Rich vs poor - · PDF fileLifestyles of the Rich and Famous: Living Costs of the Rich versus...
56
Lifestyles of the Rich and Famous: Living Costs of the Rich versus the Poor in England, 1209-1869 Gregory Clark Department of Economics UC-Davis, Davis CA 95616 [email protected] August 2004 This paper reports work in progress towards an attempt to measure the cost of living in England for those with consumption patterns similar to modern European consumers from 1209 to 1869. Until the pioneering work of Hoffman et al. (2002) measures of real wages in pre-industrial Europe have typically been for the poorer and middling sectors of society: laborers and craftsmen. The poorest workers show remarkably little gain in real wages from 1280 to 1800, despite the narrative evidence of huge changes in these societies. Combined with population evidence, the implication seems to be that there was remarkably little technological advance in England from 1200 to 1800. In this paper I show that the perspective of people with consumption patterns like our own the pre-industrial world was a period of substantial economic change. Measured relative to the laboring wages the prices of these goods consumed by the rich were falling almost as quickly in the years 1300- 1730 as in the Industrial Revolution years 1730-1869. Introduction The price history of pre-industrial England is uniquely well documented. England achieved substantial political stability by 1066. There was little of the internal strife that proved so destructive of documentary history in other countries. Also England’s island position and relative military success protected it from foreign invasion, except for the depredations of the Scots in the border counties. England further witnessed the early development of markets and monetary exchange. In particular when reports of private purchases begin in 1208-9 the markets for goods were clearly well established. A large number of documents with such prices survive in the records of churches, monasteries, colleges, charities, and government.
Transcript of Rich vs poor - · PDF fileLifestyles of the Rich and Famous: Living Costs of the Rich versus...
Lifestyles of the Rich and Famous: Living Costs of the Rich versus the Poor in England, 1209-1869
Gregory Clark
Department of Economics UC-Davis, Davis CA 95616
August 2004
This paper reports work in progress towards an attempt to measure the cost of living in England for those with consumption patterns similar to modern European consumers from 1209 to 1869. Until the pioneering work of Hoffman et al. (2002) measures of real wages in pre-industrial Europe have typically been for the poorer and middling sectors of society: laborers and craftsmen. The poorest workers show remarkably little gain in real wages from 1280 to 1800, despite the narrative evidence of huge changes in these societies. Combined with population evidence, the implication seems to be that there was remarkably little technological advance in England from 1200 to 1800. In this paper I show that the perspective of people with consumption patterns like our own the pre-industrial world was a period of substantial economic change. Measured relative to the laboring wages the prices of these goods consumed by the rich were falling almost as quickly in the years 1300-1730 as in the Industrial Revolution years 1730-1869.
Introduction
The price history of pre-industrial England is uniquely well documented. England
achieved substantial political stability by 1066. There was little of the internal strife that proved
so destructive of documentary history in other countries. Also England’s island position and
relative military success protected it from foreign invasion, except for the depredations of the
Scots in the border counties. England further witnessed the early development of markets and
monetary exchange. In particular when reports of private purchases begin in 1208-9 the markets
for goods were clearly well established. A large number of documents with such prices survive
in the records of churches, monasteries, colleges, charities, and government.

These documents have been the basis of many studies of pre-industrial wages and prices.
But the cost of living indexes constructed have mainly been for comparatively poor workers such
as building laborers and craftsmen. Until the recent work of Hoffman et al. (2002) there has
been little attention to the comparative movement in the costs of living of the rich, people like us
in their living standards, versus the poor. Oddly, as far as living standards go much more is
know about those of the poor in the pre-industrial era than is know about the rich! Yet there is
every indication that the cost of living of the poorer workers moved in a different way from that
of the rich, particularly in the years after 1500. In particular Hoffman et a. (2002) find that the
cost of living of the richest consumers in Europe increased much less than that of the poorest in
the years 1500 to 1650.
If we look at what happened to the living standards of the poorest workers in England, we
see stagnation from 1200 all the way to 1800, with only modest gains in the 19th century to the
1860s. Figure 1 shows the calculated real day wage of farm laborers in these years with the
average of 1860-9 set to 100. There is no evidence of any secular improvement in living
standards. In particular real day wages are about the same in the first half of the thirteenth
century as in the latter part of the eighteenth century. And in the plague years, from 1350 to
1550, real wages exceed those of 1800 substantially. Indeed at their peak the real wages of male
day laborers in farming exceed the level of the 1860s at the end of the Industrial Revolution.
I can also calculate the marginal product of a day’s labor in agriculture. This is the wage
measured in terms of units of output of farm produce. This marginal product is graphed versus
the estimated population of England from 1200-9 to 1790-9. Only in the 1620s is there any clear
sign of technological advance in agriculture, and even here the gains are modest. The clear
impression is of a stagnating economy and society from 1200 to 1600, with the first signs of
modest growth only in the 17th century.
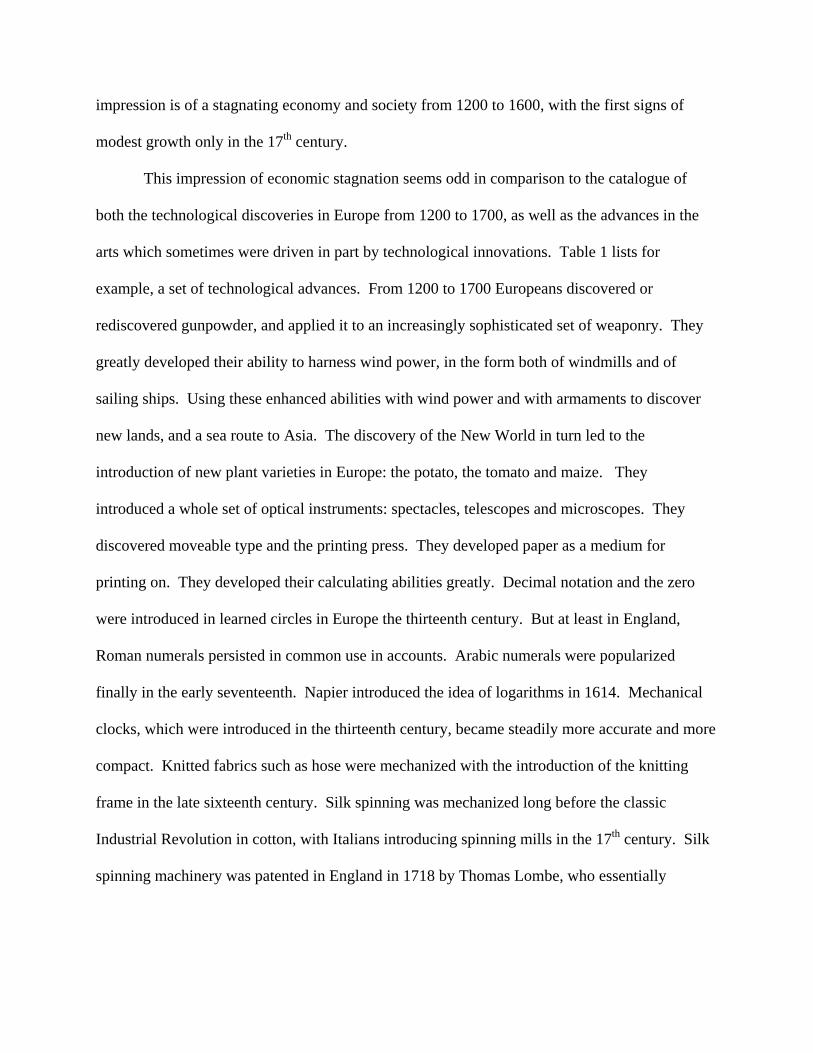
This impression of economic stagnation seems odd in comparison to the catalogue of
both the technological discoveries in Europe from 1200 to 1700, as well as the advances in the
arts which sometimes were driven in part by technological innovations. Table 1 lists for
example, a set of technological advances. From 1200 to 1700 Europeans discovered or
rediscovered gunpowder, and applied it to an increasingly sophisticated set of weaponry. They
greatly developed their ability to harness wind power, in the form both of windmills and of
sailing ships. Using these enhanced abilities with wind power and with armaments to discover
new lands, and a sea route to Asia. The discovery of the New World in turn led to the
introduction of new plant varieties in Europe: the potato, the tomato and maize. They
introduced a whole set of optical instruments: spectacles, telescopes and microscopes. They
discovered moveable type and the printing press. They developed paper as a medium for
printing on. They developed their calculating abilities greatly. Decimal notation and the zero
were introduced in learned circles in Europe the thirteenth century. But at least in England,
Roman numerals persisted in common use in accounts. Arabic numerals were popularized
finally in the early seventeenth. Napier introduced the idea of logarithms in 1614. Mechanical
clocks, which were introduced in the thirteenth century, became steadily more accurate and more
compact. Knitted fabrics such as hose were mechanized with the introduction of the knitting
frame in the late sixteenth century. Silk spinning was mechanized long before the classic
Industrial Revolution in cotton, with Italians introducing spinning mills in the 17th century. Silk
spinning machinery was patented in England in 1718 by Thomas Lombe, who essentially

imported the technology from Italy, and successfully operated a silk spinning mill employing
over 300 workers by the 1730s.
Along with improvements in production technologies came improvements in
communications. When the Paston family in England corresponded in the 15th century, their
letters between Norfolk and London seem to have been carried by whatever acquaintances or
their servants were journeying in the right direction.1 By 1512 many countries in Europe had
regular postal service. The operation run by the von Taxis family served Austria, Germany,
Italy, Low Countries, Hungary, and Spain. France and England had informal carriage of public
mail through the royal postal service from the 16th century onward. An official public postal
service between major cities, with regular times of dispatch, was introduced in France in 1627
and in England in 1635.
The entertainments available to people expanded also. Table 2 shows some of the
milestones in artistic production over these years. The variety of architectural spectacles was
increased by the achievements of Gothic architecture in Northern Europe. The stock of
literature greatly expanded over time, especially when the printing press made it possible for
authors to charge for their works, rather than having to rely on patronage. Added to book
publication was the arrival of newspapers and magazines, which in England can be traced back
to 1720. The stock of music was expanded by the creation of new instruments, new forms such
as Opera and Symphonies, and by the creation of a system of musical notation that could
preserve and disseminate the details of compositions. The ability of artists to produce faithful
renditions of nature scenes was enhanced with the development of techniques of perspective.
All this produced a society that by 1700 offered to the consumer of our tastes a menu that
was not dissimilar to our own. Someone of an upper class status living in London in 1700 could 1 Robinson (1953), pp. 1-2.

live a life that would be very familiar to us. He could drink coffee and tea at the coffee house,
beer at the alehouse and wine at the tavern. Coffee houses, for example, were first established in
London only in 1652. Yet by the 1700s there were 500 such establishments in the city (a large
number per capita than in my city of Davis, which has only 15 for 65,000 people). These coffee
houses also sold drinking chocolate. Coffee houses provided customers news books and
newspapers, sold pamphlets, and displayed notices and advertisements (Latham (1983), p. 70).
There were also over 400 taverns serving imported wines from France, Spain, Portugal and
Germany. Eating places were numerous, and ranged in quality from fancy French restaurants to
simple bakeshops. The foods they sold were flavored with spices from all over the world.
Relative Prices, 1260-1869
Before we consider the living standards of the rich we need to know what happened to
the prices of goods they consumed that do not show up in the budgets of the poor, or show up in
negligible quantities. Often the price quotes for these goods will come from scattered series,
rather than continuous runs of prices as with staple commodities like wheat. And there are many
more problems of controlling for quality over time and across sources in such goods as in the
case of the more homogenous agricultural products such as wheat.
The component price series used here have been constructed in a standard fashion. Prices
from different sources were combined into a single series by running regressions of the form
iktik i
ikktt
tikt LOCDDUNITDp εθβα +++= ∑ ∑∑)ln(
Where the Dt’s are a set of indicator series for each year (or each decade where the price
distribution is thinner), the DUNITk’s are indicators for the unit of measurement and the
DLOCi’s are indicators for the location or the quality of the output. The logarithmic form was

chosen to allow for consistent proportional differences in the level of prices across different price
series as a result of measurement or quality differences. The reason for doing this is that even
with agricultural commodities there could be considerable quality differences. Thus the average
price of butter, in pence per pound, in the years 1815-1827 from five different sources for butter
prices was as follows: Irish Imports, 4.87, Bethlem Hospital, 12.87, Greenwich Hospital, 9.52,
Lord Steward (King’s household), 19.87, Navy Victualling, 9.43. The king, unsurprisingly, got
better butter than did the inmates of the insane asylum (though the inmates did better than sailors
in the navy)! And butter imported by the barrel from Ireland was a lot cheaper than butter
bought by institutions by the pound. Generally for a given commodity the larger the units the
transaction was measured in the lower was the price per standard weight or volume.
In earlier years prices typically come from accounts that ran from Michaelmas
(September 29) to Michaelmas. But churchwardens accounts often ran from Easter to Easter.
Where the date within the year is not given these prices have been attributed to the year of the
following January since most of the account falls in that calendar year.2
For each good considered here a collection of prices has been assembled from the following
sources:
(1) Thorold Rogers incredible, promiscuous, collection of price quotes from 1260 to
1793.
(2) Beveridge’s published volume on prices from 1400 to 1831 which gives price series
for individual locations carefully controlling for quality (Beveridge (1939)).
(3) The unpublished extracts of price materials collected by Beveridge in the Robbins
Library, LSE. Some of these were for a projected volume on prices 1200-1534 that
2 By contrast Beveridge and Thorold Rogers both date prices according to the calendar year of the beginning of the account year.

Beveridge never completed. Others were scattered price material post 1534 that
Beveridge did not incorporate into his book because of his preferences for material in
continuous runs.
(4) Published accounts or translations of accounts from institutions such as town
chamberlains, churchwardens, London Guild Companies, and ecclesiastical
institutions. Most of the published transcripts are for the years before 1600.
(5) Original accounts for these same institutions. Unfortunately as we move forward
from 1600 these accounts become less and less informative, since the details of
payments increasingly were recorded by tradesmen on vouchers submitted for
payment. In this case the accounts often merely summarize the totals of these
vouchers.
(6) The original trademen’s vouchers submitted to magistrates, town chamberlains, the
clothworkers guild, and churchwardens in the years after 1600. Unfortunately most
of these bundles of vouchers were subsequently discarded. But sufficient were
retained that complete price series for many commodities for the years 1700 to 1869
can be constructed.
Table 3 shows in summary form the details of the new series constructed. In the first
column is a summary description of the commodity. In the second is the range of dates with
price quotes, in the third the number of price quotes, and in the fourth the unit of measurement.
The next two columns should the average price in the base period, 1260-1349 compared to the
end years looked at here, 1700-1759. The end years were chosen to be just before the changes of
the Industrial Revolution.

The final column of the table shows the price of each commodity in 1260-1349 relative to
its price in 1700-1759, measured in terms of the average day wage of building workers. The
average day wage of building workers was taken as the simple average of the wage of craftsmen
and of their laborers. The commodities have been arranged in order of those with the most
dramatic fall in prices relative to wages. Those with the most dramatic price declines would
typically be those with the greatest productivity gains in their production. But a complicating
factor with many of these goods – such as books, paper, glass, spices, and sugar – was that they
were taxed heavily as luxuries in England after 1689. In the case of pepper, for example, more
than half the sales price in the early eighteenth century was import taxes.
Pride of place in the table goes to books. The estimated price of a standard page of text
in the middle ages was 50 times the price in 1700-59. Figure 4 shows the price of books relative
to building day wages from 1250 to 1860, with 1700-1759 set at 100. Unfortunately
observations on book prices before 1450 are limited: I found only 32 price quotes for these years.
And the prices vary a lot by decade since it is hard to control for the quality and size of the
manuscript. Even though the scale goes up to 4000%, many of the decadal averages of prices
before 1450 cannot be shown.
Paper, the raw material on which books were mainly printed, did not experience such a
dramatic price decline. Figure 5 shows paper and parchment prices. But relative to labor costs
paper nevertheless became much less expensive over time. The spike upwards in prices after
1690 was at least in part created by the sudden embargo on French imports (followed later by
prohibitive tariffs), France having previously supplied most paper used in Britain. In the
eighteenth and early nineteenth centuries paper was quite heavily taxed, these excise taxes not
being totally repealed until 1861. Paper prices only extend back to 1356. The major writing
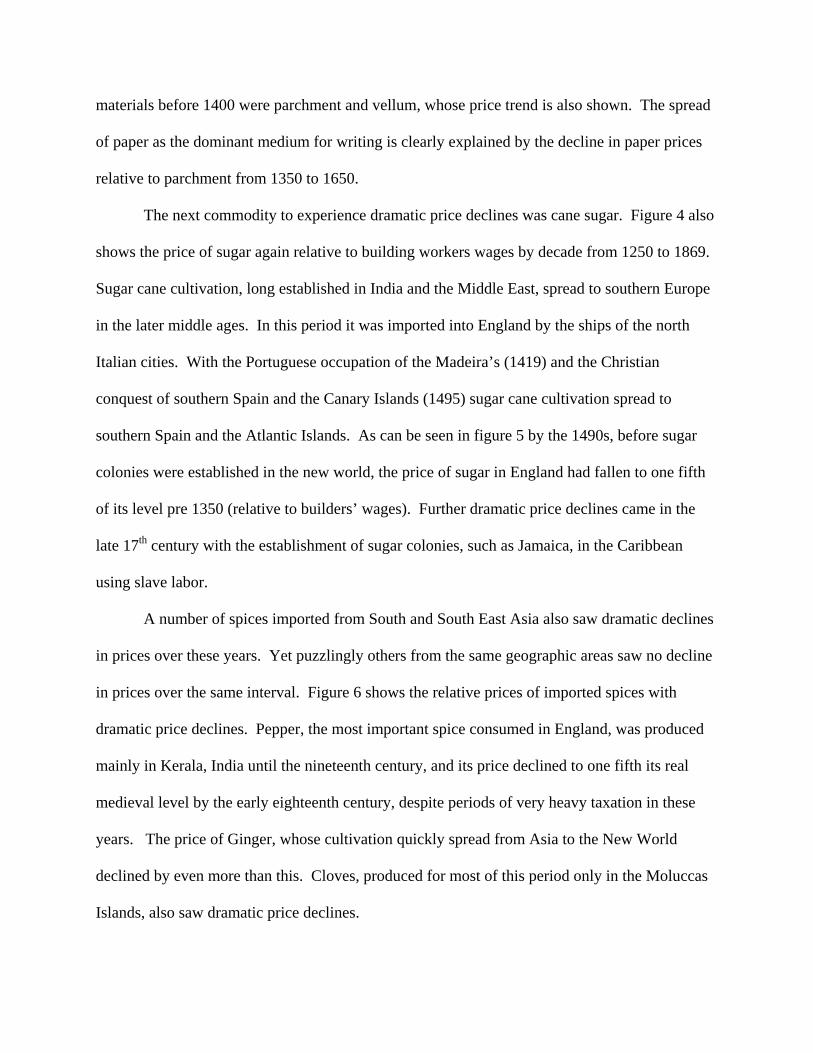
materials before 1400 were parchment and vellum, whose price trend is also shown. The spread
of paper as the dominant medium for writing is clearly explained by the decline in paper prices
relative to parchment from 1350 to 1650.
The next commodity to experience dramatic price declines was cane sugar. Figure 4 also
shows the price of sugar again relative to building workers wages by decade from 1250 to 1869.
Sugar cane cultivation, long established in India and the Middle East, spread to southern Europe
in the later middle ages. In this period it was imported into England by the ships of the north
Italian cities. With the Portuguese occupation of the Madeira’s (1419) and the Christian
conquest of southern Spain and the Canary Islands (1495) sugar cane cultivation spread to
southern Spain and the Atlantic Islands. As can be seen in figure 5 by the 1490s, before sugar
colonies were established in the new world, the price of sugar in England had fallen to one fifth
of its level pre 1350 (relative to builders’ wages). Further dramatic price declines came in the
late 17th century with the establishment of sugar colonies, such as Jamaica, in the Caribbean
using slave labor.
A number of spices imported from South and South East Asia also saw dramatic declines
in prices over these years. Yet puzzlingly others from the same geographic areas saw no decline
in prices over the same interval. Figure 6 shows the relative prices of imported spices with
dramatic price declines. Pepper, the most important spice consumed in England, was produced
mainly in Kerala, India until the nineteenth century, and its price declined to one fifth its real
medieval level by the early eighteenth century, despite periods of very heavy taxation in these
years. The price of Ginger, whose cultivation quickly spread from Asia to the New World
declined by even more than this. Cloves, produced for most of this period only in the Moluccas
Islands, also saw dramatic price declines.
There is, however, a puzzling lack of synchronicity in these price declines. The decline
for cloves is the earliest, and most of the fall to 1700-59 occurs by the early fifteenth century.
Ginger and pepper prices both fall dramatically only in the early seventeenth century. Cloves,
however, was by far the most expensive eastern spice in the middle ages with a price per pound
about 8 times that of pepper. Most of this high cost must have been created by high production
costs rather than transport costs or the Arab monopoly of the spice trade. Thus the decline in
clove prices before the Portuguese discovery of the sea route to the east probably came from
declining production costs in the Mulaccas.
In contrast with the price declines for these spices, however, we have little or no decline
in prices (relative to building workers’ wages) for cinnamon or mace and nutmeg. Figure 7
shows these price paths. The prices of these spices fell not at all before there was a dramatic
decline in the nineteenth century.
The next commodity in table 3 in terms of the extent of the relative price decline in
gunpowder, though here the first observation is from 1379. Figure 8 shows the movement of
gunpowder prices, as well as those of cutting tools (axes, hatchets, scythes, sickles, and spades)
as a proxy for weapons. Also shown is the price series for nails of a standard length per pound
relative to wages.3
After gunpowder comes glass in terms of price declines. Figure 9 shows the relative
price of glass, as well as pigments and painting oils and house rents overall. Glass for glazing
has prices quoted by the square foot from 1302 to 1869. This series was supplemented by the
prices of glass bottles of standard sizes, and the prices of wine glasses. Paint throughout this
period was composed of an oil base (typically linseed) combined with a pigment (sold by the
lb.). The price series for pigments is the average of the price of red lead, white lead, Spanish 3 The longer, and hence heavier, the nails typically the lower the price per pound.

white, verdigris, vermilion, Spanish black, yellow ochre, red ochre, ivory black, umber, and
black lead.
The house rents are an extension of the series developed in Clark (2002). The attempt
here is to measure the aggregate of house rent changes on houses of unchanging quality. House
rents change little relative to the wages of builders from 1350 to 1869. But house rents are
significantly higher in the years before 1350. One explanation of these high early rents is that
interest rates, an important component in the annual cost of housing, were much higher before
1350 than in any succeeding period.
Figure 10 shows the prices of three sets of textiles: silk, woolens and linens. Despite the
small numbers of observations the series on silk prices the price series here shows little variance.
Clearly there was a dramatic decline in silk prices from the medieval period on, more significant
than for the other textiles. This decline happened despite the imposition of various duties on silk
imports in the seventeenth and eighteenth centuries with the aim of encouraging English
manufacturers. Though I only have prices for silk thread up until 1794, the decline in silk prices
obviously continued through until the 1860s, and may have been even more dramatic after 1794.
For in 1849 the Clothworkers’ Company in London introduced into the clothing of its male
almsmen a “black silk neckerchief” (price 3/10 which is 46 d.). By 1852 the almsmens’ hats
were also made of silk. Thus silk, which had been an article only for the very wealthy in the
middle ages (1 oz of silk thread in the 1280s cost 7 days wages of a building laborer) had
become by 1849 part of the clothing of those of quite modest means.
Figure 11 shows the prices of various metal objects in house furnishing. Silver was made
into knives, forks, spoons, cups and bowls. The price series here is for silverware in the years
1500-1800, extended into earlier years through the mint price of silver 1260-1500, and the
market price of silver 1783-1869. Pewter, an alloy mainly of tin with additions of lead, was a
cheaper alternative for silver in producing these articles. The price series here is based on the
prices of new pewter (typically sold by the lb.), old pewter, and the major raw material for
pewter, tin. Brass and copper was used for goods such as kettles and pots that were subjected to
significant heat. The prices here are for brasswares and copper vessels, supplemented by prices
for raw copper and brass.
Figure 12 gives the cost of various types of light: tallow candles, used by the poor, and
wax candles and lamp oil used by the rich. Tallow candles were typically made with a mixture
of mutton and beef tallow (pork tallow smelled badly when burned and gave off a lot of smoke).
But they created a lot of soot. Wax candles and oil lamps were preferred as burning with a much
sweeter smell, and with much less soot. After 1700, and until the nineteenth century, tax policy
made wax candles very expensive. By 1711 the tax on wax candles was raised to 8 d. per pound
(the retail price then after the tax was levied being about 26 d. per lb.) compared to a tax of only
1 d. per lb. on tallow candles.
A Price Index for the Modern Consumers in a Medieval World
Table 3 reveals that there were dramatic changes in relative prices in pre-industrial
England. This also implies that the cost of living for different consumers in pre-industrial
society could change in very different ways. We saw above that for the poorest group in society,
agricultural laborers, there was little change in real living standards from 1200 to 1800, because
their consumption consisted overwhelmingly of domestic agricultural produce.
What happened to the cost of living of those whose consumption pattern more closely
resembled our own? The consumer I have in mind here is not the aristocracy, but the

professional such as ourselves – the doctor, the vicar (earlier the monk), the grammar school
master, the university professor, or the high Civil Servant such as Samuel Pepys in the 1660s.
Table 4, for example, shows the proportions of wills inventoried between 1675 and 1725 that left
various goods, such as books, silverware, mirrors, and pictures as a function of social class.
People in the class of merchants and professionals had a very different stock of possessions than
those in the laboring classes, even back in 1700.
The problem is to derive the appropriate weights for consumption, since as we see price
trends are very different for different consumers. Budgets for such households in pre-industrial
England are rare. Also the budgets for the noble households that do survive tend to aggregate the
consumption of the masters with that of the servants, who received their wage partly in board
and lodging. We do, however, get good estimates of the typical consumption patterns of modern
consumers. Table 5 shows the broad categories of consumption expenditures that we can price
for the pre-industrial era. The share of food, alcohol and tobacco in total expenditure is much
smaller for the modern consumer. But the share of housing expenses in the UK is much greater
–counting both the rental value of the structure and the cost of the panoply of home furnishing
and decorations that goes into the modern home. The other items that noticeably increased were
the shares devoted to personal services, and the share devoted to information and entertainment,
here indexed by the prices of books for the years before 1869. However for about a third of
modern expenditure I have no prices yet with which to measure the costs for most of the years
before 1869. The obvious counterpart of the automobile, which absorbs so much of modern
expenditure, is the coach and its associated horses, and horse feed. But there is no good series on
the price of a unit of horse traction power. The counterpart of telephone services is the cost of
delivering a message by post or messenger. But there was no public postal service before 1635.

For food we can get even more detailed breakdowns of consumption by quantities from
the Department of the Environment, Farming and Rural Affairs (DEFRA) National Food Survey,
and from import statistics for some foreign spices. Table 6, for example shows estimates for the
modern UK consumer of the average food consumption per week in grams or liters of food of
different categories.
Thus one way we can phrase the question is what would be the cost of living would be
for the average modern consumer, consuming the relative quantities of our food basket? In this
case we would construct a cost of living index of the following form (a Laspeyres Index):
where the αi are the quantity weights for each commodity. This index assumes that even when
the relative price of an item increased in a given year its relative consumption was unchanged.4
The problem that immediately arises with such an approach is that with fixed quantity
weights the implied share of expenditures on some minor items now is huge in earlier years.
Table 6, for example, also shows in the last column the implied share of expenditures on food at
1700-59 prices of the modern consumption pattern (for those items I have prices for in 1700-59).
Tea would be 48% of the food budget in 1700-59 at modern consumption levels! A more
conservative approach is to assume fixed budget shares over time (which is the same as
assuming for each good that the price elasticity of demand is -1, which implies that consumers
have Cobb-Douglas Utility Functions). This implies that if a good was extremely expensive
consumers choose to economize in its use.
4 Goods are strict complements in the utility of the consumer.
∑=i
itit pp α
The price index for rich consumers, those like ourselves, was thus formed as a geometric
index of the prices of each component, with the assumed output shares of each commodity used
as weights. That is, if pit is the price index for each commodity i in year t, and αi is the output
share of commodity i, then the overall price level in each year, pt is calculated as,
Thus it assumes constant shares in the value of output for each item as relative prices change
from year to year.
The weights for this index are designed to echo those of the modern consumer, as
inferred from the DEFRA, National Food Survey, 2000, and the Office of National Statistics,
Family Expenditure Survey, 2000. For many modern expenditures, however, we have no direct
equivalence (automobiles are a very important category of modern expenditure, for example).
Thus at least at this stage the weights are a very rough approximation. Table 7 shows the
weights used for the cost of living of farm workers in Clark (2004b), as well as the weights
suggested by Vanderlint in 1734 for a London laborer. The fourth column shows the expenditure
weights for modern British consumers. The final column shows how these have been translated
into the weights for a cost of living index for the rich. For some commodities, such as rice,
raisins etc. the prices series is not yet complete enough to allow them to be included in the
calculation. But eventually even more new commodities than are introduced in this paper can be
included.
∏=i
ittipp α
Consider first food, alcohol and tobacco which gets a weight of 74.5% in the COL index
of the poor, but only of 18% in the budgets of modern workers.5 Table 8 shows the elements of
the COL of farm workers, and the weights employed in their COL index (constant weights
throughout), with 1860-9 set at 100. The first column shows the index for food, alcohol and
tobacco. Table 9 shows the elements in the cost of living of the modern consumer transported
into the past. Again the first column shows the index for food, alcohol and tobacco. Figure 13
shows
sFarmWor
umersModernCons
tFoodtFood
kercoscos
with 1700-59 set at 1.00. The cost of food for a consumer with modern consumption habits (in
terms of the share of their expenditure spent in food) was over twice as great in the years before
1450 than in 1700-59. Note that this is with a conservative stipulation of “modern consumption
habits,” in that we are just assuming that the share of their expenditure devoted to food products
looks like that of modern consumers. Given the high prices for sugar and the spices included
here before 1450 the consumption of these goods, in grams per day, is assumed much less than
modern levels. The diet is assumed to be a lot more bland in 1300!
Housing, measured in the general sense of home plus furnishings, was another area where
the cost of living of farm workers and of modern consumers diverged as we move back in time.
The expenditure estimates of the family expenditure survey show that 24% of expenditures
related to housing rents or mortgages, housing repairs, and the furnishing and decorating of
houses. Clark (2004c) innovates in having an index of housing rents included in the cost of
living of farm workers. These are measures of the rents paid to landlords. It also included the
5 I included only a share of the costs of prepared meals and food eaten out of the home, for which a substantial part of the payment for such meals is for the labor in food preparation and service, and the rental of the cooking and eating establishments. The rest of the cost of these foodstuffs was included under “services” and “lodging” costs.

cost of pewter as 10% of the cost of shelter. But the expenditure of modern consumers on house
furnishings, tableware and decoration is much more elaborate. The cottages of the pre-industrial
poor had whitewashed walls, and earthen floors. The modern consumer walks on carpet, is
shielded from the prying eyes of neighbors by window drapery, and has painted or wallpapered
walls. Wood and wall surfaces are painted and varnished. Modern consumers own extensive
collections of silverware (now stainless steel), plates, glasses, pots and domestic appliances.
They sit and sleep on stuffed and padded sofas and beds, and store things in sideboards and
cupboards. To represent such consumers the housing index constructed here has the following
weights:
1. House rents (for the house structure) 67%
2. Silverware (cutlery, cups, bowls) 8.33%
3. Glassware (bottles, glasses, plates) 8.33%
4. Pewter (plates, bowls) 4.17%
5. Brasswares (kettles, pots) 4.17%
6. Paints (decoration) 8.33%
These weights are more a guess at the expenditure shares than a scientific estimate! The new
and the old housing series are shown in tables 8 and 9. Figure 13 shows that with these additions
of goods like glasswares, silverwares and paints with substantial productivity gains over these
years, the cost of lodging is high in the past for the modern consumer relative to the farm worker.
Note that this calculation does not include any allowance for the cost of housing textile fabrics,
which will be included under textiles.
In textiles the crucial difference between the farm worker and modern consumers would
be in the consumption of fabrics made from silk or its artificial substitute rayon. Silk prices, as
we saw, declined more than those of other textile products. Arbitrarily I assume 12% of textile
expenditures for the modern consumer would be on silk or its substitutes. The prices indices
here for the pre-industrial farm worker versus the modern consumer would not differ by much,
even though silk saw more rapid price declines than other textiles.
For light I assume that the farm worker uses tallow candles throughout, while the modern
consumer would use higher quality wax candles, lamp oil or (after 1810) gas lighting.6
The cost of services is assumed to be the average wage of workers in the building trades
(from Clark (2004b)). This is the cost that rises most over time, so the fact that the farm workers
consumed almost no services while “modern” workers consume many services means that in this
respect the cost of living would rise much more rapidly for modern consumers than for farm
workers who consumed mainly agricultural commodities.
The last column of tables 8 and 9 show the implied overall cost of living indices for farm
workers and for a consumer of more modern consumption choices. Figure 14 shows the
resulting relative cost of living for “modern” consumers versus farm workers. The overall effect
of changing the shares of the consumption basket towards modern shares (which stand in for
high income consumers in the past) is that living costs rose much more slowly in the years 1280
to 1650 for high income consumers than for farm workers. Indeed for the years before 1500
average living costs for the rich were double those of the poor relative to c. 1650. Thereafter if
there was any trend it was towards somewhat slower increases in costs for the poor as opposed to
the rich. In part this was because of the importance of wages in the cost of living of the rich, and
the substantial rise in wages relative to other costs in the years after 1800.
Figure 14 also shows the relative cost of living calculated by Hoffman et al. (2002) for
England in the years 1500-1869 for the upper 5% of the income distribution compared to the 6 Tallow candles release a considerable quantity of soot.

bottom 40%. As can be seen the results are very similar for the years of overlap. The only
substantial deviation is that the Hoffman et al. series shows living costs for the rich declining
relative to the poor in the Industrial Revolution period, whereas the new series suggest that from
1670 to 1869 the living costs of the rich and poor were close to constant.
Hoffman et al. interpret the U shaped movement of the relative cost of living of the rich
versus the poor from 1500 to 1750 largely in demographic terms. In periods of rapid population
growth the cost of labor declined relative to that of land. This made staple foods expensive
relative to servants and luxury goods consumed by the rich (Hoffman et al. (2002), p. 351).
There may be some truth in this interpretation, but if demography was the dominant factor then
the cost of living of the rich should have been low also in the years before 1349 and the onset of
the Black Death. The interpretation I prefer here is that while demographic trends played some
role, the dominant force was actually technological change that happened to favor the rich. One
major form of technological change in these years was the reduction in the cost of importing
goods from other regions of the world. The rich were greater beneficiaries of this because while
the poor were looking mainly for the cheapest calorie which was still produced at home until the
nineteenth century, the rich sought variety in consumption which was largely available abroad.
Finally I calculate a hypothetical real wage for the rich (doctors, attorneys, professors)
versus farm workers for 1280-1869. This is a purely hypothetical real wage since I do not have
any series for the average wages of the professional class in these years. All I am doing here is
assuming that the wage of this group did not change relative to the wage of farm workers. This
hypothetical wage is shown in figure 15. The calculated real wage of this professional group is
nearly 2.5 times as great by the mid seventeenth century as in 1280-1349. In contrast the real
wage of farm workers increased by only 30% in the same interval. Also the rate of real wage

gain for this hypothetical group is nearly as fast in the years 1300 to 1700 as in the years 1760-
1860, those of the classic Industrial Revolution. From 1280-1349 to 1700-59 my hypothetical
real wage for the rich grows at 0.26% per year. From 1700-59 to 1860-9 these real wages grow
at the same 0.26% (though the growth rate for the shorter interval 1800-9 to 1860-9 is a much
faster 0.67% per year.
Conclusions
Impressions of economic growth in England and in Europe before 1760 have been based
in part on quantitative evidence that the real wages of building workers as portrayed by Phelps-
Brown and Hopkins (1962) did not show any sign of secular increase over these years. On the
oft quoted Phelps-Brown and Hopkins series the early seventeenth century is the worse in
recorded English history in terms of workers’ living standards. Real wages of craftsmen are
about as high in 1300 as in 1800. Robert Allen in his recent study of European trends, which is
focused on the divergent trends in wages, nevertheless finds even for building craftsmen that real
wages fell, often by substantial amounts from 1500-49 to 1750-49 in 13 of 14 cities supplying
evidence, the exception being London where they were the same (Allen (2001)).
It has been hard to square this wage evidence with other features of the economy which
suggest substantial economic growth between 1300 and 1700. These features include the much
greater urbanization rates, and the increasing possessions evident in the probate inventories of
the deceased. This led to some historians, such as Neil McKendrick, positing a “consumer
revolution”: an independent cultural revolution in consumption pattern that lead to greater
demand for consumer goods at the same income level. Alternatively Jan de Vries posited an
“Industrious Revolution”: starting in the seventeenth century consumers in England and the

Netherlands began to work more hours per year, substituting new consumer goods for leisure.
They acquired a greater taste for goods as opposed to leisure (de Vries (1993, 1994)).
This paper suggests another potential resolution of this seeming paradox. The “consumer
revolution” was driven not by any change in tastes, but by the declining prices of many
consumption goods created by technological advance (which included technological advance in
the ability to trade with tropical regions). As these new consumer goods got cheaper the rich,
who had always consumed such goods, consumed more of them, and those of middle incomes
explored this area of consumption also. This explanation of the “consumer revolution” can also
explain why even though consumer goods were ever more abundant in inventories as we
progress through the seventeenth and early eighteenth centuries, they represented a declining
share of the total value of bequests (de Vries (1993), pp. 101-2).

Appendix 1: Tool and Utensil Price Observations
Item
Years
Observations
Cutting Implements: AXE 1208-1844 186 FALX 1316-1658 17 HATCHET 1275-1595 6 HEDGING BILL 1522-1579 4 HOE 1285-1667 11 REAPHOOK 1281-1579 31 KNIFE 1303-1723 217 SCYTHE 1218-1845 93 SICKLE 1364-1844 22 SPADE 1222-1845 241 STRIGIL 1273-1564 14 Containers: BUCKET 1222-1846 229 PAIL 1292-1863 55 Other: FORK (farm implement) 1233-1725 110 HAMMER 1279-1868 12 HORSESHOE 1216-1713 316 MATTOCK 1293-1683 15 PADLOCK 1220-1868 111 SHOVEL 1221-1861 277

References
Archival Sources
Beveridge Papers, Robbins Library
The Beveridge Wage and Price History extracted wage and price materials from a whole
variety of archival sources. First there were medieval manorial records: eight Winchester
manors, Hinderclay and Redgrave in Suffolk, Westminster Abbey manors, and some Battle
Abbey material. Then there were the records of religious and charitable institutions:
Westminster Abbey, Winchester College, St Bartholomew’s Hospital in Sandwich, Kent, Eton
College, Greenwich Hospital. Also town corporation accounts were utilized in the cases of
Exeter, Canterbury, and Nottingham. Finally Beveridge extracted central government records
from the Office of Royal Works.
Bristol Record Office: Bristol Town Chamberlain’s Vouchers, 1750-1855.
Cheshire Record Office: Town Chamberlain’s Vouchers, 1766-1836, TAV/3/51-83.
Clothworkers’ Company, Clothworkers Hall, London. Warden’s Accounts. Court Minutes.
Lease Books. Vouchers.
Cumbria Record Office: Carlisle Town Chamberlain’s Vouchers, 1748-1834, CA/4/11,
Cumberland Quarter Session Vouchers, 1851-4, CQF/5/117.
Dorset Record Office: Lardner MSS. 1702-1749. PE/WCH/MI/7.
Devon Record Office: Exeter Chamberlain’s Vouchers. 1760-1855. Essex Record Office: Quarter Session Vouchers, 1759-1869. Q/FAc/5/1, Q/FAc/6/2/1-59. Hull City Record Office: Chamberlains’ Vouchers, 1750-1798, 1828, 1833. BFR/6/--.
Charterhouse Charity, 1850-1, 1860-1. WT/6/--.
Leicester Record Office: Quarter Session Vouchers, 1778-1869. QS/112/1-426.

Stafford Record Office: --------- MS, 1808-1867. D 240/E/F/4/1-27.
Surrey Record Office: Quarter Session Vouchers, 1750-1851, QS2/6. Guildford Borough
Vouchers, BR/OC/6/9/1-60.
Printed Primary Sources of Wage and Price Quotes Ainsworth, John. 1939. Records of the Worshipful Company of Carpenters. Volume 5,
Warden’s Account Book, 1571-1591. Volume 6, Court Book 1573-1594. London, Phillimore.
Alcock, N. W. 1981. Warwickshire Grazier and London Skinner, 1532-1555. London: The
British Academy, Records of Social and Economic History, New Series, 4.
Bailey, Francis A. 1953. The churchwarden's accounts of Prescot, Lancashire, 1523-1607.
Preston: Record Society for the Publication of Original Documents Relating to Lancashire and
Cheshire. Publications v. 104.
Barmby, James. 1888. Churchwardens’ Accounts of Pittington and other Parishes in the
Diocese of Durham, 1580-1700. Publications of the Surtees Society, Vol. 84. Durham:
Andrews and Company.
Barmby, James. 1896. Memorials of St Gile’s, Durham. Publications of the Surtees Society,
Vol. 95. Durham: Andrews and Company.
Botelho, Lynn A. 1999. Churchwardens' accounts of Cratfield, 1640-1660. Woodbridge :
Boydell & Brewer, Suffolk Records Society, v. 42.
Bower Marsh. 1913. Records of the Worshipful Company of Carpenters. Volume 2, Warden’s
Account Book, 1438-1516. Volume 3, Court Book 1533-1573. Volume 4, Warden’s Account
Book, 1546-1571. Oxford, Oxford University Press, 1913-1939.
Brinkworth, Edwin R. C. 1964. South Newington churchwardens' accounts, 1553-1684.
Banbury, Oxford: Banbury Historical Society. Records publications v. 6.
Burgess, Clive. 1995. The Pre-Reformation Records of All Saints’, Bristol. Vol 1. Stroud:
Bristol Record Society, Publications, Vol. 46.
Burgess, Clive. 1999. The church records of St Andrew Hubbard, Eastcheap, c1450-c1570.
London: London Record Society.
Burgess, Clive. 2000. The Pre-Reformation Records of All Saints’, Bristol. Vol 2. Stroud:
Bristol Record Society, Publications, Vol. 53.
Carter, William F. 1928. The Records of King Edward’s School, Birmingham. Vol II. London,
Dugdale Society. Publications, Volume 7.
Chatwin, Philip B. 1948. The Records of King Edward’s School, Birmingham. Vol IV.
London, Dugdale Society. Publications, Volume 20.
Chatwin, Philip B. 1963. The Records of King Edward’s School, Birmingham. Vol V.
London, Dugdale Society. Publications, Volume 25.
Izon, John. 1974. The Records of King Edward’s School, Birmingham. A Supplementary
Miscellany. Vol VI. Oxford, Dugdale Society. Publications, Volume 30.
Doree, Stephen G. 1994. The early churchwardens' accounts of Bishops Stortford, 1431-1558.
Hertfordshire record publications; v. 10. Hitchin, Hertfordshire: Hertfordshire Record Society.
Drew, Charles. 1940, 1941. Lambeth churchwardens' accounts, 1504-1645 and vestry
book,1610. Surrey Record Society. Publications, vols. 18, --. Frome, Printed by Butler &
Tanner for the Surrey Record Society and the Lambeth Borough Council.
Foster, J. 1905. Churchwardens' accounts of St. Mary the Great, Cambridge,

from 1504 to 1635. Cambridge, Printed for the Cambridge Antiquarian Society, Publications:
octavo series, no. 35.
Hanham, Alison. 1970. Churchwardens' accounts of Ashburton, 1479-1580. Devon &
Cornwall Record Society. Publications new series, v. 15. Exeter: Devon and Cornwall Record
Society.
Litzenberger, C. J. 1994. Tewkesbury churchwardens' accounts, 1563-1624. Gloucester:
Bristol and Gloucestershire Archaeological Society, Gloucestershire record series, v. 7.
Mellows, William T. 1939. Peterborough local administration; parochial government before the
reformation. Churchwardens' accounts, 1467-1573. Northamptonshire Record Society,
Publications v. 9. Kettering, Printed for the Northamptonshire Record Society by the
Northamptonshire Print. and Pub. Co.,
Mercer, Francis Robert. 1928. Churchwardens' accounts at Betrysden, 1515-1573. Kent
Archaeological Society. Records Branch. Kent records vol. v, pt.3. Ashford, Printed for the
Records Branch by Headley brothers.
North, Thomas. 1884. The accounts of the churchwardens of St. Martin's, Leicester, 1489-1844.
Leicester: S. Clarke.
Northeast, Peter. 1982. Boxford churchwardens' accounts, 1530-1561. Suffolk Records
Society, vol. 23. Woodbridge, Suffolk : Boydell Press for the Suffolk Records Society.
Plomer, Henry R. 1915. The churchwardens' accounts of St. Nicholas, Strood. (B.M. add. ms.
36,937.). Kent Archaeological Society. Records Branch. Kent records, vol. V.
Salter, Herbert E. 1933. The churchwardens' accounts of St. Michael's Church, Oxford.
Transaction of the Oxfordshire Archaeological Society, no. 78. Long Compton, Shipston-on-
Stour : The "King's Stone" Press.

Somers, Frank. 1957. Halesowen churchwardens' accounts. London, Printed for the
Worcestershire Historical Society by Mitchell, Hughes and Clarke, 1957 [i.e. 1952-55]
Stallard, Arthur D. 1922. The transcript of the churchwardens' accounts of the parish of Tilney
All Saints, Norfolk, 1443 to 1589. London, Mitchell Hughes and Clarke.
Swayne, Henry J. F. 1896. Churchwardens' accounts of S. Edmund & S. Thomas, Sarum, 1443-
1702, with other documents. Wilts Record Society. Publications. Salisbury, Bennett Brothers.
Wardle, F. D. 1923. The Accounts of the Chamberlains of the City of Bath, 1568-1602.
Somerset Record Society, Vol. 38. London: Butler and Tanner.
Weatherill, Lorna. 1990. The account book of Richard Latham, 1724-1767. Oxford: Published
for the British Academy by Oxford University Press.
Secondary Sources Allen, Robert C. 2001. “The Great Divergence in European Wages and Prices from the Middle
Ages to the first World War.” Explorations of Economic History, 38(1): 411-448.
Allen, Robert C. 2004. “Mr. Lockyer meets the Index Number Problem: the Standard of Living
in Canton and London in 1704,” Working Paper, Nuffield College, Oxford.
Beveridge, Lord. 1939. Prices and Wages in England, Vol 1: The Mercantilist Era.
Clark, Gregory. 2002. “Shelter from the Storm: Housing and the Industrial Revolution, 1550-
1912” Journal of Economic History, 62(2) (June).
Clark, Gregory. 2004a. “The Price History of English Agriculture, 1209-1914,” Research in Economic
History, 22: ----, forthcoming.
Clark, Gregory. 2004b. “The Condition of the Working-Class in England, 1200-2000: Magna Carta to
Tony Blair.” Working Paper, University of California, Davis.

Clark, Gregory. 2004c. “The Long March of History: Male Farm Workers’ Wages and Living Standards
in England, 1209-1869.” Working Paper, University of California, Davis.
de Vries, Jan. 1994. AThe Industrial Revolution and the Industrious Revolution.@ Journal of
Economic History, 54(2): 249-70.
de Vries, Jan. 1993. “Between Purchasing Power and the World of Goods: Understanding the
Household Economy in Early Modern Europe,” in John Brewer and Roy Porter (eds.),
Consumption and the World of Goods. London, Routledge.
Dyer, Christopher. 1989. Standards of Living in the Later Middle Ages. Cambridge:
Cambridge University Press.
Hoffman, Philip T., David Jacks, Patricia A. Levin, and Peter H. Lindert. 2002. “Real
Inequality in Europe since 1500.” Journal of Economic History, 62(2): 322-355.
Latham, R. C. 1983. The Diary of Samuel Pepys, Volume X, Companion. Berkeley: University
of California Press.
Phelps Brown, Henry and Sheila V. Hopkins. 1962. “Seven Centuries of the Prices of Consumables,
compared with Builders’ Wage Rates” in E. M. Carus-Wilson (ed.), Essays in Economic History, pp. 179-
196. London: St Martins Press.
Thorold Rogers, J. E. 1866. A History of Agriculture and Prices in England. Volume 2. Oxford:
Clarendon Press.
Thorold Rogers, J. E. 1888a. A History of Agriculture and Prices in England. Volume 3. Oxford:
Clarendon Press.
Thorold Rogers, J. E. 1888b. A History of Agriculture and Prices in England. Volume 6. Oxford:
Clarendon Press.
Robinson, Howard. Britain’s Post Office: A History of Development from the Beginnings to the
Present Day. Oxford: Oxford University Press.

Weatherill, Lorna. 1993. “The Meaning of Consumer Behavior in Seventeenth- and Early
Eighteenth-Century England,” in John Brewer and Roy Porter (eds.), Consumption and the
World of Goods. London: Routledge.
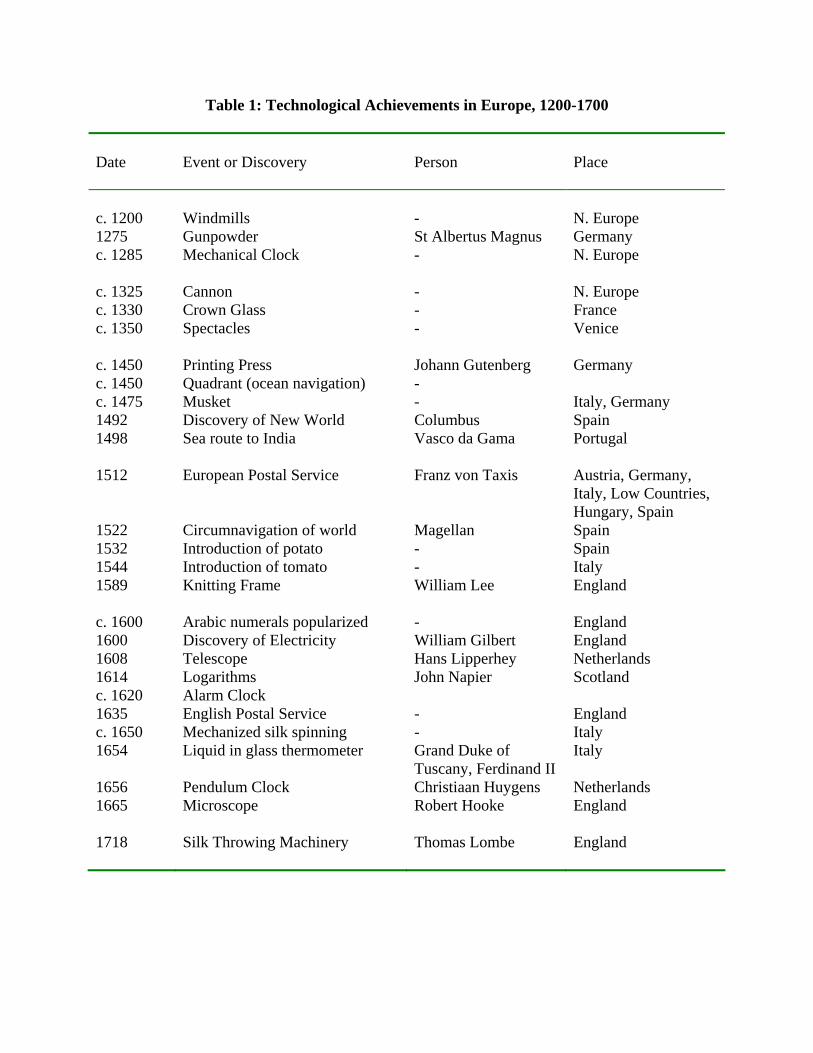
Table 1: Technological Achievements in Europe, 1200-1700 Date
Event or Discovery
Person
Place
c. 1200 Windmills - N. Europe 1275 Gunpowder St Albertus Magnus Germany c. 1285 Mechanical Clock - N. Europe c. 1325 Cannon - N. Europe c. 1330 Crown Glass - France c. 1350 Spectacles - Venice c. 1450 Printing Press Johann Gutenberg Germany c. 1450 Quadrant (ocean navigation) - c. 1475 Musket - Italy, Germany 1492 Discovery of New World Columbus Spain 1498 Sea route to India Vasco da Gama Portugal 1512 European Postal Service Franz von Taxis Austria, Germany,
Italy, Low Countries, Hungary, Spain
1522 Circumnavigation of world Magellan Spain 1532 Introduction of potato - Spain 1544 Introduction of tomato - Italy 1589 Knitting Frame William Lee England c. 1600 Arabic numerals popularized - England 1600 Discovery of Electricity William Gilbert England 1608 Telescope Hans Lipperhey Netherlands 1614 Logarithms John Napier Scotland c. 1620 Alarm Clock 1635 English Postal Service - England c. 1650 Mechanized silk spinning - Italy 1654 Liquid in glass thermometer Grand Duke of
Tuscany, Ferdinand II Italy
1656 Pendulum Clock Christiaan Huygens Netherlands 1665 Microscope Robert Hooke England 1718 Silk Throwing Machinery Thomas Lombe England

Table 2: Achievements in the Arts in 1200-1700
Date
Event or Discovery
Person
Place
1120-1500 Gothic Architecture - N. France,
England c. 1315 The Divine Comedy Dante Aligheri Italy c. 1350 Decameron Giovanni Boccaccio Florence c. 1390 Canterbury Tales Geoffrey Chaucer England c. 1400 Harpsichord - Flanders 1413 Perspective in Painting Filippo Brunelleschi Italy 1509 Wallpaper - England 1576 Public Theater James Burbage England c. 1587 Tamburlaine the Great Christopher Marlowe England 1600 Opera – “Euridice” Jacopo Peri and Giulio Caccini Florence 1602 Hamlet William Shakespeare England 1620 Newspaper - England 1637 Public Opera House - Venice 1709 Pianoforte Bartolommeo Cristofori Italy 1719 The Novel - “Robinson Crusoe” Daniel Defoe England

Table 3: Price Indices Constructed for 1209-1869
Commodity
Years
Obs.
Unit
Price
1260-1349 (d)
Price
1700-59 (d)
Relative
price (%)
Books 1262-1869 3,903 100 Pages 31.9 4.5 39.4 Sugar 1225-1869 2,325 Lb. 12.50 6.2 14.9 Tobacco 1621-1756 65 Lb. - 12.5 - Ginger 1265-1831 457 Lb. 19.0 13.8 10.1 Gunpowder* 1379-1844 125 Lb. 31.3 17.3 8.06 Glasswares 1302-1868 656 Sqr. Foot 4.44 6.0 5.39 Cloves 1265-1831 594 Lb. 100.2 157.1 4.62 Pepper 1258-1856 1,373 Lb. 12.7 21.2 4.46 Nails 1209-1868 2,664 Lb. 2.14 3.6 4.43 Silk Thread 1285-1794 151 Oz 12.0 23.0 4.17 Pigments 1284-1858 245 Lb. 2.19 4.1 3.95 House Rent 1280-1869 4,801 House/week 8.1 16.6 3.63 Painting Oil 1303-1849 82 Gallon 15.1 38.5 2.90 Woolen Cloth 1248-1869 3,040 Yard 34.9 98.6 2.65 Silverwares 1273-1869 913 Oz. 25.7 74.7 2.58 Tallow Candles 1261-1869 2,009 Lb. 1.73 5.0 2.58 Lamp Oil 1335-1800 189 Gallon 10.7 31.0 2.55 Paper* 1356-1867 1,288 Quire 6.1 9.0 2.17 Wax Candles 1261-1839 631 Lb. 7.6 26.9 2.12 Cutting Tools 1209-1845 836 Axe 6.05 23.5 1.91 Beer 1209-1869 1,571 Gallon 2.0 8.1 1.85 Farm Output 1209-1869 - Index 10.7 51.8 1.54 Barley 1209-1869 5,804 Bushel 5.26 25.7 1.53 Farm COL 1209-1869 - Index 12.9 63.7 1.52 Pewter Goods 1220-1856 1,185 Lb 2.33 12.4 1.39 Linen Cloth 1209-1866 2,836 Ell 3.29 18.7 1.31 Brasswares 1276-1848 264 Lb 3.70 21.3 1.30 Wheat 1209-1869 18,743 Bushel 8.0 47.4 1.26 Nutmeg 1286-1831 1,363 Lb. 18.1 120.0 1.14 Farm Wage 1209-1869 30,000 Day 1.45 10.2 1.06 Cinnamon 1265-1856 723 Lb. 15.6 111.7 1.00 Building Wage Ave. 1209-1869 29,000 Day 2.46 18.4 1.00 Building Laborer 1209-1869 Day 1.70 14.6 0.87 Notes: *Earlier prices from 1350-99. Sources: Domestic Farm Prices, Clark (2004a). Farm Wages, Clark (2004c). Building Wages, Clark (2004b).

Table 4: Percentage of Inventories with Given Objects, 1675-1725
Social Group
Number
Books
(%)
Looking glasses
(%)
Silverware
(%)
Pewter
(%)
Pictures
(%)
Gentry 122 39 62 61 93 33 Merchants and professionals
152 45 62 51 95 35
Husbandmen and laborers
360 4 16 2 89 0
Source: Weatherill (1993), p. 222.

Table 5: Broad Categories of Expenditure, Laborers 1800 versus Modern Consumers
Farm Laborers,
c. 1800
UK c. 2000
Reweighted
UK 2000
Food 74.5 18 26.0 Lodging 6 24 35.0 Fuel 5 2 3.0 Light 3.5 1 1.5 Soap 0.5 1 1.5 Clothing, Textiles 9 6.5 10.0 Silk 0 1 1.5 Leather 1 1 1.5 Books, newspapers 0 4 5.6 Paper 0 1 1.4 Personal Services 0.5 9 13.0
ALL 100 68.5 100
Notes: Cinema and theater (0.3%), sports events (0.8%) and TV, videos and computers (2.2%)
were placed in the “book” category. Educational expenses (2%) were divided into books (0.5%),
paper (0.5%), and services (1%).
Lodging includes rent and mortgage interest, maintenance expenditures, and expenditures
on furnishings other than textiles.
The omitted categories in 2000 which cannot be priced for the years before 1800 include
most notably automobiles and travel (14%), vacations (5.5%), telephones (2.1%), pets (0.8%)
Source: United Kingdom, Office of National Statistics, Family Expenditure Survey

Table 6: Food Consumption Patterns of British Consumers, 2000, per week
Food
Unit
Consumption
At home (per week)
Implied Total Consumption
(per week)
Implied Food
Expenditure Shares, 1700-59 at constant
weights
Cereals g. 1,508 1,689 8.0 Potatoes g. 929 1,040 - Sugars: Sugar, preserves g. 139 156 8.4 Confectionary g. 64 72 - Soft Drinks g. equiv. 107 120 - Dairy: Milk and Cream ml. milk equiv. 2,081 2,331 5.5 Cheese g. 110 123 0.9 Meat, Fish, Eggs: Meat, meat products g. 966 1,082 12.2 Fish g. 143 160 1.8 Eggs Number 1.75 1.96 0.001 Fats, oils Butter g. 39 44 1.94 Lard g. 11 12 1.94 Vegetable Fats g. 89 100 - Vegetable Oils ml. 47 53 - Vegetables g. 1,077 1,206 - Fruits: Fresh g. 745 834 - Preserved g. 73 82 - Fruit Juices ml. 303 339 - Alcohol: Beer ml. 220 1,558 10.3 Wine ml. 146 312 - Other ml. 69 116 - Drink: Tea g. 34 68 48.0 Coffee g. 15 34 - Cocoa, etc g. 4 4 - Spices: Salt g. - 84 0.30 Pepper g. - 4 0.33 Ginger g. - 3.4 0.18 Tobacco: g. - 2.8 0.14 Sources: DEFRA, National Food Survey, 2000, Office of National Statistics, Family
Expenditure Survey, 2000.

Table 7: Budget shares assumed for the two social groups before 1869 (% of expenditure)
Category of Expenditure
Farm Laborer (Clark, 2004b)
Average
Household, UK, 2000
Assumed here
All Food and Drink: 74.5 18.0 26.00 Bread and flour 0.0 - 0.0 Wheat 32.0 - 4.3 Barley 3.0 - 0.0 Oats and oatmeal 2.5 - 0.0 Peas 2.5 - 0.0 Potato 4.0 0.30 0.0 Rice 0.0 - 0.0 Meat 9.5 1.86 4.4 Bacon 1.0 0.23 0.5 Fish 0.0 0.38 0.9 Eggs 0.5 0.10 0.2 Lard 1.0 - 0.6 Milk 4.3 0.88 2.0 Cheese 2.3 0.33 0.8 Butter 5.1 0.08 0.6 Vegetable Oils 0.0 0.40 0.0Sugar 3.0 1.36 3.2Tea 3.3 0.13 0.3Coffee, Cocoa 0.0 0.18 0.0 Beer, Cider 4.7 1.94 5.4 Wine, liquor 0.0 1.81 -Tobacco 0.0 1.54 2.2Salt 0.5 - 0.2Spices 0.0 - 0.4Vegetables 0.0 0.83 0.0Fruits and Nuts 0.0 0.71 0.0Prepared Foods, Restaurant Meals
0.0 3.40 0.0

Table 7 (cont.): Budget shares for the two social groups before 1869 (% of expenditure)
Category of Expenditure
Farm Laborer
(% expenditure)
Average
Household, UK, 2000
Assumed here
House Rent 5.4 - 23.0 Pewter and Tin Wares 0.4 - 1.5 Silverwares - - 3.0 Glasswares - - 3.0 Copper and Brasswares - - 1.5 Paint - - 3.0Housing, Decoration 6.0 24.0 35.0 Fuel 5.0 2.0 3.0 Tallow candles 3.5 - 0.0 Lamp Oil 0.0 - 0.5 Wax candles/Gas 0.0 - 1.0Light 3.5 1.0 1.5 Soap 0.5 1.0 1.5 House Furnishing Textiles 3.5 2.38 4.0Silk 0.0 - 1.5Clothing 5.5 5.12 6.0Leather Goods 1.0 1.13 1.5 Paper 0.0 1.0 1.4Books/Newspapers/TV 0.0 4.0 5.6 Services 0.5 9.0 13.0
Sources: Farm Laborers, Clark (2004c), DEFRA, National Food Survey, 2000, Office of
National Statistics, Family Expenditure Survey, 2000.

Table 8: The Components of the Living Costs of Farm Workers (1860-9 = 100)
Decade
Food
(.745)
Lodging
(0.06)
Fuel
(0.05)
Light
(0.035)
Soap
(0.005)
Clothing/Textiles (0.10)
Services
(0.005)
COL
1270 11.2 - 12.2 31.7 13.5 18.9 5.5 12.1 1280 9.9 10.5 13.4 28.9 18.6 21.2 5.4 11.3 1290 11.7 24.0 14.5 31.8 25.6 19.2 5.5 13.3 1300 10.4 21.2 15.0 39.2 29.0 23.0 5.7 12.6 1310 14.3 19.7 17.6 43.3 19.1 26.0 6.2 15.8 1320 13.3 16.2 17.7 44.8 22.4 22.5 6.3 14.8 1330 11.0 16.0 16.6 39.1 24.2 22.0 6.3 12.7 1340 10.6 14.6 18.9 38.8 24.7 20.0 5.7 12.3 1350 13.6 8.8 26.0 42.9 26.1 29.1 8.2 15.3 1360 14.1 10.1 24.2 45.5 27.5 30.2 9.4 15.9 1370 14.3 11.5 25.4 44.0 27.5 31.0 9.8 16.0 1380 10.9 10.0 23.5 42.3 27.5 30.8 9.8 13.2 1390 11.8 9.9 21.7 38.6 27.5 27.5 9.6 13.6 1400 12.0 11.1 20.5 39.2 27.5 27.0 10.3 13.9 1410 12.7 11.0 19.1 36.7 27.5 27.2 10.4 14.4 1420 11.1 10.3 19.7 34.0 28.5 27.6 10.9 13.1 1430 13.7 8.1 19.0 32.7 30.3 27.5 11.2 14.5 1440 10.9 7.9 17.6 32.5 40.4 26.9 11.5 12.5 1450 11.6 7.5 17.6 27.9 42.3 25.8 11.8 12.9 1460 11.2 7.8 17.5 29.5 38.1 27.2 11.3 12.7 1470 11.4 8.2 16.2 28.0 29.3 27.4 11.5 12.8 1480 12.5 8.4 14.2 27.6 32.6 27.2 11.3 13.7 1490 11.5 8.8 14.8 23.4 33.8 26.6 11.2 12.8 1500 11.8 8.1 15.3 22.6 28.7 28.1 11.1 13.1 1510 12.2 9.0 16.4 24.9 35.5 26.1 11.4 13.5 1520 15.2 8.8 17.7 25.9 40.3 28.0 11.9 16.0 1530 16.0 9.8 17.4 26.7 51.1 29.9 12.2 17.0 1540 18.6 9.3 18.3 29.9 49.7 31.1 13.0 18.6 1550 30.2 12.3 26.5 38.7 82.6 36.6 17.7 29.0 1560 29.7 19.5 30.8 50.7 102.2 43.2 19.7 30.7 1570 31.6 15.1 35.6 53.6 89.3 51.1 20.6 32.5 1580 36.0 19.9 38.6 58.7 78.3 54.3 22.1 37.0 1590 48.9 25.1 41.3 79.0 92.4 56.5 22.4 47.7

Table 8: The Components of the Living Costs of Farm Workers (cont.)
Decade
Food (.26)
Lodging
(0.35)
Fuel
(0.05)
Light
(0.035)
Soap
(0.005)
Clothing Textiles/
(0.10)
Services (0.005)
COL
1600 49.3 26.0 46.9 80.6 97.9 61.7 24.5 49.2 1610 57.2 30.0 54.7 85.4 101.4 66.5 26.1 56.5 1620 56.2 27.2 55.3 86.3 101.2 71.7 27.1 55.8 1630 65.3 33.3 58.2 93.5 120.6 84.0 29.6 64.6 1640 66.6 28.8 73.4 101.9 120.1 92.9 32.9 66.4 1650 67.4 26.7 71.6 100.1 112.4 91.1 36.3 66.3 1660 65.3 31.7 76.9 102.2 108.6 90.9 37.6 65.9 1670 63.1 34.3 80.3 94.3 95.3 84.1 38.7 64.2 1680 59.0 38.3 80.3 88.0 95.3 81.9 40.5 61.2 1690 69.2 33.5 86.5 98.8 131.9 85.0 42.0 69.1 1700 58.6 39.7 88.8 90.7 108.9 84.2 43.6 61.3 1710 65.1 33.4 85.3 111.5 146.7 88.0 43.3 66.6 1720 64.1 35.6 84.2 106.2 150.5 87.6 43.3 66.1 1730 56.6 34.9 84.4 99.8 143.4 86.3 43.8 59.9 1740 58.3 30.2 95.1 120.2 159.1 89.0 43.6 61.5 1750 64.0 34.0 96.1 115.9 151.7 93.5 43.6 66.8 1760 68.6 34.7 96.4 125.0 162.8 97.2 45.8 70.9 1770 77.4 40.4 103.1 132.4 160.5 95.3 48.7 78.7 1780 79.3 39.5 103.2 138.4 174.6 94.9 49.8 80.2 1790 93.4 49.4 116.1 152.1 193.4 97.2 57.8 92.9 1800 131.3 72.1 146.4 196.6 236.4 110.9 76.6 126.5 1810 145.4 91.6 158.7 211.2 267.8 122.1 93.6 141.2 1820 110.0 91.9 142.5 129.3 191.8 115.7 87.7 111.5 1830 100.9 91.7 132.4 110.4 173.8 111.5 88.8 103.3 1840 100.3 85.0 117.7 104.5 125.9 108.8 88.8 101.1 1850 96.6 87.5 103.6 97.8 107.7 96.5 89.5 96.2 1860 100.0 100.0 99.9 100.0 100.0 100.0 100.0 100.0

Table 9: The Components of the Living Costs of Prosperous Consumers (1860-9 = 100)
Decade
Food (.26)
Lodging
(0.35)
Fuel
(0.03)
Light
(0.015)
Soap
(0.015)
Clothing /Textiles
(0.13)
Services
(0.13)
Books (0.056)
Paper/Parchment
(0.014)
COL
1270 23.9 - 40.7 31.7 13.5 - 5.5 331.3 14.4 - 1280 25.7 13.3 44.4 28.9 18.6 23.0 5.4 331.3 18.3 19.1 1290 24.0 25.5 57.6 31.8 25.6 21.2 5.5 331.3 23.7 25.3 1300 28.6 24.0 52.3 39.2 29.0 24.8 5.7 331.3 19.9 25.2 1310 26.3 22.8 54.8 43.3 19.1 27.7 6.2 417.0 23.4 26.2 1320 29.8 18.6 52.3 44.8 22.4 24.4 6.3 417.0 26.8 24.2 1330 30.1 18.4 43.9 39.1 24.2 23.9 6.3 417.0 19.9 24.2 1340 31.7 16.9 50.3 38.8 24.7 22.0 5.7 417.0 27.9 23.4 1350 32.9 12.3 64.8 42.9 26.1 30.6 8.2 417.0 36.1 23.5 1360 40.2 14.6 57.8 45.5 27.5 31.6 9.4 183.2 80.0 25.2 1370 37.1 15.9 49.1 44.0 27.5 32.3 9.8 183.2 57.9 26.5 1380 40.1 14.3 48.1 42.3 27.5 32.2 9.8 183.2 57.9 25.1 1390 38.0 13.1 45.2 38.6 27.5 29.1 9.6 183.2 35.9 23.3 1400 35.5 15.4 49.2 39.2 27.5 28.6 10.3 183.2 29.5 23.9 1410 30.7 15.2 55.4 36.7 27.5 28.9 10.4 184.1 23.4 24.9 1420 37.0 14.3 51.5 34.0 28.5 29.2 10.9 184.1 21.5 23.8 1430 32.5 11.8 54.1 32.7 30.3 29.1 11.2 184.1 20.5 22.3 1440 32.5 11.7 54.5 32.5 40.4 28.5 11.5 184.1 18.8 21.7 1450 29.1 10.8 50.7 27.9 42.3 27.5 11.8 184.1 20.2 21.3 1460 28.9 12.2 49.2 29.5 38.1 28.8 11.3 251.8 17.8 21.8 1470 27.0 11.8 58.1 28.0 29.3 29.0 11.5 251.8 18.5 21.3 1480 25.9 12.6 57.5 27.6 32.6 28.8 11.3 251.8 18.4 21.6 1490 25.4 12.1 61.8 23.4 33.8 28.3 11.2 251.8 16.8 20.9 1500 24.0 11.7 53.1 22.6 28.7 30.4 11.1 251.8 15.7 19.4 1510 22.5 12.8 56.3 24.9 35.5 27.3 11.4 104.4 15.4 20.0 1520 24.6 12.7 60.8 25.9 40.3 28.7 11.9 70.6 16.4 20.3 1530 28.1 13.2 57.1 26.7 51.1 30.6 12.2 36.9 16.0 20.9 1540 29.4 16.1 56.5 29.9 49.7 33.7 13.0 33.4 18.3 24.2 1550 35.1 17.5 96.6 38.7 82.6 38.9 17.7 35.7 23.2 29.9 1560 49.6 24.7 104.1 50.7 102.2 45.1 19.7 39.5 27.0 36.2 1570 51.8 20.1 102.5 53.6 89.3 52.3 20.6 50.8 28.1 35.3 1580 54.1 25.6 103.6 58.7 78.3 57.4 22.1 59.2 25.7 39.8 1590 58.5 29.2 127.3 79.0 92.4 59.3 22.4 54.5 25.4 43.7
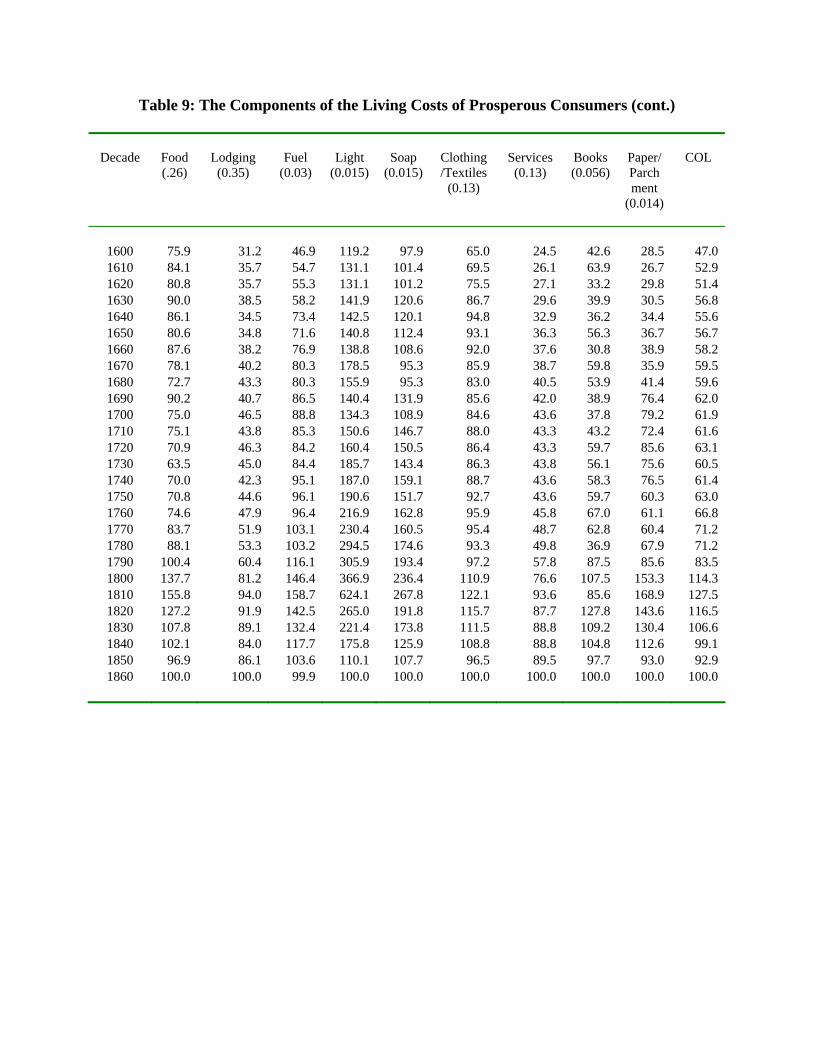
Table 9: The Components of the Living Costs of Prosperous Consumers (cont.)
Decade
Food (.26)
Lodging (0.35)
Fuel
(0.03)
Light
(0.015)
Soap
(0.015)
Clothing /Textiles
(0.13)
Services (0.13)
Books (0.056)
Paper/Parchment
(0.014)
COL
1600 75.9 31.2 46.9 119.2 97.9 65.0 24.5 42.6 28.5 47.0 1610 84.1 35.7 54.7 131.1 101.4 69.5 26.1 63.9 26.7 52.9 1620 80.8 35.7 55.3 131.1 101.2 75.5 27.1 33.2 29.8 51.4 1630 90.0 38.5 58.2 141.9 120.6 86.7 29.6 39.9 30.5 56.8 1640 86.1 34.5 73.4 142.5 120.1 94.8 32.9 36.2 34.4 55.6 1650 80.6 34.8 71.6 140.8 112.4 93.1 36.3 56.3 36.7 56.7 1660 87.6 38.2 76.9 138.8 108.6 92.0 37.6 30.8 38.9 58.2 1670 78.1 40.2 80.3 178.5 95.3 85.9 38.7 59.8 35.9 59.5 1680 72.7 43.3 80.3 155.9 95.3 83.0 40.5 53.9 41.4 59.6 1690 90.2 40.7 86.5 140.4 131.9 85.6 42.0 38.9 76.4 62.0 1700 75.0 46.5 88.8 134.3 108.9 84.6 43.6 37.8 79.2 61.9 1710 75.1 43.8 85.3 150.6 146.7 88.0 43.3 43.2 72.4 61.6 1720 70.9 46.3 84.2 160.4 150.5 86.4 43.3 59.7 85.6 63.1 1730 63.5 45.0 84.4 185.7 143.4 86.3 43.8 56.1 75.6 60.5 1740 70.0 42.3 95.1 187.0 159.1 88.7 43.6 58.3 76.5 61.4 1750 70.8 44.6 96.1 190.6 151.7 92.7 43.6 59.7 60.3 63.0 1760 74.6 47.9 96.4 216.9 162.8 95.9 45.8 67.0 61.1 66.8 1770 83.7 51.9 103.1 230.4 160.5 95.4 48.7 62.8 60.4 71.2 1780 88.1 53.3 103.2 294.5 174.6 93.3 49.8 36.9 67.9 71.2 1790 100.4 60.4 116.1 305.9 193.4 97.2 57.8 87.5 85.6 83.5 1800 137.7 81.2 146.4 366.9 236.4 110.9 76.6 107.5 153.3 114.3 1810 155.8 94.0 158.7 624.1 267.8 122.1 93.6 85.6 168.9 127.5 1820 127.2 91.9 142.5 265.0 191.8 115.7 87.7 127.8 143.6 116.5 1830 107.8 89.1 132.4 221.4 173.8 111.5 88.8 109.2 130.4 106.6 1840 102.1 84.0 117.7 175.8 125.9 108.8 88.8 104.8 112.6 99.1 1850 96.9 86.1 103.6 110.1 107.7 96.5 89.5 97.7 93.0 92.9 1860 100.0 100.0 99.9 100.0 100.0 100.0 100.0 100.0 100.0 100.0

Figure 1: The Real Day Wages of Farm Laborers, England, 1200-1869
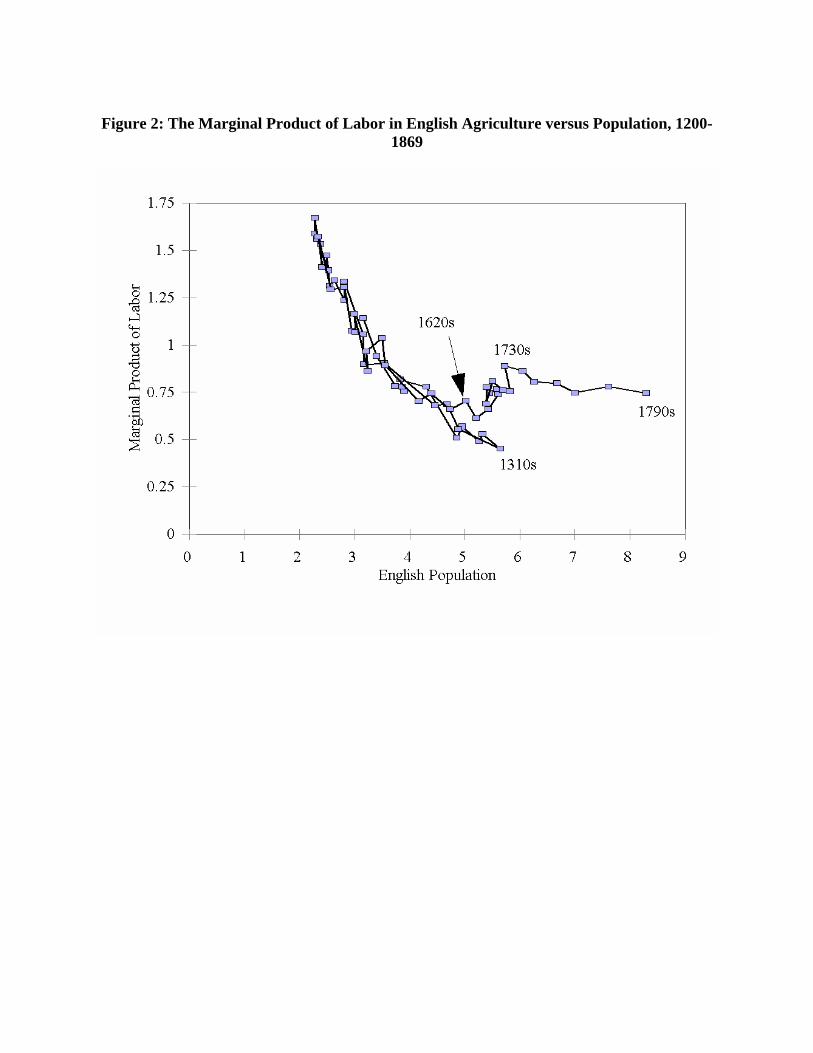
Figure 2: The Marginal Product of Labor in English Agriculture versus Population, 1200-
1869

Figure 3: The Rise in Wheat Prices in England, 1200-1869 (by decade)

Figure 4: The Price of Books, Sugar and Tobacco relative to Building Workers Wages

Figure 5: The Price of Paper and Parchment relative to Building Workers Wages

Figure 6: Spice Prices relative to Building Workers Wages
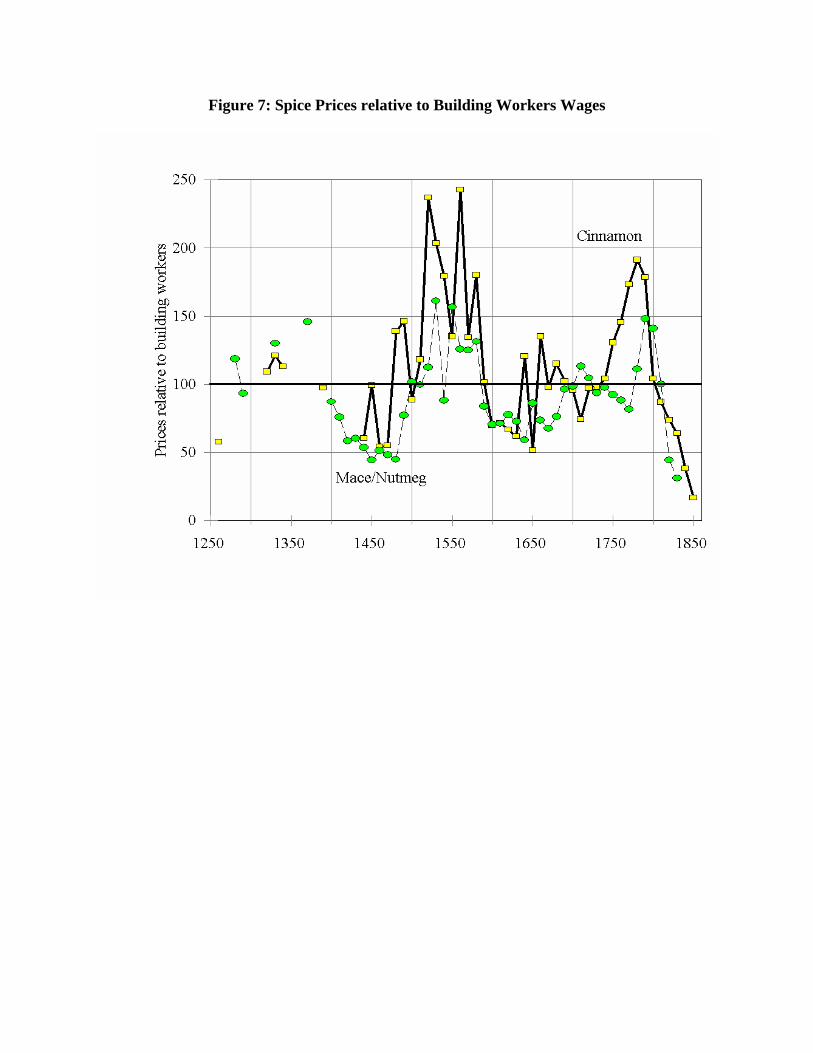
Figure 7: Spice Prices relative to Building Workers Wages

Figure 8: Gunpowder, Cutting Tool and Nail Prices relative to Building Workers Wages

Figure 9: Housing and House Decoration.

Figure 10: Textile Prices relative to Building Workers Wages

Figure 11: Metal Housewares Prices relative to Building Workers Wages

Figure 12: The Costs of Light relative to Building Workers Wages

Figure 13: The Relative Cost of Food and Lodging, modern consumption versus farm
workers (1700-59 = 1.00)
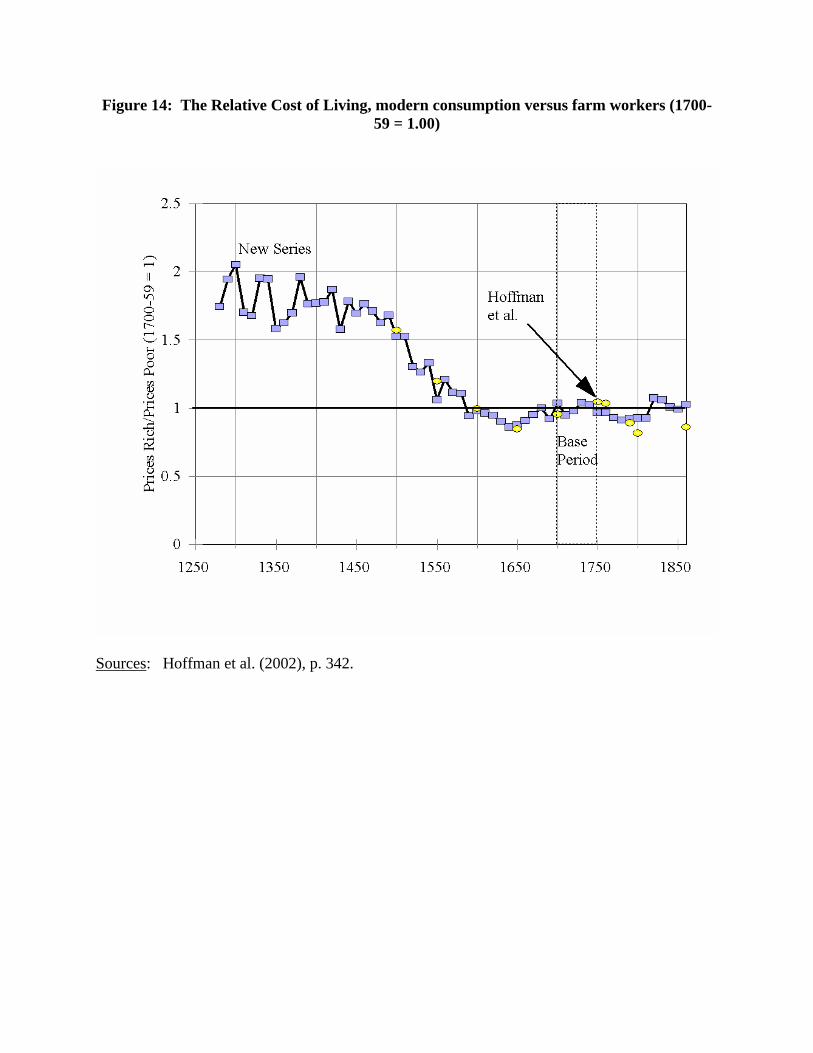
Figure 14: The Relative Cost of Living, modern consumption versus farm workers (1700-59 = 1.00)
Sources: Hoffman et al. (2002), p. 342.

Figure 15: Real Wages of Farm Workers and, Hypothetically, Modern Consumers (1860-9
= 100)