
Rice Fortification in Costa Rica: a case studyRice Fortification in Costa Rica: a case study Scaling...
26
Rice Fortification in Costa Rica: a case study Scaling Up Rice Fortification in Asia Bangkok Workshop, 2014 Dr. Luis Tacsan Health Research and Technology Development Dpt Ministry of Health Costa Rica
Transcript of Rice Fortification in Costa Rica: a case studyRice Fortification in Costa Rica: a case study Scaling...
Rice Fortification in Costa Rica: a case study
Scaling Up Rice Fortification
in Asia
Bangkok Workshop, 2014
Dr. Luis Tacsan
Health Research and
Technology Development Dpt
Ministry of Health
Costa Rica
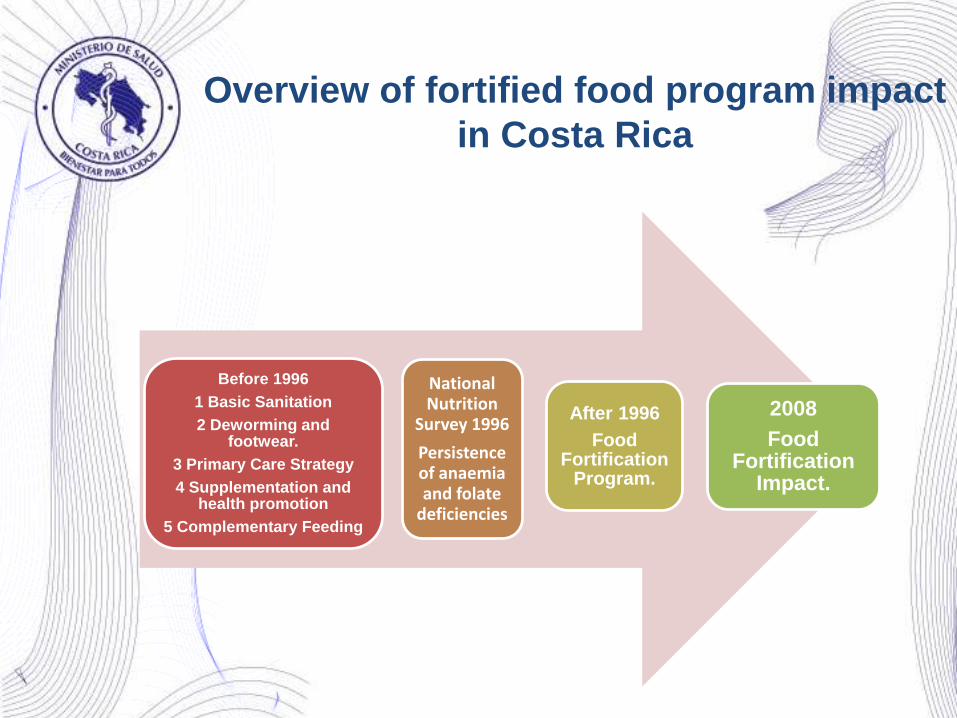
Overview of fortified food program impact
in Costa Rica
Before 1996
1 Basic Sanitation
2 Deworming and footwear.
3 Primary Care Strategy
4 Supplementation and health promotion
5 Complementary Feeding
National Nutrition
Survey 1996
Persistence of anaemiaand folate
deficiencies
After 1996
Food Fortification
Program.
2008
Food Fortification
Impact.
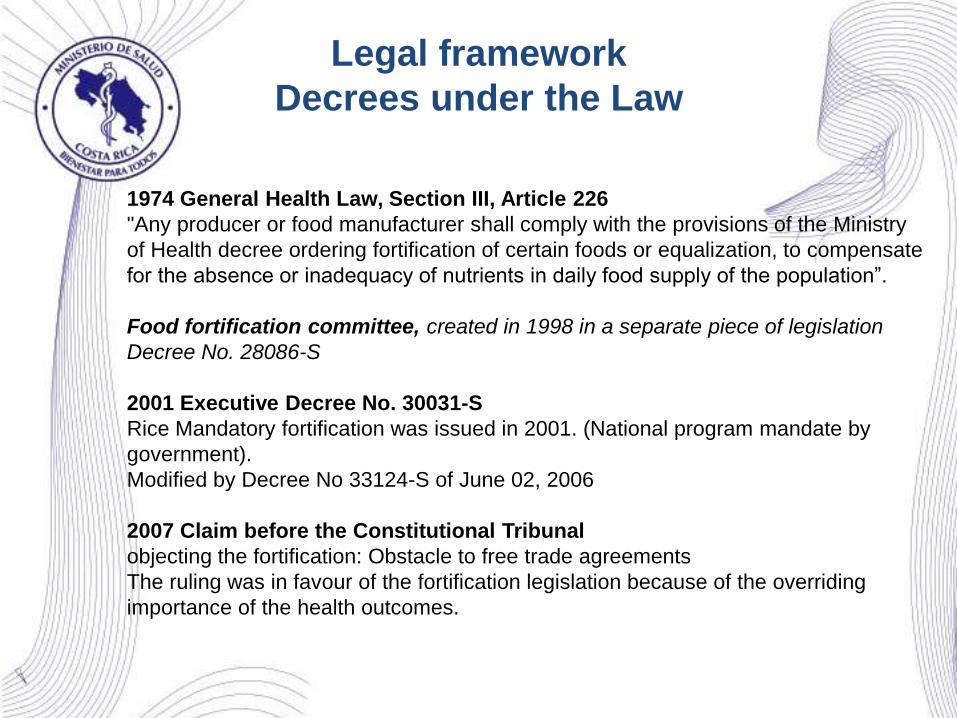
Legal framework
Decrees under the Law
1974 General Health Law, Section III, Article 226
"Any producer or food manufacturer shall comply with the provisions of the Ministry
of Health decree ordering fortification of certain foods or equalization, to compensate
for the absence or inadequacy of nutrients in daily food supply of the population”.
Food fortification committee, created in 1998 in a separate piece of legislation
Decree No. 28086-S
2001 Executive Decree No. 30031-S
Rice Mandatory fortification was issued in 2001. (National program mandate by
government).
Modified by Decree No 33124-S of June 02, 2006
2007 Claim before the Constitutional Tribunal
objecting the fortification: Obstacle to free trade agreements
The ruling was in favour of the fortification legislation because of the overriding
importance of the health outcomes.
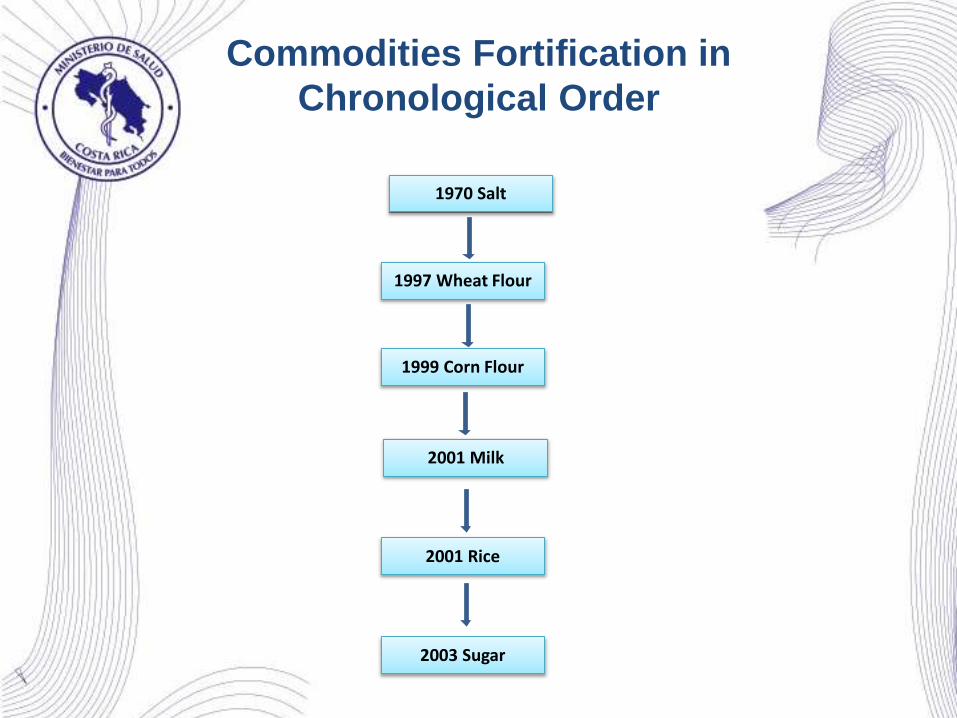
Commodities Fortification in
Chronological Order
1997 Wheat Flour
2003 Sugar
1970 Salt
1999 Corn Flour
2001 Milk
2001 Rice
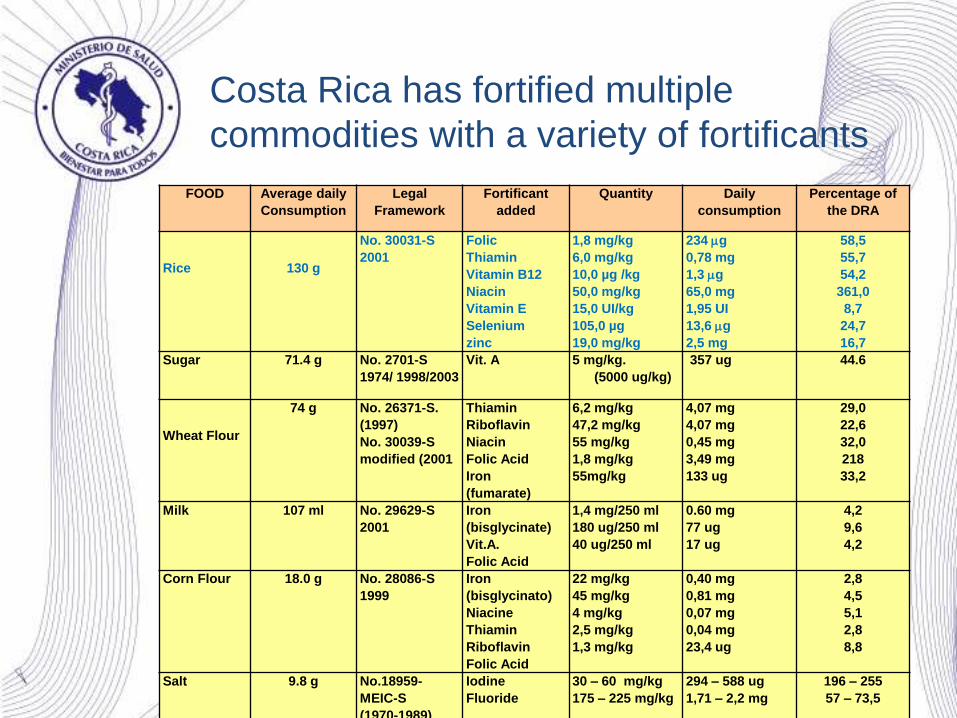
Costa Rica has fortified multiple
commodities with a variety of fortificants
Source: Official Publication La Gaceta
FOOD Average daily
Consumption
Legal
Framework
Fortificant
added
Quantity Daily
consumption
Percentage of
the DRA
Rice 130 g
No. 30031-S
2001
Folic
Thiamin
Vitamin B12
Niacin
Vitamin E
Selenium
zinc
1,8 mg/kg
6,0 mg/kg
10,0 µg /kg
50,0 mg/kg
15,0 UI/kg
105,0 µg
19,0 mg/kg
234 g
0,78 mg
1,3 g
65,0 mg
1,95 UI
13,6 g
2,5 mg
58,5
55,7
54,2
361,0
8,7
24,7
16,7
Sugar 71.4 g No. 2701-S
1974/ 1998/2003
Vit. A 5 mg/kg.
(5000 ug/kg)
357 ug 44.6
Wheat Flour
74 g No. 26371-S.
(1997)
No. 30039-S
modified (2001
Thiamin
Riboflavin
Niacin
Folic Acid
Iron
(fumarate)
6,2 mg/kg
47,2 mg/kg
55 mg/kg
1,8 mg/kg
55mg/kg
4,07 mg
4,07 mg
0,45 mg
3,49 mg
133 ug
29,0
22,6
32,0
218
33,2
Milk 107 ml No. 29629-S
2001
Iron
(bisglycinate)
Vit.A.
Folic Acid
1,4 mg/250 ml
180 ug/250 ml
40 ug/250 ml
0.60 mg
77 ug
17 ug
4,2
9,6
4,2
Corn Flour 18.0 g No. 28086-S
1999
Iron
(bisglycinato)
Niacine
Thiamin
Riboflavin
Folic Acid
22 mg/kg
45 mg/kg
4 mg/kg
2,5 mg/kg
1,3 mg/kg
0,40 mg
0,81 mg
0,07 mg
0,04 mg
23,4 ug
2,8
4,5
5,1
2,8
8,8
Salt 9.8 g No.18959-
MEIC-S
(1970-1989)
Iodine
Fluoride
30 – 60 mg/kg
175 – 225 mg/kg
294 – 588 ug
1,71 – 2,2 mg
196 – 255
57 – 73,5
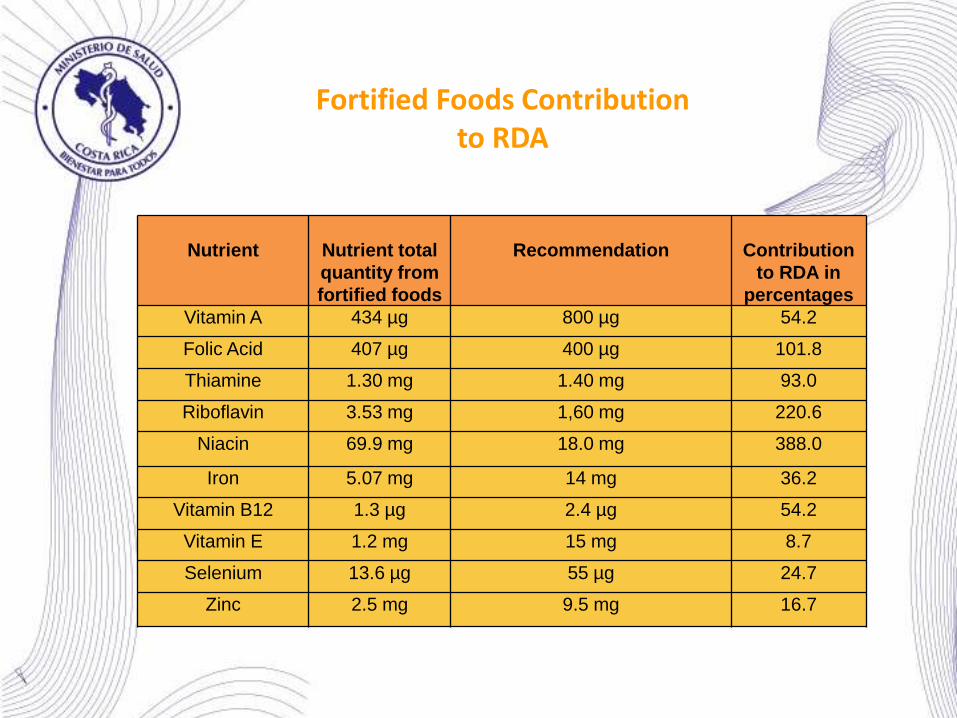
Fortified Foods Contribution to RDA
Nutrient Nutrient total
quantity from
fortified foods
Recommendation Contribution
to RDA in
percentages
Vitamin A 434 µg 800 µg 54.2
Folic Acid 407 µg 400 µg 101.8
Thiamine 1.30 mg 1.40 mg 93.0
Riboflavin 3.53 mg 1,60 mg 220.6
Niacin 69.9 mg 18.0 mg 388.0
Iron 5.07 mg 14 mg 36.2
Vitamin B12 1.3 µg 2.4 µg 54.2
Vitamin E 1.2 mg 15 mg 8.7
Selenium 13.6 µg 55 µg 24.7
Zinc 2.5 mg 9.5 mg 16.7
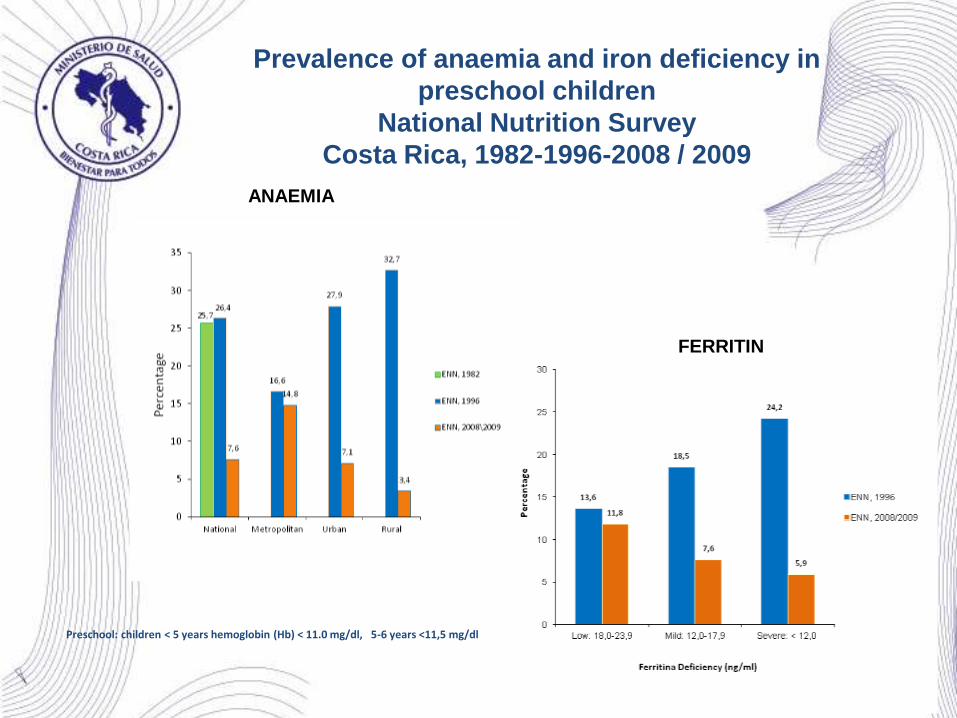
Prevalence of anaemia and iron deficiency in
preschool children
National Nutrition Survey
Costa Rica, 1982-1996-2008 / 2009
Preschool: children < 5 years hemoglobin (Hb) < 11.0 mg/dl, 5-6 years <11,5 mg/dl
FERRITIN
ANAEMIA
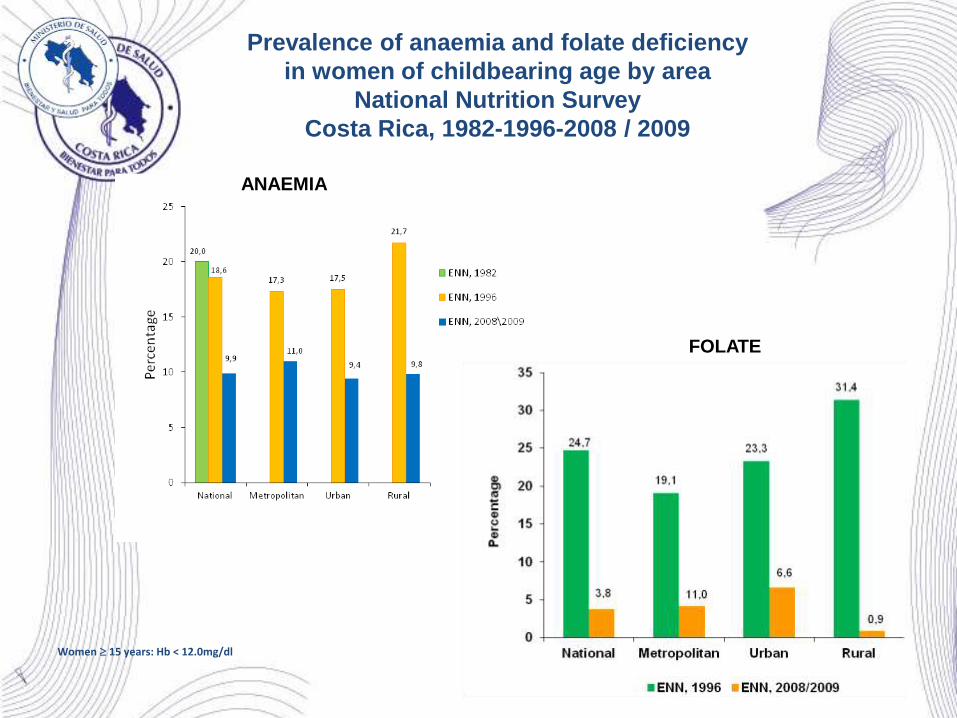
Prevalence of anaemia and folate deficiency
in women of childbearing age by area
National Nutrition Survey
Costa Rica, 1982-1996-2008 / 2009
Women 15 years: Hb < 12.0mg/dl
ANAEMIA
FOLATE
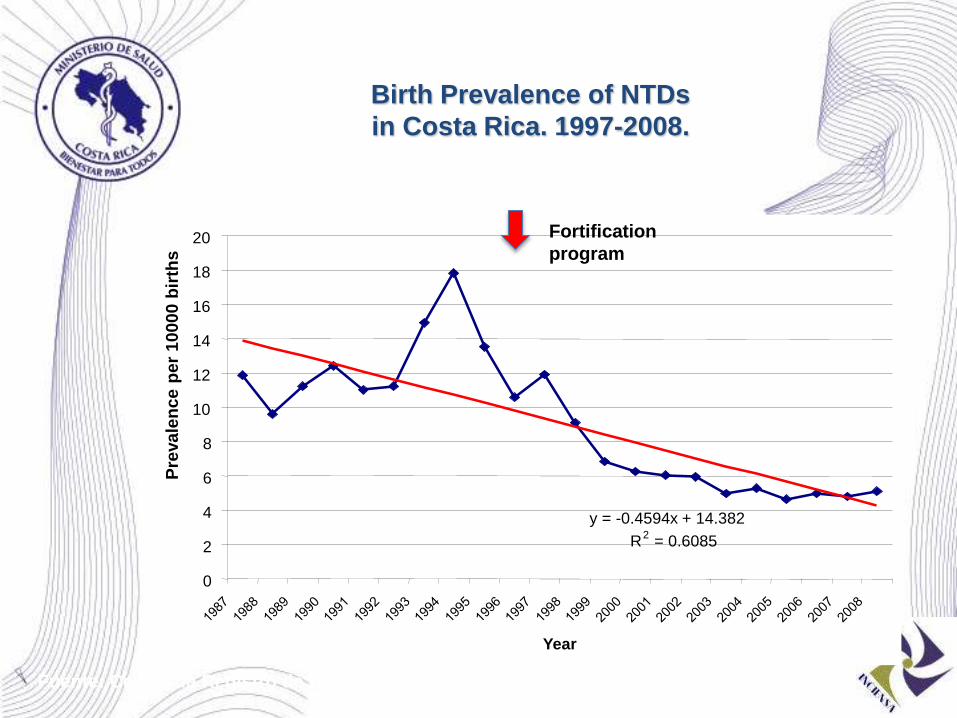
Birth Prevalence of NTDs
in Costa Rica. 1997-2008.
Fuente: Centro de Registro de Enfermedades Congénitas (CREC).
y = -0.4594x + 14.382
R2
= 0.6085
0
2
4
6
8
10
12
14
16
18
20
Year
Pre
vale
nce
per
10000 b
irth
s
Fortification
program
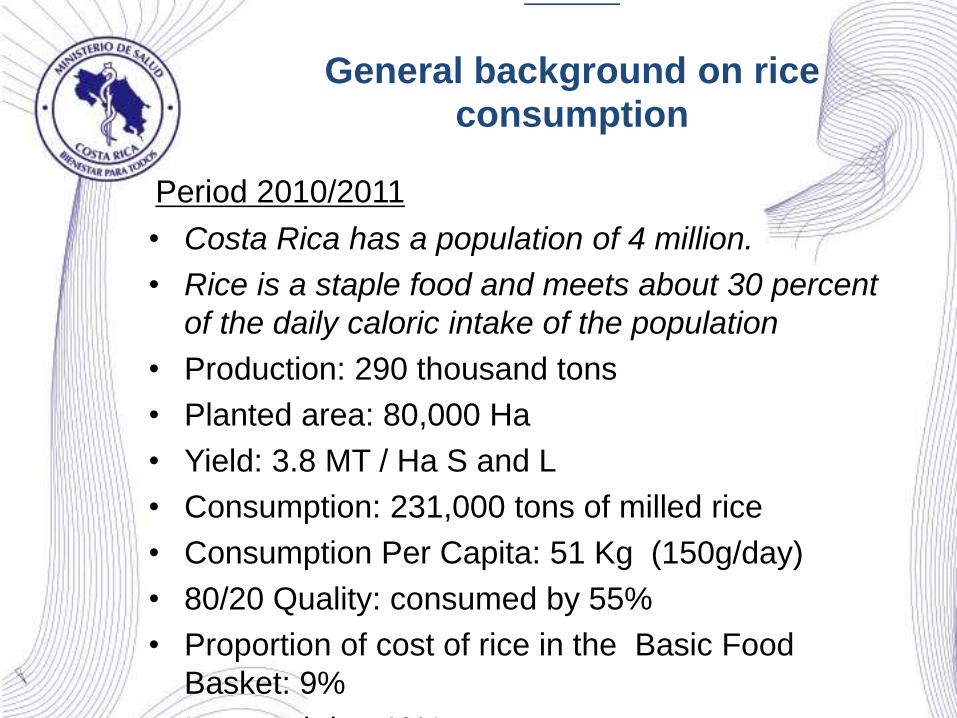
General background on rice consumption
Period 2010/2011
• Costa Rica has a population of 4 million.
• Rice is a staple food and meets about 30 percent
of the daily caloric intake of the population
• Production: 290 thousand tons
• Planted area: 80,000 Ha
• Yield: 3.8 MT / Ha S and L
• Consumption: 231,000 tons of milled rice
• Consumption Per Capita: 51 Kg (150g/day)
• 80/20 Quality: consumed by 55%
• Proportion of cost of rice in the Basic Food
Basket: 9%
• Imported rice 40%
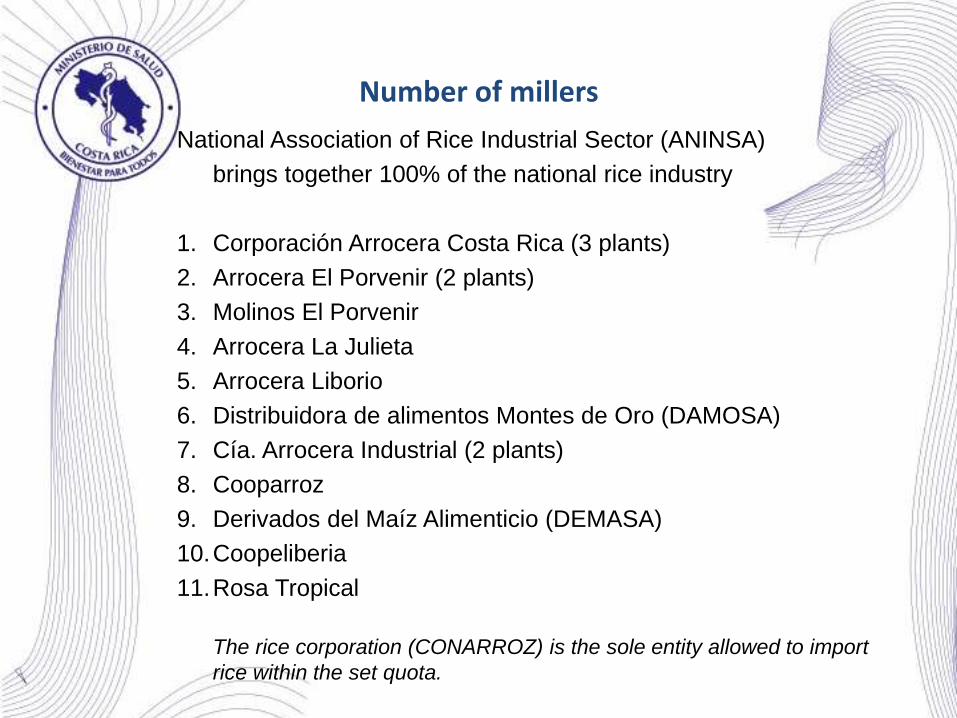
Number of millers
National Association of Rice Industrial Sector (ANINSA)
brings together 100% of the national rice industry
1. Corporación Arrocera Costa Rica (3 plants)
2. Arrocera El Porvenir (2 plants)
3. Molinos El Porvenir
4. Arrocera La Julieta
5. Arrocera Liborio
6. Distribuidora de alimentos Montes de Oro (DAMOSA)
7. Cía. Arrocera Industrial (2 plants)
8. Cooparroz
9. Derivados del Maíz Alimenticio (DEMASA)
10.Coopeliberia
11.Rosa Tropical
The rice corporation (CONARROZ) is the sole entity allowed to import
rice within the set quota.
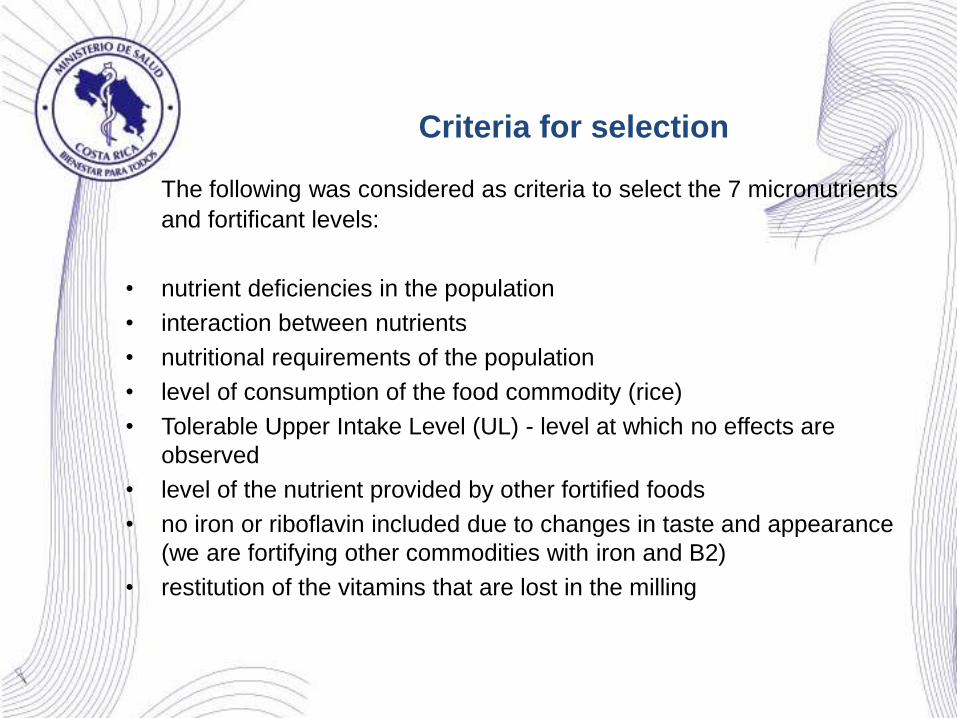
The following was considered as criteria to select the 7 micronutrients
and fortificant levels:
• nutrient deficiencies in the population
• interaction between nutrients
• nutritional requirements of the population
• level of consumption of the food commodity (rice)
• Tolerable Upper Intake Level (UL) - level at which no effects are
observed
• level of the nutrient provided by other fortified foods
• no iron or riboflavin included due to changes in taste and appearance
(we are fortifying other commodities with iron and B2)
• restitution of the vitamins that are lost in the milling
Criteria for selection
Rice fortification technology experience: coating, extrusion and blending (innovative millers)
There are two private fortified grain manufacturers, one that
uses a coating technology and another that uses a cold-
extrusion technology. Both technologies are used in Costa
Rica.
These two manufacturers supply the country's 11 milling
companies, which, in turn, blend fortified grains into their
traditional rice and then sell this fortified rice through their
distribution channels.
All of the country's rice supply is fortified.
Dosage in milled rice
For every 1,000 grams of milled rice,
5 grams of fortified rice: 0,5%
(coated grain or extruded grain)
are included.

Dispensers
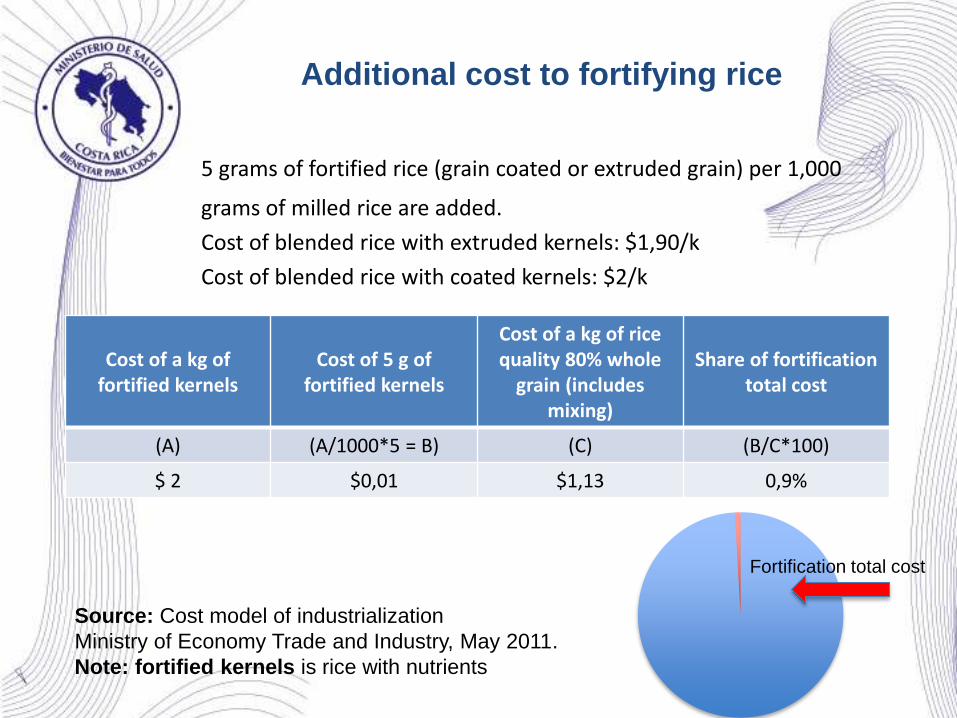
Additional cost to fortifying rice
5 grams of fortified rice (grain coated or extruded grain) per 1,000
grams of milled rice are added.
Cost of blended rice with extruded kernels: $1,90/k
Cost of blended rice with coated kernels: $2/k
Cost of a kg of fortified kernels
Cost of 5 g of fortified kernels
Cost of a kg of rice quality 80% whole
grain (includes mixing)
Share of fortification total cost
(A) (A/1000*5 = B) (C) (B/C*100)
$ 2 $0,01 $1,13 0,9%
Source: Cost model of industrialization
Ministry of Economy Trade and Industry, May 2011.
Note: fortified kernels is rice with nutrients
Fortification total cost
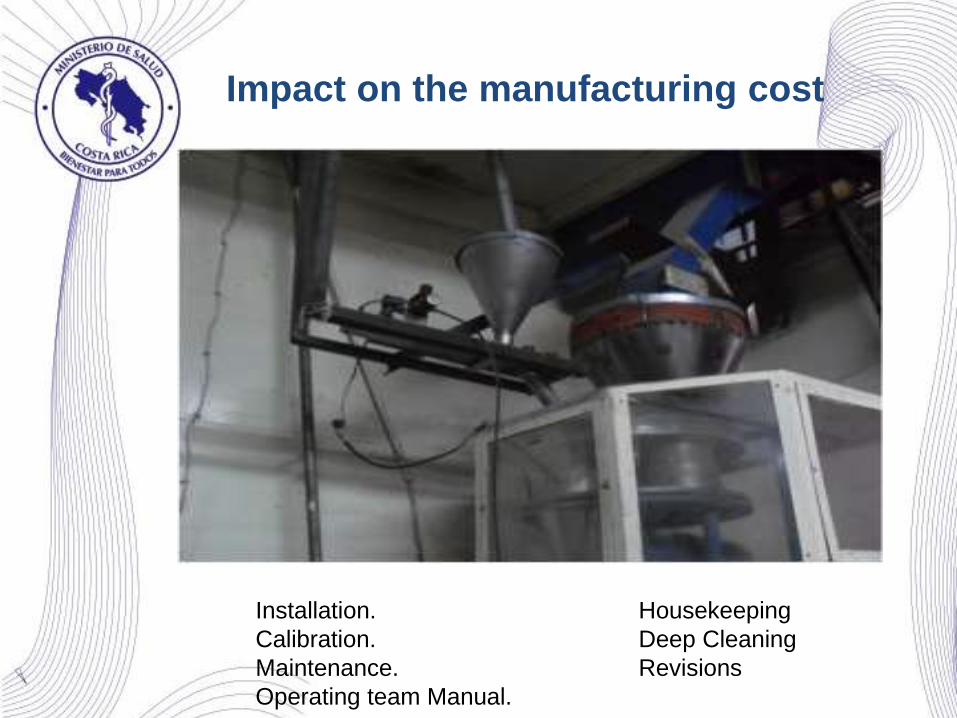
Impact on the manufacturing cost
Installation. Housekeeping
Calibration. Deep Cleaning
Maintenance. Revisions
Operating team Manual.
Additional cost to fortifying rice
who pays
The Ministry of Health budget financed the health needs research, but
technology development was financed by fortified grain producers seeking
profit opportunities. A fortification premix supplier, supported the industry by
investing in the development of blending technology.
A significant portion of the cost to develop a rice fortification program was
covered by the private sector.
The government's only costs to maintain the program at this time are labour
and laboratory equipment necessary for ongoing monitoring, evaluation, and
quality-control activities.
The incremental cost of fortification is passed on to consumers, but this in a
setting of relatively inelastic demand and government-controlled retail and
wholesale prices: the Ministry of Economy Trade and Industry included the
added cost in the rice retail price. By achieving universal fortification, there
were no competing unfortified rice products available and, consequently, no
additional resources that would have been needed to create consumer
demand.
Quality control (enforcement)
Internal monitoring is assigned to the rice manufacturers and importers; and
external quality control and evaluation is the responsibility of the Ministry of
Health.
Internal monitoring is performed
• Companies that provide the fortified product meet the parameters established in
the Decree.
• Sampling of rice is undertaken every hour, grain counting
• Sampling is also analyzed in third party laboratory under procedures guidelines to
determine compliance.
External monitoring is performed by the government's quality-control agency,
obtaining samples from retailers (POS) as opposed to upstream sampling at
manufacturing sites, this way it allows quality control across the supply chain. The
analysis are carried out in the INCIENSA (Instituto Costarricense de
Investigación y Enseñanza en Nutrición y Salud) laboratories.
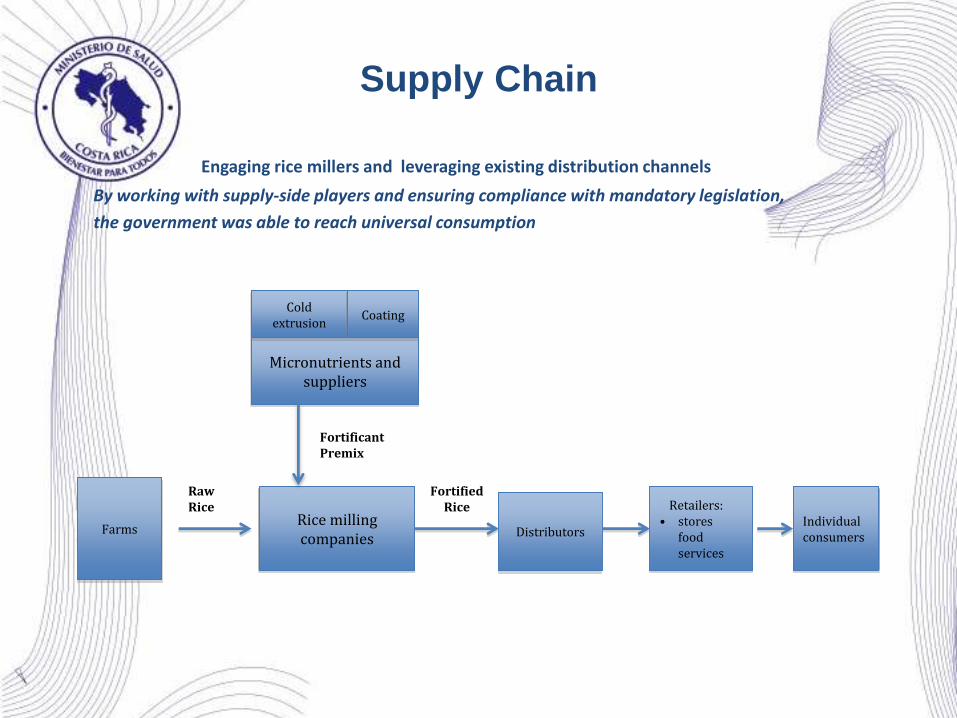
Supply Chain
Engaging rice millers and leveraging existing distribution channels
By working with supply-side players and ensuring compliance with mandatory legislation,
the government was able to reach universal consumption
Micronutrients and suppliers
Cold extrusion
Coating
FarmsRice milling companies Distributors
Retailers:• stores
food services
Individual consumers
FortificantPremix
Fortified Rice
RawRice
Consumer acceptability
with the introduction of fortified rice in Costa Rica
Consumers can not tell the difference between
fortified and non fortified rice
The fortified rice goes unnoticed
It has no color, smell or look different from non
fortified rice
Rice can be washed without losing nutrients
100% acceptance
Partnership process
• Technical approach of the proposal
• Harnessing alliance with the industry
• Support for negotiations with industry association: study
premix options and costs, taking into account market price.
• Ministry of Economy includes the cost of fortification within
the cost model of rice processing.
• The cost of fortification was transferred to the consumer
without a significant increase in the price.
• INCIENSA (government's quality-control laboratory)
Partnerships
Policy:
• Ministry of Health – Ministry of Economy
• National Commission of Micronutrients ( in charge of the program: taking corrective measures and adjustments if needed. The MoH holds the Commission´s Presidency )
Technology development and Premix tests:
• Kuruba
• DSM
Technology assessment and stability of micronutrients:
• INCAP
Advocacy: gaining general support for a universal coverage
• ANINSA – National Association of Industrial Rice sector
• CONARROZ - National Rice Corporation
Monitoring and quality Control
• Ministry of Health with INCIENSA laboratory
Key lessons regarding scaling up rice fortification
•To formulation of public policy that make fortified rice for human
intake mandatory nationwide
•To take into account producing companies conditions in legal
provisions. It is more feasible to extend it to the rice industry private
sector when centralized (ANINSA)
•To consolidate alliances among different sectors and key actors is
an essential process for promoting rice fortification and avoid
resistance (Micronutrients National Commission: cross-sector)
•To share social responsibility is fundamental
• Focus on social rights (UNICEF)
•To be used as successal experience in new commodities
fortification.
Key lessons regarding scaling up
rice fortification
• To have the political, technical and financial support of the
government in order to guarantee reinforcement (Decree and
constitutional court sentencing)
• To continue fortifying even after obtaining positive results
• To develop on-going research to evaluate results and quality
controls
• To sustain over time epidemiological surveillance – monitoring
changes in the market and nutritional habits of people
(Nutritional surveys)
• Universal fortification eliminated the additional resources that
would have been needed to create consumer demand.

thank you