RI DEM/Air Resources- 2013 Annual Monitoring Network Plan
37
STATE OF RHODE ISLAND AND PROVIDENCE PLANTATIONS DEPARTMENT OF ENVIRONMENTAL MANAGEMENT OFFICE OF AIR RESOURCES Rhode Island 2013 Annual Monitoring Network Plan Posted for Public Review on June 11, 2013 Submitted to the EPA on July 12, 2013
Transcript of RI DEM/Air Resources- 2013 Annual Monitoring Network Plan
STATE OF RHODE ISLAND AND PROVIDENCE PLANTATIONS DEPARTMENT OF ENVIRONMENTAL MANAGEMENT
OFFICE OF AIR RESOURCES
Rhode Island 2013 Annual Monitoring Network Plan
Posted for Public Review on June 11, 2013
Submitted to the EPA on July 12, 2013

1
Regulatory Background Section 58.10(a) of Title 40 of the Code of Federal Regulations (40 CFR 58.10(a)) requires states to submit a monitoring network plan to the United States Environmental Protection Agency (EPA) in July of each year. The plan must provide a description of the state’s current monitoring network, demonstrate that the network conforms to EPA requirements, and discuss any plans to remove or move a monitoring station in the 18 months following the plan submittal. The plan must be posted for public comment 30 days prior to submittal to the EPA. This document will serve as Rhode Island’s 2013 annual Monitoring Network Plan. Rhode Island Monitoring Network The Rhode Island Department of Environmental Management (RI DEM), in conjunction with the Rhode Island Department of Health (RI DOH), operates a network of air monitoring stations to measure ambient concentrations of pollutants for which the EPA has established a National Ambient Air Quality Standard (NAAQS). Those pollutants, which are known as criteria pollutants, include ozone (O3), particulate matter smaller than 10 microns (PM10), particulate matter smaller than 2.5 microns (PM2.5), nitrogen dioxide (NO2), sulfur dioxide (SO2), carbon monoxide (CO) and lead. The criteria pollutant monitoring sites are part of the EPA’s State or Local Air Monitoring Stations network (SLAMS). In addition, RI DEM and RI DOH monitor ambient levels of toxic air pollutants and of ozone precursors, which are substances that react in the atmosphere to form ground-level ozone. The State operates one monitoring site that is part of the National Air Toxics Trends Sites (NATTS) network, two that are part of the Photochemical Assessment Monitoring Stations (PAMS) network, one that is part of the PM2.5 Speciation Trends Network (STN) and one that is part of the network of core multipollutant monitoring stations (NCore). Table 1 summarizes the NAAQS and Table 2 lists the locations of the eight air monitoring stations that operated in the State in 2012, along with the parameters monitored and monitoring methods used at each of the sites. The locations of those sites are shown in Figures 1-4. All of these sites have been approved by EPA Region 1 as meeting applicable siting criteria, as specified in Subpart B of 40 CFR Part 58. All criteria pollutants are monitored, as required in the CFR, using Federal Reference Methods (FRMs) or Federal Equivalent Methods (FEMs) and monitors are operated according to the procedures specified in Quality Assurance Project Plans (QAPPs) that have been approved by EPA.1 All sites are located in the Providence-Fall River-Warwick, RI-MA Metropolitan Statistical Area (MSA), which encompasses all of Rhode Island as well as Bristol County in Massachusetts.
1 RI DEM and RI DOH, “QAPP for Criteria Pollutants Including Particulates and NCore Parameters, Revision 10.0,” approved by EPA December 5, 2012 and “QAPP: Air Toxics and PAMS Monitoring Programs, Revision 4.1,” approved by EPA December 5, 2012.

2
Table 1 National Ambient Air Quality Standards (NAAQS)
POLLUTANT AVERAGING TIME PRIMARY STANDARD
SECONDARY STANDARD
3-HourA None 0.5 ppm (1300 μg/m³) Sulfur Dioxide (SO2)
1-HourB 0.075 ppm (75 ppb) None
8-HourA 9 ppm None Carbon Monoxide (CO)
1-HourA 35 ppm None
Ozone (O3) 8-HourC 0.075 ppm (75 ppb) Same as Primary Standard
Annual Arithmetic Mean 0.053 ppm (53 ppb) Same as Primary Standard Nitrogen Dioxide (NO2)
1-HourD 100 ppb None
Particulate Matter < 10 micrometers
(PM10) 24-HourE 150 μg/m³ Same as Primary Standard
Annual Arithmetic MeanF 12.0 μg/m³ 15.0 μg/m³ Particulate Matter < 2.5 micrometers
(PM2.5) 24-HourG 35 μg/m³ Same as Primary Standard
Lead (Pb) Rolling 3-Month AverageH 0.15 μg/m³ Same as Primary Standard
Primary standards protect against adverse health effects. Secondary standards protect against welfare effects such as damage to crops, vegetation, and buildings. ANot be exceeded more than once a year. B A rule revoking the annual and 24-hour SO2 NAAQS and promulgating a new 1-hour SO2 NAAQS was signed on June 2, 2010. To attain the 1-hour NAAQS, the 3-year average of the 99th percentile of the daily maximum 1-hour average SO2 level at each monitor must not exceed 75 ppb. C The ozone NAAQS is violated when the average of the 4th highest daily eight-hour concentration measured in 3 consecutive years exceeds 0.075 ppm (75 ppb). The 0.075 ppm NAAQS became effective in May 2008. D To attain the 1-hour NO2 NAAQS, effective January 22, 2010, the 3-year average of the 98th percentile of the daily maximum 1-hour average NO2 concentration at each monitor must not exceed 100 ppb. E To attain the PM10 standard, the 24-hour concentration at each site must not exceed 150 μg/m³ more than once per year, on average over 3 years. F The primary annual average PM2.5 NAAQS was revised on December 10, 2012. The secondary NAAQS was not changed. To attain the PM2.5 annual standard, the 3-year average of the weighted annual means of the 24-hour concentrations must not exceed the NAAQS value.

3
G To attain the PM2.5 24-hour standard, the 3-year average of the 98th percentile of 24-hour concentrations at each population-based monitor must not exceed 35 µg/m3. HOn October 15, 2008, the Pb NAAQS was changed to 0.15 µg/m3 as a rolling 3-month average, not to be exceeded in a 3-year period. μg/m³ = micrograms per cubic meter mg/m³ = milligrams per cubic meter ppb = parts per billion ppm = parts per million

4
Table 2: Monitoring SitesSite AQS ID Latitude
LongitudeParameter Measured
Method Of Sampling
EPA MethodDesignation
PM2.5 Lo Vol Reference PM10 Hi Vol Reference
Vernon Trailer Vernon Street Pawtucket
440070026 41.874675-71.379953
VOC Canisters, GC/FID/MS Reference Johnson & Wales 111 Dorrance Street Providence
440070027 41.822686-71.411089
PM10
Hi Vol
Reference
Hallmark Building 695 Eddy Street Providence
440070028 41.80933 -71.40743
PM2.5 Discontinued
at end of 2012
Lo Vol Reference
Oxides of Nitrogen Nitrogen Dioxide
Chemiluminescence (low range)
Reference
Brown University 10 Prospect Street Providence
440070012 41.825556-71.405278
Sulfur dioxide Pulsed Fluorescence (low range)
Equivalent
Ozone U.V. Photometric Reference PM2.5 Beta Attenuation/Cont Equivalent
Wind Speed Anemometer N/A Wind Direction Wind Vane N/A
USEPA Laboratory 27 Tarzwell Drive Narragansett
440090007 41.4950779-71.4236587
Temperature Spot Reading N/A Oxides of Nitrogen Nitrogen Dioxide
Chemiluminescence (low range)
Reference
NO/NOy Chemiluminescence (low range)
Reference
Carbon Monoxide
Gas Filter Correlation (low range)
Equivalent
Sulfur dioxide Pulsed Fluorescence (low range)
Equivalent
Ozone U.V. Photometric Reference PM2.5 Lo Vol Reference PM2.5 Beta Attenuation/Cont Equivalent
Speciated PM2.5 Speciation Monitor N/A Coarse PM (PM10-2.5) Lo Vols (PM10 & PM2.5) Reference
Black Carbon Aethalometer N/A Lead Lo Vol PM10, XRF Equivalent VOC Canisters, GC/FID/MS Reference
Carbonyls HPLC Cartridges Reference Wind Speed Anemometer N/A
Wind Direction Wind Vane N/A Barometric Pressure Barometer N/A
Temperature Spot Reading N/A Relative Humidity Plastic Film N/A Solar Radiation Pyranometric N/A
Francis School 64 Bourne Avenue E. Providence
440071010 41.840920-71.36094
UV Radiation UV Photometric N/A

5
Site AQS ID Latitude Longitude
Parameter Measured
Method Of Sampling
EPA MethodDesignation
Precipitation Bucket/Continuous N/A PM2.5 Lo Vol Reference PM2.5 Beta Attenuation/Cont Equivalent PM10 Lo Vol N/A
PM10/Metals Hi Vol Reference Chromium VI TSP/Ion chromatograph N/A
VOC Canisters, GC/FID/MS Reference Carbonyls HPLC Cartridges Reference
Black Carbon Aethalometer N/A Semi-volatiles PUF/XAD, GC/MS N/A Wind Speed Anemometer N/A
Wind Direction Wind Vane N/A Temperature Spot Reading N/A
Urban League 212 Prairie Avenue Providence
440070022 41.807949-71.415103
Relative Humidity Plastic Film N/A Ozone U.V. Photometric Reference
Nitrogen Dioxide Chemiluminescence Reference Oxides Of Nitrogen Chemiluminescence Reference
VOC Canisters, GC/FID/MS Reference PM10 Hi Vol Reference PM2.5 Lo Vol Reference PM2.5 Beta Attenuation/Cont Equivalent
Wind Speed Anemometer N/A Wind Direction Wind Vane N/A
Barometric Pressure Barometer N/A Temperature Spot Reading N/A
Relative Humidity Plastic Film N/A
Alton Jones Campus Victory Highway West Greenwich
440030002 41.615600-71.719900
Solar Radiation Pyranometric N/A Network Evaluation Following is a discussion, by pollutant, of: • the current monitoring network, • the NAAQS and a comparison of recent measurements with the NAAQS, • whether that network meets EPA’s monitoring criteria, • whether new sites are needed, • whether any existing sites are no longer needed, and • plans for modification of the network in the next 18 months.

6
Ozone (O3) The sites in the current ozone monitoring network are listed in Table 3: Table 3 Rhode Island Ozone Monitoring Sites SITE MEASUREMENT SCALE MONITORING OBJECTIVE Alton Jones Campus Victory Highway West Greenwich
Regional (PAMS Type I)
Upwind background Population exposure
USEPA Laboratory 27 Tarzwell Drive Narragansett
Regional Population exposure
Francis School 64 Bourne Avenue E. Providence
Neighborhood (PAMS Type II)
Maximum precursor emissions impact Population exposure
The NAAQS for ozone is 75 ppb. A site is in violation of that NAAQS when the average of the 4th highest daily eight-hour ozone concentration measured in 3 consecutive years (the design value) at that site exceeds 75 ppb. Ozone design values for all of the Rhode Island sites have decreased over time, but increased in 2012, as shown in Table 4 and graphically in Figure 5. Based on the 2009-2011 design values, EPA designated Rhode Island as an unclassifiable/attainment area for the 75 ppb NAAQS on April 30, 2012. Note, however, that the 2009-2011 design values were affected by the low ozone levels recorded in 2009 due to unusually cool temperatures during the summer of that year. In the most recent three year period, 2010-2012, the design value for the Narragansett site was above the 75 ppb NAAQS, while the design values for the other two sites did not exceed that standard.
Table 4 Ozone Design Values (ppb) W. Greenwich Narragansett E. Providence 2000 - 2002 97 93 91 2001 - 2003 95 95 93 2002 - 2004 87 90 84 2003 - 2005 84 89 82 2004 - 2006 83 85 81 2005 - 2007 86 84 84 2006 - 2008 80 81 82 2007 -2009 77 77 77 2008 - 2010 71 76 72 2009 –2011 73 73 71 2010 - 2012 74 78 75

7
EPA’s rules require Rhode Island to operate at least two ozone monitors, so the State has one more monitor than the minimum number required. RI DEM believes that it is important to continue to operate all of the current monitors for the following reasons:
• Ground-level ozone levels have generally decreased in the past several years; however, there continue to be several days each summer when ozone concentrations at one or more of the Rhode Island stations reach unhealthy levels. Note that 8-hour average ozone levels were above 75 ppb at one or more of the Rhode Island monitoring sites on 11 days in 2012. EPA’s Clean Air Scientific Advisory Committee has advocated strengthening the ozone NAAQS to a level in the range of 60 – 70 ppb to protect public health. In 2012, there were 17 days with levels above 70 ppb and 33 days with levels above 60 ppb.
• The three sites represent three distinct geographical areas that are affected by different
weather patterns and therefore experience very different ozone levels on some days.
• The availability of real-time ozone data from the three ozone sites enables RI DEM to issue area-specific health advisories as appropriate and to provide residents with real-time information about ozone concentrations and associated health risks in their neighborhoods.
On July 16, 2009, the EPA proposed revisions to its ambient ozone monitoring network design requirements.2 Those requirements, as proposed, would require additional ozone monitors in rural areas that are not part of MSAs. It is not clear how this requirement would apply to Rhode Island, since all portions of the State, including areas that are commonly considered rural, are part of the Providence-Fall River-Warwick, RI-MA MSA. When that rule is finalized, RI DEM will evaluate the amended requirements and determine what actions are required. The July 2009 Federal Register Notice also proposed an increase in the length of the ozone season in several states, including Massachusetts and Connecticut. EPA did not propose a change in Rhode Island’s ozone monitoring season, April – September, but may do so in the final rule. Although the proposed rule did not change Rhode Island’s ozone season, RI DEM has extended the period of operation of its ozone monitors to be consistent with monitoring in neighboring states. Beginning in 2011, the ozone monitors at the Narragansett and East Greenwich sites have been operated from March through October. Note also that, beginning in 2011, ozone is being measured year round at the East Providence site, consistent with NCore requirements.
2 EPA, “Ambient Ozone Monitoring Regulations: Revisions to Network Design Requirements,” Proposed Rule, Federal Register 74 (135):34525, July 16, 2009. http://www.gpo.gov/fdsys/pkg/FR-2009-07-16/pdf/E9-16802.pdf

8
Carbon Monoxide (CO) The current CO monitoring network is as shown in Table 5:
Table 5 Carbon Monoxide Monitoring Network SITE MEASUREMENT SCALE MONITORING OBJECTIVE Francis School 64 Bourne Avenue E. Providence
Neighborhood Maximum precursor emissions impact Population exposure
The NAAQS for CO are:
• 35 ppm as a 1 hour average, not to be exceeded more than once per year (design value is the highest annual 2nd maximum 1-hour concentration) and
• 9 ppm as an 8 hour average, not to be exceeded more than once per year (design value is the highest annual 2nd maximum non-overlapping 8-hour concentration)
The highest CO design values recorded at the East Providence site in the last five years are:
• 2.8 ppm – 1 hour average, 8% of NAAQS, • 1.8 ppm – 8-hour average, 20 % of NAAQS
The 2012 CO design values for Rhode Island are:
• 1.5 ppm – 1 hour average, 4% of NAAQS • 1.0 ppm – 8 hour average, 11% of NAAQS
The CO NAAQS has not been exceeded in Rhode Island since 1984. Since 2001, all CO levels recorded in Rhode Island have been in the “Good” air quality classification according to the EPA’s Air Quality Index (AQI). As shown in Figure 6, there has been a general downward trend in ambient CO levels in Rhode Island in the past ten years. EPA has no minimum requirements for the number of CO monitors that must be operated in a state, except that CO monitoring is required at Type 2 PAMS sites (40 CFR 58, Appendix D, Table D-6) and at NCore sites (40 CFR 58, Appendix D 3(b)). Since the East Providence site is a Type 2 PAMS site and the State’s NCore site, carbon monoxide monitoring will continue at that site using a low range monitor, consistent with NCore requirements.

9
On August 21, 2011, EPA issued a decision retaining the CO NAAQS at the current levels.3 The decision requires the operation of CO monitors at sites established to comply with near-road monitoring requirements in the 2010 NO2 NAAQS for all urban areas which, like the Providence-New Bedford-Fall River, RI-MA MSA, have a population of 1,000,000 or more. Near-road CO monitoring is not required until January 1, 2017; however, Rhode Island plans to purchase a low-range CO monitor with the funds that EPA has provided to the State for setting up its near-road site and will begin measuring CO at that location in January 2014, when the site is operational. Plans for establishing the near-road site are discussed below in the NO2 section of this document. RI DEM does not plan any other changes in the State’s carbon monoxide monitoring network in the next 18 months. Sulfur Dioxide (SO2) The current SO2 monitoring network is as shown in Table 6:
Table 6 Sulfur Dioxide Monitoring Network SITE MEASUREMENT SCALE MONITORING OBJECTIVE Brown University 10 Prospect Street Providence
Neighborhood Population exposure
Francis School 64 Bourne Avenue E. Providence
Neighborhood NCore
The NAAQS for SO2
4 are:
• 75 ppb, 1-hour average (primary standard effective June 2, 2010). The design value is the average of the 99th percentile maximum daily hour measured in 3 consecutive years
• 0.5 ppm (500 ppb) - 3 hour average (secondary standard), not to be exceeded more than
once per year
The highest SO2 design values recorded in the last five years in Rhode Island are:
3 US EPA, “Review of National Ambient Air Quality Standards of Carbon Monoxide: Final Rule,” Federal Register 76 (169):54294, August 31, 2011. http://www.gpo.gov/fdsys/pkg/FR-2011-08-31/pdf/2011-21359.pdf4 An EPA rule amending the SO2 NAAQS was signed on June 2, 2010. The rule revokes the previous annual and 24-hour NAAQS and sets a new one-hour average NAAQS at 0.075 ppm (75 ppb). Revisions of monitoring networks consistent with the requirements in the rule must be in place by January 1, 2013.

10
• 38 ppb - 1 hour average, 51% of primary NAAQS • 27 ppb - 3-hour average, 5% of secondary NAAQS
The 2012 SO2 design values are:
• 20 ppb – 1 hour average, 27% of NAAQS • 14 ppb- 3 hour average, 34% of NAAQS
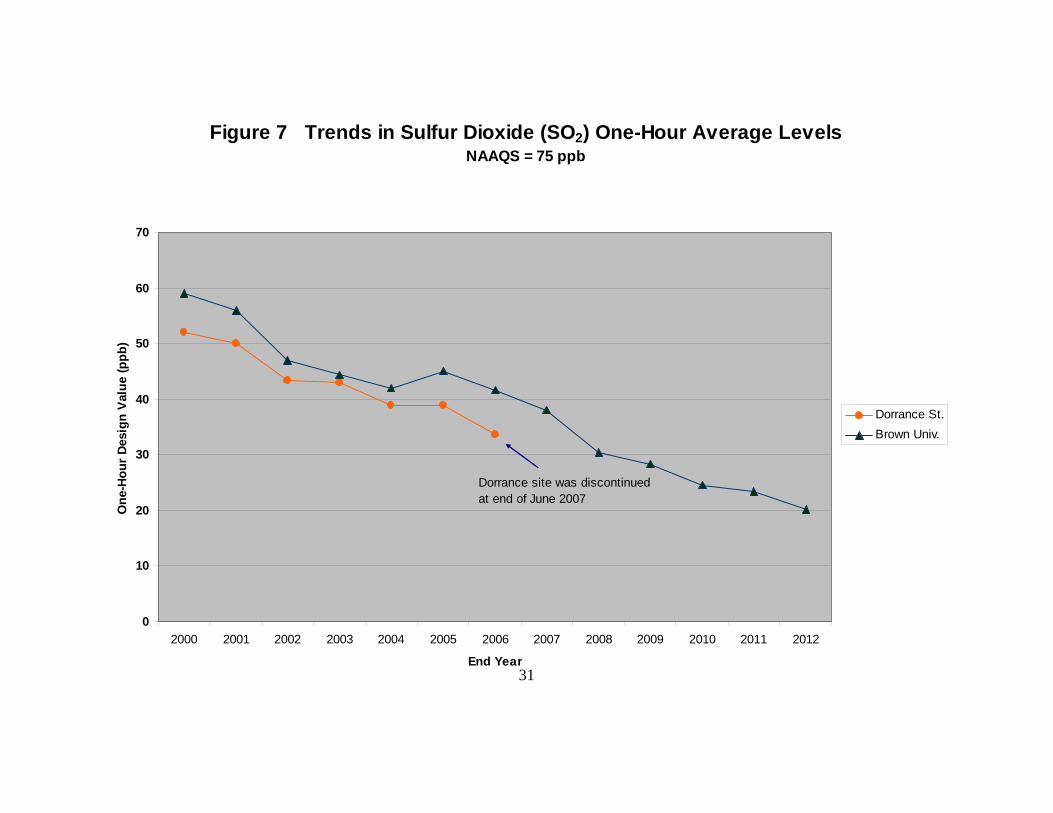
The SO2 NAAQS has never been exceeded in the State. One-hour design values have been below 75 ppb, the one-hour NAAQS promulgated in 2010, since 1994. All measurements have been in the “Good” range of the AQI since 2007. As shown in Figure 7, one-hour average SO2 design levels in Rhode Island have declined over the past decade. EPA’s 2006 amended monitoring regulation requires SO2 monitoring only at NCore sites. However, the 2010 SO2 NAAQS rule requires at least one SO2 monitor in the Providence-New Bedford-Fall River RI, MA MSA, which includes all of Rhode Island and Bristol County, Massachusetts. That SO2 monitor must be sited to meet one or more of the following objectives: (1) characterizing concentrations around emissions sources, (2) measuring the highest concentrations in an area, (3) determining population exposure, (4) establishing general background levels and (5) evaluating regional transport. Rhode Island operates a SO2 monitor at Brown University in Providence and, to meet NCore requirements, began operating a low-range SO2 monitoring at the East Providence site in January 2011.The Brown University SO2 monitor was updated to a low-range unit in January 2013. RI DEM believes that the Brown University and East Providence monitors appropriately characterize population exposure in the major urban areas in Rhode Island. The State of Massachusetts also operates a SO2 monitor in the Providence-New Bedford-Fall River RI-MA MSA. Since that monitor is located in Fall River, MA, approximately two miles southeast of Dominion Energy- Brayton Point, a coal-fired power plant, the SO2 levels recorded at that site tend to be substantially higher than those at the Rhode Island sites. The 2012 one-hour design value for SO2 at the Fall River monitor was 71.5 ppb, 95% of the NAAQS and 3 ½ times the Providence design value. According to EPA’s Emissions Inventory System (EIS), in 2008 the Brayton Point facility emitted 30,085 tons of SO2, more than 100 times more than the highest emitting Rhode Island source, Central Landfill (268 tons). Therefore, the Fall River monitor is more appropriate than a Rhode Island location for characterizing maximum concentrations in the MSA. Note that, since the Brayton Point facility is less than two miles east of the border with Bristol County, Rhode Island, maximum SO2 levels in that Rhode Island county may be better represented by levels measured at the Fall River site than by those at the Rhode Island sites. The 2010 SO2 NAAQS rule requires states to conduct dispersion modeling of large SO2 emitting sources and stipulates that the EPA will use the modeling results, in addition to monitoring data,

11
to determine whether areas are in attainment of that standard. However, in response to comments received subsequent to the promulgation of the 2010 NAAQS, EPA is reviewing the monitoring and modeling requirements in that rule to reevaluate the implementation approach for the one-hour NAAQS. When those requirements are finalized, RI DEM will determine whether the current sites meet the monitoring specifications and whether continued operation of the Providence site is necessary. Nitrogen Dioxide (NO2) The current NO2 monitoring network is shown in Table 7:
Table 7 Nitrogen Dioxide Monitoring Network SITE MEASUREMENT
SCALE MONITORING
OBJECTIVE SCHEDULE
Brown University 10 Prospect Street Providence
Neighborhood Population exposure Continuous Year round
Francis School 64 Bourne Avenue E. Providence
Neighborhood (PAMS)
Population exposure Continuous Ozone season (Continuous
3/1/12 – 10/1/14) Alton Jones Campus Victory Highway West Greenwich
Regional (PAMS) Population exposure Upwind background
Continuous Ozone season
In January 2013, NO2 monitors at all sites were replaced with low-range units. The NO2 NAAQS are:
• 100 ppb - 1 hour average (effective January 22, 2010). The design value is the average of the 98th percentile maximum daily hour measured in 3 consecutive years.
• 0.053 ppm (53 ppb) - annual average
The highest NO2 design values recorded in the last five years are:
• 48 ppb - 1 hour average, 48% of NAAQS • 12 ppb - annual average, 23% of NAAQS
Design values for 2012 are:
12
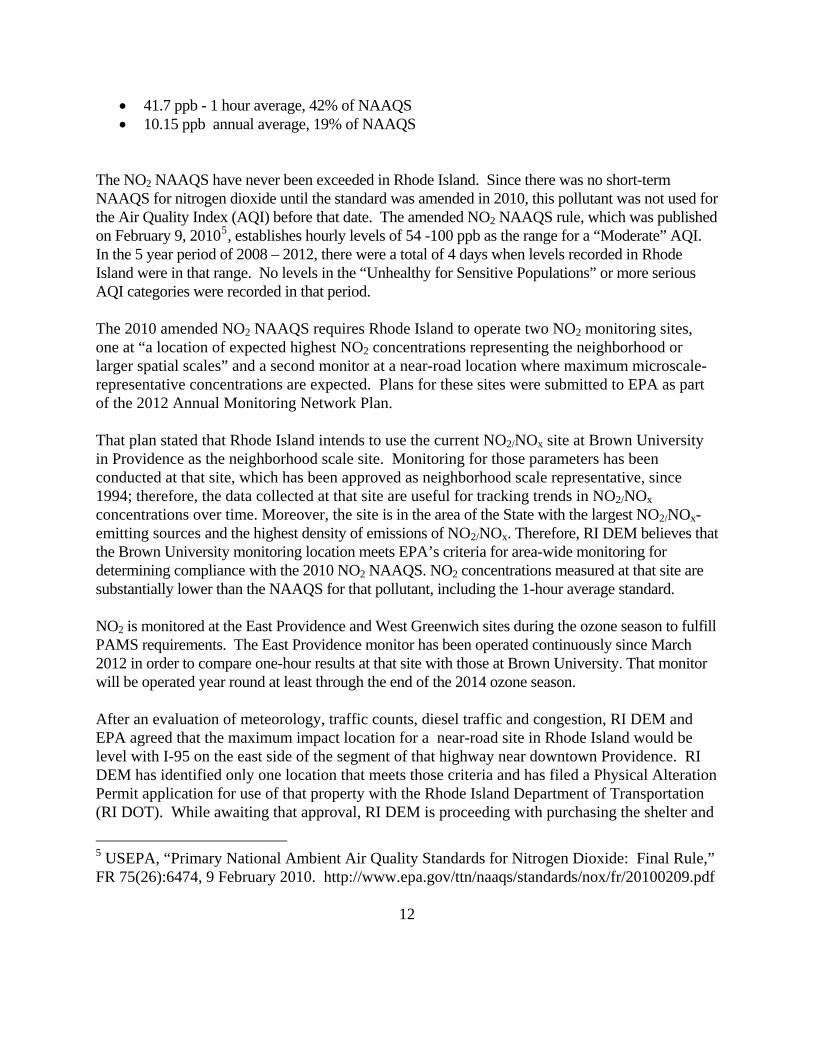
• 41.7 ppb - 1 hour average, 42% of NAAQS • 10.15 ppb annual average, 19% of NAAQS
The NO2 NAAQS have never been exceeded in Rhode Island. Since there was no short-term NAAQS for nitrogen dioxide until the standard was amended in 2010, this pollutant was not used for the Air Quality Index (AQI) before that date. The amended NO2 NAAQS rule, which was published on February 9, 20105, establishes hourly levels of 54 -100 ppb as the range for a “Moderate” AQI. In the 5 year period of 2008 – 2012, there were a total of 4 days when levels recorded in Rhode Island were in that range. No levels in the “Unhealthy for Sensitive Populations” or more serious AQI categories were recorded in that period. The 2010 amended NO2 NAAQS requires Rhode Island to operate two NO2 monitoring sites, one at “a location of expected highest NO2 concentrations representing the neighborhood or larger spatial scales” and a second monitor at a near-road location where maximum microscale- representative concentrations are expected. Plans for these sites were submitted to EPA as part of the 2012 Annual Monitoring Network Plan. That plan stated that Rhode Island intends to use the current NO2/NOx site at Brown University in Providence as the neighborhood scale site. Monitoring for those parameters has been conducted at that site, which has been approved as neighborhood scale representative, since 1994; therefore, the data collected at that site are useful for tracking trends in NO2/NOx concentrations over time. Moreover, the site is in the area of the State with the largest NO2/NOx- emitting sources and the highest density of emissions of NO2/NOx. Therefore, RI DEM believes that the Brown University monitoring location meets EPA’s criteria for area-wide monitoring for determining compliance with the 2010 NO2 NAAQS. NO2 concentrations measured at that site are substantially lower than the NAAQS for that pollutant, including the 1-hour average standard. NO2 is monitored at the East Providence and West Greenwich sites during the ozone season to fulfill PAMS requirements. The East Providence monitor has been operated continuously since March 2012 in order to compare one-hour results at that site with those at Brown University. That monitor will be operated year round at least through the end of the 2014 ozone season. After an evaluation of meteorology, traffic counts, diesel traffic and congestion, RI DEM and EPA agreed that the maximum impact location for a near-road site in Rhode Island would be level with I-95 on the east side of the segment of that highway near downtown Providence. RI DEM has identified only one location that meets those criteria and has filed a Physical Alteration Permit application for use of that property with the Rhode Island Department of Transportation (RI DOT). While awaiting that approval, RI DEM is proceeding with purchasing the shelter and
5 USEPA, “Primary National Ambient Air Quality Standards for Nitrogen Dioxide: Final Rule,” FR 75(26):6474, 9 February 2010. http://www.epa.gov/ttn/naaqs/standards/nox/fr/20100209.pdf

13
monitoring equipment for that site and preparing building permit applications with the expectation that the site will be operable by January 2014, as required. In addition to NO2/NOx, CO and PM2.5 will be monitored at that site. Although the identified location optimally meets EPA’s criteria, that site is problematic because of its proximity to impending highway construction. RI DOT is beginning a large scale highway reconstruction/bridge repair project on the southbound section of the highway, just southwest of the intended site, in June 2013. Therefore, emissions from construction equipment and activities may have a measureable impact on monitored levels at the near-road site. In addition, construction is due to shift to the northbound lanes in two or three years, necessitating a move of the monitoring trailer. Despite these issues, EPA Region 1 has indicated a strong preference for siting the trailer initially at this location, since traffic counts at alternative locations are considerably lower than at the proposed site. Particulate Matter Particles smaller than 10 microns (PM10) The current PM10 monitoring network is as shown in Table 8 and Figure 2:
Table 8 PM10 Monitoring Network SITE MEASUREMENT
SCALE MONITORING
OBJECTIVE SCHEDULE
Vernon Trailer Vernon Street Pawtucket
Middle Population exposure 24-hour 1 in 6 day
Johnson & Wales 111 Dorrance Street Providence
Neighborhood Population exposure 24-hour 1 in 6 day
Urban League 212 Prairie Avenue Providence
Neighborhood (NATTS)
Population exposure Highest concentration
24-hour 1 in 6 day
Alton Jones Campus Victory Highway West Greenwich
Regional Upwind background 24-hour 1 in 6 day
Francis School 64 Bourne Avenue E. Providence
Neighborhood (NCore)
Population exposure (Lead and PM10-2.5)
24-hour 1 in 6 day

14
The PM10 NAAQS is:
• 150 µg/m3 – 24-hour average, not to be exceeded more than once per year on average over 3 years (design value is 4th high value in a 3-year period)
The highest PM10 value recorded in Rhode Island in the last five years is:
• 62 µg/m3 – 24-hour average, 41% of NAAQS, recorded at Vernon St. in 2009
The highest 4th high PM10 value recorded at a Rhode Island site for the 2010 – 2012 period is:
• 37 µg/m3 – 24-hour average, 25% of NAAQS, recorded at Vernon St. (note, however, that 2012 data are incomplete for that site due to road construction)
The PM10 NAAQS has never been exceeded in Rhode Island and, since PM10 is measured using a filter-based method, results are not immediately available and cannot be used for Air Quality Index calculations. Trends in PM10 design values are shown in Figure 8. Levels tend to be highest at the Vernon Street site, which is adjacent to I-95, and higher at the two Providence sites than at the rural West Greenwich site. There is no clear temporal trend in the PM10 levels observed over the past decade. Since late 2011, PM10 has also been measured at the East Providence NCore site every sixth day using a lo-vol sampler. Those PM10 measurements are used, in conjunction with PM2.5 measurements at that site, for calculating PM10-2.5 levels. The lo-vol PM10 filters are also used for lead measurements. EPA’s monitoring regulations require areas like the Rhode Island MSA, which has a population greater than 1,000,000 and measured PM10 concentrations below 80% of the NAAQS, to operate a minimum of 2-4 PM10 monitoring sites. Since Rhode Island is currently operating five sites and is not measuring levels close to the NAAQS at any of the sites, one or more sites could be discontinued without violating the minimum criteria. Note that the Vernon Street site was not operated for much of the first two quarters of calendar year 2012, due to heavy construction in the immediate area of that site. Monitoring at that site resumed in July 2012. As discussed above, PM10 measurements at the East Providence site are used for calculating PM10-2.5 levels and, since this measurement is required at NCore sites, PM10 sampling cannot be discontinued at that site. Similarly, PM10 samples collected at the Urban League site in Providence are analyzed for metals to fulfill NATTS requirements, so PM10 sampling at that location cannot be discontinued. The rural Alton Jones, West Greenwich site provides useful information about background concentrations of PM10 in Rhode Island. The Vernon St., Pawtucket site, which is adjacent to I-95, tends to record the highest PM10 concentrations in the State. Therefore, the Johnson & Wales Library in downtown Providence is the only site that is being considered for possible discontinuation at this time.

15
The Johnson & Wales site is approximately one mile from the Urban League location. In the nine years that the Johnson & Wales site has been operational, the PM10 design values at that site have been, on average, 2.4 µg/m3 higher than those at the Urban League site and 9.9 µg/m3 lower than those at the Vernon Street, Pawtucket site. The PM10 levels at the Johnson & Wales site correlate well with those at the Urban League (r2 = 0.86). Since operation of the Johnson & Wales site is currently not resource-intensive, RI DEM plans to continue to operate this site for the present. If the continued operation of this site becomes problematic, RI DEM will seek EPA approval to discontinue monitoring at Johnson & Wales. Fine Particulate Matter (Particulate Matter smaller than 2.5 microns, or PM2.5) The Federal Reference Method/Federal Equivalent Method (FRM/FEM) PM2.5 monitoring network is shown in Table 9 and in Figure 3:
Table 9 PM2.5 Regulatory Monitoring Network SITE MEASUREMENT
SCALE MONITORING
OBJECTIVE SCHEDULE
Vernon Trailer Vernon Street Pawtucket
Middle Population exposure 24-hour 1 in 3 day
Hallmark Building 695 Eddy Street Providence
Urban Population exposure 24-hour 1 in 3 day
(Discontinued at end of 2012)
Urban League 212 Prairie Avenue Providence
Neighborhood Population exposure Highest concentration
24-hour daily
Francis School 64 Bourne Avenue E. Providence
Urban Population exposure Highest concentration
24-hour daily
Alton Jones Campus Victory Highway West Greenwich
Regional Population exposure General/Background Regional Transport
Continuous FEM, 1 in 6 day
co-located sampler
Filter-based FRM PM2.5 units are operated as the primary samplers at the first four sites listed above and a FEM continuous PM2.5 monitor is the primary sampler at the West Greenwich site. Continuous PM2.5 FEM monitors are operated at the Urban League site and the East Providence NCore site as secondary monitors; data collected by those monitors are used as substitute data on days when valid data from the primary samplers at those locations are not available. PM2.5 is also monitored continuously at the Narragansett site; the data collected by that monitor have not been used to determine compliance with the NAAQS but, since the monitor at that site is now a FEM

16
unit, RI DEM plans to request that the Narragansett data, beginning in 2013, be used for regulatory purposes. A filter-based FRM sampler is operated every 6th day at the West Greenwich site for quality assurance purposes. Note that the Vernon Street site was not operated for much of the first two quarters of calendar year 2012, due to heavy construction in the immediate area of the monitors. Monitoring at that site resumed in July 2012. As discussed below, monitoring at the Eddy Street, Providence site was discontinued at the end of 2013. The PM2.5 NAAQS are:
• 35 µg/m3 – 24-hour average (design value is the 3-year average of the 98th percentile 24-hour concentration)
• 12 µg/m3- annual average (design value is calculated by averaging the daily concentrations from each quarter, averaging these quarterly averages to obtain an annual average, and then averaging the annual averages for three consecutive years)6
The highest PM2.5 design values recorded in Rhode Island in the last 5 years are:
• 28.7 µg/m3 – 24-hour average, 82% of NAAQS, recorded at Vernon St. • 11.4 µg/m3 – annual average, 95% of current NAAQS, recorded at Vernon St.
The highest PM2.5 design values for 2012 are:
• 24 µg/m3 – 24-hour average, 68% of NAAQS, recorded at Vernon St. • 10.0 µg/m3 – annual average, 83% of NAAQS, recorded at Vernon St. (note that the Vernon
St. monitor did not operate for several months in 2012, so these values do not meet data capture requirements)
Trends in PM2.5 24-hour and annual design values are shown in Figures 9 and 10, respectively. Annual average levels are consistently highest at the Vernon Street site, which is adjacent to I-95, and higher at the East Providence and the two Providence sites than at the rural West Greenwich site. PM2.5 levels have decreased over the past decade. Although none of the monitors violate the NAAQS (including the revised annual average NAAQS), PM2.5 levels at one or more sites in the State were at or above 35 µg/m3 and, therefore, the air quality was unhealthy, on three days in the past five years (2008 – 2012). Note also that many members of the scientific community have recommended that the 24-hour PM2.5 NAAQS be reduced to a level of 30 µg/m3or less to be protective of public health. In the 2008-2012 period there were 12 days with concentrations at or above that level at one or more Rhode Island sites.
6 In December 2012, EPA revised the PM NAAQS, reducing the annual average PM2.5 NAAQS from 15 to 12 µg/m3. The rule left the PM10 NAAQS and the 24-hour average PM2.5 NAAQS and the secondary annual average PM2.5 NAAQS unchanged.

17
EPA regulations require a minimum of two PM2.5 monitoring sites in Rhode Island. These sites must characterize the following:
• Community-wide air quality; • Background PM2.5 levels in the State; and • Regional transport of PM2.5.
Since Rhode Island operates more PM2.5 sites than required and resources are limited, RI DEM conducted an analysis of the RI PM2.5 network to determine whether any of those sites could be discontinued. The West Greenwich site cannot be discontinued because it fulfills EPA’s requirements for measurement of background and regional transport concentrations of PM2.5. The 24-hour and annual PM2.5 design values for the Vernon Street, Pawtucket site, which is immediately adjacent to Interstate Rte. 95, tend to be higher than those at the other sites, so that is a maximum impact site and cannot be removed from the network. The East Providence site also cannot be removed because PM2.5 monitoring is required at NCore sites. Therefore, only the Urban League and Eddy Street sites could be discontinued. Those sites are located approximately 0.4 miles apart from each other in the south side of Providence. The Eddy Street site was originally established as a replacement for the Allens Avenue, Providence site, a maximum impact site immediately adjacent to I-95 that was displaced by the State’s Iway highway reconstruction project in 2002. However, since the Eddy Street site is somewhat removed from and is not typically downwind of the highway, measurements at that site do not reflect near-road conditions. As discussed previously, RI DEM plans to begin operating a near-road site in the Providence area in January 2014 and will conduct PM2.5, as well as NO2 and CO, monitoring at that site when it is operational. The 2011 and 2012 Network Monitoring Plans stated that RI DEM planned to evaluate the Eddy Street PM2.5 levels after the Iway construction project was completed and the new highway pattern near that site was in place. The 2012 plan further stated, that, “(i)f it is determined at that time that the levels at that site are similar to those at the other sites, RI DEM will discuss possible discontinuation of PM2.5 monitoring at that site with the EPA.” Note that RI DEM decided to consider discontinuation of the Eddy Street site, rather than the Urban League site, because monitors measuring PM10, PM10 metals, continuous PM2.5, black carbon, volatile organic compounds, semi-volatile compounds and carbonyls are also operated at the Urban League site, while Eddy Street is a single pollutant site. A new ramp from I-195 West to the R.I. Hospital area, near the Eddy Street monitor, was opened on October 3, 2011, completing the Iway project. Therefore, data collected in the third quarter of 2011 and in 2012 reflects the new highway patterns. As shown in Figure 11, the PM2.5 concentrations at the Eddy Street site correlated very well with those at the Urban League site during that period (r2 = 0.90). Figure 12 shows quarterly average PM2.5 levels at the Urban League and Eddy Street sites in 2010 and 2012 on days with valid data at both sites. Quarterly

18
average levels on those days were higher at the Eddy Street site than the Urban League site in all but one quarter during that three year period, but those differences were less than 1 µg/m3. The differential between the levels at the two sites was slightly higher during the five quarters of data collected after the completion of the Iway construction (range of 0.3 to 0.8 µg/m3, average 0.5 µg/m3), than in the preceding five quarters (range of -0.1 to 0.6 µg/m3, average 0.3 µg/m3). Since the analysis showed that Eddy Street and Urban League PM2.5 levels measured after the completion of the Iway project correlate well; differ, on average, by less than 1µg/m3; are significantly below the applicable NAAQS; and are lower than those at the Vernon Street site, RI DEM discontinued sampling at Eddy Street at the end of December 2012 and notified the EPA of that decision in January 2013. As discussed above, PM2.5 monitoring will be conducted at the Rhode Island near-road site, which is slated to begin operation by January 2014. No other changes to the PM2.5 network are planned in the near future.
Lead (Pb)
On November 12, 2008, the EPA promulgated an amended NAAQS for lead (FR 73:66964). The new NAAQS is an order of magnitude more stringent than the previous standard. To determine whether an area is in compliance with the new standard, the rule requires two types of lead monitoring: source- specific monitoring in the vicinity of lead sources that emit 0.5 or more tons of lead per year and area-wide lead monitoring at urban NCore sites. Rhode Island has no sources emitting 0.5 tons or more of lead per year and, therefore, is not required to operate any source-specific monitors. To fulfill the requirement for area-wide monitoring, RI DEM and RI DOH began collecting lo-vol PM-10 samples to be analyzed for lead at the East Providence NCore site in May 2011. Those filters are currently being analyzed by the State of Maine using EPA-approved XRF methodology. In June 2012, EPA approved the use of a ICP/MS analytical method to measure lead collected on lo-vol filters. Rhode Island plans to switch to this method so that the analysis can be conducted at the RI DOH Air Pollution Laboratory once the laboratory has verified that it can obtain accurate results using that methodology. As specified in the lead NAAQS rule, sampling is conducted on a one-in-six day schedule. Ozone Precursor and Air Toxics Measurements Photochemical Assessment Monitoring Stations (PAMS) The Clean Air Act Amendments of 1990 (CAAA) required serious, severe and extreme ozone nonattainment areas to establish enhanced monitoring networks to measure ozone and ozone precursors. In response to that mandate, the US EPA promulgated rules in 1993 that required the establishment of a network of Photochemical Assessment Monitoring Stations (PAMS) to measure ozone, NOx, volatile organic compounds (VOCs), carbonyls, and meteorological parameters in serious and above nonattainment areas. This network was designed to provide comprehensive data

19
on trends in ambient concentrations of ozone and ozone precursors and to evaluate the spatial and diurnal variability of those pollutants in order to track the formation and transport of ozone across large areas and to evaluate the effectiveness of strategies implemented to reduce levels of that pollutant. The EPA rule identifies four types of PAMS sites: • Type 1 sites, located on the upwind side of the nonattainment area and used to characterize
background and transported concentrations of ozone, NOx and VOC; • Type 2 sites, sited to measure the maximum impact of VOC and NOx emitted in the area; • Type 3 sites, sited to measure maximum ozone concentrations occurring downwind of the area,
and • Type 4 sites, sited to measure the concentration of ozone, NOx and VOC exiting the area. Two PAMS sites, including a Type 2 site, are required in each serious and above nonattainment area. Since Rhode Island was a serious nonattainment area for the one-hour average ozone NAAQS, the ozone standard that was in effect at the time the enhanced monitoring requirements were promulgated, a PAMS network is required in the State. The Alton Jones monitoring site in West Greenwich is designated as the State’s Type 1 PAMS site and the East Providence site as a Type 2 PAMS site. In addition, the Massachusetts Department of Environmental Protection (MA DEP) operates a site at the Blue Hills Observatory in Milton, Massachusetts that serves as the Type 1 (upwind) site for the Boston area and has served as the Type 3 (downwind) site for the Providence area. Rhode Island monitors the following PAMS pollutants: • 24-hour speciated Volatile Organic Compounds (VOC) samples are collected every sixth day
year round at the Type 1 and Type 2 sites and eight 3-hour VOC samples are collected every day during June, July and August at the Type 2 site. Eight 3-hour samples were collected every third day during June, July and August until 2011 at the Type 3 station in Milton, MA, but MA DEP stopped collecting 3-hour VOC samples in 2012, due to staffing limitations.
• 24-hour carbonyl samples are collected year round and eight 3-hour carbonyl samples per
day were collected every third day during June, July and August through 2011 at the Type 2 site. 3-hour carbonyl samples are required only in nonattainment areas classified as serious or above for the 8-hour ozone standard. Since Rhode Island has never had a nonattainment classification higher than “moderate” for that NAAQS, this requirement does not apply to the State. Rhode Island collected the 3-hour samples through the 2011 PAMS season but is no longer collecting those samples.

20
• NOx has historically been measured continuously at the Type 1 and Type 2 sites during June,
July and August. After determining that the EPA rule requires NOx monitoring at the Type 2 site for the entire ozone season, Rhode Island continued NOx monitoring at the East Providence site through the end of the ozone season (September 30th) in 2011. That monitor was operated from March through the end of December in 2012 and will be operated year-round at least until the end of 2014 to enable a comparison of NO2 levels measured at that site with those measured at the Brown University, Providence site. In January 2013, the NOx monitors at the Rhode Island sites were replaced with low-range monitors. NOx is also measured by MA DEP at the Milton, MA site, the Type 3 site for Rhode Island, during the ozone season.
• Rhode Island began measuring reactive nitrogen oxides (NOy) at the Type 2 site in January
2011 to fulfill NCore requirements. EPA regulations require NOy measurements at one Type 3 or Type 1 PAMS site during the ozone season. Rhode Island currently monitors NOx, but not NOy, at its Type 1 site. Similarly, NOx, rather than NOy, is monitored at the Type 3 site in Milton, MA, although MA DEP has measured NOy at that site in the past. Rhode Island does not have any immediate plans to install NOy equipment at the Type 1 site.
• CO is measured year round at the Type 2 site. In 2010, the conventional CO monitor at that
site was replaced with a low-range (ppb) CO monitor, in fulfillment of both NCore and PAMS network requirements.
• Ozone is measured during the ozone season at all three sites. Beginning in 2011, ozone is being measured year-round at the Type 2 site to fulfill NCore requirements.
• Surface meteorological parameters are measured at all three sites year-round.
• Rhode Island uses the upper air data collected at the Brookhaven, New York meteorological site to fulfill the PAMS requirements for those measurements
Note that the EPA is currently reviewing the PAMS program to determine whether changes in site locations, pollutants monitored, or monitoring methods are necessary to obtain the most appropriate and cost-effective data for assessing ozone formation and transport of ozone and precursors. If the EPA decides to link PAMS requirements to a state’s attainment status for the current ozone NAAQS, rather than the former one-hour NAAQS, PAMS sites may no longer be required in the State.

21
Air Toxics Rhode Island operates one site that is part of the National Air Toxics Trends Stations (NATTS) network. The primary purposes of the NATTS network are to track trends in ambient air toxics levels, to characterize exposures, and to measure progress toward emission and risk reduction goals. The Rhode Island NATTS site is located on the roof of the Urban League building in an urban residential area in the south side of Providence, approximately ½ mile west of I-95. The Urban League building houses a variety of community services, including a health clinic and day care center. This site was chosen as the State’s NATTS site because it is not dominated by local sources and because levels of air toxics at this site appear to be representative of those in urban areas in the State In keeping with EPA requirements, the following pollutants, at a minimum, are measured at the Rhode Island NATTS site: Volatile Organic Compounds (VOC)
Acrolein Perchloroethylene (tetrachloroethylene) Benzene Carbon tetrachloride Chloroform Trichloroethylene 1,3-butadiene 1,2-dichloropropane Dichloromethane Vinyl Chloride
Carbonyls Formaldehyde Acetaldehyde
Metals Nickel compounds (PM10) Arsenic compounds (PM10) Cadmium compounds (PM10) Manganese compounds (PM10) Beryllium (PM10) Lead (PM10) Hexavalent chromium (TSP) – Will be discontinued as of the end of June 2013 in
accordance with changing EPA priorities.

22
Semi-Volatile Organic Compounds (SVOC) Benzo(a)pyrene Napthalene
VOC, carbonyls and PM10 metal samples are analyzed by RI DOH. Hexavalent chromium and SVOC samples are analyzed by an EPA contractor. Note that, due to the redirection of EPA resources, hexavalent chromium monitoring in Rhode Island will cease at the end of June 2013. Sampling at the NATTS site is conducted for all of the above parameters for 24-hour periods every sixth day. 24-hour VOC samples are also collected every sixth day at the PAMS sites in West Greenwich and East Providence and at the Vernon Street, Pawtucket site, which is adjacent to I-95 in Pawtucket. 24-hour carbonyl samples are collected at the East Providence site on the same schedule. In addition, RI DEM /RI DOH operates aethalometers, which measure black carbon, an indicator of diesel exhaust, at the Urban League NATTS site and the East Providence Type 2 PAMS/NCore site. Except for the discontinuation of hexavalent chromium monitoring, RI DEM is not planning any changes to the ozone precursor or air toxics monitoring sites in the next 18 months, unless EPA promulgates changes to the PAMS program that are effective during that period.

23
National Core (NCore) Multi-pollutant Monitoring Stations Network As required in an October 17, 2006 Federal Register notice (FR 71:61236), Rhode Island began operating a site that is part of the network of core multipollutant monitoring (NCore) stations in January 2011. This network is designed to address the following monitoring objectives:
• timely reporting of data to the public through AIRNow, air quality forecasting, and other public reporting mechanisms
• supporting development of emission strategies through air quality model evaluation and other observational methods
• accessing accountability of emission strategy progress through tracking long-term trends of criteria and non-criteria pollutants and their precursors
• supporting long-term health assessments that contribute to ongoing reviews of the NAAQS
• establishing nonattainment/attainment areas by comparison with the NAAQS
• supporting multiple disciplines of scientific research, including; public health, atmospheric and ecological.
The Rhode Island Type 2 PAMS site in East Providence is operating as the State’s NCore site. Ozone, low-range NO2/NOx, reactive oxides of nitrogen (NOy), low-range CO, low range SO2, PM2.5 (FRM, continuous and speciated), coarse PM (PM10-2.5), VOCs, carbonyls, black carbon, lead in lo-vol PM10, and meteorological parameters are monitored at that site. PM10-2.5 is measured as the difference between lo-vol PM10 and lo-vol PM2.5 concentrations. Note that the conventional NO2/NOx monitor at this site was replaced by a low-range NO2/NOx monitor in January 2013 and is being operated year-round, at least until the end of 2014. Rhode Island has no plans to change NCore monitoring in the next 18 months. Summary of Proposed Changes in the Rhode Island Monitoring Network In summary, RI DEM plans to modify the current monitoring network as follows:
• If operation of the PM10 monitoring at Johnson & Wales in Providence becomes problematic, RI DEM may ask EPA for authorization to discontinue monitoring at that site.
• A near-road monitoring site measuring, at a minimum, CO, NO2, and PM2.5, will be
established and will begin operation in January 2014.

24
• Monitoring for hexavalent chromium will be discontinued at the end of June 2013.
• After the RI DOH Laboratory verifies that it can accurately measure lead concentrations in lo-vol PM10 samples, Rhode Island plans to begin to analyze its lead samples in-house using EPA’s newly approved ICP/MS methodology.
• As discussed above, the Eddy Street PM2.5 monitoring site was discontinued at the end of
December 2012 and the EPA was notified of that action with appropriate supporting documentation on January 28, 2013. In light of possible future state and federal budget restrictions, RI DEM will consider further savings opportunities and will discuss such measures with the EPA prior to implementation.
RI DEM understands that all network modifications that involve discontinuation or moving of any sites are subject to EPA approval, even if the remaining network meets EPA’s minimum requirements.
25

26

27

28

Figure 5 Trends in Rhode Island Ozone Concentrations
NAAQS = 75 ppb (8-hour average)
60
65
70
75
80
85
90
95
100
2001 2002 2003 2004 2005 2006 2007 2008 2009 2010 2011 2012
End Year
8-H
our A
vera
ge D
esig
n Va
lue
(ppb
)
W. GreenwichE. ProvidenceNarragansett
NAAQS

30
Figure 6 Trends in Carbon Monoxide Levels (8-Hour Average) NAAQS = 9 ppm
0
0.5
1
1.5
2
2.5
3
3.5
4
2000 2001 2002 2003 2004 2005 2006 2007 2008 2009 2010 2011 2012
8-H
our
Des
ign
Valu
e (p
pm)
Dorrance St., ProvidenceE. Providence
Dorrance St. site was discontinued at the end of June 2007
31
Figure 7 Trends in Sulfur Dioxide (SO2) One-Hour Average Levels NAAQS = 75 ppb
0
10
20
30
40
50
60
70
2000 2001 2002 2003 2004 2005 2006 2007 2008 2009 2010 2011 2012
End Year
One
-Hou
r De
sign
Val
ue (p
pb)
Dorrance St.Brown Univ.
Dorrance site was discontinued at end of June 2007

Figure 8 Trends in 24-Hour Average PM-10 Levels NAAQS = 150 ug/m3
0
10
20
30
40
50
60
70
2001 2002 2003 2004 2005 2006 2007 2008 2009 2010 2011 2012
End Year
24-H
our D
esig
n Va
lue
Con
cent
ratio
n (u
g/m
3)
Vernon StJohnson & WalesUrban LeagueW. Greenwich
Note: Vernon St. monitor did not operate Jan.- June 2012 due to road construction

33
Figure 9 Trends in 24-Hour Average PM-2.5 Levels NAAQS = 35 ug/m3
15
20
25
30
35
40
2002 2003 2004 2005 2006 2007 2008 2009 2010 2011 2012
End Year
24-H
our A
vera
ge D
esig
n V
alue
Con
cent
ratio
n (u
g/m
3 )
Vernon St.Eddy St.Urban LeagueE. ProvidenceW. Greenwich
2012 Vernon St data incomplete
NAAQS

34
Figure 10 Trends in Annual Average PM-2.5 Concentrations Current NAAQS = 12 ug/m3
6
7
8
9
10
11
12
13
14
2002
2003
2004
2005
2006
W. Gree
nwich 2008
2009
2010
2011
2012
Annu
al A
vera
ge D
esig
n Va
lue
(ug/
m3 )
Vernon St.Eddy St.Urban LeagueE. ProvidenceW. Greenwich
2012 Vernon St. data incomplete
NAAQS

35
Figure 11 Correlation of Urban League and Eddy Street PM2.5 after Conclusion of Iway Construction
y = 0.9146x + 0.1213R2 = 0.8983
0
5
10
15
20
25
0 5 10 15 20 25
Eddy St. PM2.5 (ug/m3)
Urb
an L
eagu
e PM
2.5
(ug/
m3)
1:1

36
Figure 12 Quarterly PM2.5 at Eddy St. and Urban League on Days with Valid Data at Both Sites
7.4
8.4 8.2
6.5
9.6
8.0
10.2
7.3
8.6
6.6
7.5
8.3
6.9
8.1 8.3
6.1
9.0
7.7
10.1
6.6
7.8
6.3
7.27.7
0.0
2.0
4.0
6.0
8.0
10.0
12.0
1st Q 2nd Q 3rd Q 4th Q 1st Q 2nd Q 3rd Q 4th Q 1st Q 2nd Q 3rd Q 4th Q
2010 2011 2012
ug/m
3 Eddy St.Urban League