
RHEOLOGICAL PROPERTIES OF FROZEN CONCENTRATED ORANGE JUICE...
10
2 nd Mercosur Congress on Chemical Engineering 4 th Mercosur Congress on Process Systems Engineering 1 RHEOLOGICAL PROPERTIES OF FROZEN CONCENTRATED ORANGE JUICE (FCOJ) AT SUBZERO TEMPERATURES Tavares, D. T. 1 , Alcantara, M. R. 2 , Tadini, C. C. 1 * ,Telis-Romero, J. 3 1 Escola Politécnica – São Paulo University, Brazil 2 Instituto de Química – São Paulo University, Brazil 3 Food Eng. and Tech. Dept. – Universidade Estadual Paulista, Brazil Abstract. This study was aimed to obtain the data on flow properties of Frozen Concentrated Orange Juice (FCOJ) produced from oranges cv. Pera-Rio (65.04 ºBrix, 8.8 % w/w pulp content, 0.133 % w/w pectin, 3.84% citric acid, 1.2934 g/cm 3 ) from – 18ºC to 0ºC and fit appropriate predictive models. This temperature interval was chosen because of the flow transport of FCOJ is done at temperatures within this range. Rheological measurements were carried out of using a rheometer (model MCR 300, Physica) with plate/plate geometry (49.96 mm) and a Peltier temperature control from – 40ºC to + 150ºC. A steady shear rate sweep was performed to determine the dependence of apparent viscosity and shear stress with rate. First the sweep was performed by increasing shear rate from 0 to 100 s -1 and then the shear rate was decreased back to initial value using the same sample at temperature constant. The experiments were repeated twice, at least, always using new FCOJ sample. The rheograms were obtained for FCOJ between 46.56 ºBrix to 65.04 ºBrix at temperature range from – 18ºC to 0 ºC. In order to obtain with different concentrations, the FCOJ was diluted with distilled water. In general, the power law fitted well the experimental data. In higher concentrations the tixotropy was observed. Arrhenius model was applied to describe the temperature effect, for each concentration. Among the samples, higher concentrations showed more dependency temperature. Keywords: Frozen concentrate orange juice, Rheological properties and Tixotropy. 1. Introduction Concentrated orange juice is one of the most important commodities over the world and Brazil is the major producer. Rheological behavior knowledge of frozen concentrated orange juice (FCOJ) is quite important for flow transport. The temperature and soluble solids content influence the rheological behavior of FCOJ and are responsible for non-Newtonian flow behavior. Some authors reported that fruit concentrates and purees revealed thixotropic behavior, related to pectin content, fibers and also pulp content. Ibarz and Ramos (1998) reported that orange juice with pulp and pectin presented thixotropic behavior at soluble solids concentrations of 55 and 60 ºBrix at temperature range from 0 to 20 ºC and shear rate interval from 7.2 to 57.6 s -1 . The thixotropic behavior was described by a kinetic model. This study was aimed to obtain the data on flow properties of Frozen Concentrated Orange Juice (FCOJ) produced from oranges cv. Pera-Rio (65.04 ºBrix, 8.8 % w/w pulp content, 0.133 % w/w pectin, 3.84% citric * To whom all correspondence should be addressed. Address: Food Eng. Lab. Chemical Eng. Dept., Escola Politécnica, São Paulo University, P. O. Box: 61548, 05424- 970 – Brazil E-mail: [email protected]
Transcript of RHEOLOGICAL PROPERTIES OF FROZEN CONCENTRATED ORANGE JUICE...

2nd Mercosur Congress on Chemical Engineering
4th Mercosur Congress on Process Systems Engineering
1
RHEOLOGICAL PROPERTIES OF FROZEN CONCENTRATED
ORANGE JUICE (FCOJ) AT SUBZERO TEMPERATURES
Tavares, D. T.1, Alcantara, M. R.2, Tadini, C. C.1*,Telis-Romero, J.3 1Escola Politécnica – São Paulo University, Brazil
2Instituto de Química – São Paulo University, Brazil 3Food Eng. and Tech. Dept. – Universidade Estadual Paulista, Brazil
Abstract. This study was aimed to obtain the data on flow properties of Frozen Concentrated Orange Juice (FCOJ) produced from oranges cv. Pera-Rio (65.04 ºBrix, 8.8 % w/w pulp content, 0.133 % w/w pectin, 3.84% citric acid, 1.2934 g/cm3) from – 18ºC to 0ºC and fit appropriate predictive models. This temperature interval was chosen because of the flow transport of FCOJ is done at temperatures within this range. Rheological measurements were carried out of using a rheometer (model MCR 300, Physica) with plate/plate geometry (49.96 mm) and a Peltier temperature control from – 40ºC to + 150ºC. A steady shear rate sweep was performed to determine the dependence of apparent viscosity and shear stress with rate. First the sweep was performed by increasing shear rate from 0 to 100 s-1 and then the shear rate was decreased back to initial value using the same sample at temperature constant. The experiments were repeated twice, at least, always using new FCOJ sample. The rheograms were obtained for FCOJ between 46.56 ºBrix to 65.04 ºBrix at temperature range from – 18ºC to 0 ºC. In order to obtain with different concentrations, the FCOJ was diluted with distilled water. In general, the power law fitted well the experimental data. In higher concentrations the tixotropy was observed. Arrhenius model was applied to describe the temperature effect, for each concentration. Among the samples, higher concentrations showed more dependency temperature.
Keywords: Frozen concentrate orange juice, Rheological properties and Tixotropy.
1. Introduction
Concentrated orange juice is one of the most important commodities over the world and Brazil is the major
producer. Rheological behavior knowledge of frozen concentrated orange juice (FCOJ) is quite important for
flow transport. The temperature and soluble solids content influence the rheological behavior of FCOJ and are
responsible for non-Newtonian flow behavior.
Some authors reported that fruit concentrates and purees revealed thixotropic behavior, related to pectin
content, fibers and also pulp content. Ibarz and Ramos (1998) reported that orange juice with pulp and pectin
presented thixotropic behavior at soluble solids concentrations of 55 and 60 ºBrix at temperature range from 0
to 20 ºC and shear rate interval from 7.2 to 57.6 s-1. The thixotropic behavior was described by a kinetic model.
This study was aimed to obtain the data on flow properties of Frozen Concentrated Orange Juice (FCOJ)
produced from oranges cv. Pera-Rio (65.04 ºBrix, 8.8 % w/w pulp content, 0.133 % w/w pectin, 3.84% citric
* To whom all correspondence should be addressed. Address: Food Eng. Lab. Chemical Eng. Dept., Escola Politécnica, São Paulo University, P. O. Box: 61548, 05424-
970 – Brazil E-mail: [email protected]

2nd Mercosur Congress on Chemical Engineering
4th Mercosur Congress on Process Systems Engineering
2
acid, 1.2934 g/cm3) from – 18ºC to 0ºC and fit appropriate predictive models. This temperature interval was
chosen because of the flow transport of FCOJ is done at temperatures within this range.
2. Material and Methods
2.1. Sample preparation
All the experimental measurements were conducted with samples from the same batch of frozen
concentrated orange juice (FCOJ) produced from oranges cv. Pera-Rio (65.04 ºBrix, 8.8 % w/w pulp content,
0.133 % w/w pectin, 3.84% citric acid, 1.2934 g/cm3) in a 7 – stage TASTE® evaporator and stored at – 30ºC.
In order to obtain different concentrations, the FCOJ was diluted with distilled water.
2.2. Analytical measurements
Citric acid was determined, in triplicate, according to the Kimball (1991) conducted in the pH-STAT
(RADIOMETER, mod. PHM290, France).
Soluble solids were determined, in triplicate, by a refractometer (CARLZEISS JENA, mod. 711849,
Germany) and corrected for acidity and temperature values according to Kimball (1991).
2.3. Rheological measurements
Rheological measurements were carried out of using a rheometer (model MCR 300, Physica) with
plate/plate geometry (49.96 mm) and a Peltier temperature control from – 40ºC to + 150ºC. A steady shear rate
sweep was performed to determine the dependence of apparent viscosity and shear stress with rate. First the
sweep was performed by increasing shear rate from 0 to 100 s-1 (2 s-1 step) and then the shear rate was
decreased back to initial value using the same sample at temperature constant. The experiments were repeated
twice, at least, always using new FCOJ sample. Shear stress – shear rate data were gathered as rheograms. The
rheograms were obtained for FCOJ between 46.56 ºBrix to 65.04 ºBrix at temperature range from – 18ºC to
0 ºC.
For thixotropic characterization, working temperatures of –18 ºC, - 10ºC and 0 ºC and shear rates of 10 s-
1, 50 s-1 and 70 s-1 were chosen. Curves were obtained using the same rheometer and same Peltier temperature
control. The variation of shear stress with time at each constant shear rate was acquired automatically, during
10 min.
2.4. Data analysis
Fitted models were obtained by using nonlinear estimation procedure from the statistical program
Statgraphics® v. 4.0 (Manugistics). The suitability of the fitted models was evaluated by the determination
coefficient (r2), the significance level (p<0.05), and residual analysis.
Experimental data obtained from thixograms were fitted by empirical structural model proposed by Figone
and Shoemaker (1983).

2nd Mercosur Congress on Chemical Engineering
4th Mercosur Congress on Process Systems Engineering
3
3. Results and Discussion Table 1 shows results of citric acid and soluble solids content of different concentrations of FCOJ samples
used for rheological measurements.
Table 1. Citric acid and soluble solids content of FCOJ according to concentration
Concentration1
(º Brix) Citric acid
(%) Soluble solids content2
(ºBrix) 64.3 3.83 ± 0.02 65.04 ± 0.00 63.1 3.88 ± 0.01 64.29 ± 0.05 58.2 3.47 ± 0.05 58.56 ± 0.01 55.7 3.37 ± 0.02 56.33 ± 0.00 49.6 3.00 ± 0.03 49.96 ± 0.01 46.0 2.77 ± 0.00 46.56 ± 0.00
1Sample concentration after dilution 2Sample concentration measurement corrected for acidity and temperature
The rheograms were obtained for Frozen Concentrate Orange Juice (FCOJ) at 46.56, 49.96, 56.33 58.56,
64.29 and 65.04 ºBrix, in triplicate, at temperatures –18, -16, -14, -12, -10, -8, -6, -4, -2 and 0 ºC, depending
on concentration, beginning always at temperature superior to freezing point depression, which range is
– 18.83ºC for 66.0 ºBrix to – 9.89 ºC for 46.0 ºBrix (Gabas et al.,2003). Typical rheograms for FCOJ at –18 ºC
to 0 ºC temperature range obtained for 65.04 ºBrix are shown in Figure 1. A clearly non-Newtonian behavior,
shear-thinning (pseudoplastic) fluid was observed. Similar curves were obtained for all concentrations and
temperatures. Vitali and Rao (1984) reported same flow behavior for 65 ºBrix low-pulp concentrate orange
juice between –19 and 30 ºC.
Fig. 1. Typical rheograms of FCOJ at 65.04 ºBrix at temperature range from – 18ºC to 0ºC.
FCOJ (65.04 ºBrix)
0
200
400
600
800
1000
1200
1400
0 10 20 30 40 50 60 70 80 90 100 110
Shear rate (s-1)
Sh
ear
stre
ss (
Pa)
-16ºC -18 ºC -14ºC -12ºC -10 ºC -8 ºC -6ºC -4 ºC -2ºC 0ºC

2nd Mercosur Congress on Chemical Engineering
4th Mercosur Congress on Process Systems Engineering
4
Power law model described well the shear rate-shear stress data of all concentrations, with negligible
magnitudes of yield stress. Parameters obtained for the power-law model are summarized in Table 2. The
coefficients of determination, for all cases, were higher than 0.999. FCOJ for all concentrations and
temperatures exhibited a power-law shear thinning behavior, characterized by flow behavior index values less
than 1. As can be observed consistency index increased as concentration increased and decreased as
temperature increased.
ANOVA applied over results indicated that both concentration and temperature significantly influenced
consistency index and flow behavior index (p<0.01). However, for lower concentrations flow behavior index
was significantly influenced only by concentration.
Non-linear regression analysis was performed to obtain combined effect of temperature and concentration
on consistency index obtained from upward curves. A single equation was derived by combining the Arrhenius
and power law relationships as follows:
×
××=TR
EexpCAK aB (1)
Brixº.CBrixº. 05655646 << KTK 273255 <<
where:
A = constant = 8.29 × 10⁻²⁰ Pa.sn.ºBrix-1
B = constant = 8.69
Ea = activation energy = 24,051.5 kJ.kmol-1
R = universal gas constant = 8.315 kJ.kmol-1.K-1
The constants of equation 1 were obtained by non-linear regression, through Marquardt procedure, of
experimental data and the adjusted determination coefficient was R2adj. = 0.75. Figure 2 shows the response
surface obtained from Eq.1. Such equations have been used by many authors for tomato concentrates (Harper
and El Sharigi, 1965), for concentrated orange juice (Vitali and Rao, 1984), for concentrated kiwi juice (Ibarz
et al., 1995), for mango, papaya and peach puree (Guerrero and Alzamora, 1998) and for banana puree
(Guerrero and Alzamora, 1997).

2nd Mercosur Congress on Chemical Engineering
4th Mercosur Congress on Process Systems Engineering
5
Table 2. Power-law parameters for FCOJ at different concentrations and temperatures
Sample up curves down curves Temperature K (Pa.sn) n R2 K (Pa.sn) n R2
65.04 ºBrix - 18ºC 73.36 ± 4.88 0.60 ± 0.01 0.995 47.56 ± 1.76 0.70 ± 0.00 0.999 - 16ºC 64.63 ± 2.84 0.60 ± 0.01 0.998 40.28 ± 2.67 0.70 ± 0.01 0.999 - 14ºC 51.65 ± 2.02 0.60 ± 0.01 0.999 34.64 ± 0.05 0.68 ± 0.00 0.999 - 12ºC 44.08 ± 0.32 0.60 ± 0.00 0.999 29.98 ± 0.26 0.68 ± 0.00 0.999 - 10ºC 35.59 ± 2.68 0.57 ± 0.02 0.996 23.00 ± 2.62 0.66 ± 0.01 0.999
- 8ºC 36.11 ± 0.43 0.56 ± 0.00 0.998 23.22 ± 0.01 0.65 ± 0.00 0.999 - 6ºC 33.77 ± 4.14 0.56 ± 0.00 0.998 21.56 ± 2.07 0.65 ± 0.01 0.999 - 4ºC 29.12 ± 2.23 0.54 ± 0.02 0.999 18.54 ± 0.10 0.64 ± 0.00 0.999 - 2ºC 24.76 ± 0.36 0.55 ± 0.01 0.999 16.72 ± 0.86 0.63 ± 0.00 0.999
0ºC 23.76 ± 0.42 0.55 ± 0.01 0.999 16.31 ± 0.67 0.63 ± 0.00 0.999 64.29 ºBrix
- 16ºC 23.51 ± 0.07 0.60 ± 0.01 0.996 18.08 ± 0.95 0.65 ± 0.00 0.999 - 14ºC 24.50 ± 2.30 0.60 ± 0.00 0.998 18.94 ± 1.93 0.65 ± 0.00 0.999 - 12ºC 18.76 ± 0.37 0.60 ± 0.00 0.998 15.15 ± 0.49 0.64 ± 0.00 0.999 - 10ºC 16.58 ± 3.53 0.60 ± 0.01 0.999 13.98 ± 2.45 0.63 ± 0.00 0.999
- 8ºC 16.81 ± 1.64 0.58 ± 0.00 0.998 13.47 ± 1.10 0.63 ± 0.00 0.999 - 6ºC 11.38 ± 2.00 0.59 ± 0.00 0.998 9.69 ± 1.66 0.62 ± 0.00 0.999 - 4ºC 10.08 ± 1.26 0.56 ± 0.02 0.998 7.76 ± 1.36 0.61 ± 0.00 0.999 - 2ºC 7.92 ± 2.12 0.58 ± 0.00 0.999 7.01 ± 1.81 0.61 ± 0.00 1.000
0ºC 7.46 ± 0.48 0.57 ± 0.01 0.999 6.41 ± 0.15 0.60 ± 0.00 1.000 58.56 ºBrix
- 14ºC 10.24 ± 0.31 0.51 ± 0.01 0.993 6.34 ± 0.27 0.61 ± 0.01 1.000 - 12ºC 10.59 ± 1.68 0.54 ± 0.02 0.999 5.61 ± 1.28 0.61 ± 0.00 1.000 - 10ºC 7.43 ± 0.98 0.54 ± 0.01 0.997 5.39 ± 0.56 0.61 ± 0.00 0.999 - 8ºC 8.05 ± 1.89 0.54 ± 0.00 0.999 5.92 ± 1.35 0.60 ± 0.00 0.999 - 6ºC 8.06 ± 1.82 0.53 ± 0.00 0.999 5.65 ± 1.21 0.60 ± 0.00 1.000 - 4ºC 6.34 ± 0.56 0.52 ± 0.01 0.998 4.43 ± 0.52 0.59 ± 0.00 1.000 - 2ºC 7.87 ± 0.05 0.53 ± 0.01 0.998 5.63 ± 0.23 0.60 ± 0.00 1.000
0ºC 7.84 ± 1.13 0.52 ± 0.02 0.999 5.60 ± 0.75 0.59 ± 0.00 1.000 56.33 ºBrix
- 12ºC 10.08 ± 0.52 0.57 ± 0.01 1.000 7.39 ± 0.01 0.63 ± 0.00 0.999 - 10ºC 8.35 ± 0.10 0.57 ± 0.01 1.000 6.30 ± 0.09 0.63 ± 0.00 1.000 - 8ºC 7.06 ± 0.21 0.57 ± 0.00 1.000 5.38 ± 0.21 0.63 ± 0.00 1.000 - 6ºC 6.63 ± 0.08 0.57 ± 0.00 1.000 5.05 ± 0.09 0.63 ± 0.00 1.000 - 4ºC 5.51 ± 0.63 0.56 ± 0.01 1.000 4.18 ± 0.47 0.62 ± 0.00 1.000 - 2ºC 5.07 ± 1.02 0.57 ± 0.00 1.000 3.90 ± 0.73 0.62 ± 0.00 1.000
0ºC 5.17 ± 0.28 0.57 ± 0.00 1.000 4.05 ± 0.17 0.62 ± 0.00 1.000 49.96 ºBrix
- 10ºC 2.69 ± 0.12 0.60 ± 0.02 0.997 2.51 ± 0.10 0.62 ± 0.00 1.000 - 8ºC 2.52 ± 0.53 0.60 ± 0.02 1.000 2.00 ± 0.39 0.65 ± 0.00 1.000 - 6ºC 2.95 ± 0.18 0.58 ± 0.01 1.000 2.14 ± 0.05 0.64 ± 0.00 1.000 - 4ºC 2.58 ± 0.18 0.57 ± 0.00 0.999 1.85 ± 0.15 0.64 ± 0.00 1.000 - 2ºC 2.50 ± 0.04 0.58 ± 0.00 1.000 1.84 ± 0.04 0.64 ± 0.00 1.000
0ºC 1.72 ± 0.23 0.60 ± 0.01 0.999 1.41 ± 0.17 0.64 ± 0.00 1.000 46.56 ºBrix
- 8ºC 1.31 ± 0.08 0.60 ± 0.01 0.999 1.08 ± 0.03 0.64 ± 0.00 0.999 - 6ºC 1.14 ± 0.10 0.60 ± 0.01 0.999 0.95 ± 0.09 0.65 ± 0.01 1.000 - 4ºC 1.08 ± 0.22 0.60 ± 0.01 0.999 0.94 ± 0.13 0.65 ± 0.00 1.000 - 2ºC 1.05 ± 0.14 0.58 ± 0.02 0.996 0.88 ± 0.19 0.65 ± 0.00 1.000
0ºC 1.06 ± 0.08 0.59 ± 0.01 0.998 0.91 ± 0.19 0.65 ± 0.00 1.000
2nd Mercosur Congress on Chemical Engineering
4th Mercosur Congress on Process Systems Engineering
6
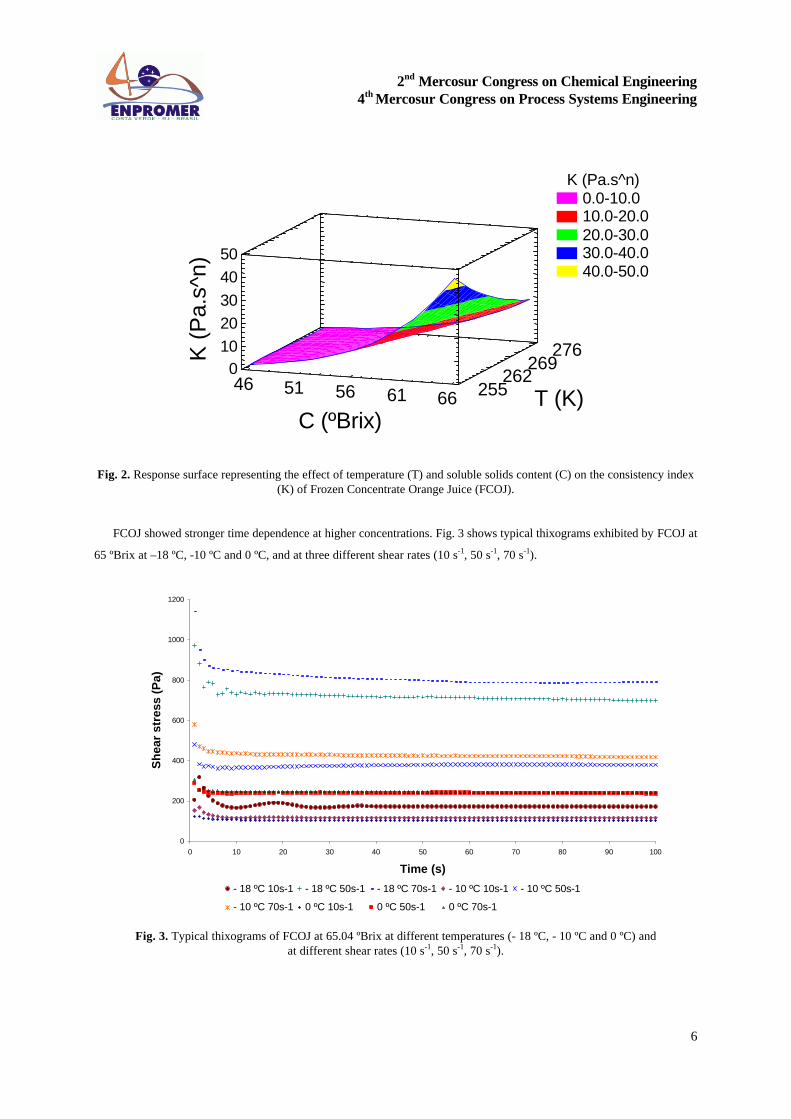
Fig. 2. Response surface representing the effect of temperature (T) and soluble solids content (C) on the consistency index (K) of Frozen Concentrate Orange Juice (FCOJ).
FCOJ showed stronger time dependence at higher concentrations. Fig. 3 shows typical thixograms exhibited by FCOJ at
65 ºBrix at –18 ºC, -10 ºC and 0 ºC, and at three different shear rates (10 s-1, 50 s-1, 70 s-1).
0
200
400
600
800
1000
1200
0 10 20 30 40 50 60 70 80 90 100
Time (s)
Sh
ear
stre
ss (P
a)
- 18 ºC 10s-1 - 18 ºC 50s-1 - 18 ºC 70s-1 - 10 ºC 10s-1 - 10 ºC 50s-1
- 10 ºC 70s-1 0 ºC 10s-1 0 ºC 50s-1 0 ºC 70s-1
Fig. 3. Typical thixograms of FCOJ at 65.04 ºBrix at different temperatures (- 18 ºC, - 10 ºC and 0 ºC) and at different shear rates (10 s-1, 50 s-1, 70 s-1).
C (ºBrix)T (K)
K (
Pa.
s^n)
K (Pa.s^n)0.0-10.010.0-20.020.0-30.030.0-40.040.0-50.0
46 51 56 61 66 255262
269276
01020304050

2nd Mercosur Congress on Chemical Engineering
4th Mercosur Congress on Process Systems Engineering
7
It can be observed that the thixograms for lower temperatures and shear rates present two segments. The first
one shows a rapid decrease of shear stress up to 30 s, while the second present a quite slower decrease. Ramos
and Ibarz (1998) reported same behavior for orange juice at 55 ºBrix and 60 ºBrix, at working temperatures of
0 ºC, 5 ºC, 10 ºC and 20 ºC. These authors suggested that first decrease occurred probably because of the
disintegration of irregular pulps into smaller and more homogeneous particles and during the second the
decrease is due orientation of particles caused by the shearing action. Figoni and Shoemaker (1983) proposed
an empirical structural model to characterize time dependent flow properties of mayonnaise (eq. 2):
( ) ( )tkeie ×−×σ−σ+σ=σ exp (2)
where:
σ = shear stress (Pa)
σe = shear stress equilibrium value (Pa)
σi = initial shear stress (Pa)
( )ei σ−σ = quantity of break-down structure for shearing (Pa)
k = kinetic constant of structural destruction (s-1)
t = time of shearing (s)
Experimental values obtained from each thixogram were fitted to Figoni and Shoemaker (1983) model and
the thixotropic parameters are listed in Table 3.

2nd Mercosur Congress on Chemical Engineering
4th Mercosur Congress on Process Systems Engineering
8
Table 3. Figoni and Shoemaker (1983) model parameters for FCOJ at 65.04 ºBrix at three different working temperatures
(-18 ºC, -10 ºC and 0 ºC) and at three different shear rates (10 s-1, 50 s-1, 70 s-1).
T γ& σi σe σi - σe k R2
(ºC) (s-1) (Pa) (Pa) (Pa) (s-1)
-18 10 297.8 168.5 129.3 2.37 x 10⁻¹ 0.65
50 757.7 670.1 87.6 1.00 x 10⁻² 0.75
70 914.0 790.1 123.9 1.07 x 10⁻² 0.82
-10 10 186.4 121.8 64.6 2.05 x 10⁻¹ 0.70
50 346.8 315.1 31.7 3.70 x 10⁻³ 0.95
70 413.4 382.7 30.7 5.67 x 10⁻³ 0.96
0 10 107.8 96.7 11.1 4.35 x 10⁻³ 0.87
50 239.7 207.9 31.9 1.48 x 10⁻³ 0.92
70 230.9 211.8 19.1 4.80 x 10⁻³ 0.82
It can be observed that the quantity of structure break-down (σi - σe) after shearing did not present a clear
tendency, at same temperature, while at lower shear rates, smaller values of equilibrium shear stress (σe) were
found, implying smaller apparent final viscosities. Ramos and Ibarz (1998) reported same tendencies for
equilibrium shear stress studying concentrate orange juice. The same behavior was observed in FCOJ at other
concentrations.
The effect of shear rate and temperature on the thixotropic character of the FCOJ is presented in Table 4.
ANOVA indicated that shear rate significantly influenced initial shear stress, equilibrium shear stress and
kinetic constant of structural destruction. Both σI and σe increased as shear rate increased, as expected. Same
tendencies were observed by Ramos and Ibarz (1998). However, temperature influenced initial stress,
equilibrium stress and quantity of breakdown of FCOJ. Both σI and σe increased as temperature decreased,
indicating that at lower FCOJ temperatures, the behavior is more thixotropic. The quantity of breakdown (σi -
σe) of FCOJ had a drastic increase after about 30 s of shearing at –18 ºC.

2nd Mercosur Congress on Chemical Engineering
4th Mercosur Congress on Process Systems Engineering
9
Table 4. Effect of shear rate and temperature on Figoni and Shoemaker model parameters for FCOJ at 65.04 ºBrix.
γ& (s-1) σi (Pa) σe (Pa) σi - σe (Pa) k (s-1)
10 197.2a 129.0a 68.2a 1.27 x 10⁻¹a
50 429.7b 381.9b 47.8a 4.85 x 10⁻³b
70 519.4b 461.5b 57.9a 7.04 x 10⁻³
Tukey HSD test
166.3 167.2 26.7 8.70 x 10⁻²
T (ºC)
-18 637.9a 527.1a 110.8a 8.57 x 10⁻²a
-10 315.5b 273.2b 42.3b 4.98 x 10⁻²a
0 192.8b 172.1b 20.7b 3.54 x 10⁻³a
Tukey HSD test
166.3 167.2 26.7 8.70 x 10⁻²
Mean values with different superscripts column wise differ significantly (p<0.05).
4. Conclusion Frozen concentrate orange juice (FCOJ) presents a pseudo plastic behavior for all concentrations studied at
temperature interval from -18 °C to 0 ºC, when up and down curves were performed. A single equation derived
by combining the Arrhenius and power law relationships was used to describe the temperature and
concentration dependence on consistency index. FCOJ presents also a strong time dependence rheological
behavior, at higher concentrations. Experimental data were fitted to a structural model to correlate initial shear
stress, equilibrium shear stress and quantity of structure breakdown during shearing.
.
2nd Mercosur Congress on Chemical Engineering
4th Mercosur Congress on Process Systems Engineering
10
References Figoni, P. I., Shoemaker, C. F. (1983). Characterization of time dependent flow properties on mayonnaise under steady
shear. J. Texture Studies, 114, 431-442.
Gabas, A. L., Telis-Romero, J., Telis, V. R. N. (2003). Influence of fluid concentration on frozen point depression and
thermal conductivity of frozen orange juice. Int. J. of Food Properties, 6, 543.
Guerrero, S. N. and Alzamora, S. M. (1997). Effect of pH, temperature and glucose addition on flow behavior of fruit
purées: I. Banana purée, Journal of Food Engineering, 33, 239.
Guerrero, S. N. and Alzamora, S. M. (1998). Effect of pH, temperature and glucose addition on flow behavior of fruit
purées: II. Peach, papaya and mango purées, Journal of Food Engineering, 37, 77.
Harper, J. C. and El Sharigi, A F. (1965). Viscometric behavior of tomato concentrates, Journal of Food Sci., 30, 470.
Ibarz, A., Giner, J., Pagán, J., Gimeno, V. and Garzas, S. (1995) Rheological behavior of kiwi fruit juice concentrates, J.
Texture Studies, 26, 137.
Kimball, D. A. (1991). Citrus Processing: Quality Control and Technology. Chapman & Hall. New York, NY.
Vitali, A. A., Rao, M. A. (1984). Flow properties of low-pulp concentrated orange juice: serum viscosity and effect of pulp
content, Journal of Food Sci., 49, 876.
Vitali, A. A., Rao, M. A. (1984). Flow properties of low-pulp concentrated orange juice: effect of temperature and
concentration. J. of Food Science, 49, 882.
Acknowledgments
Authors wish to thank BASCITRUS S. A. for helpful suggestions and sample material supply, and João
Jesuino Demilio for technical support.