RFO Trending Process
24
RFO Trending Process Constellation Energy Calvert Cliffs Nuclear Power Plant Presented by: Paula Amos, Director Performance Improvement
-
Upload
cedric-valenzuela -
Category
Documents
-
view
50 -
download
1
description
RFO Trending Process. Constellation Energy Calvert Cliffs Nuclear Power Plant Presented by: Paula Amos, Director Performance Improvement. Presentation Groundrules. Interactive Discussion Share experience to maximize learning. Ice Breaker. Why is trending important? - PowerPoint PPT Presentation
Transcript of RFO Trending Process
RFO Trending ProcessConstellation Energy
Calvert Cliffs Nuclear Power Plant
Presented by: Paula Amos, Director Performance Improvement

2 June 22, 2010 / HPRCT
o Interactive Discussion
o Share experience to maximize learning
Presentation Groundrules
3 June 22, 2010 / HPRCT
o Why is trending important?
o What are some key elements of a good trending program?
Ice Breaker
4 June 22, 2010 / HPRCT
o Bins are defined that provide a logical way of sorting performance information. Keep the number of bins small enough to facilitate decision-making, and the bins are modified when necessary to reflect changes in priority or activities.
o Look for the trends or prevailing tendencies in department, station, and fleet performance data. Previously identified trends and additional areas for which the data shows that performance is improving, is deteriorating, or has stagnated.
INPO 07-007 Process Alignment

5 June 22, 2010 / HPRCT
o A limited number of individuals, such as trend analysts, apply trend codes.
o Establish Management Standard Limits or Averages by using fixed limit analysis or average limit analysis.
o Display data using control charts. The charts include a baseline average line and control limits. The control limits act as alarm values.
INPO 07-007 Process Alignment
6 June 22, 2010 / HPRCT
o Real-time tool to initiate interventions targeted at improving behavior / performance real time. o Daily review by Station Managemento Focus Areas Selected
o The goal is to identify adverse or potential trends immediately such that compensatory measures can be taken to reduce / prevent events and event pre-cursors.
Rapid RFO Trending Purpose
7 June 22, 2010 / HPRCT
o Condition Reportso Observationso HOST Briefing Sheetso Prompt Investigationso QPA Daily Summary Reports
What is Analyzed?
8 June 22, 2010 / HPRCT
o The Performance Improvement Unit developed reports that lists observation and condition report data that was generated within a given timeframe.
o Categories were developed based on previous trend categories in 2009 as well as current RFO data.
o Condition Reports and Observations were read and binned accordingly into categories.
Process

9 June 22, 2010 / HPRCT
o New categories are added to provide a more finite analysis of the data. These categories will be carried into future outages. New categories added as need arises.
o Analysis results are incorporated into the RFO Trending Document which is a combination of written analysis and graphical presentations.
Process
10 June 22, 2010 / HPRCT
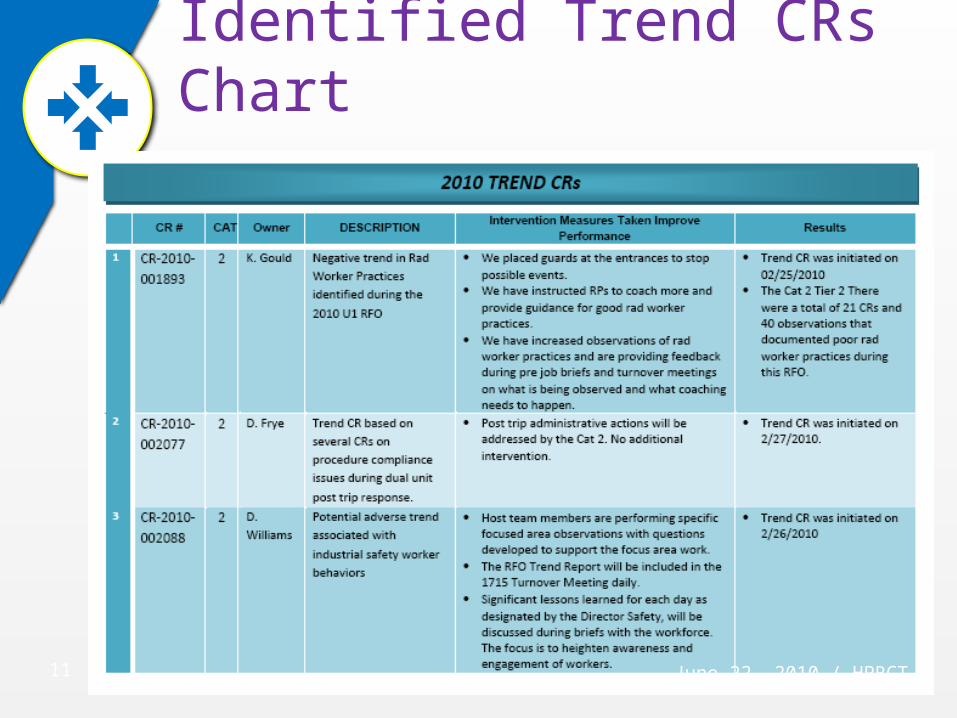
o Trend condition reports are generated at a low threshold.
o The report captures the following for each trend identified:o CR numberso Categoryo Ownero Descriptiono Invention Measures Taken to Improve
Behavior / Performanceo Results
Process
11 June 22, 2010 / HPRCT
Identified Trend CRs Chart

12 June 22, 2010 / HPRCT
o Comparisons were developed to show improved performance or declining performance during outages.
Process
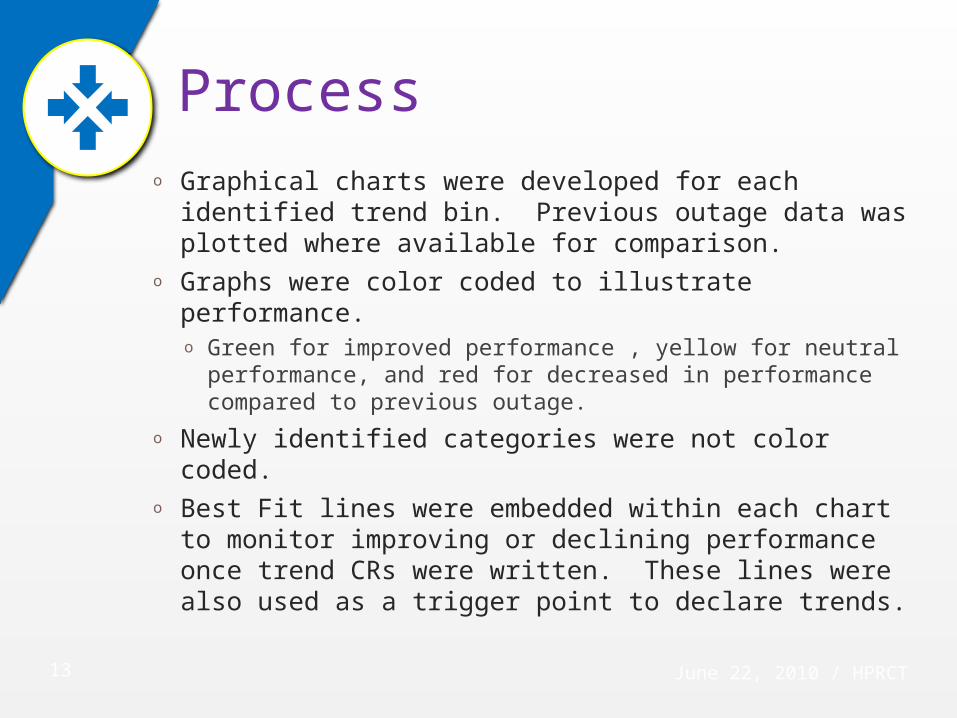
13 June 22, 2010 / HPRCT
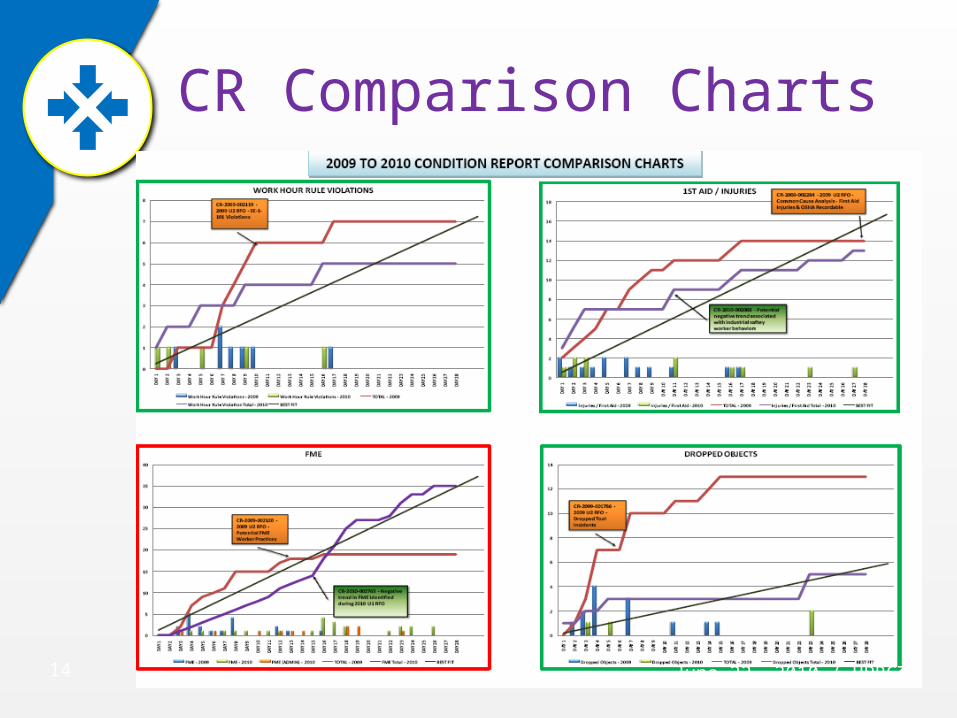
o Graphical charts were developed for each identified trend bin. Previous outage data was plotted where available for comparison.
o Graphs were color coded to illustrate performance.o Green for improved performance , yellow for neutral
performance, and red for decreased in performance compared to previous outage.
o Newly identified categories were not color coded.o Best Fit lines were embedded within each chart
to monitor improving or declining performance once trend CRs were written. These lines were also used as a trigger point to declare trends.
Process
14 June 22, 2010 / HPRCT
CR Comparison Charts
15 June 22, 2010 / HPRCT
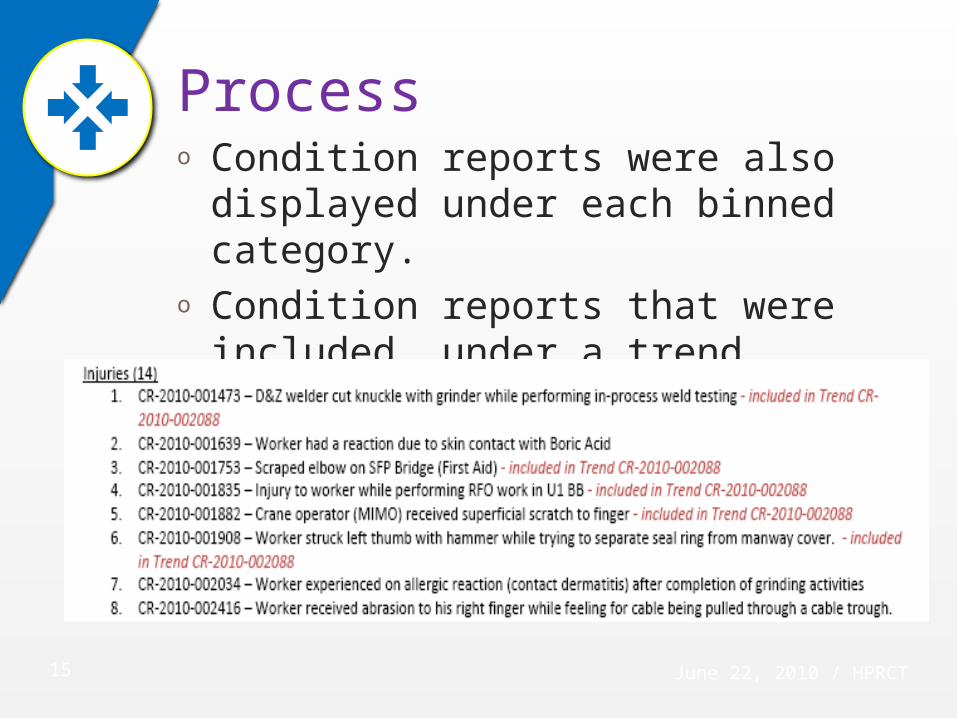
o Condition reports were also displayed under each binned category.
o Condition reports that were included under a trend condition were noted.
Process
16 June 22, 2010 / HPRCT
o Observations were also binned by category based on applied trend codes.
o Graphical presentation was included in the daily trending report.
o 2010 RFO trend CRs and 2009 RFO trend CRs were displayed on the chart.
Process
17 June 22, 2010 / HPRCT
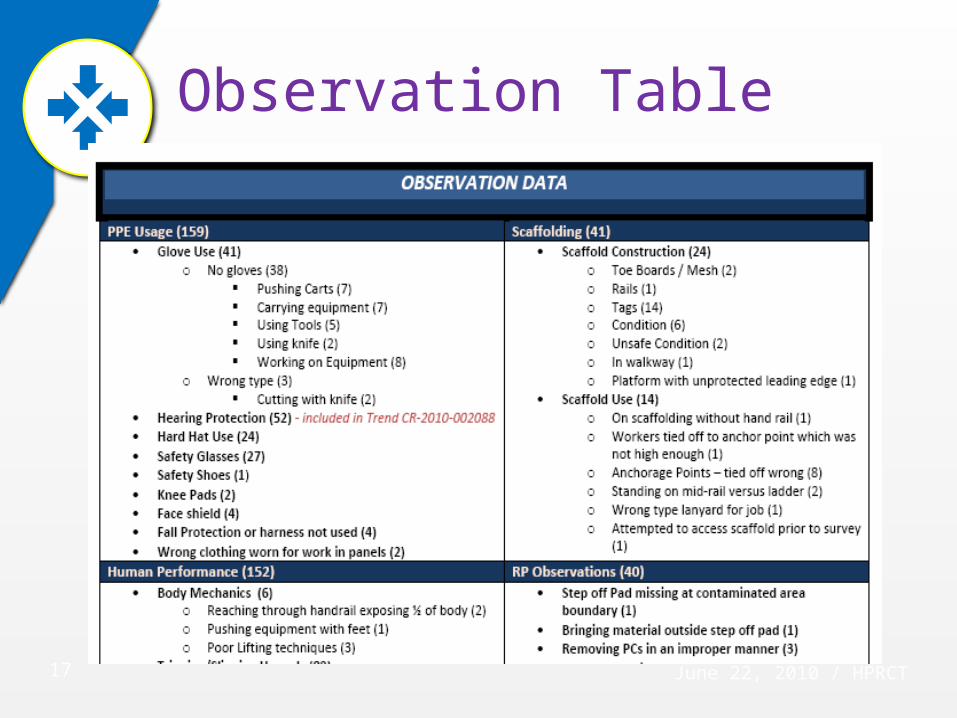
Observation Table
18 June 22, 2010 / HPRCT
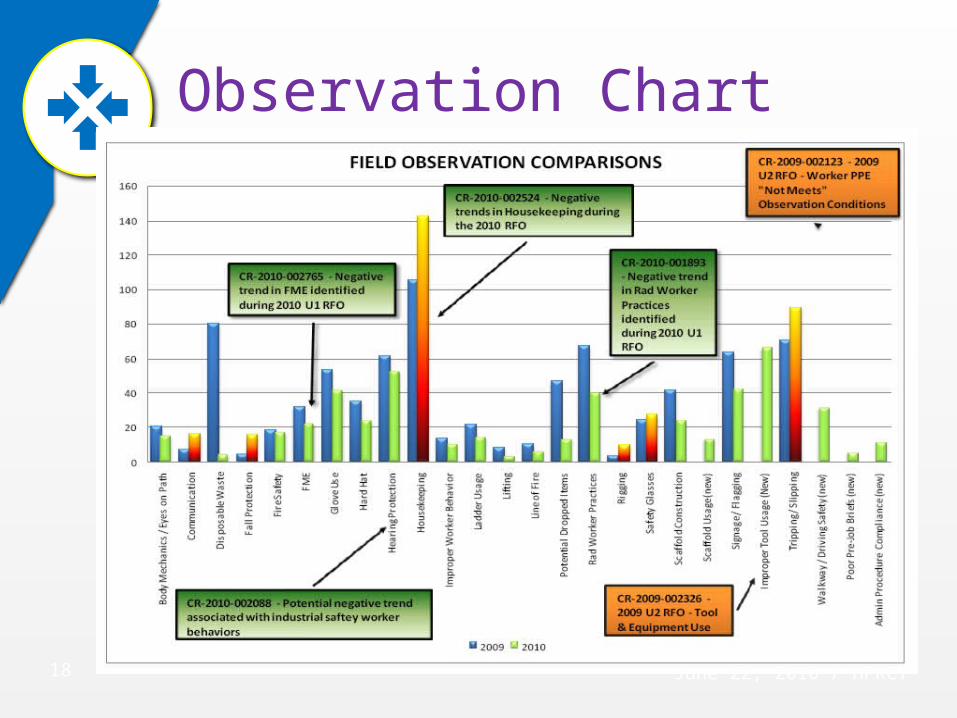
Observation Chart
19 June 22, 2010 / HPRCT
o The RFO Trending Report Summary was developed at the conclusion of the outage.
o Report included:o All data reported dailyo Prompt Investigation Summaryo QPA Observation Data Roll-upo Example of Host Briefing Sheet
Final Report
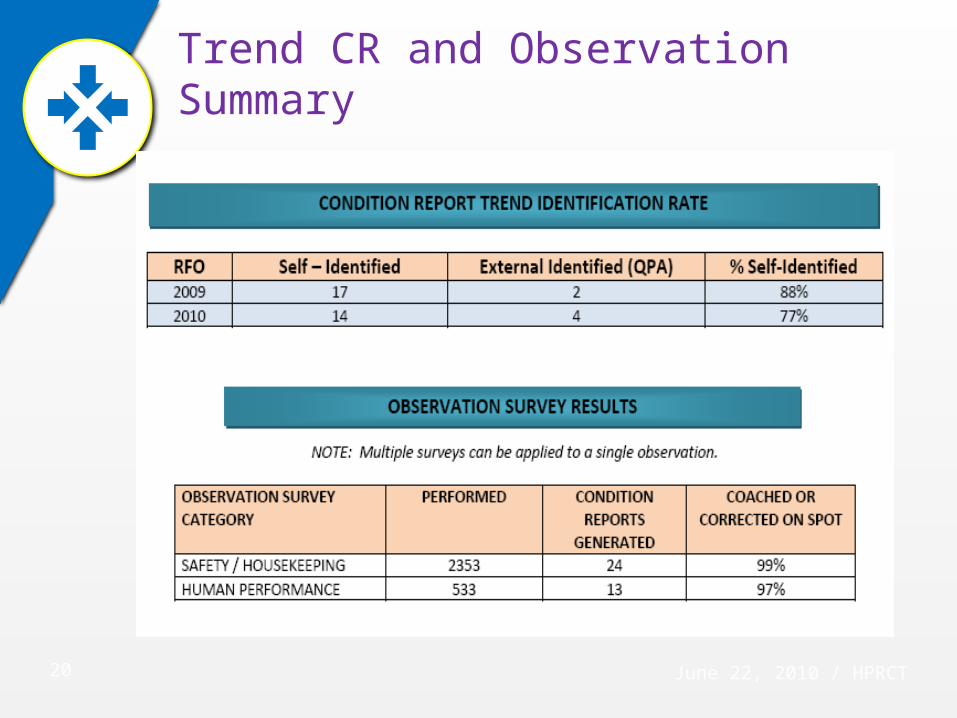
20 June 22, 2010 / HPRCT
Trend CR and Observation Summary
21 June 22, 2010 / HPRCT
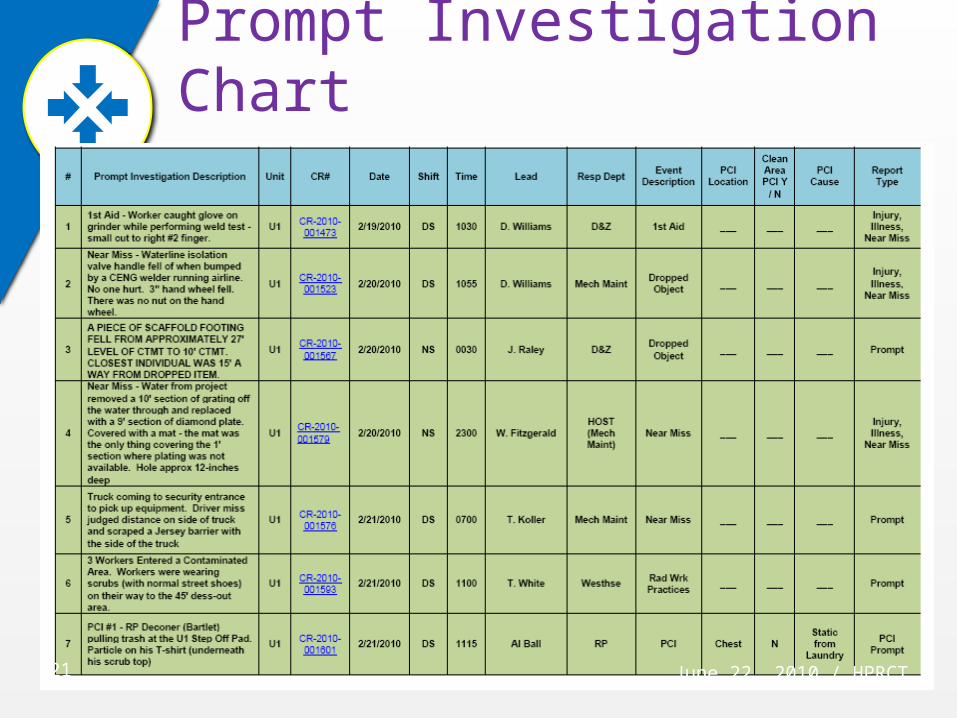
Prompt Investigation Chart
22 June 22, 2010 / HPRCT
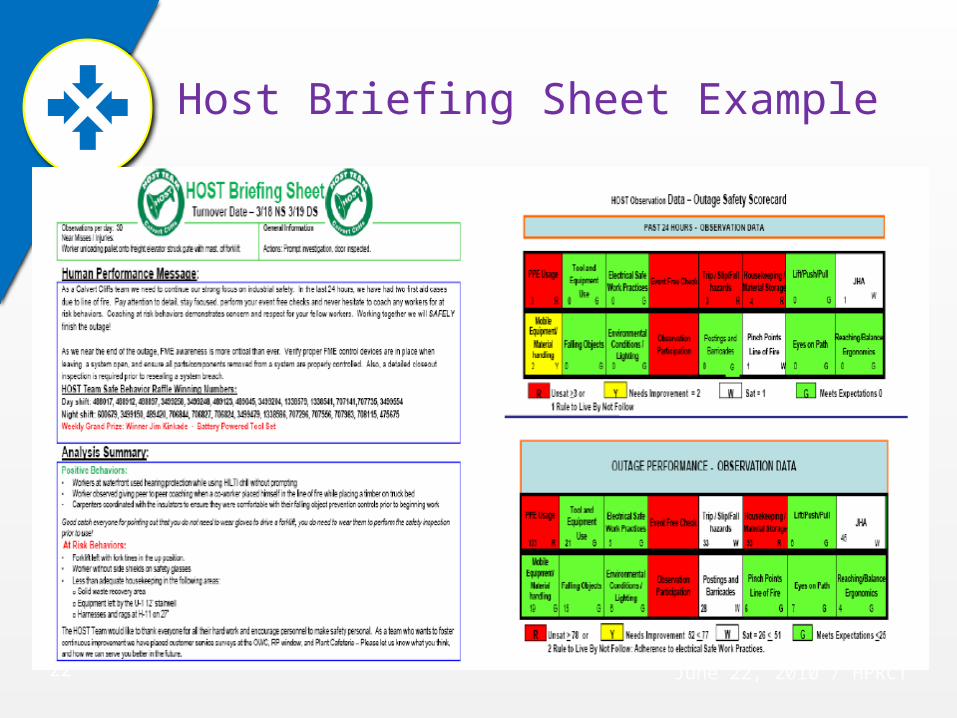
Host Briefing Sheet Example
23 June 22, 2010 / HPRCT
o A structured Rapid Trending Process can make an impact on Outage Performance.
o You need to start somewhere. INPO 07-007 has defined the baseline.
o Use all available data sources.
o You can’t get to where you want to be with performance until you know where you are at!!
Summary

24 June 22, 2010 / HPRCT
?
Questions and Answers

![COFRENTES UNDERVESSEL PROJECT IN RFO 16 … UNDERVESSEL PROJECT IN RFO 16 (2007) [ Replacement of all the CRDH undervessel piping] COFRENTES UNDERVESSEL PROJECT IN RFO 16 (2007) [](https://static.fdocuments.us/doc/165x107/5abcda087f8b9a8f058e13cf/cofrentes-undervessel-project-in-rfo-16-undervessel-project-in-rfo-16-2007.jpg)