RF EMISSIONS FROM SMART GRID ELECTRIC METERS, HAN …
35
RF EMISSIONS FROM SMART GRID ELECTRIC METERS, HAN DEVICES, AND THEIR RELATIONSHIP TO THE FCC MAXIMUM PERMISSIBLE EXPOSURE LIMIT (MPE) PREPARED FOR BY Gordon W. Hudson 9 th October 2012
Transcript of RF EMISSIONS FROM SMART GRID ELECTRIC METERS, HAN …

RF EMISSIONS FROM SMART GRID ELECTRIC
METERS, HAN DEVICES, AND THEIR
RELATIONSHIP TO THE FCC MAXIMUM
PERMISSIBLE EXPOSURE LIMIT (MPE)
PREPARED FOR
BY
Gordon W. Hudson
9th
October 2012

Table of Contents
1. Executive Summary ................................................................................................................. 4
2. Scope & Purpose ..................................................................................................................... 5
3. RF Restrictions ........................................................................................................................ 5
4. Radiation .................................................................................................................................. 5
5. Maximum Permissible Exposure (MPE) % ............................................................................. 6
6. Test Equipment ........................................................................................................................ 7
7. Common RF Emitters – Spectrum Analysis Mode ................................................................. 8
8. Common RF Emitters – Safety Evaluation Mode ................................................................. 10
9. OG&E Smart Grid MPE Test Details .................................................................................... 11
a) Locations ............................................................................................................................ 11
b) Test Criteria ....................................................................................................................... 11
c) OG&E Test Locations & Modes Overview ....................................................................... 11
10. OG&E Smart Grid MPE Test Results ............................................................................ 12
a) Commercial Location......................................................................................................... 12
b) Residential Location .......................................................................................................... 18
11. Comparative Results ...................................................................................................... 25
a) Overall MPE results graph summary (logarithmic) ........................................................... 25
b) Overall MPE results graph summary (linear) .................................................................... 26
12. Conclusions .................................................................................................................... 27
13. Other Resources ............................................................................................................. 28
a) Technical References ......................................................................................................... 28
b) Similar Reports .................................................................................................................. 28
14. Equipment Certification & Calibration Information ...................................................... 29
a) 3-Axis Antenna Calibration Documentation ..................................................................... 30
b) Antenna Cable Calibration Documentation ....................................................................... 32
c) SRM-3000 Selective Radiation Meter Calibration Documentation .................................. 34

Table of Figures
Figure 1 - FCC MPE limits. ........................................................................................................ 6
Figure 2 - Narda SRM-3000, Stock Photo .................................................................................. 7
Figure 2 - Cell Phone Emission, Max Hold mode @ 1cm distance. .......................................... 8
Figure 3 - Microwave Oven, Full Power, Max Hold mode @ 1cm. .......................................... 9
Figure 4 - SRM-3000 Example Screenshot in Safety Eval mode ............................................. 10
Figure 5 - Common RF Emitters, % of MPE ........................................................................... 10
Figure 6 - Commercial Location Layout (not to scale) ............................................................ 12
Figure 7 - Commercial Location MPE levels ........................................................................... 12
Figure 8 - Commercial Location "A", Meter Front .................................................................. 13
Figure 9 - Commercial Location "A", Meter close up during test ............................................ 14
Figure 10 - Commercial Location "B", at thermostat ............................................................... 15
Figure 11 - Commercial Location "B", close up of thermostat during test .............................. 16
Figure 12 - Commercial Location "C", location inside building. ............................................. 17
Figure 13 - Residential Location Layout (not to scale) ............................................................ 18
Figure 14 - Residential Location MPE levels ........................................................................... 19
Figure 15 - Residential Location "B", at thermostat ................................................................. 20
Figure 16 - Residential Location “B”, close up of Thermostat during test .............................. 21
Figure 17 - Residential Location "A", Meter Front .................................................................. 22
Figure 18 - Residential Location "A", close up of Meter front during test .............................. 23
Figure 19 - Residential Location, collecting ambient levels .................................................... 24
Figure 20 - Overall MPE results, logarithmic ........................................................................... 25
Figure 21 - Overall MPE results, linear .................................................................................... 26

1. Executive Summary
This report was prepared with certified, calibrated National Institute of Standards equipment
using techniques similar, where practical, with FCC best practices for measuring RF Emissions.
The standard for comparison is the FCC Maximum Exposure Limit for the General Population
Exposure FCC 47 CFR 1.1301-1.1310.
Testing indicates RF emissions from OG&E’s Smart Grid systems are from hundreds to
thousands of times lower than the FCC Maximum Permissible Exposure limit (MPE) when in
normal use. The emissions measured inside residences or businesses equipped with the Smart
Grid system are over 100 times less than a standard cell phone, over 1000 times less than
exposure standing in front of a microwave oven, and are often so low they cannot be discerned
from common background RF emission sources such WiFi and cordless phones.
To gain useful data, two test modes were used.
Regular (normal use) mode
o Units were measured over a 30 minute period with no system intervention, as per
the FCC MPE limits for the general population.
Worst case transmission mode
o Units were forced into constant activity by repeatedly requiring a firmware
upgrade, which creates excessive data traffic, which in turn creates abnormally
high RF emission levels. Tests are performed for 30 minutes.
Again, for the thermostats or HAN devices, we used two similar test modes.
Regular (normal use) mode.
o Units were measured over a 30 minute period with no system intervention, as per
the FCC MPE limits for the general population.
Worst case transmission mode
o Thermostat is continually accessed, creating excessive data traffic, which in turn
creates abnormally high RF emission levels. Tests are performed for 30 minutes.

2. Scope & Purpose
So-called “smart grid” meters read the amount of electric consumption per customer and
communicate that information back to the utility on a regular basis, often in real time.
In addition to Automatic Meter Reading (AMR) these devices perform as part of an Advanced
Metering Infrastructure (AMI) network, capable of bidirectional communication with the utility
and customer’s equipment via HAN (Home Area Network) devices, such as room thermostat
controls.
The scope & purpose of this document is to provide RF emission data from real-world testing of
these devices against the FCC Maximum Permissible Exposure Limit, or MPE, and compare it to
data collected from other common RF devices.
3. RF Restrictions
The Federal Communications Commission (FCC) has established restrictions on exposure to
Radio Frequency (RF) radiation to protect the public and the environment. One of these
restrictions is known as the MPE, or Maximum Permissible Exposure limit. This is measured in
percent, with 100% being the maximum. Anything over 100% of the Maximum Permissible
Exposure limit is in violation of this restriction and will not be granted an FCC license to
operate.
4. Radiation
This word is unnerving to most, but it is very important to distinguish between the different
types, and clarify this term.
Non-Ionizing Radiation – These are electromagnetic waves of a relatively low frequency, such as
radio waves, infra-red rays, and microwaves which do not possess enough energy to remove
electrons from atoms. No health risks are known from non-ionizing radiation.
Ionizing Radiation – These are electromagnetic waves of relatively high frequency, such as
particles and rays emitted by radioactive materials, and x-rays, which possess enough energy to
strip electrons from atoms (ionize them), can damage DNA structure and can contribute to
cancer, and other adverse health effects.

5. Maximum Permissible Exposure (MPE) %
The FCC has two different limits imposed for MPE. Occupational, or Controlled exposure and
General Population, or Uncontrolled Exposure.
Formulae for calculating Power Density, and therefore MPE, are frequency-dependent. The
lowest frequency of operation is always used.
For the purposes of this paper, we are concerned with two frequency bands – 900MHz (Power
Density limit of [902/300]mW/cm2) and 2.4GHz (Power Density Limit of 5mW/cm
2) – and the
General Population, or Uncontrolled exposure limit, which is averaged over a 30 minute time
span.
Figure 1 - FCC MPE limits.

6. Test Equipment
The equipment used to detect RF emissions from equipment in this case is the SRM-3000
Selective Radiation Meter from Narda Safety Test Solutions (http://www.narda-sts.us/ ).
Narda STS is a global leader in EM (Electromagnetic) Field test and measurement.
The equipment consists of an isotropic, three-axis antenna for pickup of radiated fields, and a
base unit which houses the electronics to process the received fields and display them in a range
of different formats, including spectrum analyzer displays and numbers in percent of MPE.
For these tests we are purely interested in the level of the emissions displayed in % MPE.
A remote antenna cable for the antenna is used for the tests. The signal loss created by using this
cable is calculated out of the measurements automatically by the SRM-3000.
Figure 2 - Narda SRM-3000, Stock Photo

7. Common RF Emitters – Spectrum Analysis Mode
To create a point of reference, some common household RF emitting devices were scanned.
This allows us to compare everyday existing RF emissions with RF emissions from AMI
infrastructure. Spectrum Analyzer mode was used in these tests to give a graphic representation
of the emissions.
Figure 2 - Cell Phone Emission, Max Hold mode @ 1cm distance.
The above graph shows % MPE on the y-axis in a logarithmic scale (tick marks in multiples of
10), and frequency in Hz along the x-axis. The SRM-3000 was in MAX mode, which
continuously monitors the frequencies selected and displays the maximum value detected at any
given time or frequency. As we can see, a common cell phone (iPhone 4S in this case) reaches
around 0.35% of the MPE at its peak emission. This would be an invalid result, since the SRM-
3000 was used in MAX mode, not Safety Evaluation Mode which detects MPE averaged over
time. The cell phone had maximum receive signal (5 bars) at the time, so the transmitted
emission should have been relatively low since cell phones vary their power in relation to receive
signal.
0.00001
0.0001
0.001
0.01
0.1
1
10
100
830000000 835000000 840000000 845000000
Ex
posu
re (
% M
PE
, g
ener
al
pop
ula
tion
, F
CC
47
CF
R 1
.13
01
-1.1
310
)
Frequency (Hz)
iPhone 4S, Full RX Signal @ 1 centimeter.

Figure 3 - Microwave Oven, Full Power, Max Hold mode @ 1cm.
In the same MAX mode, the peak emission from a microwave oven is very “dirty” compared to a
cell phone, and it reaches almost 11.5% of the MPE at 1cm distance, which is similar to someone
looking inside the oven to check on their food. Other MAX measurements around the door of
the microwave oven yielded up to 20% of MPE. The oven was heating 1 standard cup of water
during the test.
1E-05
0.0001
0.001
0.01
0.1
1
10
100
2.4E+09 2.42E+09 2.44E+09 2.46E+09 2.48E+09 2.5E+09
Ex
posu
re (
% M
PE
, g
ener
al
pop
ula
tion
, F
CC
47
CF
R 1
.13
01
-1.1
310
)
Frequency (Hz)
Microwave Oven, Full Power @ 1 centimeter.

8. Common RF Emitters – Safety Evaluation Mode
The SRM-3000 Safety Evaluation mode is the most “meaningful” mode, since it gives MPE
results in a simple percentage of the maximum (100%).
Figure 4 - SRM-3000 Example Screenshot in Safety Eval mode
Device Distance Averaging Time % MPE
iPhone 4S Cell Phone 1 cm 2 minutes 0.23
Microwave Oven 1 cm 2 minutes 22.78
Microwave Oven 1 m 2 minutes 2.03
Figure 5 - Common RF Emitters, % of MPE
In Figure 5, the same devices were tested as in the “Common RF Emitters – Spectrum Analysis
Mode” section, but now we are using the SRM-3000 in Safety Evaluation mode.
The FCC MPE limit for General Population specifies that the RF emissions be averaged over 30
minutes. These measurements were averaged over 2 minutes. However, this was enough time to
gain a realistic result, since the cell phone is transmitting during the entire duration of a call, and
the microwave oven cycled its magnetron on and off several times during the 2 minute cook time
of 1 standard cup of water.
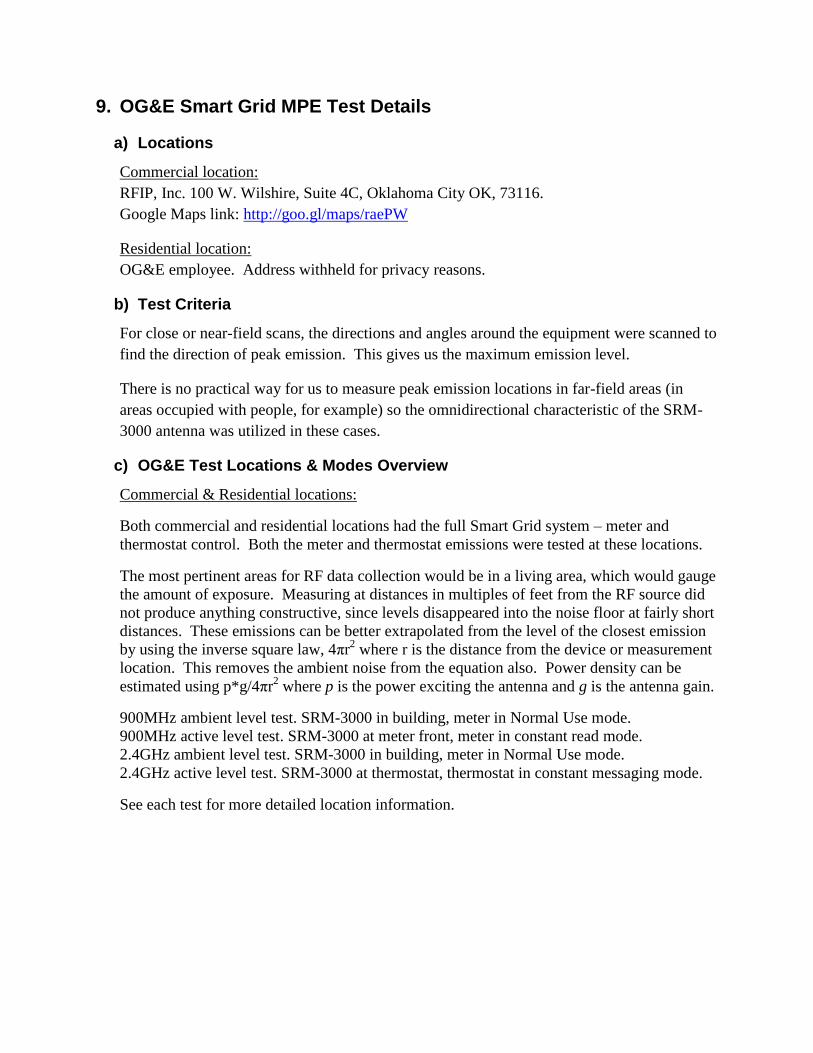
9. OG&E Smart Grid MPE Test Details
a) Locations
Commercial location:
RFIP, Inc. 100 W. Wilshire, Suite 4C, Oklahoma City OK, 73116.
Google Maps link: http://goo.gl/maps/raePW
Residential location:
OG&E employee. Address withheld for privacy reasons.
b) Test Criteria
For close or near-field scans, the directions and angles around the equipment were scanned to
find the direction of peak emission. This gives us the maximum emission level.
There is no practical way for us to measure peak emission locations in far-field areas (in
areas occupied with people, for example) so the omnidirectional characteristic of the SRM-
3000 antenna was utilized in these cases.
c) OG&E Test Locations & Modes Overview
Commercial & Residential locations:
Both commercial and residential locations had the full Smart Grid system – meter and
thermostat control. Both the meter and thermostat emissions were tested at these locations.
The most pertinent areas for RF data collection would be in a living area, which would gauge
the amount of exposure. Measuring at distances in multiples of feet from the RF source did
not produce anything constructive, since levels disappeared into the noise floor at fairly short
distances. These emissions can be better extrapolated from the level of the closest emission
by using the inverse square law, 4πr2 where r is the distance from the device or measurement
location. This removes the ambient noise from the equation also. Power density can be
estimated using p*g/4πr2 where p is the power exciting the antenna and g is the antenna gain.
900MHz ambient level test. SRM-3000 in building, meter in Normal Use mode.
900MHz active level test. SRM-3000 at meter front, meter in constant read mode.
2.4GHz ambient level test. SRM-3000 in building, meter in Normal Use mode.
2.4GHz active level test. SRM-3000 at thermostat, thermostat in constant messaging mode.
See each test for more detailed location information.

10. OG&E Smart Grid MPE Test Results
a) Commercial Location
Three locations were chosen. Location “A” is the meter itself. Location “B” is the
thermostat location, and location “C” is a location randomly chosen within the building for
ambient RF level measurements.
Figure 6 - Commercial Location Layout (not to scale)
Commercial Location Mode MPE Level (%) SRM-300 Mode
RFIP, Inc. Ambient 900MHz level. Location “C” Normal Use Mode 0.003350112 AVERAGE 30m
RFIP, Inc. Ambient 2.4GHz level. Location “C” Normal Use Mode 0.043210023 AVERAGE 30m
RFIP, Inc. At Thermostat, 2.4GHz scan. Location “B”
Constant Thermostat Messages
0.047873002 AVERAGE 30m
RFIP, Inc. At Meter. 900MHz scan. Location “A” Constant Meter Traffic 0.053870998 AVERAGE 30m
Figure 7 - Commercial Location MPE levels
Using the FCC guidelines for exposure (% MPE, general population, FCC 47 CFR 1.1301-
1.1310) we can see that exposure in the building (Location “C”) is very low, at around three
thousandths of one percent.
The exposure level at worst case, right at the meter itself, was around 0.05%. This “worst case”
scenario was created by having the meter constantly polled for reading, which causes it to
repeatedly transmit data, many times more than normal operation and finding the maximum
emission level right at the meter. This is the highest possible average emission level the meter
will create during its lifetime and testing all angles allows us to capture that emission.
The results of this test show an increase in the 900MHz MPE level when the meter is active, and
this is to be expected.
The increase in the 2.4GHz MPE level was very slight, barely detectable, and possibly even in
the error margin or noise floor. This is due to the 2.4GHz band being used by many devices
already in existence.

Commercial Test Location Photographs
Location “A”
Figure 8 - Commercial Location "A", Meter Front

Figure 9 - Commercial Location "A", Meter close up during test
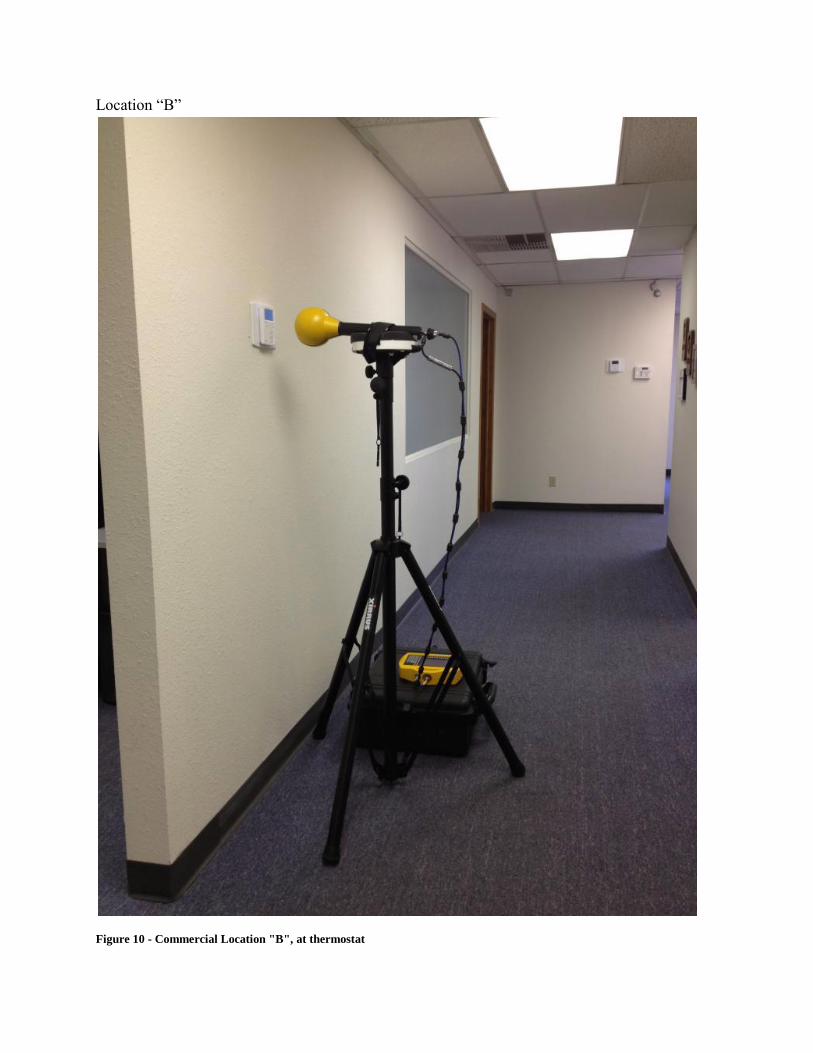
Location “B”
Figure 10 - Commercial Location "B", at thermostat

Figure 11 - Commercial Location "B", close up of thermostat during test
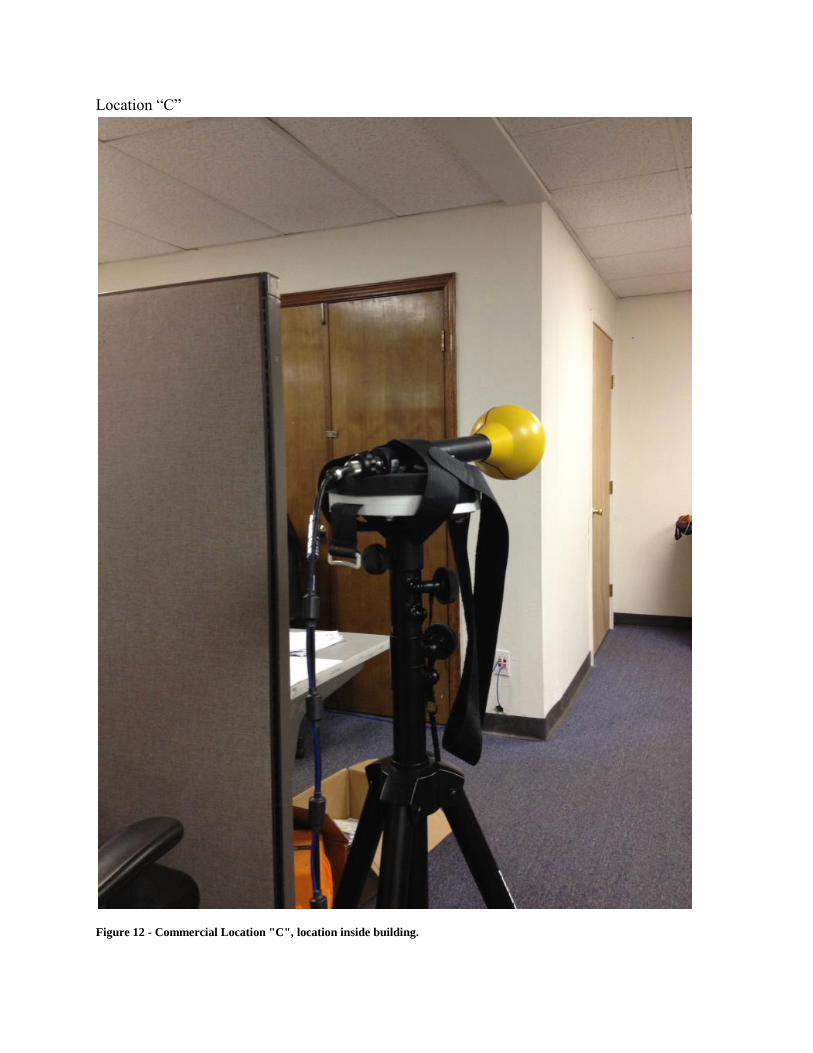
Location “C”
Figure 12 - Commercial Location "C", location inside building.
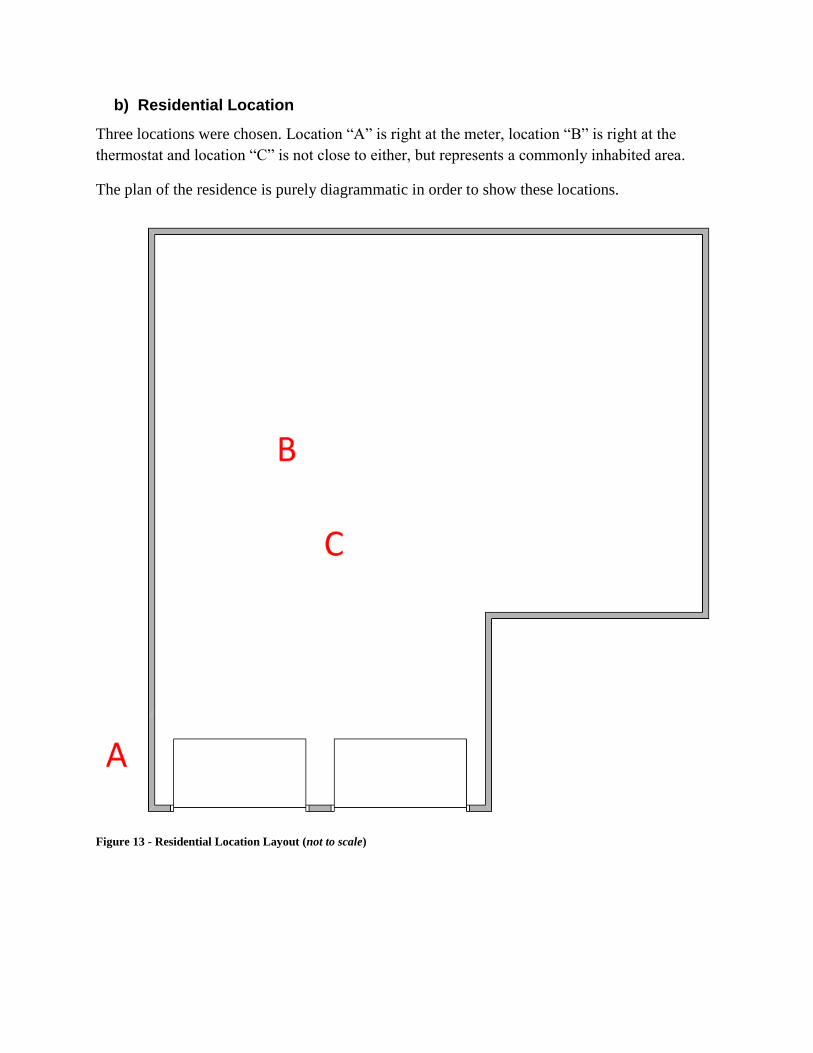
b) Residential Location
Three locations were chosen. Location “A” is right at the meter, location “B” is right at the
thermostat and location “C” is not close to either, but represents a commonly inhabited area.
The plan of the residence is purely diagrammatic in order to show these locations.
Figure 13 - Residential Location Layout (not to scale)

Residential Location Mode MPE Level (%) SRM-300 Mode
Ambient 900MHz level. Location “A” Normal Use Mode 0.013310011 AVERAGE 30m
Ambient 2.4GHz level. Location “A” Normal Use Mode 0.548829973 AVERAGE 30m
Ambient 2.4GHz level in Residence. Location “C” Thermostat Messages 0.542287451 AVERAGE 30m
At Thermostat, 2.4GHz scan. Location “B” Thermostat Messages 0.553820014 AVERAGE 30m
Ambient 900MHz level in Residence. Location “C” Meter Constant Traffic 0.015303323 AVERAGE 30m
At Meter, 900MHz scan. Location “A” Meter Constant Traffic 1.062999964 AVERAGE 30m
Figure 14 - Residential Location MPE levels
Using the FCC guidelines for exposure (% MPE, general population, FCC 47 CFR 1.1301-
1.1310), the ambient RF background is 0.013%, which is around 1.3 hundredths of one percent
in the 900MHz band. The ambient background is much higher in the 2.4GHz band in this
residential area, at around half of a percent, probably because of heavy use of Wi-Fi and cordless
phones in this particularly large residential neighborhood. Wireless routers most commonly
operate in the 2.4GHz band, although this is changing somewhat with migration to the 5.8GHz
band, driven by the demand for higher throughput.
As with the commercial test results, when the meter is active, we see a small increase in the
900MHz MPE level. A 2.4GHz increase was barely noticeable.
The 2.4GHz Band is a Crowded Band…
Many other devices operate in this 2.4GHz ISM band. ISM (Industrial Scientific and Medical)
bands were originally allocated and intended for just those applications. However, the main use
of these ISM bands in recent decades has been for communications, wireless internet, Wi-Fi,
cordless phones, etc. Microwave Ovens also operate in this 2.4GHz band. Some years ago, the
900MHz band was more popular than the 2.4GHz band, but there has been a migration to
2.4GHz and 5.8GHz, leaving the 900MHz band relatively quiet.
Since the 2.4GHz band is heavily used in populated areas and residential Wi-Fi is pervasive, it
was impossible to discern any HAN signal between the meter and the thermostat from the
ambient noise floor.

Residential Location Photographs
Location “C” was not photographed, for privacy reasons.
Figure 15 - Residential Location "B", at thermostat

Figure 16 - Residential Location “B”, close up of Thermostat during test

Figure 17 - Residential Location "A", Meter Front

Figure 18 - Residential Location "A", close up of Meter front during test

Figure 19 - Residential Location, collecting ambient levels

11. Comparative Results
a) Overall MPE results graph summary (logarithmic)
Figure 20 - Overall MPE results, logarithmic
A iPhone 4S Cell Phone @ 1cm [Good, 5-bar signal area]
B Microwave Oven @ 1cm heating 1 cup of water [like looking inside]
C Microwave Oven @ 1m [like standing in front]
D Commercial ambient 900MHz level
E Commercial ambient 2.4GHz level
F Commercial 2.4GHz level at Thermostat - Constant Messages
G Commercial 900MHz level at Meter - Constant Meter Reads
H Residential ambient 900MHz level
I Residential ambient 2.4GHz level
J Residential ambient 2.4GHz level in residence while sending thermostat messages
K Residential 2.4GHz level at Thermostat - Constant Messages
L Residential ambient 900MHz level in residence while constantly reading meter
M Residential 900MHz level at Meter - Constant Meter Reads
0.001
0.01
0.1
1
10
100
A B C D E F G H I J K L M
Ex
posu
re (
% M
PE
, g
ener
al
pop
ula
tion
, F
CC
47
CF
R 1
.13
01
-1.1
310
)
Measurement Location (See notes, below)
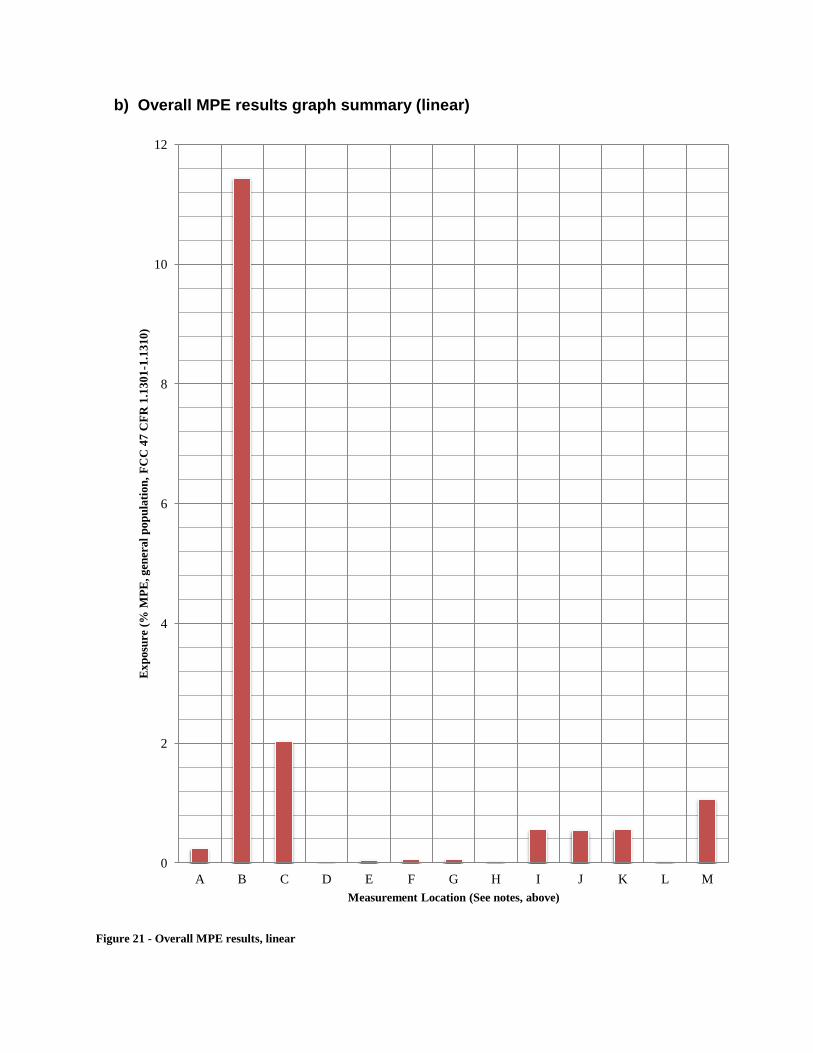
b) Overall MPE results graph summary (linear)
Figure 21 - Overall MPE results, linear
0
2
4
6
8
10
12
A B C D E F G H I J K L M
Ex
posu
re (
% M
PE
, g
ener
al
pop
ula
tion
, F
CC
47
CF
R 1
.13
01
-1.1
310
)
Measurement Location (See notes, above)

Logarithmic vs. Linear
To make the lowest and highest result values visible on the graph above, Figure 20, a logarithmic
(base 10) format for the y-axis was chosen. Each tick mark on the y-axis represents 10 times
more than the previous tick mark.
To turn the values into a more “real world” number format, we use a linear graph, as in Figure
21. The highest emission we measured in the overall results was 11.44% from the Microwave
Oven at 1 centimeter distance. In Figure 21, the y-axis is in a common linear number series,
with zero at the bottom and 12 at the top, to include the highest emission.
Figure 21 more clearly illustrates the level of emissions from AMI infrastructure compared to
emissions from cell phones, microwave ovens, etc, with most levels much smaller (with the
exception of the close-in tests) and some levels not visible due to their low magnitude.
12. Conclusions
Emissions from OG&E Smart Grid AMI infrastructure, even given worst case scenarios and
abnormally small detection distances, do not come anywhere close to approaching the FCC’s
Limit for Maximum Exposure.
Shown in these tests:
Emissions from OG&E Smart Grid and similar AMI meters, when active, are lower than
common background RF levels in every case except when measured in the near-field of
the meter antenna.
Near-field emissions from an active meter, in a “worst-case” scenario, were found to be
around 1.5% or less of the FCC’s Maximum Permissible Exposure limit for the general
public.
Emissions from HAN thermostats are barely detectable over common Wi-Fi router
interference when in a residential area.
Overall emissions from HAN and AMI network infrastructure are anywhere from 1,000
to 10,000 times less than the FCC’s Maximum Permissible Exposure limit for the general
public when measured in a building equipped with AMI infrastructure.

13. Other Resources
a) Technical References
FCC CFR Title 47, Volume 1, Section 1.1310 – Radiofrequency Radiation Exposure Limits.
FCC OET Bulletin 56, Fourth Edition – Questions and Answers about Biological Effects and
Potential Hazards of Radiofrequency and Electromagnetic Fields.
FCC OET Bulletin 65, Edition 97-01 – Evaluating Compliance with FCC Guidelines for Human
Exposure to Radiofrequency and Electromagnetic Fields.
IEEE C.95-1, 2005 – IEEE Standard for Safety Levels with Respect to Human Exposure to
Radio Frequency and Electromagnetic Fields, 3kHz to 300GHz.
Sensus – MPE Calculations for FlexNet Endpoint-Equipped Electric and Gas Meters.
Narda STS – A Practical Guide for Establishing an RF Safety Program.
b) Similar Reports
EMC Technologies AMI Meter Electromagnetic Field Survey, Document Number M110736, 20
October 2011.
Health Impacts of Radio Frequency from Smart Meters – California Council on Science and
Technology, January 2011.
Silver Spring Networks – Whitepaper: Radio Frequency Emissions, Analysis of Radio
Frequency Exposure Associated with Silver Spring Networks’ Advanced Metering Devices.
Edison Electric Institute – A discussion of Smart Meters and RF Exposure Issues, March 2011.

14. Equipment Certification & Calibration Information
All equipment used in the collection of RF emissions data for this report were both certified and
had valid current NIST traceable calibration.
The following pages contain the certificate images and sticker images from the actual equipment.
Narda calibration is valid for two (2) years from the date of calibration.

a) 3-Axis Antenna Calibration Documentation


b) Antenna Cable Calibration Documentation


c) SRM-3000 Selective Radiation Meter Calibration Documentation