RF Channel Characterization for 4G MIMO deployment
46
© CelPlan International, Inc. Proprietary Information Page 1 White Paper RF Channel Characterization for 4G MIMO deployment CelPlan International, Inc. February 2014
Transcript of RF Channel Characterization for 4G MIMO deployment
© CelPlan International, Inc. Proprietary Information Page 1
White Paper
RF Channel Characterization for 4G
MIMO deployment CelPlan International, Inc.
February 2014
© CelPlan International, Inc. Proprietary Information Page 2
RF Channel Characterization for 4G MIMO deployments
CelPlan® International, Inc.
February 2014 Data usage in wireless network is growing at an exponential rate, while revenues are growing linearly. Operators
have to maximize spectrum usage efficiency by increasing cell capacity.
OFDM and MIMO are two techniques adopted to increase network capacity. The efficient usage of these
techniques brought many challenges that require a deep understanding of the RF channel characteristics along the
network. The use of broadband channels (>5 MHz) exacerbated this issue.
Traditional measuring equipment provides some information about the received signal and limited or no
information about the RF channel.
Many RF channel characteristics required for a proper design have to be guessed by engineers, if considered at all.
This results that networks are build first and its performance evaluated after deployment and even then there are
no indications on how to fix them.
The main difficulty resides in that RF parameters depend on the environment and physical antenna system
configuration and vary for each network location.
Some of those additional parameters are listed below and should be measured/ predicted along the whole
network:
- Multipath spread at different threshold levels
- Average frequency fading and its variance
- Average time fading and its variance
- Noise floor and Interference
- Signal to Noise Ratio along the RF frame
- RF channel response along the frame
- Correlation between antennas
Information collected during a drive test may need to be analyzed deeply for some locations, but this only can be
done with another drive test under different conditions.
Traffic volume and physical information allocation at the moment of the measurement are important data for the
analysis of network issues. This becomes more important in 4G, where vendor algorithms and automatic
processes, like ICIC, take over the task of avoiding interference.
A new generation of equipment was required to perform this functionality: RF Spectrum and Channel Analyzers,
like CelPlan’s CellSpectrum™, provide all this information, allowing the design of extremely spectrum efficient
networks and consequently minimizing CAPEX and OPEX.
Framed OFDM transmitters, like WiMAX and LTE, provide an ideal platform to characterize the broadband RF
channel.
© CelPlan International, Inc. Proprietary Information Page 3
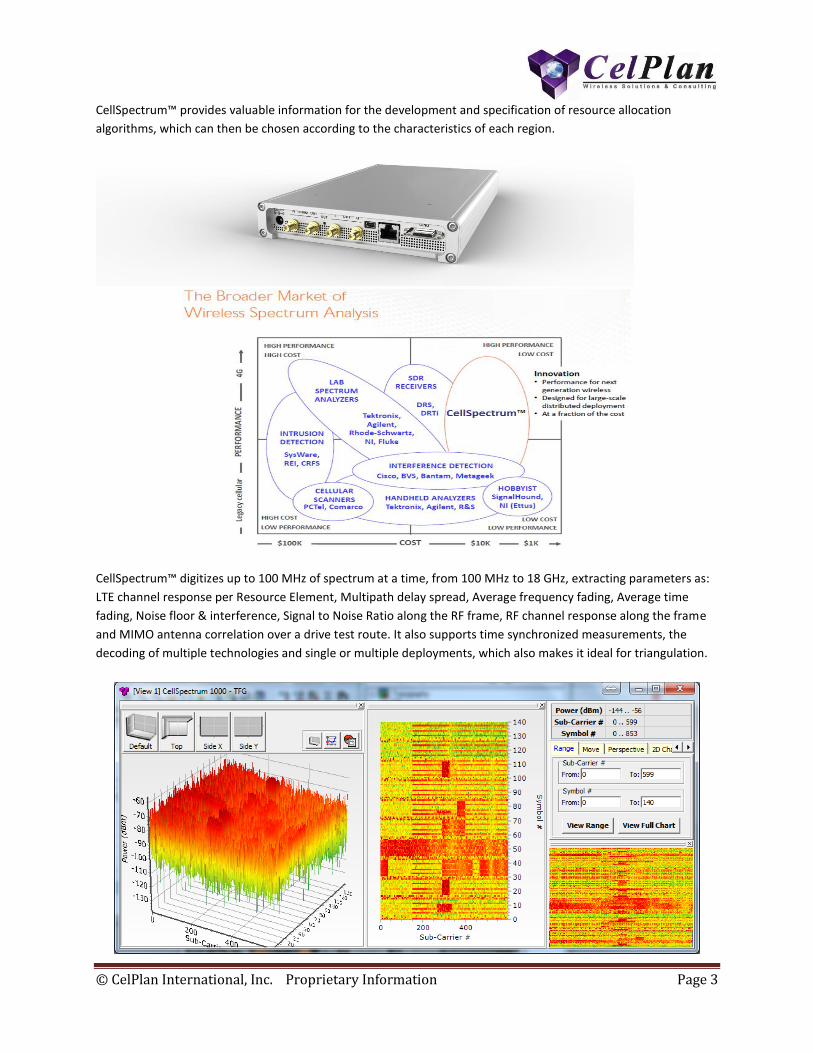
CellSpectrum™ provides valuable information for the development and specification of resource allocation
algorithms, which can then be chosen according to the characteristics of each region.
CellSpectrum™ digitizes up to 100 MHz of spectrum at a time, from 100 MHz to 18 GHz, extracting parameters as:
LTE channel response per Resource Element, Multipath delay spread, Average frequency fading, Average time
fading, Noise floor & interference, Signal to Noise Ratio along the RF frame, RF channel response along the frame
and MIMO antenna correlation over a drive test route. It also supports time synchronized measurements, the
decoding of multiple technologies and single or multiple deployments, which also makes it ideal for triangulation.
© CelPlan International, Inc. Proprietary Information Page 4
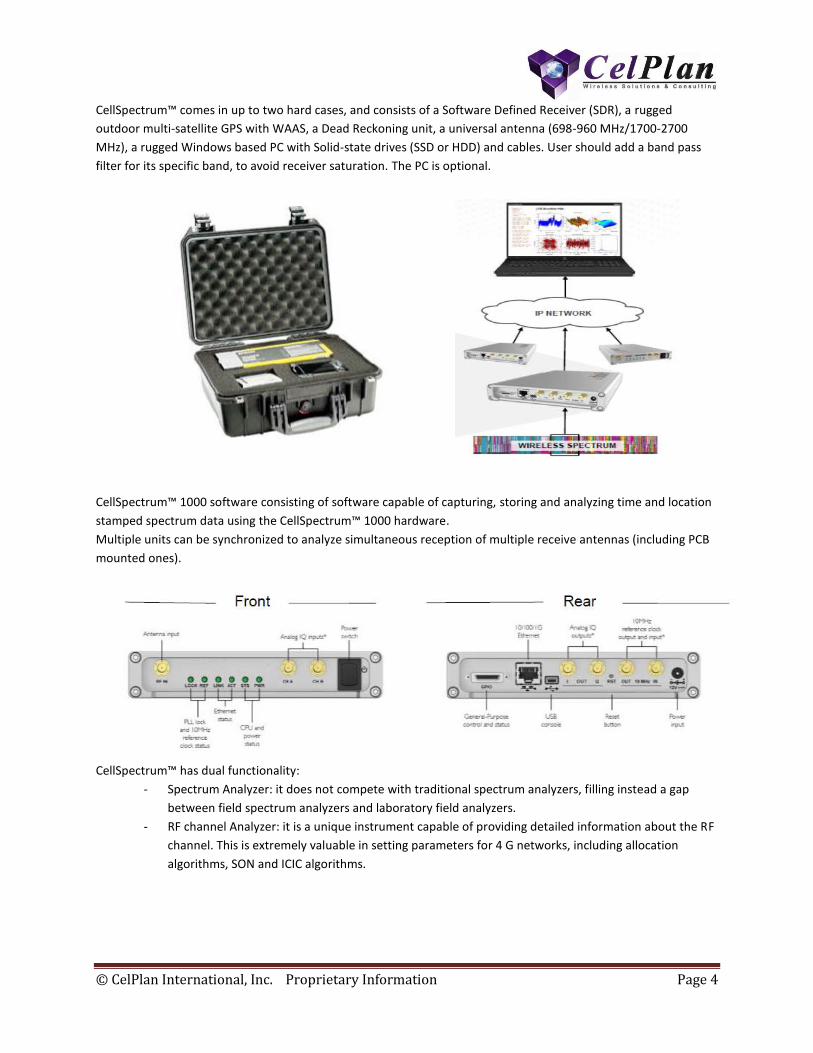
CellSpectrum™ comes in up to two hard cases, and consists of a Software Defined Receiver (SDR), a rugged
outdoor multi-satellite GPS with WAAS, a Dead Reckoning unit, a universal antenna (698-960 MHz/1700-2700
MHz), a rugged Windows based PC with Solid-state drives (SSD or HDD) and cables. User should add a band pass
filter for its specific band, to avoid receiver saturation. The PC is optional.
CellSpectrum™ 1000 software consisting of software capable of capturing, storing and analyzing time and location
stamped spectrum data using the CellSpectrum™ 1000 hardware.
Multiple units can be synchronized to analyze simultaneous reception of multiple receive antennas (including PCB
mounted ones).
CellSpectrum™ has dual functionality:
- Spectrum Analyzer: it does not compete with traditional spectrum analyzers, filling instead a gap
between field spectrum analyzers and laboratory field analyzers.
- RF channel Analyzer: it is a unique instrument capable of providing detailed information about the RF
channel. This is extremely valuable in setting parameters for 4 G networks, including allocation
algorithms, SON and ICIC algorithms.
© CelPlan International, Inc. Proprietary Information Page 5
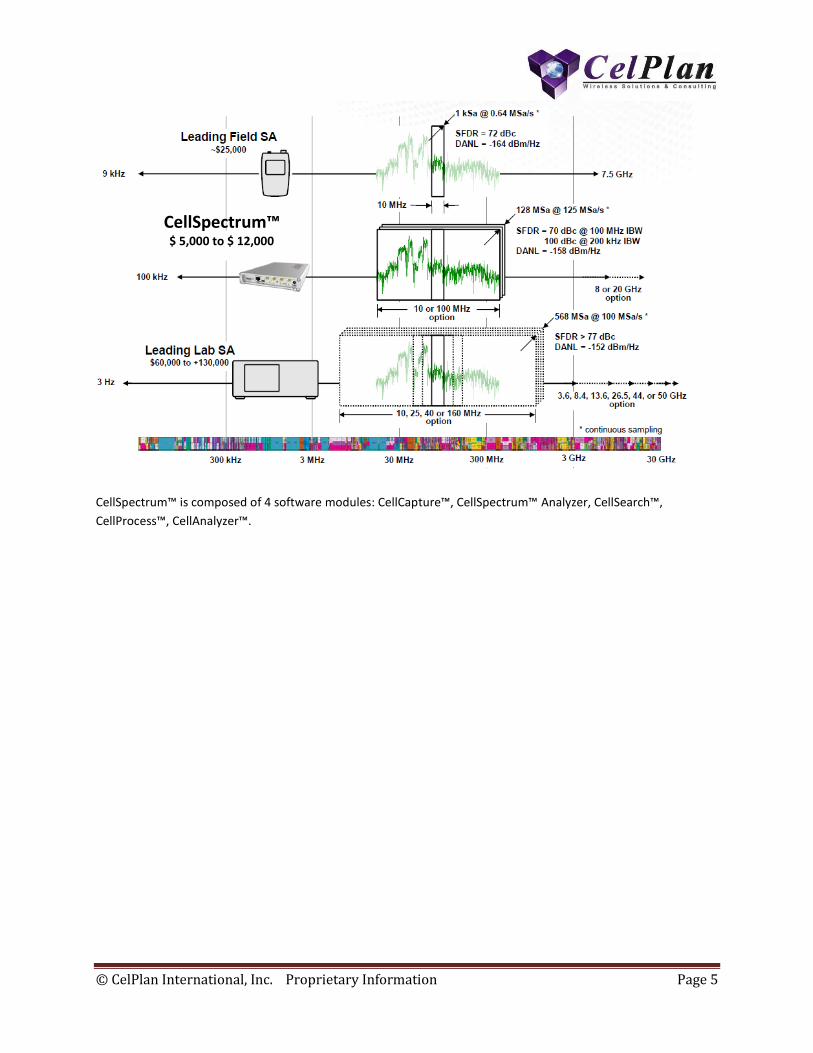
CellSpectrum™ is composed of 4 software modules: CellCapture™, CellSpectrum™ Analyzer, CellSearch™,
CellProcess™, CellAnalyzer™.
CellSpectrum™
$ 5,000 to $ 12,000
© CelPlan International, Inc. Proprietary Information Page 6
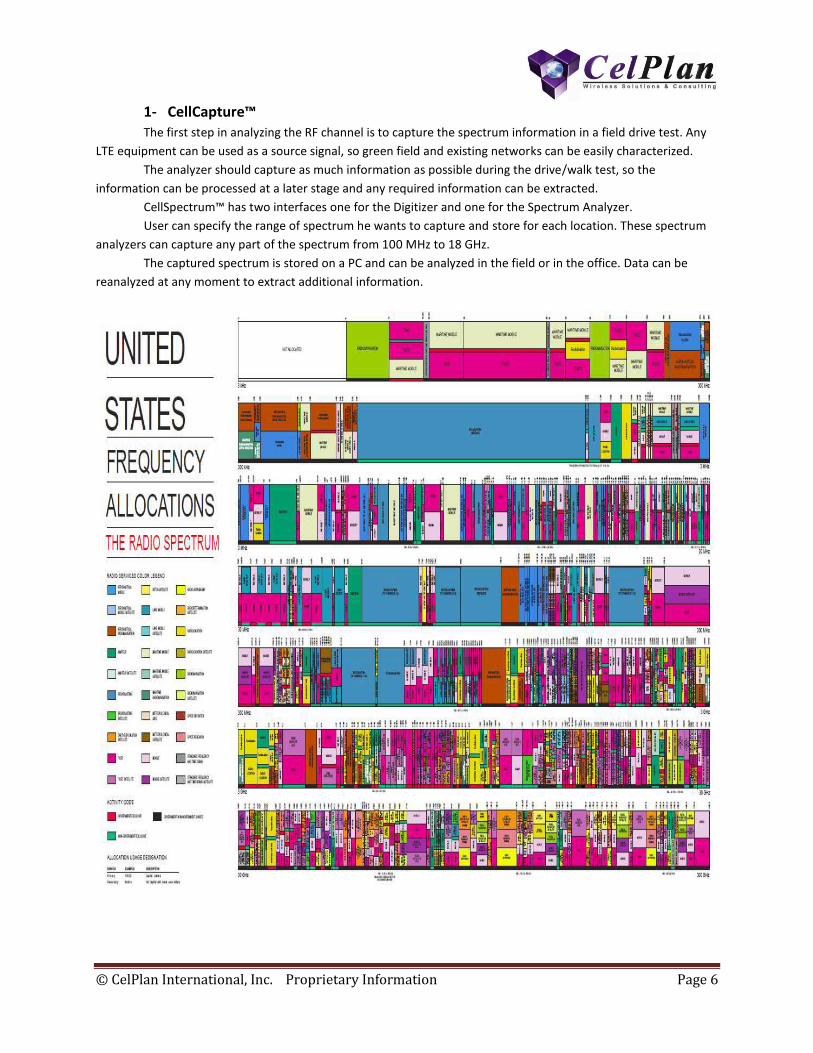
1- CellCapture™ The first step in analyzing the RF channel is to capture the spectrum information in a field drive test. Any
LTE equipment can be used as a source signal, so green field and existing networks can be easily characterized.
The analyzer should capture as much information as possible during the drive/walk test, so the
information can be processed at a later stage and any required information can be extracted.
CellSpectrum™ has two interfaces one for the Digitizer and one for the Spectrum Analyzer.
User can specify the range of spectrum he wants to capture and store for each location. These spectrum
analyzers can capture any part of the spectrum from 100 MHz to 18 GHz.
The captured spectrum is stored on a PC and can be analyzed in the field or in the office. Data can be
reanalyzed at any moment to extract additional information.
© CelPlan International, Inc. Proprietary Information Page 7
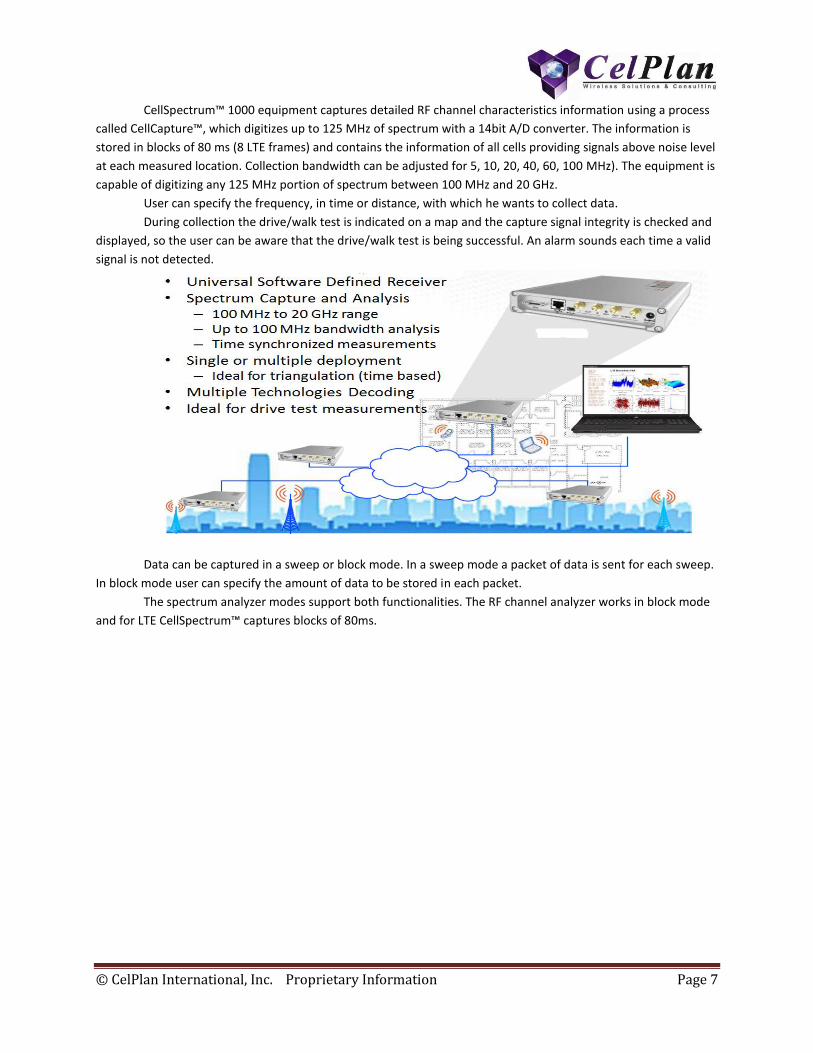
CellSpectrum™ 1000 equipment captures detailed RF channel characteristics information using a process
called CellCapture™, which digitizes up to 125 MHz of spectrum with a 14bit A/D converter. The information is
stored in blocks of 80 ms (8 LTE frames) and contains the information of all cells providing signals above noise level
at each measured location. Collection bandwidth can be adjusted for 5, 10, 20, 40, 60, 100 MHz). The equipment is
capable of digitizing any 125 MHz portion of spectrum between 100 MHz and 20 GHz.
User can specify the frequency, in time or distance, with which he wants to collect data.
During collection the drive/walk test is indicated on a map and the capture signal integrity is checked and
displayed, so the user can be aware that the drive/walk test is being successful. An alarm sounds each time a valid
signal is not detected.
Data can be captured in a sweep or block mode. In a sweep mode a packet of data is sent for each sweep.
In block mode user can specify the amount of data to be stored in each packet.
The spectrum analyzer modes support both functionalities. The RF channel analyzer works in block mode
and for LTE CellSpectrum™ captures blocks of 80ms.
© CelPlan International, Inc. Proprietary Information Page 8
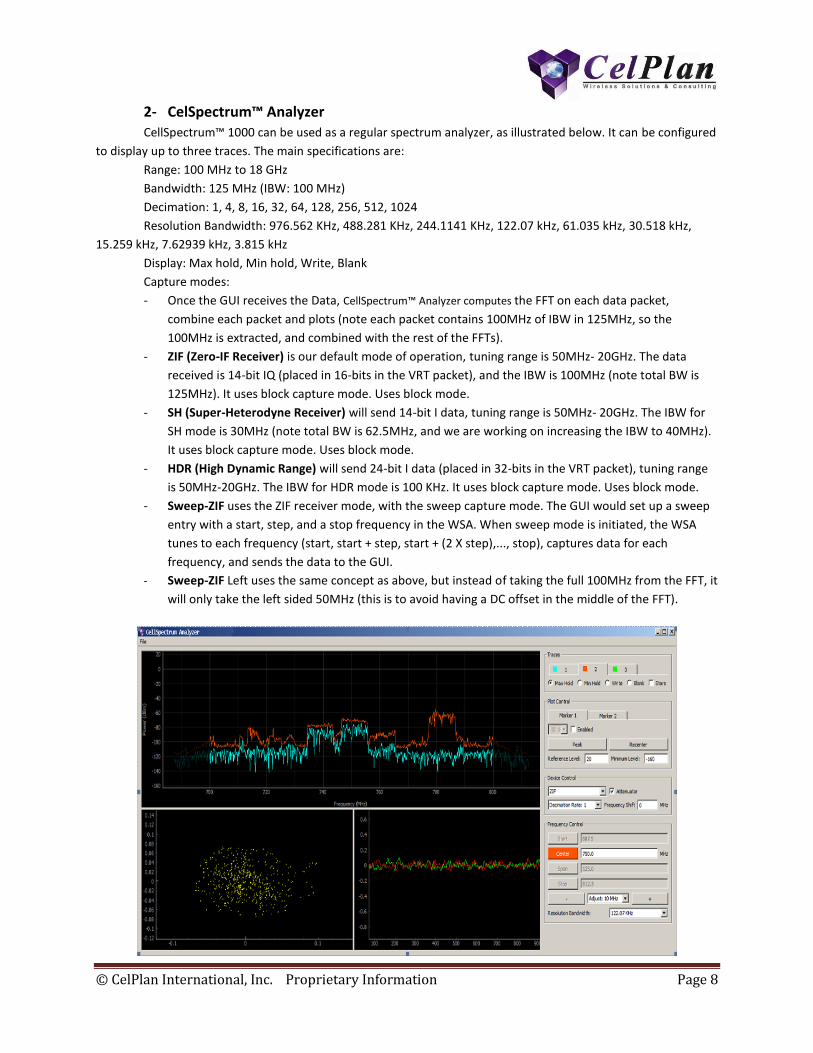
2- CelSpectrum™ Analyzer CellSpectrum™ 1000 can be used as a regular spectrum analyzer, as illustrated below. It can be configured
to display up to three traces. The main specifications are:
Range: 100 MHz to 18 GHz
Bandwidth: 125 MHz (IBW: 100 MHz)
Decimation: 1, 4, 8, 16, 32, 64, 128, 256, 512, 1024
Resolution Bandwidth: 976.562 KHz, 488.281 KHz, 244.1141 KHz, 122.07 kHz, 61.035 kHz, 30.518 kHz,
15.259 kHz, 7.62939 kHz, 3.815 kHz
Display: Max hold, Min hold, Write, Blank
Capture modes:
- Once the GUI receives the Data, CellSpectrum™ Analyzer computes the FFT on each data packet,
combine each packet and plots (note each packet contains 100MHz of IBW in 125MHz, so the
100MHz is extracted, and combined with the rest of the FFTs).
- ZIF (Zero-IF Receiver) is our default mode of operation, tuning range is 50MHz- 20GHz. The data
received is 14-bit IQ (placed in 16-bits in the VRT packet), and the IBW is 100MHz (note total BW is
125MHz). It uses block capture mode. Uses block mode.
- SH (Super-Heterodyne Receiver) will send 14-bit I data, tuning range is 50MHz- 20GHz. The IBW for
SH mode is 30MHz (note total BW is 62.5MHz, and we are working on increasing the IBW to 40MHz).
It uses block capture mode. Uses block mode.
- HDR (High Dynamic Range) will send 24-bit I data (placed in 32-bits in the VRT packet), tuning range
is 50MHz-20GHz. The IBW for HDR mode is 100 KHz. It uses block capture mode. Uses block mode.
- Sweep-ZIF uses the ZIF receiver mode, with the sweep capture mode. The GUI would set up a sweep
entry with a start, step, and a stop frequency in the WSA. When sweep mode is initiated, the WSA
tunes to each frequency (start, start + step, start + (2 X step),..., stop), captures data for each
frequency, and sends the data to the GUI.
- Sweep-ZIF Left uses the same concept as above, but instead of taking the full 100MHz from the FFT, it
will only take the left sided 50MHz (this is to avoid having a DC offset in the middle of the FFT).
© CelPlan International, Inc. Proprietary Information Page 9
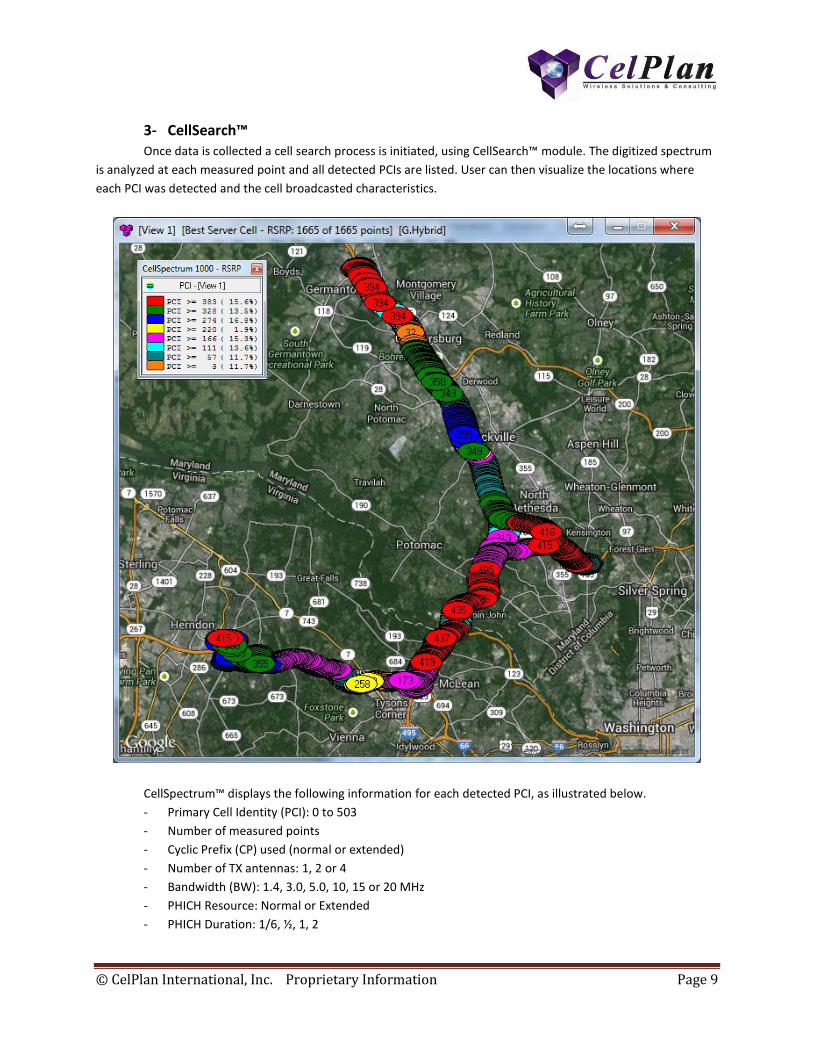
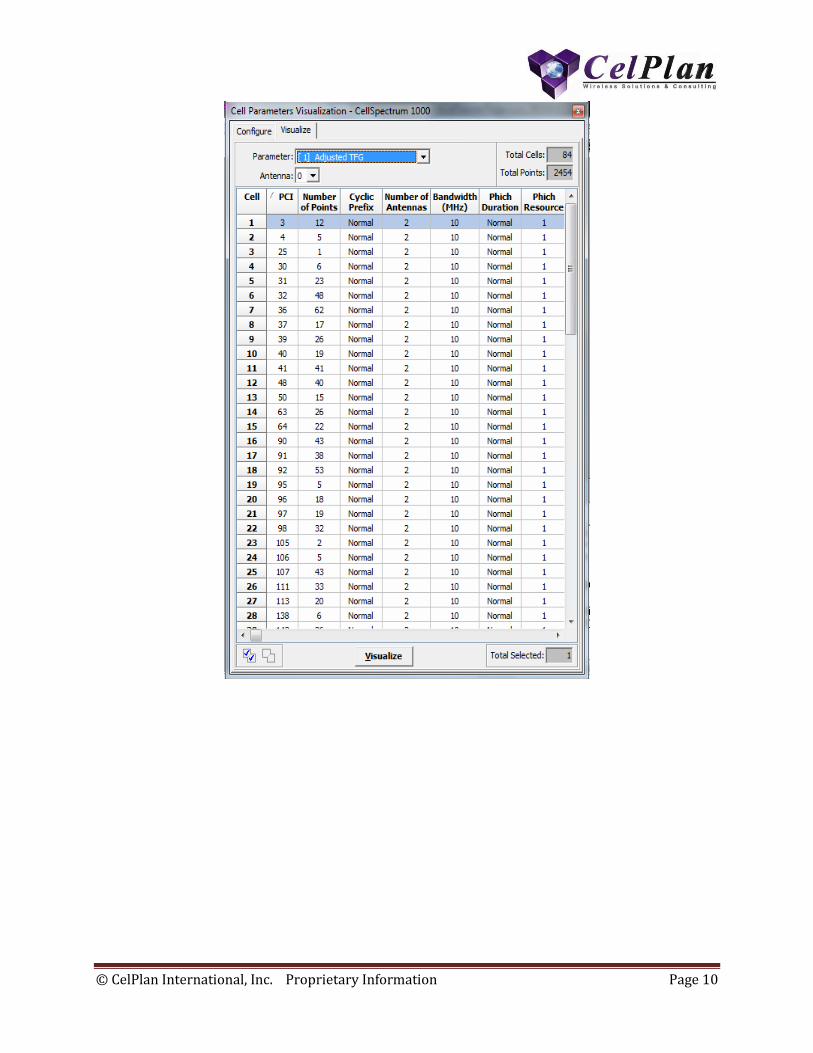
3- CellSearch™ Once data is collected a cell search process is initiated, using CellSearch™ module. The digitized spectrum
is analyzed at each measured point and all detected PCIs are listed. User can then visualize the locations where
each PCI was detected and the cell broadcasted characteristics.
CellSpectrum™ displays the following information for each detected PCI, as illustrated below.
- Primary Cell Identity (PCI): 0 to 503
- Number of measured points
- Cyclic Prefix (CP) used (normal or extended)
- Number of TX antennas: 1, 2 or 4
- Bandwidth (BW): 1.4, 3.0, 5.0, 10, 15 or 20 MHz
- PHICH Resource: Normal or Extended
- PHICH Duration: 1/6, ½, 1, 2
© CelPlan International, Inc. Proprietary Information Page 10
© CelPlan International, Inc. Proprietary Information Page 11
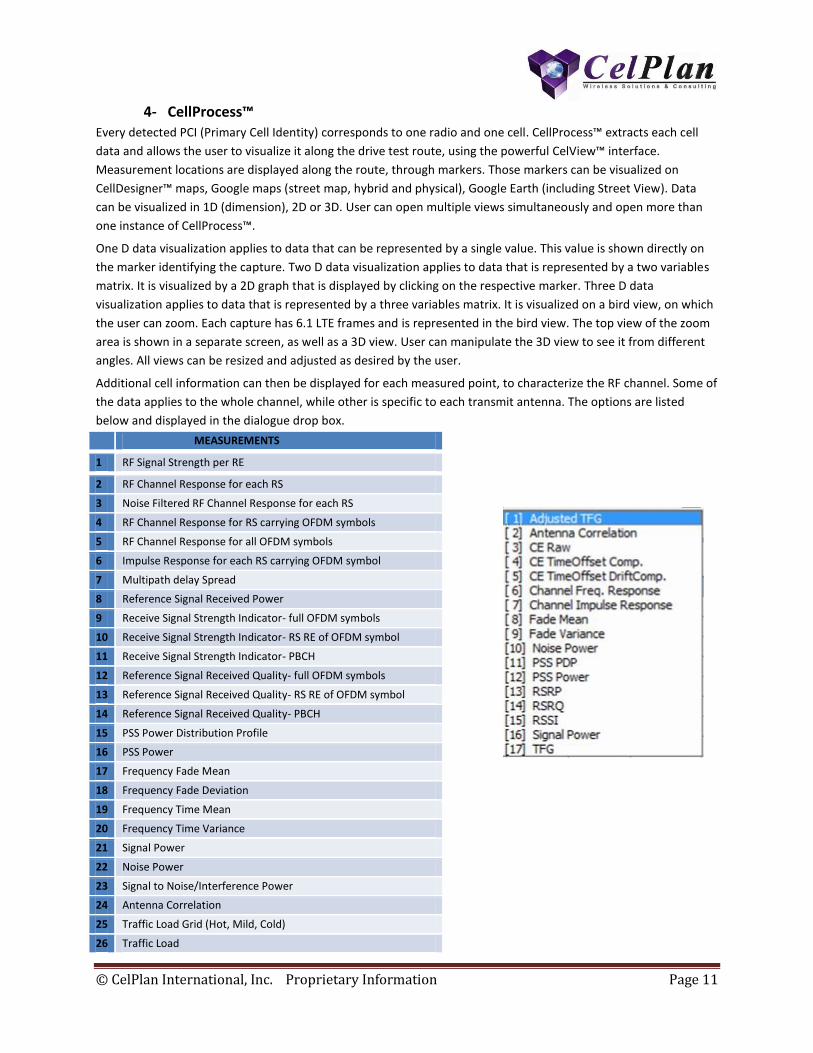
4- CellProcess™ Every detected PCI (Primary Cell Identity) corresponds to one radio and one cell. CellProcess™ extracts each cell
data and allows the user to visualize it along the drive test route, using the powerful CelView™ interface.
Measurement locations are displayed along the route, through markers. Those markers can be visualized on
CellDesigner™ maps, Google maps (street map, hybrid and physical), Google Earth (including Street View). Data
can be visualized in 1D (dimension), 2D or 3D. User can open multiple views simultaneously and open more than
one instance of CellProcess™.
One D data visualization applies to data that can be represented by a single value. This value is shown directly on
the marker identifying the capture. Two D data visualization applies to data that is represented by a two variables
matrix. It is visualized by a 2D graph that is displayed by clicking on the respective marker. Three D data
visualization applies to data that is represented by a three variables matrix. It is visualized on a bird view, on which
the user can zoom. Each capture has 6.1 LTE frames and is represented in the bird view. The top view of the zoom
area is shown in a separate screen, as well as a 3D view. User can manipulate the 3D view to see it from different
angles. All views can be resized and adjusted as desired by the user.
Additional cell information can then be displayed for each measured point, to characterize the RF channel. Some of
the data applies to the whole channel, while other is specific to each transmit antenna. The options are listed
below and displayed in the dialogue drop box.
MEASUREMENTS
1 RF Signal Strength per RE
2 RF Channel Response for each RS
3 Noise Filtered RF Channel Response for each RS
4 RF Channel Response for RS carrying OFDM symbols
5 RF Channel Response for all OFDM symbols
6 Impulse Response for each RS carrying OFDM symbol
7 Multipath delay Spread
8 Reference Signal Received Power
9 Receive Signal Strength Indicator- full OFDM symbols
10 Receive Signal Strength Indicator- RS RE of OFDM symbol
11 Receive Signal Strength Indicator- PBCH
12 Reference Signal Received Quality- full OFDM symbols
13 Reference Signal Received Quality- RS RE of OFDM symbol
14 Reference Signal Received Quality- PBCH
15 PSS Power Distribution Profile
16 PSS Power
17 Frequency Fade Mean
18 Frequency Fade Deviation
19 Frequency Time Mean
20 Frequency Time Variance
21 Signal Power
22 Noise Power
23 Signal to Noise/Interference Power
24 Antenna Correlation
25 Traffic Load Grid (Hot, Mild, Cold)
26 Traffic Load
© CelPlan International, Inc. Proprietary Information Page 12
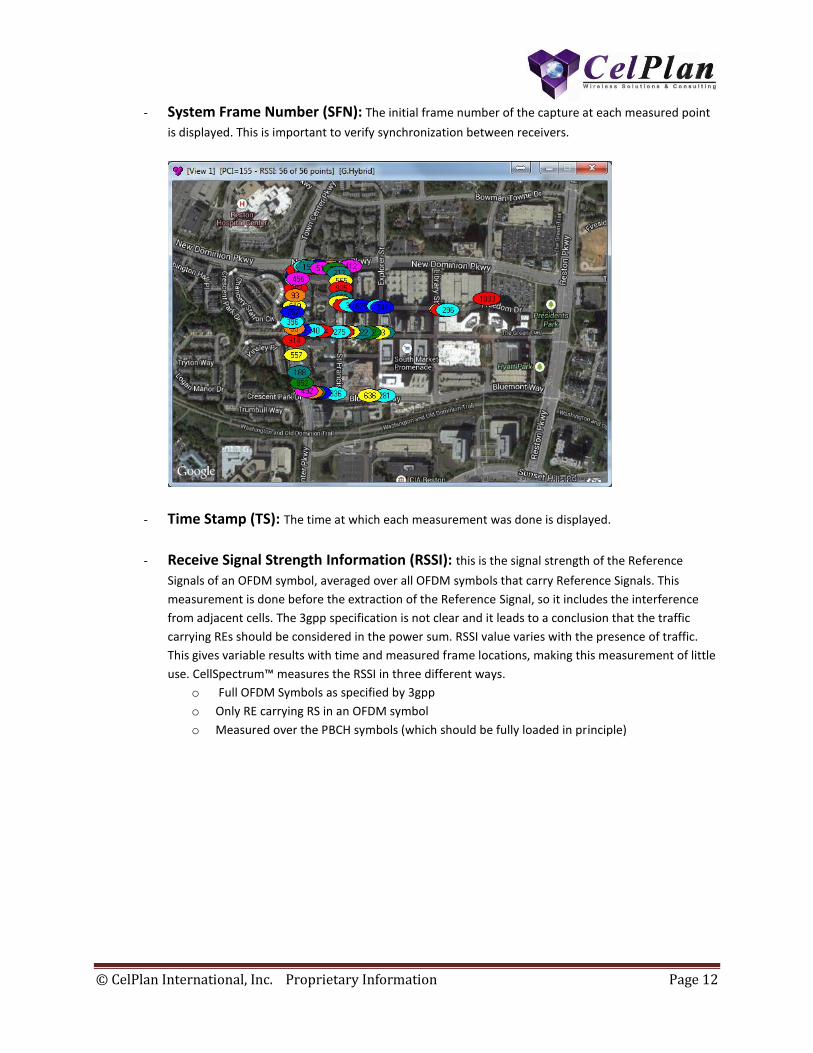
- System Frame Number (SFN): The initial frame number of the capture at each measured point
is displayed. This is important to verify synchronization between receivers.
- Time Stamp (TS): The time at which each measurement was done is displayed.
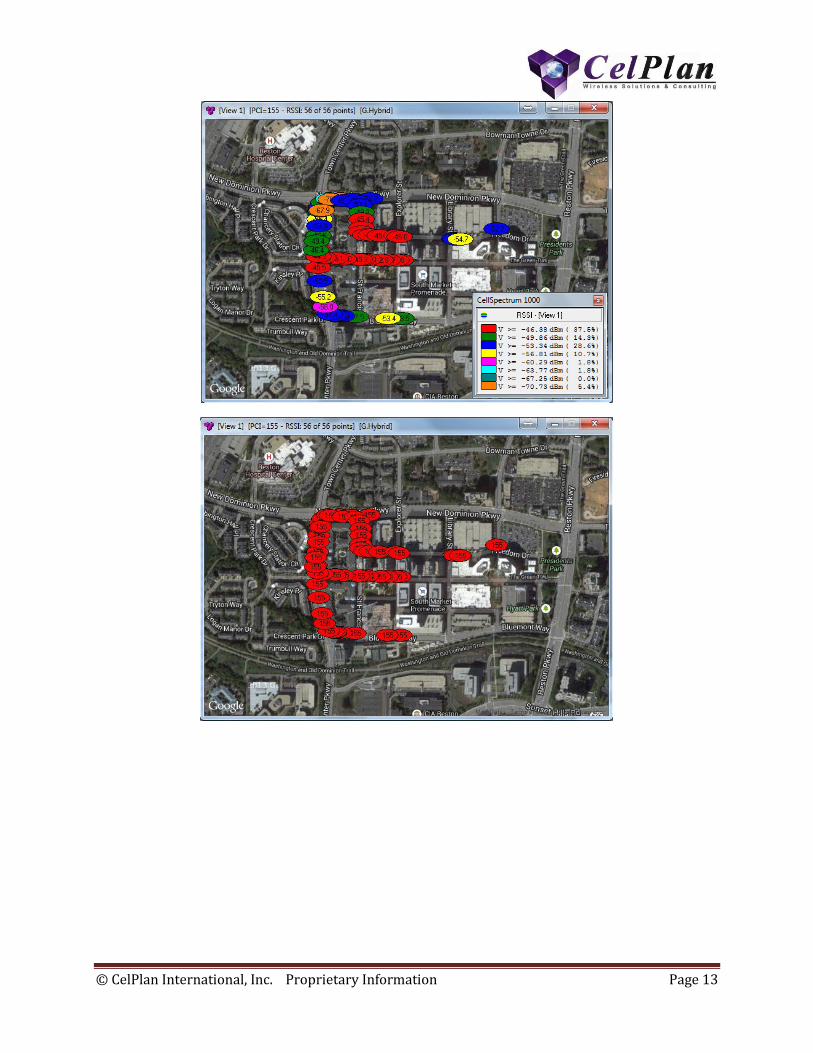
- Receive Signal Strength Information (RSSI): this is the signal strength of the Reference
Signals of an OFDM symbol, averaged over all OFDM symbols that carry Reference Signals. This
measurement is done before the extraction of the Reference Signal, so it includes the interference
from adjacent cells. The 3gpp specification is not clear and it leads to a conclusion that the traffic
carrying REs should be considered in the power sum. RSSI value varies with the presence of traffic.
This gives variable results with time and measured frame locations, making this measurement of little
use. CellSpectrum™ measures the RSSI in three different ways.
o Full OFDM Symbols as specified by 3gpp
o Only RE carrying RS in an OFDM symbol
o Measured over the PBCH symbols (which should be fully loaded in principle)
© CelPlan International, Inc. Proprietary Information Page 13
© CelPlan International, Inc. Proprietary Information Page 14
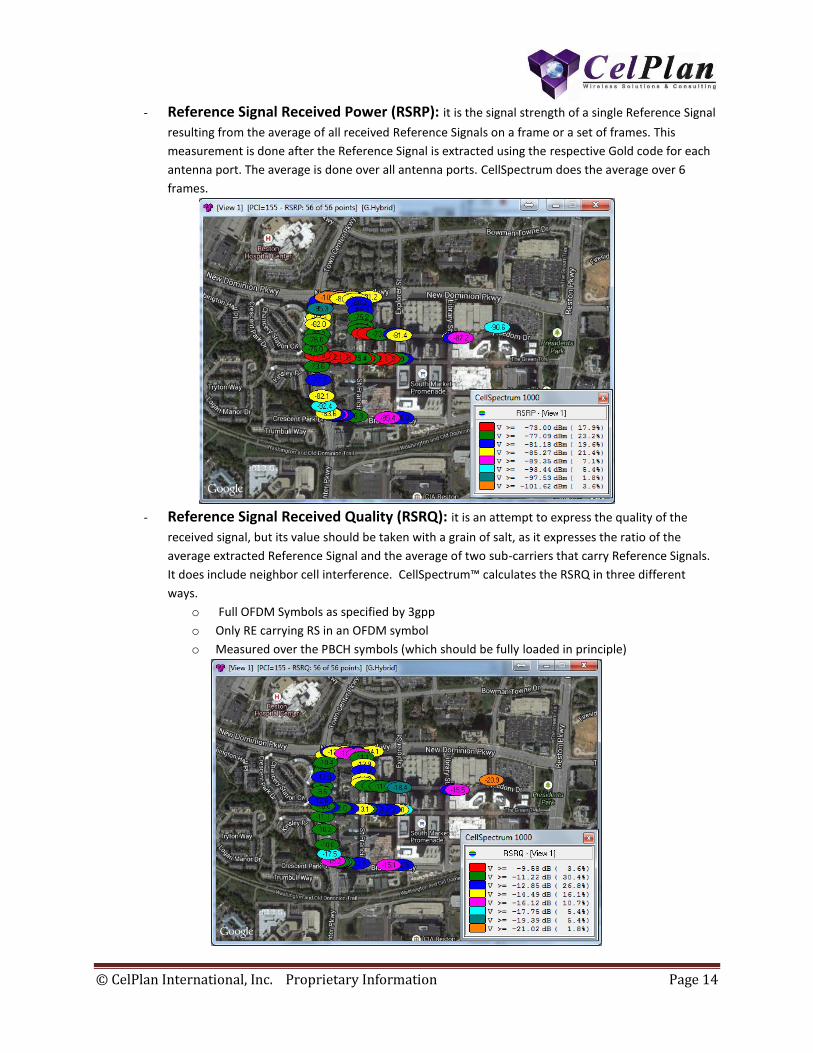
- Reference Signal Received Power (RSRP): it is the signal strength of a single Reference Signal
resulting from the average of all received Reference Signals on a frame or a set of frames. This
measurement is done after the Reference Signal is extracted using the respective Gold code for each
antenna port. The average is done over all antenna ports. CellSpectrum does the average over 6
frames.
- Reference Signal Received Quality (RSRQ): it is an attempt to express the quality of the
received signal, but its value should be taken with a grain of salt, as it expresses the ratio of the
average extracted Reference Signal and the average of two sub-carriers that carry Reference Signals.
It does include neighbor cell interference. CellSpectrum™ calculates the RSRQ in three different
ways.
o Full OFDM Symbols as specified by 3gpp
o Only RE carrying RS in an OFDM symbol
o Measured over the PBCH symbols (which should be fully loaded in principle)
© CelPlan International, Inc. Proprietary Information Page 15
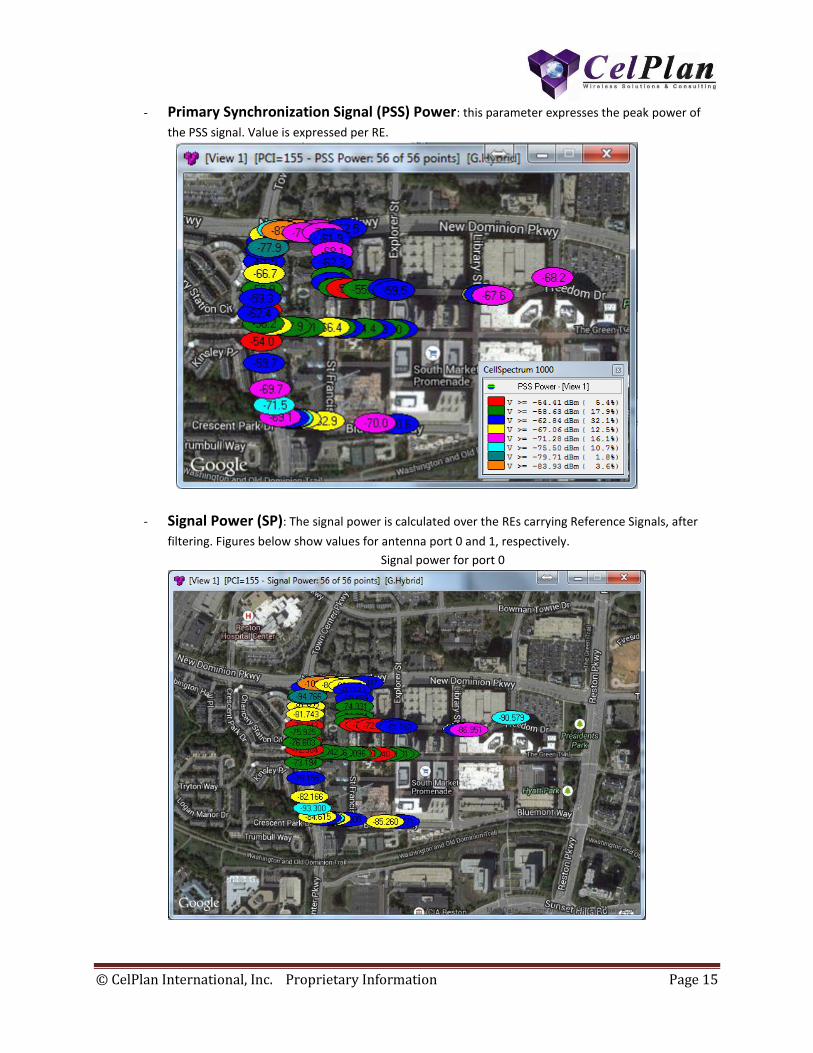
- Primary Synchronization Signal (PSS) Power: this parameter expresses the peak power of
the PSS signal. Value is expressed per RE.
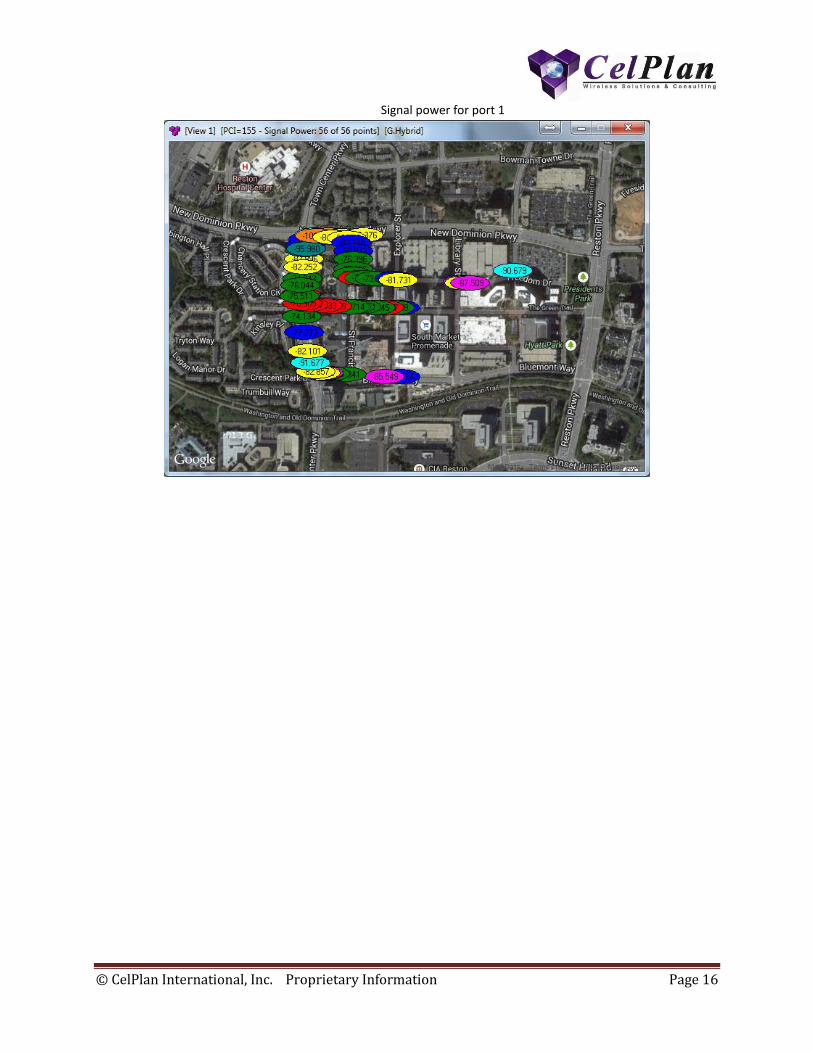
- Signal Power (SP): The signal power is calculated over the REs carrying Reference Signals, after
filtering. Figures below show values for antenna port 0 and 1, respectively.
Signal power for port 0
© CelPlan International, Inc. Proprietary Information Page 16
Signal power for port 1
© CelPlan International, Inc. Proprietary Information Page 17
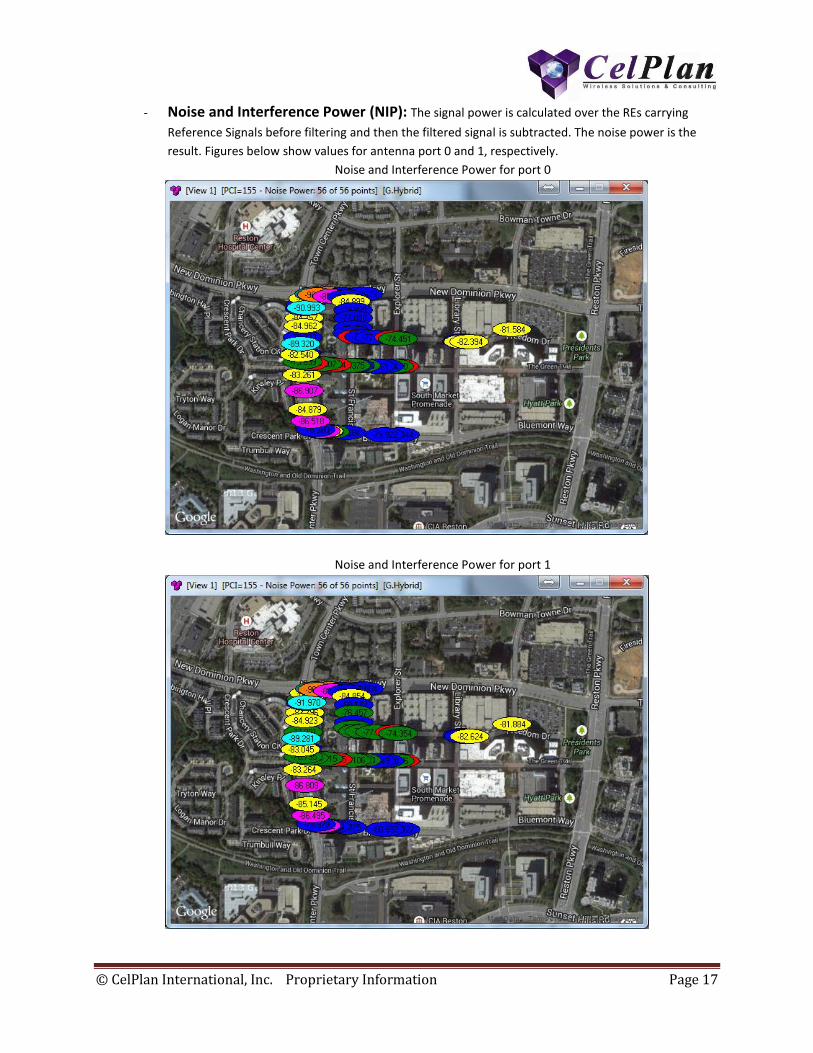
- Noise and Interference Power (NIP): The signal power is calculated over the REs carrying
Reference Signals before filtering and then the filtered signal is subtracted. The noise power is the
result. Figures below show values for antenna port 0 and 1, respectively.
Noise and Interference Power for port 0
Noise and Interference Power for port 1
© CelPlan International, Inc. Proprietary Information Page 18
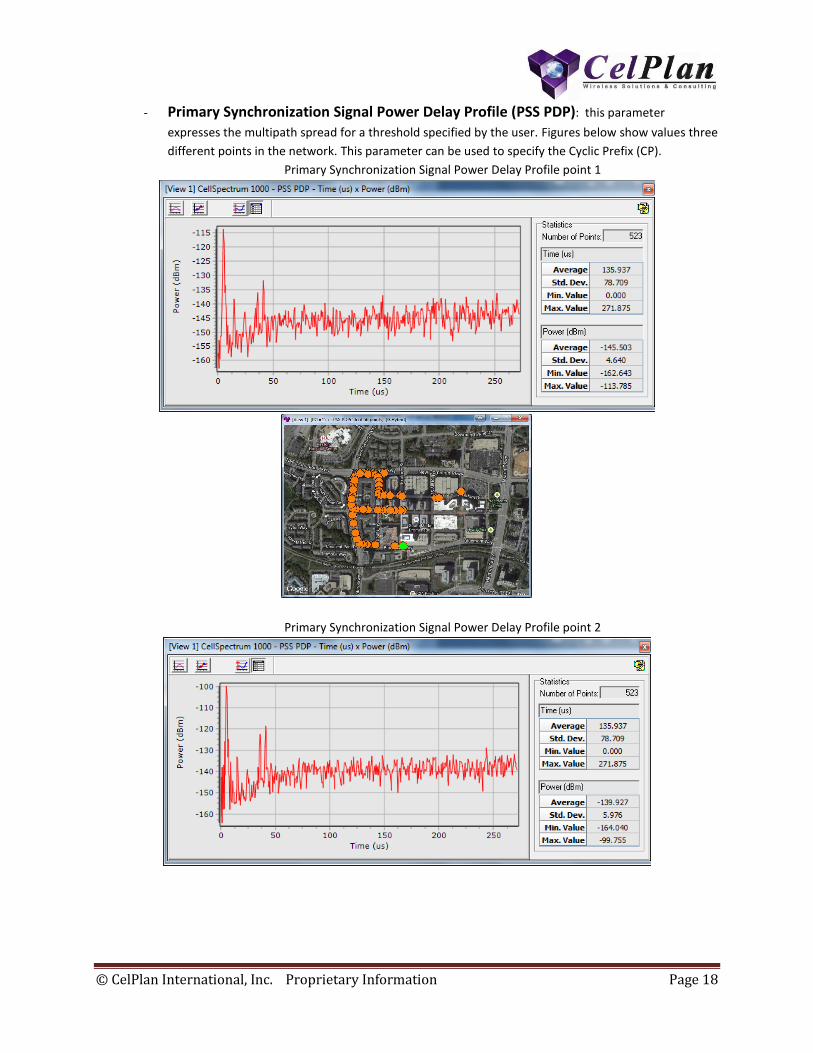
- Primary Synchronization Signal Power Delay Profile (PSS PDP): this parameter
expresses the multipath spread for a threshold specified by the user. Figures below show values three
different points in the network. This parameter can be used to specify the Cyclic Prefix (CP).
Primary Synchronization Signal Power Delay Profile point 1
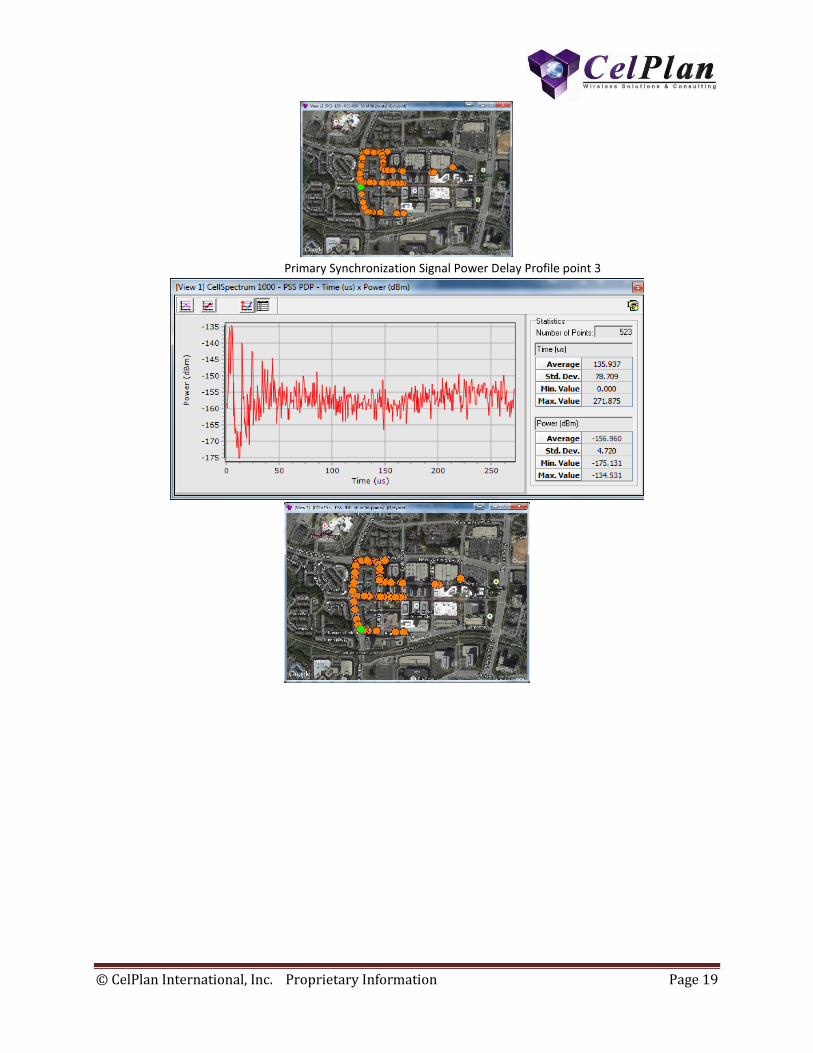
Primary Synchronization Signal Power Delay Profile point 2
© CelPlan International, Inc. Proprietary Information Page 19
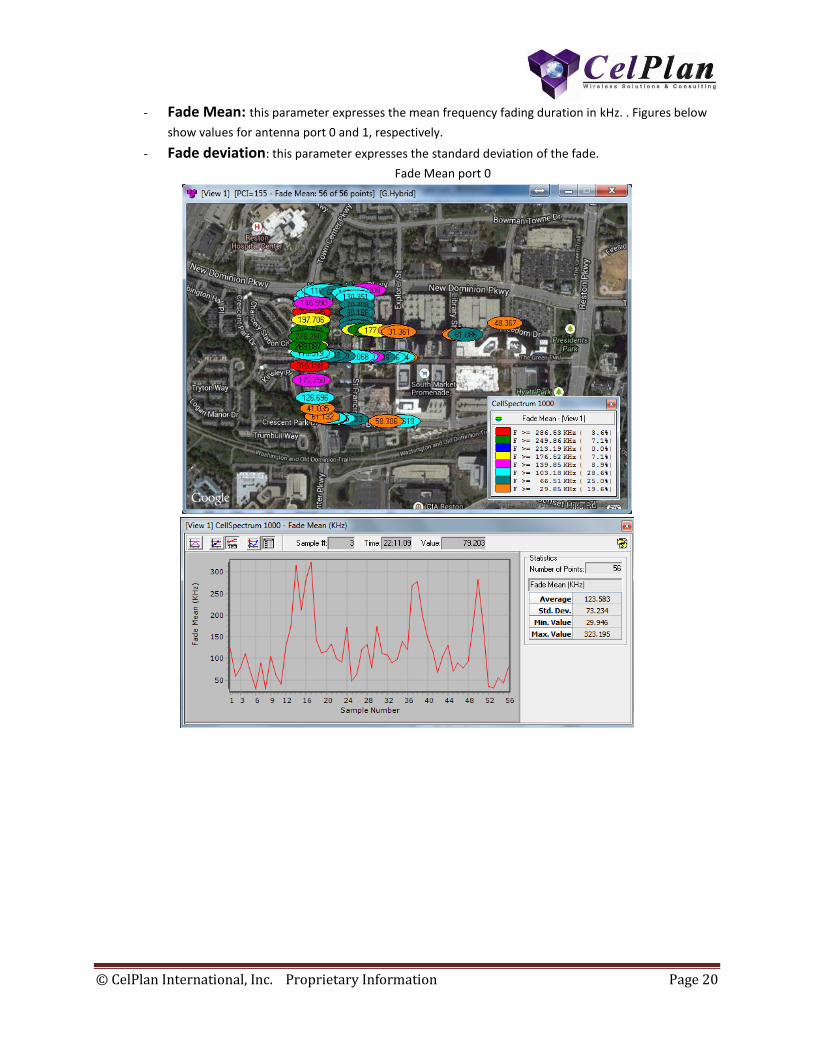
Primary Synchronization Signal Power Delay Profile point 3
© CelPlan International, Inc. Proprietary Information Page 20
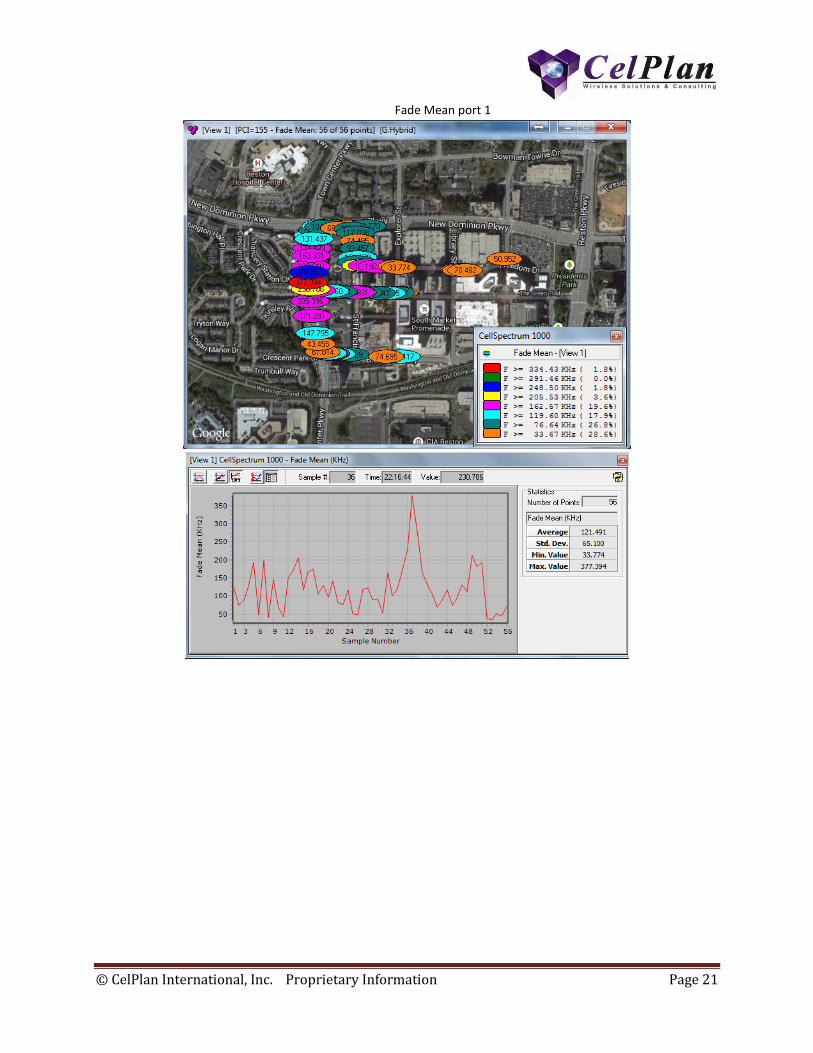
- Fade Mean: this parameter expresses the mean frequency fading duration in kHz. . Figures below
show values for antenna port 0 and 1, respectively.
- Fade deviation: this parameter expresses the standard deviation of the fade.
Fade Mean port 0
© CelPlan International, Inc. Proprietary Information Page 21
Fade Mean port 1
© CelPlan International, Inc. Proprietary Information Page 22
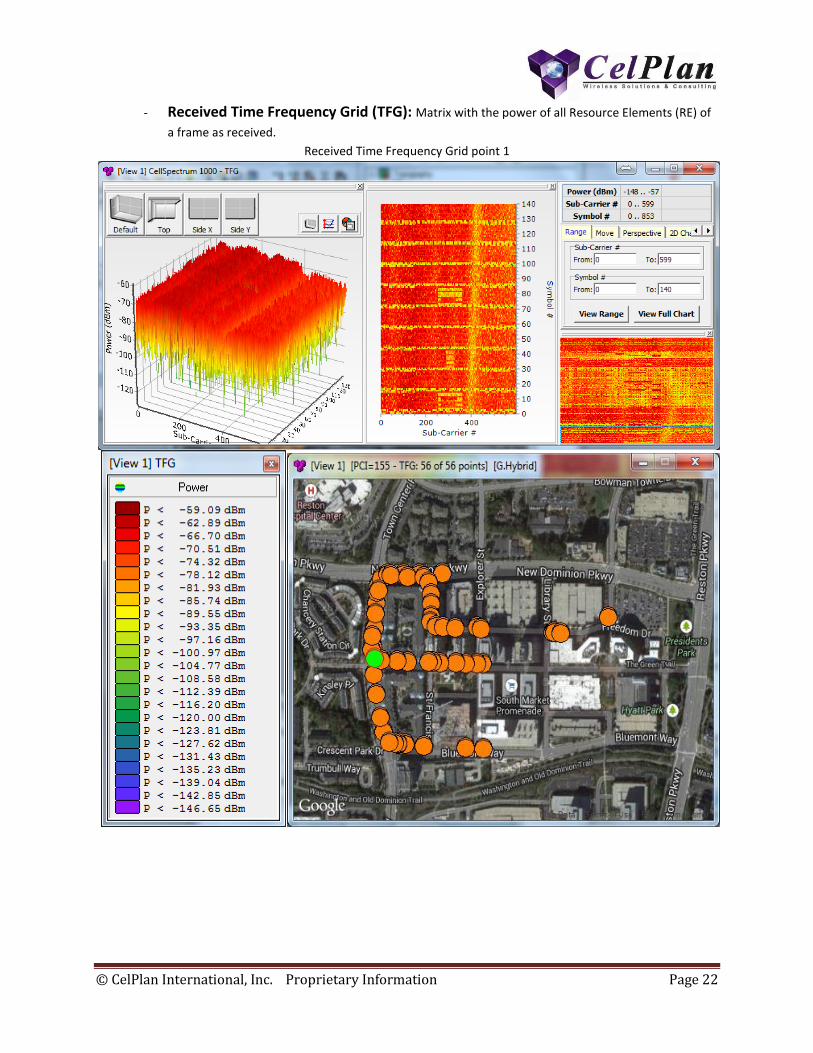
- Received Time Frequency Grid (TFG): Matrix with the power of all Resource Elements (RE) of
a frame as received.
Received Time Frequency Grid point 1
© CelPlan International, Inc. Proprietary Information Page 23
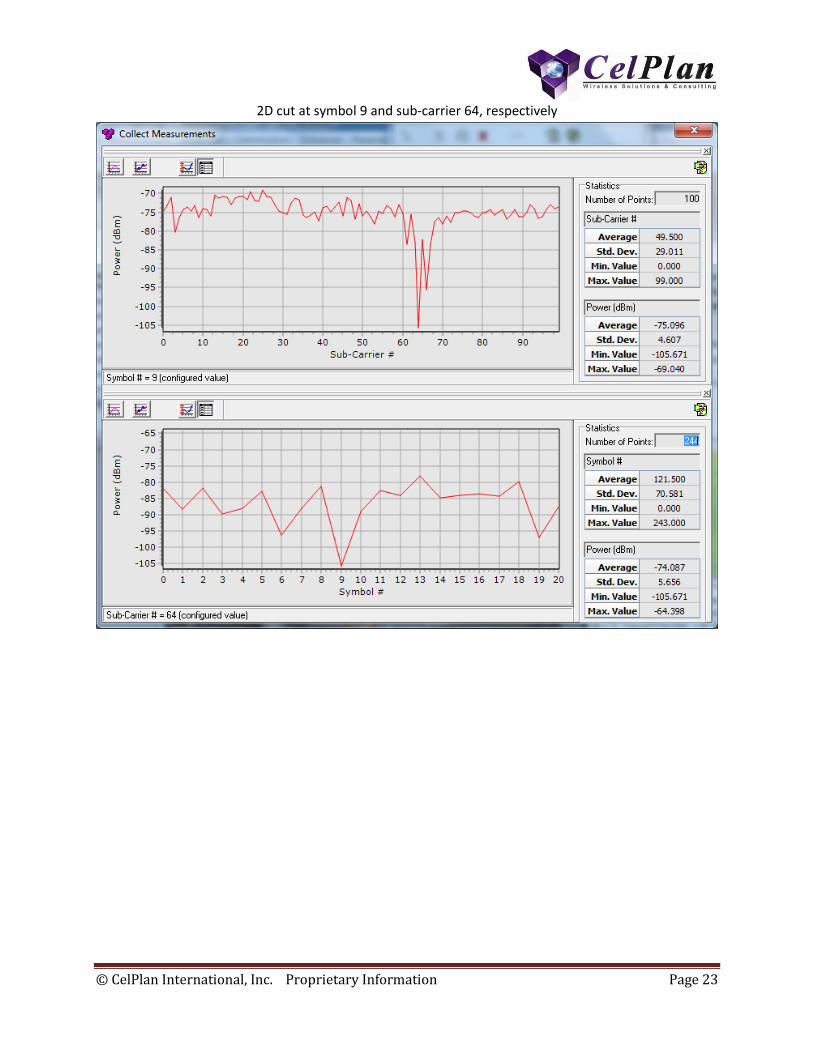
2D cut at symbol 9 and sub-carrier 64, respectively
© CelPlan International, Inc. Proprietary Information Page 24
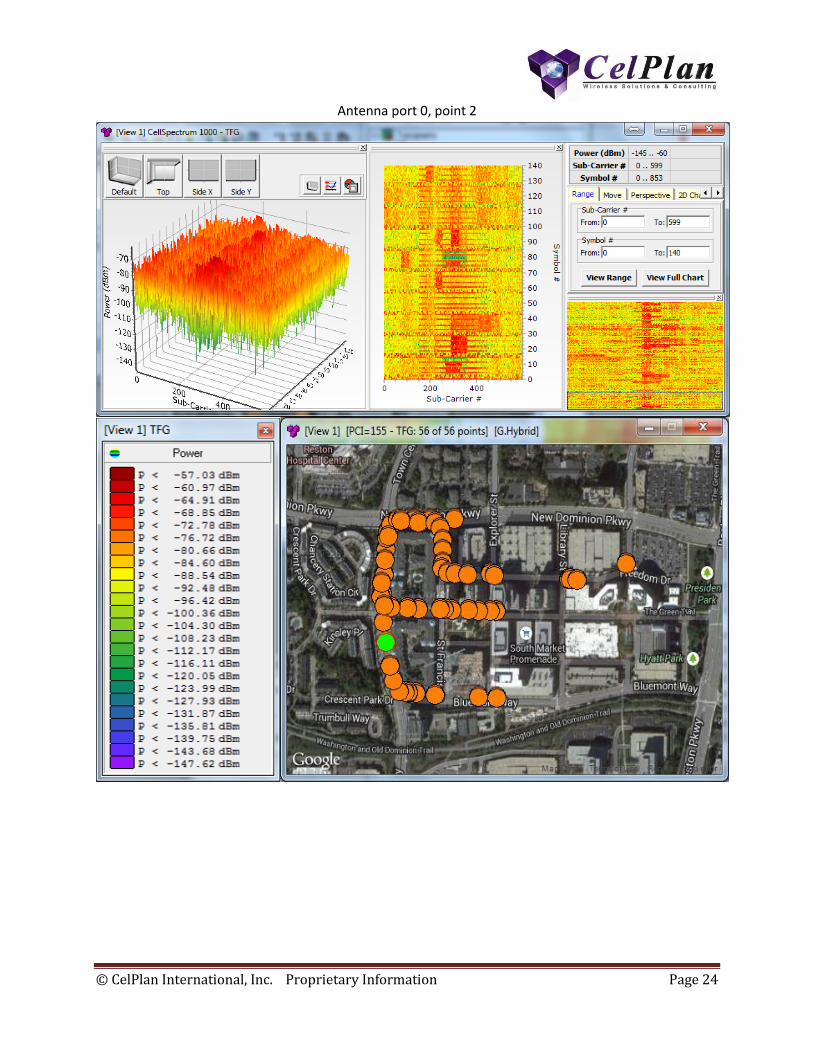
Antenna port 0, point 2
© CelPlan International, Inc. Proprietary Information Page 25
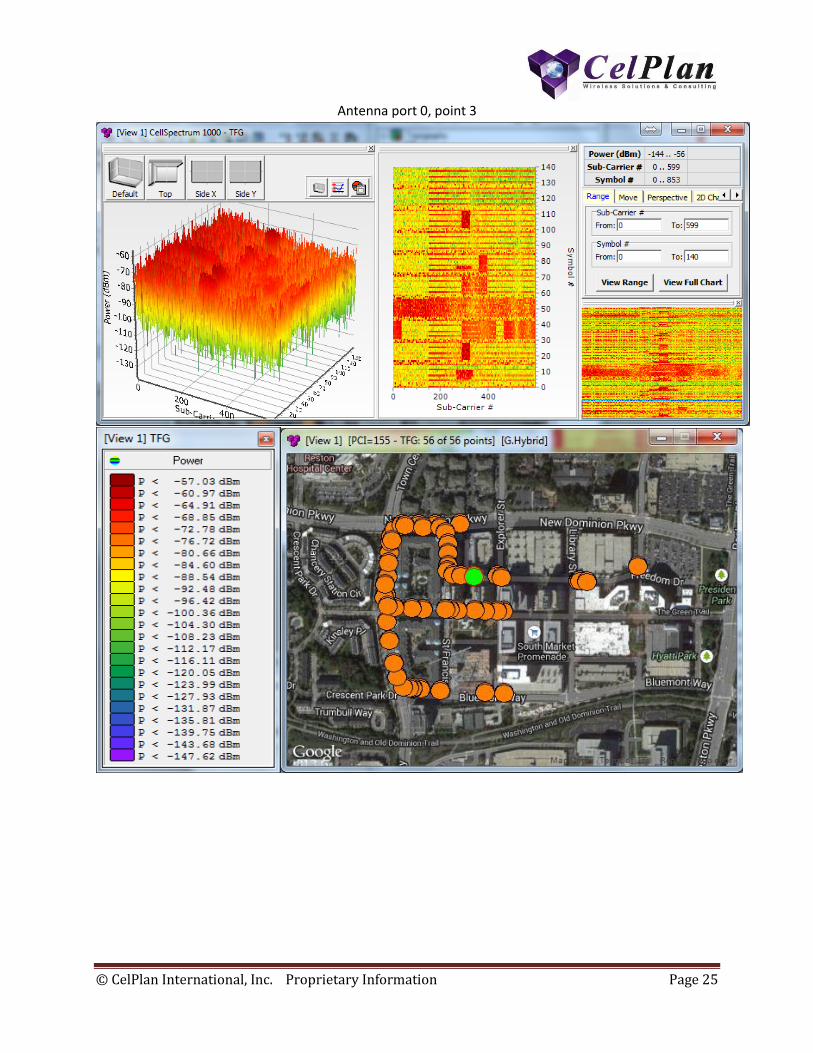
Antenna port 0, point 3
© CelPlan International, Inc. Proprietary Information Page 26
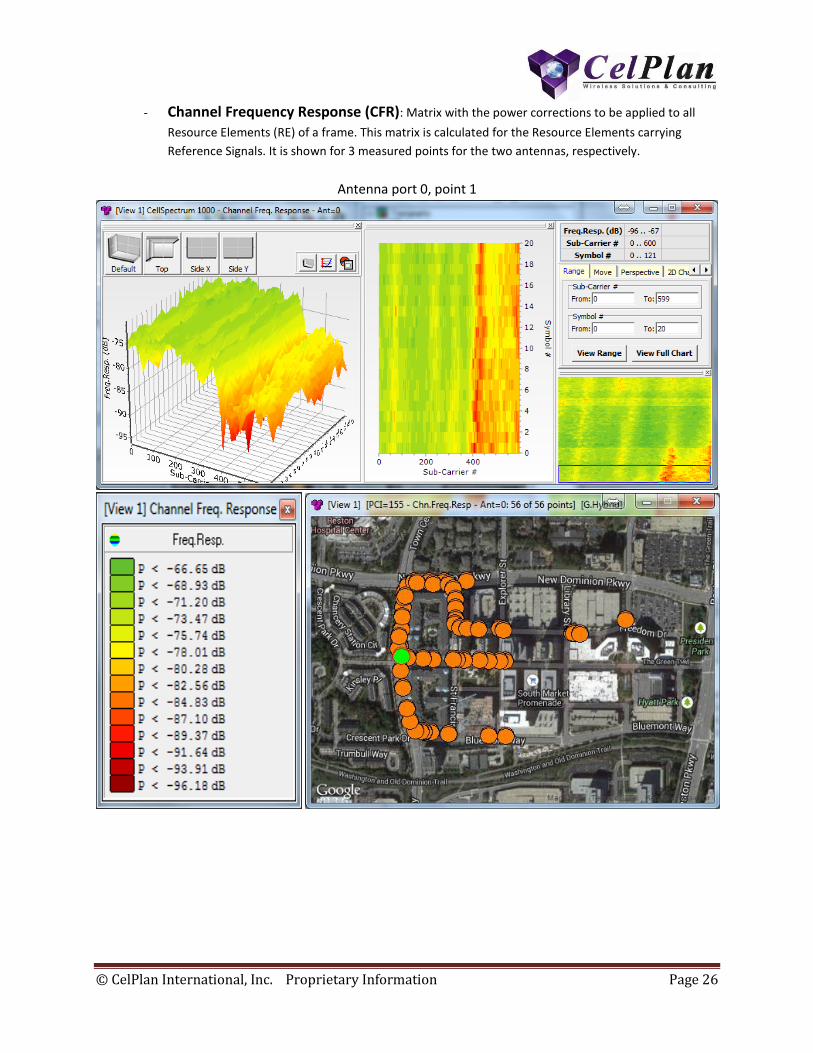
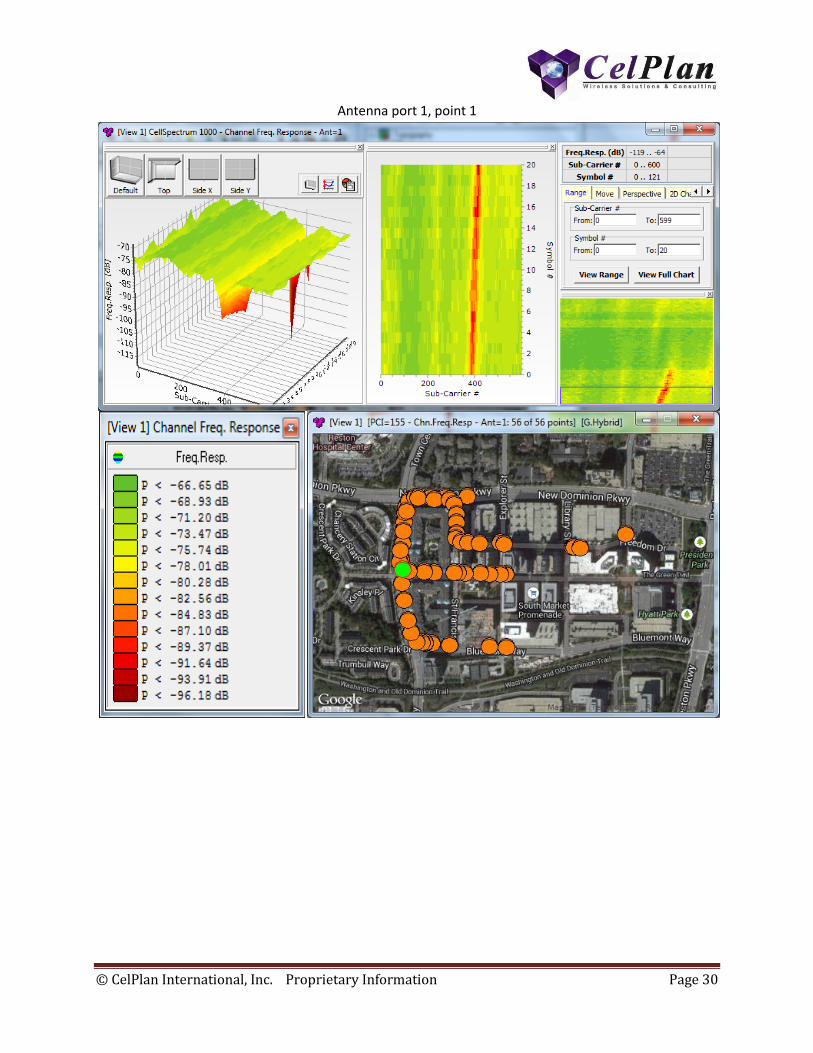
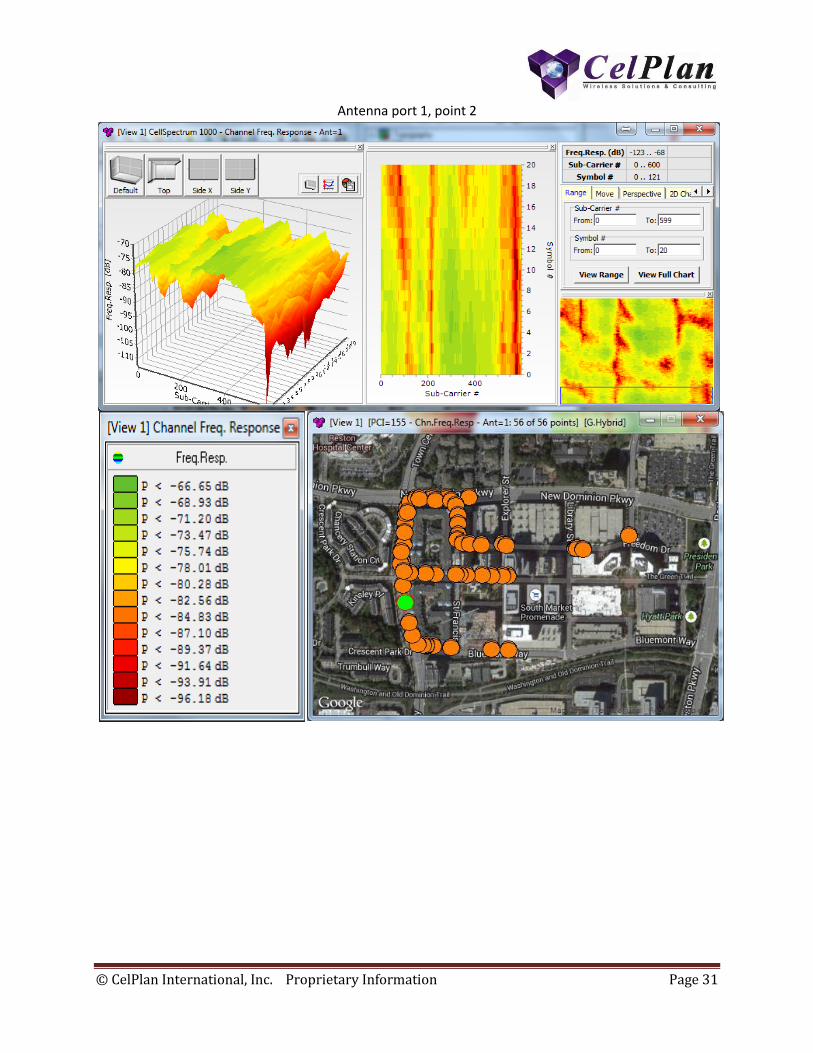
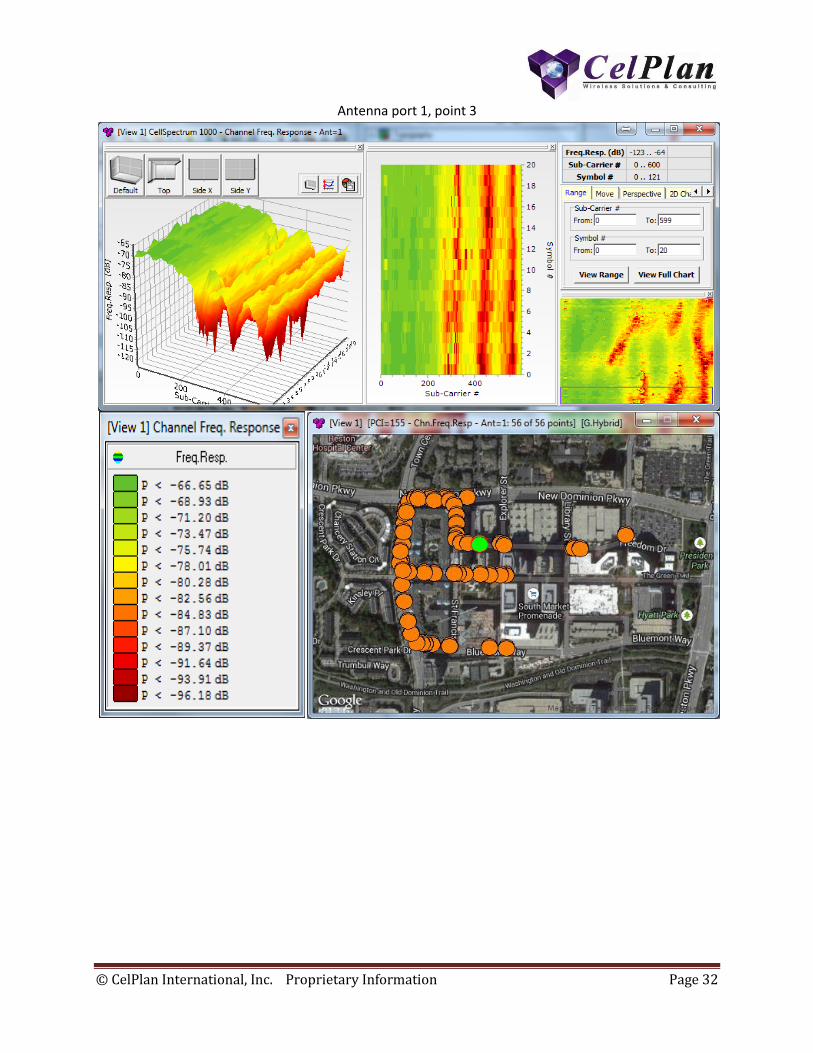
- Channel Frequency Response (CFR): Matrix with the power corrections to be applied to all
Resource Elements (RE) of a frame. This matrix is calculated for the Resource Elements carrying
Reference Signals. It is shown for 3 measured points for the two antennas, respectively.
Antenna port 0, point 1
© CelPlan International, Inc. Proprietary Information Page 27
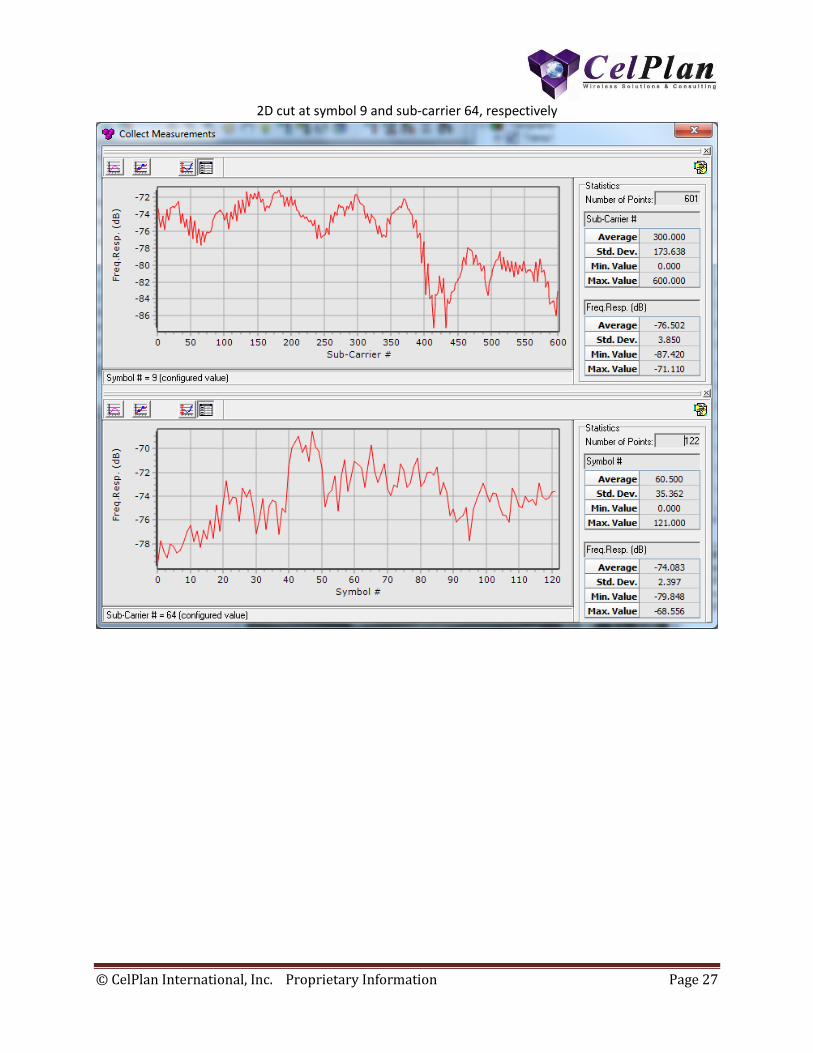
2D cut at symbol 9 and sub-carrier 64, respectively
© CelPlan International, Inc. Proprietary Information Page 28
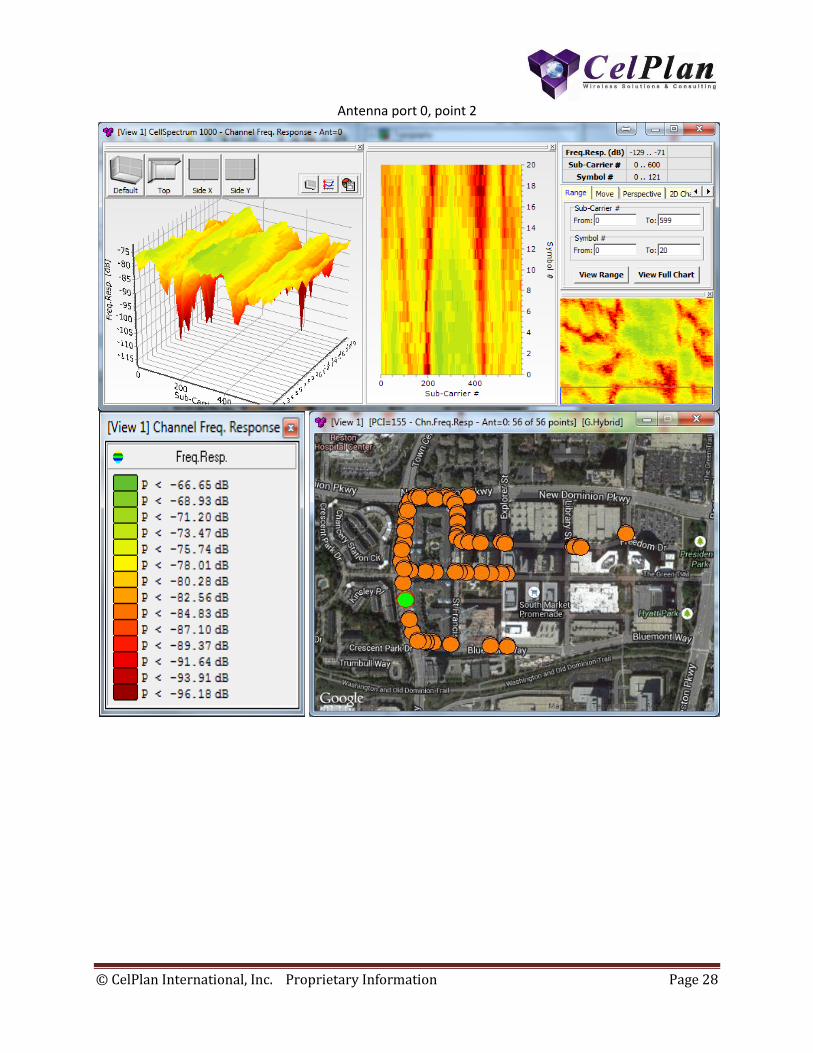
Antenna port 0, point 2
© CelPlan International, Inc. Proprietary Information Page 29
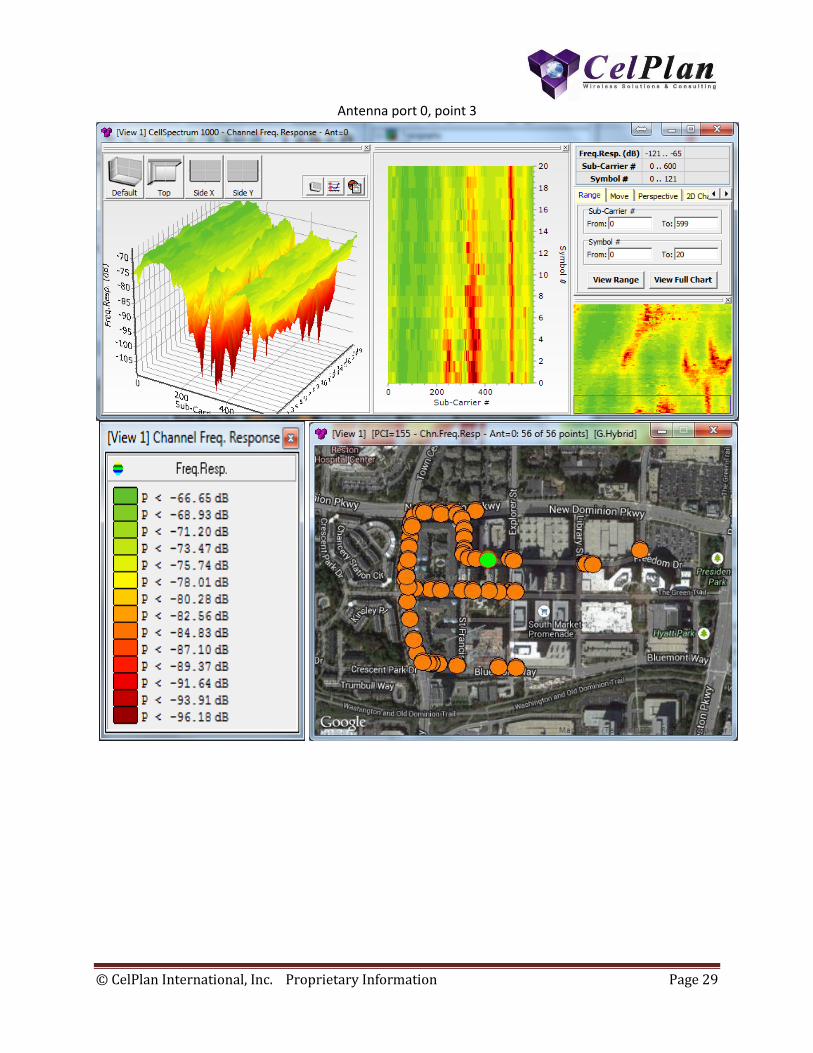
Antenna port 0, point 3
© CelPlan International, Inc. Proprietary Information Page 30
Antenna port 1, point 1
© CelPlan International, Inc. Proprietary Information Page 31
Antenna port 1, point 2
© CelPlan International, Inc. Proprietary Information Page 32
Antenna port 1, point 3
© CelPlan International, Inc. Proprietary Information Page 33
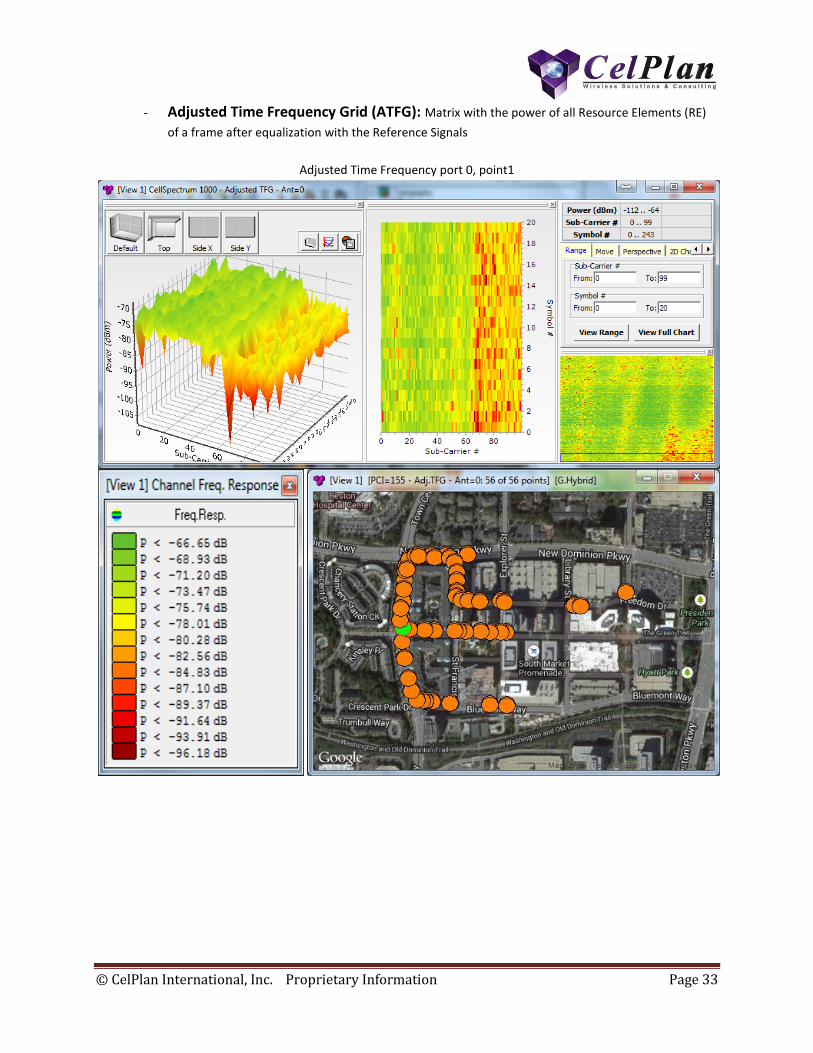
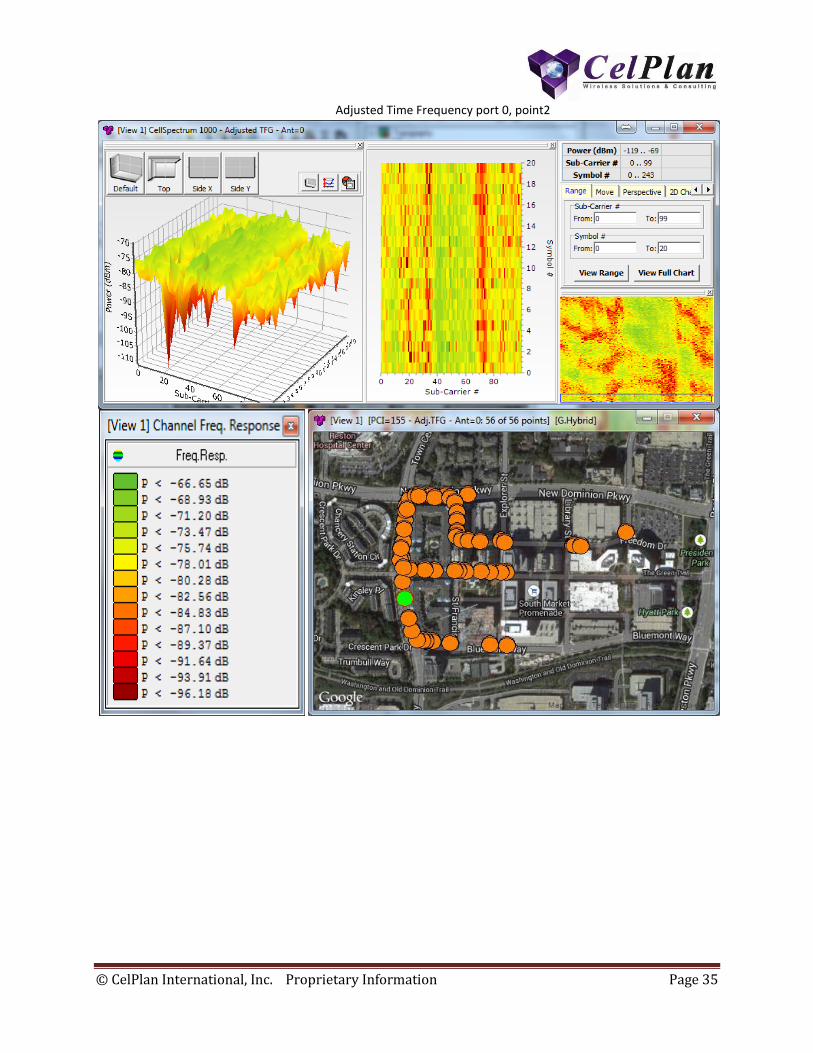
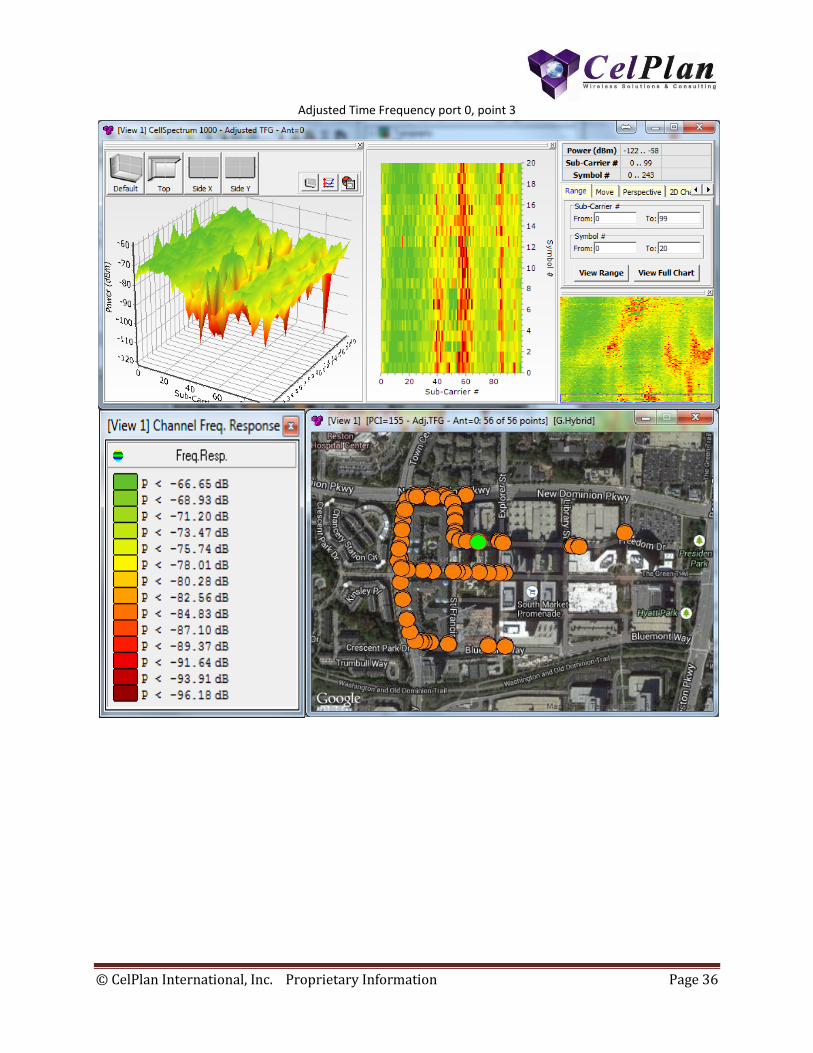
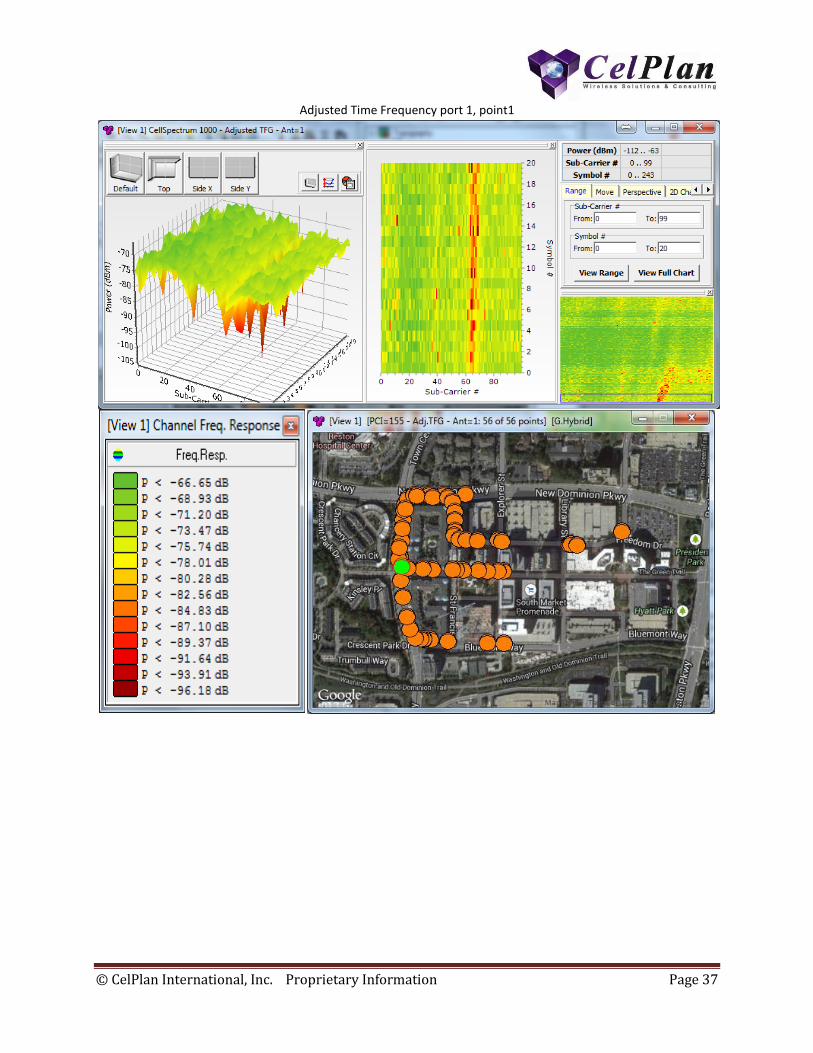
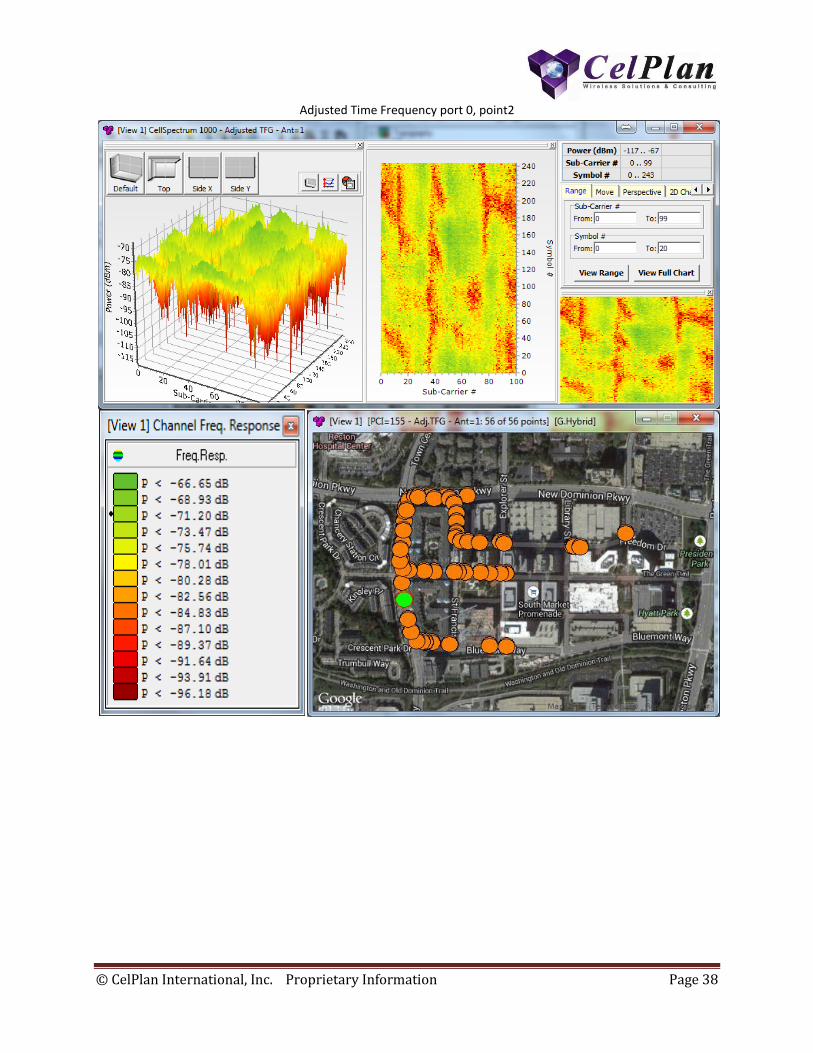
- Adjusted Time Frequency Grid (ATFG): Matrix with the power of all Resource Elements (RE)
of a frame after equalization with the Reference Signals
Adjusted Time Frequency port 0, point1
Grid port 0, point 1
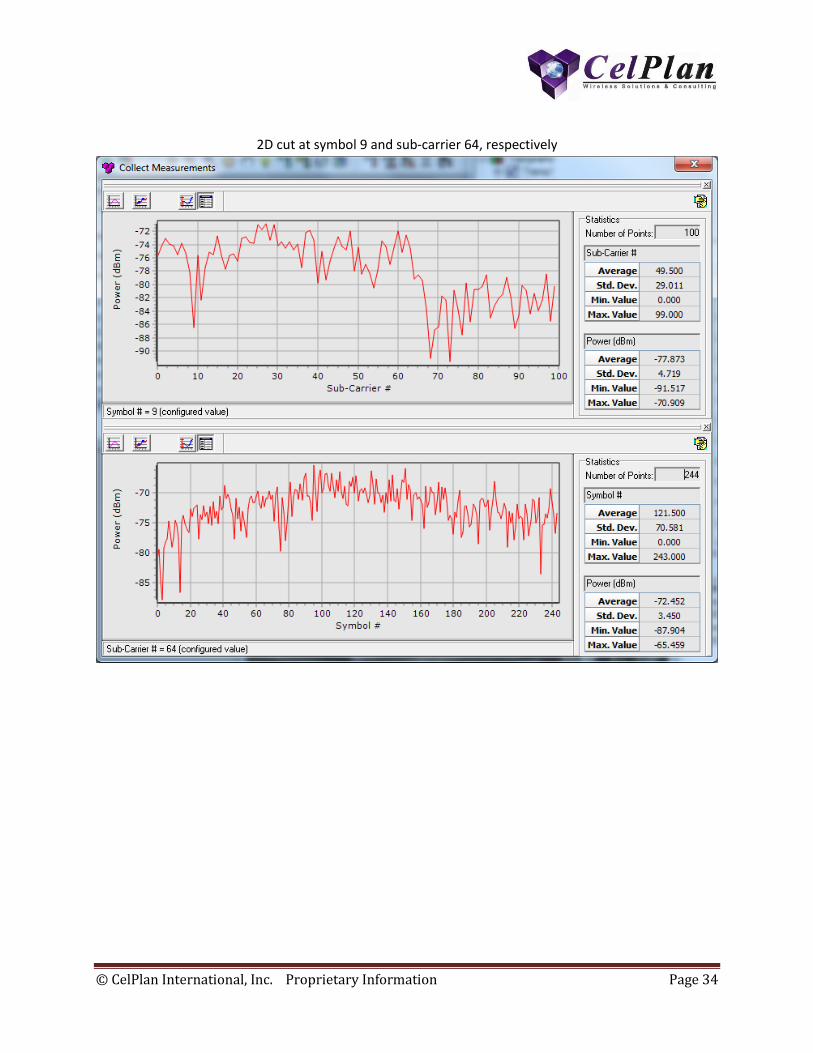
© CelPlan International, Inc. Proprietary Information Page 34
2D cut at symbol 9 and sub-carrier 64, respectively
© CelPlan International, Inc. Proprietary Information Page 35
Adjusted Time Frequency port 0, point2
© CelPlan International, Inc. Proprietary Information Page 36
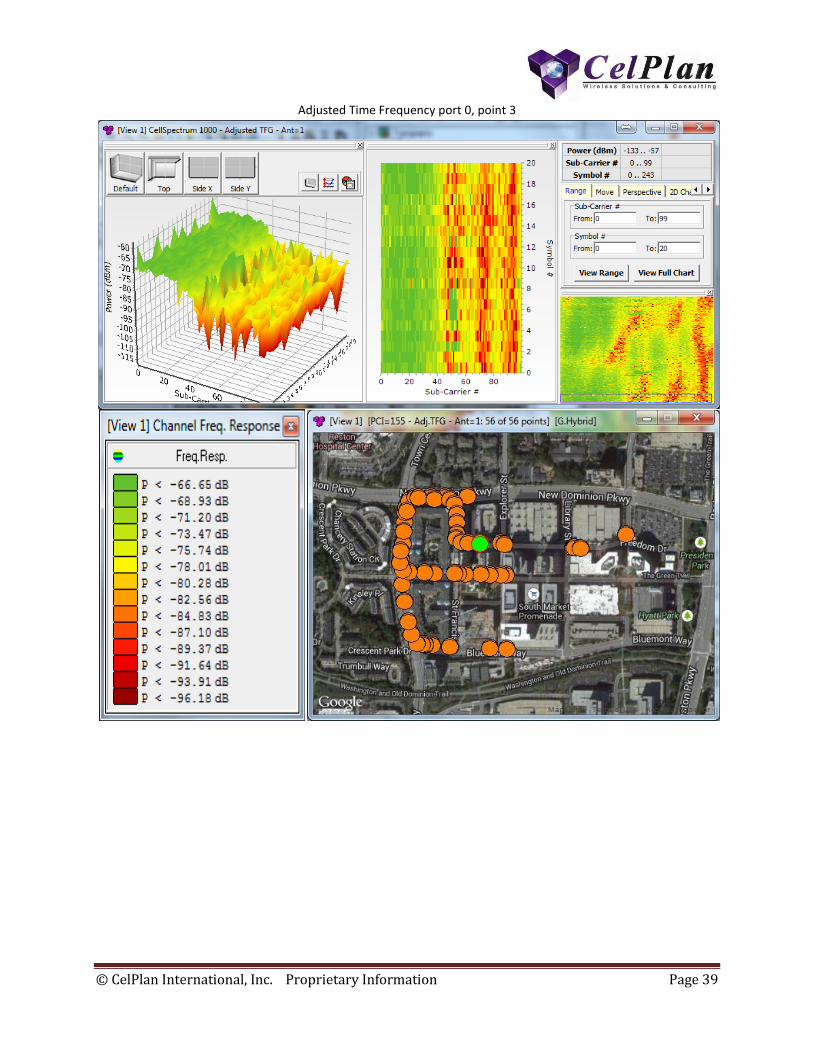
Adjusted Time Frequency port 0, point 3
© CelPlan International, Inc. Proprietary Information Page 37
Adjusted Time Frequency port 1, point1
© CelPlan International, Inc. Proprietary Information Page 38
Adjusted Time Frequency port 0, point2
© CelPlan International, Inc. Proprietary Information Page 39
Adjusted Time Frequency port 0, point 3
© CelPlan International, Inc. Proprietary Information Page 40
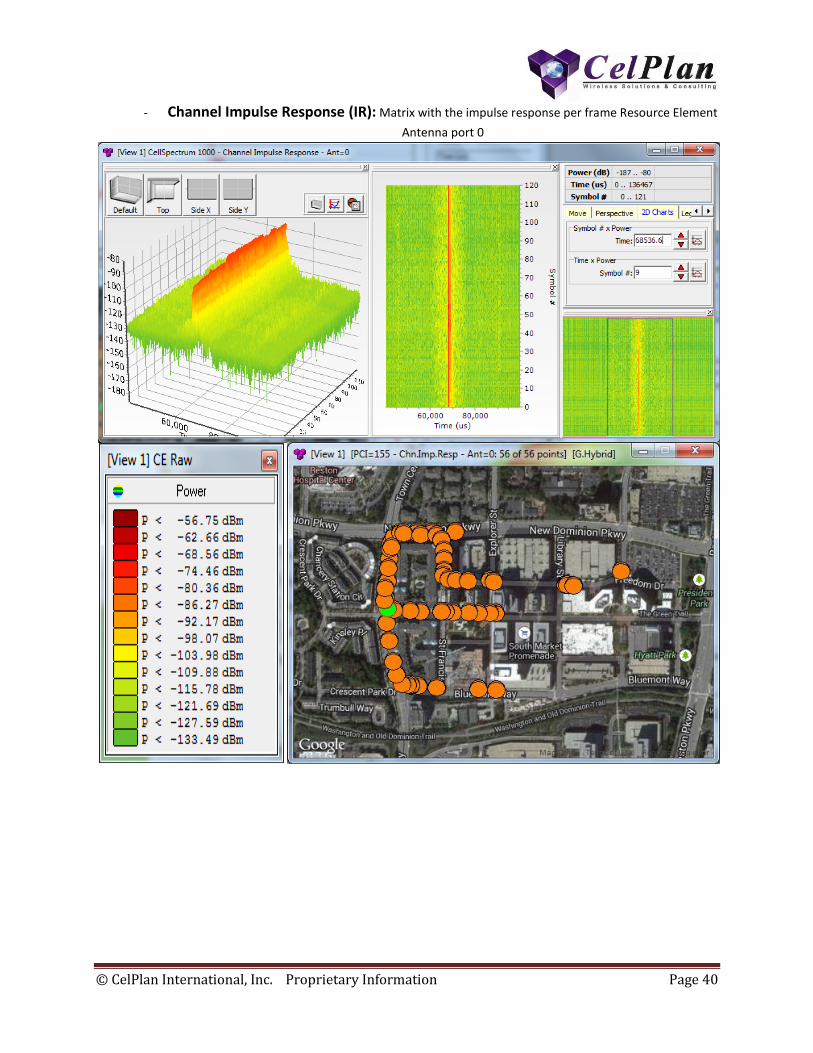
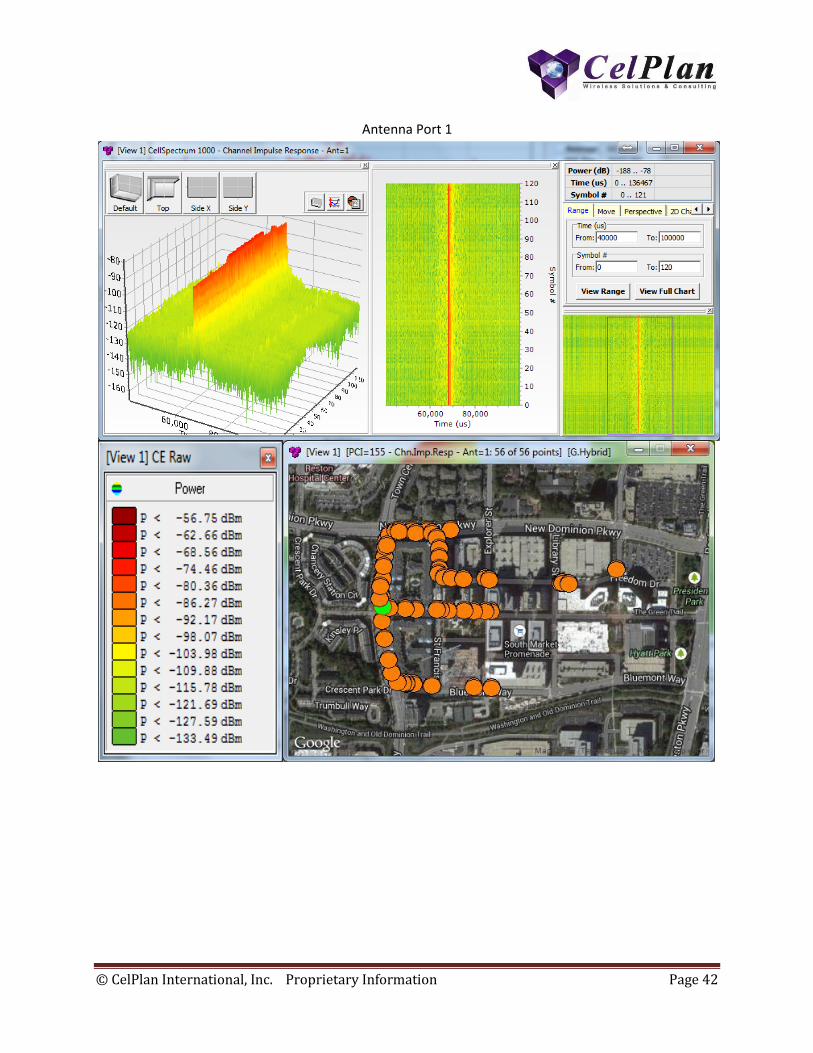
- Channel Impulse Response (IR): Matrix with the impulse response per frame Resource Element
Antenna port 0
© CelPlan International, Inc. Proprietary Information Page 41
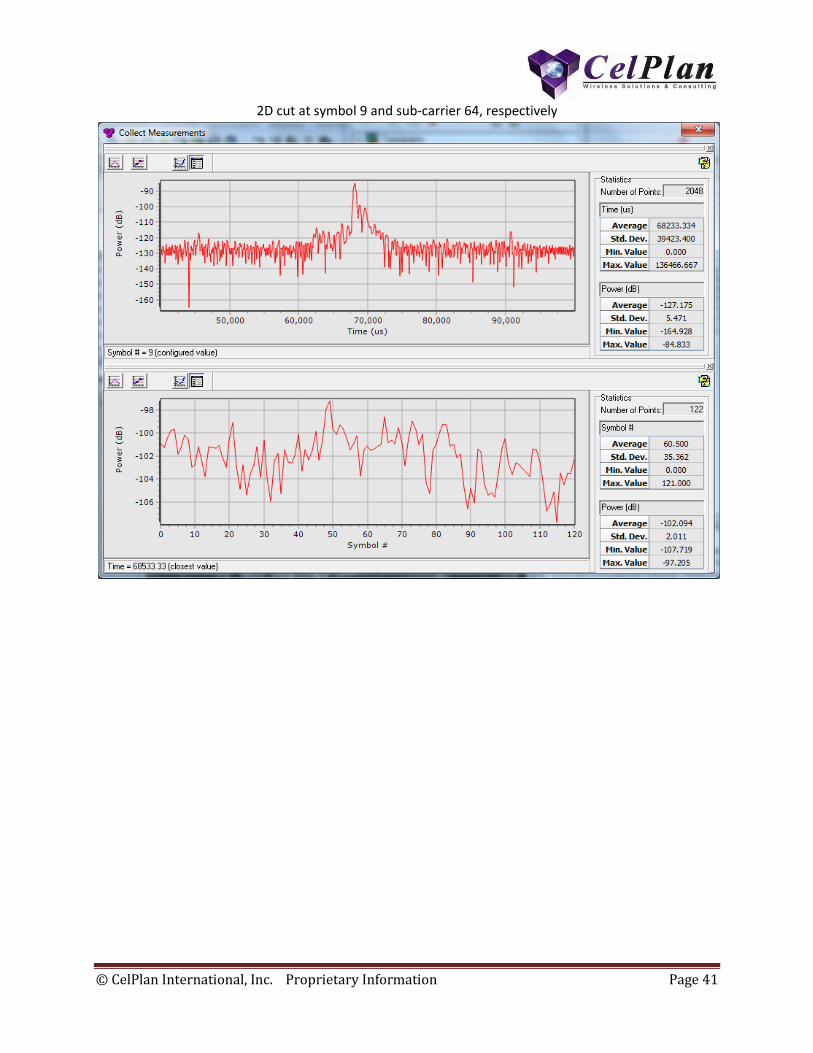
2D cut at symbol 9 and sub-carrier 64, respectively
© CelPlan International, Inc. Proprietary Information Page 42
Antenna Port 1
© CelPlan International, Inc. Proprietary Information Page 43
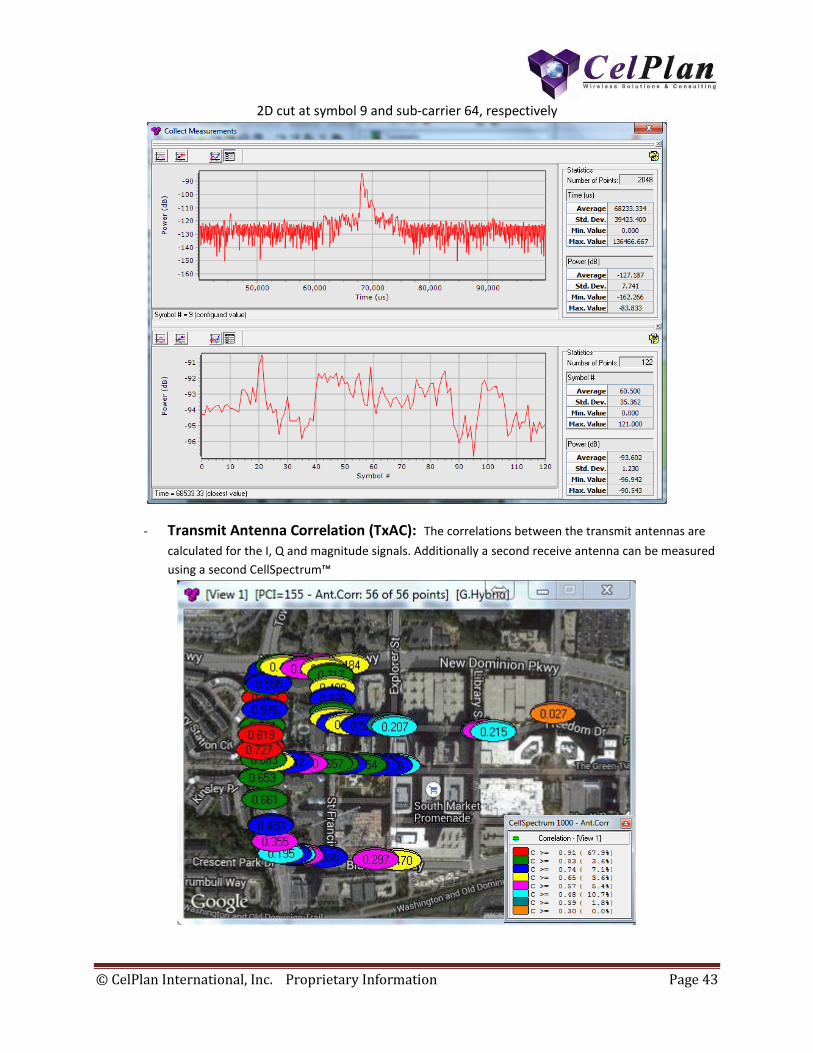
2D cut at symbol 9 and sub-carrier 64, respectively
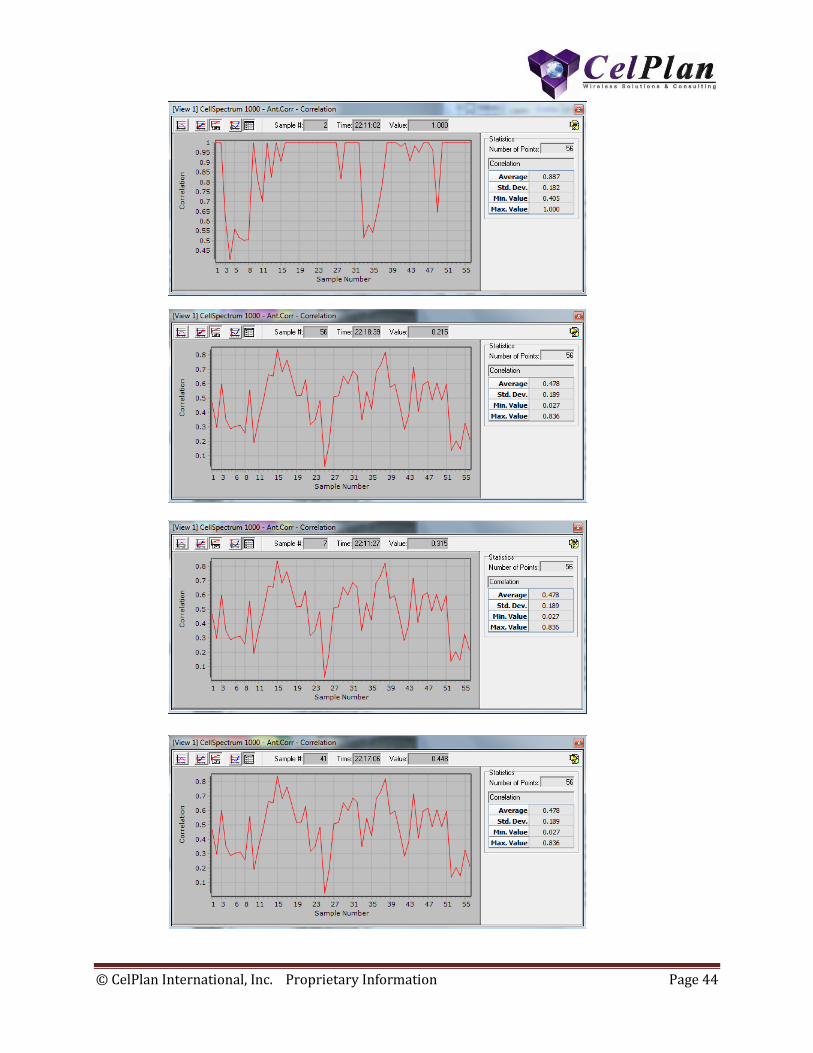
- Transmit Antenna Correlation (TxAC): The correlations between the transmit antennas are
calculated for the I, Q and magnitude signals. Additionally a second receive antenna can be measured
using a second CellSpectrum™
© CelPlan International, Inc. Proprietary Information Page 44
© CelPlan International, Inc. Proprietary Information Page 45
- Traffic Load Grid (Hot, Mild, Cold) (TLG): 3D representation of frame indicating the RE that are carrying traffic.
RE elements are classified in a hot category when the presence of traffic can be clearly identified, mild category
when the signal detected can be either traffic or interference and cold when no traffic presence is detected. This
prediction will be ready in the next release.
- Used symbols/Empty symbols ratio (UER): Expresses the amount of traffic being carried. Can be used
to evaluate traffic load. This prediction will be ready in the next release.
- Condition Number for N by N MIMO (CN): this feature allows the usage of multiple receive antennas.
Each antenna is connected to a CellSpectrum™ unit and both capture the received spectrum. A
printed board dual antenna circuit can be used to simulate the antennas of a smart phone. This
prediction will be ready in the next release.
Several other measurements are available to verify the decoding process. They are:
- Channel Estimation Raw
- Channel Estimation Time Offset Compensation
- Channel Estimation Time Offset Drift Compensation
Additional predictions can be developed under user request.
CellSpectrum™ provides a unique visualization of the network behavior and allows the prediction of key
parameters over the whole network. It can be done for outdoor and indoor multi-level signals. Developers can
tailor their allocation algorithms and operators can choose the best algorithms for each location.
© CelPlan International, Inc. Proprietary Information Page 46
5- CellAnalyzer™ CellSpectrum™ will provide analysis features that will check the collected data and compare it to cell settings or
recommend cell settings. This feature is in development and customer inputs are welcomed.
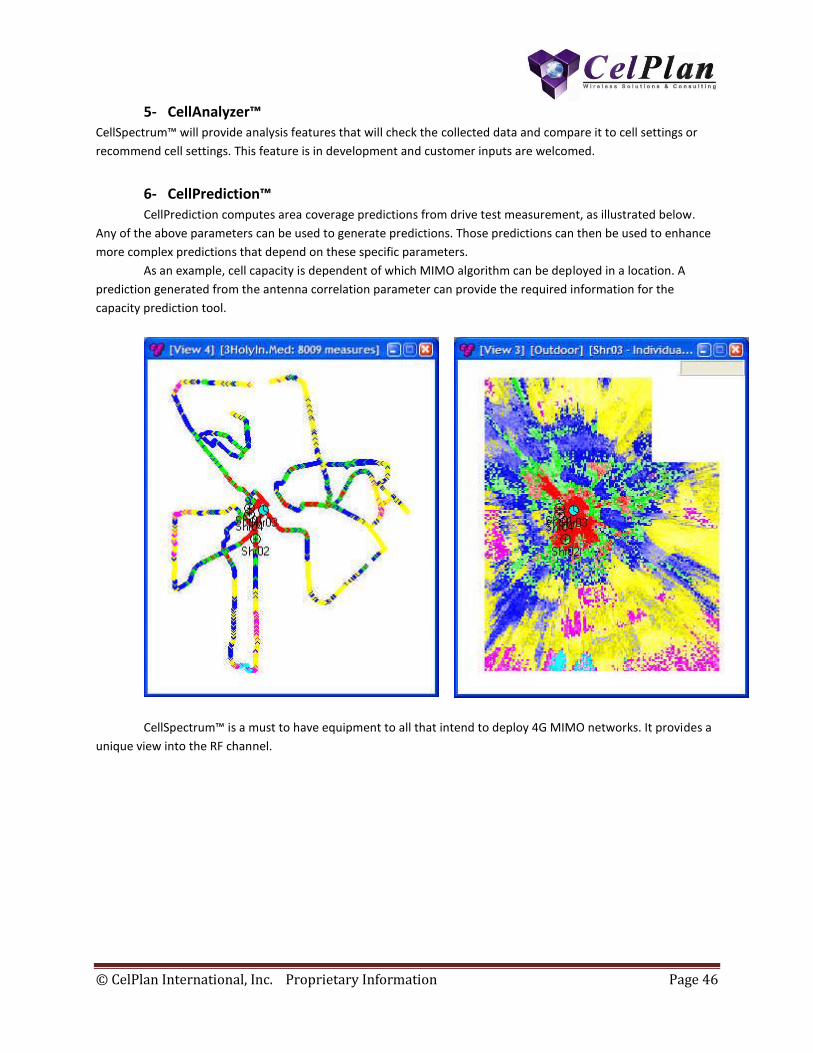
6- CellPrediction™ CellPrediction computes area coverage predictions from drive test measurement, as illustrated below.
Any of the above parameters can be used to generate predictions. Those predictions can then be used to enhance
more complex predictions that depend on these specific parameters.
As an example, cell capacity is dependent of which MIMO algorithm can be deployed in a location. A
prediction generated from the antenna correlation parameter can provide the required information for the
capacity prediction tool.
CellSpectrum™ is a must to have equipment to all that intend to deploy 4G MIMO networks. It provides a
unique view into the RF channel.