
rewards and sanctions
43
CAEPR Working Paper #2006-005 The Effect of Rewards and Sanctions in Provision of Public Goods Martin Sefton University of Nottingham Robert Shupp Ball State University James Walker Indiana University Bloomington August 29, 2006 This paper can be downloaded without charge from the Social Science Research Network electronic library at: http://ssrn.com/abstract=932683 . The Center for Applied Economics and Policy Research resides in the Department of Economics at Indiana University Bloomington. CAEPR can be found on the Internet at: http://www.indiana.edu/~caepr . CAEPR can be reached via email at [email protected] or via phone at 812-855-4050. ©2006 by Martin Sefton, Robert Shupp and James Walker. All rights reserved. Short sections of text, not to exceed two paragraphs, may be quoted without explicit permission provided that full credit, including © notice, is given to the source.
Transcript of rewards and sanctions

CAEPR Working Paper #2006-005
The Effect of Rewards and Sanctions in
Provision of Public Goods
Martin Sefton University of Nottingham
Robert Shupp
Ball State University
James Walker Indiana University Bloomington
August 29, 2006 This paper can be downloaded without charge from the Social Science Research Network electronic library at: http://ssrn.com/abstract=932683. The Center for Applied Economics and Policy Research resides in the Department of Economics at Indiana University Bloomington. CAEPR can be found on the Internet at: http://www.indiana.edu/~caepr. CAEPR can be reached via email at [email protected] or via phone at 812-855-4050.
©2006 by Martin Sefton, Robert Shupp and James Walker. All rights reserved. Short sections of text, not to exceed two paragraphs, may be quoted without explicit permission provided that full credit, including © notice, is given to the source.

The Effect of Rewards and Sanctions in Provision of Public Goods
Martin Sefton
University of Nottingham, United Kingdom
Robert Shupp
Ball State University, Muncie, IN
James Walker
Indiana University, Bloomington, IN
July, 2006
© 2006 Martin Sefton, Robert Shupp, James Walker
Acknowledgements: We thank Jeff Carpenter, Juan-Camilo Cardenas, Rachel Croson, Robyn Dawes,
David Dickinson, Gerhard Glomm, Simon Gächter, Axel Ockenfels, Louis Putterman, Rupert Sausgruber,
and Arlington Williams, as well as anonymous referees, for their comments and advice and the Center on
Philanthropy at Indiana University for funding support for this project.
Contact Details:
Martin Sefton: School of Economics, University of Nottingham, Nottingham NG7 2RD, United
Kingdom. Phone 44-115-846-6130, E-mail martin.sefton @ nottingham.ac.uk.
Robert Shupp, Department of Economics, Ball State University, Muncie, IN 47306. Phone 765-
285-3724, E-mail rshupp @ bsu.edu.
James Walker: Department of Economics, Indiana University, Bloomington, IN 47405. Phone
812-855-2760, E-mail walkerj @ indiana.edu.

JEL C92
The Effect of Rewards and Sanctions in Provision of Public Goods
Abstract
A growing number of field and experimental studies focus on the institutional
arrangements by which individuals are able to solve collective action problems. Important in this
research is the role of reciprocity and institutions that facilitate cooperation via opportunities for
monitoring, sanctioning, and rewarding others. Sanctions represent a cost to both the participant
imposing the sanction and the individual receiving the sanction. Rewards represent a zero sum
transfer from participants giving to those receiving rewards. We contrast reward and sanction
institutions in regard to their impact on cooperation and efficiency in the context of a public
goods experiment.
Martin Sefton: School of Economics, University of Nottingham, Nottingham NG7 2RD, United
Kingdom. Phone 44-115-846-6130, E-mail martin.sefton @ nottingham.ac.uk.
Robert Shupp, Department of Economics, Ball State University, Muncie, IN 47306. Phone 765-
285-3724, E-mail rshupp @ bsu.edu.
James Walker: Department of Economics, Indiana University, Bloomington, IN 47405. Phone
812-855-2760, E-mail walkerj @ indiana.edu.

The Effect of Rewards and Sanctions in Provision of Public Goods
The experimental literature on voluntary public goods provision shows that groups attain
better outcomes than implied by economic models based on individuals maximizing own-
monetary earnings. At the same time, however, groups uniformly fail to achieve optimal
outcomes, suggesting that incentives to free ride are important. Moreover, when the decision
situation is repeated, the group outcome often deteriorates with repetition, suggesting that, in
many settings, a group’s ability to overcome free rider incentives may be transitory (see for
example Andreoni and Miller, 1993, Isaac, Walker, and Williams, 1994, and Croson, 1998).
In this paper we report an experiment examining the impact of introducing opportunities
for individuals to reward or sanction other group members after observing their decisions. This
institutional change is motivated by the observation that such opportunities are commonplace in
field settings. In many group or team situations, individuals observe the actions of others, and
individuals often have rich opportunities for reacting to others’ behavior in ways that may
impose costs or benefits on both parties. There is abundant anecdotal evidence that individuals
sanction those who engage in selfish activities at the expense of other group members. For
example, people who violate social norms are often ostracized. Similarly, there is strong
anecdotal evidence that people are prepared to make sacrifices to help others on a quid pro quo
basis.1 Recent experiments with simple proposer-responder games also demonstrate that
responders are willing to depart from own-earnings maximization by rewarding more generous
proposers or sanctioning less generous proposers (see Offerman, 2002, and Andreoni, Harbaugh
and Vesterlund, 2003).
Given this evidence, it is quite plausible that individuals will sanction or reward other
group members based upon their contributions to a public good in a laboratory setting. In turn,
1

the possibility of receiving such sanctions or rewards may affect contributions. Such
contributions could be viewed as a response to the threat of negative reciprocation, in the case of
sanctions, or the expectation of positive reciprocation, in the case of rewards. Our experiment
directly compares the effectiveness of such negative and positive reciprocation in maintaining
contributions to public goods.2 In our experiment groups of four subjects make contribution
decisions in a sequence of ten public goods games without opportunities to reward or sanction.
These subjects then play an additional ten games in which a second stage is added at the end of
each game. Depending on treatment, in the second stage subjects are given an opportunity to
reward, sanction, or both reward and sanction other group members on the basis of their
contribution decisions.
When neither rewards nor sanctions are available, our results mirror those of previous
experiments: contributions and earnings steadily diminish with repetition. In the other treatments
the introductions of opportunities to reward and/or sanction initially increase contributions.
However, in the reward treatment contributions subsequently decrease to a level below that
observed in the absence of opportunities to reward. Thus, the opportunity to reward by itself is
insufficient to sustain contributions. In contrast, we find that sanctioning sustains public goods
provision at a level above that observed in the absence of sanctioning opportunities, and so
sanctioning appears to be a more effective mechanism for sustaining contributions. However,
opportunities to sanction initially result in a loss of efficiency, as the direct costs associated with
sanctioning outweigh the effect of increased contributions. Only in later rounds, where it appears
that the mere threat of being sanctioned sustains contributions does the opportunity to sanction
enhance group performance. Our treatment allowing both sanctions and rewards suggests a
2

synergistic relationship between the two, insofar as this treatment generates the highest
contributions and earnings.
Our data also allow us to make some observations about the way rewards and sanctions
are used. Those subjects most willing to use rewards and sanctions are those who contribute
more than the group average, and subjects who contribute more (less) than the group average are
more likely to receive rewards (sanctions). We also observe, however, differences in the dynamic
patterns of rewarding and sanctioning behavior. While initially subjects use rewards more
frequently than sanctions, over time the use of rewards declines at a faster rate than the use of
sanctions, so that in later rounds rewards are used less frequently than sanctions.
The remainder of the paper is organized as follows. In the next section, we describe the
nature of sanctions and rewards in the public goods laboratory setting. In Section II, we describe
the specific experimental setting investigated here and Section III presents the experimental
results. Section IV contains concluding comments.
I. REWARDS AND SANCTIONS IN PUBLIC GOODS EXPERIMENTS
Our setting for studying public goods provision is the voluntary contributions mechanism
(VCM) with linear payoffs.3 In this setting, subjects are endowed with tokens that they can
allocate between a private account and a group account. The returns from these accounts are
structured so that group earnings are maximized when subjects allocate all their tokens to the
group account. Private monetary incentives, however, point individuals toward placing all their
tokens in their private accounts. The stylized results emerging from this type of decision setting
are: a) there is considerable heterogeneity in individual allocations, b) allocations to the group
account exceed the prediction of zero tokens, but are substantially below the optimal level of
3

100% of endowments, and c) group allocations often decline significantly as the game is
repeated.
These findings suggest the need for understanding the effectiveness of alternative
institutional arrangements to facilitate group cooperation. Ostrom, Walker and Gardner (1992),
investigate behavior in a common-pool resource game, and find that covenants or promises about
future actions can be useful in maintaining cooperation, even when the promises are non-
binding.4 They also study the effect of supporting covenants with sanctions. They find that
covenants are even more effective when supported by internal sanctions, i.e. sanctions imposed
by group members. On the other hand, they find that sanctions used alone, without covenant
opportunities, may actually lower group earnings when costs of sanctions are included.
Our study is most closely related to that of Fehr and Gächter (2000). They investigate a
2-stage punishment game. The first stage corresponds to a single period of the VCM game. In
the second stage, individual decisions are anonymously revealed to the group and subjects have
an opportunity to punish each other. Punishment is costly, both to the person doing the
punishment and the person being punished.5 Public goods provision is significantly higher in the
VCM game with opportunities to sanction than in the VCM game without opportunity for
sanctions. Once the costs of sanctioning are taken into account, however, the welfare
implications are somewhat ambiguous. In their partners treatment, which most closely parallels
the experiments reported here, payoffs in the first decision round are lower than in the first
period of the VCM game without sanctions. By the last period, however, the game with sanctions
offers a payoff gain of approximately 20% relative to the VCM game without sanctions.
Our experiment builds on previous studies by contrasting sanction opportunities with
reward opportunities. Analogous to the sanctioning game, the reward game is structured so that it
4

is costly to reward other group members. Note this implies that withholding a reward is not
equivalent to imposing a sanction, as withholding a reward increases own earnings whereas
sanctioning reduces own earnings. Thus sanctions reduce the earnings of both the subject
imposing the sanction and the subject being sanctioned, whereas rewards simply constitute a
transfer of earnings from the subject giving the reward to the subject receiving the reward. In
particular, while sanctions directly reduce group earnings, rewards allow individual group
members to react to others' contributions without impinging directly on efficiency.
This asymmetry in how rewards and sanctions affect payoffs suggests at least two
reasons why the behavioral effects of rewards and sanctions may differ. First, if the threat of
sanctioning induces greater contributions to the public good then sanctions need not be used,
whereas if an expectation of rewards induces greater contributions then rewards must be used to
fulfill those expectations. Second, unlike rewards, sanctions can be used by contributors to
reduce the earnings advantage of low contributors over other group members.
II. THE DECISION SETTING
The initial study includes twelve sessions. In each session, twelve subjects were recruited
from introductory economics classes at Indiana University-Bloomington.6 Via the computer, the
twelve subjects were privately and anonymously assigned to four-person groups and remained in
these groups throughout the session. No subject could identify which of the others in the room
was assigned to their group. Since no information passed across groups, each session involved
three independent groups. At the beginning of each session, subjects privately read a set of
instructions.7 A review of the instructions was then presented on an overhead screen so that the
structure of the decision problem was public information. Subjects made all decisions privately.
There were four treatment conditions: sanction, reward, sanction&reward, and baseline. Table 1
5

presents summary design information. Three sessions were conducted using each of the four
treatment conditions, yielding data on 9 independent 4-person groups in each condition.8
[TABLE 1 ABOUT HERE]
Each group participated in two sequences of ten decision rounds, Sequence I and
Sequence II. The structures of Sequence I and Sequence II were explained prior to beginning
Sequence I. 9 In all sessions and all treatment conditions, each round in Sequence I corresponded
to a VCM game. At the beginning of each Sequence I decision round, each subject was endowed
with six tokens to be allocated between their private account and the group account. For each
token placed in his or her private account a subject received 10 cents. For each token placed in
the group account, each group member received 5 cents. After all subjects had made their
decisions for a round, they were informed of the aggregate allocations to the group account, the
allocation of each member of their group to the group account, and their own earnings for the
round. Individual decisions were not linked to subject identifiers and the order in which group
member’s decisions were presented on each subject’s terminal was randomized each round.
Thus, subject-specific reputations could not develop across rounds. This parallels the setting used
by Fehr and Gächter (2000).
In the sanction, reward, and sanction&reward treatments, each round of Sequence II
contained two stages. Stage 1 of each round involved a VCM game identical to that used in
Sequence I decision rounds. In Stage 2, each subject received six additional tokens. How these
tokens could be used varied across the three treatment conditions.
In Stage 2 of each round of the sanction treatment, subjects could allocate the additional
tokens to a private account, from which the subject earned 10 cents per token, or use the tokens
to sanction other group members.10 The computer screen informing a subject of other group
6

members’ Stage 1 decisions was used for imposing sanctions. Alongside each group member’s
decision, subjects could indicate how many of their six tokens they wished to use to sanction
each particular group member. Because the decisions of others were ordered randomly each
round and did not contain subject identifiers, subjects could sanction only on the basis of current
round decisions. For each token used to sanction another group member, that group member’s
earnings were reduced by 10 cents. The cost to the individual imposing the sanction was the
foregone earnings from their own private account. Thus, each token used for sanctioning reduced
group earnings by 20 cents. After sanctioning decisions were completed, each subject was
informed of their earnings, including any sanctions they imposed or received. Subjects were
informed of the total number of sanctions they received, but could not identify which of the other
subjects imposed the sanctions. Further, subjects were not informed of the number of sanctions
other group members received.
Stage 2 of the reward treatment was identical to the sanction treatment, except instead of
using tokens to sanction other group members, subjects could use tokens to reward other group
members. Subjects using tokens to reward other group members also incurred a cost in the form
of foregone earnings. However, for each token used to reward a group member, that group
member received 10 cents. Thus, rewards constituted a pure redistribution of earnings.
In the sanction&reward treatment, both sanctions and rewards were allowed. Tokens
could be allocated toward sanctions in which case the subject receiving the sanction had his
earnings reduced by 10 cents, or allocated toward rewards in which case the subject receiving the
reward has his earnings increased by 10 cents.
Opportunities for learning, or for employing history-dependant strategies, make it
problematic to use comparisons of the Sequence I and Sequence II decisions to measure the
7

effect of sanctions and rewards. For purposes of experimental control, a baseline treatment was
conducted. All aspects of the baseline treatment were identical to the other treatments, except
that there was no Stage 2 in the decision rounds of Sequence II; no opportunities for rewards or
sanctions, and no language in the instructions related to opportunities to reward or sanction. In an
effort to minimize potential behavioral differences across treatments due to reduced earnings
potential in Sequence II of the baseline treatment, subjects were notified that at the end of each
round of Sequence II, an additional 60 cents would be added to their earnings.
In all treatment conditions, subjects play a finitely repeated game with a commonly
known final round. Under the assumption that it is common knowledge that subjects maximize
own-earnings, the theoretical prediction is straightforward. The subgame perfect Nash
equilibrium for each treatment condition calls for zero contributions in the VCM game and no
sanctions or rewards.11 As noted earlier, however, experimental studies of the VCM game
typically find that the level of cooperation observed is not consistent with equilibrium
predictions of zero provision of the group good.12 Moreover, other studies have shown that
subjects do use sanctions - even though they reduce own-earnings - when they are available.
To the extent that motivations of fairness and reciprocity play a role in decision-making,
the sanction and reward decision environments investigated here allow for subjects to act on such
motivations beyond changes that they make in their group allocations to the public good.13 That
is, in the setting here, subjects can respond via explicitly targeted sanctioning or rewarding
behavior. Sanctions and rewards can be viewed as an extension of reciprocal behavior allowed
through allocation decisions in the standard VCM game. Subjects make costly decisions that
yield signals to others that are specifically targeted in relation to current round decisions.
8

III. RESULTS
Group-level data is first analyzed to assess the effect of rewards and sanctions on levels
of provision of the public good and overall earnings. We then examine overall levels of rewards
and sanctions and analyze rewarding and sanctioning behavior at the individual level.14
Allocations to the group account
Figure 1 shows average group allocations across all twenty rounds. Data is presented as
the percentage of tokens allocated to the group account. Recall, prior to making any decisions,
subjects were informed of the decision environment for both Sequence I and Sequence II. In the
reward, sanction, and sanction&reward treatments, the pattern of average group allocations
across Sequence I (round 1 to 10) is very similar to the baseline treatment. This evidence suggest
that instructions that vary across treatment conditions for Sequence II have no differential impact
on decisions in Sequence I.15 Further, pooling across treatment conditions, the pattern of group
allocations is consistent with that observed in previous studies. In the initial round, subjects
allocate an average of 53% of endowments to the group account. Group allocations then decline
across rounds to 44% in round ten. Even in the final round of Sequence I, group allocations
substantially exceed the zero allocation level based on the standard model of own-earnings
maximization.16
[FIGURE 1 ABOUT HERE]
As shown in Figure 1, the time trends of average group allocations diverge across
treatments in Sequence II. Most notably, average group allocations in the reward, sanction, and
sanction&reward treatments move away from the baseline treatment over early rounds of
Sequence II. Similar to other VCM experiments with multiple decision sequences, in the
baseline treatment there is a restart effect -- group allocations are higher in round 11 than round
9

10 -- and then allocations resume their downward trend. In the sanction and sanction&reward
treatments, allocations increase and are sustained above 50% throughout Sequence II. Both
treatments, however, show an end of experiment decay in group allocations, with the decay in
the sanction&reward treatment beginning in round 19. In the reward treatment the data reveal a
similar, but more pronounced, dynamic. Group allocations are well above the baseline for most
of Sequence II, but in round 17 begin a sharp decay. By the last round, group allocations fall
below that of the baseline.
Statistical tests bear out the trends displayed in Figure 1. Group allocations in round
eleven are not significantly different across treatments at conventional levels; allocations in
round 20, as well as across all rounds of Sequence II, are significantly different.17 Considering
each treatment separately, group allocations in round 20 are significantly lower than in round 11
for the baseline and reward treatments, but not for the sanction or sanction&reward
treatments.18 Comparing the baseline and reward treatments, group allocations are not
significantly different in rounds 11 or 20, but are significant when comparing average allocations
over Sequence II, reflecting the temporary increase in allocations resulting from the introduction
of rewarding opportunities. 19 In contrast, a comparison of the baseline and reward&sanction
treatments shows that a significant difference in group allocation levels emerges after round 11
and is sustained throughout the rest of Sequence II.20 The difference between the baseline and
sanction treatments is less pronounced, and indeed not significant at conventional levels (even
though, as already noted, group allocations exhibit different dynamics in the two treatments).21
Of course, the pooled averages plotted in Figure 1, disguise the degree of variation across
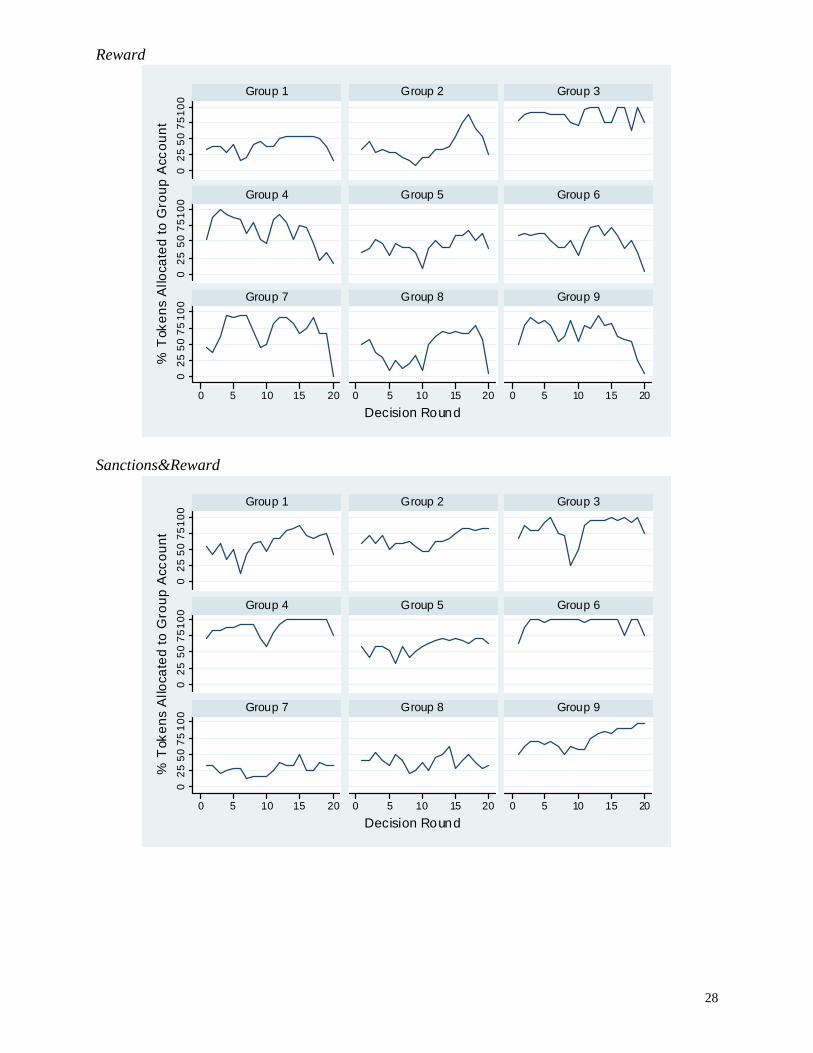
groups in each treatment condition. Figure 2 displays the percentage of tokens allocated to the
group account across each of the 20 decision rounds for each group. Clearly, considerable
10

variation exists across groups and across treatment conditions. Two observations are of particular
note. First, in each treatment condition, there are some groups that are able to achieve sustained
high levels of cooperation. Second, in the reward treatment, there is a high level of consistency
across groups in the decline in group allocations in the later rounds of Sequence II.
[FIGURE 2 ABOUT HERE]
Group Efficiency
Efficiency in allocations is measured as actual group earnings as a percentage of
maximum possible earnings. For each round of Sequence I maximal group earnings of 480 cents
are attained when all tokens are allocated to the group account. Sequence II maximal group
earnings of 720 cents are attained when all tokens are allocated to the group account in stage 1,
and in the sanction and sanction&reward treatments no sanctions are used in stage 2. Given that
allocations are very similar across treatments in Sequence I, earnings and efficiencies are also,
averaging 78%.22 In Sequence II, the divergent patterns in allocations and the use of rewards
and sanctions generate differences in earnings, and resulting efficiencies. Following round 11,
the initial impact of allowing rewards and/or sanctions is a shift upwards in efficiencies in the
reward and sanction&reward treatments relative to the baseline, and a downward shift in the
sanction treatment.
As shown in Figure 3, however, efficiencies follow a different dynamic across the
treatment conditions. Efficiencies in the sanction treatment show a statistically significant
increase, from round 11 to 20, although they remain below the levels of the other treatments.
Efficiencies in the sanction&reward treatment remain relatively stable, with a sharp decline in
round 20. Efficiencies in the reward treatment are relatively stable until round 17, where they
begin a steady decline.23
11

[FIGURE 3 ABOUT HERE]
Levels of Sanctions and Rewards
As well as allowing a comparison of the effects of rewards and sanctions on group
account allocations and earnings, our data supplies evidence about how rewards and sanctions
are actually used. Figure 4 displays the average percentage of tokens used for sanctions/rewards
across rounds. As seen in the left-hand panel, in the sanction treatment, subjects begin by
allocating on average 31% of their Stage 2 tokens to sanctions, but this percentage falls to 16%
by the final round. The decline in the use of rewards is more pronounced. In the reward
treatment, the percentage of Stage 2 tokens used for rewarding falls sharply, from 41% in round
11 to 3% in the final round. The right-hand panel of Figure 4 displays the use of rewards and
sanctions in the sanction&reward treatment. Again, subjects initially prefer using rewards to
sanctions. In round 11, 42% of Stage 2 tokens are allocated to rewards and only 8% to sanctions.
However, this pattern is not maintained. In the final round only 8% of Stage 2 tokens are used for
rewarding other subjects, and 10% for sanctioning.24
[FIGURE 4 ABOUT HERE]
For further analysis of rewarding and sanctioning behavior we focus on four issues: (1)
who sanctions or rewards, (2) recipients of sanctions or rewards, (3) the impact of sanctions or
rewards on the distribution of individual and group earnings, and (4) the impact of sanctions or
rewards on subsequent individual group account allocation decisions.
Who Sanctions/Rewards
To examine the characteristics of individuals who use sanctions/rewards we use a
multivariate Tobit regression analysis. The dependent variable is an individual's expenditures on
sanctions/rewards in a given round, while the explanatory variables are the individual's allocation
12

to the group account in that round, the average allocation by that individual's group in that round
and round and group dummies to capture time and group fixed effects. The results are shown in
Table 2. The primary conclusions of this analysis are rather intuitive. In the sanction (reward)
treatment, controlling for the group's per-capita allocation to the group account, those individuals
who allocate most to the group account tend to sanction (reward) most. The sanction&reward
treatment, yields a somewhat different result. Those that tend to allocate more to the group
account tend to sanction more. However, in this treatment, there is not a statistically significant
relationship between one’s own allocation and the level of rewards given. In fact, in this
treatment condition, there is no statistically significant correlation between total sanctions given
and total rewards given by individuals.25 Finally, controlling for the variation in individual
allocations to the group account, groups that allocated less to the group account on a per-capita
basis do more sanctioning, and less rewarding, although this relationship is not statistically
significant in the reward treatment.
[TABLE 2 ABOUT HERE]
Recipients of Sanctions/Rewards
We next examine the characteristics of subjects who receive sanctions/rewards. In order
to account for the fact that subjects could receive both sanctions and rewards in the
sanction&reward treatment, we calculate “net reward” as the difference between reward
received and sanction received. Thus, sanctions are measured as negative rewards. Following an
approach similar to that used by Fehr and Gachter (2000), Figure 5 shows net rewards received
as a function of an individual’s deviation from the average group allocation of other group
members. Deviations are grouped into intervals, and the average net reward received over
observations falling in each interval is plotted.
13

[FIGURE 5 ABOUT HERE]
Our data support Fehr and Gacther's interpretation of the determinants of being
sanctioned. In the sanction treatment, subjects are more heavily sanctioned the further their own
allocation to the group account falls below the average allocation of the rest of their group. As
observed by Fehr and Gächter and Ostrom, Walker and Gardner (1992), however, there is some
sanctioning of those making group allocations well above the group average.26 In the
sanction&reward treatment, those making group allocations well below the average of other
group members are sanctioned, but not at the level observed in the sanction treatment. As
expected, those in the reward treatment that make allocations above the average of other group
members receive the majority of the rewards. Interestingly, however, the average rewards for
those making group allocations well above the average of other group members are no greater
than for those just above the average of others. Further, large deviations below the average of
other group members were sanctioned at a magnitude much higher than rewards for allocations
well above the average of other group members. This asymmetry may, in part, explain why
rewards alone tended to be less successful in sustaining increased group account allocations.
To characterize the determinants of rewards and sanctions more formally, we estimate a
multivariate regression model similar to that used by Fehr and Gächter. Again, we use a Tobit
specification with net reward received as the dependent variable, and others' average group
allocation, and negative and positive deviations from this, as explanatory variables. Denoting
own group allocations by , and the average allocation of the other group members by iA A , the
variable absolute negative deviation is defined as max{ A − , 0}, and absolute positive
deviation as max{ −
iA
iA A , 0}.27 The results are presented in Table 3. In the sanction treatment,
higher negative deviations are more heavily punished (fewer net rewards), which is consistent
14

with the findings of Fehr and Gächter. However, neither “others' average allocation” nor
“absolute positive deviation” is statistically significant. This differs from the results of Fehr and
Gächter, where “others' average allocation” is significant. In the regression for the
sanction&reward treatment, net rewards are positively correlated with others’ average allocation,
higher negative deviations lead to higher sanctions, and higher positive deviations lead to higher
rewards. Note, that, consistent with the results reported above, holding constant the size of the
deviation, negative deviations lead to higher sanctions than rewards for positive deviations.
Similarly, in the reward treatment, rewards are higher in those groups in which other group
members allocate more, and are positively correlated with one’s own group allocation as a
deviation from that of others in one’s group.
[TABLE 3 ABOUT HERE]
Distribution of Individual and Group Earnings
Sanctions and rewards have the potential to impact the distribution of earnings across
individuals and across groups beyond their impact on group account allocation decisions. The
analyses above examined the characteristics of subjects who received sanctions/rewards and
those who chose to sanction/reward. To examine how these factors combine to impact earnings
distributions, we examine each subject’s and each group’s earnings, pooled across rounds 11-20.
In summary, based on both the range in earnings and variance, the strongest evidence regarding
income dispersion comes from the sanction treatment. This treatment includes the widest range
of incomes for individuals and groups, as well as the highest variance.28 This finding is largely
attributable to behavior in two of the nine groups in this treatment. These two groups used
substantively higher levels of sanctions than the other groups in this treatment. The two groups
15

not only had the lowest levels of group earnings, the eight subjects in these two groups were
among the nine lowest earners in this treatment condition.
Dynamics in Individual Decision Making
In this section we turn to modeling individual group account allocations across decision
rounds, in each treatment condition. Our approach follows closely that used in Ashley, Ball and
Eckel (2005). We use a multivariate Tobit regression analysis with individual fixed effects, with
the dependent variable an individual's group account allocation in a given round. The
explanatory variables are the individual's group account allocation lagged one round and lagged
two rounds, an individual’s positive (negative) deviation from the average group account
allocation of other group members in the last round, and rewards and/or sanctions received in the
last round. Table 4 displays estimates for each treatment condition.
[TABLE 4 ABOUT HERE]
For our purposes, of primary interest is the response of individuals to positive or negative
deviations from others’ allocations in the previous round, and the response to sanctions and/or
rewards. Consistent with previous findings and models of reciprocity, both positive and negative
deviations from the average group account allocations of others is of the expected sign across all
treatments. Subjects who give more than others tend to lower their contributions, while subjects
who give less than others tend to raise their contributions. The effect of Positive Deviation is
apparently stronger, indicating that the reduction in contributions among those subjects who give
more than others tends to be greater than the increase in contributions among those that give less
than others. Indeed, the coefficient on Negative Deviation is not significant at the 10% level in
the sanction and sanction&reward treatments. Similarly, the coefficients on sanctions and
rewards have the expected sign, indicating that these instruments encourage recipients to
16

increase contributions. However, the magnitude of the effect of sanctions is rather weak – a
sanction of one token induces the recipient to increase contributions by about a tenth of a token –
and insignificant in the case of the sanction&reward treatment. The coefficients on rewards –
1.00 in the reward treatment and 0.39 in the reward&sanction treatment – suggest a greater
response. These estimates are suggestive as to one of the reasons for the decline in sanctions
given across rounds. On the other hand, they point to an even greater problem in the reward
treatment. Rewards appear to induce a response that is efficiency enhancing. Even with this
relatively large response, however, groups do not maintain rewards at initial levels. In fact, the
level of rewards across rounds declines at a faster rate than that for sanctions.
IV. CONCLUDING COMMENTS
Experiments on the provision of public goods offer a rich testing ground for examining
norms of behavior and how such behavior is impacted by alternative institutional arrangements.
In particular, this paper focuses on reciprocity as a behavioral norm, examining changes in
individual group allocations as a general form of reciprocity and sanctions and rewards as
targeted forms of reciprocity.
Our results show that rewards and sanctions are not symmetric in their behavioral effects:
opportunities to reward or sanction are used differently by subjects and have different
consequences for facilitating cooperation.29 Initially, subjects chose to use rewards more than
sanctions. However, the rate of decay in the level of rewards was faster than that for sanctions.
Subjects appeared to “give up” more quickly on the use of rewards. Further, sanctions appeared
to be imposed in a more intuitive way than rewards. There was a clear positive correlation
between the number of sanctions received and the degree to which an individual’s group
allocation was below that of other group members. Rewards were generally given to those with
17

group allocations above the average of others, but the magnitudes varied little with how far an
individual’s group allocation was above the average of others, suggesting that there was not a
clear consensus on how rewards should be used. The opportunity to reward other group members
led to a modest increase in group allocations and earnings, although this was due to behavior in
initial rounds that did not survive repetition. On the other hand, in treatments that allowed
sanctions, groups were better able to sustain group allocations, although the beneficial impact on
earnings was hindered by the cost of sanctions.30
These results lend some support to arguments that the use of sanctions may be necessary
to promote cooperation initially, but the threat of sanctions may be sufficient to sustain
cooperation. These results also point to the complexities involved in using a reward system for
sustaining cooperation. One might argue that a successful reward system requires continued use
of rewards, and those rewards must be in the form of transfers from those allocating less to the
public good to those allocating more. In our experiments, however, it was those subjects who
allocated relatively more to the group account who tended to give more rewards. Further, as
noted above, it appears that subjects lacked a clear focal point or consensus in regard to where
rewards should be targeted. The significant decay in rewards across decision rounds, suggests
that groups may have difficulty in maintaining a rewards system.
The results from the sanction treatment of this study are qualitatively consistent with
those of Fehr and Gächter (2000) and other recent studies that examine sanctioning. Subjects use
sanctions and overall group allocations increase. The primary behavioral difference among these
studies is the degree to which sanctions increase group allocations and the extent to which
increased group allocations succeed in increasing overall earnings. There are structural
differences among these studies that might account for this difference. In particular, some studies
18

follow Fehr and Gachter and employ parameterizations where subjects faced convex costs of
imposing sanctions (Carpenter, 2005, and Masclet, Noussair, Tucker, and Villeval, 2003). In
these studies, it was relatively inexpensive to assign a small number of sanctions to another
group member. Further, each unit of sanction reduced earnings by a fixed percentage. Thus, in
absolute terms, sanctions reduced earnings more for high earners. Others, like the study here, use
a simpler linear framework (Yamagishi, 1986, Bochet, Page and Putterman, 2006). In this case,
there is a one-to-one mapping from costs of imposing a sanction to the magnitude of the
sanction. The weaker effect of sanctions in our study may reflect the intuitive notion that
sanctions will be more readily used when they are less costly to impose, and will be more
effective when they impose greater costs upon those sanctioned.31
The one-to-one nature of our sanctioning technology limits the ability of subjects to use
sanctions to reduce disadvantageous payoff inequality (in the sense of Fehr and Schmidt,
1999).32 Even so, subjects do use sanctions in our experiment. In this respect, our results support
Falk, Fehr and Fischbacher's (2005) findings from a 'low-sanction' Prisoner's Dilemma
experiment, which also employs a one-for-one sanctioning technology. They observe a
substantial number of subjects cooperating and sanctioning defectors, and interpret the driving
force behind these sanctions to be a desire to retaliate against unfair behavior, rather than to
reduce unfair payoff differences. In this sense, our experimental results complement a growing
number of experimental studies of public goods provision that find support for behavior based on
reciprocity or conditional cooperation. Future theoretical work, and experimental tests of these
theories, faces the challenge of more clearly articulating the scope of these norms of reciprocity,
as well as how these norms vary and interact across individuals and across institutional
arrangements.
19

REFERENCES
Ahn, T.K., E. Ostrom, and J. Walker. “Incorporating Motivational Heterogeneity into Game
Theoretic Models of Collective Action.” Working paper, Indiana University, 2002.
Ashley, R., S. Ball, and C. Eckel. “Motives for Giving: A Reanalysis of Two Classic Public
Goods Experiment.” Working paper, Virginia Technological Institute, 2005.
Anderson, C., and L. Putterman. “Do Non-strategic Sanctions Obey the Law of Demand? The
Demand for Punishment in the Voluntary Contribution Mechanism.” Games and Economic
Behavior, 54(1), 2006, 1-24.
Andreoni, J. "Giving with Impure Altruism: Applications to Charity and Ricardian Equivalence."
Journal of Political Economy, 97(6), 1989, 1447-1458.
Andreoni, J., W. Harbaugh, and L. Vesterlund. “The Carrot or the Stick: Rewards, Punishments
and Cooperation.” American Economic Review, 93(3), 2003, 893-902.
Andreoni, J., and J. Miller. “Rational Cooperation in the Finitely Repeated Prisoner’s
Dilemma: Experimental Evidence.” Economic Journal, 103(417), 1993, 570-585.
Bochet, O., T. Page, T., and L. Putterman. "Communication and Punishment in Voluntary
Contribution Experiments." Journal of Economic Behavior and Organization, 60(1), 2006,
11-26.
Bolton, G.E., and A. Ockenfels. “ERC: A Theory of Equity, Reciprocity, and Competition.”
American Economics Review, 90(1), 2000, 166-193.
Carpenter, J. “Punishing Free-Riders: How Group Size Affects Mutual Monitoring and the
Provision of Public Goods.” Forthcoming in Games and Economic Behavior.
Casari, M. “On the Design of Peer Punishment Experiments.” Experimental Economics, 8(2),
2005, 107-115.
20

Clark, K., and M. Sefton. "The Sequential Prisoners Dilemma: Evidence on Reciprocation."
Economic Journal, 111(468), 2001, 51-68.
Coats, J., and W. Neilson. “Beliefs about Other-Regarding Preferences in a Sequential Public
Goods Game.” Economic Inquiry , 43(3), 2005, 614-622.
Croson, R. “Theories of Commitment, Altruism and Reciprocity: Evidence from Linear Public
Goods Games.” Working Paper, University of Pennsylvania, 1998.
Dugar, S. “Approval and Disapproval in Minimum Action Games.” Working Paper, University
of Arizona, 2005.
Dickinson, D. "The Carrot vs. the Stick in Work Team Motivation." Experimental Economics,
4(1), 2001, 107-124.
Falk, A., E. Fehr, and U. Fischbacher. “Driving Forces Behind Informal Sanctions.”
Econometrica, 73(6), 2005, 2017-2030.
Falk, A., and U. Fischbacher. “A Theory of Reciprocity.” Games and Economic Behavior, 54(2),
2006, 293-315.
Falkinger, J., E. Fehr, E., S. Gächter and R. Winter-Ebmer. "A Simple Mechanism for the
Efficient Provision of Public Goods: Experimental Evidence." American Economic Review,
90(1), 2000, 247-264.
Fehr, E., and S. Gächter. "Cooperation and Punishment in Public Goods Experiments."
American Economic Review, 90(4), 2000, 980-994.
Fehr, E., and K. Schmidt. "A Theory of Fairness, Competition, and Cooperation." Quarterly
Journal of Economics, 114(3), 1999, 817-868.
21
Gunnthorsdottir, A., D. Houser, K. McCabe, and H. Ameden. "Excluding free-riders improves
reciprocity and promotes the private provision of public goods." Working Paper, University of
Arizona, 2000.
Hoffman, E., K. McCabe, and V. Smith. "Behavioral Foundations of Reciprocity: Experimental
Economics and Evolutionary Psychology." Economic Inquiry, 36(3), 1998, 335-352.
Isaac, M., Walker, J., and A. Williams. "Group Size and the Voluntary Provision of Public
Goods: Experimental Evidence Utilizing Large Groups." Journal of Public Economics, 54(1),
1994, 1-36.
Isaac, M., and J. Walker. "Communication and Free Riding Behavior: The Voluntary
Contribution Mechanism," Economic Inquiry, 26(4), 1988, 585-608.
Kerr, N. “Anonymity and social control in social dilemmas.” In M. Foddy et al. (Eds.),
Resolving Social Dilemmas Philadelphia, PA, Psychology Press, 1999.
Keser, C. “SUPER: Strategies Used in Public Goods Experimental Rounds.” Working Paper,
University of Mannheim, 1997.
Keser, C. “Cooperation in Public Goods Experiments.” Working Paper, CIRANO, 2000.
Kroll, L., T. Cherry, and J. Shogren. “Voting, Punishment and Public Goods: An Experimental
Investigation.” Working Paper, St. Lawrence University, 2003.
Ledyard, J. "Public Goods: A Survey of Experimental Research," in Kagel, J. and A. Roth (eds)
Handbook of Experimental Economics, Princeton University Press, 1995.
Masclet, D., C. Noussair, S. Tucker, and M. Villeval. "Monetary and Non-Monetary Punishment
in the Voluntary Contributions Mechanism." American Economic Review, 93, 2003, 366-380.
Offerman, T. “Hurting Hurts more than Helping Helps.” European Economic Review, 46(8),
2002, 1423-1437.
22

23
Oliver, P. "Rewards and Punishments as Selective Incentives for Collective Action: Theoretical
Investigations." American Journal of Sociology, 85(6), 1980, 1356-1375.
Orbell, J., A. van de Kragt, and R. Dawes. “Explaining Discussion Induced Cooperation.”
Journal of Personality and Social Psychology, 54(5), 1988, 811-819.
Ostrom, E.. Governing the Commons, Cambridge University Press, 1990.
Ostrom, E., J. Walker, and R. Gardner. "Covenants With and Without a Sword: Self-Governance
is Possible." American Political Science Review, 86(1), 1992, 404-417.
Schmidt, D., R. Shupp, J. Walker, J., T. Ahn, and E. Ostrom.“Dilemma Games: Game
Parameters and Matching Protocols.” Journal of Economic Behavior and Organization, 46(4),
2001, 357-377.
Seely, B., Van Huyck, J., and R. Battalio. “Credible Assignments Can Improve Efficiency in
Laboratory Public Goods Games.” Journal of Public Economics, 89(8), 2005, 1437-1455.
Sonnemans, J., A. Schram, and T. Offerman. “Strategic Behavior in Public Good Games: When
Partners Drift Apart.” Economics Letters, 62(1), 1999, 35-41.
Sugden, R. “Reciprocity: The Supply of Public Goods Through Voluntary Contributions.”
Economic Journal, 94(375), 1984, 772-787.
Swope, K. "An Experimental Investigation of Excludable Public Goods." Experimental
Economics, 5(3), 2002, 209-222.
Walker J., and M. Halloran. “Rewards and Sanctions and the Provision of Public Goods in One-
shot Settings.” Experimental Economics, 7(3), 2004, 235-247.
Yamagishi, T. “The Provision of a Sanctioning System as a Public Good.” Journal of
Personality and Social Psychology, 51(1), 1986, 110-116.

24
TABLES AND FIGURES
TABLE 1 Design Information
Treatment Sequence I (Rounds 1-10)
Sequence II (Rounds 11-20)
Number of Sessions
Number of Independent Groups
baseline VCM VCM 3 9 sanction VCM VCM/sanction 3 9 reward VCM VCM/reward 3 9
sanction&reward VCM VCM/sanction or reward
3 9
TABLE 2 Individual Expenditures on Sanctions and Rewards
Dependent Variable: Expenditures on Sanctions
Dependent Variable: Expenditures on Rewards
Independent Variables sanction sanction&reward reward sanction&rewardGroup Per-Capita Allocation
to Group Account −0.7257
(p= 0.030) −2.5332
(p= 0.000) 0.1995
(p= 0.266) 1.8453
(p= 0.000) Individual Allocation to
Group Account 0.7586
(p= 0.000) 0.7902
(p= 0.001) 0.2715
(p= 0.001) −0.2929
(p= 0.151) Note: Tobit maximum likelihood estimates. Group and round dummies were also included as
independent variables.

25
TABLE 3
Recipients of Sanctions or Rewards Dependent variable: Net Rewards Received
Independent Variables sanction reward sanction&reward Others' Average Group
Account Allocation 0.4597
(p= 0.101) 0.5316
(p= 0.000) 0.7495
(p= 0.000) Absolute Negative
Deviation −1.8548
(p= 0.000) −0.8623
(p= 0.000) −1.2488
(p= 0.000) Absolute Positive
Deviation 0.2233
(p= 0.301) 0.6262
(p= 0.000) 0.3115
(p= 0.017) Note: Tobit maximum likelihood estimates. Group and round dummies were also included as independent variables.
TABLE 4
Decision Making Across Rounds Dependent variable: Individual Group Allocations
Independent Variables Sanction reward sanction&reward Individual Group Allocation in Previous Round
0.537 (p=.011)
1.268 (p=.000)
0.240 (p=.326)
Individual Group Allocation Lagged 2 Rounds
-0.166 (p=.084)
-0.102 (p=.468)
0.020 (p=.850)
Positive Deviation from Others in Previous Round
-0.427 (p=.052)
-1.668 (p=.000)
-0.770 (p=.003)
Negative Deviation from Others in Previous Round
0.409 (p=.104)
1.175 (p=.000)
0.453 (p=.125)
Sanctions Received in Previous Round
0.121 (p=.097)
0.082 (p=.624)
Rewards Received in Previous Round
1.007 (p=.000)
0.39 (p = 0.003)
Note: Tobit maximum likelihood estimates. Individual fixed effects were also included as independent variables.

FIGURE 1
Allocations to Group Account
Decision Round
% Tokens Allocated to Group Account
1 2 3 4 5 6 7 8 9 10 11 12 13 14 15 16 17 18 19 200
10
20
30
40
50
60
70
80
90
100
baseline sanction
reward sanction&reward
Sequence 1 Sequence 2
26

FIGURE 2
Allocations to Group Account: By Group
Baseline
025
5075
100
025
5075
100
025
5075
100
0 5 10 15 20 0 5 10 15 20 0 5 10 15 20
Group 1 Group 2 Group 3
Group 4 Group 5 Group 6
Group 7 Group 8 Group 9
% T
oken
s A
lloca
ted
to G
roup
Acc
ount
Decision Round
Sanction
025
5075
100
025
5075
100
025
5075
100
0 5 10 15 20 0 5 10 15 20 0 5 10 15 20
Group 1 Group 2 Group 3
Group 4 Group 5 Group 6
Group 7 Group 8 Group 9
% T
oken
s A
lloca
ted
to G
roup
Acc
ount
Decision Round
27
Reward
025
5075
100
025
5075
100
025
5075
100
0 5 10 15 20 0 5 10 15 20 0 5 10 15 20
Group 1 Group 2 Group 3
Group 4 Group 5 Group 6
Group 7 Group 8 Group 9
% T
oken
s A
lloca
ted
to G
roup
Acc
ount
Decision Round
Sanctions&Reward
025
5075
100
025
5075
100
025
5075
100
0 5 10 15 20 0 5 10 15 20 0 5 10 15 20
Group 1 Group 2 Group 3
Group 4 Group 5 Group 6
Group 7 Group 8 Group 9
% T
oken
s A
lloca
ted
to G
roup
Acc
ount
Decision Round
28

FIGURE 3
Efficiency: Earnings as a % of Maximum
S eq uence II O b serva tio ns
D ecis io n R o u n d
E arn in g s as a % o f M axim u m
11 12 13 14 15 16 17 18 19 2050
60
70
80
90
100
baseline sanction
rew ard sanction& rew ard
29

FIGURE 4
Tokens Used for Sanctions and/or Rewards
sanction treatmentreward treatment
Decision Round
Average % of Tokens per Individual
11 12 13 14 15 16 17 18 19 200
10
20
30
40
50
sanction&rewardtreatment
Decision Round
Average % of Tokens per Individual
11 12 13 14 15 16 17 18 19 200
10
20
30
40
50
Rewards
Sanctions Rewards
Sanctions
30

FIGURE 5
Net Reward Received in Relation to
Deviation from Others' Average Group Allocation
Ave
rage
Net
Rew
ard
Rec
eive
d
-6
-4
-2
0
2
4
6 sa n c tio n re w a rd
[-6 , -5 ] ( -5 , -3 ] (-3 , -1 ] (-1 , 1 ] (1 , 3 ] (3 , 5 ] (5 ,6 ]
sa n c tio n & re w a rd
Deviation from the average group allocation of other group members
31

32
Appendix I: Instructions
Screen Prints from Instructions for sanction&reward treatment. Changes made for neutral wording sessions indicated in [ ]. Instructions for the other treatments were very similar, variations only in regard to whether rewards only, sanctions only, or no rewards and sanctions were permitted. This is an experiment about decision-making. Several research foundations have provided the funds for this experiment. The instructions are simple and if you follow them carefully and make good decisions you might earn a considerable amount of money which will be paid to you privately and in cash at the end of today's session. The amount of money you earn depends on the decisions that you and the other participants make. You will never be asked to reveal your identity to anyone during the course of the experiment. Your name will never be associated with any of your decisions. In order to keep your decisions private do not reveal your choices to any other participant. THIS EXPERIMENT This experiment consists of TWO SEQUENCES of decision rounds. EACH SEQUENCE CONTAINS 10 DECISION ROUNDS. You will be in a group of size four (you plus three other people). We have already randomly assigned you to a group. YOU WILL REMAIN IN THIS GROUP FOR THE REST OF THIS EXPERIMENT. However, you will not be told each other's identities. Your earnings will depend upon the decisions that you make and the decisions that the other people in your group make. SEQUENCE 1 (decision rounds 1-10) Each round you will be endowed with 6 tokens. You must choose how many of these tokens to keep in your PRIVATE ACCOUNT and how many tokens to allocate to a GROUP ACCOUNT. The amount of money that you earn in each decision round depends on how many tokens you place in your private account, how many tokens you allocate to the group account, and how many tokens the others in your group allocate to the group account. You can choose any number of tokens to allocate to your private account, from 0 through 6 tokens, and any number to allocate to the group account (also any number from 0 through 6 tokens). However, the number of tokens you allocate to your private account and to the group account must sum to 6. You will earn 10 web-cents for each token you allocate to your private account. For each token you allocate to the group account, you will earn 5 web-cents, and each of the other three people in your group will also earn 5 web-cents (a total of 20 web-cents for all four of you together). For each token another person in your group allocates to their own private account, they also earn 10 web-cents. For each token another person in your group allocates to the group account, this person will earn 5 web-cents, and each of the other people in your group will also earn 5 web-cents (a total of 20 web-cents for the group). TO SUMMARIZE, in each of rounds 1-10 you will earn:
10 web-cents times the number of tokens you allocate to your private account PLUS 5 web-cents times the total number of tokens allocated to the group account by everyone in their group.
At the beginning of each round, you will see a screen like the one shown below. You will enter an amount to allocate to the group account by clicking the "+1" and "-1" buttons. The amount allocated to your private account is the part of your endowment that is left after you have entered

33
your group allocation amount. Once you have entered an amount, click the "Submit Allocation Decision" button and you will be asked to confirm your decision. If your decision is ok, click OK. If it is not, or you wish to change your decision, click Cancel. PLEASE TRY THIS NOW. After all individuals have made their decisions for the round, the computer will tabulate the results. You will be informed of the total allocation to the group account and your total earnings for the round. You will also be informed of the allocation decisions of each member of the group. On your own screen your allocation decision will be listed first, and the other three decisions will listed in random order. Thus, information about individual decisions will be completely anonymous. This same process will be repeated for a total of 10 rounds. Notice that you will have 6 tokens to allocate in each of the 10 rounds. Note that at the end of a round the decisions of the other people in your group are listed in random order. This means, for example, that the person listed second in one round may be different from the person listed second in another. SEQUENCE 2 (decision rounds 11-20) In the second sequence of decision rounds (rounds 11-20), each decision round will have two parts. PART 1 of SEQUENCE 2: In the first part of the decision round, the type of decision you make will be just like the type of decision you made in rounds 1-10. In part one of each round you will be endowed with 6 tokens. You must choose how many of these tokens to keep in your private account and how many tokens to allocate to a group account. The amount of money that you earn in part one of each decision round depends on how many tokens you place in your private account, how many tokens you allocate to the group account, and how many tokens the others in your group allocate to the group account. You can choose any number of tokens to allocate to your private account, from 0 through 6 tokens, and any number to allocate to the group account (also any number from 0 through 6 tokens). However, the number of tokens you allocate to your private account and to the group account must sum to 6. You will earn 10 web-cents for each token you allocate to your private account. For each token you allocate to the group account, you will earn 5 web-cents, and each of the other three people in your group will also earn 5 web-cents (a total of 20 web-cents for all four of you together). For each token another person in your group allocates to their own private account, this person will earn 10 web-cents. For each token another person allocates to the group account, this person will earn 5 web-cents,and each of the other people in your group will also earn 5 web-cents (a total of 20 web-cents for the group). TO SUMMARIZE, in the first part of each of rounds 11-20 you will earn:
10 web-cents times the number of tokens you allocate to your private account PLUS 5 web-cents times the total number of tokens allocated to the group account by everyone in their group.
In each round in the second sequence, at the end of part 1 you will be informed of the total allocation to the group account and your total earnings for part 1 of that round. You will also be informed of the allocation decisions of each member of the group. On your own screen your allocation decision will be listed first, and the other three decisions will listed in random order. Thus, information about individual decisions will be completely anonymous.

34
PART 2 of SEQUENCE 2: In the second part of each round in the second sequence you will be endowed with 6 tokens. You must choose how many of these tokens to keep in your private account and how many tokens to use to reward or sanction each of the other group members. The amount of money that you earn in the second part of a round depends on how many tokens you place in your private account, and how many tokens the others in your group reward or sanction you. In part 2 you can choose any number of tokens to allocate to your private account, from 0 through 6 tokens, and any number to reward or sanction other group members (also any number from 0 through 6 tokens for each other group member). However, the number of tokens you allocate to your private account and to rewarding or sanctioning other group members must sum to 6. You will earn 10 web-cents for each token you allocate to your private account. For each token you use to reward another group member, that group member will receive 10 web-cents. For each token you use to sanction another group member, that group member will lose 10 web-cents. For each token another person in your group allocates to their private account, this person will earn 10 web-cents. For each token this person uses to reward another group member, that group member will receive 10 web-cents. In particular, if another person in your group rewards you, you will receive 10 web-cents. For each token this person uses to sanction another group member, that group member will lose 10 web-cents. In particular, if another person in your group sanctions you, you will lose 10 web-cents. TO SUMMARIZE, in part 2 of each round in the second sequence you will earn:
10 web-cents times the number of tokens you allocate to your private account PLUS 10 web-cents times the number of tokens the other group members reward you MINUS
10 web-cents times the number of tokens the other group members sanction you. Your total earnings for the round will be the sum of your earnings from part 1 and part 2 of that round. It is possible for your earnings to be negative in a given decision round. In part 1 of each round, you will decide how to allocate your tokens between your private account and the group account. You will then see the results from part 1 and move to part 2. At the beginning of part 2, you will see a screen like the one shown below. The first column of each row lists how many tokens another group member allocated to the group account in part 1. The amount you enter in the two columns beside it is the number of tokens you wish to use to reward (first column) or sanction Remember, in part 2 of each sequence 2 round you will have 6 tokens that can be allocated to your private account or used to reward and/or sanction the other players in your group. As in part 1, you enter amounts by clicking the "+1" and "-1" buttons. Also as in part 1, the amount of tokens allocated to your private account is the amount of your endowment that is left after you have entered your reward and/or sanction amounts. Once you have entered these amounts, click the "Submit Reward/Sanction Decisions" button you will be asked to confirm your decision. If your decision is ok, click OK. If it is not, or you wish to change your decision, click Cancel.

35
Remember - In part 2, the number of tokens you allocate to your private account and the number you use to reward or sanction other group members must sum to 6. That is, you can enter any number between 0 and 6 inclusive in any of the spaces in the table, but all the numbers you enter must add up to 6 OR LESS. After all individuals have made their decisions for the part 2 of each round, the computer will tabulate the results and you will be informed of your earnings from part 1, part 2, and the total for the round. This same process will be repeated for all 10 rounds of the second sequence, that is, rounds 11-20. Notice that you will have 6 tokens to allocate in each part of each of the 10 rounds. Note that at the end of a round the decisions of the other people in your group are listed in random order. This means, for example, that the person listed second in one round may be different from the person listed second in another. EARNING MONEY IN THIS EXPERIMENT We will record your web-cent earnings in every round this experiment. At the end of the experiment we will add up these web-cent earnings and convert them to U.S. dollars by multiplying by 0.01. We will pay you this amount privately and in cash. Your earnings are your own business and you do not have to discuss them with anyone. During the experiment, you are not permitted to speak or communicate with the other participants. If you have a question while the experiment is going on, please raise your hand and one of us will come to your seat to answer it. At this time, do you have any questions about the instructions or procedures? If you have a question now or at any time during the experiment, please raise your hand and one of us will come to your seat to answer it. Finally, a history screen with a summary of past decisions and earnings will be available. To see the history screen, click the "History" button at the bottom of your screen. To continue, you must click the "Close History" button at the bottom of the history screen. Please click "Continue" to begin the experiment.

36
Appendix II: Group data - averages in terms of tokens per group member per round B refers to baseline, etc. X refers to additional experiments with extended time horizon. N refers to additional
experiments using neutral language. Group allocation to group account in round sanctions in round rewards in round
1 10 Seq I 11 Last
Seq II 11 last Seq II 11 last Seq II
B1 2.75 1.25 2.375 3.00 1.25 1.725 - - - - - - B2 3.25 3.00 3.925 3.75 1.75 2.975 - - - - - - B3 5.00 3.00 4.375 3.25 0.50 2.250 - - - - - - B4 1.75 0.25 1.175 0.50 0.75 0.625 - - - - - - B5 2.25 3.00 2.250 3.00 2.00 3.350 - - - - - - B6 2.50 2.25 2.700 2.50 1.50 1.775 - - - - - - B7 4.75 4.00 5.325 5.25 5.00 5.175 - - - - - - B8 2.75 3.25 3.450 4.00 2.75 3.850 - - - - - - B9 3.00 1.75 2.650 2.50 1.00 1.525 - - - - - - S1 4.75 5.75 5.825 6.00 5.75 5.975 0.25 0.00 0.100 - - - S2 2.75 3.00 2.850 2.00 4.50 4.150 3.00 0.75 1.600 - - - S3 5.00 4.50 5.100 4.50 4.75 5.150 0.50 0.75 0.750 - - - S4 3.00 3.25 2.825 3.50 1.75 2.400 3.00 1.50 1.800 - - - S5 3.00 0.75 3.100 1.50 1.50 3.025 3.75 3.00 3.375 - - - S6 3.00 1.50 2.525 2.25 0.25 1.350 0.75 0.00 0.250 - - - S7 2.50 2.00 2.225 1.75 1.50 2.775 3.50 2.50 3.825 - - - S8 5.25 4.50 5.300 4.50 6.00 5.325 1.00 0.00 0.725 - - - S9 2.00 1.00 1.500 1.75 1.75 1.925 1.25 0.25 1.150 - - - R1 2.00 2.25 2.050 2.25 1.00 2.775 - - - 2.50 0.00 1.250 R2 2.00 1.25 1.600 1.25 1.50 2.925 - - - 2.50 0.50 1.575 R3 4.75 4.25 5.100 5.75 4.5 5.300 - - - 2.25 1.00 0.850 R4 3.25 2.75 4.475 5.00 1.00 3.425 - - - 2.50 0.00 1.300 R5 2.00 0.50 2.225 2.25 2.25 3.025 - - - 3.00 0.00 1.350 R6 3.50 1.75 3.100 3.25 0.25 3.075 - - - 2.75 0.00 1.200 R7 2.75 3.00 4.150 5.00 0.00 4.300 - - - 3.50 0.00 0.975 R8 3.00 0.50 1.700 3.00 0.25 3.575 - - - 2.00 0.00 1.425 R9 3.00 3.25 4.375 4.75 0.25 3.700 - - - 1.25 0.00 0.525
RS1 3.25 2.75 2.750 4.00 2.50 4.250 0.75 0.75 0.750 2.75 1.50 1.925 RS2 3.50 2.75 3.525 2.75 5.00 4.350 2.00 0.00 0.525 0.75 0.25 0.550 RS3 4.00 3.00 4.350 5.25 4.50 5.625 0.00 1.75 0.175 2.25 0.00 0.900 RS4 4.25 3.50 4.900 4.75 4.50 5.675 0.50 0.25 0.125 2.50 0.50 1.850 RS5 3.50 3.50 3.075 3.75 3.75 4.025 0.00 0.00 0.250 2.75 0.00 0.875 RS6 3.75 6.00 5.675 5.75 4.50 5.675 0.25 2.25 0.525 5.00 0.00 3.150 RS7 2.00 1.00 1.400 1.50 2.00 2.000 0.25 0.00 0.400 1.75 0.00 0.500 RS8 2.50 2.25 2.325 1.50 2.00 2.425 0.50 0.50 0.325 2.50 0.00 0.575 RS9 3.00 3.50 3.750 3.50 6.00 5.175 0.25 0.00 0.300 2.25 2.25 2.225 SX1 4.50 2.00 3.400 3.75 2.50 3.388 2.00 1.50 1.000 - - - SX2 3.75 5.50 5.200 5.75 6.00 5.613 1.75 0.00 0.400 - - - SX3 1.00 2.00 2.600 2.75 3.25 3.200 2.00 0.75 1.163 - - - RX1 4.25 1.00 4.275 5.50 0.50 1.888 - - - 4.00 0.00 0.700 RX2 2.75 1.25 1.475 1.25 1.00 2.238 - - - 1.25 0.00 1.050 RX3 3.25 1.00 2.825 2.75 0.50 4.025 - - - 2.00 0.00 0.600
RSN1 2.00 2.00 2.100 1.75 3.75 3.175 0.75 1.25 1.475 0.50 0.50 0.850 RSN2 2.25 2.25 1.925 2.25 1.75 1.400 1.25 0.50 0.500 2.50 0.25 2.025 RSN3 4.25 0.00 2.275 3.00 5.25 4.750 1.75 0.00 0.925 3.00 1.50 1.875 RSN4 2.00 1.75 2.075 2.00 2.25 2.175 0.75 1.00 0.800 2.25 0.25 0.725 RSN5 2.50 0.25 1.725 1.50 0.75 1.625 1.00 0.25 0.400 1.50 0.00 0.700 RSN6 0.75 1.25 0.875 1.00 1.25 1.300 0.75 0.00 0.325 2.25 0.50 1.050

37
ENDNOTES
1 See Ostrom (1990) for an insightful discussion of governance of common pool resources and the role of sanctions.
Also see Kerr (1999) for evidence related to social exclusion.
2 Recent experimental studies provide strong support for the role of norms of reciprocity in social dilemma settings.
For examples, see Orbell, van de Kraght, and Dawes (1988), Isaac, Walker, Williams (1994), Sonnemans, Schram,
Offerman (1999), Keser (1997, 2000), Croson (1998), Gunnthorsdottir, Houser, McCabe, and Ameden (2000),
Clark and Sefton (2001), Schmidt, Shupp, Walker, Ahn, and Ostrom (2001), Coats and Neilson (2005), and Seely,
Van Huyck, and Battalio (2005).
3 See Ledyard (1995) for a review.
4 Also see Orbell, van de Kragt, and Dawes (1988) and Isaac and Walker (1988) for a discussion of the
effectiveness of face-to-face non-binding communication as an institution for facilitating cooperation in public
goods environments.
5 Over the last several years, the literature has produced several other studies designed to examine the use of rewards
or sanctions in public goods settings or other dilemma settings, including Anderson and Putterman (2006),
Andreoni, Harbaugh, and Vesterlund (2003), Bochet, Page, and Putterman (2006), Carpenter (forthcoming),
Dickinson (2001), Dugar (2005), Falkinger, Fehr, Gächter and Winter-Ebmer (2000), Kroll, Cherry, and Shogren
(2003), Masclet, Noussair, Tucker, and Villeval (2003), Walker and Halloran (2004).
6 Students in introductory economics have majors in numerous disciplines including business, political science,
journalism, and economics. Less that 5% are economics majors.
7 See Appendix I for a copy of the instructions.
8 Each session was completed in approximately one hour. Subject earnings averaged $28.91 (which includes a $5
participation fee).
9 The procedure of informing subjects about both decision sequences prior to any decisions was for experimental
control. Across experimental sessions, it is always possible that potential subjects may talk to subjects from prior
experiments. This is true for all multi-session experiments. Informing subjects of the full experimental protocol,
prior to any decisions, eliminates the possibility that subjects have incorrect expectations regarding the nature of the
experiment.
10 Unlike Fehr and Gachter (2000), our protocol includes a fixed number of tokens that can be used each round for
sanctions/rewards. This protocol was used for control purposes. Across rounds and across treatments, subjects have
38
identical opportunities for rewards/sanctions. Our design also used a constant “fee/fine” ratio for sanctions and a
constant “fee/reward” ratio for rewards. See Casari (2005) for a discussion of the implications of alternative cost
structures for sanctions.
11 In the sanction treatments there are other Nash equilibria, including some that support efficient allocations.
However, equilibrium strategies that support efficient allocations rely on non-credible threats to sanction free riders.
12 To explain this behavior, the theoretical literature focuses on factors within the game and those in the environment
surrounding a particular play of the game that are posited to affect individual motivation and behavior. Recent
modeling approaches have turned to representations of subjects’ preferences beyond own pecuniary motivations. In
addition to pecuniary payoffs, these models include subjects’ orientations to altruism, fairness, or reciprocity. For
examples, see Sugden (1984), Andreoni (1989), Bolton and Ockenfels (2000), Hoffman, McCabe and Smith (1998),
Fehr and Schmidt (1999), and Falk and Fischbacher (2006), Ahn, Ostrom, and Walker (2002).
13 Although not targeted at specific individuals, reducing/increasing group allocations in the VCM game can be
viewed as forms of sanctions/rewards imposed on others in the group. However, unlike the sanctions investigated
here, individuals reducing group allocations in the stage game receive greater payoffs for themselves.
14 Appendix II contains summary group-level data.
15 Treating each group as an independent observation and averaging across decision rounds of Sequence I, an F-test
of differences across treatments is not significant (F=0.18, n=36, p=0.907). A non-parametric Kruskal-Wallis test
supports this conclusion.
16 As Isaac, Walker and Williams (1994) demonstrate, the level and rate of group allocations in VCM games is
strongly correlated with the marginal per capita return from the group account, as well as group size and number of
rounds. Fehr and Gächter, in their partners treatment, with four-person groups and a marginal per capita return of
0.4, find an overall average group allocation of 37% over 10 rounds and 18% in the final round. In a related study,
with virtually identical parameters to our own, Swope (2002) finds an overall group allocation of 45% and a final
round allocation of 23%.
17 Round 11 (F=0.39, n=36, p=0.759), Round 20 (F=4.87, n=36, p=.007), All Rounds (F=2.64, n=36, p=0.066).
Non-parametric tests support these conclusions.
18 Two-tail, paired t-test, n=9, differences between rounds 11 and 20, baseline (t =4.16, p=0.003) reward (t = 3.72,
p=0.005), sanction (t = 0.00, p= 0.500), and sanction&reward (t = -0.474, p = 0.648). Non-parametric tests support
these conclusions.
39
19 Baseline vs. reward, two-tail t-test, n=18, Round 11 (t = -0.78, p = 0.447), Round 20 (t = 0.927, p = 0.368), All
Rounds (t = -1.84, p = 0.089). Non-parametric tests support these conclusions.
20 Baseline vs. sanction&reward, two-tail t-test, n=18, Round 11 (t = -0.84, p = 0.415), Round 20
(t = -3.096, p = 0.007), All Rounds (t = -2.715, p = 0.016). Non-parametric tests support these conclusions.
21 Baseline vs. sanction, two-tail test, n=18, Round 11 (t = 0.00, p = 0.500), Round 20 (t = -1.47, p = 0.163), All
Rounds (t = -1.36, p = 0.191). Non-parametric tests support these conclusions.
22 An alternative specification would calculate efficiency as the increase in earnings over minimum possible
earnings. In Sequence I, with no possibilities for sanctions or rewards, minimum possible group earnings occur
when no tokens are allocated to the group account. Using this measure, the average efficiency was 56% in Sequence
I, pooling across all 4 treatments. Finally, it is certainly the case that the gains from cooperation (increases in social
welfare) may go beyond pure increases in pecuniary earnings.
23 Using a paired t-test, comparing round 11 to round 20, the reward treatment yields an average decrease of 13.3%
(t = 3.723, n=9, p=0.006), while the sanction treatment yields an average increase of 10.2%, (t = 2.393, n=9,
p=0.044). Non-parametric statistics support these conclusions.
24 Given that subjects had 6 tokens to use for sanctions/rewards, it is possible that some subjects, especially in early
rounds, faced a binding constraint in their decisions to sanction or reward. Across all three treatments, however, in
only 81 of 1080 decisions did a subject allocate all 6 tokens to either sanctions or rewards.
25 Correlation coefficient = -.056, p=.744, n=36.
26 Both of these studies suggest “blind revenge” as one possible motivation for this type of behavior.
27 Fehr and Gächter (2000) use sanction received as the dependent variable, so consistency with their reported
results requires that our coefficients have the opposite signs.
28 The unit of observation is the average per round value measured in cents for: a) individual subject’s earnings
within a treatment (n=36), and b) individual group’s earnings within a treatment on a per-capita basis (n=9).
Individuals by treatment: sanction (range=123, var=1258.31), sanction&reward (range=86.5, var=391.54), reward
(range=66, var=237.56), baseline (range=50, var=220.77. Groups by treatment: sanction (range=106.5,
var=1248.01), sanction&reward (range=42.25, var=225.57), reward (range=25.25, var=64.42), baseline
(range=45.5 var=193.98).
29 Based on differences in implementation costs, Oliver (1980) develops an argument that sanctions will be more
efficient in settings where near unanimous cooperation is required, while rewards will be more efficient if
cooperation by only a small proportion of a group is required.

40
30 To examine the robustness of our results, we conducted an additional session, with three groups of four subjects,
of both the reward and the sanction treatments, but with 20 rounds in Sequence II instead of 10. The results from
these sessions are strikingly similar to those from our original design. In addition, our initial instructions
specifically included wording that referred to opportunities to 'sanction' or 'reward' others. To investigate whether
this framing may have had an impact on behavior, we ran two additional sessions, six 4-person groups, of our
sanction&reward treatment. These sessions replaced references to ‘sanctions’ and ‘rewards’ with wording that
simply referred to opportunities to decrease or increase others’ earnings. The general pattern of change in group
allocations is similar to that observed in the sanction&reward treatment in the initial study. Further, the use of
rewards and sanctions in these sessions is very similar to that observed in the original sanction&reward sessions.
Appendix II includes summary information on these additional experiments.
31 Ostrom, Walker and Gardner (1992) show that the frequencies of use of sanctions in a common-pool resource
environment are inversely related to the cost of sanction and positively correlated with the magnitude of the
sanction. The Ostrom, Walker and Gardner study finds little evidence that sanctions improve earnings net of
sanctions. In addition, Fehr and Gächter have recently conducted experiments examining the cost technology
associated with rewards and sanctions. They find that when the ratio of the cost of being sanctioned to the cost of
sanctioning is 1 to 1 group allocations display a slight downward trend, whereas when the ratio is 3 to 1 group
allocations increase to near 100% (Gächter, personal communication).
32 With this one-to-one sanctioning technology, a subject cannot use sanctions to reduce her earnings disadvantage
relative to a free rider. However, coordinated sanctioning by the rest of the group could reduce a free rider's earnings
advantage.