Rewarding Strivers: Helping Low-Income Students Succeed in College Affordability and College...
33
Rewarding Strivers: Rewarding Strivers: Helping Low-Income Helping Low-Income Students Succeed in Students Succeed in College College Affordability and College Affordability and College Attainment in Wisconsin Public Attainment in Wisconsin Public Higher Education Higher Education University of Wisconsin - Madison University of Wisconsin - Madison Richard D. Kahlenberg Richard D. Kahlenberg July 8, 2011 July 8, 2011
-
Upload
caroline-king -
Category
Documents
-
view
231 -
download
0
Transcript of Rewarding Strivers: Helping Low-Income Students Succeed in College Affordability and College...
Rewarding Strivers:Rewarding Strivers:Helping Low-Income Helping Low-Income Students Succeed in Students Succeed in
CollegeCollege
Affordability and College Attainment Affordability and College Attainment in Wisconsin Public Higher in Wisconsin Public Higher
EducationEducation
University of Wisconsin - MadisonUniversity of Wisconsin - Madison
Richard D. KahlenbergRichard D. Kahlenberg
July 8, 2011July 8, 2011
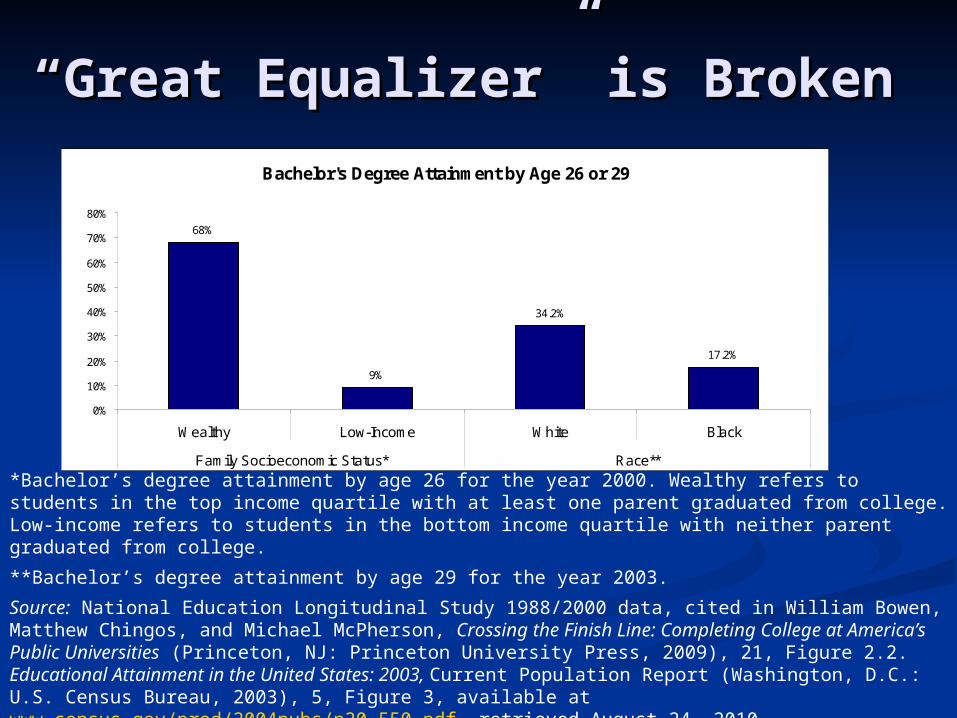
*Bachelor’s degree attainment by age 26 for the year 2000. Wealthy refers to students in the top income quartile with at least one parent graduated from college. Low-income refers to students in the bottom income quartile with neither parent graduated from college.
**Bachelor’s degree attainment by age 29 for the year 2003.
Source: National Education Longitudinal Study 1988/2000 data, cited in William Bowen, Matthew Chingos, and Michael McPherson, Crossing the Finish Line: Completing College at America’s Public Universities (Princeton, NJ: Princeton University Press, 2009), 21, Figure 2.2. Educational Attainment in the United States: 2003, Current Population Report (Washington, D.C.: U.S. Census Bureau, 2003), 5, Figure 3, available at www.census.gov/prod/2004pubs/p20-550.pdf, retrieved August 24, 2010.
““Great Equalizer” is Broken Great Equalizer” is Broken
Bachelor's Degree Attainment by Age 26 or 29
68%
9%
34.2%
17.2%
0%
10%
20%
30%
40%
50%
60%
70%
80%
Wealthy Low-Income White Black
Family Socioeconomic Status* Race**
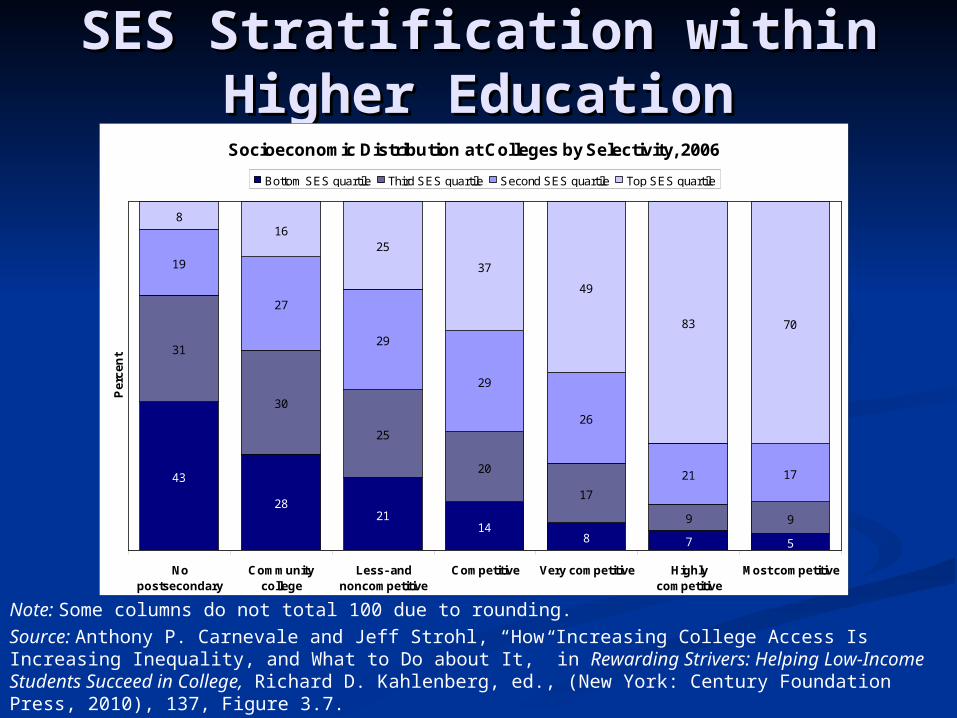
SES Stratification within SES Stratification within Higher EducationHigher Education
Note: Some columns do not total 100 due to rounding.
Source: Anthony P. Carnevale and Jeff Strohl, “How Increasing College Access Is Increasing Inequality, and What to Do about It,” in Rewarding Strivers: Helping Low-Income Students Succeed in College, Richard D. Kahlenberg, ed., (New York: Century Foundation Press, 2010), 137, Figure 3.7.
Socioeconomic Distribution at Colleges by Selectivity, 2006
43
2821
148 7 5
31
30
25
20
17
9 9
19
27
29
29
26
21 17
816
25
37
49
83 70
Nopostsecondary
Communitycollege
Less- andnoncompetitive
Competitive Very competitive Highlycompetitive
Most competitive
Pe
rce
nt
Bottom SES quartile Third SES quartile Second SES quartile Top SES quartile
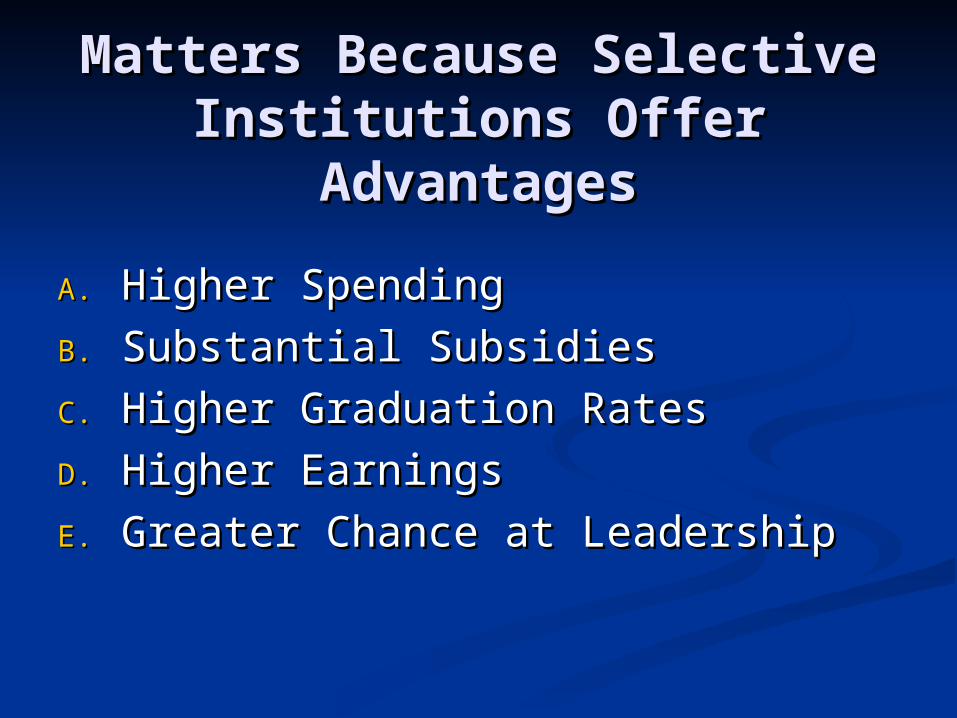
Matters Because Selective Matters Because Selective Institutions Offer Institutions Offer
AdvantagesAdvantages
A.A. Higher SpendingHigher Spending
B.B. Substantial SubsidiesSubstantial Subsidies
C.C. Higher Graduation RatesHigher Graduation Rates
D.D. Higher EarningsHigher Earnings
E.E. Greater Chance at LeadershipGreater Chance at Leadership
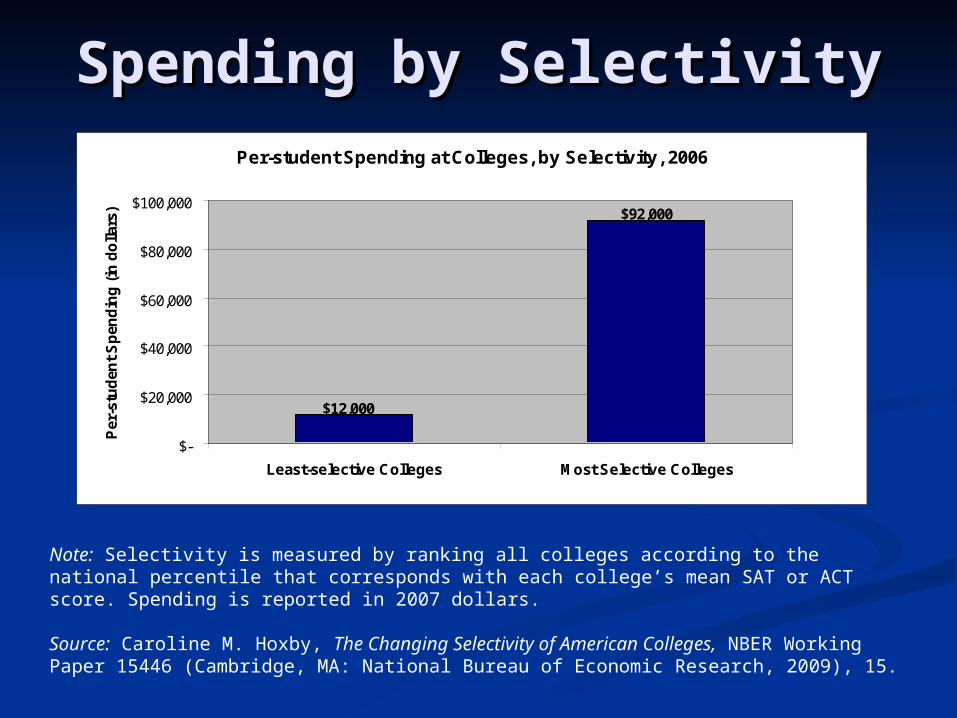
Spending by SelectivitySpending by SelectivityPer-student Spending at Colleges, by Selectivity, 2006
$12,000
$92,000
$-
$20,000
$40,000
$60,000
$80,000
$100,000
Least-selective Colleges Most Selective Colleges
Per
-stu
den
t S
pen
din
g (
in d
olla
rs)
Note: Selectivity is measured by ranking all colleges according to the national percentile that corresponds with each college’s mean SAT or ACT score. Spending is reported in 2007 dollars.
Source: Caroline M. Hoxby, The Changing Selectivity of American Colleges, NBER Working Paper 15446 (Cambridge, MA: National Bureau of Economic Research, 2009), 15.
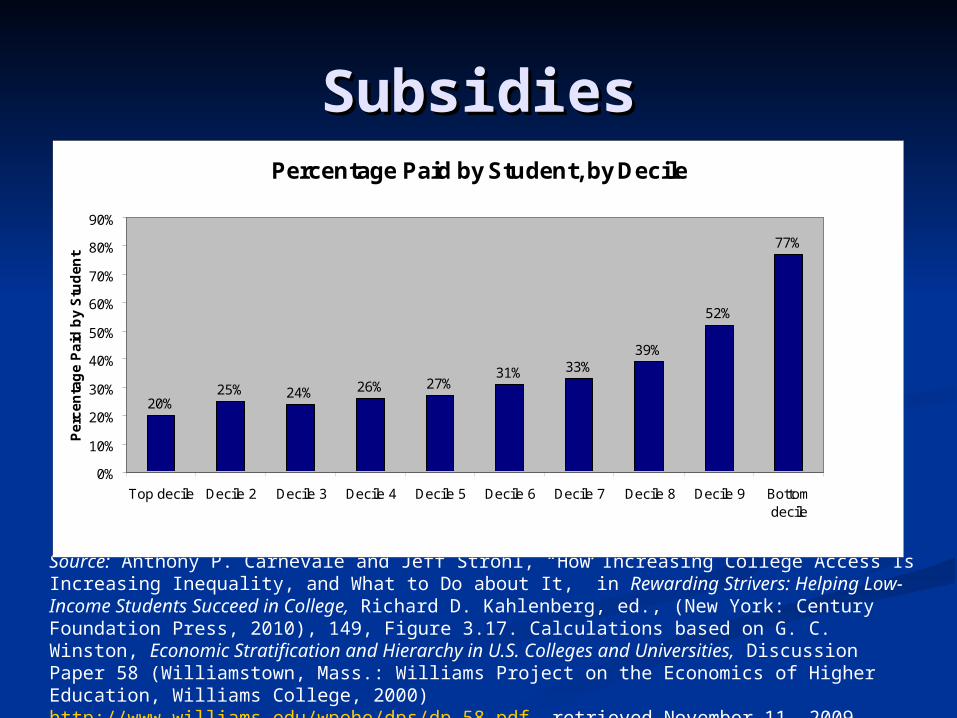
SubsidiesSubsidies
Source: Anthony P. Carnevale and Jeff Strohl, “How Increasing College Access Is Increasing Inequality, and What to Do about It,” in Rewarding Strivers: Helping Low-Income Students Succeed in College, Richard D. Kahlenberg, ed., (New York: Century Foundation Press, 2010), 149, Figure 3.17. Calculations based on G. C. Winston, Economic Stratification and Hierarchy in U.S. Colleges and Universities, Discussion Paper 58 (Williamstown, Mass.: Williams Project on the Economics of Higher Education, Williams College, 2000) http://www.williams.edu/wpehe/dps/dp-58.pdf, retrieved November 11, 2009.
Percentage Paid by Student, by Decile
20%25% 24% 26% 27%
31% 33%39%
52%
77%
0%
10%
20%
30%
40%
50%
60%
70%
80%
90%
Top decile Decile 2 Decile 3 Decile 4 Decile 5 Decile 6 Decile 7 Decile 8 Decile 9 Bottomdecile
Pe
rce
nta
ge
Pa
id b
y S
tud
en
t
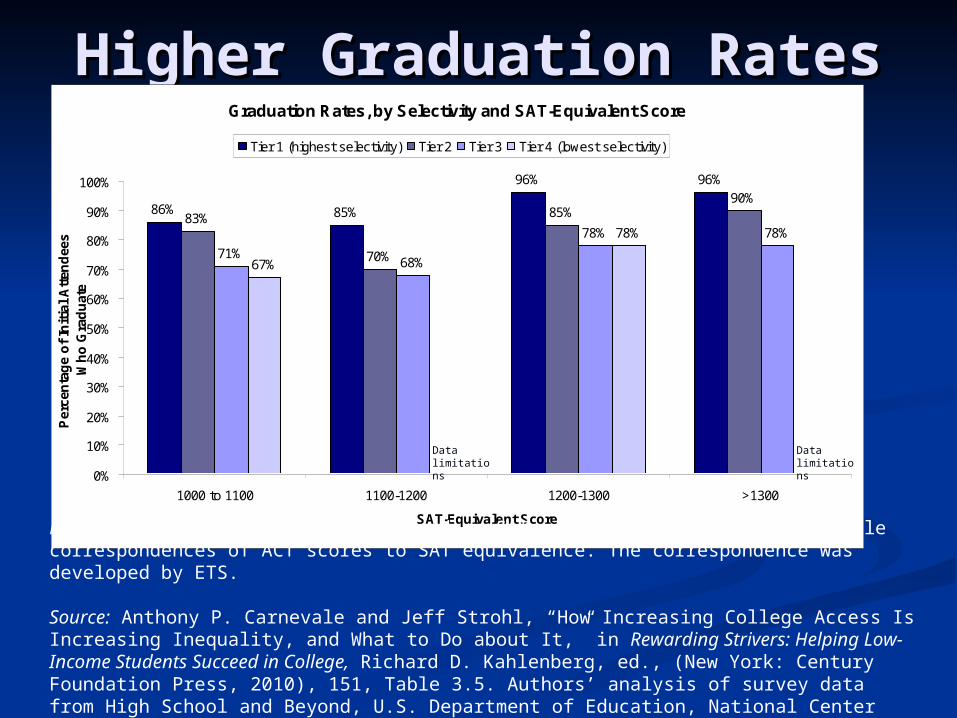
Higher Graduation RatesHigher Graduation RatesGraduation Rates, by Selectivity and SAT-Equivalent Score
86% 85%
96% 96%
83%
70%
85%90%
71%68%
78% 78%
67%
0%
78%
0%0%
10%
20%
30%
40%
50%
60%
70%
80%
90%
100%
1000 to 1100 1100-1200 1200-1300 >1300
SAT-Equivalent Score
Per
cen
tag
e o
f In
itia
l A
tten
dee
s W
ho
Gra
du
ate
Tier 1 (highest selectivity) Tier 2 Tier 3 Tier 4 (lowest selectivity)
Data limitations
Data limitations
Note: SAT-equivalent scores are based on SAT scores or equivalent percentile correspondences of ACT scores to SAT equivalence. The correspondence was developed by ETS.
Source: Anthony P. Carnevale and Jeff Strohl, “How Increasing College Access Is Increasing Inequality, and What to Do about It,” in Rewarding Strivers: Helping Low-Income Students Succeed in College, Richard D. Kahlenberg, ed., (New York: Century Foundation Press, 2010), 151, Table 3.5. Authors’ analysis of survey data from High School and Beyond, U.S. Department of Education, National Center for Education Statistics, http://nces.ed.gov/surveys/hsb/.

Higher EarningsHigher Earnings
Note: Dollar amounts are in 2007 dollars.
Source: Anthony P. Carnevale and Jeff Strohl, “How Increasing College Access Is Increasing Inequality, and What to Do about It,” in Rewarding Strivers: Helping Low-Income Students Succeed in College, Richard D. Kahlenberg, ed., (New York: Century Foundation Press, 2010), 149, Figure 3.17. Authors’ calculations from Barron’s Selectivity Rankings, various years; National Education Longitudinal Study: Base Year through Fourth Follow-Up, 1988-2000 (Washington, D.C.: U.S. Dept. of Education, National Center for Education Statistics, 2000).
Entry-level Earnings of College Graduates, by Selectivity, 1999
$33,177
$39,880$41,779
$53,817
$37,081
$-
$10,000
$20,000
$30,000
$40,000
$50,000
$60,000
Community college Less andnoncompetitive
college
Competitive college Very competitivecollege
Most and highlycompetitive college
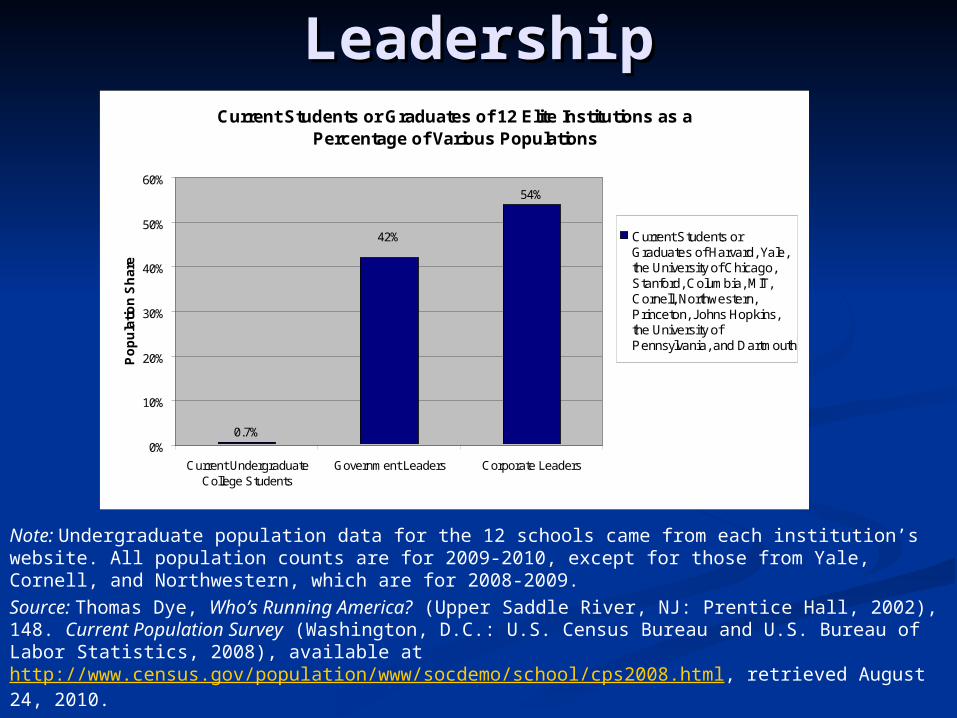
LeadershipLeadership
Note: Undergraduate population data for the 12 schools came from each institution’s website. All population counts are for 2009-2010, except for those from Yale, Cornell, and Northwestern, which are for 2008-2009.
Source: Thomas Dye, Who’s Running America? (Upper Saddle River, NJ: Prentice Hall, 2002), 148. Current Population Survey (Washington, D.C.: U.S. Census Bureau and U.S. Bureau of Labor Statistics, 2008), available at http://www.census.gov/population/www/socdemo/school/cps2008.html, retrieved August 24, 2010.
Current Students or Graduates of 12 Elite Institutions as a Percentage of Various Populations
0.7%
54%
42%
0%
10%
20%
30%
40%
50%
60%
Current UndergraduateCollege Students
Government Leaders Corporate Leaders
Po
pu
lati
on
Sh
are
Current Students orGraduates of Harvard, Yale,the University of Chicago,Stanford, Columbia, MIT,Cornell, Northwestern,Princeton, Johns Hopkins,the University ofPennsylvania, and Dartmouth
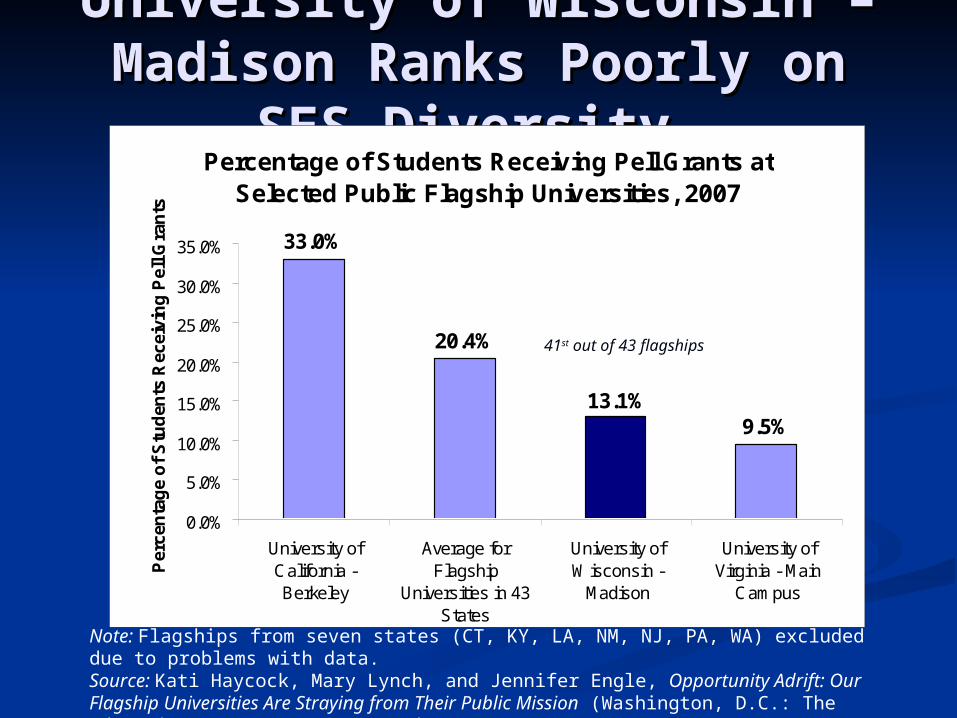
University of Wisconsin – University of Wisconsin – Madison Ranks Poorly on Madison Ranks Poorly on
SES Diversity SES Diversity
Note: Flagships from seven states (CT, KY, LA, NM, NJ, PA, WA) excluded due to problems with data.Source: Kati Haycock, Mary Lynch, and Jennifer Engle, Opportunity Adrift: Our Flagship Universities Are Straying from Their Public Mission (Washington, D.C.: The Education Trust, 2010), 20, Figure 19.
Percentage of Students Receiving Pell Grants at Selected Public Flagship Universities, 2007
33.0%
20.4%
9.5%13.1%
0.0%
5.0%
10.0%
15.0%
20.0%
25.0%
30.0%
35.0%
University ofCalifornia -Berkeley
Average forFlagship
Universities in 43States
University ofWisconsin -
Madison
University ofVirginia - Main
Campus
Per
cen
tag
e o
f S
tud
ents
Rec
eivi
ng
Pel
l Gra
nts
41st out of 43 flagships
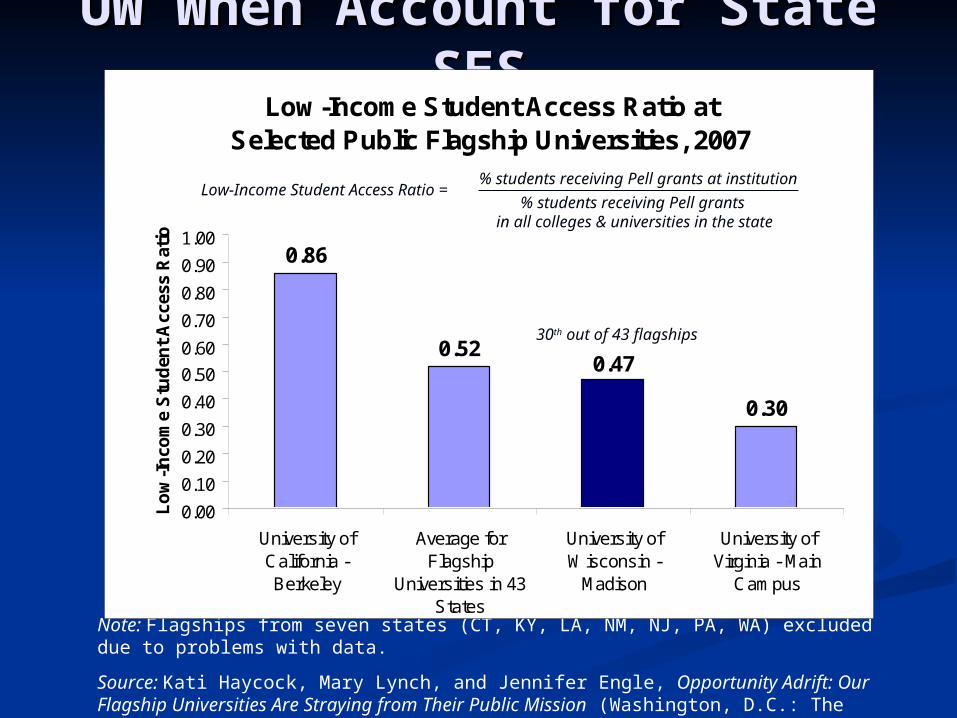
UW When Account for State UW When Account for State SESSES
Note: Flagships from seven states (CT, KY, LA, NM, NJ, PA, WA) excluded due to problems with data.
Source: Kati Haycock, Mary Lynch, and Jennifer Engle, Opportunity Adrift: Our Flagship Universities Are Straying from Their Public Mission (Washington, D.C.: The Education Trust, 2010), 20, Figure 19.
__ of __ states
Low-Income Student Access Ratio at Selected Public Flagship Universities, 2007
0.86
0.52
0.30
0.47
0.00
0.10
0.20
0.30
0.40
0.50
0.60
0.70
0.80
0.90
1.00
University ofCalifornia -Berkeley
Average forFlagship
Universities in 43States
University ofWisconsin -
Madison
University ofVirginia - Main
Campus
Lo
w-I
nco
me
Stu
den
t A
cces
s R
atio
30th out of 43 flagships
Low-Income Student Access Ratio =% students receiving Pell grants
in all colleges & universities in the state
% students receiving Pell grants at institution
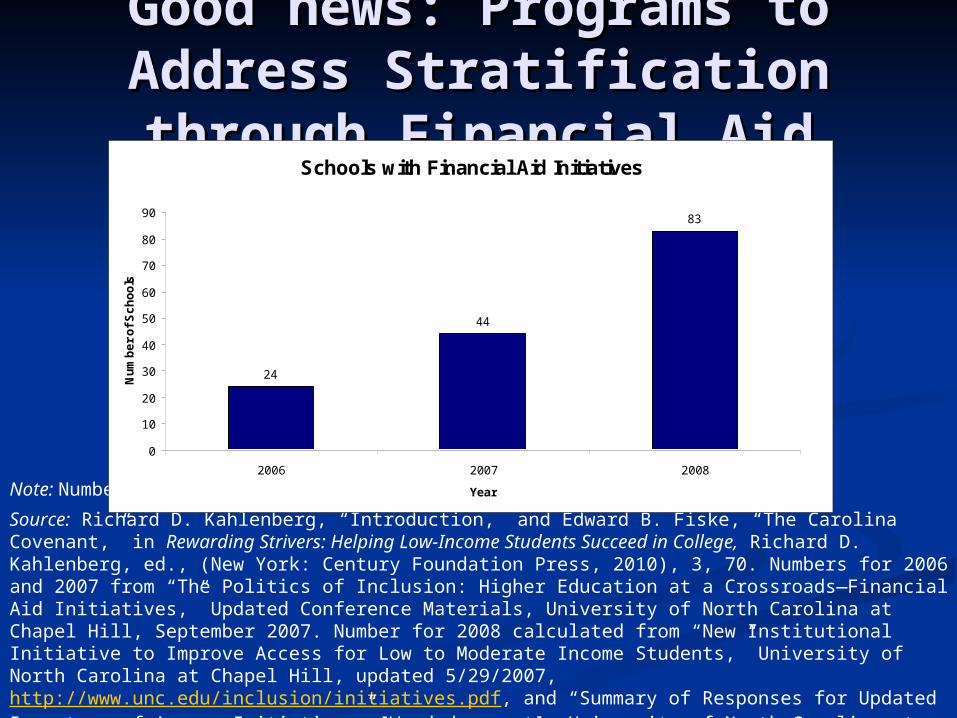
Good news: Programs to Good news: Programs to Address Stratification Address Stratification through Financial Aidthrough Financial Aid
Note: Number of schools is cumulative.
Source: Richard D. Kahlenberg, “Introduction,” and Edward B. Fiske, “The Carolina Covenant,” in Rewarding Strivers: Helping Low-Income Students Succeed in College, Richard D. Kahlenberg, ed., (New York: Century Foundation Press, 2010), 3, 70. Numbers for 2006 and 2007 from “The Politics of Inclusion: Higher Education at a Crossroads—Financial Aid Initiatives,” Updated Conference Materials, University of North Carolina at Chapel Hill, September 2007. Number for 2008 calculated from “New Institutional Initiative to Improve Access for Low to Moderate Income Students,” University of North Carolina at Chapel Hill, updated 5/29/2007, http://www.unc.edu/inclusion/initiatives.pdf, and “Summary of Responses for Updated Inventory of Access Initiatives” [Word document], University of North Carolina at Chapel Hill, updated 11/5/2008.
Schools with Financial Aid Initiatives
24
44
83
0
10
20
30
40
50
60
70
80
90
2006 2007 2008
Year
Nu
mb
er
of
Sc
ho
ols
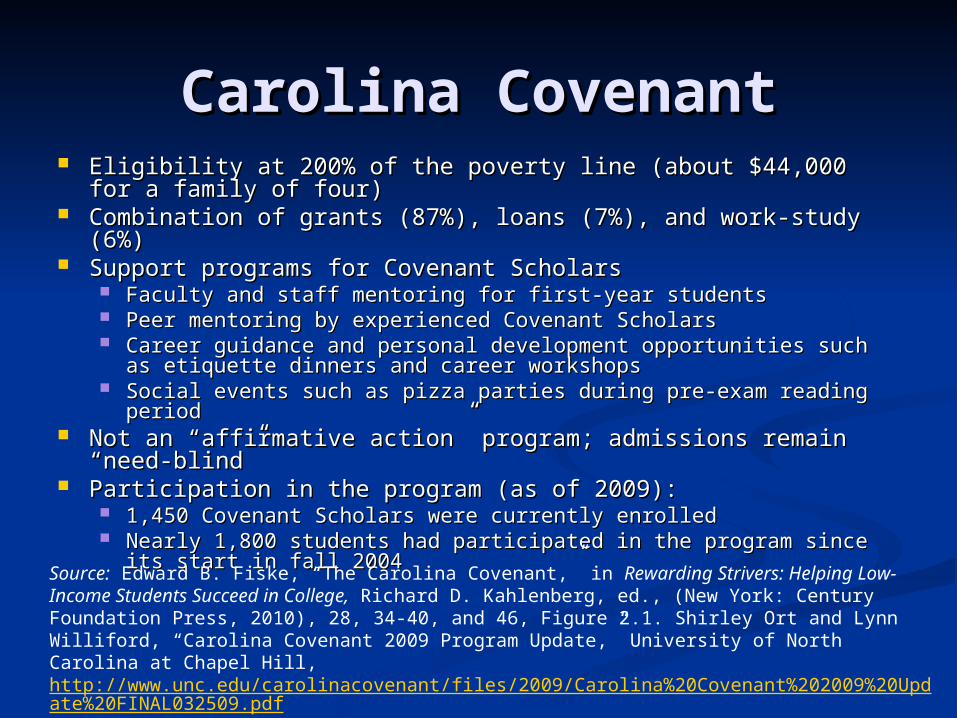
Carolina CovenantCarolina Covenant Eligibility at 200% of the poverty line (about $44,000 for a Eligibility at 200% of the poverty line (about $44,000 for a
family of four)family of four) Combination of grants (87%), loans (7%), and work-study (6%)Combination of grants (87%), loans (7%), and work-study (6%) Support programs for Covenant ScholarsSupport programs for Covenant Scholars
Faculty and staff mentoring for first-year studentsFaculty and staff mentoring for first-year students Peer mentoring by experienced Covenant ScholarsPeer mentoring by experienced Covenant Scholars Career guidance and personal development opportunities such as Career guidance and personal development opportunities such as
etiquette dinners and career workshopsetiquette dinners and career workshops Social events such as pizza parties during pre-exam reading periodSocial events such as pizza parties during pre-exam reading period
Not an “affirmative action” program; admissions remain Not an “affirmative action” program; admissions remain “need-blind”“need-blind”
Participation in the program (as of 2009):Participation in the program (as of 2009): 1,450 Covenant Scholars were currently enrolled1,450 Covenant Scholars were currently enrolled Nearly 1,800 students had participated in the program since its Nearly 1,800 students had participated in the program since its
start in fall 2004 start in fall 2004
Source: Edward B. Fiske, “The Carolina Covenant,” in Rewarding Strivers: Helping Low-Income Students Succeed in College, Richard D. Kahlenberg, ed., (New York: Century Foundation Press, 2010), 28, 34-40, and 46, Figure 2.1. Shirley Ort and Lynn Williford, “Carolina Covenant 2009 Program Update,” University of North Carolina at Chapel Hill, http://www.unc.edu/carolinacovenant/files/2009/Carolina%20Covenant%202009%20Update%20FINAL032509.pdf, retrieved August 23, 2010.

Graduation Rates for Covenant Scholars and Other Students
56.7%
74.3%
61.9%
75.6%
0%
10%
20%
30%
40%
50%
60%
70%
80%
Covenant All students
Pe
rce
nta
ge
Gra
du
ate
d w
ith
in E
igh
t S
em
es
ters
2003 Control Group 2004 Cohort
Graduation Rates Graduation Rates under Carolina Covenantunder Carolina Covenant
+ 5.2%
+ 1.3%
Source: Edward B. Fiske, “The Carolina Covenant,” in Rewarding Strivers: Helping Low-Income Students Succeed in College, Richard D. Kahlenberg, ed., (New York: Century Foundation Press, 2010), 62, Table 2.8. Data from UNC Office of Scholarship and Student Aid.
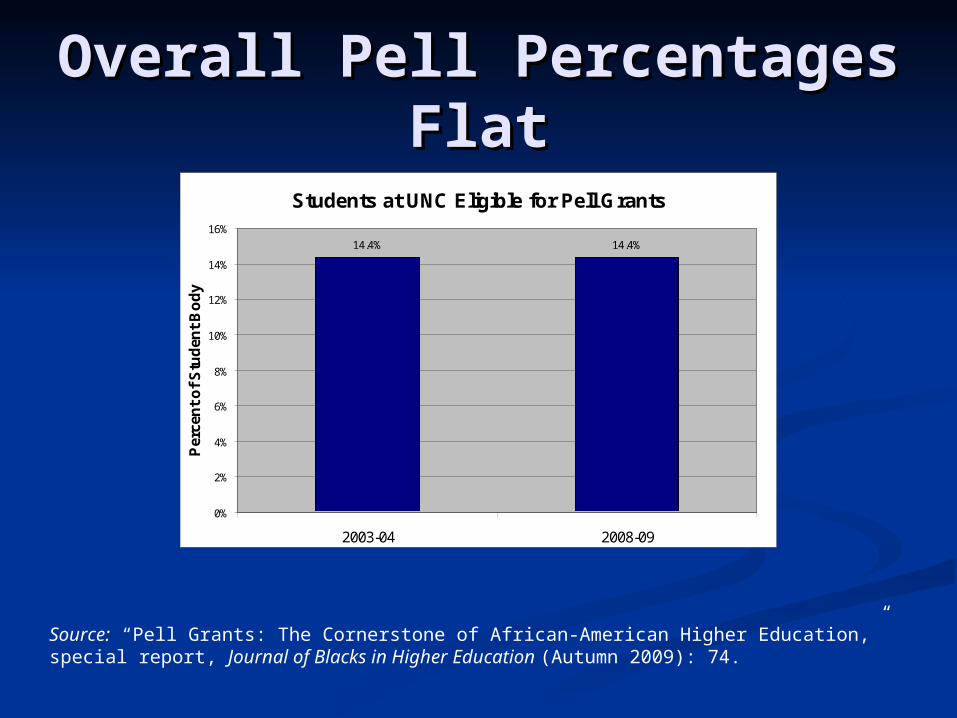
Overall Pell Percentages Overall Pell Percentages FlatFlat
Students at UNC Eligible for Pell Grants
14.4%14.4%
0%
2%
4%
6%
8%
10%
12%
14%
16%
2003-04 2008-09
Per
cen
t o
f S
tud
ent
Bo
dy
Source: “Pell Grants: The Cornerstone of African-American Higher Education,” special report, Journal of Blacks in Higher Education (Autumn 2009): 74.

Three reasons to Three reasons to supplement financial aid supplement financial aid
with socioeconomic with socioeconomic affirmative actionaffirmative action
Educational. Enhance the university Educational. Enhance the university experience.experience.
Efficiency. Avoid wasting talent.Efficiency. Avoid wasting talent. Equity/Fairness/Justice. Strivers Equity/Fairness/Justice. Strivers
“deserve” to be admitted. Many “deserve” to be admitted. Many admissions officers see this rationale admissions officers see this rationale as naïve but it appears to resonate as naïve but it appears to resonate powerfully with the public.powerfully with the public.
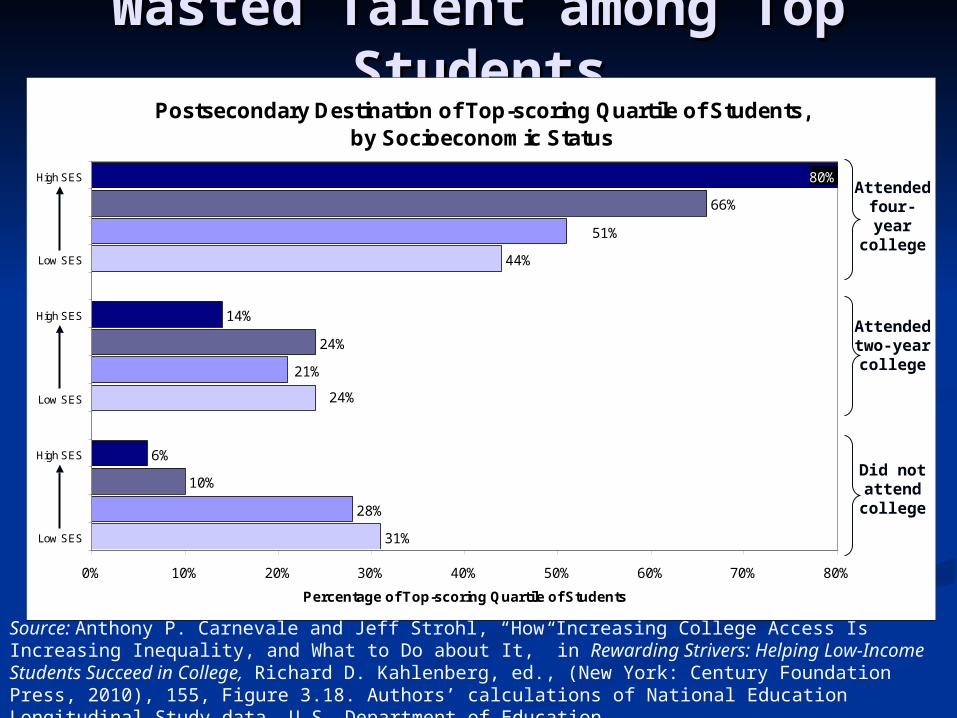
Wasted Talent among Top Wasted Talent among Top StudentsStudents
Source: Anthony P. Carnevale and Jeff Strohl, “How Increasing College Access Is Increasing Inequality, and What to Do about It,” in Rewarding Strivers: Helping Low-Income Students Succeed in College, Richard D. Kahlenberg, ed., (New York: Century Foundation Press, 2010), 155, Figure 3.18. Authors’ calculations of National Education Longitudinal Study data, U.S. Department of Education.
Postsecondary Destination of Top-scoring Quartile of Students, by Socioeconomic Status
31%
28%
10%
6%
24%
14%
44%
66%
80%
21%
24%
51%
0% 10% 20% 30% 40% 50% 60% 70% 80%
Low SES
High SES
Low SES
High SES
Low SES
High SES
Percentage of Top-scoring Quartile of Students
Attended four-year college
Attended two-year college
Did not attend college
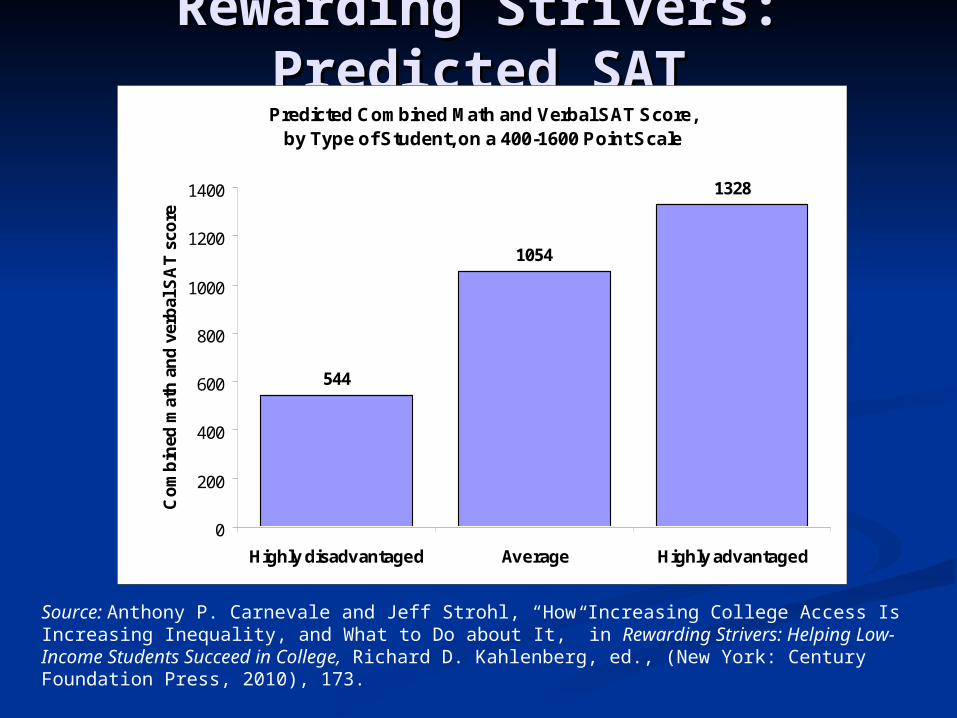
Rewarding Strivers: Rewarding Strivers: Predicted SATPredicted SAT
Source: Anthony P. Carnevale and Jeff Strohl, “How Increasing College Access Is Increasing Inequality, and What to Do about It,” in Rewarding Strivers: Helping Low-Income Students Succeed in College, Richard D. Kahlenberg, ed., (New York: Century Foundation Press, 2010), 173.
Predicted Combined Math and Verbal SAT Score, by Type of Student, on a 400-1600 Point Scale
544
1054
1328
0
200
400
600
800
1000
1200
1400
Highly disadvantaged Average Highly advantaged
Co
mb
ined
mat
h a
nd
ver
bal
SA
T s
core
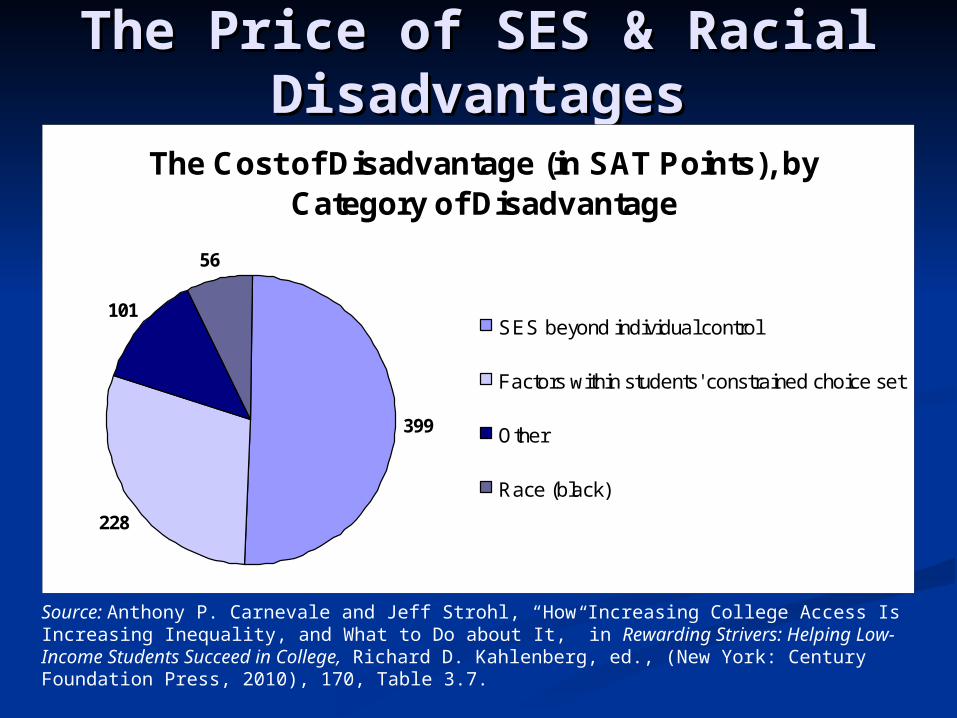
The Price of SES & Racial The Price of SES & Racial DisadvantagesDisadvantages
Source: Anthony P. Carnevale and Jeff Strohl, “How Increasing College Access Is Increasing Inequality, and What to Do about It,” in Rewarding Strivers: Helping Low-Income Students Succeed in College, Richard D. Kahlenberg, ed., (New York: Century Foundation Press, 2010), 170, Table 3.7.
The Cost of Disadvantage (in SAT Points), by Category of Disadvantage
399
228
101
56
SES beyond individual control
Factors within students' constrained choice set
Other
Race (black)

Economic Affirmative Action: Economic Affirmative Action: Public SupportPublic Support
Support for Racial and Economic Affirmative Action: 3 polls
26 27 26
59 5765
010203040506070
LA Times EPIC/MRA Newsweek
Race
Income
Source: EPIC/MRA poll (conducted January 29–February 3, 2003); Los Angeles Times poll (conducted January 30–February 2, 2003); and Newsweek poll (conducted January 16–17, 2003).
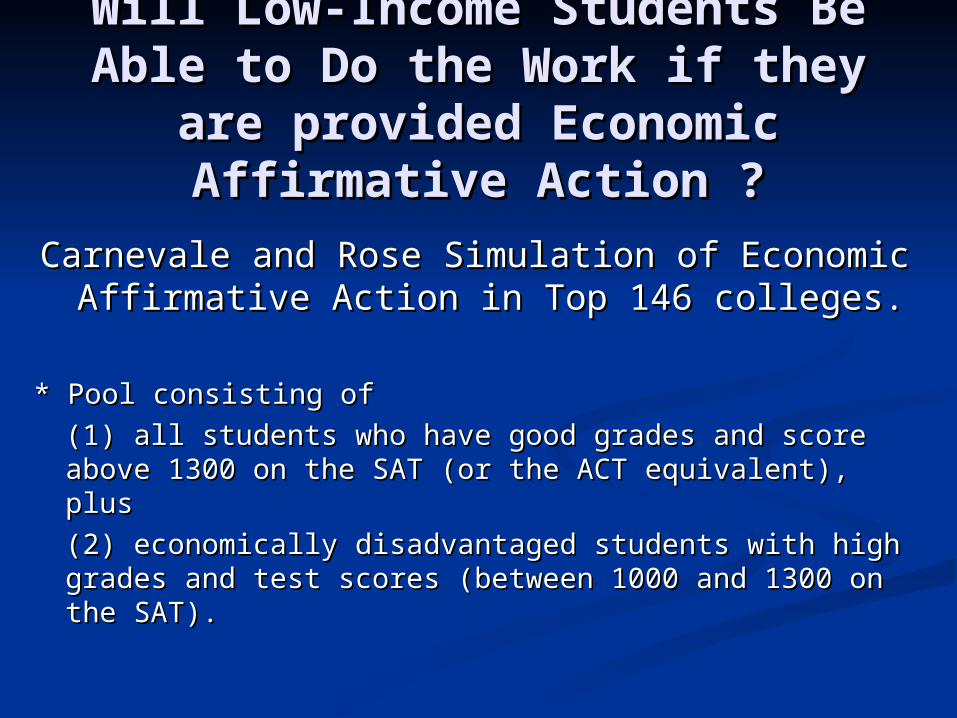
Will Low-Income Students Be Will Low-Income Students Be Able to Do the Work if they Able to Do the Work if they
are provided Economic are provided Economic Affirmative Action ?Affirmative Action ?
Carnevale and Rose Simulation of Economic Carnevale and Rose Simulation of Economic Affirmative Action in Top 146 colleges.Affirmative Action in Top 146 colleges.
* Pool consisting of * Pool consisting of
(1) all students who have good grades and score above (1) all students who have good grades and score above 1300 on the SAT (or the ACT equivalent), plus 1300 on the SAT (or the ACT equivalent), plus
(2) economically disadvantaged students with high (2) economically disadvantaged students with high grades and test scores (between 1000 and 1300 on the grades and test scores (between 1000 and 1300 on the SAT). SAT).
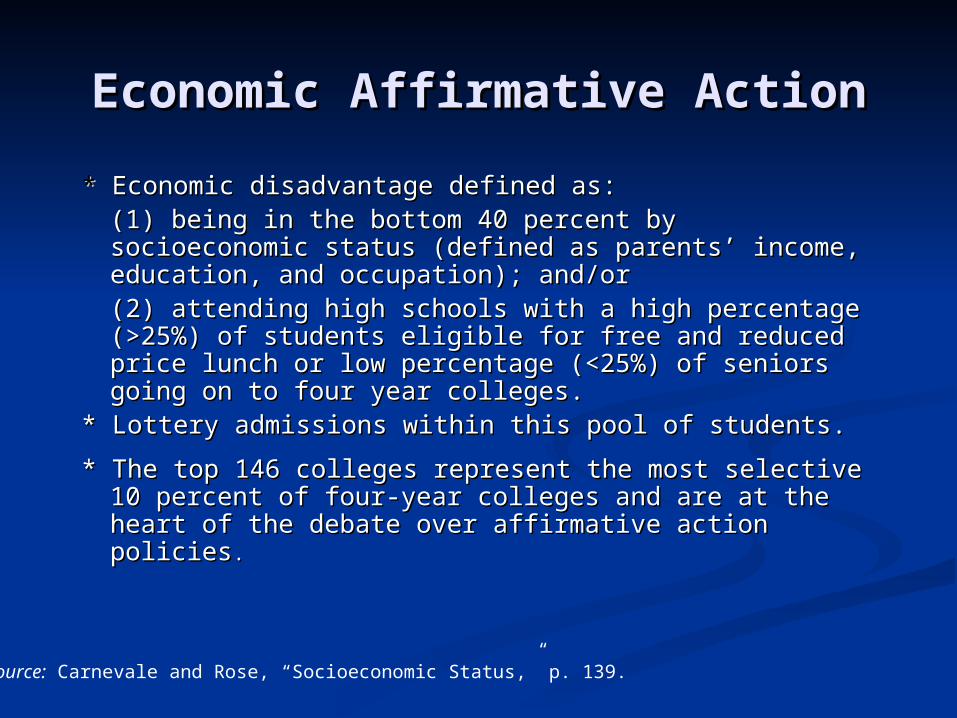
Economic Affirmative ActionEconomic Affirmative Action
* * Economic disadvantage defined as:Economic disadvantage defined as:(1) being in the bottom 40 percent by (1) being in the bottom 40 percent by socioeconomic status (defined as parents’ income, socioeconomic status (defined as parents’ income, education, and occupation); and/or education, and occupation); and/or (2) attending high schools with a high percentage (2) attending high schools with a high percentage (>25%) of students eligible for free and reduced (>25%) of students eligible for free and reduced price lunch or low percentage (<25%) of seniors price lunch or low percentage (<25%) of seniors going on to four year colleges.going on to four year colleges.
* Lottery admissions within this pool of students.* Lottery admissions within this pool of students.
* The top 146 colleges represent the most selective * The top 146 colleges represent the most selective 10 percent of four-year colleges and are at the 10 percent of four-year colleges and are at the heart of the debate over affirmative action heart of the debate over affirmative action policiespolicies. .
Source: Carnevale and Rose, “Socioeconomic Status,” p. 139.
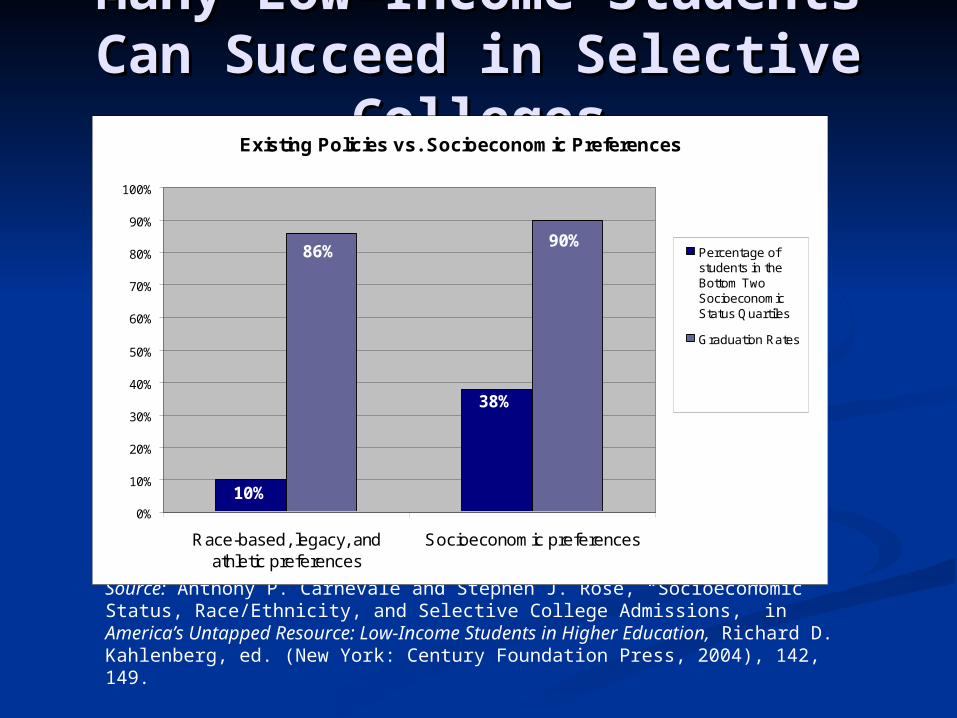
Many Low-Income Students Many Low-Income Students Can Succeed in Selective Can Succeed in Selective
CollegesColleges
Source: Anthony P. Carnevale and Stephen J. Rose, “Socioeconomic Status, Race/Ethnicity, and Selective College Admissions,” in America’s Untapped Resource: Low-Income Students in Higher Education, Richard D. Kahlenberg, ed. (New York: Century Foundation Press, 2004), 142, 149.
Existing Policies vs. Socioeconomic Preferences
10%
38%
90%86%
0%
10%
20%
30%
40%
50%
60%
70%
80%
90%
100%
Race-based, legacy, andathletic preferences
Socioeconomic preferences
Percentage ofstudents in theBottom TwoSocioeconomicStatus Quartiles
Graduation Rates
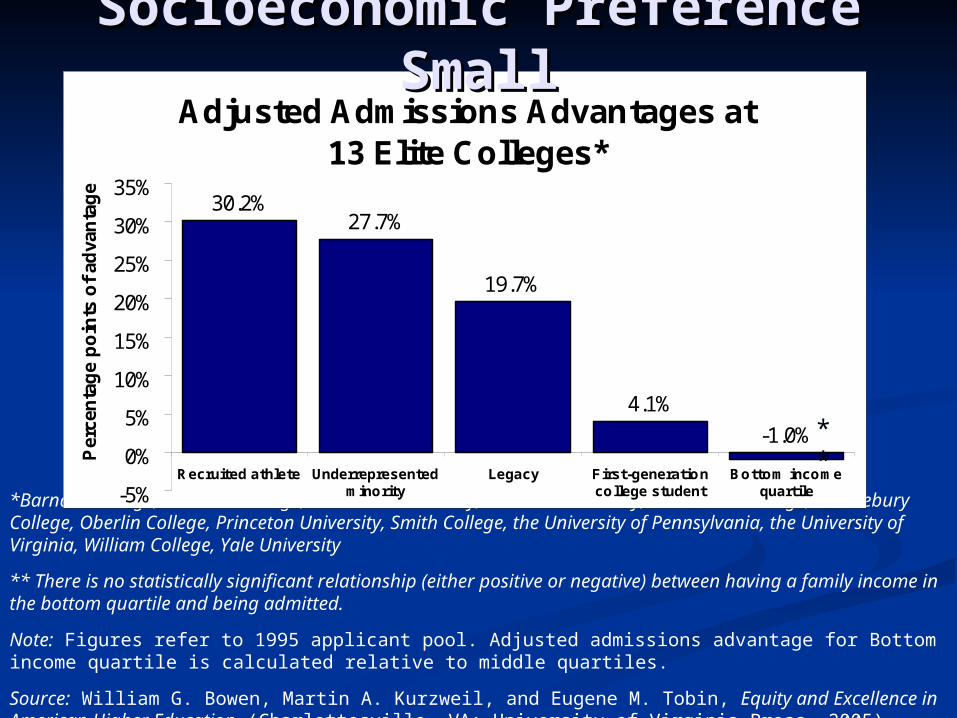
*Barnard College, Bowdoin College, Columbia University, Harvard University, Macalester College, Middlebury College, Oberlin College, Princeton University, Smith College, the University of Pennsylvania, the University of Virginia, William College, Yale University
** There is no statistically significant relationship (either positive or negative) between having a family income in the bottom quartile and being admitted.
Note: Figures refer to 1995 applicant pool. Adjusted admissions advantage for Bottom income quartile is calculated relative to middle quartiles.
Source: William G. Bowen, Martin A. Kurzweil, and Eugene M. Tobin, Equity and Excellence in American Higher Education (Charlottesville, VA: University of Virginia Press, 2005), 105, Table 5.1.
Adjusted Admissions Advantages at 13 Elite Colleges*
30.2%27.7%
19.7%
4.1%
-1.0%
-5%
0%
5%
10%
15%
20%
25%
30%
35%
Recruited athlete Underrepresentedminority
Legacy First-generationcollege student
Bottom incomequartile
Per
cen
tag
e p
oin
ts o
f ad
van
tag
e
Socioeconomic Preference Socioeconomic Preference SmallSmall
**

Increased Chances of Increased Chances of Admissions for Legacies in Admissions for Legacies in
Three StudiesThree Studies160 SAT points 19.7 percentage
point increase45.1 percentage point increase
Child of Undergraduate Alumnus:
Legacy Bonus
Legacy Bonus
Legacy Bonus
1200
1360
40 %
59.7 %
40 %
85.1 %
Source: Thomas J. Espenshade, Chang Y. Chung, and Joan L. Walling, “Admission Preferences for Minority Students, Athletes, and Legacies at Elite Universities,” Social Science Quarterly 85, no. 5 (December 2004): 1431.
Source: William G. Bowen, Martin A. Kurzweil and Eugene M. Tobin, Equity and Excellence in American Higher Education (Charlottesville, Va.: University of Virginia Press, 2005), 105-06.
Source: Michael Hurwitz, “The Impact of Legacy Status on Undergraduate Admissions at Elite Colleges and Universities,” Economics of Education Review 30, Issue 3 (June 2011): pp.480-492, and Elyse Ashburn, “At Elite Colleges, Legacy Status May Count More Than Was Previously Thought,” The Chronicle of Higher Education, January 5, 2011, http://chronicle.com/article/Legacys-Advantage-May-Be/125812/

Affirmative Action for the Affirmative Action for the Rich: Historical OriginsRich: Historical Origins
Peter Schmidt’s chapter outlines the Peter Schmidt’s chapter outlines the rise of legacy preferences after WWI rise of legacy preferences after WWI as one way to limit admissions of as one way to limit admissions of immigrant students, particularly immigrant students, particularly Jews.Jews.
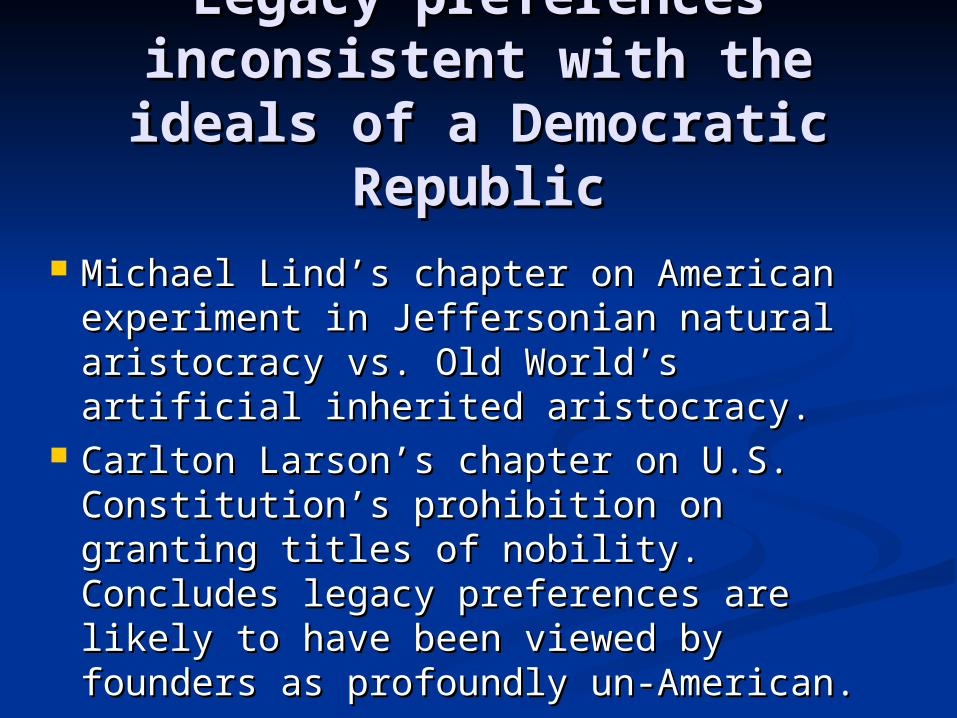
Legacy preferences Legacy preferences inconsistent with the ideals inconsistent with the ideals of a Democratic Republicof a Democratic Republic
Michael Lind’s chapter on American Michael Lind’s chapter on American experiment in Jeffersonian natural experiment in Jeffersonian natural aristocracy vs. Old World’s artificial aristocracy vs. Old World’s artificial inherited aristocracy.inherited aristocracy.
Carlton Larson’s chapter on U.S. Carlton Larson’s chapter on U.S. Constitution’s prohibition on granting Constitution’s prohibition on granting titles of nobility. Concludes legacy titles of nobility. Concludes legacy preferences are likely to have been preferences are likely to have been viewed by founders as profoundly un-viewed by founders as profoundly un-American.American.
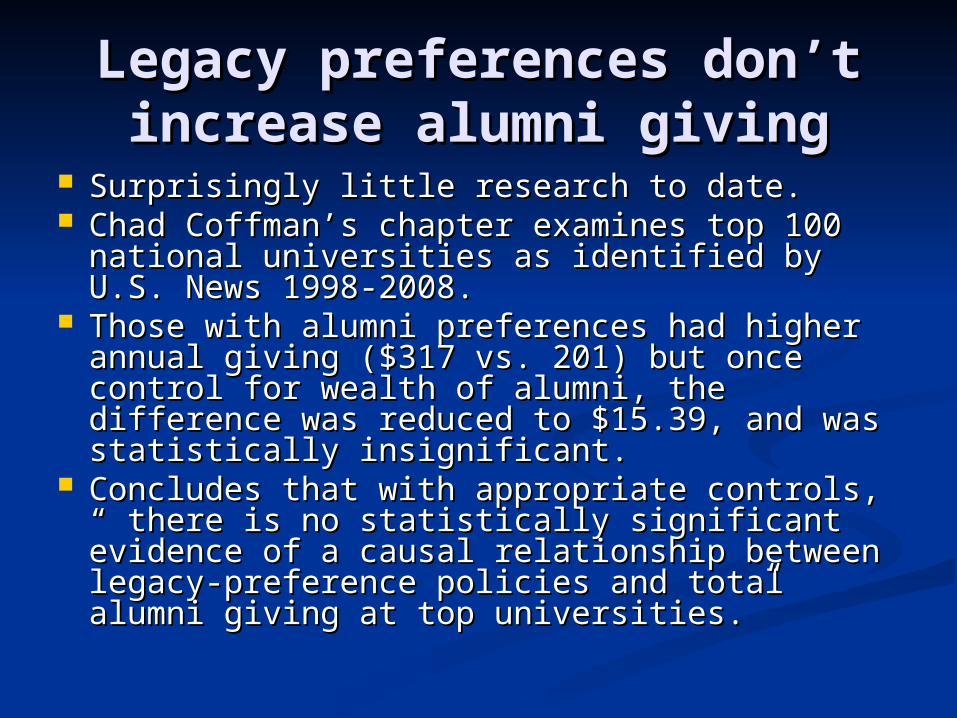
Legacy preferences don’t Legacy preferences don’t increase alumni givingincrease alumni giving
Surprisingly little research to date.Surprisingly little research to date. Chad Coffman’s chapter examines top 100 Chad Coffman’s chapter examines top 100
national universities as identified by U.S. national universities as identified by U.S. News 1998-2008.News 1998-2008.
Those with alumni preferences had higher Those with alumni preferences had higher annual giving ($317 vs. 201) but once control annual giving ($317 vs. 201) but once control for wealth of alumni, the difference was for wealth of alumni, the difference was reduced to $15.39, and was statistically reduced to $15.39, and was statistically insignificant.insignificant.
Concludes that with appropriate controls, “ Concludes that with appropriate controls, “ there is no statistically significant evidence of there is no statistically significant evidence of a causal relationship between legacy-a causal relationship between legacy-preference policies and total alumni giving at preference policies and total alumni giving at top universities.”top universities.”
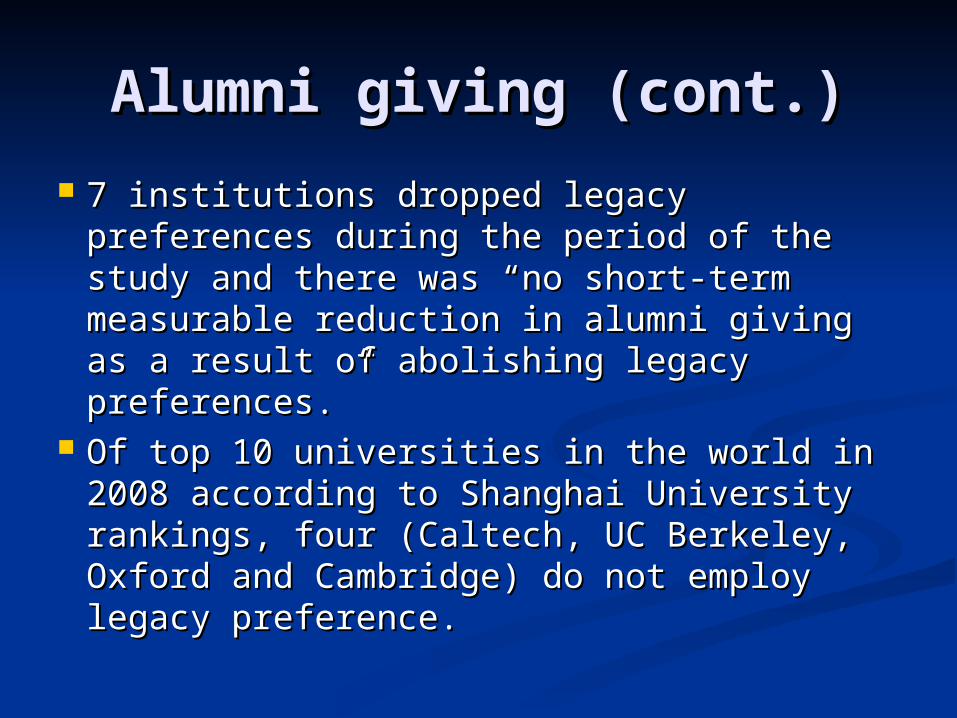
Alumni giving (cont.)Alumni giving (cont.)
7 institutions dropped legacy preferences 7 institutions dropped legacy preferences during the period of the study and there during the period of the study and there was “no short-term measurable reduction was “no short-term measurable reduction in alumni giving as a result of abolishing in alumni giving as a result of abolishing legacy preferences.”legacy preferences.”
Of top 10 universities in the world in Of top 10 universities in the world in 2008 according to Shanghai University 2008 according to Shanghai University rankings, four (Caltech, UC Berkeley, rankings, four (Caltech, UC Berkeley, Oxford and Cambridge) do not employ Oxford and Cambridge) do not employ legacy preference.legacy preference.
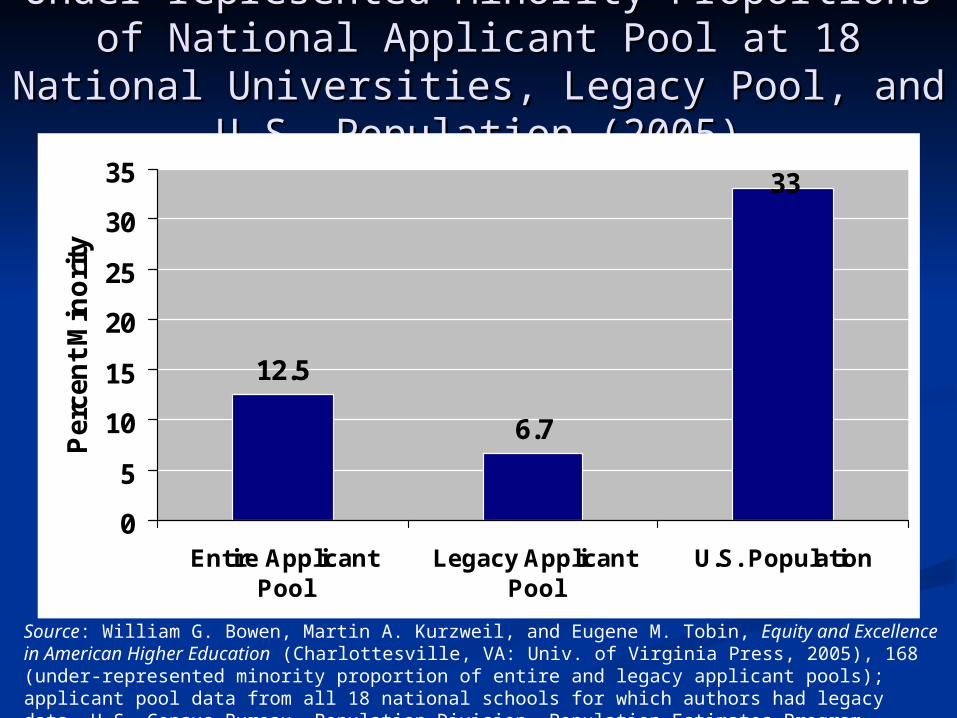
Under-represented Minority Proportions of Under-represented Minority Proportions of National Applicant Pool at 18 National National Applicant Pool at 18 National
Universities, Legacy Pool, and U.S. Universities, Legacy Pool, and U.S. Population (2005)Population (2005)
12.5
6.7
33
0
5
10
15
20
25
30
35
Entire ApplicantPool
Legacy ApplicantPool
U.S. Population
Per
cen
t M
ino
rity
Source: William G. Bowen, Martin A. Kurzweil, and Eugene M. Tobin, Equity and Excellence in American Higher Education (Charlottesville, VA: Univ. of Virginia Press, 2005), 168 (under-represented minority proportion of entire and legacy applicant pools); applicant pool data from all 18 national schools for which authors had legacy data. U.S. Census Bureau, Population Division, Population Estimates Program, Vintage 2005, July 1, 2005 (minority proportion of U.S. population).
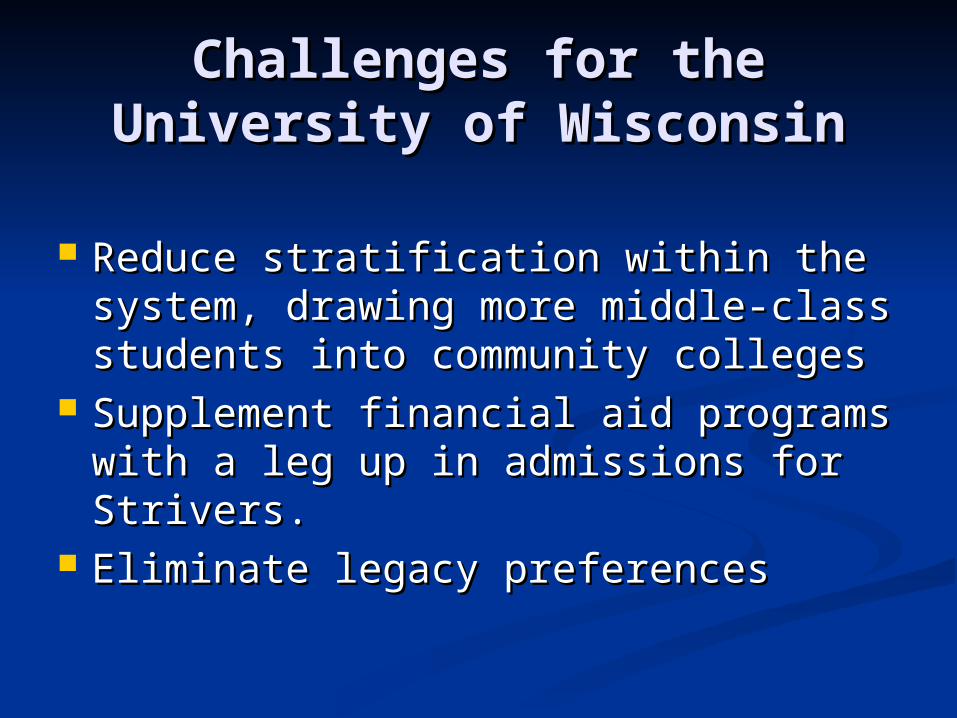
Challenges for the Challenges for the University of WisconsinUniversity of Wisconsin
Reduce stratification within the Reduce stratification within the system, drawing more middle-class system, drawing more middle-class students into community collegesstudents into community colleges
Supplement financial aid programs Supplement financial aid programs with a leg up in admissions for with a leg up in admissions for Strivers.Strivers.
Eliminate legacy preferencesEliminate legacy preferences
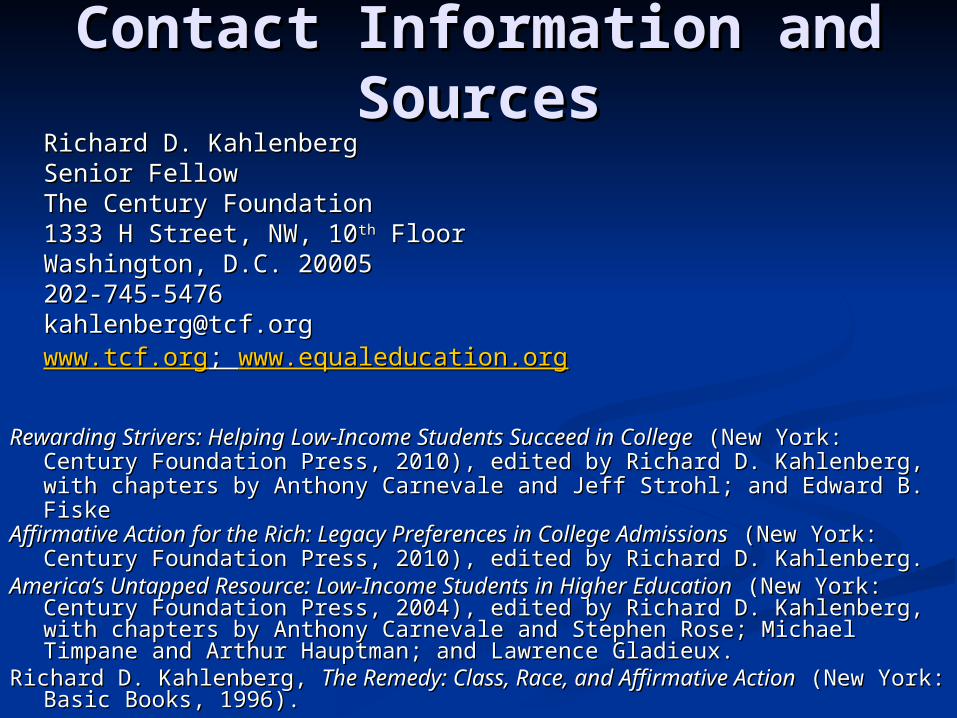
Contact Information and Contact Information and SourcesSources
Richard D. KahlenbergRichard D. KahlenbergSenior FellowSenior FellowThe Century FoundationThe Century Foundation1333 H Street, NW, 101333 H Street, NW, 10thth Floor FloorWashington, D.C. 20005Washington, D.C. [email protected]@tcf.orgwww.tcf.orgwww.tcf.org; ; www.equaleducation.orgwww.equaleducation.org
Rewarding Strivers: Helping Low-Income Students Succeed in CollegeRewarding Strivers: Helping Low-Income Students Succeed in College (New (New York: Century Foundation Press, 2010), edited by Richard D. Kahlenberg, York: Century Foundation Press, 2010), edited by Richard D. Kahlenberg, with chapters by Anthony Carnevale and Jeff Strohl; and Edward B. Fiskewith chapters by Anthony Carnevale and Jeff Strohl; and Edward B. Fiske
Affirmative Action for the Rich: Legacy Preferences in College AdmissionsAffirmative Action for the Rich: Legacy Preferences in College Admissions (New York: Century Foundation Press, 2010), edited by Richard D. (New York: Century Foundation Press, 2010), edited by Richard D. Kahlenberg.Kahlenberg.
America’s Untapped Resource: Low-Income Students in Higher EducationAmerica’s Untapped Resource: Low-Income Students in Higher Education (New York: Century Foundation Press, 2004), edited by Richard D. (New York: Century Foundation Press, 2004), edited by Richard D. Kahlenberg, with chapters by Anthony Carnevale and Stephen Rose; Kahlenberg, with chapters by Anthony Carnevale and Stephen Rose; Michael Timpane and Arthur Hauptman; and Lawrence Gladieux.Michael Timpane and Arthur Hauptman; and Lawrence Gladieux.
Richard D. Kahlenberg, Richard D. Kahlenberg, The Remedy: Class, Race, and Affirmative ActionThe Remedy: Class, Race, and Affirmative Action (New (New York: Basic Books, 1996).York: Basic Books, 1996).
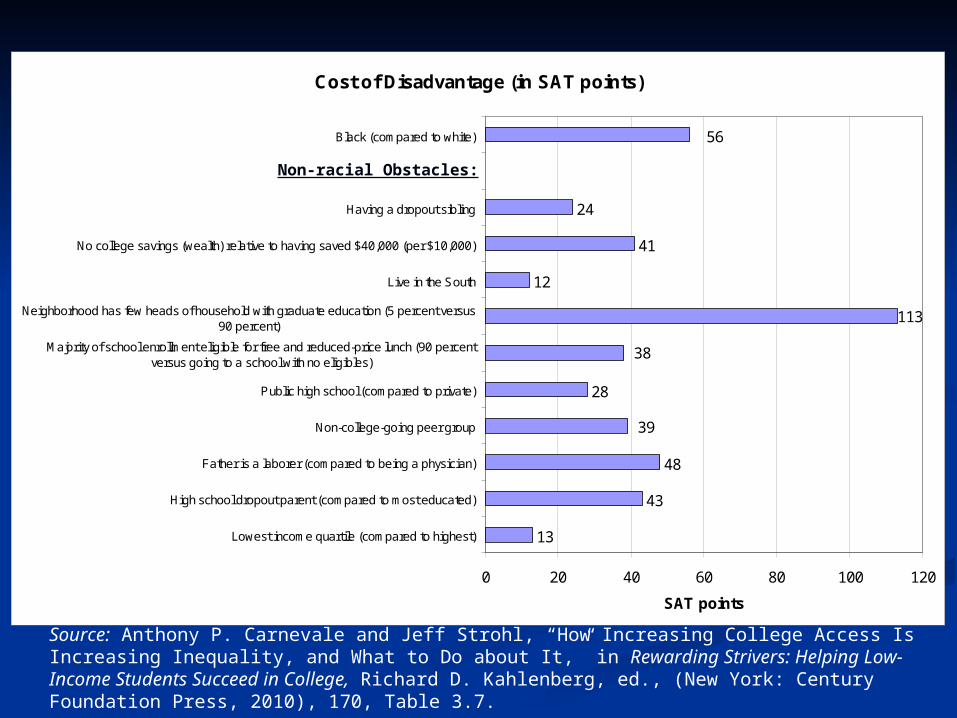
Source: Anthony P. Carnevale and Jeff Strohl, “How Increasing College Access Is Increasing Inequality, and What to Do about It,” in Rewarding Strivers: Helping Low-Income Students Succeed in College, Richard D. Kahlenberg, ed., (New York: Century Foundation Press, 2010), 170, Table 3.7.
Cost of Disadvantage (in SAT points)
13
43
48
28
12
41
24
39
56
38
113
0 20 40 60 80 100 120
Lowest income quartile (compared to highest)
High school dropout parent (compared to most educated)
Father is a laborer (compared to being a physician)
Non-college-going peer group
Public high school (compared to private)
Majority of school enrollment eligible for free and reduced-price lunch (90 percentversus going to a school with no eligibles)
Neighborhood has few heads of household with graduate education (5 percent versus90 percent)
Live in the South
No college savings (wealth) relative to having saved $40,000 (per $10,000)
Having a dropout sibling
Non-racial Obstacles:
Black (compared to white)
SAT points
Non-racial Obstacles: