
Revolutionary Debug Techniques to Improve … · Revolutionary Debug Techniques to Improve...
62
Revolutionary Debug Techniques to Improve Verification Productivity Nadav Chazan Debug Product Eng. © Accellera Systems Initiative 1
Transcript of Revolutionary Debug Techniques to Improve … · Revolutionary Debug Techniques to Improve...

Revolutionary Debug Techniques to Improve Verification Productivity
Nadav Chazan
Debug Product Eng.
© Accellera Systems Initiative 1
2 © 2014 Cadence Design Systems, Inc. All rights reserved.
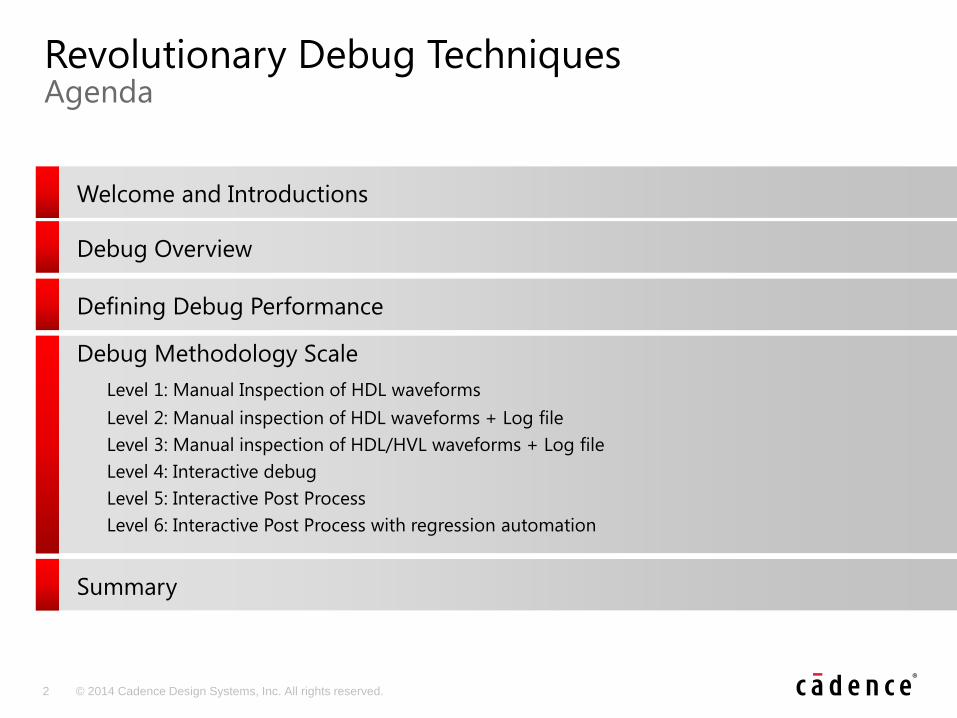
Revolutionary Debug Techniques Agenda
Welcome and Introductions
Debug Overview
Defining Debug Performance
Debug Methodology Scale
Level 1: Manual Inspection of HDL waveforms
Level 2: Manual inspection of HDL waveforms + Log file
Level 3: Manual inspection of HDL/HVL waveforms + Log file
Level 4: Interactive debug
Level 5: Interactive Post Process
Level 6: Interactive Post Process with regression automation
Summary

3 © 2014 Cadence Design Systems, Inc. All rights reserved.
Revolutionary Debug Techniques Agenda
Welcome and Introductions
Debug Overview
Defining Debug Performance
Debug Methodology Scale
Level 1: Manual Inspection of HDL waveforms
Level 2: Manual inspection of HDL waveforms + Log file
Level 3: Manual inspection of HDL/HVL waveforms + Log file
Level 4: Interactive debug
Level 5: Interactive Post Process
Level 6: Interactive Post Process with regression automation
Summary
4 © 2014 Cadence Design Systems, Inc. All rights reserved.
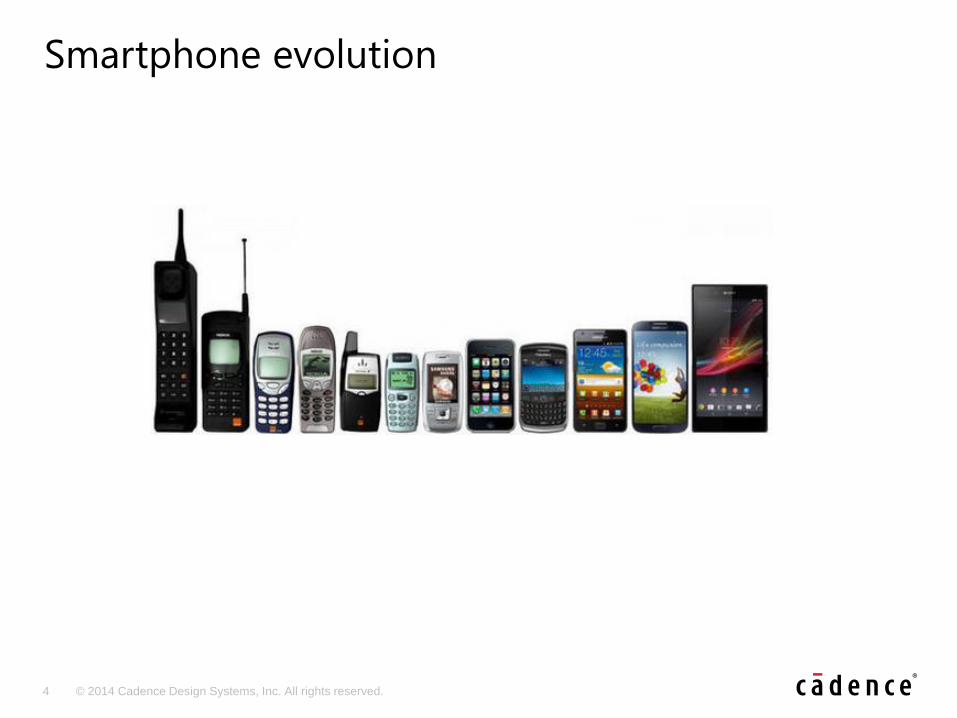
Smartphone evolution
5 © 2014 Cadence Design Systems, Inc. All rights reserved.
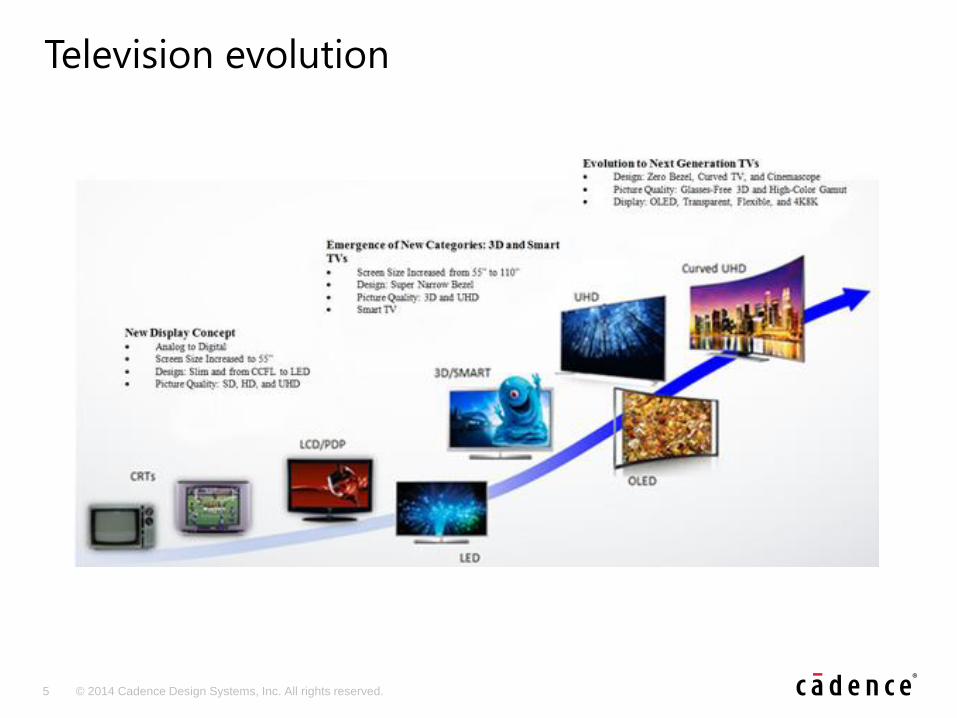
Television evolution

6 © 2014 Cadence Design Systems, Inc. All rights reserved.
Internet speed evolution

7 © 2014 Cadence Design Systems, Inc. All rights reserved.
Design complexity
8 © 2014 Cadence Design Systems, Inc. All rights reserved.
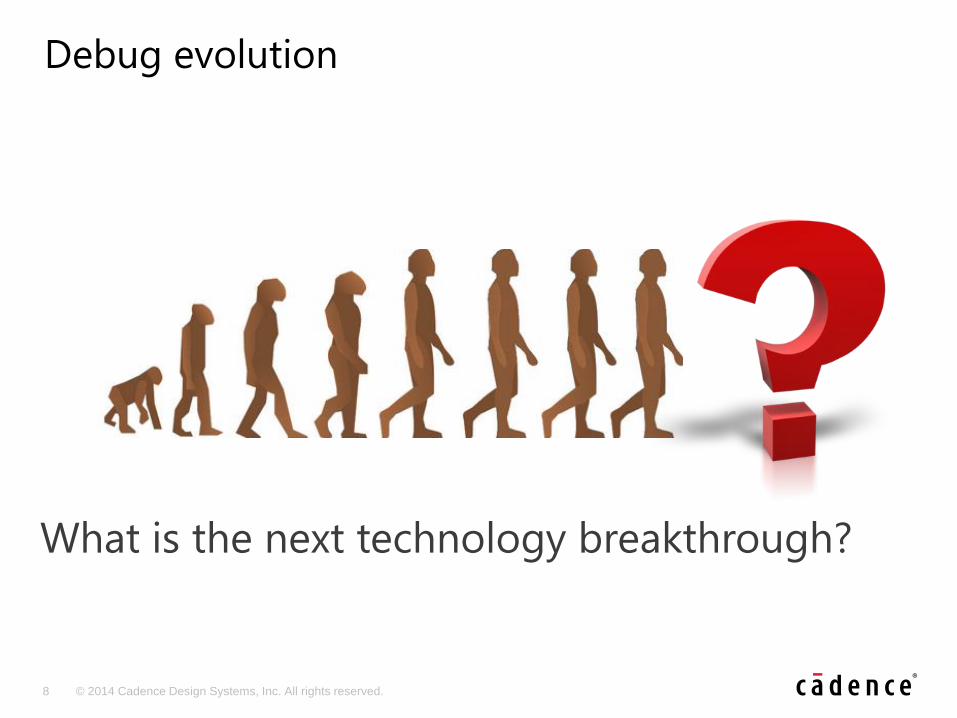
Debug evolution
What is the next technology breakthrough?

9 © 2014 Cadence Design Systems, Inc. All rights reserved.
Verification Effort
Test execution
Test creation
Coverage Analysis
Test Planning
Debug
Debug is the Verification Bottleneck
• Estimated 50% of verification effort spent on debug– Failure Triage
– Analyzing simulation output
– Root cause analysis
Data Source: Customer Interview Series

10 © 2014 Cadence Design Systems, Inc. All rights reserved.
•Multiple debug iterations
•Context switching
•Manual grep/search through code
•Ramp up on unfamiliar
environment
• Varying debug skillset
Human Time
• Large designs
• Lengthy simulations
• Regression management (DRM’s)
• Management of large databases
• Debug turnaround time
Performance
•Complex designs/verification
environments
• Feature interactions
• OOP/AOP languages for Testbenches
•Legacy/unfamiliar code
•Generated code
•Encrypted code
Code Complexity
•Working at the waveform signal
level too often
•Print statement debug
•Often difficult to see the “big
picture” or the “right picture”
•Encrypted IPs
• IP/VIP protocol debug
Abstraction
• Debug handover
• Different tool set (design vs.
verification vs. SW)
•Different mindset (design vs.
verification vs. SW)
•Manual knowledge transfer
(emails, phone, meetings)
Collaboration
•Regression data explosion
•Coverage, log files, reports,
•Regression tracking, test case
ranking
•Performance profiling, linting
•Combining information into
meaningful picture
Information Overload
•Defining complex
scenarios/constraint sets
• Is my coverage correct
•Are my assertions capturing
correct scenarios
• Is my coverage actually being
sampled correctly
Coverage
•Assertions, SV, e, SC, C++, C, HDL
syntax/semantics
•Different debug methodologies
(RTL vs. HVL vs. SW)
•Different toolsets
•Mixed language
designs/verification environments
•Language interactions
Multi-
Language
Some of Today’s Many Debug Challenges

11 © 2014 Cadence Design Systems, Inc. All rights reserved.
• Design complexity will continue to increase
• Engineers need significant advancements in debug methodology to keep pace
– Faster simulator is only a small part of improving debug performance
• Industry needs to address debug performance holistically
– Computers spent time simulating and producing results
– Humans spend significant time analyzing results
Debug Performance Must be IncreasedCommon need among all users

12 © 2014 Cadence Design Systems, Inc. All rights reserved.
Revolutionary Debug Techniques Agenda
Welcome and Introductions
Debug Overview
Defining Debug Performance
Debug Methodology Scale
Level 1: Manual Inspection of HDL waveforms
Level 2: Manual inspection of HDL waveforms + Log file
Level 3: Manual inspection of HDL/HVL waveforms + Log file
Level 4: Interactive debug
Level 5: Interactive Post Process
Level 6: Interactive Post Process with regression automation
Summary

13 © 2014 Cadence Design Systems, Inc. All rights reserved.
What is Performance?
• Often measured in cycles– Machine Cycles – Simulation throughput on a given server
– Human Cycles – Abstract notion but could be wall clock time
• Goal in increasing performance is to:1. Use human cycles as efficiently as possible
2. Reduce the number of machine cycles to achieve goals
3. Run each machine cycle as efficiently as possible
• Engineers are most productive when they have the right tools, methodologies and technologies at hand
13
14 © 2014 Cadence Design Systems, Inc. All rights reserved.
How do we measure
debug
performance?

15 © 2014 Cadence Design Systems, Inc. All rights reserved.
• Typically one test case per feature
• Large regression suites
• Testbench written exclusively in HDL
• Waveform debugging was the typical debug methodology
• Each test case was fairly simple to write and debug
– Typically a cut/paste/modify exercise from another test case
– Most issues found were in the RTL
“Back in the Day” Directed testing verification methodology

16 © 2014 Cadence Design Systems, Inc. All rights reserved.
• Size and complexity have increased
• Explosion in feature interactions
• Test cases highly randomized
• Testbenches typically created in HVL’s (SV, e, SC)
– OOP/AOP paradigm similar to SW design
• New pieces added to the debug puzzle
– Design IP, Verification IP, SoC System Simulations, Embedded SW, Acceleration, HW/SW
• Waveform debugging still typical debug methodology
– Supplemented by log file analysis (printf() debug)
– Interactive debug techniques used occasionally for testbench debug
Today’s Complex DesignsMetric Driven Verification methodology
17 © 2014 Cadence Design Systems, Inc. All rights reserved.
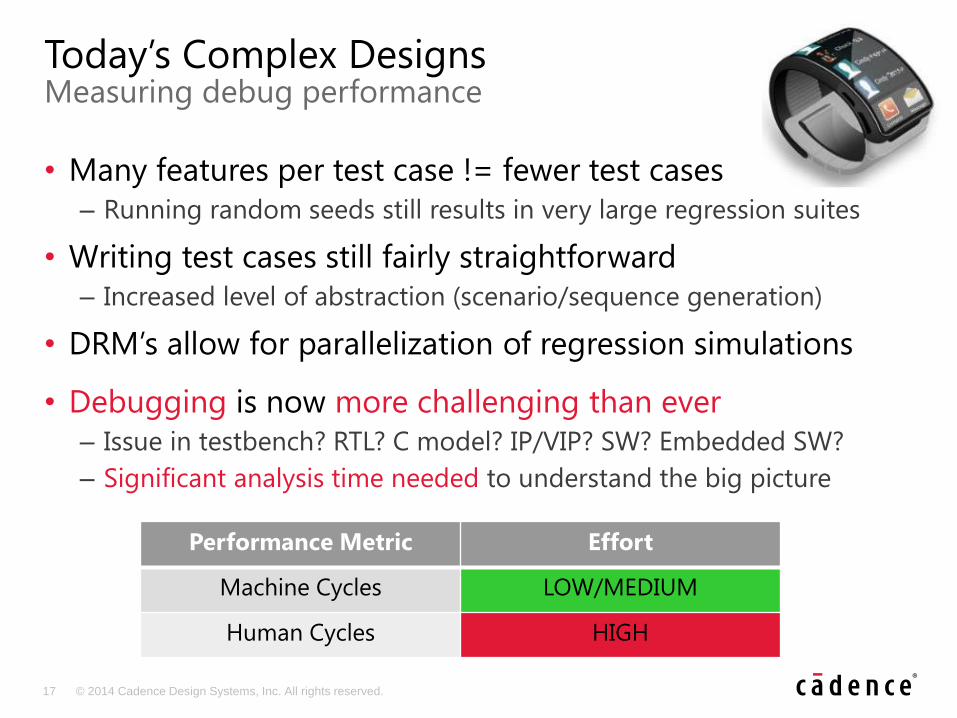
• Many features per test case != fewer test cases
– Running random seeds still results in very large regression suites
• Writing test cases still fairly straightforward
– Increased level of abstraction (scenario/sequence generation)
• DRM’s allow for parallelization of regression simulations
• Debugging is now more challenging than ever
– Issue in testbench? RTL? C model? IP/VIP? SW? Embedded SW?
– Significant analysis time needed to understand the big picture
Today’s Complex DesignsMeasuring debug performance
Performance Metric Effort
Machine Cycles LOW/MEDIUM
Human Cycles HIGH
18 © 2014 Cadence Design Systems, Inc. All rights reserved.
It’s time for
Revolutionin Debug Methodology
Revolution

19 © 2014 Cadence Design Systems, Inc. All rights reserved.
Revolutionary Debug Techniques Agenda
Welcome and Introductions
Debug Overview
Defining Debug Performance
Debug Methodology Scale
Level 1: Manual Inspection of HDL waveforms
Level 2: Manual inspection of HDL waveforms + Log file
Level 3: Manual inspection of HDL/HVL waveforms + Log file
Level 4: Interactive debug
Level 5: Interactive Post Process
Level 6: Interactive Post Process with regression automation
Summary

20 © 2014 Cadence Design Systems, Inc. All rights reserved.
• Assembled based on meetings with hundreds of design and verification engineers
• Showcases the diversity of industry debug techniques
• Identifies advantages and disadvantages of each level
• Helps identifies a need to migrate to next level
• Natural evolution from lower to upper levels
The Debug Methodology Scale

21 © 2014 Cadence Design Systems, Inc. All rights reserved.
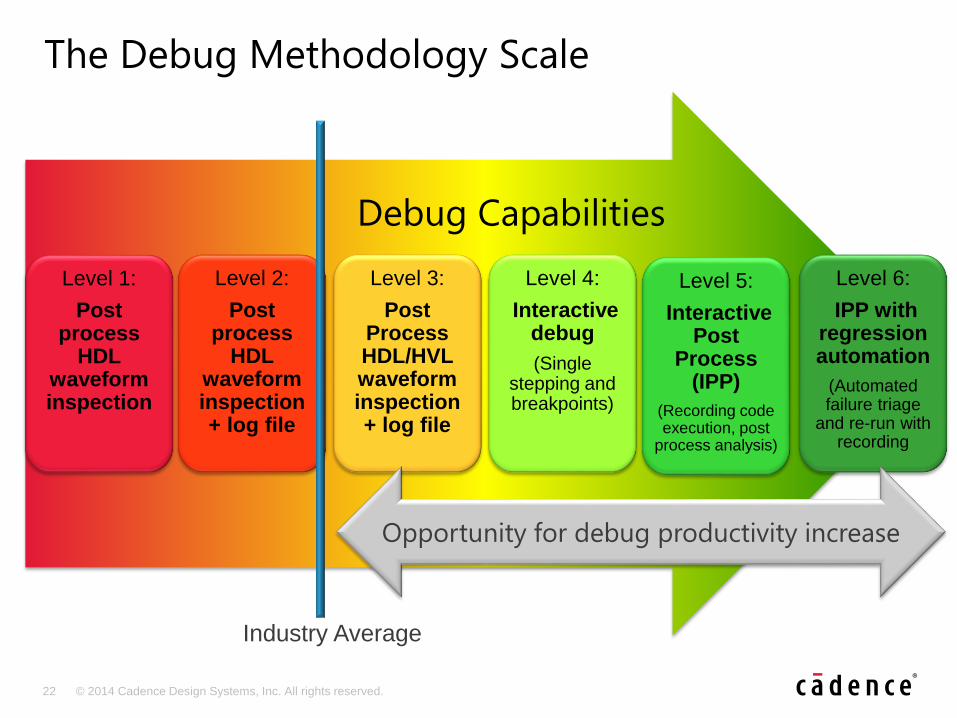
The Debug Methodology Scale
Level 2:
Post process
HDL waveform inspection + Log file
Level 3:
Post Process HDL/HVL waveform inspection + Log file
Level 4:
Interactive debug
(Single stepping and breakpoints)
Level 5:
Interactive Post
Process (IPP)
(Recording code execution, post
process analysis)
Level 6:
IPP with regression automation
(Automated failure triage
and re-run with recording
Level 1:
Post process
HDL waveform inspection
Industry Average
22 © 2014 Cadence Design Systems, Inc. All rights reserved.
The Debug Methodology Scale
Debug Capabilities
Level 2:
Post process
HDL waveform inspection + log file
Level 3:
Post Process HDL/HVL waveform inspection + log file
Level 4:
Interactive debug
(Single stepping and breakpoints)
Level 5:
Interactive Post
Process (IPP)
(Recording code execution, post
process analysis)
Level 6:
IPP with regression automation
(Automated failure triage
and re-run with recording
Level 1:
Post process
HDL waveform inspection
Opportunity for debug productivity increase
Industry Average

23 © 2014 Cadence Design Systems, Inc. All rights reserved.
Revolutionary Debug Techniques Agenda
Welcome and Introductions
Debug Overview
Defining Debug Performance
Debug Methodology Scale
Level 1: Manual Inspection of HDL waveforms
Level 2: Manual inspection of HDL waveforms + Log file
Level 3: Manual inspection of HDL/HVL waveforms + Log file
Level 4: Interactive debug
Level 5: Interactive Post Process
Level 6: Interactive Post Process with regression automation
Summary
24 © 2014 Cadence Design Systems, Inc. All rights reserved.
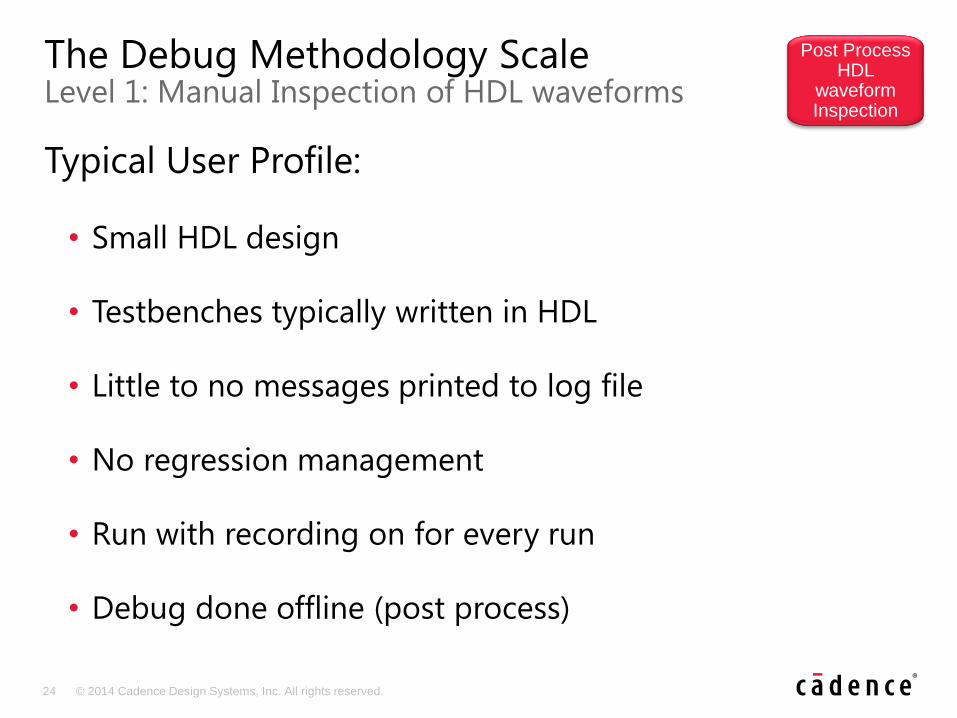
Typical User Profile:
• Small HDL design
• Testbenches typically written in HDL
• Little to no messages printed to log file
• No regression management
• Run with recording on for every run
• Debug done offline (post process)
The Debug Methodology ScaleLevel 1: Manual Inspection of HDL waveforms
Post Process HDL
waveform Inspection
25 © 2014 Cadence Design Systems, Inc. All rights reserved.
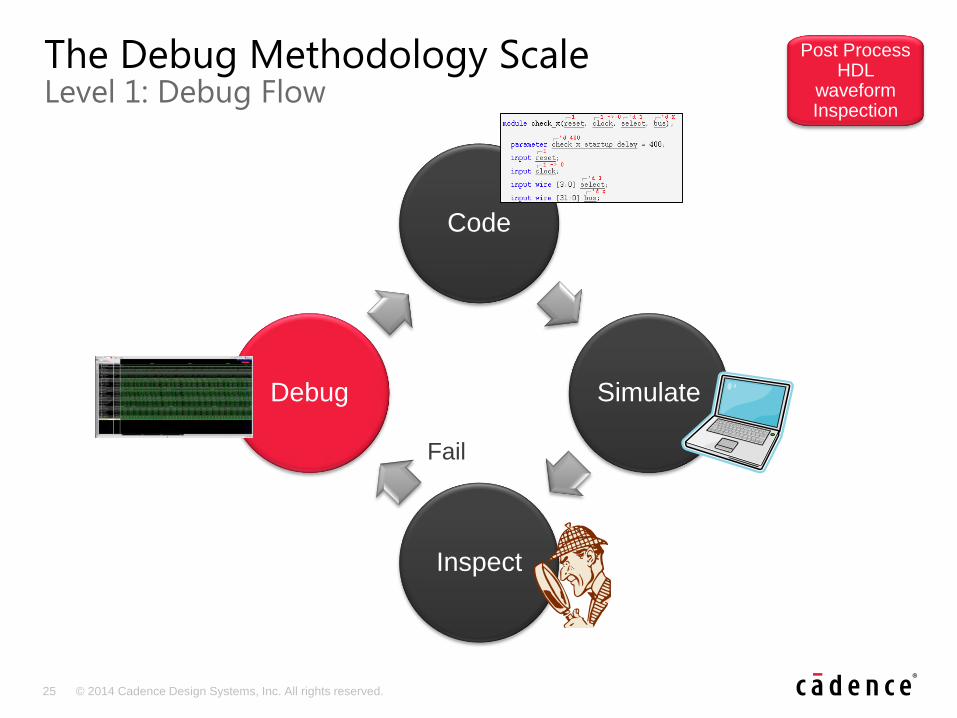
Code
Simulate
Inspect
Debug
The Debug Methodology ScaleLevel 1: Debug Flow
Post Process HDL
waveform Inspection
Fail
26 © 2014 Cadence Design Systems, Inc. All rights reserved.
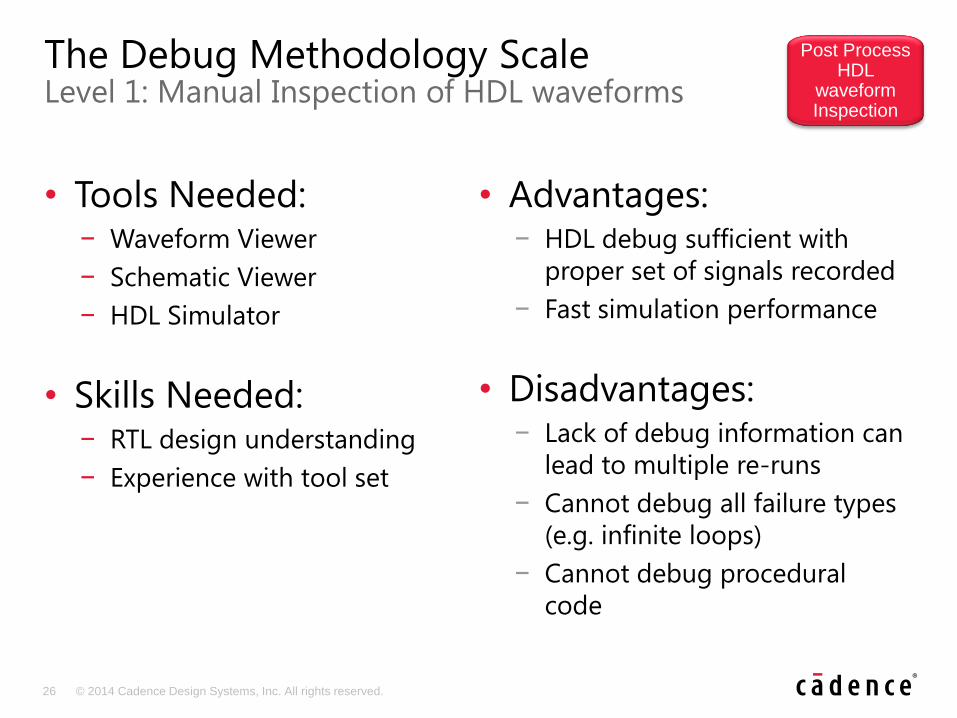
The Debug Methodology ScaleLevel 1: Manual Inspection of HDL waveforms
• Tools Needed: − Waveform Viewer
− Schematic Viewer
− HDL Simulator
• Skills Needed: − RTL design understanding
− Experience with tool set
• Advantages: − HDL debug sufficient with
proper set of signals recorded
− Fast simulation performance
• Disadvantages:− Lack of debug information can
lead to multiple re-runs
− Cannot debug all failure types
(e.g. infinite loops)
− Cannot debug procedural
code
Post Process HDL
waveform Inspection

27 © 2014 Cadence Design Systems, Inc. All rights reserved.
• Why move up the scale from this level?
– Increased design and testbench complexity
– Not enough debug data in only HDL waveforms
– Too much human cycle time spent in low level analysis
– Looking to try “what if” scenarios while debugging
– Too many reruns
– Need to debug wider range of issues like procedural code execution, infinite loops, zero time loops, etc.
– Would like to debug at a higher levels of abstraction
The Debug Methodology ScaleLevel 1: Manual inspection of HDL waveforms
Post Process HDL
waveform Inspection

28 © 2014 Cadence Design Systems, Inc. All rights reserved.
Revolutionary Debug Techniques Agenda
Welcome and Introductions
Debug Overview
Defining Debug Performance
Debug Methodology Scale
Level 1: Manual Inspection of HDL waveforms
Level 2: Manual inspection of HDL waveforms + Log file
Level 3: Manual inspection of HDL/HVL waveforms + Log file
Level 4: Interactive debug
Level 5: Interactive Post Process
Level 6: Interactive Post Process with regression automation
Summary
29 © 2014 Cadence Design Systems, Inc. All rights reserved.
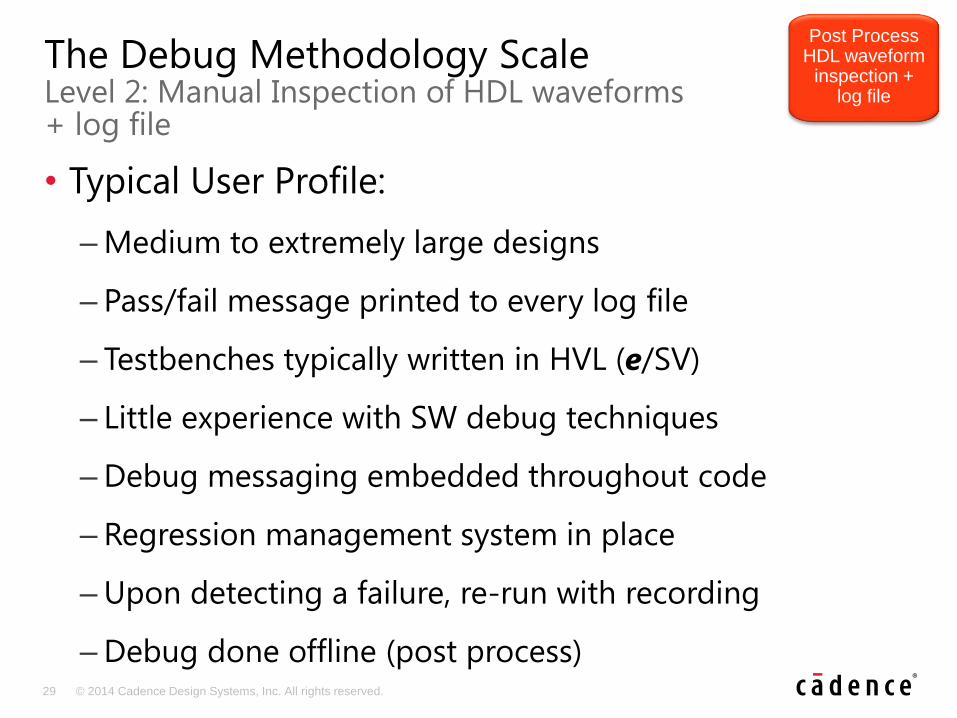
• Typical User Profile:
– Medium to extremely large designs
– Pass/fail message printed to every log file
– Testbenches typically written in HVL (e/SV)
– Little experience with SW debug techniques
– Debug messaging embedded throughout code
– Regression management system in place
– Upon detecting a failure, re-run with recording
– Debug done offline (post process)
The Debug Methodology ScaleLevel 2: Manual Inspection of HDL waveforms + log file
Post Process HDL waveform
inspection + log file
30 © 2014 Cadence Design Systems, Inc. All rights reserved.
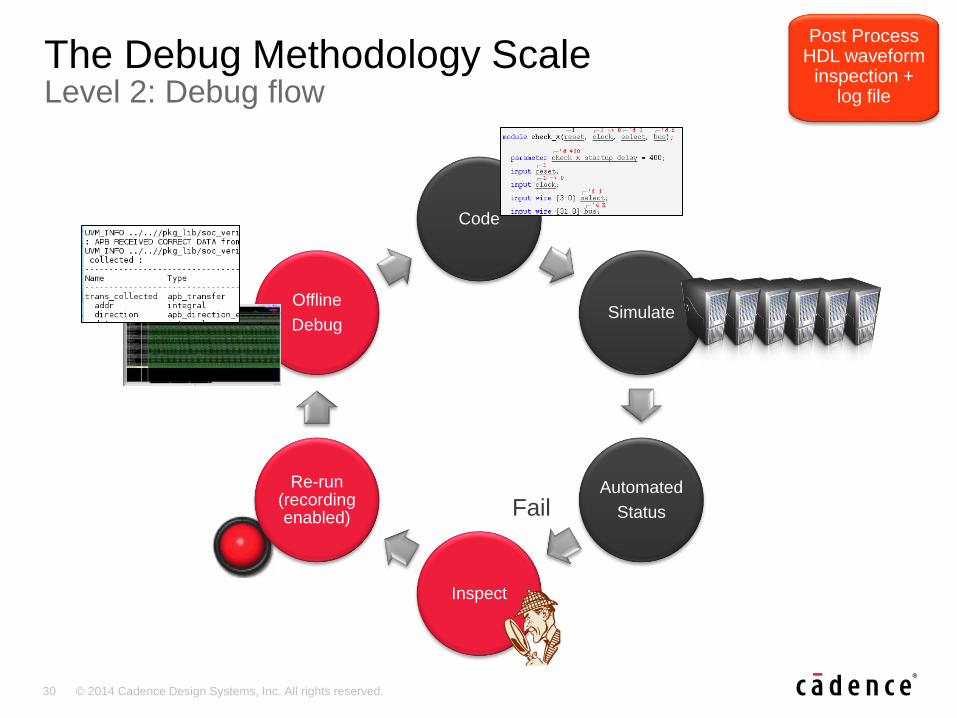
Code
Simulate
Automated
Status
Inspect
Re-run (recording enabled)
Offline
Debug
The Debug Methodology ScaleLevel 2: Debug flow
Fail
Post Process HDL waveform
inspection + log file

31 © 2014 Cadence Design Systems, Inc. All rights reserved.
The Debug Methodology ScaleLevel 2: Manual Inspection of HDL waveforms + log file
• Tools Needed: − Waveform Viewer
− Schematic Viewer
− HDL/HVL Simulator
• Skills Needed: − RTL design understanding
− OOP experience for HVL test
benches (possibly UVM)
− Regular expression
knowledge for log file
grepping
• Advantages: − HDL debug sufficient with
proper set of signals recorded
− Decent runtime performance
• Disadvantages:− Difficult procedural code
debug
− Lack of debug information can
lead to multiple re-runs
− Adding more printf()’s each time
− Cannot debug all failure types
Post Process HDL waveform
inspection + log file

32 © 2014 Cadence Design Systems, Inc. All rights reserved.
• Why move up the scale from this level?
– Too much human cycle time spent in low level analysis
– Too many re-runs (debug loop iterations)
– Lengthy simulation debug runs (recording overhead)
– Difficulty correlating waves to interesting “events” in TB
– Need to debug wider range of issues like procedural code execution, infinite loops, zero time loops, etc.
– Would like to debug at a higher levels of abstraction
– Looking to try “what if” scenarios while debugging
The Debug Methodology ScaleLevel 2: Manual Inspection of HDL waveforms + log file
Post Process HDL waveform
inspection + log file
33 © 2014 Cadence Design Systems, Inc. All rights reserved.
Revolutionary Debug Techniques Agenda
Welcome and Introductions
Debug Overview
Defining Debug Performance
Debug Methodology Scale
Level 1: Manual Inspection of HDL waveforms
Level 2: Manual inspection of HDL waveforms + Log file
Level 3: Manual inspection of HDL/HVL waveforms + Log file
Level 4: Interactive debug
Level 5: Interactive Post Process
Level 6: Interactive Post Process with regression automation
Summary
34 © 2014 Cadence Design Systems, Inc. All rights reserved.
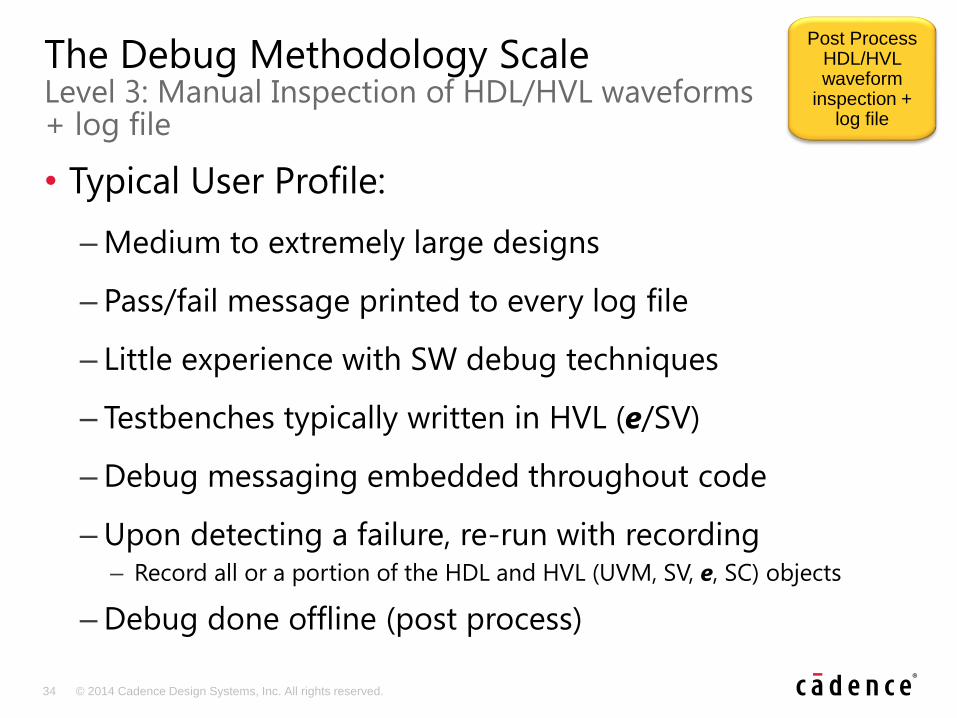
• Typical User Profile:
– Medium to extremely large designs
– Pass/fail message printed to every log file
– Little experience with SW debug techniques
– Testbenches typically written in HVL (e/SV)
– Debug messaging embedded throughout code
– Upon detecting a failure, re-run with recording– Record all or a portion of the HDL and HVL (UVM, SV, e, SC) objects
– Debug done offline (post process)
The Debug Methodology ScaleLevel 3: Manual Inspection of HDL/HVL waveforms + log file
Post Process HDL/HVL waveform
inspection + log file
35 © 2014 Cadence Design Systems, Inc. All rights reserved.
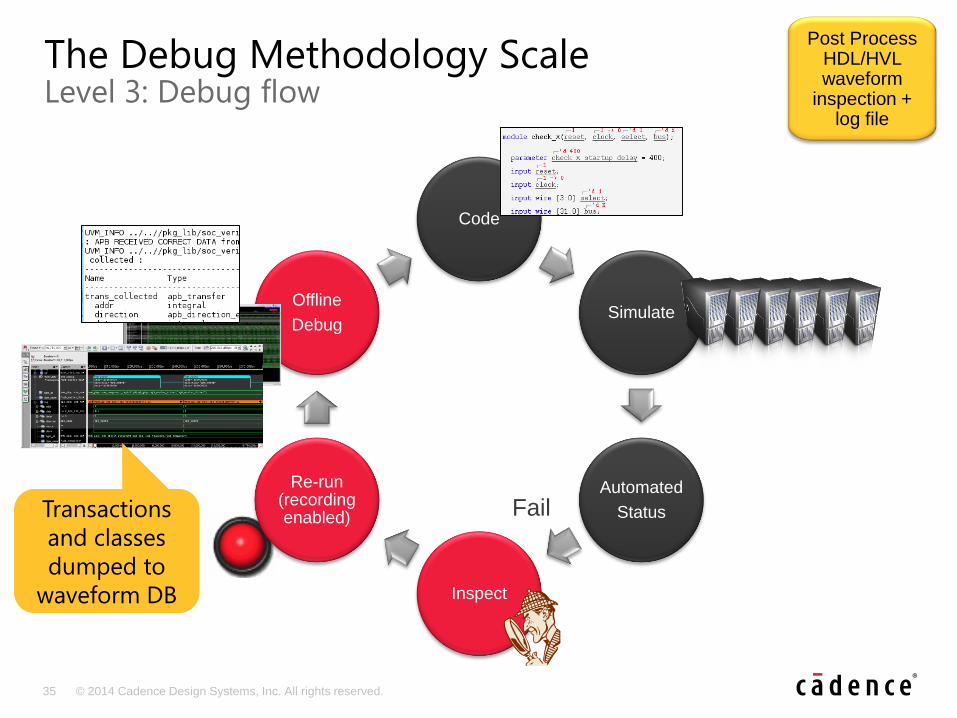
Code
Simulate
Automated
Status
Inspect
Re-run (recording enabled)
Offline
Debug
The Debug Methodology ScaleLevel 3: Debug flow
Fail
Post Process HDL/HVL waveform
inspection + log file
Transactions
and classes
dumped to
waveform DB
36 © 2014 Cadence Design Systems, Inc. All rights reserved.
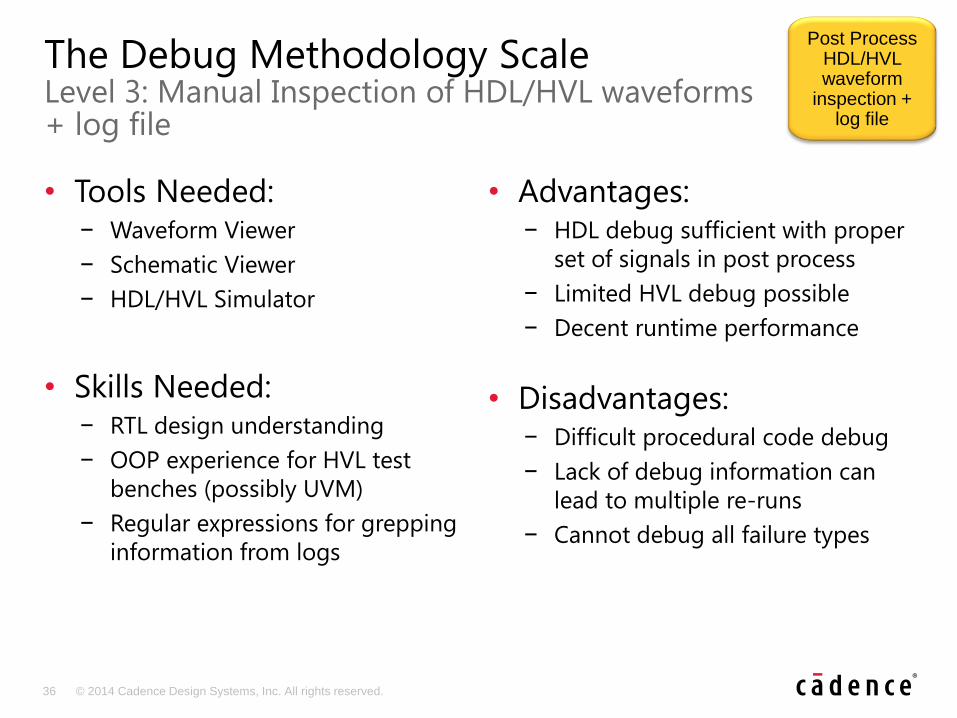
The Debug Methodology ScaleLevel 3: Manual Inspection of HDL/HVL waveforms + log file
• Tools Needed: − Waveform Viewer
− Schematic Viewer
− HDL/HVL Simulator
• Skills Needed: − RTL design understanding
− OOP experience for HVL test
benches (possibly UVM)
− Regular expressions for grepping
information from logs
• Advantages: − HDL debug sufficient with proper
set of signals in post process
− Limited HVL debug possible
− Decent runtime performance
• Disadvantages:− Difficult procedural code debug
− Lack of debug information can
lead to multiple re-runs
− Cannot debug all failure types
Post Process HDL/HVL waveform
inspection + log file

37 © 2014 Cadence Design Systems, Inc. All rights reserved.
• Why move up the scale from this level?
– Not enough debug data in waveforms alone
– Need to debug procedural code execution
– Too many re-runs (debug loop iterations)
– Disk space limitations (large waveform databases)
– Difficulty correlating waves to interesting “events” in the test bench
– Working with multiple-languages
– Looking to try “what if” scenarios while debugging
– Need to debug wider range of issues like infinite loops, zero time loops, etc
The Debug Methodology ScaleLevel 3: Manual Inspection of HDL/HVL waveforms + log file
Post Process HDL/HVL waveform
inspection + log file

38 © 2014 Cadence Design Systems, Inc. All rights reserved.
Revolutionary Debug Techniques Agenda
Welcome and Introductions
Debug Overview
Defining Debug Performance
Debug Methodology Scale
Level 1: Manual Inspection of HDL waveforms
Level 2: Manual inspection of HDL waveforms + Log file
Level 3: Manual inspection of HDL/HVL waveforms + Log file
Level 4: Interactive debug
Level 5: Interactive Post Process
Level 6: Interactive Post Process with regression automation
Summary
39 © 2014 Cadence Design Systems, Inc. All rights reserved.
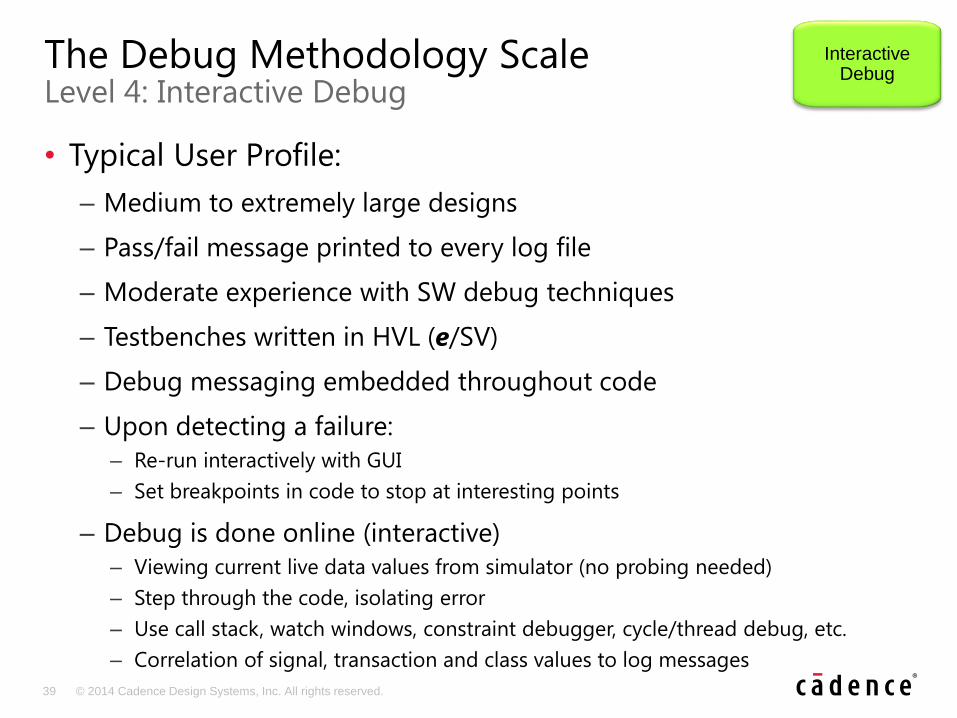
• Typical User Profile:
– Medium to extremely large designs
– Pass/fail message printed to every log file
– Moderate experience with SW debug techniques
– Testbenches written in HVL (e/SV)
– Debug messaging embedded throughout code
– Upon detecting a failure:
– Re-run interactively with GUI
– Set breakpoints in code to stop at interesting points
– Debug is done online (interactive)
– Viewing current live data values from simulator (no probing needed)
– Step through the code, isolating error
– Use call stack, watch windows, constraint debugger, cycle/thread debug, etc.
– Correlation of signal, transaction and class values to log messages
The Debug Methodology ScaleLevel 4: Interactive Debug
Interactive Debug
40 © 2014 Cadence Design Systems, Inc. All rights reserved.
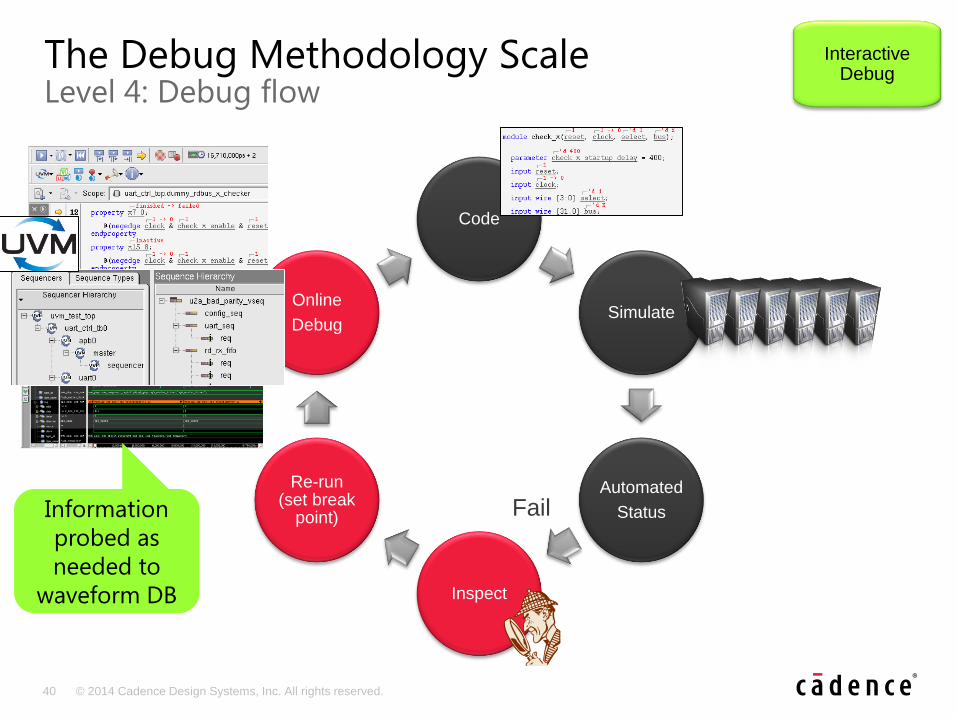
Code
Simulate
Automated
Status
Inspect
Re-run (set break
point)
Online
Debug
The Debug Methodology ScaleLevel 4: Debug flow
FailInformation
probed as
needed to
waveform DB
Interactive Debug

41 © 2014 Cadence Design Systems, Inc. All rights reserved.
• Mindset change and ramp up– Easier (sometimes faster) to just add print statements and re-run
– RTL debug background (post process)
• Lack of awareness of interactive debug capabilities
• Historically immature EDA debug tools
• Some EDA companies promoted print statement debug as a workaround for lack of interactive debug capabilities
• We are using it … just not that often– Only for really tough issues
– Start with log, then increase verbosity and recording, finally interactive
Interactive Debug TechniquesWhy we not using it more often?
Interactive Debug
42 © 2014 Cadence Design Systems, Inc. All rights reserved.
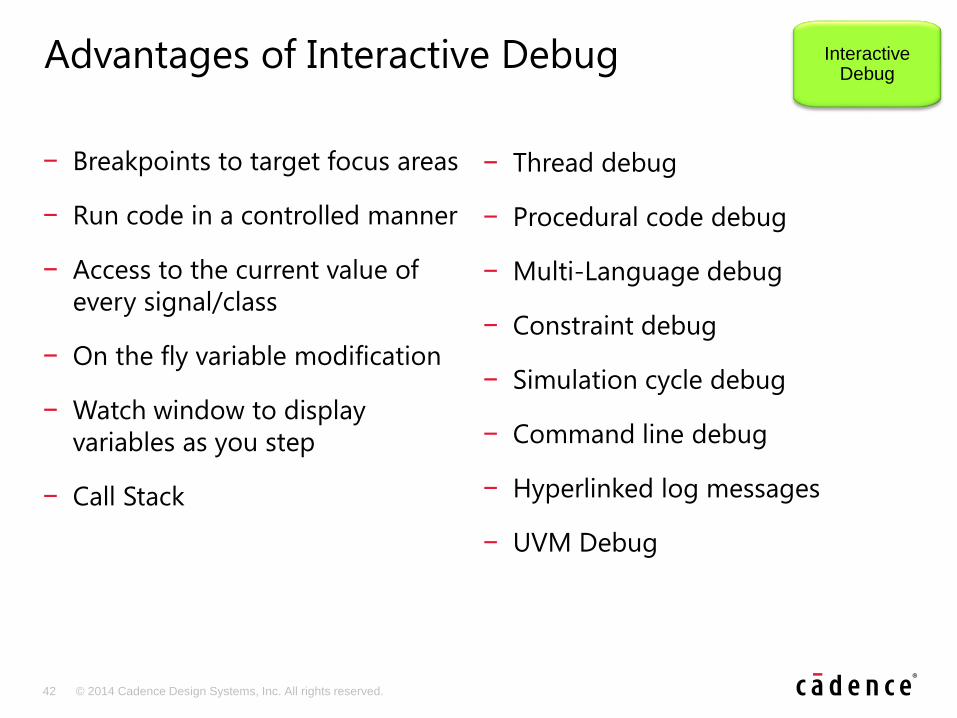
Advantages of Interactive Debug
− Breakpoints to target focus areas
− Run code in a controlled manner
− Access to the current value of
every signal/class
− On the fly variable modification
− Watch window to display
variables as you step
− Call Stack
− Thread debug
− Procedural code debug
− Multi-Language debug
− Constraint debug
− Simulation cycle debug
− Command line debug
− Hyperlinked log messages
− UVM Debug
Interactive Debug
43 © 2014 Cadence Design Systems, Inc. All rights reserved.
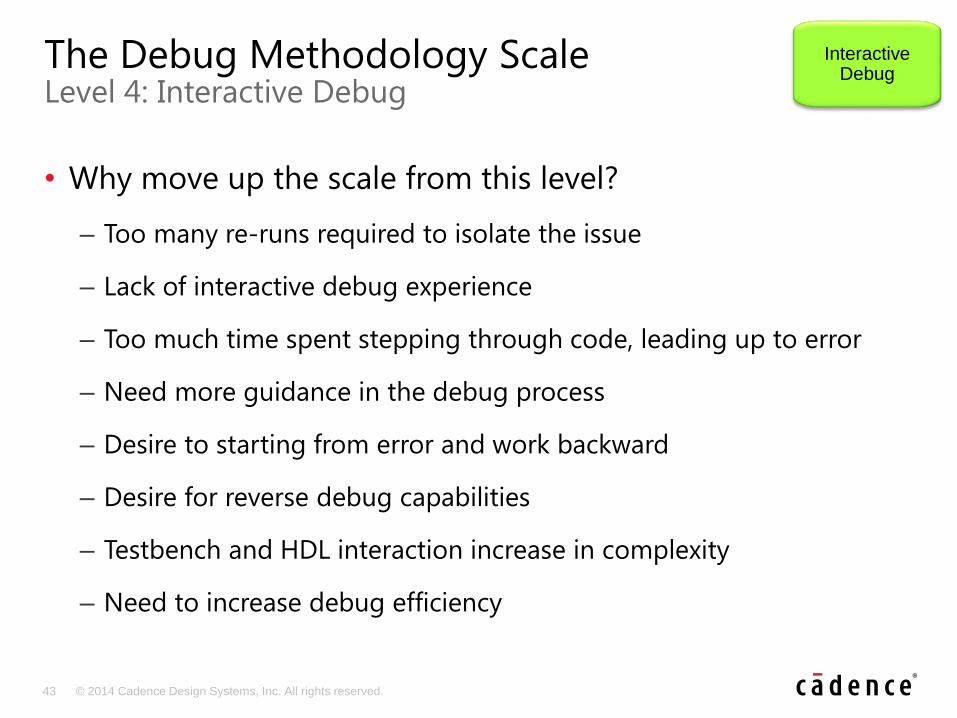
• Why move up the scale from this level?
– Too many re-runs required to isolate the issue
– Lack of interactive debug experience
– Too much time spent stepping through code, leading up to error
– Need more guidance in the debug process
– Desire to starting from error and work backward
– Desire for reverse debug capabilities
– Testbench and HDL interaction increase in complexity
– Need to increase debug efficiency
The Debug Methodology ScaleLevel 4: Interactive Debug
Interactive Debug

44 © 2014 Cadence Design Systems, Inc. All rights reserved.
• What if we never needed to re-run more than once?
• We had a tool that guided us through the debug process?
• What if we could step forward/backward through code?
• What if we could immediately jump through time and space to interesting events in a single click?
• What if we never needed to manually grep log files?
• We were able to cut our debug turnaround time in half?
• All of the above was enabled through only a slight modification to our post process debug methodology?
Revolution in Debug Methodology
45 © 2014 Cadence Design Systems, Inc. All rights reserved.
It’s time to introduce a
Revolutionin Debug Methodology
46 © 2014 Cadence Design Systems, Inc. All rights reserved.
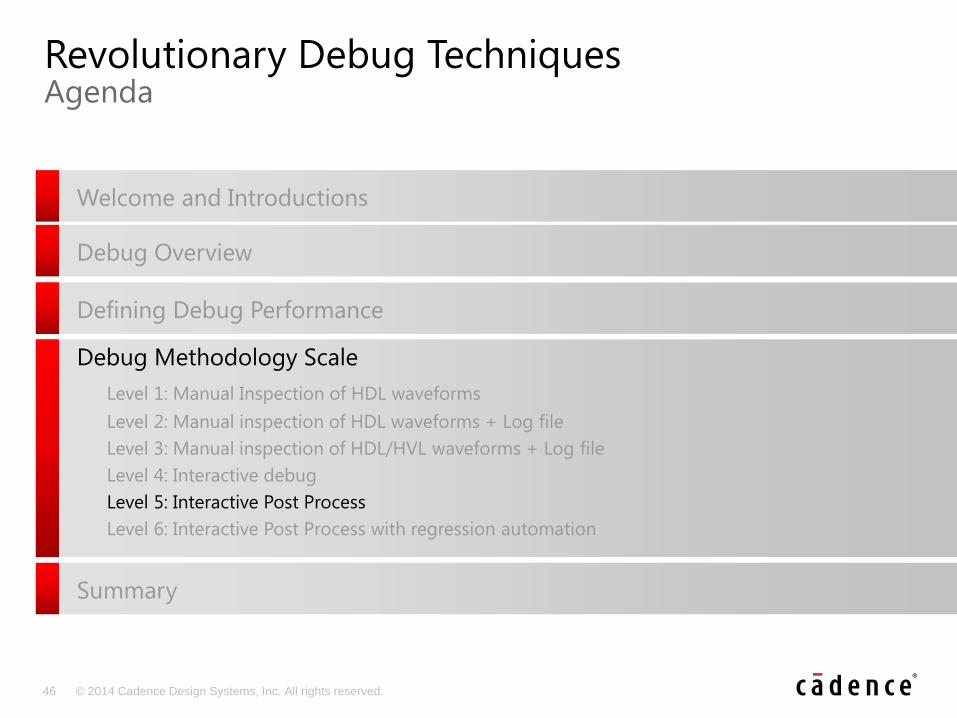
Revolutionary Debug Techniques Agenda
Welcome and Introductions
Debug Overview
Defining Debug Performance
Debug Methodology Scale
Level 1: Manual Inspection of HDL waveforms
Level 2: Manual inspection of HDL waveforms + Log file
Level 3: Manual inspection of HDL/HVL waveforms + Log file
Level 4: Interactive debug
Level 5: Interactive Post Process
Level 6: Interactive Post Process with regression automation
Summary

47 © 2014 Cadence Design Systems, Inc. All rights reserved.
• Typical User Profile:
– Pass/fail message printed to every log file
– Little to moderate experience with SW debug techniques
– Testbenches written in HVL (e/SV)
– Debug messaging embedded throughout code– Possibly several verbosity levels controllable from command line
– Upon detecting a failure, re-run with recording– Record all or a portion of the HDL/HVL code execution, object values, etc
– Debug is done offline (post process) – Start from failure point and work backwards– Use Cause Investigation to be guided through debug process– Step through code forward/backward, isolating error– Can use breakpoints, call stack, watch windows, thread debug, etc. – Hyperlinked and interactive log file provides quick navigation
The Debug Methodology ScaleLevel 5: Interactive Post Process
Interactive Post
Process
48 © 2014 Cadence Design Systems, Inc. All rights reserved.
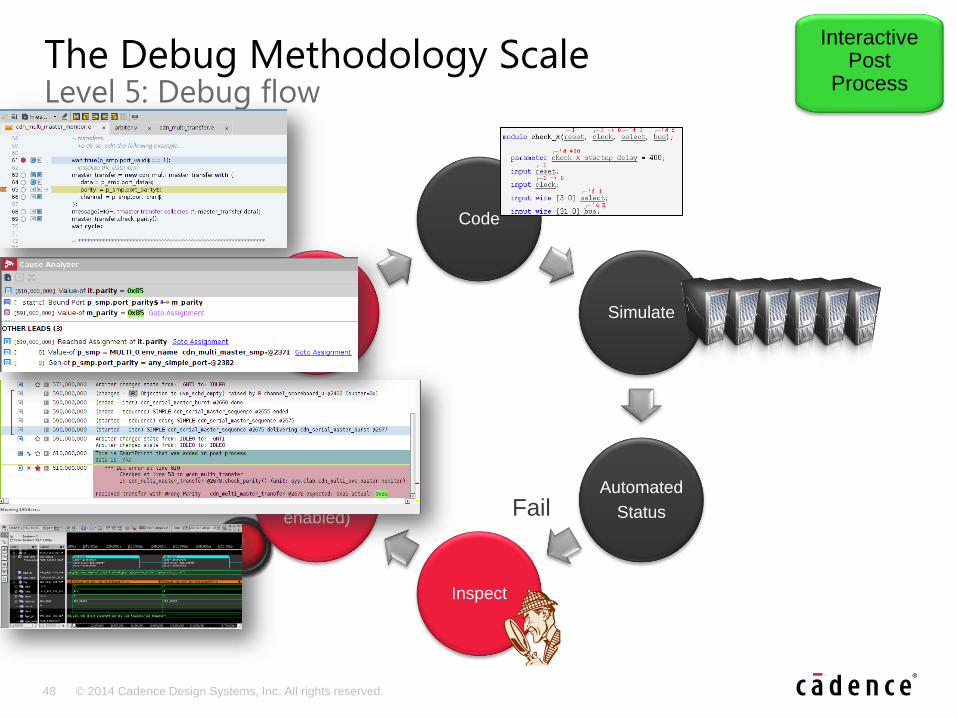
Code
Simulate
Automated
Status
Inspect
Re-run (recording enabled)
Offline
Debug
Fail
The Debug Methodology ScaleLevel 5: Debug flow
Interactive Post
Process
49 © 2014 Cadence Design Systems, Inc. All rights reserved.
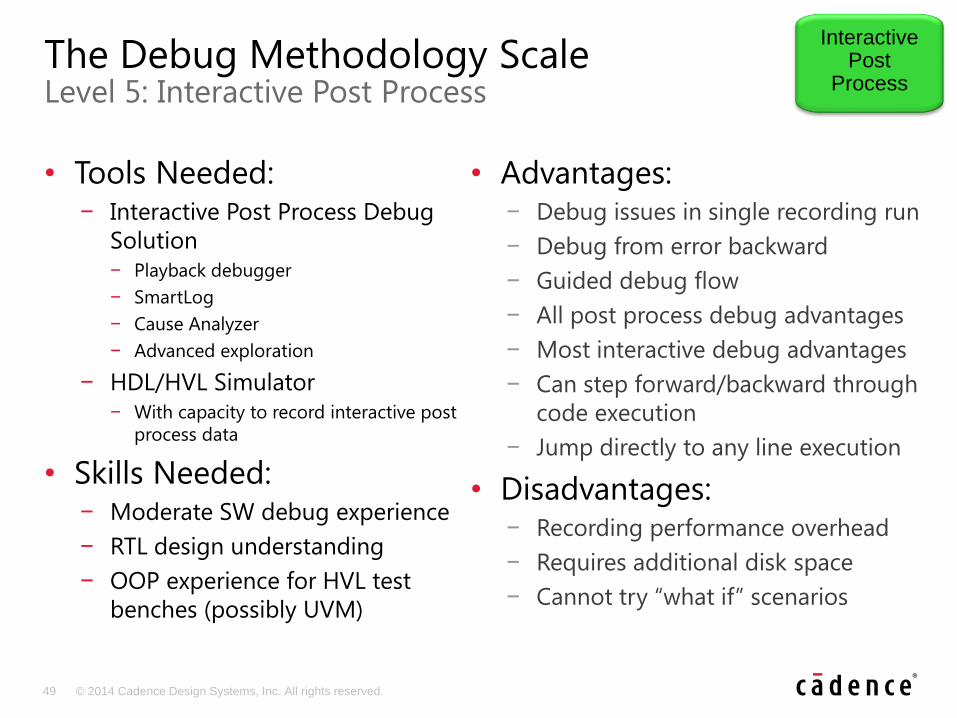
The Debug Methodology ScaleLevel 5: Interactive Post Process
• Tools Needed: − Interactive Post Process Debug
Solution
− Playback debugger
− SmartLog
− Cause Analyzer
− Advanced exploration
− HDL/HVL Simulator
− With capacity to record interactive post
process data
• Skills Needed: − Moderate SW debug experience
− RTL design understanding
− OOP experience for HVL test
benches (possibly UVM)
• Advantages: − Debug issues in single recording run
− Debug from error backward
− Guided debug flow
− All post process debug advantages
− Most interactive debug advantages
− Can step forward/backward through
code execution
− Jump directly to any line execution
• Disadvantages:− Recording performance overhead
− Requires additional disk space
− Cannot try “what if” scenarios
Interactive Post
Process
50 © 2014 Cadence Design Systems, Inc. All rights reserved.
Demo
51 © 2014 Cadence Design Systems, Inc. All rights reserved.
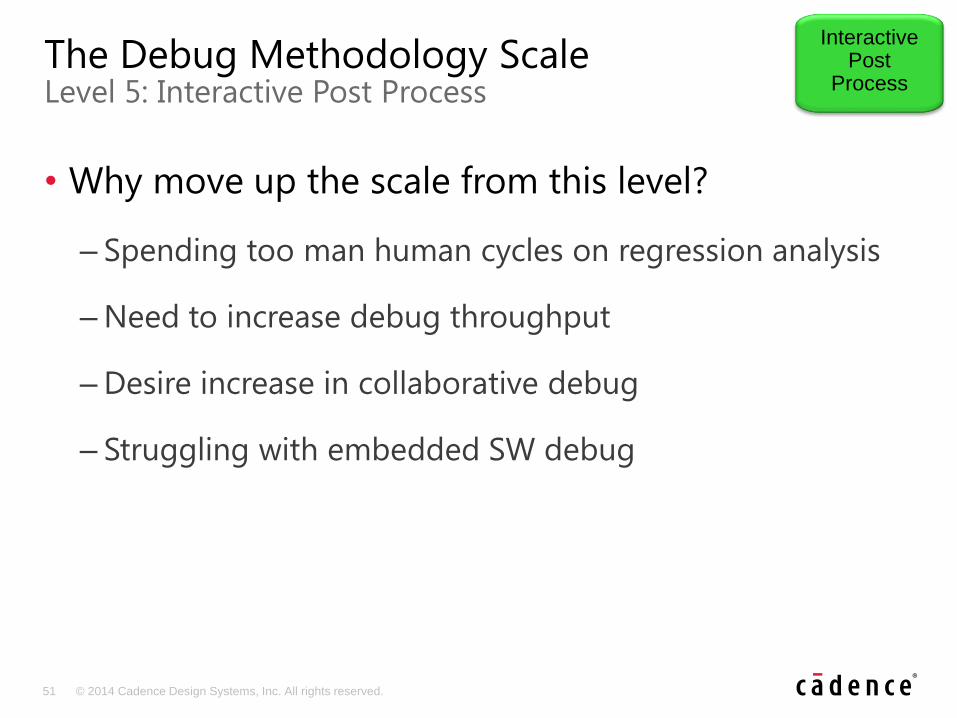
• Why move up the scale from this level?
– Spending too man human cycles on regression analysis
– Need to increase debug throughput
– Desire increase in collaborative debug
– Struggling with embedded SW debug
The Debug Methodology ScaleLevel 5: Interactive Post Process
Interactive Post
Process
52 © 2014 Cadence Design Systems, Inc. All rights reserved.
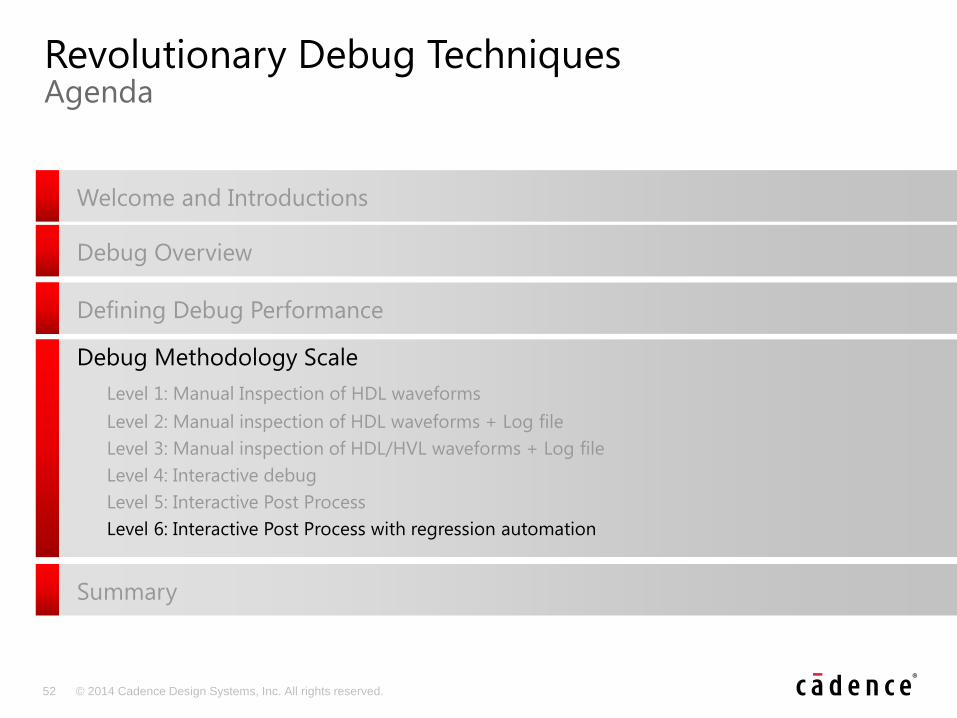
Revolutionary Debug Techniques Agenda
Welcome and Introductions
Debug Overview
Defining Debug Performance
Debug Methodology Scale
Level 1: Manual Inspection of HDL waveforms
Level 2: Manual inspection of HDL waveforms + Log file
Level 3: Manual inspection of HDL/HVL waveforms + Log file
Level 4: Interactive debug
Level 5: Interactive Post Process
Level 6: Interactive Post Process with regression automation
Summary
53 © 2014 Cadence Design Systems, Inc. All rights reserved.
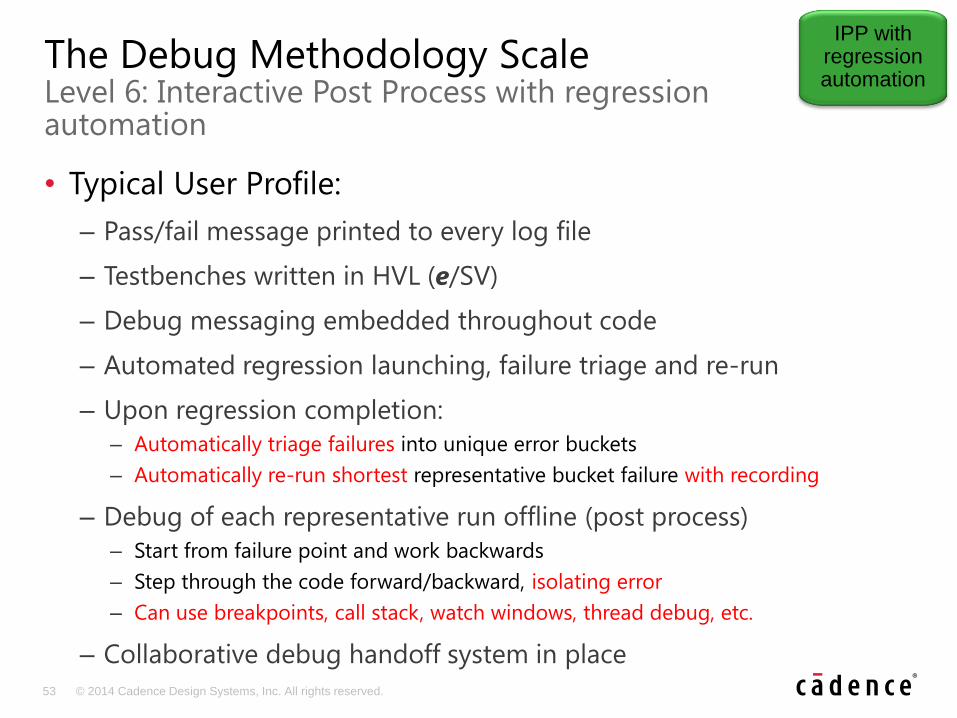
• Typical User Profile:
– Pass/fail message printed to every log file
– Testbenches written in HVL (e/SV)
– Debug messaging embedded throughout code
– Automated regression launching, failure triage and re-run
– Upon regression completion:
– Automatically triage failures into unique error buckets
– Automatically re-run shortest representative bucket failure with recording
– Debug of each representative run offline (post process)
– Start from failure point and work backwards
– Step through the code forward/backward, isolating error
– Can use breakpoints, call stack, watch windows, thread debug, etc.
– Collaborative debug handoff system in place
The Debug Methodology ScaleLevel 6: Interactive Post Process with regression automation
IPP with regression automation
54 © 2014 Cadence Design Systems, Inc. All rights reserved.
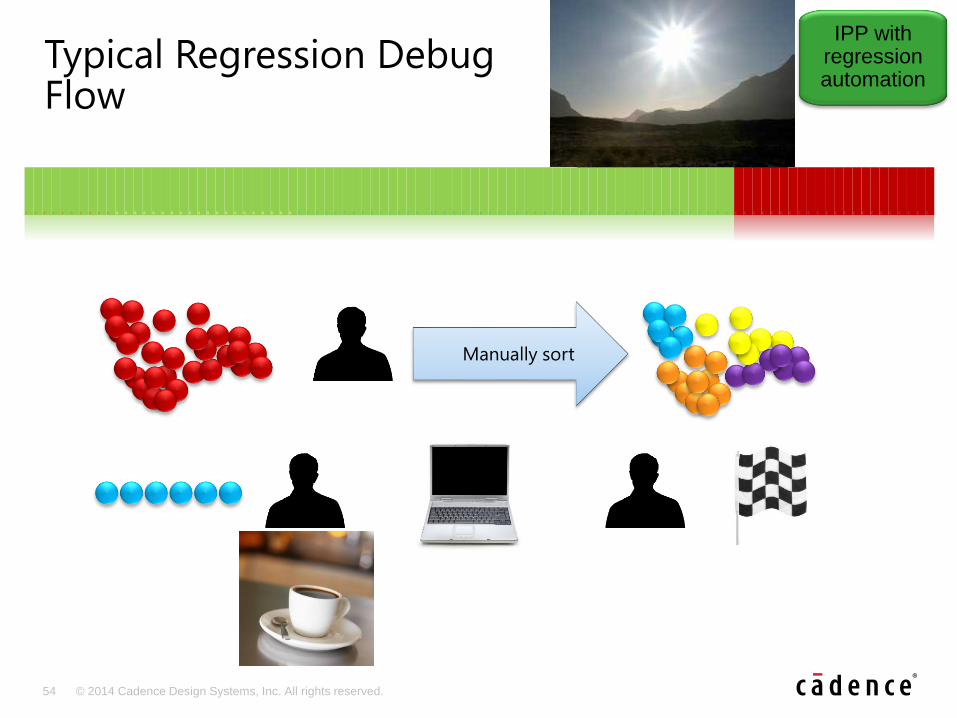
Typical Regression Debug Flow
A A A A A A A A A A B B B B B B B B B B B B B B B B B B B B C C C C C C C C C C C C C C C C C C C C C C C C C C C C C C C C C C C C C C C C C C C C C C C C C C C C C C C C C C C C C C C C C C C C C C
Manually sort
IPP with regression automation

55 © 2014 Cadence Design Systems, Inc. All rights reserved.
Regression Automation Debug Flow
A A A A A A A A A A B B B B B B B B B B B B B B B B B B B B C C C C C C C C C C C C C C C C C C C C C C C C C C C C C C C C C C C C C C C C C C C C C C C C C C C C C C C C C C C C C C C C C C C C C CA A A A A A A A A A B B B B B B B B B B B B B B B B B B B B C C C C C C C C C C C C C C C C C C C C C C C C C C C C C C C C C C C C C C C C C C C C C C C C C C C C C C C C C C C C C C C C C C C C C C
IPP with regression automation
56 © 2014 Cadence Design Systems, Inc. All rights reserved.
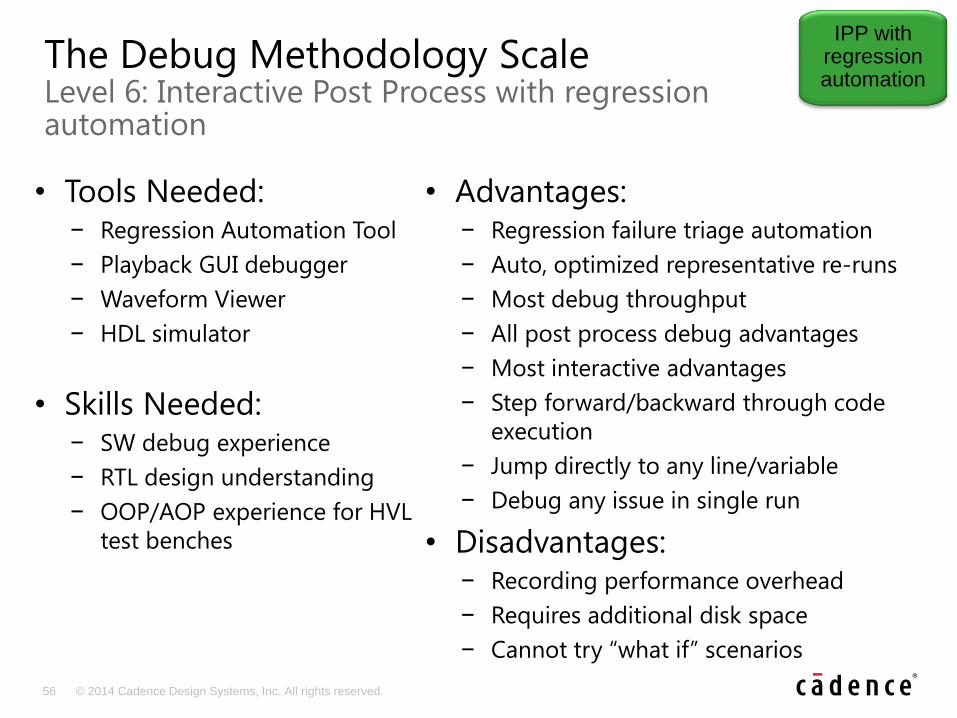
The Debug Methodology ScaleLevel 6: Interactive Post Process with regression automation
• Tools Needed: − Regression Automation Tool
− Playback GUI debugger
− Waveform Viewer
− HDL simulator
• Skills Needed: − SW debug experience
− RTL design understanding
− OOP/AOP experience for HVL
test benches
• Advantages: − Regression failure triage automation
− Auto, optimized representative re-runs
− Most debug throughput
− All post process debug advantages
− Most interactive advantages
− Step forward/backward through code
execution
− Jump directly to any line/variable
− Debug any issue in single run
• Disadvantages:− Recording performance overhead
− Requires additional disk space
− Cannot try “what if” scenarios
IPP with regression automation
57 © 2014 Cadence Design Systems, Inc. All rights reserved.
Revolutionary Debug Techniques Agenda
Welcome and Introductions
Debug Overview
Defining Debug Performance
Debug Methodology Scale
Level 1: Manual Inspection of HDL waveforms
Level 2: Manual inspection of HDL waveforms + Log file
Level 3: Manual inspection of HDL/HVL waveforms + Log file
Level 4: Interactive debug
Level 5: Interactive Post Process
Level 6: Interactive Post Process with regression automation
Summary

58 © 2014 Cadence Design Systems, Inc. All rights reserved.
• Today’s SoC’s depend on embedded SW
• Embedded SW Debug typically involves Acceleration and Embedded SW Engineers
The Unified Debug Big Picture HW/SW SoC Debug
SOC Debug
Testbench Debug
RTL Debug
RTL Design
Engineer
System
Integrator
Verification
Engineer
Embedded SW
Engineer
System
Architect
Acceleration/
Emulation
Specialist

59 © 2014 Cadence Design Systems, Inc. All rights reserved.
• Same use model
• Same software feature capabilities– Playback debugger
– SmartPrint
– Software choose execution
– Source code exploration
• Same debug platform
• More software oriented features– Disassembly
– Multi Core support
– Tight waveform integration
The Unified debug platform
60 © 2014 Cadence Design Systems, Inc. All rights reserved.
Demo
61 © 2014 Cadence Design Systems, Inc. All rights reserved.
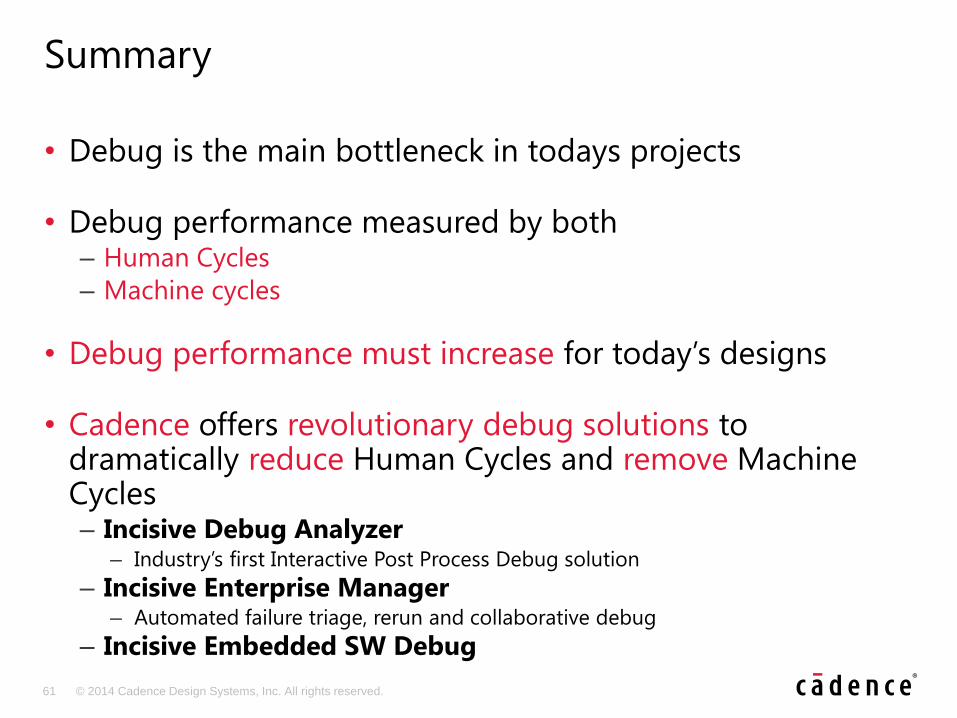
• Debug is the main bottleneck in todays projects
• Debug performance measured by both – Human Cycles
– Machine cycles
• Debug performance must increase for today’s designs
• Cadence offers revolutionary debug solutions to dramatically reduce Human Cycles and remove Machine Cycles– Incisive Debug Analyzer
– Industry’s first Interactive Post Process Debug solution
– Incisive Enterprise Manager– Automated failure triage, rerun and collaborative debug
– Incisive Embedded SW Debug
Summary


![AM1 Debug Probe Quick-Start Guide · AM1 Debug Probe Quick-Start Guide [1] AM1 Debug Probe 1.1 Target Connection Image To HOST COMPUTER by USB1.1 AM1 Debug Probe MN101XXXXX MicroCompuer](https://static.fdocuments.us/doc/165x107/60b451c0278d9528a0323ead/am1-debug-probe-quick-start-am1-debug-probe-quick-start-guide-1-am1-debug-probe.jpg)