
Revista Internacional de Investigación e Innovación...
12
Vol. 5, No. 29 Noviembre – Diciembre 2017 1 LED as a low cost single photon source El LED como fuente de fotones individuales Linares-Vallejo, E., Dahnoun, N., Rarity, J.G. Department of Electrical and Electronic Engineering, University of Bristol; BS8 1TR. Bristol, United Kingdom, [email protected], [email protected], [email protected] Technological innovation: Low cost single photon source. Industrial application area: Quantum cryptography, Quantum computing, Quantum entanglement and Quantum teleportation. Received: 13 July 2017. Accepted: 13 October 2017. Resumen Las fuentes de fotones individuales usan luz no-agrupada para producir fotones individuales, y en este artículo se describe una aplicación con el diodo emisor de luz (Light Emitting Diode; LED) como una fuente de fotones individuales de bajo costo usando pulsos débiles de luz coherente, el uso correcto de circuitos de radiofrecuencia (RF) para controlar la zona de agotamiento del LED, puede lograr una emisión de pulsos ópticos correspondiente a los pulsos eléctricos en la excitación del LED para generar fotones individuales, sin embargo circuitos tradicionales de conmutación para control de un LED fallan considerablemente cuando el tiempo de conmutación es menor a 10ns provocando una foto emisión no deseada. Este experimento demuestra que un fotón individual puede ser generado por un LED controlado. Palabras clave: Fotonica Cuántica, fuente de fotones, LED Abstract Single photon sources use anti-bunched light to produce single photons, and in this article an application is described. With a light emitter diode (LED) as a low cost single photon source using weak light coherent pulses, the appropriate use of radiofrequency (RF) circuits to control the LED depletion zone, it could achieve an emission of optical pulses appropriat to the electrical pulses in the LED excitation to generate single photons. Nevertheless, the switching circuits for the LED control fail when the time of commutation is under 10ns, which then provokes a non-desired photon emission. This experiment shows that a controlled LED can generate a single photon. Key Words: Quantum photonics, single photon sources, LED. Revista Internacional de Investigación e Innovación Tecnológica Página principal: www.riiit.com.mx
Transcript of Revista Internacional de Investigación e Innovación...

Vol. 5, No. 29 Noviembre – Diciembre 2017
1
LED as a low cost single photon source
El LED como fuente de fotones individuales
Linares-Vallejo, E., Dahnoun, N., Rarity, J.G.
Department of Electrical and Electronic Engineering, University of Bristol; BS8 1TR. Bristol, United Kingdom,
[email protected], [email protected], [email protected]
Technological innovation: Low cost single photon source. Industrial application area: Quantum cryptography, Quantum computing, Quantum
entanglement and Quantum teleportation.
Received: 13 July 2017.
Accepted: 13 October 2017.
Resumen
Las fuentes de fotones individuales usan luz no-agrupada para producir fotones individuales, y
en este artículo se describe una aplicación con el diodo emisor de luz (Light Emitting Diode;
LED) como una fuente de fotones individuales de bajo costo usando pulsos débiles de luz
coherente, el uso correcto de circuitos de radiofrecuencia (RF) para controlar la zona de
agotamiento del LED, puede lograr una emisión de pulsos ópticos correspondiente a los pulsos
eléctricos en la excitación del LED para generar fotones individuales, sin embargo circuitos
tradicionales de conmutación para control de un LED fallan considerablemente cuando el tiempo
de conmutación es menor a 10ns provocando una foto emisión no deseada. Este experimento
demuestra que un fotón individual puede ser generado por un LED controlado.
Palabras clave: Fotonica Cuántica, fuente de fotones, LED
Abstract
Single photon sources use anti-bunched light to produce single photons, and in this article
an application is described. With a light emitter diode (LED) as a low cost single photon
source using weak light coherent pulses, the appropriate use of radiofrequency (RF)
circuits to control the LED depletion zone, it could achieve an emission of optical pulses
appropriat to the electrical pulses in the LED excitation to generate single photons.
Nevertheless, the switching circuits for the LED control fail when the time of commutation is
under 10ns, which then provokes a non-desired photon emission. This experiment shows that a
controlled LED can generate a single photon.
Key Words: Quantum photonics, single photon sources, LED.
Revista Internacional de Investigación e Innovación
Tecnológica
Página principal: www.riiit.com.mx

Vol. 5, No. 29 Noviembre – Diciembre 2017
2
1. Introduction
Single photon sources began with the Brown
and Twiss experiment [1], who had the
purpose of studying the astrophysical
properties of space. After Glauber postulated
that the correlation functions for coherent
fields [2] applied to coherent fields like a
laser light, by 1965 it was still believed that
light quantum properties followed the
electromagnetic classic theory. However
when Bell published his theory about
inequality [3], finally there was a possibility
to prove the Einstein-Poldolsky-Rosen
paradox [4]
experimentally. This is the
moment when the necessity to obtain single
photons with anti-bunching light became
important.
Clauser in 1974 [5], developed an
experiment to obtain single photons based
on the transition cascade of calcium atoms.
This experiment is considered the first single
photon that was sourced successfully. Thus
there was a way to demonstrate
experimentally Bell’s inequality proposed
years before. Since this first single photon
source, there have been several
developments of single photon sources,
dividing them in to two types: deterministic
and probabilistic [6]. However to understand
how a single photon source works, it is
necessary to understand the anti-bunching
light concept.
In 1977 Kimble observed for the first time
an anti-bunching light effect
[7] when a
single photon could be detected in the
transmitter and receiver arms of the Brown
and Twiss experiment, this single photon is
isolated from other photons by a gap of time,
this effect can be mathematically
demonstrated with the second-order
correlation function in Eq. (1) [8].
( )( ) ⟨ ( ) ( )⟩
⟨ ( )⟩ (Eq. 1)
Where t is time of propagation, τ a delay
and I the intensity of the electromagnetic
field. When τ =0 and g(2)
is 0, it is
considered a perfect anti-bunching light.
Also the second-order correlation function
can be related with the number of photons at
a sample time in the Eq (2) [9].
( )( ) ⟨ ( ) ( )⟩
⟨ ⟩ (Eq. 2)
Where T is the photo detection sample time
and ⟨ ⟩ is the average count rate per photo
detection sample time. This function is
illustrated in Figure 1 applied to continuous
or pulsing light. When it is continuous, the
single photon detection observes Rabi
oscillations (Figure 1a) and when it is
pulsed, it behaves like the Dirac function
(Figure 1b) where each Dirac pulse
represents coincidences of optical pulses.

Vol. 5, No. 29 Noviembre – Diciembre 2017
3
Cor
rela
tio
n Fu
ncti
on
Delay Time (ns)
a)
0 20-20
1.5
1.0
0.5
0.0
Delay Time (ns)
b)
0 20-20 40-40
Co
inci
den
ces
(A.U
)
Figure 1. a) Rabi oscillations in a continuous single
photon light source, b) coincidences generate by each
single photon detector.
The single photon sources can be controlled
optically or electrically, although the latter
has more applications. The electrical pulses
are applied to the LED structure stimulating
the minority carriers in the silicon substrate
(N and P). This generates photons under
demand however when the purpose is to
generate single photons with the LED, it is
not possible due to the minority carriers
combination. It still releases photons until it
becomes a non-radiative recombination in a
so-called depletion zone.
There are single photon sources with nano-
wired LEDs [10], although they are
considered as quantum dots due to the
special temperature conditions of 10°K (-
263°C). Therefore, there is a proposal to
control the combination of minority carriers
with high-speed response circuits, of which
the advantages are: low cost, compactness
and lack of requirement to have special
temperatures, i.e. they can work at room
temperature.
2. Experimental Procedure
A. Material and Equipment
The LED can have different parameters of
excitation such as physical and electrical
properties. Therefore, the LED used in this
experiment could have some slight
difference between another of the same
model. Figure 2 illustrates the equivalent
circuit of the LED when it is forward bias.
Figure 2. LED equivalent circuit, Cj is the junction
capacitance, Rd is the diffusion resistance and Cd is
the diffusion capacitance.
The junction capacitance is low and
despised, diffusion capacitance is related
with the depletion zone. The LED used is a
Vishay TLHR4400 with a wavelength (λ) of
625nm.
The single photon detector used is an id100-
50-MMF of idQuantique, with a λ response
between 360 - 760nm. The optical pulses
measurement is realised with a PicoQuant
time-correlator PicoHarp300. An optic fibre
multi-mode of 100 µm model FG105LCA,
to transfer the light to the single photon

Vol. 5, No. 29 Noviembre – Diciembre 2017
4
detector and an optical power meter model
PM100D with its detector SC700C to
measure the LED optical power were used
both sourced from Thorlabs.
The experiment was mounted in a cage
system to avoid problems of alignment
between the LED, and the aspheric lens
(ACL2520U-DG6), which concentrates the
light in the fibre-optic tip to reduce losses.
Figure 3 illustrates the scheme and shows a
picture of the optical experimental array.
d1
Multi-mode fibre optic d2
Aspheric lens
LED
a)
Figure 3. a) Scheme of the optical system, b) Optical
experimental array.
There are two circuits used for this
experiment: the operational amplifier
THS3202 from Texas instruments with its
respective evaluation board and an LED
switching driver with a current booster. The
transistor used in the driver is a BFG 198
UHF transistor from NXP semiconductors
and BC847 with MMBTA42LT1G for the
current booster.
The electric signals are recorded by a
storage oscilloscope from Keysight model
DSOS404A and the electrical pulses are
generated with a pulse generator from
Agilent model 81130A.
B. Circuits simulation
The circuit analysis is developed through a
simulation with the most realistic conditions
using Multisim 12.0 from National
Semiconductors with electrical pulses of 2ns
duration as the middle point of the times
used to excite the LED. Afterwards the
simulation results are compared with the
experimental results.
C. Experimental method
The first step previous to any optical
measurement is a light concentration from
the LED to the fibre-optic tip thus reducing
possible losses, the adjustment of the
aspherical lens to a certain distance of
24.5mm from the LED and 104.2mm from
the optical fibre. These are obtained
empirically or they can be calculated by the
Eq. (3).
(Eq. 3)
Where f is the focal length (Thorlabs
specified this information), d1 is the distance
from the LED and d2 is the distance to the
optical fibre. The frequency of repetition for
the electrical pulses is 10MHz and the
duration times used are 1ns, 2ns and 5ns.
The schematic diagram of the THS3202
evaluation circuit (Figure 4a), is provided
by Texas instruments [11]. Only the channel
2 is used due to the gain of 1 because at

Vol. 5, No. 29 Noviembre – Diciembre 2017
5
commutation times of 2ns and 1ns, more
voltage and current are necessary for the
LED excitation. The input of the pulses is
connected to the non-inverter input and 1V
in the inverters input to adjust the offset
level in the output signal. This offset level
would stop the minority carrier in the
depletion zone.
The diagram schematic of the LED driver
with a current booster is illustrated in Figure
4b.
Current Booster
Q1
Q2
C1
R1
R3
R2L1
L2
5V
12V
C2
L3
Q3
VoltageDivider
V1
b)
Figure 4. Diagram schematic of: a) THS3202
evaluation circuit and b) The LED driver.
This circuit uses two voltage sources: the
first is 5V for the LED reference in its
anode and the second is 12V as a reverse
pulse to stop the recombination in the
depletion zone. The current booster is used
to increase the current through the LED
without changing the 5V.
The transistor Q2 enters in the saturation
region when there is no stimulation from the
source input V1 and the cut-off region is
activated with the presence of stimulation,
Q1 controls the operation of the cut-off-
saturation in Q2 synchronized with Q1, Q3 is
the LED switching driver; when in the cut-
off region the LED cathode is polarized
with 12V, although that voltage can be
adjusted by a voltage divider.
The LC circuits in the Q2 and Q3 base
terminals have the function of filters and
impedance coupling. The RL circuit in Q1
has the function of polarizing the transistor
in DC and AC, this circuit is based in the
high speed optical communication [12]. The
time resolution in the time-correlator is
adjusted to 512ps with threshold levels of
150mV to discriminate possible noise.
D. Control measurement of optical pulses
Previous to testing the circuits, the LED is
directly connected to the pulse generator to
know the depletion zone effects on the
electrical pulse stimulation with the widths
times proposed (1ns, 2ns and 5ns). Figure 5
and 6 illustrate the electrical and optical
pulses respectively.

Vol. 5, No. 29 Noviembre – Diciembre 2017
6
Figure 5. Electrical pulses obtained from the
oscilloscope. Scales: 1V/div and 10ns/div.
Figure 6. Optical pulse measurements registered
with the time-correlator.
The electric pulse with a time of 1ns is not
registered because there is not enough
excitation between the minority carriers to
generate any photon, and between the
optical pulses that correspond to 2ns and
5ns. There is an attenuation, due to the time
of electric pulse, stimulations need to be
amplified for a suitable photon radiation,
Table 1 shows the results of the optical
measurements.
Table 1. Comparison between pulses. Electrical pulse Optical pulse
1nS No emission
2nS 6.656ns
5nS 8.192ns
Therefore the time in the depletion zone is
around 4ns.
3. Discussion
A. Simulation Results
The result of the THS3202 evaluation
circuit is promising because the current in
the output signal is adjusted to the input
signal, although the output voltage signal is
low and has a longer duration but the
simulator indicates there is an emission
from the LED.
The LED driver enhances the output signal
voltage and the current is high, this could be
possible for Q3 switching. Figure 7
illustrates the results of the simulation for
both circuits.

Vol. 5, No. 29 Noviembre – Diciembre 2017
7
Figure 7. Graphic results obtained with the simulator
oscilloscope: a) THS3202 evaluation circuit, b) LED
driver.
Scales: a) 1V/div and 2ns/div.
b) 2V/div and 2ns/div.
The input signal is represented with the red
curve with 2V/div for both circuits. In
Figure 7a the blue signal represents the
current with 50mA/div and the green signal
is the voltage in the output signal with
1V/div. In Figure 7b, the blue signal
represents the transition between the cut-off
and saturation region with 2V/div, the green
signal represents the falling voltage in the
cathode with 5V/div, and the pink signal
represents the circulation current. The time
division for both graphs is 2ns/div.
B. Experimental Results of circuits
The THS3202 has an excellent output
signal, better than the simulation although
there is a slight attenuation that limits a
photon emission. Figure 8 illustrates the
signals observed.
Figure 8. Signals obtained experimentally with the
THS3202 evaluation circuit: a) input signal, b)
output signal.
Scales: 500mV/div and 5ns/div.
The LED driver has similar results in its
simulation, although it is possible to observe
a slight noise without affecting the
stimulation. The main difference observed
in the LED with the circuits, is that there is
no limitation of photon emission by the
LED driver. This is due to the current
booster supplying the necessary current that
the THS3202 cannot supply. Figure 9
illustrates the signals observed.
Vol. 5, No. 29 Noviembre – Diciembre 2017
8
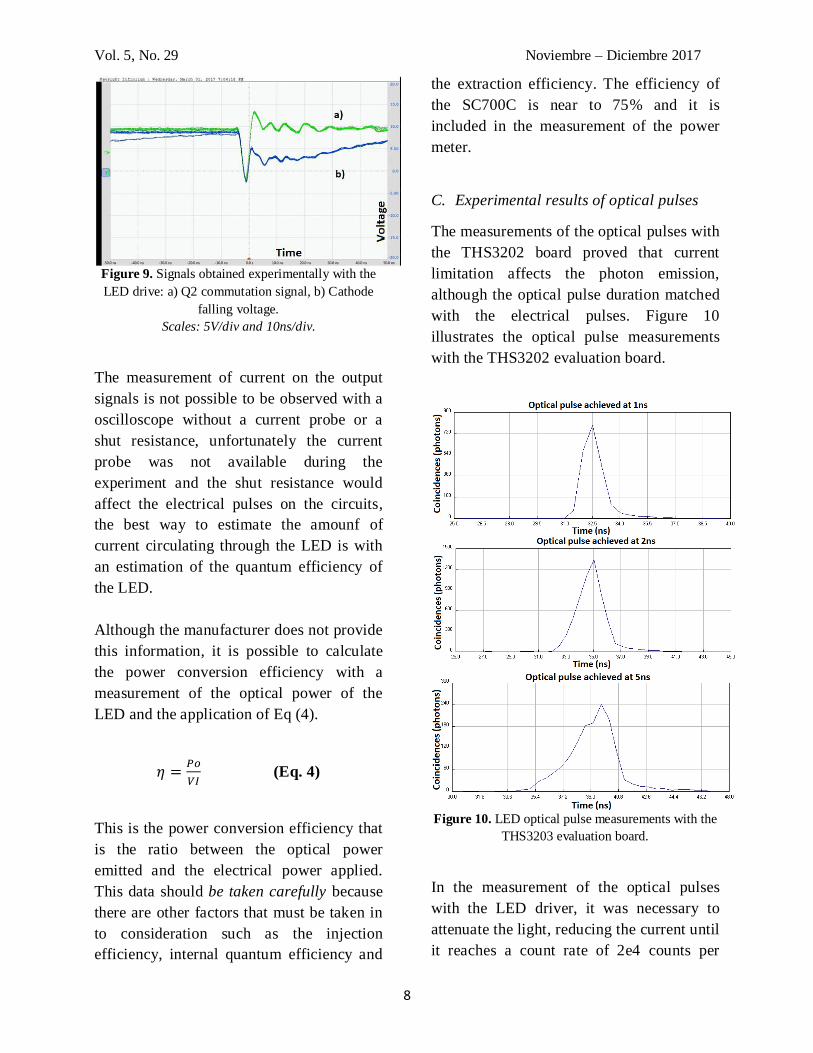
Figure 9. Signals obtained experimentally with the
LED drive: a) Q2 commutation signal, b) Cathode
falling voltage.
Scales: 5V/div and 10ns/div.
The measurement of current on the output
signals is not possible to be observed with a
oscilloscope without a current probe or a
shut resistance, unfortunately the current
probe was not available during the
experiment and the shut resistance would
affect the electrical pulses on the circuits,
the best way to estimate the amounf of
current circulating through the LED is with
an estimation of the quantum efficiency of
the LED.
Although the manufacturer does not provide
this information, it is possible to calculate
the power conversion efficiency with a
measurement of the optical power of the
LED and the application of Eq (4).
(Eq. 4)
This is the power conversion efficiency that
is the ratio between the optical power
emitted and the electrical power applied.
This data should be taken carefully because
there are other factors that must be taken in
to consideration such as the injection
efficiency, internal quantum efficiency and
the extraction efficiency. The efficiency of
the SC700C is near to 75% and it is
included in the measurement of the power
meter.
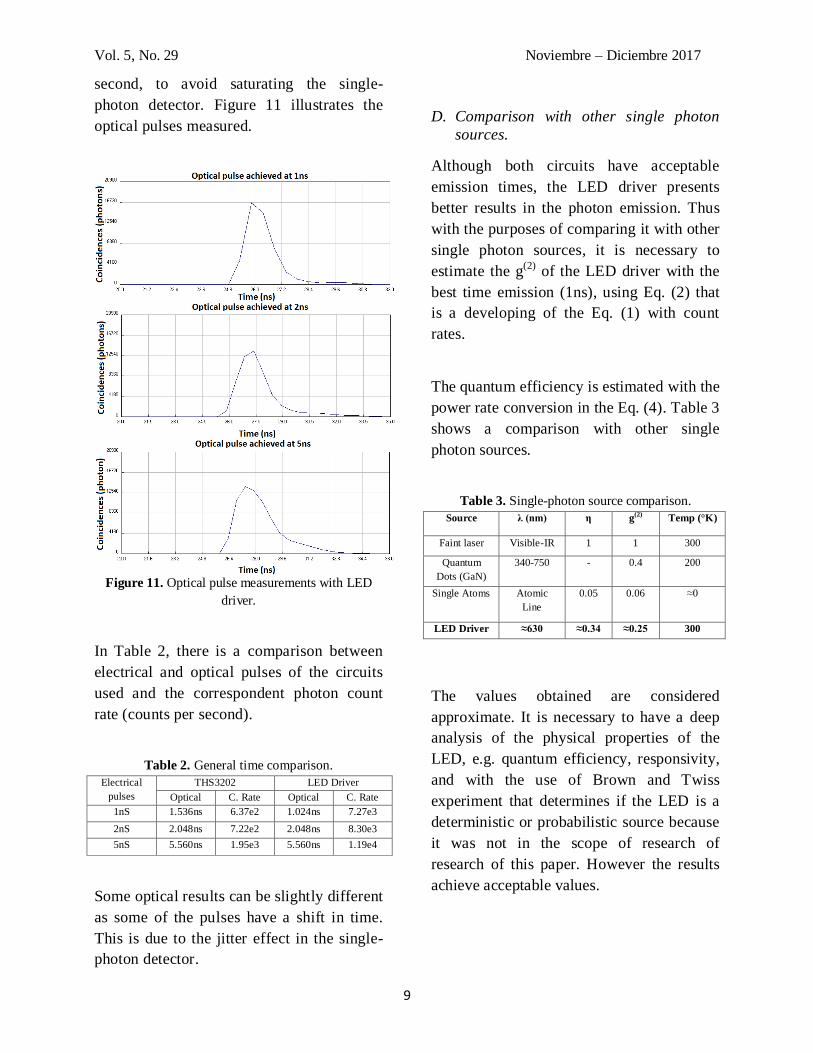
C. Experimental results of optical pulses
The measurements of the optical pulses with
the THS3202 board proved that current
limitation affects the photon emission,
although the optical pulse duration matched
with the electrical pulses. Figure 10
illustrates the optical pulse measurements
with the THS3202 evaluation board.
Figure 10. LED optical pulse measurements with the
THS3203 evaluation board.
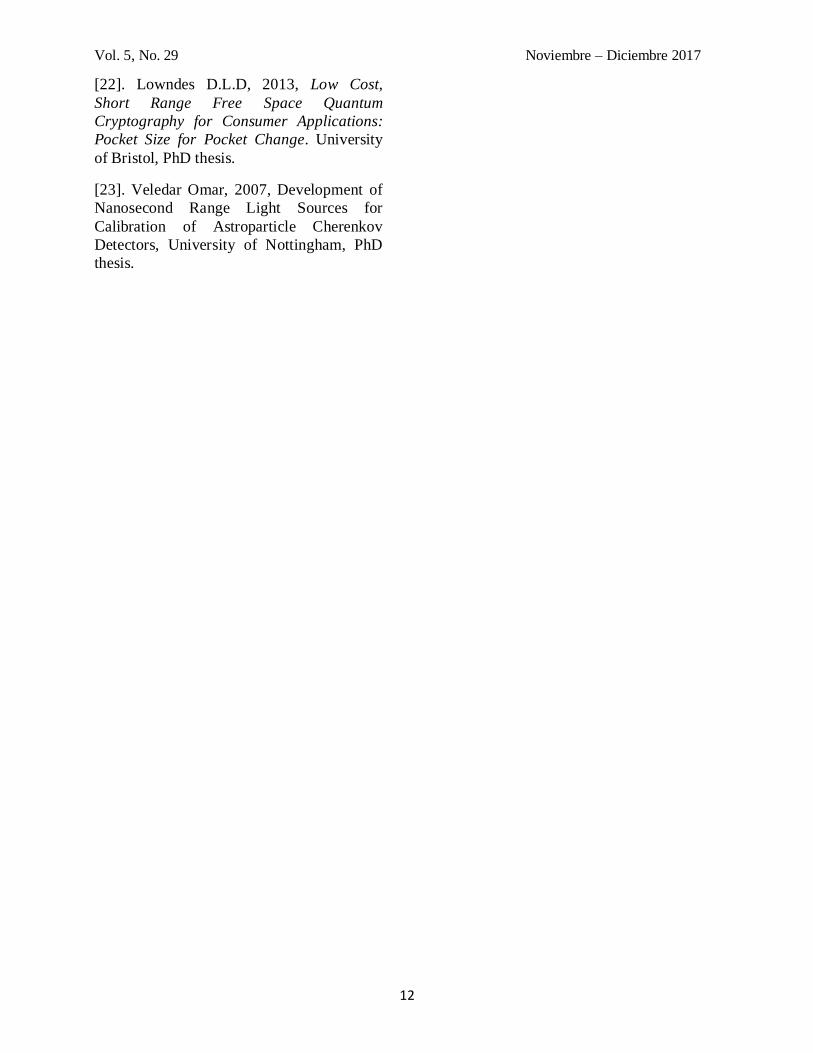
In the measurement of the optical pulses
with the LED driver, it was necessary to
attenuate the light, reducing the current until
it reaches a count rate of 2e4 counts per
Vol. 5, No. 29 Noviembre – Diciembre 2017
9
second, to avoid saturating the single-
photon detector. Figure 11 illustrates the
optical pulses measured.
Figure 11. Optical pulse measurements with LED
driver.
In Table 2, there is a comparison between
electrical and optical pulses of the circuits
used and the correspondent photon count
rate (counts per second).
Table 2. General time comparison.
Electrical
pulses
THS3202 LED Driver
Optical C. Rate Optical C. Rate
1nS 1.536ns 6.37e2 1.024ns 7.27e3
2nS 2.048ns 7.22e2 2.048ns 8.30e3
5nS 5.560ns 1.95e3 5.560ns 1.19e4
Some optical results can be slightly different
as some of the pulses have a shift in time.
This is due to the jitter effect in the single-
photon detector.
D. Comparison with other single photon
sources.
Although both circuits have acceptable
emission times, the LED driver presents
better results in the photon emission. Thus
with the purposes of comparing it with other
single photon sources, it is necessary to
estimate the g(2)
of the LED driver with the
best time emission (1ns), using Eq. (2) that
is a developing of the Eq. (1) with count
rates.
The quantum efficiency is estimated with the
power rate conversion in the Eq. (4). Table 3
shows a comparison with other single
photon sources.
Table 3. Single-photon source comparison.
Source λ (nm) η g(2)
Temp (°K)
Faint laser Visible-IR 1 1 300
Quantum
Dots (GaN)
340-750 - 0.4 200
Single Atoms Atomic
Line
0.05 0.06 ≈0
LED Driver ≈630 ≈0.34 ≈0.25 300
The values obtained are considered
approximate. It is necessary to have a deep
analysis of the physical properties of the
LED, e.g. quantum efficiency, responsivity,
and with the use of Brown and Twiss
experiment that determines if the LED is a
deterministic or probabilistic source because
it was not in the scope of research of
research of this paper. However the results
achieve acceptable values.

Vol. 5, No. 29 Noviembre – Diciembre 2017
10
4. Conclusions
The research and application of quantum
optics has brought a revolutionary
innovation in areas where electronics ruled
during the XX century and quarter of this
century, the traditional computing began
with vacuum valves and afterwards they
were replaced by solid-state semiconductors,
now the quantum photonics start to
complement them [13].
Quantum computing uses solid-state single-
photon emitters [14, 15, 16], thus the
information is encoded and processed in the
quantum states of single-photons, although
the quantum dots are used to generate single-
photons, they construction and working
requirements make them exclusive for
scientific and research purposes [17].
New research has established a Silicon-
Carbide LED that works as a quantum dot
under room conditions [18], however this
device is still expensive. Therefore in this
research, a method was used to replicate a
semi-coherence light using weak light pulses
with a common LED.
The electronic solution proposed to stop the
non-radiative recombination released optical
pulses with similarities to other single
photon sources, hence the reason why the
weak coherence light pulses are suitable to
produce anti-bunching light [19].
The results obtained from the circuits
presented a pulsed light with a low number
of photons, this photon emission is similar to
a single photon source emission and hence,
the LED is an option for possible quantum
applications, especially for quantum
communication [20]. The LED responses on
external trigger demand to emit a low
number of photons but it is necessary to
characterize the light pulses to determine
what type of single photon source
corresponds, deterministic or probabilistic.
Recently the University of Bristol has
analysed the use of the LED in commercial
applications with the Quantum Key
Distribution (QKD) [21] and there are PhD
theses [22, 23] with LED applications that
have been approved.
5. Acknowledgements
This paper is a product of the collaboration
between CONACYT and the University of
Bristol. Thanks to Dr. Xiao Ai for the single-
photon detector supply and advice, and to
Dr. Richard Nock for his advice with
electronic circuits.
6. References
[1]. Brown Hadbury, Twiss R Q, “A test of a
new type of stellar interferometer on
Syrius”, Nature Publishing Group, Vol. 178,
10 November 1956, pp. 1046 – 1048.
[2]. Glauber R J, “Correlation Functions for
Coherent Fields”, Physical Review, Vol. 140
No. 3B, 8 November 1965, pp. B676 –
B682.
[3]. Bell J S, “On Einstein Podolsky and
Rosen Paradox”, Physics, Vol. 1, No. 10, 4
November 1964, pp. 195 – 290.
[4]. Einstein A, Podolsky B, Rosen N, “Can
Quantum Mechanical Description of
Physical Reality Be Considered Complete”,
Physical Review, Vol. 47, 15 May 1935, pp.
777 – 780.
[5]. Clauser John F, “Experimental
distinction between the quantum and
classical field-theoretic predictions for the

Vol. 5, No. 29 Noviembre – Diciembre 2017
11
photoelectric effect”, Physical Review, Vol.
9, No. 4, 15 February 1974, pp. 853 – 860.
[6]. Eisaman M. D, Fan J, Migdall A,
Poluakov V. “Single-photon sources and
detectors”, AIP Review of Scientific
Instruments, Vol 82. 071101, 27 July 2011.
[7]. Kimble H. J, Dagenais M, Mandel L,
“Photon Antibunching in Resonance
Fluorescence”, Physical Review Letters, Vol.
39, No. 691, 12 September 1977.
[8]. Loumis Brahim, Orrit Michel, “Single-
photon sources”, Institute of Physics
Publishing, Vol. 68, 21 April 2005, pp. 1129
– 1176.
[9]. Rarity John G, Wall E. Thomas, Ridley
D. Kevin, Owens C. M. Philippa, Tapster
Paul R. “Single-photon counting for the
1300-1600nm range by use of Peltier-cooled
and passively quenched InGaAs avalanche
photodiodes”, Applied Optics, Vol. 39, No.
36, 20 December 2000, pp. 6746-6753.
[10]. Minot Ethan D, Kelkensberg Freek,
Van Kouwen Maarten, Van Dam Jourden A,
Kouwenhoven Leo P, Zwiller Valery,
Borgstrom Magnus T. Wunnicke Olaf,
Verheijen Marcel A. Bakkers Erik P. A. M.
“Single Quantum Dot Nanowire LEDs”,
Nano Letters, Vol. 7, No 2. 22 December
2006, pp. 367-371.
[11].
http://www.ti.com/lit/ug/slou148/slou148.pd
f
[12]. Tanaka Hiroyuki, Umeda Yohtaro,
Takyu Osamu, High-Speed LED Driver for
visible light communications with Drawing-
Out of Remain Carrier, Radio and Wireless
Symposium IEEE, Jan 2011, pp. 295-298.
[13]. Oxborrow, Mark, and Alastair G.
Sinclair. "Single-photon sources"
Contemporary Physics 46, no. 3 (2005):
173-206.
[14]. O'brien, Jeremy L. "Optical quantum
computing." Science 318, no. 5856 (2007):
1567-1570.
[15]. Aharonovich, Igor, Dirk Englund, and
Milos Toth. "Solid-state single-photon
emitters" Nature Photonics 10, no. 10
(2016): 631-641.
[16]. He, Yu-Ming, et al. "Deterministic
implementation of a bright, on-demand
single-photon source with near-unity
indistinguishability via quantum dot
imaging" Optica 4.7 (2017): 802-808.
[17]. Minot, Ethan D., Freek Kelkensberg,
Maarten Van Kouwen, Jorden A. Van Dam,
Leo P. Kouwenhoven, Valery Zwiller,
Magnus T. Borgström, Olaf Wunnicke,
Marcel A. Verheijen, and Erik PAM
Bakkers. "Single quantum dot nanowire
LEDs" Nano letters 7, no. 2 (2007): 367-
371.
[18]. Fuchs, F., V. A. Soltamov, S. Väth, P.
G. Baranov, E. N. Mokhov, G. V. Astakhov,
and V. Dyakonov. "Silicon carbide light-
emitting diode as a prospective room
temperature source for single photons"
Scientific reports 3 (2013).
[19]. Gottesman, Daniel, H-K. Lo, Norbert
Lutkenhaus, and John Preskill. "Security of
quantum key distribution with imperfect
devices" In Information Theory, 2004. ISIT
2004. Proceedings. International Symposium
on, p. 136. IEEE, 2004.
[20]. Liu, Yang, Teng-Yun Chen, Liu-Jun
Wang, Hao Liang, Guo-Liang Shentu, Jian
Wang, Ke Cui et al. "Experimental
measurement-device-independent quantum
key distribution" Physical review letters 111,
no. 13 (2013): 130502.
[21]. Zhang, P., et al. "Reference-frame-
independent quantum-key-distribution server
with a telecom tether for an on-chip client"
Physical review letters 112.13 (2014):
130501.
Vol. 5, No. 29 Noviembre – Diciembre 2017
12
[22]. Lowndes D.L.D, 2013, Low Cost,
Short Range Free Space Quantum
Cryptography for Consumer Applications:
Pocket Size for Pocket Change. University
of Bristol, PhD thesis.
[23]. Veledar Omar, 2007, Development of
Nanosecond Range Light Sources for
Calibration of Astroparticle Cherenkov
Detectors, University of Nottingham, PhD
thesis.