
Revisiting the Minnesota River Assessment Project of Study ... Revisiting the Minnesota River...
42
An Evaluation of Fish and Invertebrate Community Progress Revisiting the Minnesota River Assessment Project May 2011
Transcript of Revisiting the Minnesota River Assessment Project of Study ... Revisiting the Minnesota River...

An Evaluation of Fish and Invertebrate Community Progress
Revisiting the Minnesota River Assessment Project
May 2011

Minnesota Pollution Control Agency 520 Lafayette Road North | Saint Paul, MN 55155-4194 | www.pca.state.mn.us | 651-296-6300 Toll free 800-657-3864 | TTY 651-282-5332 This report is available in alternative formats upon request, and online at www.pca.state.mn.us
Document number: lrwq-s-2sy11
Legislative Charge
The Minnesota Pollution Control Agency is to spend $348,000 to retest the comprehensive assessment of the biological conditions of the lower Minnesota River and its tributaries within the Lower Minnesota River Major Watershed, as previously assessed from 1976 to 1992 under the Minnesota River Assessment Project (MRAP). The assessment must include the same fish species sampling at the same 116 locations and the same macroinvertebrate sampling at the same 41 locations as the MRAP assessment. The assessment must: (1) include an analysis of the findings; and (2) identify factors that limit aquatic life in the Minnesota River. HF 1231, Article 2, Section 4(a)
Authors Principal Author: Benjamin Lundeen Principal Author: Michael Koschak
Contributors / acknowledgements Name: Glenn Skuta Name: Scott Niemela Name: Dan Helwig Name: Joel Chirhart Name: Mike Feist Name: Larry Gunderson Name: Kristofor Parson
Estimated cost of preparing this report (as required by Minn. Stat. § 3.197)
Total staff time: 926 hrs. $25,949Production/duplication $0Total $25,949 The MPCA is reducing printing and mailing costs by using the Internet to distribute reports and information to a wider audience. Visit our website for more information.
MPCA reports are printed on 100% post-consumer recycled content paper manufactured without chlorine or chlorine derivatives.

Forward Residing in the southwestern portion of Minnesota, the Minnesota River Basin encompasses parts or all of 38 counties and contains 13 major watersheds, which drain nearly 20 percent of Minnesota (Figure 1) (Musser et al. 2009). The Minnesota River originates at Big Stone Lake (South Dakota) where it flows southeast to Mankato and abruptly turns to the northeast before joining with the Mississippi River near Fort Snelling, Minnesota. At 335 miles long, the Minnesota River and its accompanying watersheds drain approximately 16,770 square miles (approximately 10 million acres) (Musser et al. 2009).
Historically, the Minnesota River Basin was dominated by native prairie grassland (~78 percent, 18 million acres); however, today less than 200,000 acres exist in the region primarily due to the conversion of prairies for agricultural production (Musser et al. 2009). Currently, agriculture dominates the landscape where greater than 78 percent of the surrounding landuse is agriculture while the other 22 percent is made up of urban, forest, and grassland areas (Figure 1). Furthermore, the Minnesota River Basin was historically scattered with prairie wetlands, due to the advent of hydrologic modifications (i.e. tile drainage) nearly 90 percent of these wetlands have disappeared, and are now home to a majority of Minnesota’s largest corn and soybean farms (Musser et al. 2009). While several improvements to the landscape have been made since the original Minnesota River Assessment Project (MRAP) (i.e. implementation of conservation easements and best management practices), several environmental issues persist within the Minnesota River Basin (Feist 2002 and Musser et al. 2009).
Human influence throughout much of the Minnesota River Basin has come in many forms: chemical pollutants from municipal and industrial point source discharges, agricultural runoff of sediment, nutrients and pesticides, hydrologic alteration from stream channelization, dams and artificial drainage, and habitat alteration from agricultural, urban, and residential encroachment (Feist 2002; Musser et al. 2009).
In 1992, Minnesota Governor Arne Carlson declared the Minnesota River “needs tremendous improvement,” so he issued a challenge to make the river fishable and swimmable by 2002. In response to this declaration, a cleanup program was launched to meet this goal. Since Carlson’s remark, groups and programs such as the Minnesota River Citizen Advisory Committee (1992), the Minnesota River Joint Powers Board (1995), and the Conservation Reserve Enhancement Program (CREP) (1998) were formed (Minnesota River Basin Data Center 2011).
Beginning in 1989 and continuing through 1993, MRAP was designed to assess the condition of the Minnesota River Basin and to provide more definitive information regarding impairment of fish and macroinvertebrate communities throughout the basin. The project created a widespread monitoring network within the basin, which was led by the Minnesota Pollution Control Agency (MPCA) with assistance from federal, state, and local government agencies, as well as university involvement (Bailey et al. 1993, Zischke et al. 1994).
Based on the results of the previous studies, biological communities were determined to be severely to moderately impaired (Bailey et al. 1993, Zischke et al. 1994). For fish communities, the degraded conditions were attributed to lack of instream habitat and cover, which was a result of stream channelization and excess sedimentation (Bailey et al. 1993). Invertebrate communities were determined to be degraded throughout much of the basin; however no explanation for the status of communities was provided as this was a baseline effort (Zischke et al. 1994).
In 2009-2010, the biological portion of this project was replicated to determine the current biological conditions of the Minnesota River Basin and measure the success of restoration efforts. In addition, sites sampled in 2001 as part of a MRAP progress evaluation by the MPCA were replicated using current methods and protocols. This project was led by the South Biological Monitoring Unit of the MPCA with funding provided by the Minnesota Legislature.


Contents
Purpose of Study ..................................................................................................................... 1 Study Sites and Site Selection .................................................................................................. 1 Methods .................................................................................................................................. 2
Fish sampling .......................................................................................................................................... 2 Benthic macroinvertebrate collection methods ....................................................................................... 2 Habitat ................................................................................................................................................... 4 Water chemistry ..................................................................................................................................... 5 Site and data evaluation ......................................................................................................................... 5 Tolerance metrics ................................................................................................................................... 7 Community metrics ................................................................................................................................. 8
Data Analysis ........................................................................................................................... 8 Twenty Year Basin Study Results ............................................................................................. 9
Fish communities ..................................................................................................................................... 9 Macroinvertebrate communities ........................................................................................................... 13
Nine Year Basin Study Results ............................................................................................... 19 2001 vs. 2010 MPCA protocol ................................................................................................................ 19 Index of biological integrity results ....................................................................................................... 20 Fish community .................................................................................................................................... 20 Macroinvertebrate community ............................................................................................................. 21
Minnesota Stream Habitat Assessment ................................................................................. 23 Discussion and Conclusions ................................................................................................... 23 References............................................................................................................................. 24 Appendix ............................................................................................................................... 26

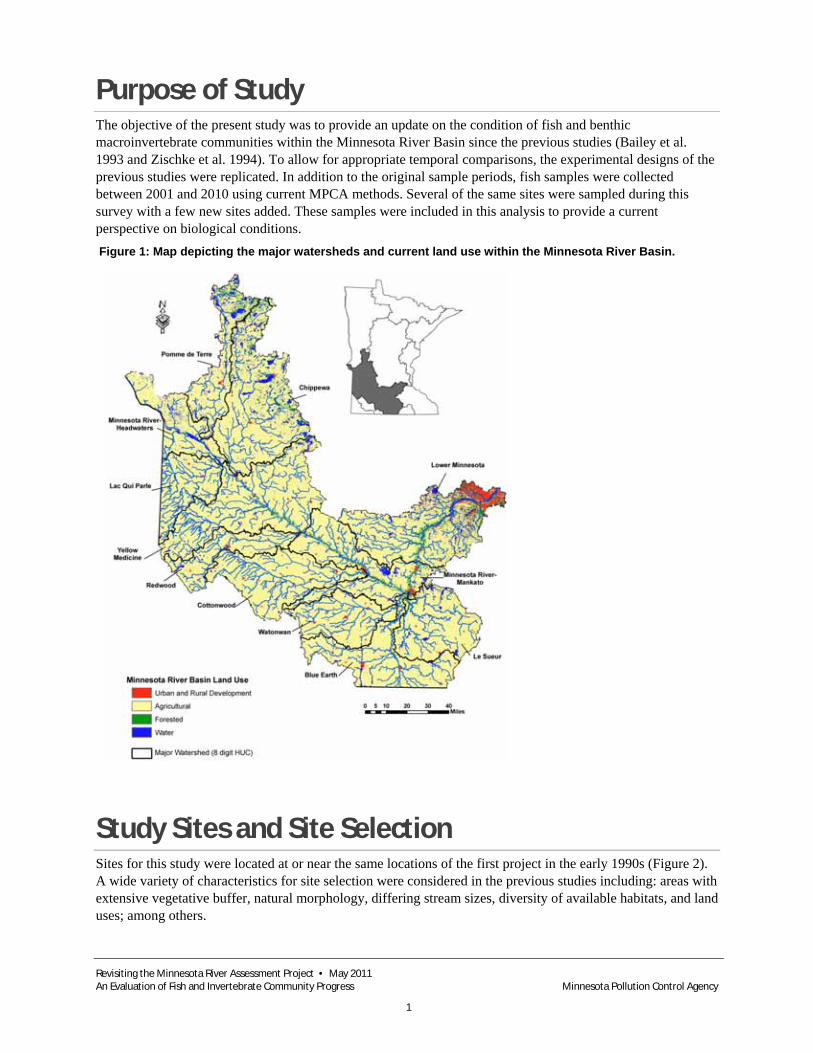
Purpose of Study The objective of the present study was to provide an update on the condition of fish and benthic macroinvertebrate communities within the Minnesota River Basin since the previous studies (Bailey et al. 1993 and Zischke et al. 1994). To allow for appropriate temporal comparisons, the experimental designs of the previous studies were replicated. In addition to the original sample periods, fish samples were collected between 2001 and 2010 using current MPCA methods. Several of the same sites were sampled during this survey with a few new sites added. These samples were included in this analysis to provide a current perspective on biological conditions. Figure 1: Map depicting the major watersheds and current land use within the Minnesota River Basin.
Study Sites and Site Selection Sites for this study were located at or near the same locations of the first project in the early 1990s (Figure 2). A wide variety of characteristics for site selection were considered in the previous studies including: areas with extensive vegetative buffer, natural morphology, differing stream sizes, diversity of available habitats, and land uses; among others.
Revisiting the Minnesota River Assessment Project • May 2011 An Evaluation of Fish and Invertebrate Community Progress Minnesota Pollution Control Agency
1

Revisiting the Minnesota River Assessment Project • May 2011 An Evaluation of Fish and Invertebrate Community Progress Minnesota Pollution Control Agency
2
One hundred fourteen of the 117 original sites were re-sampled to assess the fish community condition (Figure 2) and another 33 of the original 41 sites were re-sampled to determine benthic macroinvertebrate conditions (Figure 3). In addition, 30 of 31 sites sampled in 2001 as part of a MRAP progress evaluation were re-sampled for fish community and 15 of those 31 sites were sampled for benthic macroinvertebrates.
Methods
Fish sampling To allow for a comparison between the original MRAP survey and this new survey, we attempted to duplicate the fish sampling methods. Sampling took place during July-August in 2009 and June-September in 2010 during daylight hours in normal-low flow conditions.
Electrofishing was the sole method used for collecting fish. Using an adjustable, square wave, pulsed direct current (DC), crews were able to effectively capture fish in a safe and efficient manner from all available habitat types. Four different gear types were used and chosen according to the depth and width of the stream (backpack shocker, stream shocker, mini-boom shocker, and boom shocker). Due to issues such as accessibility, changes in stream size, and availability of equipment, some sites were not sampled with the same gear chosen during the first visit. However, the distance fished, and time fished remained relatively the same in the two projects.
All fish captured were identified to species and counted. For each species, the minimum and maximum lengths were recorded in millimeters. The total wet weight of each species was also recorded to the nearest 0.5 gram. Each fish was also examined for external anomalies. Voucher specimens were collected for each species at sites where a fish’s identity was questionable. Large specimens where taxonomic identification was common knowledge were not kept. Voucher specimens were preserved and sent to the Minnesota Bell Museum of Natural History for verification.
For the subset of 31 sites that were sampled in both 2001 and 2010, the current MPCA fish and invert sampling protocols were used (Brasuhn 2009).
Fish communities were evaluated using an index of biological integrity (IBI) that was initially developed during MRAP and was subsequently revised to include all warmwater streams in Minnesota. The IBI provides a numerical score to describe how the biological community, in this case the fish community, has changed from a reference or least impacted condition (Bailey et al. 1993).
Benthic macroinvertebrate collection methods To allow for direct comparison with the original study, benthic macroinvertebrate collection methods were based on methods in Zischke et al. (1994). Six Hester-Dendy samplers were placed in the same approximate location at 33 of the 41 original MRAP locations (Figure 3). It should be noted that not all original locations were revisited due to a myriad of reasons: vandalism (removal of sampling apparatus from the site), dry streambeds, and inappropriate habitat type. Hester-Dendy samplers were allowed to colonize for six weeks prior to retrieval. Upon retrieval Hester-Dendy samples were preserved in ~85 percent ethanol and shipped to Rithron Inc. (Missoula, Montana USA) for processing and benthic macroinvertebrate identification. To maintain consistency with current MPCA benthic macroinvertebrate sampling protocols and the original study, Hester-Dendy samplers were deployed in August and collected in September. It is important to note that in the original MRAP study, Hester-Dendy samplers were deployed from June through August and benthic macroinvertebrate collections were made from July through October. However, the start date of the current project did not allow for the collection of benthic macroinvertebrates during the early summer months.

Therefore, the present analysis was constrained to samples collected during the months of September and early October for temporal consistency. Benthic macroinvertebrate communities’ change as a result of temperature and daylight periods, and therefore, samples collected during the summer months (June, July, and August) may not provide consistent comparisons with the present study. Furthermore, the MPCA has established index periods for collecting benthic macroinvertebrates based upon known life history characteristics for many of the species that occur within Minnesota (Chirhart 2004).
Between 2001 and 2010 the MPCA sampled benthic macroinvertebrates from 15 locations within the Minnesota River Basin using a qualitative multi-habitat approach that is currently used by MPCA to conduct benthic macroinvertebrate surveys. This methodology utilizes D-frame dip-nets (500 µm mesh) to collect composite benthic macroinvertebrate samples from dominant habitats observed within a given reach. These data were used to generate a benthic macroinvertebrate IBI score. These data provide an additional comparison similar to that of the original MRAP study using the current MPCA sampling protocols for benthic macroinvertebrates.
Figure 2: Map depicting the original Minnesota River Assessment Project (MRAP) fish sampling locations within the Minnesota River Basin.
Revisiting the Minnesota River Assessment Project • May 2011 An Evaluation of Fish and Invertebrate Community Progress Minnesota Pollution Control Agency
3

Figure 3: Map depicting the revisited Hester-Dendy locations within the Minnesota River Basin.
Habitat Each site was also evaluated qualitatively for habitat condition. The habitat survey was accomplished by completing the Qualitative Habitat Evaluation Index, (QHEI). The QHEI rates the condition of the habitat in terms of surrounding land use, riparian vegetation, shade, bank condition, channel morphology, substrate, instream cover, water depth, and channel stability. To complete the QHEI, the stream was walked and measurements of stream width, depth, and length by channel type were recorded qualitatively; as well as observations of specific habitat attributes. At some sites, it was difficult to thoroughly assess the instream channel, substrate, and cover attributes. For these sites, which were the majority of the boom shocking sites, a QHEI score was not determined during the original MRAP sampling (Bailey et al. 1993). However, during the most recent sampling QHEI scores were determined for all sites.
In addition to a habitat evaluation, field water chemistry was also collected at each site using a Hach meter (model HQ40d). The following parameters were measured and recorded: dissolved oxygen, pH, conductivity (µS/cm), transparency, water temperature (ºC), and air temperature (ºC).
Revisiting the Minnesota River Assessment Project • May 2011 An Evaluation of Fish and Invertebrate Community Progress Minnesota Pollution Control Agency
4

Revisiting the Minnesota River Assessment Project • May 2011 An Evaluation of Fish and Invertebrate Community Progress Minnesota Pollution Control Agency
5
Water chemistry Field water chemistry and grab samples for lab analysis were collected for the Minnesota River Assessment Project (MRAP) subset study (2001-2010). However, due to the limited sample size and insufficient characterization of the previous MRAP sites, the data were not appropriate for inclusion in the present report. For a current perspective on water quality changes within the Minnesota River Basin please refer to Musser et al. (2009).
Site and data evaluation Recent improvements in sampling techniques and data analyses have led to a better and more accurate understanding of fish and invertebrate community assemblages. Using these newer methods, the MPCA developed new statewide IBIs for both fish and benthic macroinvertebrates. These IBIs were then used to score all fish and benthic macroinvertebrate sampling sites for both the MRAP comparison study (1990-92 vs. 2009-10) and the study of the subsets of MRAP sites (2001 vs. 2010).
Invertebrate trend analysis During the previous MRAP, a total of 41 sample locations were visited between 1989 and 1992 (Zischke et al. 1994). In 2009, 33 of the previous MRAP locations were revisited for benthic macroinvertebrate collection (Figure 3). Because sites visited between 1989 and 1990 were statistically significantly larger (median watershed area 3,091 mi.2) than those sites visited between 1991 and 1992 (median watershed area 11 mi.2) (Independent two sample t-test, p<0.05), the data were separated into two groups based on watershed drainage area. Watershed area often influences richness and diversity of many benthic macroinvertebrate communities, due to food availability, hydrologic variability, and available habitat. Therefore, smaller streams were separated from the larger streams in order to determine changes in community structure due to differences in ecological condition.
Furthermore, Hester-Dendy data from 1989 were removed from the analysis due to drought conditions in 1989, which may provide misinterpretation during trend analysis (Figure 4). Drought is a substantial abiotic factor which regulates many lotic ecosystems (see references in Resh et al. 1988); therefore removal of these data was critical to maintain congruency in data analysis. Also, samples from the Blue Earth River and Le Sueur River were omitted from data analysis because there were no comparisons between 1990 and 2009 for these locations. Finally, data from 1991 were removed from analysis due to small sample size (n = 6). Because both parametric paired t-tests and non-parametric Wilcoxon sign-rank tests are constrained to pairwise comparisons, a small sample would have limited the robustness of the analysis (Quinn and Keough 2002).
Since the previous study, there have been advancements in benthic macroinvertebrate identification techniques, and because of this, several genera and species identified during the current study were not identified during the previous study (Zischke et al. 1994). In order to maintain appropriate comparisons, the current dataset was constrained to the taxonomic resolution of the previous study (Zischke et al. 1994). In some cases this meant conducting comparisons based on broader levels of taxonomic proficiency (i.e. order and family). Secondly, raw data from the previous study were not available and comparisons between years were often based on averaged data for a given site and organism. Due to this constraint, samples were pooled to allow for comparisons between years.

Figure 4: Bar graph depicts the mean (+ 2 S.E.) drainage area (mile2) for sites sampled within the Minnesota River Basin during a given year. Years with different letters indicate a statistically significant difference (independent two sample t-test, p<0.05).
Revisiting the Minnesota River Assessment Project • May 2011 An Evaluation of Fish and Invertebrate Community Progress Minnesota Pollution Control Agency
6
1990 1992Original Study Year
10
100
1,000
10,000
Dra
inag
e A
rea
(Sq.
Mi.)
a
b
Figure 5: Mean summer (July-September) monthly discharge (+ S.E.) for eight USGS gauging stations within the Minnesota River Basin.
0
50
100
150
200
250
300
350
1989 1990 2009
Ave
rage
Mon
thly
Sum
mer
Dis
char
ge
(C.F
.S.)

Revisiting the Minnesota River Assessment Project • May 2011 An Evaluation of Fish and Invertebrate Community Progress Minnesota Pollution Control Agency
7
Macroinvertebrate metrics Many of the metrics used in the previous study were recalculated in order to provide direct comparisons with the findings from the previous study (Zischke et al. 1994). However, because biological monitoring is not a static process, several metrics have been added or altered based on the evolution of biological monitoring since the previous study (Carter et al. 2006). The paragraphs below contain a list of the metrics utilized for determining ecological condition.
Tolerance metrics
Macroinvertebrate biotic index
Many benthic macroinvertebrates found in Minnesota have an assigned tolerance value based upon the organism’s response to a measure of stress (Hilsenhoff 1987; Lenat 1988; Barbour et al. 1999; Carter et al. 2006; Merritt et al. 2008). Tolerance values range from 0 (very intolerant) to 10 (most tolerant). In general, tolerance values are assigned at specific taxonomic levels, and in the present study we assigned tolerance values based on the lowest taxonomic level of identification. The macroinvertebrate biotic index (MBI) represents a score from 0 to 10, which is based on the average tolerance score within a given community, weighted by abundance (see equation below). The MBI score may be used to interpret the ecological condition at a given site (Table 1). Ziscke et al. (1994) previously reported that an MBI score of 2.5 represented non-impacted streams while a site with an MBI score of 3.5 or greater represented an impacted stream. It is important to note that many of the tolerance values used in the previous report (Zischke et al. 1994) were updated in this study based on the Midwestern classification of benthic macroinvertebrate tolerance values (Barbour et al. 1999). Therefore, the results of the previous benthic macroinvertebrate community assessments have been updated to reflect the inclusion of the current tolerance values (Table 1).
/
Where ni represents the number of individuals and ti represents the tolerance value of the ith species, respectively, and s = the number of genera used for analysis (adapted from Hilsenhoff 1988 and Carter et al. 2006). Table 1: Ecological condition based on the benthic macroinvertebrate biotic index values (adapted from Hilsenhoff 1988 and Carter et al. 2006).
Macroinvertebrate Biotic Index Ecological Condition
0.00 - 3.75 Excellent
3.76 - 4.25 Very good
4.26 - 5.00 Good
5.01 - 5.75 Fair
5.76 - 6.50 Fairly poor
6.51 – 7.25 Poor
7.26 – 10.00 Very poor

Revisiting the Minnesota River Assessment Project • May 2011 An Evaluation of Fish and Invertebrate Community Progress Minnesota Pollution Control Agency
8
Percent tolerant taxa The relative abundance of tolerant taxa (tolerance value of 5 to10) provides a measure of the proportion of pollution tolerant species within a given community. Tolerant taxa were designated as those individuals with a tolerance value of 5 or greater. In many streams, the relative abundance of tolerant organisms provides a measure of degradation within a given stream. Tolerant taxa are commonly found at most sites; however they tend to dominate at sites with degraded conditions (Fore et al. 1996). These sites tend to be characteristic of areas with low dissolved oxygen, heavy siltation, and high turbidity.
Percent intolerant taxa
The relative abundance of intolerant organisms provides a measure of the sensitive species within a given community. The metric is based on the abundance of benthic macroinvertebrates with tolerance values ranging from zero to two relative to the abundance of the community at a given site.
Community metrics Community metrics provide a description of the benthic macroinvertebrate community expressed as the relative abundance of a given taxonomic group or combination of taxonomic groups. The metrics may be used to develop relationships with many abiotic and biotic factors affecting macroinvertebrate communities. The paragraphs below provide a list of macroinvertebrate community metrics used for past and present comparisons.
Percent Ephemeroptera, Plecoptera, and Trichoptera (EPT) Many species of mayflies (Ephemeroptera), stoneflies (Plecoptera), and caddisflies (Trichoptera) are known to be sensitive to many different environmental stressors (fluctuations in flow and temperature) as well as pollution (inorganic elements, pesticides, and emerging contaminants). Many of the individuals that make up these orders require moderate to high amounts of dissolved oxygen and are usually found in flowing waters. These organisms occupy many different components of the food chain and provide a sensitive indication of the overall condition of a given site.
Percent other Diptera and non-insect taxa The relative abundance of non-tanytarsini Diptera and non-insect taxa provides a measure of adverse conditions, as these organisms are considered to be pollution tolerant (Zischke et al. 1994).
Macroinvertebrate index of biological integrity The history of IBI development and use at the MPCA has been described by Chirhart (2003). In general, an IBI utilizes a series of metrics that are established based on biological responses to a measure of anthropogenic disturbance. The MPCA uses several statistically stringent criteria during the metric selection process to achieve an unbiased index. The end result is an IBI that allows for the interpretation of biological data to understand how biological communities respond to environmental stressors. Whitter et al. (2007) provides an overview of the statistically stringent criteria used by the MPCA.
Data Analysis In order to compare results over the 10 and 20 year time periods, several statistical analyses were employed to determine changes in both fish and benthic macroinvertebrate communities. Paired t-tests were used to compare mean metric scores between time periods when data met normality assumptions (normal distribution and homogeneity of variance) or could be transformed (i.e. log10, square root) in order to meet the

Revisiting the Minnesota River Assessment Project • May 2011 An Evaluation of Fish and Invertebrate Community Progress Minnesota Pollution Control Agency
9
assumptions. When normality assumptions were not met, a Wilcoxon sign-rank test was used for non-parametric comparisons between years. Secondly, a simple linear regression and Spearman rank correlation was used to interpret the relationship between variables (i.e. BMP, CREP, and landuse) and biological metrics. All data analyses and graphs were developed using SYSTAT version 13.1 statistical software.
Twenty Year Basin Study Results
Fish communities
1990-92 vs 2009-2010 MRAP protocol Although 114 of the original 117 MRAP sites were sampled between 2009 and 2010 (Figure 7), 108 were used for analysis (See Appendix 1). Five of these sites were determined to be coldwater influenced. Currently, the MPCA does not have an IBI to determine biological condition within coldwater sites. Therefore, the 5 sites were removed from the proceeding analysis. The remaining site was not used since it was sampled during above normal flow conditions.
Overall, a statistically significant improvement in mean IBI score of 6.34 points was observed between the two time periods (paired t-test or Wilcoxon sign-rank test, p<0.05) (Figure 6). Also, QHEI scores increased by an average of 6.58 points, which was statistically significant (paired t-test or Wilcoxon sign-rank test, p<0.05).
Results comparing these two time periods for fish community assemblage (Figure 6) and instream habitat (See Appendix 2) are broken down into the three classifications used to describe streams in southern Minnesota.
Class 1 - southern rivers (drainage area > 300 mi2) The largest rivers involved in the MRAP sampling showed an improvement in IBI at 17 of the 33 sites, while a decline was shown at 15 sites and 1 site showed no change (See Appendix 1). The average improvement in IBI score was just above 12 points with the Minnesota River near Judson leading the way with a 30 point increase in IBI score. The average decline in IBI score was just over 11 points. Overall, Class 1 sites saw an average improvement of 1.24 points which was not enough to be considered statistically significant (Figure 6).
Qualitative Habitat Evaluation Index scores improved between the two time periods. A statistically significant average increase of 9 points was observed (paired t-test or Wilcoxon sign-rank test, p<0.05) (See Appendix 2).
Class 2 - southern streams (drainage area >30 mi2 and < 300mi2) Forty-one sites were classified as southern streams. Of these streams, 25 showed an improvement in fish IBI score (See Appendix 1), with an average increase in IBI score of 10.08 points. However, 15 sites observed a decrease in fish IBI score with an average decrease of 6.63 points. One site showed neither a gain nor loss in fish community health. Overall, Class 2 sites showed a nearly 3.72 point average increase in fish IBI score, which was statistically significant (paired t-test or Wilcoxon sign-rank test, p<0.05) (Figure 6).
Qualitative Habitat Evaluation Index scores for this class showed a modest improvement between the two time periods. On average, a 7.4 point increase was seen at these sites. This improvement was statistically significant (paired t-test or Wilcoxon sign-rank test, p<0.05) (See Appendix 2).
Class 3 - southern headwaters (drainage area <30 mi2) The most improvements in IBI score were made at headwater sites. Nearly two-thirds of sites in this classification showed an increase in IBI score (See Appendix 1). Sites that increased raised their score an average of 19.79 points. County Ditch 26 in the Blue Earth River watershed had the largest increase in IBI score (53 point improvement) (See Appendix 2). The average decrease in IBI score was 11.14 points. Three sites within this class showed no decline or improvement over the 20 year difference between sampling. Altogether, Class 3 sites observed an average

increase in fish IBI score of 14.63, which was statistically significant (paired t-test or Wilcoxon sign-rank test, p<0.05) (Figure 6). Class 3 sites showed the largest increase in QHEI scores. These sites had an average increase of over 15 points per site, which was statistically significant (paired t-test or Wilcoxon sign-rank test, p<0.05) (See Appendix 2). Figure 6: Bar graphs depicting 1990-92 and 2009-10 mean IBI score (+ S.E.). A) IBI score separated by fish class (Southern Rivers n=33; Southern Streams n=41; Southern Headwaters n=32); B) IBI score for all fish classes combined. Years with similar letters do not indicate a statistically significantly change in IBI scores (paired t-test or Wilcoxon sign-rank test, p<0.05).
0
10
20
30
40
50
60
70
80
IBI S
core
Revisiting the Minnesota River Assessment Project • May 2011 An Evaluation of Fish and Invertebrate Community Progress Minnesota Pollution Control Agency
10
2009-10 IBI1990-92 IBI
Southe
rn Rive
rs
Southe
rn Stre
ams
Southe
rn Hea
dwate
rs0
10
20
30
40
50
60
70
80
IBI S
core
2009-10 IBI1990-92 IBIA) B)
b a a a
b b a
a
All Classes Combined

Figure 7: Spatial interpretation of the 20 year change in fish IBI sites resampled during the MRAP study using MRAP sampling protocols. Change, both positive and negative was based on a 10 point difference in fish IBI score.
Revisiting the Minnesota River Assessment Project • May 2011 An Evaluation of Fish and Invertebrate Community Progress Minnesota Pollution Control Agency
11

Fish species of interest While there has only been a minimal overall increase in fish IBI scores, an increase in traditionally large river sensitive species was noted. Blue sucker and black buffalo were two species that were not observed during the first sampling of MRAP, but were captured during the latest sampling. Shovelnose sturgeon collections increased from 11 individuals in the early 1990s to 19 during 2009-10. Throughout the basin observations of smallmouth bass increased from 24 individuals to 43 and walleye from 141 to 153. The return of and increased occurrences of these fish species is an encouraging sign for the Minnesota River since these species typically succeed in waters lacking fine sediments (Figure 8).
Figure 8: Clockwise from upper left: Blue Sucker from Minnesota River (90MN070), Shovelnose Sturgeon from Minnesota River (90MN070), Black Buffalo from Minnesota River (90MN070), and Smallmouth Bass from Minnesota River (90MN018).
This study also showed an increase in intolerant fish species. These species are more sensitive to degraded water quality conditions. Intolerant species showing an increase in population over the 20 years between MRAP projects include blacknose shiners, logperch, and mimic shiners. However, there was a significant decline in greater redhorse numbers between the two projects. Intolerant species found during the studies are pictured below in Figure 9.
Figure 9: Clockwise from upper left: Blacknose Shiner, Logperch, Mimic Shiner, and Greater Redhorse. (Photos courtesy of Konrad P. Schmidt).
Revisiting the Minnesota River Assessment Project • May 2011 An Evaluation of Fish and Invertebrate Community Progress Minnesota Pollution Control Agency
12

Revisiting the Minnesota River Assessment Project • May 2011 An Evaluation of Fish and Invertebrate Community Progress Minnesota Pollution Control Agency
13
Macroinvertebrate communities
Large river trends (1990 to 2009) The dominant taxa collected from large river sites during the 2009 survey, in order of dominance were: Glyptotendipes (Diptera), Hydropsyche (Trichoptera), Tricorythodes (Ephemeroptera), Cheumatopsyche (Trichoptera), Potamyia (Trichoptera), and Oligochaeta. These taxa are similar to those of the 1990 survey in which the dominant taxa collected, in order of dominance were: Hydropsyche (Trichoptera), Glyptotendipes (Diptera), and Gammarus (Amphipoda) (Zischke et al. 1994). Dominant taxa were determined using the 95th percentile of total taxa collected for a given time period. This statistic was not constrained to taxa similar to both time periods. Of the dominant taxa collected from both years, most represent taxa considered to be ubiquitous within large warm water rivers. In addition, it has been demonstrated that many of these taxa are tolerant to environmental stress (references in Merritt et al. 2008).
There was no significant difference in tolerance measures between the two time periods; however a general increase in tolerant taxa and decline of intolerant taxa was observed in 2009 (Figure 10). Conversely, community metric comparisons indicated a statistically significant difference between the two time periods (Figures 11) (Wilcoxon sign-rank test, p<0.05). Specifically, the change represents a decline in sensitive communities and an increase in communities tolerant of environmental stress. Nine of the 16 sites in this class observed modest improvement to minimal change in MBI score, while 7 sites observed an increase in MBI score (i.e. decrease in quality) over the 20 year periods (Figure 12 and Appendix 3). These data suggest approximately half of the previous sites sampled have observed modest improvement to little change, while the other sites have shown further degradation.
There was no correlation with best management practice (BMPs) as a percent of the watershed (per mile2) or BMP implementation since 1995 and changes in metric values or current metric values over the 20 year period (Spearman rank correlation, p < 0.05). Moreover, further analyses revealed no correlations with changes in CREP or landuse and changes in metric values or current metric values (Spearman rank correlation, p < 0.05).

Figure 10: Bar graphs depicting the mean (+ S.E.) of tolerance metrics for large rivers between 1990 and 2009. A) MBI (n=16); B) percent tolerant taxa (n=16); C) percent very tolerant taxa (n=16); D) percent Intolerant Taxa (n=16). Years with differing letters indicate a statistically significant change (Wilcoxon sign-rank test, p<0.05).
Revisiting the Minnesota River Assessment Project • May 2011 An Evaluation of Fish and Invertebrate Community Progress Minnesota Pollution Control Agency
14
Figure 11: Bar graphs depicting the mean (+ S.E.) of community metrics for large rivers between 1990 and 2009. A) Comparison of percent Ephemeroptera, Plecoptera, and Trichoptera (EPT) taxa (n=16); B) Comparison of percent Diptera and Non-insect taxa (n=16). Years with differing letters indicate a statistically significant change (Wilcoxon sign-rank test, p < 0.05).
1990 2009Year Sampled
3
4
5
6
7
8
9M
BI
1990 2009Year Sampled
0
10
20
30
40
50
60
70
80
90
100
Perc
ent (
%) T
oler
ant
1990 2009Year Sampled
0
10
20
30
40
50
60
70
80
Perc
ent (
%) V
ery
Tole
rant
1990 20090
10
20
30
40
50Pe
rcen
t (%
) Int
oler
ant
Year Sampled
1990 2009Year Sampled
0
10
20
30
40
50
60
70
80
90
Perc
ent (
%) E
PT
100
1990 2009Year Sam
0
10
20
30
40
50
60
70
80
90
100
Perc
ent (
%) D
ipte
ra &
Non
-inse
cts
b
a
B)
b
a
A)
a
a
a a
a
a
A) B)
C)
a
a
D)
pled

Figure 12: Box and whisker plot depicting the median (center line) and overall range (whisker boundaries) of change in MBI scores over the past 20 years, as well as the associated rating of ecological quality for large streams sampled in the Minnesota River Basin. An increase in MBI score indicates an increase in tolerant taxa, whereas a decrease in MBI score indicates a decrease in tolerant taxa.
Revisiting the Minnesota River Assessment Project • May 2011 An Evaluation of Fish and Invertebrate Community Progress Minnesota Pollution Control Agency
15
-2
-1
0
1
2
3
4
5
6
Cha
nge
in M
BI S
core
n=9
n=7
Improved DegradedEcological Quality
Stream trends (1992 to 2009) During the 2009 survey, the dominant taxa within streams of the Minnesota River Basin, in order of dominance were: Glyptotendipes (Diptera), Stenelmis (Coleoptera), Physa (Gastropoda), Oligochaeta (Annelida), and Parakiefferiella (Diptera). Many of the dominant species are known to be ubiquitous throughout lentic and lotic ecosystems, and indicate a stressed ecosystem as many of these genera are tolerant of environmental stress (Barbour et al. 1999). Conversely, the dominant taxa observed in streams during the previous study (1992), in order of dominance, were: Hydropyche (Trichoptera), Stenacron (Ephemeroptera), Stenonema (Ephemeroptera), Hyallela (Ephemeroptera), and Heptagenia (Ephmeroptera). Although many of these dominant taxa represent EPT taxa, the specific genera that contributed to the metric have been shown to be tolerant of environmental stress (references in Merritt et al. 2008 and Barbour et al. 1999).
Both tolerance and community metric comparisons suggest that a majority of the sites sampled in small streams have degraded since the previous study (Figures 13 and 14). Twelve of the 16 sites (75 percent) represent channelized streams. Therefore, the degraded biological condition is not surprising given the stressors associated with channelized streams (i.e. lack of instream habitat, hydrologic modifications, continued maintenance of stream channel, and lack of riparian buffers) (Delong and Brusven 1998, Dovciak and Perry 2002, Lau et al. 2006). Moreover, three of the sites observed modest improvement or minimal change and 13 sites showed an increased degraded condition based on changes in MBI scores (Figure 15 and Appendix 3). No observed spatial patterns of MBI change were apparent following spatial interpretation (Figure 16).
There was no correlation with BMP implementation since 1995 and change in MBI score over the last 20 years for small rivers (Spearman rank correlation, p < 0.05). Moreover, upon further analysis, there was no correlation with the change in CREP as a percent of the watershed (per mile2) and changes in landuse with the 20 year changes in metrics or current metric scores; for all metrics respectively (Spearman rank correlation, p < 0.05).

Figure 13: Bar graphs depicting the mean + standard error of tolerance metrics for small rivers between 1992 and 2009. A) MBI (n=16); B) percent tolerant taxa (n=16); C) percent very tolerant taxa (n=16); D) percent intolerant taxa (n=16). Years with differing letters indicate a statistically significant change (Wilcoxon sign-rank test, p<0.05).
Revisiting the Minnesota River Assessment Project • May 2011 An Evaluation of Fish and Invertebrate Community Progress Minnesota Pollution Control Agency
16
Figure 14: Bar graphs depicting the mean (+ S.E.) of community metrics for small rivers between 1992 and 2009. A) Comparison of percent Ephemeroptera, Plecoptera, and Trichoptera (EPT) taxa (n=16); B) Comparison of percent Diptera and Non-insect taxa (n=16). Years with differing letters indicate a statistically significant change (Wilcoxon sign-rank test, p < 0.05).
1992 2009Year Sampled
3
4
5
6
7
8
9
10M
BI
20
30
40
50
60
70
80
90
100
110
Perc
ent (
%) T
oler
ant
19Y
92 2009ear Sampled
bA) B) a b
a
1992 2009Year Sampled
0
10
20
30
40
50
60
70
80
Perc
ent (
%) V
ery
Tole
rant
1992 2009Year Sampled
0
10
20
30
40
Perc
ent (
%) I
ntol
eran
t 50
60
C) D)
b
a
a b
1992 2009Year Sampled
0
10
20
30
40
50
60
70
80
90
100
Perc
ent (
%) E
PT
1992 2009Year Sam
0
10
20
30
40
50
60
70
80
90
100
Perc
ent (
%) D
ipte
ra &
Non
-inse
cts
b
a
b
a
B)A)
pled

Figure 15: Box and whisker plot depicting the median (center line) and overall range (whisker boundaries) of the change in MBI scores over the past 20 years, as well as the associated rating of ecological quality for small streams sampled in the Minnesota River Basin. An increase in MBI score indicates a decrease in biological condition, whereas a decrease in MBI score indicates an improvement in biological condition.
-1
0
1
2
3
4
Cha
nge
in M
BI S
core
Revisiting the Minnesota River Assessment Project • May 2011 An Evaluation of Fish and Invertebrate Community Progress Minnesota Pollution Control Agency
17
n=3
n=13
Improved DegradedEcological Quality
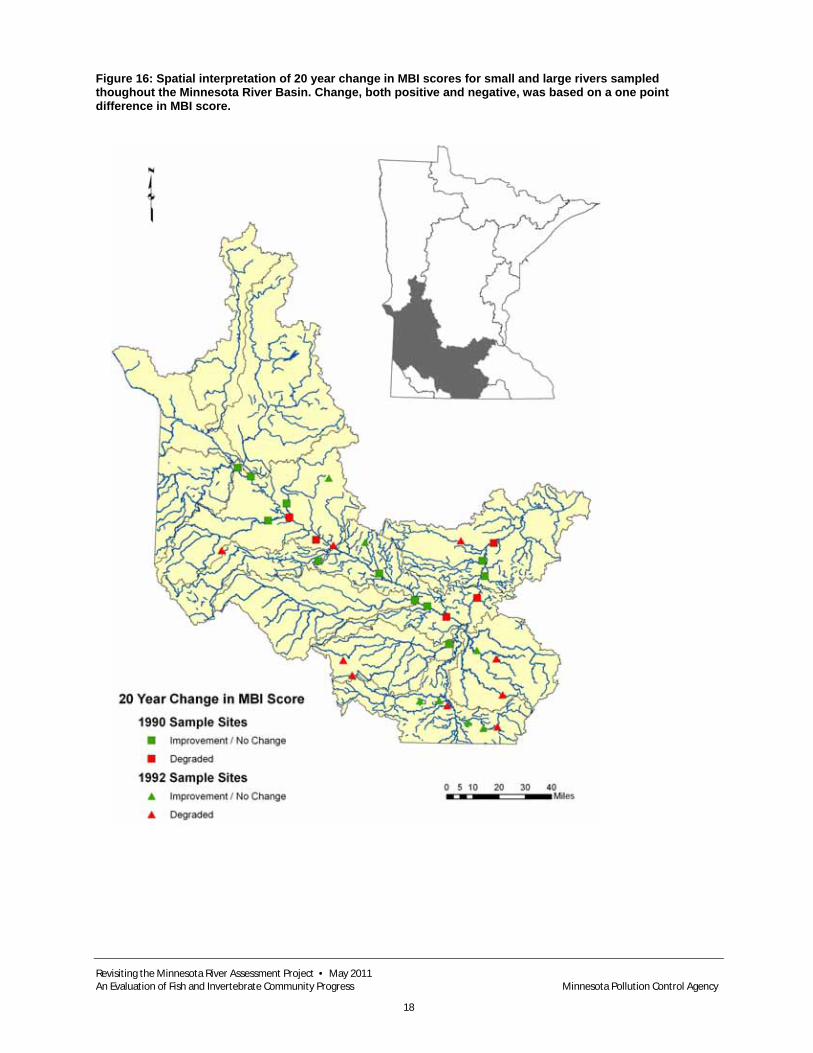
Figure 16: Spatial interpretation of 20 year change in MBI scores for small and large rivers sampled thoughout the Minnesota River Basin. Change, both positive and negative, was based on a one point difference in MBI score.
Revisiting the Minnesota River Assessment Project • May 2011 An Evaluation of Fish and Invertebrate Community Progress Minnesota Pollution Control Agency
18

Nine Year Basin Study Results
2001 vs. 2010 MPCA protocol In addition to the 20 year study using MRAP sampling methods, the MPCA replicated an MRAP progress study performed by the agency in 2001 using the more advanced fish and invert sampling protocols that the MPCA currently follows. See Figure 17 for a map illustrating the sites with both fish and invertebrate trend information available. Figure 17: Spatial interpretation of the nine year change in both fish and benthic macroinvertebrate IBI score based on current MPCA sampling protocols. Change, both positive and negative was based on a 10 point difference in either fish or benthic macroinvertebrate IBI score, as this approximates the confidence limit surrounding the IBI threshold.
Revisiting the Minnesota River Assessment Project • May 2011 An Evaluation of Fish and Invertebrate Community Progress Minnesota Pollution Control Agency
19

Index of biological integrity results
Fish community Of the original subset of 31 sites, 27 were able to be re-sampled for fish community with 4 sites deemed unsampleable due to high flow conditions (See Appendix 1). The fish IBI scores using current MPCA protocols showed an overall increase in mean IBI score of 7.02 points which proved to be statistically significant (paired t-test or Wilcoxon sign-rank test, p<0.05 ) (Figure 18).
The 27 sites represented three different fish IBI classes with the results described below:
Class 1- southern rivers (drainage area > 300 mi2) Six sites of the 2001 MRAP subset were designated as southern rivers. Five of these sites showed an improvement with an average increase in IBI score of 10 points. The one site that declined dropped 1 point. The overall average difference in IBI scores between time periods was 8.08 points and was statistically significant (paired t-test or Wilcoxon sign-rank test, p<0.05) (Figure 18).
Class 2- southern streams (drainage area >30 mi2 and < 300mi2) There were 10 sites that fell into the southern stream class. The average increase in IBI score for the 8 sites demonstrating an improvement was 12.25. The IBI scores for the remaining 2 sites decreased by an average of 22 points. Spring Creek (Yellow Medicine watershed) observed the largest decline in IBI score (28 points). Overall, sites in this class showed an average improvement of 5.35 points; however the observed increase was not statistically significant (Figure 18).
Class 3 - southern headwaters (drainage area <30 mi2) Eleven sites of the 2001 MRAP subset were classified as Southern Headwaters. IBI scores for 6 sites improved an average of 21 points. The IBI score for one of the 6, a tributary to Mound Creek improved by 74 IBI points. Index of biological integrity scores for 4 sites declined 9 points on average and one site showed no change in score at all since 2001. Overall streams within the southern headwaters class improved by an average fish IBI score of 7.95 points, but this increase it was not enough to be statistically significant (Figure 18). Figure 18: Bar graphs depicting 2001 and 2010 mean IBI score (+ S.E.). A) IBI score separated by fish class (Southern Rivers n=6; Southern Streams n=10; Southern Headwaters n=11); B) IBI score for all fish classes combined. Years with similar letters do not indicate a statistically significantly change in IBI scores (paired t-test, p<0.05).
0
10
20
30
40
50
60
70
80
90
IBI S
core
0
10
20
30
40
50
60
70
80
90
IBI S
core
Revisiting the Minnesota River Assessment Project • May 2011 An Evaluation of Fish and Invertebrate Community Progress Minnesota Pollution Control Agency
20
2010 IBI2001 IBI
Southe
rn R
ivers
Southe
rn S
tream
s
Southe
rn H
eadw
aters
2010 IBI2001 IBI
a a
b
a a b
a a
B)A)
All Classes Combined

Macroinvertebrate community From 2001 to 2010 there was no statistically significant difference in mean IBI score when all sites were combined (Figure 19), or when sites were separated based on invertebrate stream classification (paired t-test, p < 0.05) (Figure 20). Although there were no differences in mean IBI scores between the two sampling periods, a number of IBI scores within each class changed; Appendix 4 provides a list of the magnitude of change and aquatic life use designations for each site, respectively. A description of the class specific changes is provided in the following paragraphs.
Class 2 – prairie forest rivers (glide pool habitats) The prairie forest rivers classification characterizes sites with a drainage area of greater than or equal to 500 square miles and that are characteristic of ecological provinces 222, 223, and 251 (MNDNR 2011). A total of 4 sites were sampled between 2001 and 2010, with an average change in IBI score of -15 (+ 18) points (See Appendix 4). All sites within this class had IBI scores that decreased, most notably the Redwood River, which observed a 41 point decrease in IBI score from 2001 to 2010. Three of the 4 sites within prairie forest rivers were rated fair, while the Redwood River was rated poor (See Appendix 4).
Class 5 – southern streams (riffle/run habitat) The southern streams invertebrate classification characterizes sites within ecological provinces 222, 223, 251(MNDNR 2011) and with drainage areas of less than 500 square miles. A total of 6 sites were sampled between 2001 and 2010, with an average change in IBI score of -10 (+ 12) points (See Appendix 4). Three sites, along the Redwood River, had a greater than 10 point decrease in IBI scores, while the other 3 sites (Center Creek, High Water Creek, and Little Cottonwood River) observed little to no change in IBI score. Based on the 2010 IBI score, 3 sites had aquatic life use (ALU) ratings of poor, 2 sites were rated fair, and 1 site rated good (See Appendix 4).
Class 7 – prairie streams (glide pool) The prairie streams invertebrate classification characterizes sites with a watershed of less than 500 square miles and that are characteristic of ecological provinces 222 and 251 (MNDNR 2011). A total of 5 sites were sampled between 2001 and 2010, with an average change in IBI score of 8 (+ 8) points (See Appendix 4). Index of biological integrity scores at 3 of the 5 sites improved (Center Creek, Mounds Creek, and tributary to Little Cottonwood River), and 2 sites observed little to no change (See Appendix 4). Based on 2010 IBI scores, 4 sites had ALU ratings of fair, with 1 site (County Ditch 46) with a poor rating.
Overall comparisons When all sites were combined, the average change in IBI score was -5 (+ 15) points. Based on the 2010 IBI scores, 9 of the 15 sites received ALU ratings of fair, 5 sites received ALU ratings of poor,and 1 site (High Water Creek) received an ALU rating of good. Furthermore, between 2001 and 2010, IBI scores improved at 3 sites, 7 sites observed little to no change in IBI score, and 5 sites observed a greater than 10 point decrease in IBI score (See Appendix 4).
Revisiting the Minnesota River Assessment Project • May 2011 An Evaluation of Fish and Invertebrate Community Progress Minnesota Pollution Control Agency
21

Figure 19: Bar graph depitcting mean IBI score (+ S.E.) for all sites sampled between 2001 and 2010 (n=15, p=0.196). Years with differing letters indicate a statistically significant change in mean IBI score (paired t-test, p < 0.05).
0
10
20
30
40
50
60
IBI S
core
Revisiting the Minnesota River Assessment Project • May 2011 An Evaluation of Fish and Invertebrate Community Progress Minnesota Pollution Control Agency
22
Figure 20: Bar graphs depicting mean IBI score + one standard error for sites sampled between 2001 and 2010. A) prairie forest rivers classification (n=4, p=0.193); B) southern stream rock rubble classification (n=6, p=0.103); C) prairie stream glide pool classification (n=5, p=0.10). Years with differing letters indicate a statistically significant change in IBI score (paired t-test, p< 0.05).
a
2001 2010Year Sampled
a
2001 2010Year Sampled
0
10
20
30
40
50
60
IBI S
core
Prairie Forest Rivers
2001 2010Year Sampled
0
10
20
30
40
50
60
IBI S
core
Southern Streams R.R.
2001 2010Year Sampled
0
10
20
30
40
50
60
IBI S
core
Prairie Streams G.P.
a
aaa
a a
B) C) A)

Revisiting the Minnesota River Assessment Project • May 2011 An Evaluation of Fish and Invertebrate Community Progress Minnesota Pollution Control Agency
23
Minnesota Stream Habitat Assessment The MPCA uses the Minnesota Stream Habitat Assessment (MSHA) as a way to determine the instream habitat conditions as opposed to the QHEI used for the original and follow-up MRAP sampling periods during this study. The MSHA was derived from the QHEI as a way to rate stream habitat conditions in Minnesota as opposed to the more generalized QHEI that originated from Ohio. The MSHA evaluations took place during the fish sampling visits; therefore the fish classification system is used when describing the results.
Minnesota Stream Habitat Assessment scores increased the most in the southern rivers streams. These scores increased 11.34 points on average. Sites within the Southern Streams and Southern Headwaters classes both experienced average increases of 5.21 and 0.71 points respectively. Habitat score improvements were statistically significant for the Southern Rivers class only. For site related habitat values, see Appendix 2. (paired t-test or Wilcoxon sign-rank test, p<0.05).
Discussion and Conclusions The 1990-1992 MRAP survey concluded that the biological condition of the Minnesota River Basin had been degraded over the years, which was attributed to a myriad of factors. In order to address the deteriorating conditions within the Basin, several advisory committees were formed, conservation programs were developed, and best management practices (BMPs) were implemented. To date, these efforts have led to only modest improvements to no change to the overall biological condition of rivers and streams within the Minnesota River Basin. The relatively small increase in overall fish IBI, the return of many intolerant fish species, and improvement of game species such as the smallmouth bass, are reasons to be optimistic about the future of biological conditions in the Minnesota River Basin. However, the lack of progress in benthic macroinvertebrate community health indicates that more conservation efforts are needed, and additional monitoring to better track the successes of these projects.
In heavily farmed landscapes like the Minnesota River watershed, many streams, particularly headwater streams, have been channelized to increase agricultural production by quickly and efficiently moving water from the fields to the stream. As of 2001, 78 percent of the Minnesota River Basin was in agricultural production, down 0.6 percent from 1992 (Musser et al. 2009). Although channel modification may provide benefits to farmers, there are prolonged effects to hydrologic processes and biological communities (Lau et al. 2006). These direct changes to the streams natural course may negate the effectiveness of watershed wide BMPs by directly altering the hydrology (Lau et al 2006), increasing fine sediments, nutrients, contaminants, and simplifying in-stream habitat (Waters 1995, Balogh et al. 1996, Nerbonne and Vondracek 2001). Under these modified conditions, the ecological potential of streams may be reduced as aquatic communities become dominated by a few highly adaptable, tolerant species of invertebrates and fish (see references in Lau et al. 2006).
Another known stressor to biological communities is the increase in urbanization and subsequent addition of impervious surfaces within a watershed. Aquatic ecosystems within close proximity to urbanized areas often have contributing runoff sources from impervious surfaces. These contributing sources are often characterized by poor water quality, degraded biological communities, and lack of instream habitat (Feist and Niemela 2002). Concerns in the Minnesota River Basin about impervious surfaces are generally restricted to the large or fast growing metropolitan areas like Mankato, as well as the outlet of the Minnesota River located in the Twin Cities Metropolitan Area. Limiting the effects from runoff caused by these surfaces will be a contributing factor to preventing further degradation to the biological communities within the Minnesota River Basin, as well as other basins in the state.

Revisiting the Minnesota River Assessment Project • May 2011 An Evaluation of Fish and Invertebrate Community Progress Minnesota Pollution Control Agency
24
During the present study, two methods for assessing change in biological condition were compared. The results from the fish analyses indicate that there was a statistically significant, but modest, increase in biological condition over the 20 year period based on an increase in fish IBI scores. However, when IBI scores were analyzed, significant increases in biological condition were observed only in the southern streams and southern headwaters fish classes. Conversely, the results of the benthic macroinvertebrate analyses indicated that large and small river sites had significantly decreased biological condition over the 20 year period. While these two measures of ecological condition provide conflicting results, it should be noted that each respond to measures of stress differently. For example, both fish and invertebrates are mobile, which allows them to move when conditions warrant. However, fish are able to recolonize previous habitats quicker due to a rapid dispersal rate, while dispersal rates for invertebrates are much slower and depend on many factors (i.e. distance from source population, hydrologic conditions).
Based on Minnesota Board of Water and Soil Resources data, an increase in BMP implementation has been observed since 1995. However these data provide little supporting evidence that there has been a concomitant change in the biological condition throughout the Minnesota River Basin. One suggestion for the lack of supporting evidence is BMP implementation was not focused at or near MRAP site locations resulting in values that may not reflect the overall improvements of the watershed as a whole (Feist 2002). Increased accountability of BMP implementation will aid in the characterization of the effectiveness that these implementations have over time. Furthermore, targeted biological and water quality monitoring near BMP projects will provide interpretation of how specific BMPs affect overall water quality and biological condition.
Given the current transition to water quality monitoring via a watershed approach, the ability to track the effectiveness of BMP implementation may not be too far away. Currently, the MPCA conducts intensive biological and water quality monitoring within an average of eight 8-digit hydrologic unit code (HUC) watersheds each year. This process identifies monitoring locations for comprehensive monitoring using an unbiased method. Within each 8-digit HUC watershed, monitoring sites are sampled for biology, water chemistry, and habitat. These data are then used to make assessments about the condition of the watershed. Following the water body assessments, stressors that limit the aquatic community are identified. The assessment and stressor identification process allows for the development of specific plans to link impaired waters and/or waters suitable for protection with the appropriate BMPs. However, it should be noted that at this time BMP implementation is a voluntary process. Rates of BMP adoption are often low and not necessarily selected or placed in areas that will maximize the potential to achieve a desirable water quality result that can be linked back to the monitoring data. None the less, successive biological and water quality sampling following the 10 year watershed schedule will allow us to track changes in water quality much more effectively than we have in the past.
References Bailey, P.A., Enblom, J.W., Hanson, S.R., Renard, P.A., and K. Schmidt. 1993. A fish Community Analysis of the Minnesota River Basin, in Minnesota River Assessment Project Report, v. III: Minnesota Pollution Control Agency, St. Paul, MN USA. Pp. 212.
Balogh, S.J., Meyer, M.L., and D. Kent. 1996. Mercury and Suspended Sediment Loadings in the Lower Minnesota River. Environmental Science and Technology 31(1): 198-202.
Barbour, M.T., Gerritsen, J., Snyder, B.D., and J.B. Stribling. 1999. Rapid Bioassessment Protocols For Use in Streams and Wadeable Rivers: Periphyton, Benthic Macroinvertebrates, and Fish (2nd ed.). EPA Report: EPA 841-B-99-002.
Brasuhn, J. 2009. Fish Community Sampling Protocol for Stream Monitoring Sites. Minnesota Pollution Control Agency.

Revisiting the Minnesota River Assessment Project • May 2011 An Evaluation of Fish and Invertebrate Community Progress Minnesota Pollution Control Agency
25
Carter, J.L., Resh, V.H., Hannaford, M.J., and M.J. Myers. 2006. Macroinvertebrates as Biotic Indicators of Environmental Quality. Pages 805-833 in Hauer R.F. and G.A. Lamberti (editors). Methods in Stream Ecology (2nd Ed.). Academic Press, Burlington, MA USA. Pp. 877.
Chirhart, J. 2004. Invertebrate Sampling Procedures. Minnesota Pollution Control Agency Report Number: EMAP-SOP 4. Pp. 10.
Delong, M.D. and M.A. Brusven. 1998. Macroinvertebrate Community Structure Along the Longitudinal Gradient of an Agriculturally Impacted Stream. Environmental Management 22(3):445-457.
Dovciak, A.L. and J.A. Perry. 2002. In Search of Effective Scales for Stream Management: Does Agroecoregion, Watershed, or Their Intersection Best Explain the Variance in Stream Macroinvertebrate Communites? Environmental Management 30(3):365-377.
Fore, L.S., J.R. Karr, and R.W. Wisseman. 1996. Assessing Invertebrate Reponses to Human Activities: Evaluating Alternative Approaches. Journal of the North American Benthological Society. 15:212-231.
Hilsenhoff, W.L. 1987. An Improved Biotic Index of Organic Stream Pollution. Great Lakes Entomologist. 20(1):31-40.
Lenat, D.R. 1988. Water Quality Assessment of Streams Using a Qualitative Collection Method for Benthic Macroinvertebrates. Journal of the North American Benthological Society. 7(3):222-233.
Merritt, R.W., Cummins, K.W., and M.B. Berg. 2008. An Introduction to the Aquatic Insects of North America (4th Ed.). Kendall / Hunt Publishing, Dubuque, IA USA. Pp. 1158.
Minnesota River Basin Data Center. 2011. Mankato State University, Mankato, MN USA. http://mrbdc.mnsu.edu/mnbasin/fact_sheets/timeline.html.
Minnesota Department of Natural Resources. 2011. http://www.dnr.state.mn.us/ecs/index.html
Musser, K., Kudelka, S., and R. Moore. 2009. Minnesota River Basin Trends. Mankato State University, Mankato, MN USA. Pp. 64.
Nerbonne, B.A. and B. Vondracek. 2001. Effects of Local Land Use on Physical Habitat, Benthic Macroinvertebrates, and Fish in the Whitewater River, Minnesota, USA. Environmental Management 28(1): 87-99.
Niemela, S.L., and M.D. Feist. 2002. Evaluating Progress of Biological Condition in Streams of the Minnesota River Basin. St. Paul, MN: Minnesota Pollution Control Agency.
Lau, J.K., Lauer, T.E., and M.L. Weinman. 2006. Impacts of Channelization on Stream Habitats and Associated Fish Assemblages in East Central Indiana. American Midland Naturalist 156:319-330.
Lyons, J. 1992. The length of stream to sample with a towed electrofishing unit when fish species richness is estimated. North American Journal of Fisheries Management. 16:241-256.
Quinn, G.P. and M.J. Keough. 2002. Experimental Design and Data Analysis for Biologists. Cambridge University Press. Cambridge, UK. Pp. 537.
Waters, T.F. 1995. Sediment in Streams: Sources, Biological Effects and Control. American Fisheries Society Monograph 7. American Fisheries Society, Bethesda, Maryland, 251 pp.
Whittier, T.R., R.M. Hughes, J.L. Stoddard, G.A. Lomnicky, D.V. Peck, and A.T. Herlihy. 2007. A Structured Approach for Developing Indicies of Biotic Integrity: Three Examples from Streams and Rivers in the Western USA. Transactions of the American Fisheries Society 136:718-735.
Zischke, J. A., Ericksen, G., Waller, D., and R. Bellig. 1994. Analysis of Benthic Macroinvertebrate Communities in the Minnesota River Watershed. Report submitted to the Minnesota Pollution Control Agency.

Revisiting the Minnesota River Assessment Project • May 2011 An Evaluation of Fish and Invertebrate Community Progress Minnesota Pollution Control Agency
26
Appendix Appendix 1: MRAP Fish sampling locations and corresponding IBI scores. A 10 point change in IBI score approximates the confidence limits surrounding the IBI threshold for each class. Negative changes are highlighted in red and positive changes are in green. Fish IBI Classes (1 = Southern Rivers; 2 = Southern Streams; 3 = Southern Headwaters; 7 = Low Gradient)
Site # Stream Name Location Watershed (HUC8)
Fish IBI Class
1990-92 IBI
(MRAP)
2009-10 IBI
(MRAP)
2001 IBI
(MPCA)
2010 IBI
(MPCA) 20 Year Change
9 Year Change
90MN071 County Ditch 44 Downstream of CR 19, 2 mi. SE of Frost Blue Earth 3 19 56 37
90MN073 West Branch Blue Earth River
Downstream of 40th St, 2.5 mi NW of Elmore Blue Earth 2 31.5 48 16.5
90MN077 Brush Creek Upstream of 570th Ave, 0.5 mi W of Kiester Blue Earth 3 60.5 47 -13.5
90MN081 Judicial Ditch 38 Upstream of CSAH 49, 9 mi. SE of Fairmont Blue Earth 3 1 11 10
90MN094 Blue Earth River Downstream of Hwy 169, 1 mi S of Vernon Center Blue Earth 1 50 47 -3
90MN101 Blue Earth River Downstream of Rapidan Dam, Downstream of CR 9, in Rapidan Blue Earth 1 60 48 -12
90MN106 Blue Earth River Upstream of CSAH 90, 1 mi. SW of Mankato Blue Earth 1 51 43 -8
91MN080 County Ditch 26 Upstream of CR 13, 3 mi. E of Blue Earth Blue Earth 3 18 71 53
91MN086 Judicial Ditch 3 Upstream of 240th Ave, 4 mi. NE of Fairmont Blue Earth 3 0 18 18
91MN089 County Ditch 60 Upstream of 370th Ave, 4 mi NW of Blue Earth Blue Earth 3 14 43 29
92MN072 Blue Earth River, Middle Branch
Downstream of 40th St., 2.5 mi N of Elmore Blue Earth 2 34 27 -7
92MN074 Coon Creek Downstream of CR 4, 3 mi S of Blue Earth Blue Earth 2 34 39 5
92MN075 Blue Earth River, East Branch
Downstream of 100 St, 2 mi. NW of Walters Blue Earth 2 22 24 2
92MN076 Foster Creek Upstream of CR 40, 4 mi. NW of Jordan Blue Earth 2 23 19 -4
92MN078 Blue Earth River, East Branch
Upstream of Co Hwy 21, 2 mi NW of Bricelyn Blue Earth 2 41 39 -2
92MN079 Blue Earth River, East Branch
Upstream of CR 13, 4 mi E of Blue Earth Blue Earth 2 54 40 -14
92MN082 South Creek Upstream of 330th Ave, 4 mi. SW of Winnebago Blue Earth 2 38 41 3
92MN083 Center Creek Downstream of North Ave, Fairmont treatment plant, in Fairmont Blue Earth 2 18 18 29 36 0 7
92MN084 Center Creek Upstream of 230th Ave, 2 mi E of Fairmont Blue Earth 2 41 19 22 34 -22 12
92MN085 Center Creek Upstream of CSAH 1, 4 mi. SW of Winnebago Blue Earth 2 33 36 3
92MN087 Elm Creek Upstream of CSAH 1, 2.5 mi. W of Winnebago Blue Earth 2 40 47 7

Revisiting the Minnesota River Assessment Project • May 2011 An Evaluation of Fish and Invertebrate Community Progress Minnesota Pollution Control Agency
27
Site # Stream Name Location Watershed (HUC8)
Fish IBI Class
1990-92 IBI
(MRAP)
2009-10 IBI
(MRAP)
2001 IBI
(MPCA)
2010 IBI
(MPCA) 20 Year Change
9 Year Change
92MN088 Blue Earth River Downstream of CSAH 6, 0.5 mi SW of Blue Earth Blue Earth 1 21 41 20
92MN090 Blue Earth River Upstream of CSAH 8, 2 mi. NW of Blue Earth Blue Earth 1 28 27 -1
92MN091 Blue Earth River Upstream of CSAH 12, 0.5 mi. W of Winnebago Blue Earth 1 34 45 11
92MN092 Blue Earth River Downstream of CR 147, 1.5 mi SW of Amboy Blue Earth 1 23 38 15
92MN093 Blue Earth River Downstream of Hwy 169, .5 mi S of Vernon Center Blue Earth 1 31 37 6
92MN095 Blue Earth River Upstream of CSAH 13, 3 mi W of Good Thunder Blue Earth 1 38 49 11
92MN096 Blue Earth River Adjacent to 185th St, 4 mi SE of Lake Crystal Blue Earth 1 38 35 -3
90MN008 Signalness Creek
Upstream of CR 41, near Glacial Lake State Park, 4.5 mi S of Starbuck Chippewa 3 42 63 61 48 21 -13
90MN010 Chippewa River, East Branch Swift County Park, in Swift Falls Chippewa 2 58 63 5
91MN013 Trib. to Dry Weather Creek
Downstream of 20th St NW, 7 mi NE of Montevideo Chippewa 3 15 40 25
90MN062 Plum Creek Downstream of CR 78, in Plum Creek Cty Park, 1 mi. SW of Walnut Grove Cottonwood 2 57 65 8
90MN063 Highwater Creek Downstream of CR 10, in Cottonwood Cty Park, 5.5 mi NW of Jeffers
Cottonwood 2 58 52.5 40 55 -5.5 15
90MN069 Cottonwood River
Upstream of 260th Ave, 4 mi. S of Sleepy Eye Cottonwood 1 46 51 5
91MN065 Trib. to Mound Creek
Downstream of 460th Ave, 4 mi S of Springfield Cottonwood 3 28 74 8 82 46 74
91MN066 Mound Creek Upstream of 490th Ave, 6.5 mi. NE of Jeffers Cottonwood 3 65.5 55 -10.5
91MN067 Mound Creek Downstream of 420th Ave, 3.5 mi. S of Springfield Cottonwood 2 20 34 68 47 14 -21
91MN068 County Ditch 54 Downstream of CR 66, 3 mi. SE of Wabasso Cottonwood 3 42 17 -25
92MN064 Trib. to Mound Creek
Off of 250th St, Downstream of Red Rock Falls, in County Park, 6.5 mi NE of Jeffers
Cottonwood 3 63 60 -3
90MN002 West Fork Lac qui Parle River
Upstream of County Line Road, 1 mi NE of Gary, South Dakota Lac Qui Parle 3 50 45 -5
90MN003 Lazarus Creek Upstream of CR E5, 7 mi. SW of Canby Lac Qui Parle 3 53 30 -23
90MN005 Ten Mile Creek Downstream of CR 18, 5 mi NW of Montevideo Lac Qui Parle 2 34 43 9
90MN006 Lac qui Parle River
Downstream of confluence with Ten Mile Creek, 9 mi. NW of Montevideo Lac Qui Parle 1 50 26 -24
90MN105 Le Sueur River West of CR 28, in Wildwood County Park, 3.5 mi. N of St. Clair Le Sueur 1 32 45 13
91MN102 Maple River Downstream of Hwy 22, 2.5 mi NW of Wells Le Sueur 3 22 46 24

Revisiting the Minnesota River Assessment Project • May 2011 An Evaluation of Fish and Invertebrate Community Progress Minnesota Pollution Control Agency
28
Site # Stream Name Location Watershed (HUC8)
Fish IBI Class
1990-92 IBI
(MRAP)
2009-10 IBI
(MRAP)
2001 IBI
(MPCA)
2010 IBI
(MPCA) 20 Year Change
9 Year Change
91MN103 County Ditch 5 Upstream of Twp Rd 316/620th Ave, 3 mi SW of Pemberton Le Sueur 7 0 9 9
91MN104 Trib. to Big Cobb River
Upstream of Hwy 22, 5.5 mi E of Good Thunder Le Sueur 3 0 33 33
90MN110 Rush River
Adjacent to Rush River Park Road, in the Rush River Unit of Minnesota Valley Trail SP, 2 mi SW of Henderson
Lower Minnesota 1 28 40.5 12.5
90MN111 Buffalo Creek Upstream of 270th St, 2 mi NW of Henderson
Lower Minnesota 3 41.67 45 54 48 3.33 -6
90MN113 Silver Creek Downstream of CR 41, 5 mi NE of Belle Plaine
Lower Minnesota 2 33.5 38.5 5
90MN114 Bevens Creek Upstream of CR 40, 4 mi. NW of Jordan
Lower Minnesota 2 52 61 9
90MN115 Minnesota River Off of CR 50, 3 mi downstream of Jordan access, 4 mi. N of Jordan
Lower Minnesota 1 45 53 8
90MN116 Sand Creek Upstream of W 220th St, 3 mi. SE of Jordan
Lower Minnesota 2 38 52 14
90MN117 Credit River Upstream of Murphy Lake Blvd (CR 75), 3.5 mi E of Prior Lake
Lower Minnesota 3 58.33 56 61 53 -2.33 -8
91MN109 County Ditch 43 Upstream of 310th St 4 mi. SE of Gaylord
Lower Minnesota 3 29 70 41
91MN112 Robert Creek Downstream of Oak Crest Trail, 1mi SW of Belle Plaine
Lower Minnesota 3 15 59 42.5 51 44 8.5
90MN053 Birch Coulee Creek
Upstream of Unnamed road, in Birch Coulee Battlefield park, 2 mi. N of Morton
Minnesota River-Mankato
2 32 39 7
90MN058 Little Cottonwood River
Downstream of Hwy 15, 4 mi S of New Ulm
Minnesota River-Mankato
2 40.5 57 16.5
90MN070 Minnesota River Upstream of Hwy 23, 3 mi NW of Judson
Minnesota River-Mankato
1 34 66 32
90MN107 Minnesota River Downstream of Hwy 14, 1 mi downstream of power plant in Mankato
Minnesota River-Mankato
1 56 54.5 -1.5
90MN108 Minnesota River Adjacent(east) of Hwy 169, 6 mi N of North Mankato
Minnesota River-Mankato
1 63 44 -19
91MN054 County Ditch 106A trib
Upstream of 420th St, 5 mi. NE of Franklin
Minnesota River-Mankato
7 4 15 11
91MN056 Little Cottonwood River Upstream of CR 2, 7 mi. E of Jeffers
Minnesota River-Mankato
3 51 52 50 53 1 3
91MN057 Little Cottonwood River trib
Upstream of 170th St, 5 mi. NW of Hanska
Minnesota River-Mankato
3 29 62 35 58 33 23
91MN059 County Ditch 46A
Upstream of township road 186/411th Ave, 6.5 mi W of Kasota
Minnesota River-Mankato
3 0 0 6 17 0 11
91MN060 Duck Lake outlet downstream from Co Rd 16, 2.5 mi. N of Madison Lake
Minnesota River-Mankato
3 59 65 6
91MN061 Rogers Creek Downstream from CSAH 20, 3 mi N of St. Peter
Minnesota River-Mankato
3 0 23 32 21 23 -11
90MN001 Pomme de Terre River
Morris City Park, off Hwy 10, 2 mi SE of Morris
Pomme de Terre 1 31 47 16

Revisiting the Minnesota River Assessment Project • May 2011 An Evaluation of Fish and Invertebrate Community Progress Minnesota Pollution Control Agency
29
Site # Stream Name Location Watershed (HUC8)
Fish IBI Class
1990-92 IBI
(MRAP)
2009-10 IBI
(MRAP)
2001 IBI
(MPCA)
2010 IBI
(MPCA) 20 Year Change
9 Year Change
91MN040 County Ditch 33 Downstream of Fairview Ave, 1.5 SE of Vesta Redwood 3 15 41 26
92MN021 Redwood River Downstream of CR 80, below small dam, 2 mi NW of Current Lake Redwood 2 56 44 -12
92MN022 Redwood River Downstream of Hwy 14, 2 mi E of Florence Redwood 2 37 37 36.5 47 0 11
92MN023 Tyler Creek Upstream of Hwy 14, 3 mi. SE of Tyler Redwood 2 20 12 -8
92MN024 Tyler Creek Upstream of Hwy 23, 1 mi NE of Florence Redwood 2 38 27 -11
92MN025 Redwood River Upstream of Hwy 23, 0.5 mi. SW of Russel Redwood 2 39 57 39 42 18 3
92MN026 Norwegian Creek Upstream of Hwy 75, 2.5 mi. N of Lake Benton Redwood 3 7 37 30
92MN027 Coon Creek Upstream of CR 113, 3.5 mi. N of Tyler Redwood 2 0 27 27
92MN028 Coon Creek Upstream of CR 66, 6 mi. SW of Lynd Redwood 2 45 29 -16
92MN030 Redwood River Downstream of CR 74, 3 mi. SW of Marshall Redwood 2 60 45 42 48 -15 6
92MN031 Redwood River Adjacent to CR 67, 1 mi. NW of Marshall Redwood 2 49 49 39 43 0 4
92MN032 Redwood River Adjacent to 300th St, 2 mi. N of Marshall Redwood 2 53 51 -2
92MN033 Redwood River Adjacent to 300th Ave, 5 mi. NE of Marshall Redwood 1 13 17 23 30 4 7
92MN034 Three Mile Creek Upstream of CR 57, 9 mi. W of Marshall Redwood 3 68 65 -3
92MN035 Three Mile Creek Upstream of 220th Ave, 5.5 mi. NW of Marshall Redwood 2 45 56 11
92MN036 Three Mile Creek Upstream of 270th Ave, 6 mi. N of Marshall Redwood 2 15 47 32
92MN037 Redwood River Downstream of CR 51, 5 mi. NW of Milroy Redwood 1 34 47 13
92MN038 Redwood River Upstream of CSAH 8, 6 mi. W of Vesta Redwood 1 9 32 32.5 49 23 17
92MN039 Redwood River Upstream of Hwy 19, 0.5 mi. SW of Vesta Redwood 1 38 34 -4
92MN041 Redwood River Upstream of CR 56, 3 mi. SE of Vesta Redwood 1 34 25 34 45 -9 11
92MN042 Clear Creek Downstream of 270th Ave, 2 mi N of Lucan Redwood 2 22 20 -2
92MN043 Clear Creek Downstream of 290th St, .5 mi. SE of Seaforth Redwood 2 27 29 2
92MN044 Redwood River Upstream of CSAH 6, 6 mi. SW of Redwood Falls Redwood 1 34 25.5 24 29 -8.5 5
92MN045 Redwood River Downstream of CSAH 17, 2 mi. SW of Redwood Falls Redwood 1 51 30 -21
92MN046 Ramsey Creek Downstream of Justice Ave, 4 mi. W of Redwood Falls Redwood 2 12 8 -4

Revisiting the Minnesota River Assessment Project • May 2011 An Evaluation of Fish and Invertebrate Community Progress Minnesota Pollution Control Agency
30
Site # Stream Name Location Watershed (HUC8)
Fish IBI Class
1990-92 IBI
(MRAP)
2009-10 IBI
(MRAP)
2001 IBI
(MPCA)
2010 IBI
(MPCA) 20 Year Change
9 Year Change
92MN049 Redwood River Downstream of E Oak St, in Ramsey park, in Redwood Falls Redwood 1 57 49 73 68 -8 -5
90MN099 South Fork Watonwan River
Downstream of Hwy 60 at Wayside Rest, 5 mi. E of St. James Watonwan 2 27 36 45 56 9 11
90MN100 Watonwan River Upstream of Washington St in Garden City Watonwan 1 36 60 24
91MN097 Judicial Ditch 1 Downstream of CR 1, in wayside park, 2 mi. S of Mountain Lake Watonwan 2 36 21 -15
91MN098 Mountain Lake Inlet
Upstream of CR 99, 2 mi W of Mountain Lake Watonwan 3 0 0 21 28 0 7
90MN007 Minnesota River Upstream of CSAH 212/59, 1 mi SW of Montevideo
Yellow Medicine 1 57 66 9
90MN017 Hawk Creek Upstream of 822nd Ave, 4 mi west of Sacred Heart
Yellow Medicine 1 32.5 37 53 68 4.5 15
90MN018 Minnesota River Downstream of Hwy 10/21, in Renville County Park, 4.5 mi SW of Sacred Heart
Yellow Medicine 1 73 55 -18
90MN019 Minnesota River Adjacent to CR 81, 5 mi SW of Sacred Heart
Yellow Medicine 1 67 62 -5
90MN020 Minnesota River Adjacent to CR 15, 5 mi NW of Delhi Yellow Medicine 1 67 42 -25
91MN014 Spring Creek Upstream of 470th St, 5 mi NW of Hanley Falls
Yellow Medicine 2 21 54 61 50 33 -11
91MN016 Judicial Ditch 18 Downstream of 180th Ave SW, 3mi NE of Prinsburg
Yellow Medicine 3 0 21 21
91MN050 Trib. to Minnesota River
Upstream of 810th Ave, 2.5 mi SW of Sacred Heart
Yellow Medicine 3 0 0 0 0 0 0
91MN051 Camp Pope Creek
Upstream of River Road, 2.5 mi N of Redwood Falls
Yellow Medicine 3 34 64 30
92MN052 Beaver Creek Upstream of CR 2, in Beaver Falls Yellow Medicine 2 45 71 26

Revisiting the Minnesota River Assessment Project • May 2011 An Evaluation of Fish and Invertebrate Community Progress Minnesota Pollution Control Agency
31
Appendix 2: MRAP Fish sampling locations and corresponding instream habitat scores. Negative changes are highlighted in red and positive changes are in green. Fish IBI Classes (1 = Southern Rivers; 2 = Southern Streams; 3 = Southern Headwaters; 7 = Low Gradient)
Site # Stream Name Fish IBI Class
1990-92 QHEI
(MRAP)
2009-10 QHEI
(MRAP) 2001 MSHA
(MPCA) 2010 MSHA
(MPCA) 20 Year Change
9 Year Change
90MN001 Pomme de Terre River 1 57 53.75 3.25
90MN002 Lac qui Parle River, West Fork 3 58 65.3 -7.3
90MN003 Lazarus Creek 3 43 56.3 -13.3
90MN005 Ten Mile Creek 2 73 61.95 11.05
90MN008 Signalness Creek 3 28 56.5 55 82.1 -28.5 -26.7
90MN010 Chippewa River, East Branch 2 63 76.4 -13.4
90MN017 Hawk Creek 1 59 66.8 56 67 -7.8 -11.4
90MN053 Birch Coulee Creek 2 49 78 -29
90MN058 Little Cottonwood River 2 58 61 -3
90MN062 Plum Creek 2 66 69.8 -3.8
90MN063 Highwater Creek 2 43 69.7 54 74.8 -26.7 -21.1
90MN069 Cottonwood River 1 64 71.2 -7.2
90MN070 Minnesota River 1 48 64.1 -16.1
90MN071 County Ditch #44 3 30 46.5 -16.5
90MN073 Blue Earth River, West Branch 2 33 54.1 -21.1
90MN077 Brush Creek 3 38 64 -26
90MN081 Judicial Ditch #38 3 34.5 28.5 6
90MN099 Watonwan River, South Fork 2 40 45.5 48 40.7 -5.5 7.52
90MN100 Watonwan River 1 64 70.25 -6.25
90MN101 Blue Earth River 1 74 78.55 -4.55
90MN105 LeSueur River 1 55 64.2 -9.2
90MN108 Minnesota River 1 52 50.9 1.1
90MN110 Rush River 1 55 68.1 -13.1
90MN111 Buffalo Creek 3 76.2 67 72.9 -5.9
90MN113 Silver Creek 2 40 56 -16
90MN114 Bevens Creek 2 74 60.25 13.75

Revisiting the Minnesota River Assessment Project • May 2011 An Evaluation of Fish and Invertebrate Community Progress Minnesota Pollution Control Agency
32
Site # Stream Name Fish IBI Class
1990-92 QHEI
(MRAP)
2009-10 QHEI
(MRAP) 2001 MSHA
(MPCA) 2010 MSHA
(MPCA) 20 Year Change
9 Year Change
90MN115 Minnesota River 1 67 42.1 24.9
90MN116 Sand Creek 2 69 73.5 -4.5
90MN117 Credit River 3 56.8 65.3 64 70.6 -8.5 -6.6
91MN013 Trib. to Dry Weather Creek 3 21 27 -6
91MN014 Spring Creek 2 20 46 43 36.3 -26 6.75
91MN016 Judicial Ditch 18 3 29 34.5 -5.5
91MN040 County Ditch 33 3 22 26 -4
91MN050 Trib. to Minnesota River 3 49 55 62 54.9 -6 6.57
91MN051 Camp Pope Creek 3 76 52.9 23.1
91MN054 County Ditch 106A trib 7 18 15.5 2.5
91MN056 Little Cottonwood River 3 60 42 83 73 18 10.35
91MN057 Little Cottonwood River trib 3 28 21.5 37 30 6.5 7
91MN059 County Ditch 46A 3 19 38 39 35 -19 3.5
91MN060 Duck Lake outlet 3 39 56.6 -17.6
91MN061 Rogers Creek 3 56 67.6 64 52 -11.6 12.25
91MN065 Trib. to Mound Creek 3 20 46.8 56 46.8 -26.8 8.7
91MN066 Mound Creek 3 73 41 32
91MN067 Mound Creek 2 41 40 41 48.2 1 -6.75
91MN068 County Ditch 54 3 22 35 -13
91MN080 County Ditch 26 3 27 24.5 2.5
91MN086 Judicial Ditch 3 3 27 37 -10
91MN089 County Ditch 60 3 35 52.5 -17.5
91MN097 Judicial Ditch 1 2 60 64.45 -4.45
91MN098 Mountain Lake Inlet 3 18 38 41 44 -20 -3.5
91MN102 Maple River 3 26 45 -19
91MN103 County Ditch 5 7 18 12 6
91MN104 Trib. to Big Cobb River 3 15 25 -10
91MN109 County Ditch 43 3 13 29.5 -16.5

Revisiting the Minnesota River Assessment Project • May 2011 An Evaluation of Fish and Invertebrate Community Progress Minnesota Pollution Control Agency
33
Site # Stream Name Fish IBI Class
1990-92 QHEI
(MRAP)
2009-10 QHEI
(MRAP) 2001 MSHA
(MPCA) 2010 MSHA
(MPCA) 20 Year Change
9 Year Change
91MN112 Robert Creek 3 65 62.7 55 68.2 2.3 -13.5
92MN021 Redwood River 2 39 51.1 -12.1
92MN022 Redwood River 2 51 52 56.6 -4.37
92MN023 Tyler Creek 2 30 48 -18
92MN024 Tyler Creek 2 61 72.7 -11.7
92MN025 Redwood River 2 55 72.6 63 72.7 -17.6 -10.2
92MN027 Coon Creek 2 52 43.75 8.25
92MN028 Coon Creek 2 54 63.9 -9.9
92MN030 Redwood River 2 66 57 52 73.8 9 -21.9
92MN031 Redwood River 2 34 38.4 45 48.3 -4.4 -3.8
92MN032 Redwood River 2 40 53 -13
92MN033 Redwood River 1 33 35.9 50 54 -2.9 -4
92MN034 Three Mile Creek 3 30 51.2 -21.2
92MN035 Three Mile Creek 2 32.5 51.9 -19.4
92MN036 Three Mile Creek 2 32 48.5 -16.5
92MN037 Redwood River 1 51 55.7 -4.7
92MN038 Redwood River 1 35 33.2 38 45 1.8 -7
92MN039 Redwood River 1 31 38.5 -7.5
92MN041 Redwood River 1 34 48.4 46 58.7 -14.4 -12.4
92MN042 Clear Creek 2 35 28.5 6.5
92MN043 Clear Creek 2 63 63.9 -0.9
92MN044 Redwood River 1 69 69.3 58 73.6 -0.3 -15.6
92MN045 Redwood River 1 68 73.65 -5.65
92MN046 Ramsey Creek 2 27 35 -8
92MN049 Redwood River 1 69 77.55 60 77.8 -8.55 -17.7
92MN064 Trib. to Mound Creek 3 62 65.15 -3.15
92MN072 Blue Earth River, Middle Branch 2 35 48 -13
92MN074 Coon Creek 2 38 47 -9

Revisiting the Minnesota River Assessment Project • May 2011 An Evaluation of Fish and Invertebrate Community Progress Minnesota Pollution Control Agency
34
Site # Stream Name Fish IBI Class
1990-92 QHEI
(MRAP)
2009-10 QHEI
(MRAP) 2001 MSHA
(MPCA) 2010 MSHA
(MPCA) 20 Year Change
9 Year Change
92MN075 Blue Earth River, East Branch 2 53 51 2
92MN076 Foster Creek 2 26 36.5 -10.5
92MN083 Center Creek 2 45 39.5 57 60.8 5.5 -3.65
92MN084 Center Creek 2 60 47.55 47 41.9 12.45 5.35
92MN085 Center Creek 2 29 54 -25
92MN087 Elm Creek 2 61 54.6 6.4
92MN096 Blue Earth River 1 52 53 -1

Revisiting the Minnesota River Assessment Project • May 2011 An Evaluation of Fish and Invertebrate Community Progress Minnesota Pollution Control Agency
35
Appendix 3: MBI score, 20 year change in MBI score, and the reflected ecological classification based on the 2009 MBI score. Changes highlighted in red indicate an increase in MBI score (negative response) with a resulting change in ecological condition, while changes in bold indicate a decrease in MBI score (positive change) with a resulting change in ecological condition. Ecological condition does not reflect current TMDL status or assessment rating.
MBI Score (0 to 10) Ecological Condition Based on MBI Score
Based on Hilsenhoff (1988)
Site Code Water body Name 1990 1992 2009 20 Year Change 1990 1992 2009
ARL High Island Creek NS 4.58 6.27 1.69 - Good Fairly Poor
BFD Trib. to Cobb River NS 4.49 5.79 1.30 - Good Fairly Poor
CHP Chippewa River 7.68 NS 5.80 -1.87 Very Poor - Fairly Poor
COT Cottonwood River 5.19 NS 5.90 0.70 Fair - Fairly Poor
CPC Camp Pope Creek NS 6.20 6.22 0.02 - Fairly Poor Fairly Poor
CR13 Judicial Ditch 26 NS 5.50 8.62 3.12 - Fair Very Poor
CTD Minnesota River 5.74 NS 4.83 -0.91 Fairly Poor - Good
DEL Minnesota River 3.78 NS 8.39 4.61 Very Good - Very Poor
EBE E. Branch Blue Earth River NS 4.41 5.43 1.01 - Good Fair
FFX County Ditch 106a NS 6.72 8.53 1.81 - Poor Very Poor
FMT Judicial Ditch 3 NS 6.69 7.44 0.74 Poor Very Poor
FRO County Ditch 44 NS 7.65 7.89 0.24 - Very Poor Very Poor
FTR Minnesota River 3.84 NS 4.21 0.37 Very Good - Good
HEN Minnesota River 7.85 NS 7.14 -0.71 Very Poor - Poor
HIS High Island Creek 4.74 NS 5.85 1.12 Good - Fairly Poor
HWK Hawk Creek 5.27 NS 5.55 0.28 Fair - Fair
JUD Minnesota River 4.36 NS 8.68 4.32 Good - Very Poor
LQP Minnesota River 7.08 NS 6.03 -1.06 Poor - Fairly Poor
MIN County Ditch 37 NS 8.08 7.54 -0.55 - Very Poor Very Poor
MTL Mountain Lake Ditch NS 6.35 7.79 1.44 - Fairly Poor Very Poor
OML Judicial Ditch 1 NS 4.52 8.29 3.77 - Good Very Poor
PEM County Ditch 5 NS 6.70 9.00 2.30 - Poor Very Poor
ROS Judicial Ditch 18 NS 6.98 9.29 2.30 - Poor Very Poor
RSH Rush River 6.35 NS 6.17 -0.18 Poor - Fairly Poor
RWR Redwood River 5.29 NS 4.53 -0.76 Fair - Good
STP Minnesota River 3.40 NS 8.61 5.22 Excellent - Very Poor
UPS Minnesota River 4.35 NS 8.86 4.51 Very Good - Very Poor
WEL Maple River NS 5.65 7.63 1.98 - Fair Very Poor
WIN1 Winnebago Ditch 1 NS 4.09 6.80 2.71 - Very Good Poor
WIN2 Winnebago Ditch 2 NS 3.46 5.63 2.17 - Excellent Fair
WTW Watonwan River 5.50 NS 5.57 0.07 Fair - Fair
YMR Yellow Medicine River 5.82 NS 6.48 0.65 Fairly Poor - Fairly Poor

Appendix 4: IBI comparisons for sites sampled within the MRAP study area during 2001 and 2010. A 10 point change in IBI score represents a significant change. Negative changes are highlighted in red and positive changes are in bold. Aquatic life use status was designated based on 2010 IBI score, the bottom table provides a brief description of ALU status criteria.
Stream Name MPCA Site # Invert Class 2001 IBI 2010 IBI IBI Change ALU Status
Lac qui Parle River 90MN004 2 41 39 -2 Fair
Hawk Creek 90MN017 2 37 25 -13 Fair
High Water Creek 90MN063 5 50 50 0 Good
Little Cottonwood River 91MN056 5 35 33 -2 Fair
Little Cottonwood River Trib. 91MN057 7 12 28 16 Fair
County Ditch 46A 91MN059 7 11 10 -2 Poor
Mound Creek 91MN067 7 38 50 13 Fair
Redwood River 92MN022 5 29 14 -15 Poor
Redwood River 92MN025 5 49 17 -32 Poor
Redwood River 92MN030 5 36 24 -12 Fair
Redwood River 92MN033 7 42 42 0 Fair
Redwood River 92MN044 2 43 3 -41 Poor
Redwood River 92MN049 2 29 25 -4 Fair
Center Creek 92MN083 7 27 39 12 Fair
Center Creek 92MN084 5 22 22 0 Poor
ALU Status Description
Good Above upper confidence limit
Fair Within threshold
Poor Below lower confidence limit
Revisiting the Minnesota River Assessment Project • May 2011 An Evaluation of Fish and Invertebrate Community Progress Minnesota Pollution Control Agency
36


