Revisiting the Impact of Bt Corn Adoption by U.S....
14
Agricultural and Resource Economics Review 41/3 (December 2012) 377–390 Copyright 2012 Northeastern Agricultural and Resource Economics Association Revisiting the Impact of Bt Corn Adoption by U.S. Farmers Jorge Fernandez-Cornejo and Seth Wechsler This study examines the impact of adopting Bt corn on farm profits, yields, and insecticide use. The study employs an econometric model that corrects for self-selection and simultaneity. The model is estimated using nationwide farm-level survey data for 2005. Regression analysis confirms that Bt adoption is associated with increased variable profits, yields, and seed demand. However, the results of this analysis suggest that Bt adoption is not significantly related to insecticide use. This result may be due to the fact that insect infestation levels were lower in 2005 than they were in previous years. Key Words: genetically engineered corn, insect resistance, Bt corn, insecticide use, technology adoption, yields Genetically engineered (GE) crop varieties with enhanced pest management traits, such as insect resistance and herbicide tolerance, are being adopted by U.S. farmers at a very rapid rate. 1 In- sect-resistant crops (Bt crops) contain a gene from a soil bacterium, Bacillus thuringiensis (Bt), which produces a protein that is toxic to specific insects. Bt corn with traits to control the Euro- pean corn borer was introduced commercially in 1996 (Hyde et al. 1999). By the year 2000, Bt corn accounted for 19 percent of corn-planted acres. Bt corn with traits to control corn root- worms was commercially introduced in 2003. By 2010, Bt corn accounted for approximately 63 percent of domestic corn acres (Figure 1). Estimating the costs and benefits associated with Bt corn use is complicated by the high de- gree of variability in regional factors such as weather, infestation levels, and seed costs. More- over, the impact of Bt adoption is often con- founded with the effect of other production prac- tices such as crop rotation. Several studies have Jorge Fernandez-Cornejo is an economist at the Economic Research Service, U.S. Department of Agriculture, in Washington, D.C. Seth Wechsler is a graduate student in the Department of Agricultural and Resource Economics at the University of Maryland in College Park, Maryland. The views expressed are the authors’ and do not necessarily corre- spond to the views or policies of the U.S. Department of Agriculture. 1 Crops with insect resistance and herbicide tolerance traits are classi- fied as first generation GE crops. First generation GE crops include crops with enhanced input characteristics. analyzed how Bt corn affects pesticide use, yields, costs, and profits (Duffy 2001, McBride and El- Osta 2002, Fernandez-Cornejo and McBride 2002, Pilcher et al. 2002, Baute, Sears, and Schaafsma 2002, Dillehay et al. 2004, Fernandez-Cornejo and Li 2005, Mungai et al. 2005, Fang et al. 2007). Generally speaking, these studies have found that Bt corn yields are higher for adopters than for growers of conventional varieties (Table 1). For example, Duffy (1999) found that Bt corn yields were approximately 13 bushels per acre higher than conventional yields. Mitchell, Hurley, and Rice (2004) found that adoption increased yields by 2.8 to 6.6 percent. Dillehay et al. (2004) found that adoption increased yields by 5.5 per- cent in Pennsylvania and Maryland. Fernandez- Cornejo and Li (2005) found that, on average, adopters had 12.5 bushels per acre higher corn yields than non-adopters. Several studies also concluded that adopters used less insecticide than non-adopters (Table 1). However, most studies have analyzed data col- lected in the first years of adoption. As a recent report by the National Research Council (NRC) (NRC 2010) suggests, “The environmental, eco- nomic, and social effects on adopters and non- adopters of GE crops [have] changed over time....” Corn farmers have experienced significant changes in market and environmental conditions since the turn of the twenty-first century. For in- stance: (i) corn borer infestations have decreased dramatically (Hutchinson et al. 2010); (ii) new
Transcript of Revisiting the Impact of Bt Corn Adoption by U.S....

Agricultural and Resource Economics Review 41/3 (December 2012) 377–390 Copyright 2012 Northeastern Agricultural and Resource Economics Association
Revisiting the Impact of Bt Corn Adoption by U.S. Farmers Jorge Fernandez-Cornejo and Seth Wechsler This study examines the impact of adopting Bt corn on farm profits, yields, and insecticide
use. The study employs an econometric model that corrects for self-selection and simultaneity. The model is estimated using nationwide farm-level survey data for 2005. Regression analysis confirms that Bt adoption is associated with increased variable profits, yields, and seed demand. However, the results of this analysis suggest that Bt adoption is not significantly related to insecticide use. This result may be due to the fact that insect infestation levels were lower in 2005 than they were in previous years.
Key Words: genetically engineered corn, insect resistance, Bt corn, insecticide use, technology
adoption, yields Genetically engineered (GE) crop varieties with enhanced pest management traits, such as insect resistance and herbicide tolerance, are being adopted by U.S. farmers at a very rapid rate.1 In-sect-resistant crops (Bt crops) contain a gene from a soil bacterium, Bacillus thuringiensis (Bt), which produces a protein that is toxic to specific insects. Bt corn with traits to control the Euro-pean corn borer was introduced commercially in 1996 (Hyde et al. 1999). By the year 2000, Bt corn accounted for 19 percent of corn-planted acres. Bt corn with traits to control corn root-worms was commercially introduced in 2003. By 2010, Bt corn accounted for approximately 63 percent of domestic corn acres (Figure 1). Estimating the costs and benefits associated with Bt corn use is complicated by the high de-gree of variability in regional factors such as weather, infestation levels, and seed costs. More-over, the impact of Bt adoption is often con-founded with the effect of other production prac-tices such as crop rotation. Several studies have
Jorge Fernandez-Cornejo is an economist at the Economic Research Service, U.S. Department of Agriculture, in Washington, D.C. Seth Wechsler is a graduate student in the Department of Agricultural and Resource Economics at the University of Maryland in College Park, Maryland.
The views expressed are the authors’ and do not necessarily corre-spond to the views or policies of the U.S. Department of Agriculture.
1 Crops with insect resistance and herbicide tolerance traits are classi-
fied as first generation GE crops. First generation GE crops include crops with enhanced input characteristics.
analyzed how Bt corn affects pesticide use, yields, costs, and profits (Duffy 2001, McBride and El-Osta 2002, Fernandez-Cornejo and McBride 2002, Pilcher et al. 2002, Baute, Sears, and Schaafsma 2002, Dillehay et al. 2004, Fernandez-Cornejo and Li 2005, Mungai et al. 2005, Fang et al. 2007). Generally speaking, these studies have found that Bt corn yields are higher for adopters than for growers of conventional varieties (Table 1). For example, Duffy (1999) found that Bt corn yields were approximately 13 bushels per acre higher than conventional yields. Mitchell, Hurley, and Rice (2004) found that adoption increased yields by 2.8 to 6.6 percent. Dillehay et al. (2004) found that adoption increased yields by 5.5 per-cent in Pennsylvania and Maryland. Fernandez-Cornejo and Li (2005) found that, on average, adopters had 12.5 bushels per acre higher corn yields than non-adopters. Several studies also concluded that adopters used less insecticide than non-adopters (Table 1). However, most studies have analyzed data col-lected in the first years of adoption. As a recent report by the National Research Council (NRC) (NRC 2010) suggests, “The environmental, eco-nomic, and social effects on adopters and non-adopters of GE crops [have] changed over time....” Corn farmers have experienced significant changes in market and environmental conditions since the turn of the twenty-first century. For in-stance: (i) corn borer infestations have decreased dramatically (Hutchinson et al. 2010); (ii) new

378 December 2012 Agricultural and Resource Economics Review
Figure 1. Bt Adoption Rates for U.S. Corn Farmers (1996–2010) Source: NASS/ERS ARMS data, the NASS Objective Yield Survey, and the NASS June Agricultural Survey.
traits, such as corn rootworm resistance (intro-duced in 2003) and corn earworm resistance (in-troduced in 2010) have been engineered into Bt seeds; and (iii) average corn prices, as well as most input costs, have increased. One would expect decreases in pest popula-tions to slow rates of Bt adoption. As Figure 1 demonstrates, there was a decrease in adoption rates between 1999 and 2002. However, adoption rates rose from 2003 onwards. This may be be-cause farmers placed a premium on the new (in-sect-resistance) traits that have been incorporated into Bt seeds since 2003. Alternately, increases in expected profits may have made these seed pur-chases more palatable. Given that pest populations have dwindled and that new insect-resistance traits have been incor-porated into Bt seeds, one might expect a reduc-tion in the profitability of insecticide use. This would lead to a reduction of insecticide use and to a change in how Bt adoption affects insecticide use. This paper analyzes farm-level data collected nationally in 2005 in an effort to understand how
changes in market and environmental conditions have affected Bt adoption, farmers’ profits, and farmers’ input decisions. The study will provide an important counterpoint to research conducted during the earlier stages of Bt adoption. As a recent report by the NRC (2010) con-cludes, “empirical research into the environmen-tal and economic effects of changing market con-ditions and farmer practices have not kept pace [with the changes themselves].” This analysis ad-dresses some of those concerns. The Data The data used in this study were obtained from the 2005 nationwide Agricultural Resource Man-agement Survey (ARMS), which was developed and conducted by USDA. The ARMS survey has a multi-phase, multi-frame, stratified, probability-weighted design. In other words, farmers with specific characteristics are administered different phases of the ARMS survey during and after each survey year. After data collection, the National Agricultural Statistics Service (NASS) generates

Fernandez-Cornejo and Wechsler Revisiting the Impact of Bt Corn Adoption by U.S. Farmers 379
Table 1. Summary of Select Studies on the Effects of Bt Corn on Yields, Insecticide Use, and Returns
Effects on ...
Researchers / Date of Publication Data Source Yields Insecticide Use Returns
Pilcher and Rice 1998 a Survey Increase Decrease Depends on infestation
Duffy 2001 b Survey Increase N/A Same
Baute, Sears, and Schaafsma 2002 c Experiments Increase N/A Depends on infestation
McBride and El-Osta 2002 d Survey N/A N/A Decrease
Pilcher et al. 2002 e Survey Increase Decrease N/A
Dillehay et al. 2004 f Experiments Increase N/A N/A
Mitchell, Hurley, and Rice 2004 g Experiments Increase N/A Depends on infestation
Fernandez-Cornejo and Li 2005 h Survey Increase Decrease N/A
Mungai et al. 2005 i Experiments Increase N/A N/A
Fang et al. 2007 j Experiments Increase N/A N/A
Note: N/A = not available. a Results using data from surveys administered in 1996–1998. b Results using data from surveys administered in 1998. c Results using data from field trials administered in 1996–1997. d Results using data from surveys administered in 1998. e Results using data from surveys administered in 1996–1998.
f Results using data from field trials administered in 2000–2002. g Results using data from field trials administered in 1997–1999. h Results using data from surveys administered in 2001. i Results using data from field trials administered in 2002–2003. j Results using data from field trials administered in 2002.
probability weights to help ensure that the ARMS sample accurately represents the population of U.S. famers. The ARMS survey has three phases. The ARMS Phase I survey is administered in the summer of the survey year. Phase I verifies that all respon-dents operate a farm or plant a specific crop. The ARMS Phase II survey is administered in the fall and winter of the survey year. This commodity-based, field-level survey collects data on produc-tion practices and input use. The ARMS Phase III is administered in the spring following the survey year. Phase III gathers data on debt, revenue, op-erating costs, and expenditures. After merging the Phase II and Phase III data-sets and excluding observations with missing val-ues, 1,129 observations from 19 major corn-pro-ducing states were available for analysis. According to the 2005 ARMS corn survey, 76.5 percent of the farmers adopting Bt corn indicated that they did so in order to increase yields. Other adopters reported that they used Bt corn to de-
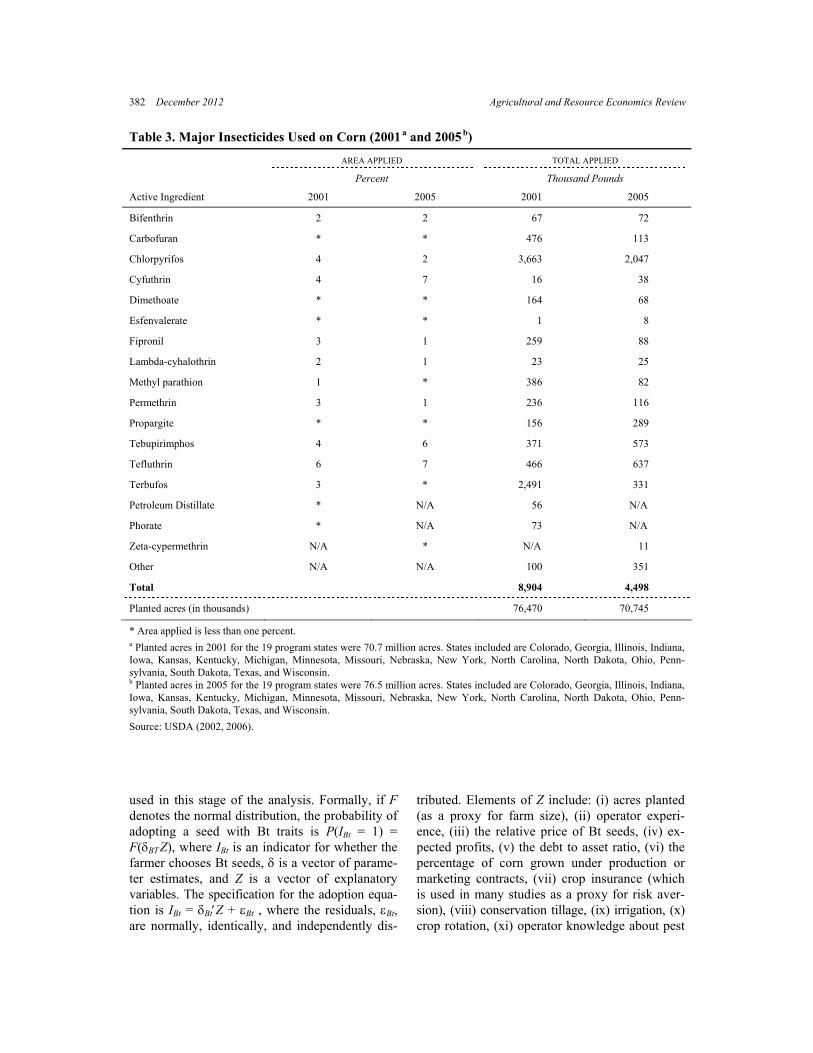
crease pesticide costs (11.3 percent) or to save management time (3.3 percent). Approximately 10 percent of adopters reported using Bt corn for other reasons. Survey results indicate that, on average (Table 2), actual corn yields were about 17 bushels per acre (12 percent) higher for adopters than for non-adopters, seed use was 0.02 bushels per acre (4.8 percent) higher for adopters than for non-adopters, insecticide use was 0.04 pounds of ac-tive ingredients per acre (43 percent) lower for adopters than for non-adopters, and variable prof-its were 18 dollars per acre (7.5 percent) higher for adopters than for non-adopters. Differences in the unconditioned means suggest that Bt adoption may increase variable profits, yields, and seeding rates, while decreasing insecticide use. The geographical distribution of average corn yields and Bt adoption rates are shown in Figures 2 and 3, respectively. Table 3 contrasts insecticide use in 2005 with insecticide use in 2001. Total pounds applied de-

380 December 2012 Agricultural and Resource Economics Review
Table 2. Sample Means and Definition of Main Variables—Corn Producers (2005)
Variable Description All Obs. Bt Adopters Non-
Adopters
Yield Per acre yields, in bushels 144.81 155.14 138.56
Seed use Seed demand, in bushels per acre 0.35 0.36 0.34
Insecticide use Insecticide demand, in pounds AI per acre 0.07 0.05 0.09
Bt corn Dummy variable = 1 if the operator planted seeds with Bt traits
0.38
Crop insurance Dummy variable = 1 if the operator has crop insurance
0.76 0.88 0.68
Precipitation Spring and summer precipitation, in meters 7.70 7.46 7.84
Seed price Seed price, dollars per bushel 108.99 120.18 102.23
Corn price Corn price, dollars per bushel 1.99 1.95 2.01
Operator experience Years of operator experience 36.24 33.63 37.81
Heartland Dummy variable = 1 if the operation is located in the ERS-designated Heartland region
0.68 0.74 0.65
Insecticide Dummy variable = 1 if insecticides are applied 0.20 0.22 0.19
Number of observations 1,129 435 694
Source: 2005 ARMS Corn Survey.
0 – 50
50‐150
150‐250
Figure 2. Average Corn Yields (in bushels per acre) Source: NASS/ERS 2005 ARMS corn data.

Fernandez-Cornejo and Wechsler Revisiting the Impact of Bt Corn Adoption by U.S. Farmers 381
0 – 33%
33% – 66%
66% – 100%
Figure 3. Percentage of Respondents that Adopted Bt Corn Seeds Source: NASS/ERS 2005 ARMS corn data. clined by approximately 4.5 million pounds (or 50 percent) over this time period. Usage declined most for Chlorpyrifos and Terbufos. Chlorpyrifos and Terbufos are used to control corn rootworms and other insects (Wilson et al. 2005).2 Given that Bt corn can be used to control the European corn borer (since 1996) and the corn rootworm (since 2003), it is likely that the decreased demand for corn insecticides is due to Bt adoption. Mean comparisons are illustrative. However, definite conclusions should not be drawn from these comparisons unless the data is generated under carefully controlled experimental settings, where factors other than adoption are “controlled for” by making them as similar as possible (Fer-nandez-Cornejo and Li 2005, Fernandez-Cornejo and McBride 2002). Clearly, this is not the case with survey data. After all, Bt use is not random. In other words, surveyed farmers were not ran-domly assigned to a treatment group (adopters) and a control group (non-adopters). Consequently, adopters and non-adopters may be systematically different from one another (for example, in terms
2 See http://www.chlorpyrifos.com/benefits-by-crop.htm.
of management ability). This situation, called self-selection, biases the statistical results, unless it is corrected (Heckman 1979). For these rea-sons, we specify an econometric model that ac-counts for self-selection. The Model In this section, we briefly discuss the theoretical framework of the model and present the specifi-cations used in the empirical analysis. This study employs a two-stage framework. The first stage, which is referred to as the adop-tion decision model, is used to determine factors that influence a farmer’s decision to use Bt seeds. The second stage, or impact model, is used to estimate the impact that adopting Bt seeds has on yields, seed demand, insecticide demand, and farm variable profits. The Adoption Decision Model Because adoption decisions involve a binary choice (experimenting with a new technology or retaining an old one), a probit specification is
382 December 2012 Agricultural and Resource Economics Review
Table 3. Major Insecticides Used on Corn (2001 a and 2005 b)
AREA APPLIED TOTAL APPLIED
Percent Thousand Pounds
Active Ingredient 2001 2005 2001 2005
Bifenthrin 2 2 67 72
Carbofuran * * 476 113
Chlorpyrifos 4 2 3,663 2,047
Cyfuthrin 4 7 16 38
Dimethoate * * 164 68
Esfenvalerate * * 1 8
Fipronil 3 1 259 88
Lambda-cyhalothrin 2 1 23 25
Methyl parathion 1 * 386 82
Permethrin 3 1 236 116
Propargite * * 156 289
Tebupirimphos 4 6 371 573
Tefluthrin 6 7 466 637
Terbufos 3 * 2,491 331
Petroleum Distillate * N/A 56 N/A
Phorate * N/A 73 N/A
Zeta-cypermethrin N/A * N/A 11
Other N/A N/A 100 351
Total 8,904 4,498
Planted acres (in thousands) 76,470 70,745
* Area applied is less than one percent. a Planted acres in 2001 for the 19 program states were 70.7 million acres. States included are Colorado, Georgia, Illinois, Indiana, Iowa, Kansas, Kentucky, Michigan, Minnesota, Missouri, Nebraska, New York, North Carolina, North Dakota, Ohio, Penn-sylvania, South Dakota, Texas, and Wisconsin. b Planted acres in 2005 for the 19 program states were 76.5 million acres. States included are Colorado, Georgia, Illinois, Indiana, Iowa, Kansas, Kentucky, Michigan, Minnesota, Missouri, Nebraska, New York, North Carolina, North Dakota, Ohio, Penn-sylvania, South Dakota, Texas, and Wisconsin. Source: USDA (2002, 2006).
used in this stage of the analysis. Formally, if F denotes the normal distribution, the probability of adopting a seed with Bt traits is P(IBt = 1) = F(δBTZ), where IBt is an indicator for whether the farmer chooses Bt seeds, δ is a vector of parame-ter estimates, and Z is a vector of explanatory variables. The specification for the adoption equa-tion is IBt = δBt′Z + εBt , where the residuals, εBt, are normally, identically, and independently dis-
tributed. Elements of Z include: (i) acres planted (as a proxy for farm size), (ii) operator experi-ence, (iii) the relative price of Bt seeds, (iv) ex-pected profits, (v) the debt to asset ratio, (vi) the percentage of corn grown under production or marketing contracts, (vii) crop insurance (which is used in many studies as a proxy for risk aver-sion), (viii) conservation tillage, (ix) irrigation, (x) crop rotation, (xi) operator knowledge about pest

Fernandez-Cornejo and Wechsler Revisiting the Impact of Bt Corn Adoption by U.S. Farmers 383
infestations, and (xii) an indicator for whether the farm is located in the region designated “Heart-land” by USDA’s Economic Research Service (ERS). The Impact Model The second stage of the model examines how Bt adoption affects pesticide use, yields, and vari-able profits. To do this in a manner consistent with farmers’ optimization behavior, we use the well-developed restricted profit function (Diewert 1974). Using the Hotteling-Shephard lemma, we derive the output supply and input demand func-tions from the profit function. For the empirical model, we use a normalized quadratic restricted profit function (Diewert and Ostensoe 1988). Considering land as a fixed in-put, imposing symmetry by sharing parameters, imposing linear homogeneity by normalization (using the price of labor as the numeraire), and appending disturbance terms, the per-acre profit function (π), the supply (yield) equation (Y ), the per-acre demand equation for seeds (X1), and the per-acre demand equation for insecticides (X2) are: (1) 0
2 0.5
0.5
y j j k kj k
yy yj j yk kj k
ij i j jk j kj i k j
A A P A W C R
G P G PW F PR
G WW E W R π
π = + + +
+ + +
+ + + ε
∑ ∑
∑ ∑
∑∑ ∑∑
(2) y yy yj j yk k y
j kY A G P G W F R= + + + + ε∑ ∑
(3) 1 1 1 1 1 1 y j j k k
j kX A G P G W E R= + + + + ε∑ ∑
(4) 2 2 2 2 2 2 y j j k k
j kX A G P G W E R= + + + + ε∑ ∑ ,
where j indexes inputs used in the production process (for instance, seeds and insecticides), k indexes exogenous variables describing farm-spe-cific characteristics (for instance, operator educa-tion, farm location, etc.), P and W are normalized output and input prices (respectively), and A, C, E, F, and G are parameters (Fernandez-Cornejo 1996). The vector R contains a measure of Bt adoption (as discussed in the next section) as well
as exogenous variables to control for pest infesta-tion levels and management characteristics. Self-Selection As discussed in a previous section, since farmers are not randomly assigned to a treatment group and a control group, adopters and non-adopters may be systematically different from one another. If these differences affect both farm performance and Bt adoption, they will confound the analysis (Fernandez-Cornejo 1996). This is a classic case of self-selection (Greene 1997). Self-selection is a type of endogeneity (Mad-dala 1983, Greene 1997). Endogeneity arises when there is a correlation between the explanatory variables and the model’s residuals.3 If endogene-ity is not accounted for (for instance, through the use of instrumental variable techniques), the re-sults of the analysis will be biased. For simplicity, consider self-selection in the context of determining whether Bt adoption af-fects seed demand. Let the true model be: (5) 1 1iSeed i i i iX S Bt RA e= β + ∝ + γ +
(6) 2 2i i i iBt Z RA v= β + γ + , where
iSeedX represents seed use, Bti ∈ {0,1} represents the farmer’s decision to adopt Bt seeds, Si and Zi are vectors of (exogenous) explanatory variables, RAi represents an unobserved variable (e.g., the farmer’s desire to avoid risk), β1, β2, ∝, γ1, and γ2 are vectors of parameter estimates, and ei and vi are error terms. RA is assumed to be unobserved. Thus, it is necessary to estimate: (7) 1 1Seed i i iX S Bt= β + ∝ + ε , where the error term is 11 ( )i iRA eε γ += , (8) 2 2i iBt Z= β + ε , where the error term is 2 2( )i iRA vε = γ + .
3 The residuals represent “noise” generated by random processes, but
also contain variation caused by all unspecified or unobservable vari-ables.

384 December 2012 Agricultural and Resource Economics Review
Consider equation (7). Notice that neither E[Bti, ε1] nor 1[ , ]
iSeedE X ε equals 0 because RAi influ-ences both Bt adoption and seed demand [as speci-fied in equations (5) and (6)]. This correlation is the source of the self-selection problem. Regress-ing equation (7) without accounting for this cor-relation will generate biased parameter estimates. Controlling for Endogeneity / Self-Selection There are several methods of controlling for self-selection. The approach used in this study (some-times called an instrumental variables approach) is to calculate predictions of Bti (denoted by iBt ) using the parameters estimated from equation (8) and to substitute these predictions into equation (7). Because the variables in Zi are exogenous,
iBt is uncorrelated with ei, and ∝ is an unbiased estimator. Estimation The Adoption Model was estimated using the weighted probit routines in STATA and LIMDEP. The Impact Model was estimated using the Con-ditional Mixed Process Module (cmp) developed for STATA by David Roodman (Roodman 2009).4 The CMP module fits Seemingly Unrelated Re-gression Models with normally distributed error terms. Unlike many of the SUR routines available in STATA or SAS, this program enables the esti-mation of mixed models, allowing linear, probit, ordered probit, multinomial probit, Tobit, interval regression, and truncated-distribution regressions to be jointly estimated within the context of a seemingly unrelated system of equations. For the purposes of this analysis, the profit, yield, and seed demand equations were assumed to have un-censored, linear specifications. Because approxi-mately 80 percent of the farmers in the sample do not use insecticides, a tobit specification was used to model insecticide demand. As in the Adoption Model, a weighted least squares technique was used to estimate the Impact Model. After estimating the Adoption and Impact Mod-els using the full sample, the standard errors were reestimated using the delete-a-group jackknife
4 This module is based on work by Cappellari and Jenkins (2003), Gates (2006), Geweke (1989), Hajivassiliou and McFadden (1998), and Keane (1992, 1994).
method described in Kott (1998) and employed in other analyses of ARMS data (Fernandez-Cornejo, Hendricks, and Mishra 2005, Fernandez-Cornejo and Li 2005, Fernandez-Cornejo, Klotz-Ingram, and Jans 2002).5 It is well known that standard errors estimated using the jackknife method are conservative, and “may underestimate the signifi-cance of variables under some circumstances” (Fernandez-Cornejo, Hendricks, and Mishra 2005). For this reason, standard errors were calculated using both the standard estimation procedure and the jackknife method. The p-values used in this analysis were calculated using the jackknifed standard errors. Model Results The Adoption Decision Model Table 4 presents results from the Adoption Model. Most of these results corroborated a pri-ori assumptions. For instance, previous work has established that large operations are more likely than small operations to adopt agricultural inno-vations (Feder, Just, and Zilberman 1985, Fer-nandez-Cornejo, Klotz-Ingram, and Jans 2002, Fernandez-Cornejo and Li 2005). Previous work has also established that farmers who purchase crop insurance are more likely than their unin-sured counterparts to purchase Bt seeds (Fernan-dez-Cornejo and McBride 2002).6 Similarly, it is well known that the opportunity cost of pest in-festations tends to be higher on irrigated opera-tions, operations in the heartland (which tend to have highly productive soils), and other opera-tions with high expected yields. Finally, it is not surprising that farmers expecting yield losses from corn borers are more likely to adopt insect-resis-tant seeds. In other words, it was expected that the
5 The National Agricultural Statistics Service (NASS) partitions the
sample into 15 groups of observations. Fifteen “replicate” groups of observations are formed by excluding one of the 15 original groups from the full sample. NASS calculates sampling weights for the full sample, as well as each of the replicates. In order to estimate the model, parameter estimates are estimated using the full sample. To cal-culate the standard errors, the model is run 15 additional times (using each of the 15 subsamples and the appropriate replicate weights). The standard errors estimated from each subsample are saved and used to calculate the adjusted standard errors [see Fernandez-Cornejo, Hen-dricks, and Mishra (2005)].
6 Bt seeds and crop insurance both reduce expected losses from pest infestations.

Fernandez-Cornejo and Wechsler Revisiting the Impact of Bt Corn Adoption by U.S. Farmers 385
Table 4. Predicting Bt Adoption—Corn Producers (2005)
Observations : 1,129
McFadden pseudo R-squared 0.15
Variable Parameter Estimate a
SE, Using Standard Method
SE, Using Jackknife Method
Constant -1.03* 0.31 0.51
Acres planted 0.005*** 0.001 0.002
Operator experience -0.01** 0.003 0.004
Relative price of Bt seeds -0.16 0.17 0.28
Expected profits a -0.19 0.51 1.22
Debt to asset ratio 0.08 0.15 0.29
Contract -0.04 0.22 0.36
Crop insurance 0.50** 0.11 0.17
Conservation tillage 0.04 0.09 0.20
Irrigation 0.74** 0.17 0.33
Crop rotation 0.07 0.15 0.29
Ind_Cbor 0.73*** 0.12 0.19
Ind_Cwrm -0.0002 0.12 0.20
Heartland 0.22 0.10 0.18
Note: *** indicates that P < 0.01, ** indicates that P < 0.05, and * indicates that P < 0.10. a Variable Profits are used as a proxy for expectations Source: Model results. parameter estimates on Size, Crop Insurance, Irri-gation, Heartland, and Ind_cbor would be positive. While we expected the parameter estimate for operator experience to be positive, this parameter estimate was negative and significant.7 One ex-planation is that changing perceptions about the probability of insect infestations have decreased the perceived value of Bt seeds. For instance, corn borer infestations have radically declined since the introduction of Bt corn (Hutchinson et al. 2010). This decline may be more apparent to experienced corn farmers (who are better at fore-casting insect populations) than it is to inexperi-enced ones. In other words, experienced farmers
7 A positive relationship between farming experience (measured in
years) and Bt crop adoption is commonly found. However, a negative relationship is not unprecedented in the literature (see, for example, Matuschke and Qaim 2009).
may update their expectations more quickly than their less experienced counterparts.8 The Impact Model The Impact Model fits the data relatively well. While it appears that there is no consensus re-garding the best measure of “goodness of fit” for Mixed Process Models (Kramer 2005), pseudo R2
or generalized R2 statistics are good alternatives to traditional R2 values.9 As discussed in Magee
8 As suggested by an anonymous reviewer, we also included both
experience and age in the adoption equation, but this inclusion caused a severe collinearity problem, leading us to drop the age variable.
9 Pseudo R2 values resemble traditional R2 values in that they are bounded on the [0,1] interval and higher values indicate better model fit. However, these values cannot be interpreted as one would interpret a traditional R2, because the parameter estimates were not calculated to minimize variance (rather they were calculated via maximum likeli-hood or an alternative, iterative method). Different methods of calcu-lating pseudo R2’s can provide very different values.

386 December 2012 Agricultural and Resource Economics Review
(1990), there are many different methods of cal-culating alternatives to R2 statistics, all of which provide slightly different values. One possibility involves computing directly the sum of squared residuals and dividing them by the sum of squared means. While identical to the formula used to calculate the traditional R2 value, it does not have the same interpretation:
2 'SSEGeneralized R 1 1 SSM '
e em m
= − = − ,
where e is an nxl matrix of residuals (with n = the number of observations in the system, and l = the number of equations in the system), m is an nxl matrix of the difference in means ( )y y− , and
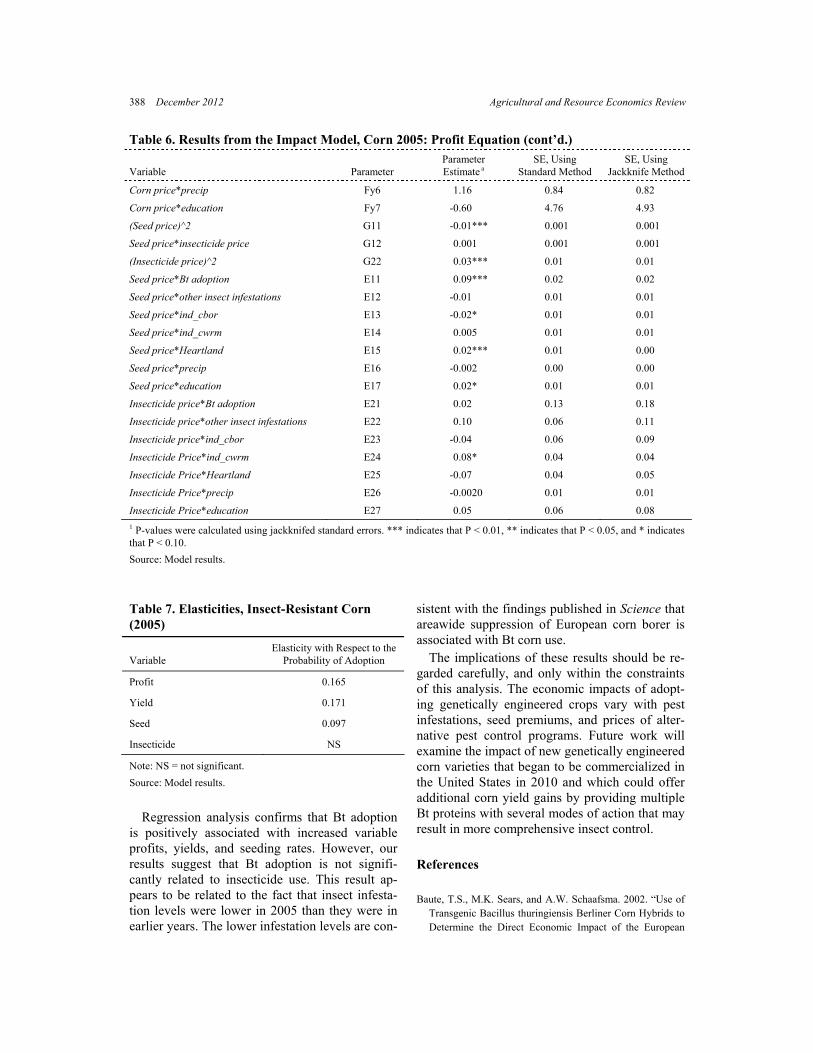
'e e represents the determinant of e′e. Using this measure, the Generalized R2 of the model is 0.87. Most of the results derived from the parameter estimates corroborate a priori expectations. In-creases in seed prices decrease seed demand. In-creases in corn prices increase per-acre supply (yields). Pest infestation is associated with de-creased yields, while being located in the Heart-land region and high precipitation rates are asso-ciated with increased yields (Table 5). Increases in insecticide prices appear to decrease seed de-mand.10 This implies that seeds and insecticides are complements in the production process. How-ever, our results appear to suggest that increases in insecticide prices increase insecticide demand. The positive relationship between insecticide prices and insecticide use is likely to be due to the fact that insecticide prices are highly correlated with pesticide potency and other measures of pesticide quality. Insofar as the impact of Bt adoption is con-cerned, this study’s findings suggest that Bt seed use increases variable profits, yields, and seed de-mand (Tables 5 and 6). More specifically, a 10 percent increase in the probability of adoption was associated with a 1.65 percent increase in variable profits, a 1.7 percent increase in yields, and a 1 percent increase in seed demand (Table 7). In contrast to the findings reported in Fernan-dez-Cornejo and Li (2005) (which were based on
10 Parameter restrictions ensure that G12 equals G21. This ensures
that the effect insecticide prices have on seed demand is equivalent to the effect seed prices have on insecticide demand.
2001 data), this study finds that Bt adoption does not have a statistically significant impact on in-secticide demand (Table 6). This result may be related to the fact that insect infestation levels were lower in 2005 than they were in 2001 (Hutchinson et al. 2010). Because infestation lev-els were low, most farmers applied substantially fewer insecticides in 2005 than they did in 2001.11 In fact (as previously mentioned), 80 percent of the farmers in the sample did not use insecticides at all. This may have reduced the impact of Bt adoption on insecticide use. After all, farmers use insecticides only if treating pest infestations is expected to be profitable. In other words, farmers use insecticides only if infestation levels are above a certain threshold.12 Below this threshold, Bt adoption should not affect insecticide use. The lower infestation levels are also consistent with the findings recently published in Science (Hutchinson et al. 2010) that areawide suppres-sion of European corn borer is associated with Bt corn, which has been used in increasing amounts since 1996. This suggests that Bt corn has bene-fited not only adopters but non-adopters as well by reducing pest populations. Concluding Comments This study estimates how adopting Bt corn affects variable profits, yields, seeding rates, and insecti-cide demand using an econometric model that corrects for self-selection and simultaneity. The model is estimated using 2005 national survey data. Survey results indicate that, on average, vari-able profits were about $18 per acre higher for adopters than for non-adopters, corn yields were 17 bushels per acre higher for adopters than for non-adopters, seed demand was 0.02 bushels per acre higher for adopters than for non-adopters, and insecticide demand was 0.04 pounds of active ingredients per acre lower for adopters than for non-adopters. Differences in the unconditioned means suggest that Bt adoption increases variable profits, yields, and seeding rates, while decreas-ing insecticide use.
11 Average insecticide use was 0.07 pounds per acre in 2005 (Table 1) compared with about 0.15 pounds per acre in 2001 (Fernandez-Cornejo and Li 2005).
12 This threshold may differ for adopters and non-adopters.

Fernandez-Cornejo and Wechsler Revisiting the Impact of Bt Corn Adoption by U.S. Farmers 387
Table 5. Results from the Impact Model, Corn Producers 2005: Derived Output and Input Equations
Variable Parameter Yield a Parameter Seed a Parameter Insecticidesa
Corn price Gyy 82.32*** Gy1 0.58*** Gy2 -1.22***
Seed price Gy1 0.58*** G11 -0.008*** G21 0.001
Insecticide price Gy2 -1.22*** G12 0.0007 G22 0.031***
Bt corn Fy1 65.27*** E11 0.09*** E21 0.02
Other insect infestations Fy2 -37.17** E12 -0.011 E22 0.10
Ind_Cbor Fy3 -13.26** E13 -0.02* E23 -0.04
Ind_Cwrm Fy4 8.01 E14 0.005 E24 0.08*
Heartland Fy5 21.86*** E15 0.024*** E25 -0.07
Precipitation Fy6 1.16 E16 -0.002 E26 -0.002
Education Fy7 -0.60 E17 0.02* E27 0.05
Constant Ay 82.78*** A1 0.27*** A2 -0.38** a P-values were calculated using the jackknifed standard errors. *** indicates that P < 0.01, ** indicates that P < 0.05, and * indi-cates that P < 0.10. Source: Model results.
Table 6. Results from the Impact Model, Corn 2005: Profit Equation
Variable Parameter Parameter Estimate a
SE, Using Standard Method
SE, Using Jackknife Method
Constant A0 -2.14 0.98 1.60
Corn Price Ay 82.78*** 9.37 7.15
Seed price A1 0.27*** 0.03 0.03
Insecticide price A2 -0.38** 0.12 0.17
Bt adoption C1 -3.36** 1.17 1.46
Other insect infestations C2 -0.25 0.81 1.34
Ind_cbor C3 1.08* 0.46 0.57
Ind_cwrm C4 -0.85** 0.38 0.37
Heartland C5 0.21 0.31 0.35
Precip C6 0.00 0.09 0.11
Education C7 -1.02* 0.50 0.53
(Corn Price)^2 Gyy 82.32*** 20.17 22.87
Corn price*seed price Gy1 0.58*** 0.09 0.09
Corn price*insecticide Price Gy2 -1.22*** 0.27 0.33
Corn price*Bt Adoption Fy1 65.27*** 13.40 13.86
Corn price*other Insect Infestations Fy2 -37.17** 12.27 13.57
Corn price*ind_cbor Fy3 -13.26** 6.25 5.88
Corn price*ind_cwrm Fy4 8.01 5.46 6.00
Corn price*Heartland Fy5 21.86*** 4.29 6.06
cont’d.
388 December 2012 Agricultural and Resource Economics Review
Table 6. Results from the Impact Model, Corn 2005: Profit Equation (cont’d.)
Variable Parameter Parameter Estimate a
SE, Using Standard Method
SE, Using Jackknife Method
Corn price*precip Fy6 1.16 0.84 0.82
Corn price*education Fy7 -0.60 4.76 4.93
(Seed price)^2 G11 -0.01*** 0.001 0.001
Seed price*insecticide price G12 0.001 0.001 0.001
(Insecticide price)^2 G22 0.03*** 0.01 0.01
Seed price*Bt adoption E11 0.09*** 0.02 0.02
Seed price*other insect infestations E12 -0.01 0.01 0.01
Seed price*ind_cbor E13 -0.02* 0.01 0.01
Seed price*ind_cwrm E14 0.005 0.01 0.01
Seed price*Heartland E15 0.02*** 0.01 0.00
Seed price*precip E16 -0.002 0.00 0.00
Seed price*education E17 0.02* 0.01 0.01
Insecticide price*Bt adoption E21 0.02 0.13 0.18
Insecticide price*other insect infestations E22 0.10 0.06 0.11
Insecticide price*ind_cbor E23 -0.04 0.06 0.09
Insecticide Price*ind_cwrm E24 0.08* 0.04 0.04
Insecticide Price*Heartland E25 -0.07 0.04 0.05
Insecticide Price*precip E26 -0.0020 0.01 0.01
Insecticide Price*education E27 0.05 0.06 0.08 1 P-values were calculated using jackknifed standard errors. *** indicates that P < 0.01, ** indicates that P < 0.05, and * indicates that P < 0.10. Source: Model results. Table 7. Elasticities, Insect-Resistant Corn (2005)
Variable Elasticity with Respect to the
Probability of Adoption
Profit 0.165
Yield 0.171
Seed 0.097
Insecticide NS
Note: NS = not significant. Source: Model results. Regression analysis confirms that Bt adoption is positively associated with increased variable profits, yields, and seeding rates. However, our results suggest that Bt adoption is not signifi-cantly related to insecticide use. This result ap-pears to be related to the fact that insect infesta-tion levels were lower in 2005 than they were in earlier years. The lower infestation levels are con-
sistent with the findings published in Science that areawide suppression of European corn borer is associated with Bt corn use. The implications of these results should be re-garded carefully, and only within the constraints of this analysis. The economic impacts of adopt-ing genetically engineered crops vary with pest infestations, seed premiums, and prices of alter-native pest control programs. Future work will examine the impact of new genetically engineered corn varieties that began to be commercialized in the United States in 2010 and which could offer additional corn yield gains by providing multiple Bt proteins with several modes of action that may result in more comprehensive insect control. References Baute, T.S., M.K. Sears, and A.W. Schaafsma. 2002. “Use of
Transgenic Bacillus thuringiensis Berliner Corn Hybrids to Determine the Direct Economic Impact of the European

Fernandez-Cornejo and Wechsler Revisiting the Impact of Bt Corn Adoption by U.S. Farmers 389
Corn Borer (Lepidoptera: Crambidae) on Field Corn in East-ern Canada.” Journal of Economic Entomology 95(1): 57–64.
Cappellari, L., and S. Jenkins. 2003. “Multivariate Probit Regression Using Simulated Maximum Likelihood.” Stata Journal 3(3): 278–294.
Diewert, W.E. 1974. “Applications of Duality Theory.” In M. Intriligator and D. Kendrick, eds., Frontiers of Quantitative Economics (Vol. II). Amsterdam: North-Holland.
Diewert, W.E., and L. Ostensoe. 1988. “Flexible Functional Forms and Global Curvature Conditions.” In W. Barnett, E. Berndt, and H. White, eds., Dynamic Econometric Model-ing. Boston: Cambridge University Press.
Dillehay, B.L., G.W. Roth, D.D. Calvin, R.J. Karatochvil, G.A. Kuldau, and J.A. Hyde. 2004. “Performance of Bt Corn Hybrids, Their Near Isolines, and Leading Corn Hy-brids in Pennsylvania and Maryland.” Agronomy Jour-nal 96(204): 818–824.
Duffy, M. 1999. “Does Planting GMO Seed Boost Farmers’ Profits?” Leopold Letter 11, Iowa State-Leopold Center for Sustainable Agriculture, Ames, Iowa. Available at http:// www.leopold.iastate.edu/news/leopold-letter/1999/fall/does -planting-gmo-seed-boost-farmers-profits (accessed May 18, 2012).
____. 2001. “Who Benefits from Biotechnology?” Paper pre-sented at the 2001 American Seed Trade Association meet-ing, Chicago, IL. Available at http://www2.econ.iastate. edu/faculty/duffy/Pages/biotechpaper.pdf (accessed May 18, 2012).
Fang, M., P.P. Motavalli, R.J. Kremer, and K.A. Nelson. 2007. “Assessing Changes in Soil Microbial Communities and Carbon Mineralization in Bt and non-Bt Corn Residue-Amended Soils.” Applied Soil Ecology 37(1): 150–160.
Feder, G., R. Just, and D. Zilberman. 1985. “Adoption of Ag-ricultural Innovations in Developing Countries: A Survey.” Economic Development and Cultural Change 33(2): 255–298.
Fernandez-Cornejo, J. 1996. “The Microeconomic Impact of IPM Adoption: Theory and Adoption.” Agricultural and Resource Economics Review 25(2): 149–160.
Fernandez-Cornejo, J., C. Hendricks, and A. Mishra. 2005. “Technology Adoption and Off-Farm Household Income: The Case of Herbicide-Tolerant Soybeans.” Journal of Ag-ricultural and Applied Economics 37(2): 549–563.
Fernandez-Cornejo, J., C. Klotz-Ingram, and S. Jans. 2002. “Farm-Level Effects of Adopting Herbicide-Tolerant Soy-beans in the U.S.A.” Journal of Agricultural and Applied Economics 34(1): 149–163.
Fernandez-Cornejo, J., and J. Li. 2005. “The Impacts of Adopt-ing Genetically Engineered Crops in the USA.” Paper pre-sented at the American Agricultural Economics Association meetings, July 24–27.
Fernandez-Cornejo, J., and W. McBride. 2002. “Adoption of Bioengineered Crops.” Agricultural Economic Report No. 810, Economic Research Service, U.S. Department of Agri-culture, Washington, D.C.
Gates, R. 2006. “A Mata Geweke-Hajivassiliou-Keane Multi-variate Normal Simulator.” Stata Journal 6(2): 190–213.
Geweke, J. 1989. “Bayesian Inference in Econometric Models Using Monte Carlo Integration.” Econometrica 57(6): 1317–1339.
Greene, W. 1997. Econometric Analysis (3rd edition). Upper Saddle River, NJ: Prentice-Hall.
Hajivassiliou, V., and D. McFadden. 1998. “The Method of Simulated Scores for the Estimation of LDV Models.” Econometrica 66(4): 863–896.
Heckman, J. 1979. “Sample Selection Bias as a Specification Error.” Econometrica 47(1): 153–161.
Hutchinson, W.D., E.C. Burkness, R.L. Hellmich, L.V. Kaster, T.E. Hunt, R.J. Wright, K. Pecinovsky, T.L. Rabaey, B.R. Flood, E.S. Raun, P.D. Mitchell, R.D. Moon, T.W. Leslie, S.J. Fleischer, M. Abrahamson, K.L. Hamilton, K.L. Stef-fey, and M.E. Gray. 2010. “Areawide Suppression of Euro-pean Corn Borer with BT Maize Reaps Savings to Non-Bt Maize Growers.” Science 330(6001): 222–225.
Hyde, J., M. Martin, P. Preckel, and R. Edwards. 1999. “The Economics of Bt Corn: Valuing Protection from the Euro-pean Corn Borer.” Review of Agricultural Economics 21(2): 442–454.
Keane, M.P. 1992. “A Note on Identification in the Multino-mial Probit Model.” Journal of Business and Economics Statistics 10(2): 193–200.
____. 1994. “A Computationally Practical Simulation Esti-mator for Panel Data.” Econometrica 62(1): 95–116.
Kott, P.S. 1998. “Using the Delete-a-Group Jackknife Vari-ance Estimator in NASS Surveys.” Research Report No. RD-98-01, National Agricultural Statistics Service, U.S. Department of Agriculture, Washington, D.C.
Kramer, M. 2005. “R2 Statistics for Mixed Models.” In J.E. Boyer, Jr., ed., Proceedings of the 17th Annual Kansas State University Conference on Applied Statistics in Agriculture. Manhattan, KS: Kansas State University Press.
Maddala, G.S. 1983. Limited Dependent and Qualitative Vari-ables in Econometrics. Cambridge, UK: Cambridge Uni-versity Press.
Magee, L. 1990. “R2 Measures Based on Wald and Likelihood Ratio Joint Significance Tests.” American Statistician 44(3): 250–253.
Matuschke, I., and M. Qaim. 2009. “The Impact of Social Net-works on Hybrid Seed Adoption in India.” Agricultural Economics 40(5): 493–505.
McBride, W., and H. El-Osta. 2003. “Impacts of the Adoption of Genetically Engineered Crops on Farm Financial Per-formance.” Journal of Agricultural and Applied Economics 34(1): 175–191.
Mitchell, P., T. Hurley, and M. Rice. 2004. “Is Bt Corn Really a Drag? Bt Corn Yield Drag and Yield Variance.” Faculty Paper Series No. FP 04-01, Department of Agricultural Eco-nomics, Texas A&M University, College Station, Texas.
Mungai, N.W., P.P. Motavalli, K.A. Nelson, and R.J. Kremer. 2005. “Differences in Yields, Residue Composition and N Mineralization Dynamics of Bt and non-Bt Maize.” Nutri-ent Cycling in Agroecosystems 73(1): 101–109.
National Research Council (NRC). 2010. The Impact of Ge-netically Engineered Crops on Farm Sustainability in the

390 December 2012 Agricultural and Resource Economics Review
United States. Washington, D.C.: The National Academies Press.
Pilcher, C.D., and M.E. Rice. 1998. “Management of Euro-pean Corn Borer (Lepidoptera: Crambidae) and Corn Root-worms (Coleoptera: Chrysomelidae) with Transgenic Corn: A Survey of Farmer Perceptions.” American Entomologist 44(1): 36–44.
Pilcher, C.D., M.E. Rice, R.A. Higgins, K.L. Steffey, R.L. Hellmich, J. Witowski, D. Calvin, K.R. Ostlie, and M. Gray. 2002. “Biotechnology and the European Corn Borer: Measuring Historical Farmer Perceptions and Adoption of Transgenic Bt Corn as a Pest Management Strategy.” Journal of Economic Entomology 95(5): 878–892.
Roodman, D. 2009. “Estimating Fully Observed Recursive Mixed-Process Models with cmp.” Working Paper No. 168, Center for Global Development, Washington, D.C.
U.S. Department of Agriculture. 2002. “Agricultural Chemical Usage 2002 Field Crops Summary.” National Agricultural Statistics Service, U.S. Department of Agriculture, Wash-ington, D.C.
____. 2006. “Agricultural Chemical Usage 2006 Field Crops Summary.” National Agricultural Statistics Service, U.S. Department of Agriculture, Washington, D.C.
Wilson, T., M. Rice, J. Tollefson, and C. Pilcher. 2005. “Trans-genic Corn for Control of the European Corn Borer and Corn Rootworms: A Survey of Midwestern Farmers’ Prac-tices and Perceptions.” Journal of Economic Entomol-ogy 98(2): 237–247.