Revisiting battery modeling using the energy power...
4
Revisiting battery modeling using the energy power supply concept Arturo Fajardo Jaimes *† * Department of Electronics Engineering Pontifical Xavierian University, Bogota, Colombia Email: [email protected] Fernando Rangel de Sousa † † Radiofrequency Laboratory Department of Electrical and Electronics Engineering Federal University of Santa Catarina (UFSC), Florianpolis, Brazil Email: [email protected] Abstract—Using the energy power supply concept, this paper proposes a DC voltage source with limited energy storage capac- ity, which models: the energy storage capacity of the batteries, the involved energy transfer process and the constant voltage output behavior when the battery has storage energy. Further, this circuit source is used for understanding the combined electrical circuit- based battery model, which is commonly used for designing of: portable electronic devices, hybrid electric vehicles and smart grid systems. Keywords—Battery modeling, electrical circuit-based battery model, Energy, Power, DC source. I. I NTRODUCTION The energy storage devices have a wide application span. Recently, the battery technologies have been receiving huge attention because three commercial applications, whose push the batteries to its limits [1]. These are: portable electronic de- vices (PEDs), hybrid electric vehicles and smart grid systems. In the design of PEDs, the trade-off between functionality (i.e. dissipated power) and portability (i.e. battery running time, weight, size) [2] must be faced. Typically, the device portability is associated to the battery because it is the least likely element to change in the development cycle of the product [3]. Without battery models in hand, circuit designers cannot predict nor optimize either battery runtime or circuit performance. In order to integrate the batteries as energy storage devices into the smart grid, it is important to evaluate the utilization of them in the system [4], in terms of cost (e.g. maintenance), Lifetime (measured by the charge discharge cycles and calendar life of the battery), power delivery (i.e. chargedischarge rate, energy storage level, ramp rate, and chargedischarge efficiency), envi- ronmental impact and safety. This evaluation is much cheaper if it is made by electrical simulation instead of prototyping [5]. However, the simulation results are dependent on the accuracy of battery model. The electric vehicle industry use large battery packs in demanding applications that involve high power charge and discharge rates, with high service life [6]. An accurate and efficient battery model is vital to increase the performance of the driver and its battery, and to inform its development to the control systems [4]. Battery modeling is a broad and complicated field, with no single model capable of meeting the requirements for all applications. The battery models may be classified as physical models, analytical models, and circuit-based models [1], [6]. The physical models are mainly used to optimize the physical design aspects of batteries, they capture the V=f(SoC) I=g(i s ) Energy storage circuit SoC Load Voltage response circuit i s Fig. 1. Combined electrical–circuit based model. fundamental mechanisms of power generation. The analytical models adopt empirical equations (e.g. math fitting of empir- ical data) to predict system-level behaviors, such as battery runtime, efficiency, or capacity. The circuit-based models use a combination of circuit elements (i.e. voltage sources, resistors, and capacitors) to predict the I–V information of the battery. For electrical engineers, this circuit models are more intuitive, useful, and easy to handle, especially when they can be used in circuit simulators (i.e. compatible with spice models) for co-simulation with other circuits. This paper focus on the circuit-based models proposed in [7], which was referenced as the combined electrical circuit- based model (CECBM) by [1], [6]. This model is commonly used for designing of: portable electronic devices, hybrid electric vehicles and smart grid system, because it is capable to predict accurately the DC voltage response, the runtime and the transient. Further, it was modified by [8]–[11] for capturing some nonlinear behaviors (e.g. the C-rate effect, state of health (SoH) of the battery). These family of models (illustrated in Fig. 1) are based on two separate circuits: energy storage circuit and voltage response circuit, these circuits are coupled by a nonlinear relation (i.e. f and g) that models the energy flow process. These models have been used without a comprehensive development about the inspiration of its topology, and the simple energy flow process that models. In this paper the electric Energy Power Supply (EPS) concept is presented, and a DC voltage source with limited energy storage capacity was proposed. Further, we use this component for understanding the behaviors captured by the CECBM. II. ENERGY POWER SUPPLY (EPS) CONCEPTS A. Energy flow process An EPS is a system that supplies electrical energy to a load. The load energy (E L ) is the energy delivered by the EPS and consumed by the load during a time interval, this energy can be calculated as the integral with respect to time
Transcript of Revisiting battery modeling using the energy power...

Revisiting battery modeling using the energy powersupply concept
Arturo Fajardo Jaimes∗†∗ Department of Electronics Engineering
Pontifical Xavierian University, Bogota, ColombiaEmail: [email protected]
Fernando Rangel de Sousa †† Radiofrequency Laboratory
Department of Electrical and Electronics EngineeringFederal University of Santa Catarina (UFSC), Florianpolis, Brazil
Email: [email protected]
Abstract—Using the energy power supply concept, this paperproposes a DC voltage source with limited energy storage capac-ity, which models: the energy storage capacity of the batteries, theinvolved energy transfer process and the constant voltage outputbehavior when the battery has storage energy. Further, this circuitsource is used for understanding the combined electrical circuit-based battery model, which is commonly used for designing of:portable electronic devices, hybrid electric vehicles and smartgrid systems.
Keywords—Battery modeling, electrical circuit-based batterymodel, Energy, Power, DC source.
I. INTRODUCTION
The energy storage devices have a wide application span.Recently, the battery technologies have been receiving hugeattention because three commercial applications, whose pushthe batteries to its limits [1]. These are: portable electronic de-vices (PEDs), hybrid electric vehicles and smart grid systems.In the design of PEDs, the trade-off between functionality (i.e.dissipated power) and portability (i.e. battery running time,weight, size) [2] must be faced. Typically, the device portabilityis associated to the battery because it is the least likely elementto change in the development cycle of the product [3]. Withoutbattery models in hand, circuit designers cannot predict noroptimize either battery runtime or circuit performance. In orderto integrate the batteries as energy storage devices into thesmart grid, it is important to evaluate the utilization of themin the system [4], in terms of cost (e.g. maintenance), Lifetime(measured by the charge discharge cycles and calendar life ofthe battery), power delivery (i.e. chargedischarge rate, energystorage level, ramp rate, and chargedischarge efficiency), envi-ronmental impact and safety. This evaluation is much cheaperif it is made by electrical simulation instead of prototyping[5]. However, the simulation results are dependent on theaccuracy of battery model. The electric vehicle industry uselarge battery packs in demanding applications that involve highpower charge and discharge rates, with high service life [6].An accurate and efficient battery model is vital to increase theperformance of the driver and its battery, and to inform itsdevelopment to the control systems [4].
Battery modeling is a broad and complicated field, withno single model capable of meeting the requirements forall applications. The battery models may be classified asphysical models, analytical models, and circuit-based models[1], [6]. The physical models are mainly used to optimizethe physical design aspects of batteries, they capture the
V=f(SoC)
I=g(is)
Energy
storage
circuitSoC
Load
Voltage
response
circuit
is
Fig. 1. Combined electrical–circuit based model.
fundamental mechanisms of power generation. The analyticalmodels adopt empirical equations (e.g. math fitting of empir-ical data) to predict system-level behaviors, such as batteryruntime, efficiency, or capacity. The circuit-based models use acombination of circuit elements (i.e. voltage sources, resistors,and capacitors) to predict the I–V information of the battery.For electrical engineers, this circuit models are more intuitive,useful, and easy to handle, especially when they can be usedin circuit simulators (i.e. compatible with spice models) forco-simulation with other circuits.
This paper focus on the circuit-based models proposed in[7], which was referenced as the combined electrical circuit-based model (CECBM) by [1], [6]. This model is commonlyused for designing of: portable electronic devices, hybridelectric vehicles and smart grid system, because it is capableto predict accurately the DC voltage response, the runtimeand the transient. Further, it was modified by [8]–[11] forcapturing some nonlinear behaviors (e.g. the C-rate effect,state of health (SoH) of the battery). These family of models(illustrated in Fig. 1) are based on two separate circuits: energystorage circuit and voltage response circuit, these circuits arecoupled by a nonlinear relation (i.e. f and g) that models theenergy flow process. These models have been used withouta comprehensive development about the inspiration of itstopology, and the simple energy flow process that models. Inthis paper the electric Energy Power Supply (EPS) concept ispresented, and a DC voltage source with limited energy storagecapacity was proposed. Further, we use this component forunderstanding the behaviors captured by the CECBM.
II. ENERGY POWER SUPPLY (EPS) CONCEPTS
A. Energy flow process
An EPS is a system that supplies electrical energy to aload. The load energy (EL) is the energy delivered by theEPS and consumed by the load during a time interval, thisenergy can be calculated as the integral with respect to time
of the instantaneous power (PL) at the terminals of the load,this energy is supplied by the combination of current (iL)and voltage (vL) therefore, the energy flow process can bedescribed as:
PL(t) =dEL (t)
dt= vL (t) iL (t) ; (1)
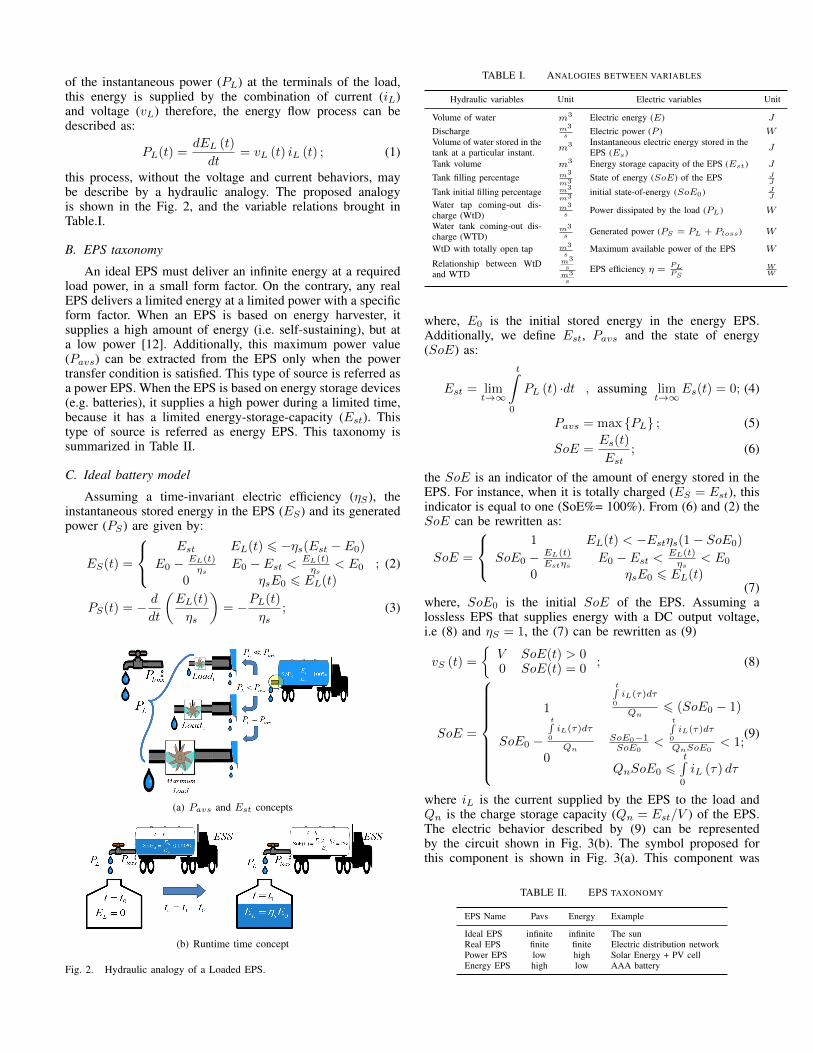
this process, without the voltage and current behaviors, maybe describe by a hydraulic analogy. The proposed analogyis shown in the Fig. 2, and the variable relations brought inTable.I.
B. EPS taxonomy
An ideal EPS must deliver an infinite energy at a requiredload power, in a small form factor. On the contrary, any realEPS delivers a limited energy at a limited power with a specificform factor. When an EPS is based on energy harvester, itsupplies a high amount of energy (i.e. self-sustaining), but ata low power [12]. Additionally, this maximum power value(Pavs) can be extracted from the EPS only when the powertransfer condition is satisfied. This type of source is referred asa power EPS. When the EPS is based on energy storage devices(e.g. batteries), it supplies a high power during a limited time,because it has a limited energy-storage-capacity (Est). Thistype of source is referred as energy EPS. This taxonomy issummarized in Table II.
C. Ideal battery model
Assuming a time-invariant electric efficiency (ηS), theinstantaneous stored energy in the EPS (ES) and its generatedpower (PS) are given by:
ES(t) =
Est
E0 − EL(t)ηs
0
EL(t) 6 −ηs(Est − E0)
E0 − Est < EL(t)ηs
< E0
ηsE0 6 EL(t)
; (2)
PS(t) = −d
dt
(EL(t)
ηs
)= −PL(t)
ηs; (3)
(a) Pavs and Est concepts
(b) Runtime time concept
Fig. 2. Hydraulic analogy of a Loaded EPS.
TABLE I. ANALOGIES BETWEEN VARIABLES
Hydraulic variables Unit Electric variables Unit
Volume of water m3 Electric energy (E) J
Discharge m3
sElectric power (P ) W
Volume of water stored in thetank at a particular instant. m3 Instantaneous electric energy stored in the
EPS (Es) J
Tank volume m3 Energy storage capacity of the EPS (Est) J
Tank filling percentage m3
m3 State of energy (SoE) of the EPS JJ
Tank initial filling percentage m3
m3initial state-of-energy (SoE0) J
J
Water tap coming-out dis-charge (WtD)
m3
sPower dissipated by the load (PL) W
Water tank coming-out dis-charge (WTD)
m3
sGenerated power (PS = PL + Ploss) W
WtD with totally open tap m3
sMaximum available power of the EPS W
Relationship between WtDand WTD
m3
sm3s
EPS efficiency η =PLPS
WW
where, E0 is the initial stored energy in the energy EPS.Additionally, we define Est, Pavs and the state of energy(SoE) as:
Est = limt→∞
t∫0
PL (t) ·dt , assuming limt→∞
Es(t) = 0; (4)
Pavs = max {PL} ; (5)
SoE =Es(t)
Est; (6)
the SoE is an indicator of the amount of energy stored in theEPS. For instance, when it is totally charged (ES = Est), thisindicator is equal to one (SoE%= 100%). From (6) and (2) theSoE can be rewritten as:
SoE =
1
SoE0 − EL(t)Estηs
0
EL(t) < −Estηs(1− SoE0)
E0 − Est < EL(t)ηs
< E0
ηsE0 6 EL(t)(7)
where, SoE0 is the initial SoE of the EPS. Assuming alossless EPS that supplies energy with a DC output voltage,i.e (8) and ηS = 1, the (7) can be rewritten as (9)
vS (t) =
{V SoE(t) > 00 SoE(t) = 0
; (8)
SoE =
1
SoE0 −
t∫0
iL(τ)dτ
Qn
0
t∫0
iL(τ)dτ
Qn6 (SoE0 − 1)
SoE0−1SoE0
<
t∫0
iL(τ)dτ
QnSoE0< 1;
QnSoE0 6t∫
0
iL (τ) dτ
(9)
where iL is the current supplied by the EPS to the load andQn is the charge storage capacity (Qn = Est/V ) of the EPS.The electric behavior described by (9) can be representedby the circuit shown in Fig. 3(b). The symbol proposed forthis component is shown in Fig. 3(a). This component was
TABLE II. EPS TAXONOMY
EPS Name Pavs Energy Example
Ideal EPS infinite infinite The sunReal EPS finite finite Electric distribution networkPower EPS low high Solar Energy + PV cellEnergy EPS high low AAA battery
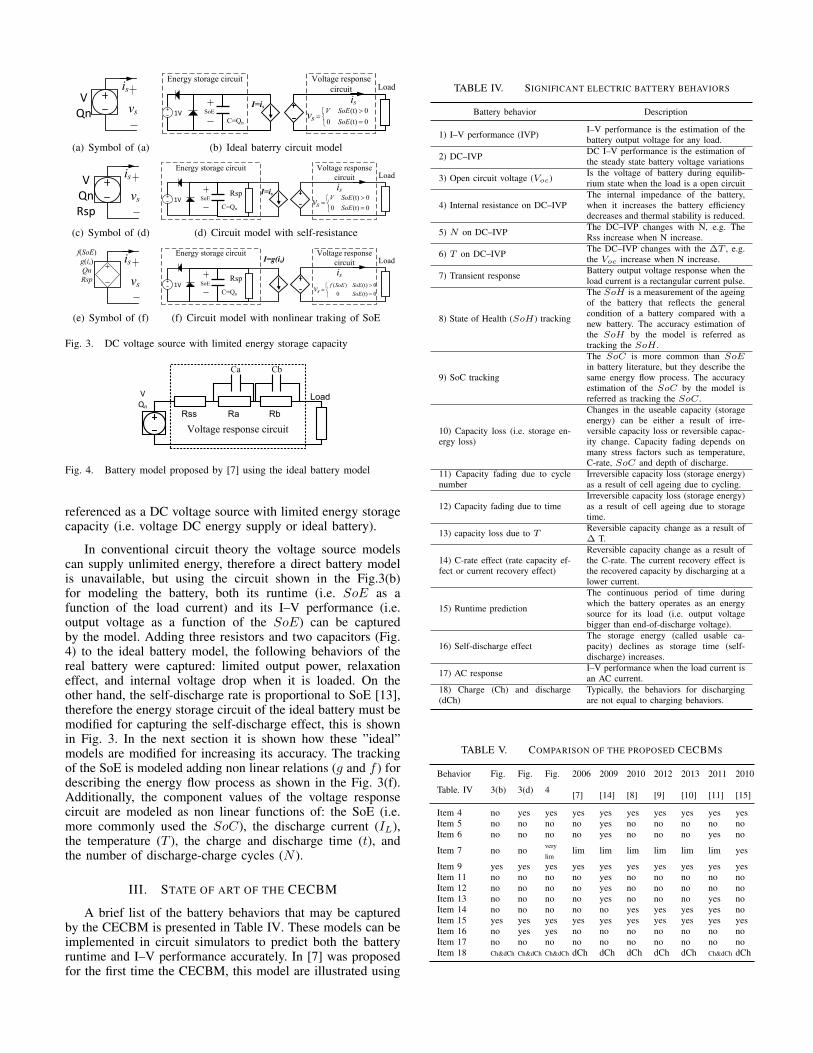
VQn vs
is
(a) Symbol of (a)
C=Qn
SoE
isI=is
Energy storage circuitLoad
1V (t) 0
0 (t) 0
V SoE
SoEsv
Voltage response
circuit
(b) Ideal baterry circuit model
VQnRsp
vs
is
(c) Symbol of (d)
C=Qn
SoE
isI=is
Energy storage circuitLoad
1V (t) 0
0 (t) 0
V SoE
SoEsv
Voltage response
circuit
Rsp
(d) Circuit model with self-resistance
f(SoE)
g(is)
Qn
Rsp vs
is
(e) Symbol of (f)
C=Qn
SoE
is
I=g(is)Energy storage circuit
Load
1V ( ) (t) 0
0 (t) 0
f SoE SoE
SoEsv
Voltage response
circuit
Rsp
(f) Circuit model with nonlinear traking of SoE
Fig. 3. DC voltage source with limited energy storage capacity
VQn
Rss Ra
Ca
Rb
Cb
Load
Voltage response circuit
Fig. 4. Battery model proposed by [7] using the ideal battery model
referenced as a DC voltage source with limited energy storagecapacity (i.e. voltage DC energy supply or ideal battery).
In conventional circuit theory the voltage source modelscan supply unlimited energy, therefore a direct battery modelis unavailable, but using the circuit shown in the Fig.3(b)for modeling the battery, both its runtime (i.e. SoE as afunction of the load current) and its I–V performance (i.e.output voltage as a function of the SoE) can be capturedby the model. Adding three resistors and two capacitors (Fig.4) to the ideal battery model, the following behaviors of thereal battery were captured: limited output power, relaxationeffect, and internal voltage drop when it is loaded. On theother hand, the self-discharge rate is proportional to SoE [13],therefore the energy storage circuit of the ideal battery must bemodified for capturing the self-discharge effect, this is shownin Fig. 3. In the next section it is shown how these ”ideal”models are modified for increasing its accuracy. The trackingof the SoE is modeled adding non linear relations (g and f ) fordescribing the energy flow process as shown in the Fig. 3(f).Additionally, the component values of the voltage responsecircuit are modeled as non linear functions of: the SoE (i.e.more commonly used the SoC), the discharge current (IL),the temperature (T ), the charge and discharge time (t), andthe number of discharge-charge cycles (N ).
III. STATE OF ART OF THE CECBM
A brief list of the battery behaviors that may be capturedby the CECBM is presented in Table IV. These models can beimplemented in circuit simulators to predict both the batteryruntime and I–V performance accurately. In [7] was proposedfor the first time the CECBM, this model are illustrated using
TABLE IV. SIGNIFICANT ELECTRIC BATTERY BEHAVIORS
Battery behavior Description
1) I–V performance (IVP) I–V performance is the estimation of thebattery output voltage for any load.
2) DC–IVP DC I–V performance is the estimation ofthe steady state battery voltage variations
3) Open circuit voltage (Voc) Is the voltage of battery during equilib-rium state when the load is a open circuit
4) Internal resistance on DC–IVPThe internal impedance of the battery,when it increases the battery efficiencydecreases and thermal stability is reduced.
5) N on DC–IVP The DC–IVP changes with N, e.g. TheRss increase when N increase.
6) T on DC–IVP The DC–IVP changes with the ∆T , e.g.the Voc increase when N increase.
7) Transient response Battery output voltage response when theload current is a rectangular current pulse.
8) State of Health (SoH) tracking
The SoH is a measurement of the ageingof the battery that reflects the generalcondition of a battery compared with anew battery. The accuracy estimation ofthe SoH by the model is referred astracking the SoH .
9) SoC tracking
The SoC is more common than SoEin battery literature, but they describe thesame energy flow process. The accuracyestimation of the SoC by the model isreferred as tracking the SoC.
10) Capacity loss (i.e. storage en-ergy loss)
Changes in the useable capacity (storageenergy) can be either a result of irre-versible capacity loss or reversible capac-ity change. Capacity fading depends onmany stress factors such as temperature,C-rate, SoC and depth of discharge.
11) Capacity fading due to cyclenumber
Irreversible capacity loss (storage energy)as a result of cell ageing due to cycling.
12) Capacity fading due to timeIrreversible capacity loss (storage energy)as a result of cell ageing due to storagetime.
13) capacity loss due to T Reversible capacity change as a result of∆ T.
14) C-rate effect (rate capacity ef-fect or current recovery effect)
Reversible capacity change as a result ofthe C-rate. The current recovery effect isthe recovered capacity by discharging at alower current.
15) Runtime prediction
The continuous period of time duringwhich the battery operates as an energysource for its load (i.e. output voltagebigger than end-of-discharge voltage).
16) Self-discharge effectThe storage energy (called usable ca-pacity) declines as storage time (self-discharge) increases.
17) AC response I–V performance when the load current isan AC current.
18) Charge (Ch) and discharge(dCh)
Typically, the behaviors for dischargingare not equal to charging behaviors.
TABLE V. COMPARISON OF THE PROPOSED CECBMS
Behavior Fig. Fig. Fig. 2006 2009 2010 2012 2013 2011 2010
Table. IV 3(b) 3(d) 4 [7] [14] [8] [9] [10] [11] [15]
Item 4 no yes yes yes yes yes yes yes yes yesItem 5 no no no no yes no no no no noItem 6 no no no no yes no no no yes no
Item 7 no no very
limlim lim lim lim lim lim yes
Item 9 yes yes yes yes yes yes yes yes yes yesItem 11 no no no no yes no no no no noItem 12 no no no no yes no no no no noItem 13 no no no no yes no no no yes noItem 14 no no no no no yes yes yes yes noItem 15 yes yes yes yes yes yes yes yes yes yesItem 16 no yes yes no no no no no no noItem 17 no no no no no no no no no noItem 18 Ch&dCh Ch&dCh Ch&dCh dCh dCh dCh dCh dCh Ch&dCh dCh

TABLE III. COMPARISON OF THE CIRCUIT VALUES DEPENDENCES ON THE ANALYZED MODELS
Model Fig. Fig. Fig. 2006 2009 2010 2012 2013 2011param. 3(b) 3(d) 4 [7] [14] [8] [9] [10] [11]
Qn Nominal Nominal Nominal Nominal Nominal Nominal Nominal Nominal NominalRsp infinite Nominal Nominal infinite infinite infinite infinite infinite infiniteRss 0 0 Nominal h(SoC) h(SoC) h(SoC) h(SoC) m(SoC, is) q(SOC, T, abs(is), sgn(is))Ra,Rb 0 0 Fixed h(SoC) h(SoC) h(SoC) h(SoC) m(SoC, is) q(SOC, T, abs(is), sgn(is))Ca,Cb infinite infinite Fixed h(SoC) h(SoC) h(SoC) h(SoC) m(SoC, is) q(SOC, T, abs(is), sgn(is))g g(is) = is g(is) = is g(is) = is g(is) = is g(is) = is/CF l(is, t) l(is, t) l(abs(is)) n(abs(is), sgn(is), T )
fsgn(SoE) f(SoE) = V f(SoE) = V h(SoE) h(SoE) p(SoE, T ) h(SoE) h(SoE) h(SoE) h(SoE)
the ideal battery model in the Fig. 4, all component valuesof the voltage response circuit were proposed as a nonlinearfunctions of the SoC. In [15], the impact of the complexity ofthe voltage response circuit in the capture of transient responsewas analyzed. The authors demonstrate that with more thantwo RC circuits the battery model gives better accuracy. Onthe other hand, to improve the basic model with the captureof the C-rate effect, in [8] was used a more complex energybalance circuit based on a non linear tracking of the SoC, thiscircuit reflects the non linear decrease in the battery capacity(i.e. storage energy) when the discharge current increase.Other approach for modeling the C-rate effect was proposedin [9], they replace the energy balanced circuit for a mathmodel based on the Kinetic Battery Model (KiBaM), theseequations may be interpreted as nonlinear function of boththe charging current and the time. In [14] was developeda battery model that captures the capacity fading effects,they propose a capacity correction factor as a non linearfunction of the storage time, temperature and cycle number,this factor may be also interpreted as a current correct factor.Recently, in [10] was proposed that the model parameterscan be described as non linear functions of the SOC andthe discharge current. Further, a more complex model wasproposed in [11], they used empirical equations to describethe model parameters as nonlinear functions of: the currentdirection, the state of charge (SoC), the temperature, and C-rate. The brief comparison, illustrated in Table V, indicates themodeling road-map of the CECBM. From the designer pointof view, the better model is the one that captures accuratelythe interest battery behaviors with minimum computationalcomplexity, maximum flexibility, and stability. In the TableIII is summarized the input variables used for extracting thecircuit values of the models. The functions listed in thistable (h(x), p(x1, x2), l(x1, x2),m(x1, x2), q(x1, x2, x3, x4))are non linear equations that were fitted using the experimentaldata.
IV. CONCLUSIONS
The proposed DC voltage source with limited energystorage capacity was used for understanding the combinedelectrical circuit-based battery model. Further, it was presenteda comprehensive state-of-the-art review of the progress that hasbeen made on this battery model. Furthermore, a comprehen-sive development of the energy power supply concept and theenergy flow process was presented and used for comparisonof the analyzed models.
ACKNOWLEDGMENT
The first author would like to thank COLCIENCIAS andthe Pontificia Universidad Javeriana for the financial support.
REFERENCES
[1] M. Nikdel et al., “Various battery models for various simulation studiesand applications,” Renewable and Sustainable Energy Reviews, vol. 32,pp. 477–485, 2014.
[2] S. D’Ambrosio, S. De Pasquale, G. Iannone, D. Malandrino, A. Negro,G. Patimo, A. Petta, V. Scarano, L. Serra, and R. Spinelli, “Mobilephone batteries draining: Is green web browsing the solution?” in GreenComputing Conference (IGCC), 2014 International, Nov 2014, pp. 1–10.
[3] R. W. Erickson and D. Maksimovic, Fundamentals of power electronics.Springer, 2001.
[4] H. Rahimi-Eichi, U. Ojha, F. Baronti, and M. Chow, “Battery man-agement system: An overview of its application in the smart grid andelectric vehicles,” Industrial Electronics Magazine, IEEE, vol. 7, no. 2,pp. 4–16, June 2013.
[5] N. Windarko, J. Choi, and G.-B. Chung, “Improvement of electricalmodeling of nimh battery for application of microgrid system,” inEnergy Conversion Congress and Exposition (ECCE), 2010 IEEE, Sept2010, pp. 4243–4248.
[6] A. Seaman, T.-S. Dao, and J. McPhee, “A survey of mathematics-basedequivalent-circuit and electrochemical battery models for hybrid andelectric vehicle simulation,” Journal of Power Sources, vol. 256, pp.410–423, 2014.
[7] M. Chen and G. A. Rincon-Mora, “Accurate electrical battery modelcapable of predicting runtime and iv performance,” Energy conversion,ieee transactions on, vol. 21, no. 2, pp. 504–511, 2006.
[8] J. Zhang, S. Ci, H. Sharif, and M. Alahmad, “An enhanced circuit-basedmodel for single-cell battery,” in Applied Power Electronics Conferenceand Exposition (APEC), 2010 Twenty-Fifth Annual IEEE, Feb 2010, pp.672–675.
[9] T. Kim and W. Qiao, “A hybrid battery model capable of capturingdynamic circuit characteristics and nonlinear capacity effects,” in Powerand Energy Society General Meeting, 2012 IEEE, July 2012, pp. 1–1.
[10] L. W. Yao, J. Aziz, P. Y. Kong, and N. Idris, “Modeling of lithium-ion battery using matlab/simulink,” in Industrial Electronics Society,IECON 2013 - 39th Annual Conference of the IEEE, Nov 2013, pp.1729–1734.
[11] L. Lam, P. Bauer, and E. Kelder, “A practical circuit-based model for li-ion battery cells in electric vehicle applications,” in TelecommunicationsEnergy Conference (INTELEC), 2011 IEEE 33rd International, Oct2011, pp. 1–9.
[12] G. A. Rincon-Mora, “Powering microsystems with ambient energy.”CRC Press, 2013, pp. 1–30.
[13] M. W. Verbrugge and R. S. Conell, “Electrochemical and thermalcharacterization of battery modules commensurate with electric vehicleintegration,” Journal of the Electrochemical Society, vol. 149, no. 1, pp.A45–A53, 2002.
[14] O. Erdinc, B. Vural, and M. Uzunoglu, “A dynamic lithium-ion batterymodel considering the effects of temperature and capacity fading,” inClean Electrical Power, 2009 International Conference on, June 2009,pp. 383–386.
[15] H. Zhang and M.-Y. Chow, “Comprehensive dynamic battery modelingfor phev applications,” in Power and Energy Society General Meeting,2010 IEEE, July 2010, pp. 1–6.