Revision 2 Hydrogen incorporation and the oxidation state ... · 1 1 Revision 2 2 3 Hydrogen...
33
1 Revision 2 1 2 Hydrogen incorporation and the oxidation state of iron in ringwoodite – a spectroscopic 3 study 4 Maria Mrosko 1 , Stephan Lenz 2 , Catherine A McCammon 3 , Michail Taran 4 , Richard Wirth 1 , 5 Monika Koch-Mueller 1 6 1 Chemistry and Physics of Earth Materials, GFZ Potsdam, Potsdam, Germany. Email: 7 [email protected] 8 2 Institute for Applied Geosciences, Technical University Berlin, Berlin, Germany. 9 3 Bayerisches Geoinstitut, University of Bayreuth, Bayreuth, Germany. 10 4 Institute of Geochemistry, Mineralogy and Ore Formation, National Academy of Sciences of 11 Ukraine, Kiev, Ukraine. 12 13 14 Abstract 15 We conducted several multi-anvil-experiments to synthesize iron-bearing (0.11≤x Fe ≤0.24) 16 hydrous ringwoodite under oxidizing and reducing conditions. The experiments were 17 performed at 1200 °C and pressures between 16.5 and 18.3 GPa. The incorporation of 18 hydrogen and iron in ringwoodite was studied using FTIR, MB, UV-VIS and EEL 19 spectroscopy. For MB spectroscopy, ringwoodite enriched in 57 Fe was synthesized. The IR 20 spectra of ringwoodite show a broad OH band around 3150 cm -1 and two shoulders on the 21 high-energy side: one intense at 3680 cm -1 and one weak at around 3420 cm -1 . The water 22 content of the samples was determined using FTIR spectroscopy to have a maximum value of 23 1.9 (3) wt% H 2 O. UV-VIS spectra display a broad band around 12700 cm -1 and a shoulder at 24 9900 cm -1 representing the spin allowed dd-transitions of VI Fe 2+ . The weaker band around 25 18200 cm -1 is a distinct feature of Fe 2+ - Fe 3+ intervalence charge transfer indicating the 26
Transcript of Revision 2 Hydrogen incorporation and the oxidation state ... · 1 1 Revision 2 2 3 Hydrogen...
1
Revision 2 1
2
Hydrogen incorporation and the oxidation state of iron in ringwoodite – a spectroscopic 3
study 4
Maria Mrosko1, Stephan Lenz2, Catherine A McCammon3, Michail Taran4, Richard Wirth1, 5
Monika Koch-Mueller1 6
1Chemistry and Physics of Earth Materials, GFZ Potsdam, Potsdam, Germany. Email: 7
2Institute for Applied Geosciences, Technical University Berlin, Berlin, Germany. 9
3Bayerisches Geoinstitut, University of Bayreuth, Bayreuth, Germany. 10
4Institute of Geochemistry, Mineralogy and Ore Formation, National Academy of Sciences of 11
Ukraine, Kiev, Ukraine. 12
13
14
Abstract 15
We conducted several multi-anvil-experiments to synthesize iron-bearing (0.11≤xFe≤0.24) 16
hydrous ringwoodite under oxidizing and reducing conditions. The experiments were 17
performed at 1200 °C and pressures between 16.5 and 18.3 GPa. The incorporation of 18
hydrogen and iron in ringwoodite was studied using FTIR, MB, UV-VIS and EEL 19
spectroscopy. For MB spectroscopy, ringwoodite enriched in 57Fe was synthesized. The IR 20
spectra of ringwoodite show a broad OH band around 3150 cm-1 and two shoulders on the 21
high-energy side: one intense at 3680 cm-1 and one weak at around 3420 cm-1. The water 22
content of the samples was determined using FTIR spectroscopy to have a maximum value of 23
1.9 (3) wt% H2O. UV-VIS spectra display a broad band around 12700 cm-1 and a shoulder at 24
9900 cm-1 representing the spin allowed dd-transitions of VIFe2+. The weaker band around 25
18200 cm-1 is a distinct feature of Fe2+ - Fe3+ intervalence charge transfer indicating the 26

2
presence of Fe3+ in the samples. EEL spectra yield Fe3+ fractions ranging from 6 (3) at 27
reducing conditions to 12 (3) % at oxidizing conditions. 28
We performed heating experiments up to 600 °C in combination with in situ FTIR 29
spectroscopy to evaluate the temperature dependent behavior of ringwoodite, especially with 30
respect to hydrogen incorporation. We observed a color change of ringwoodite from blue to 31
green to brown. The heat treated samples displayed hydrogen loss, an irreversible 32
rearrangement of part of the hydrogen atoms (FTIR), as well as oxidation of Fe2+ to Fe3+ 33
evidenced by the appearance of the spin forbidden dd-transition band for Fe3+ and the ligand-34
metal (O2- - Fe3+) transition band in the optical spectra. An increased Fe3+ fraction was also 35
revealed by EEL and MB spectroscopy (up to 16 % Fe3+/ΣFe). Analyses of MB data revealed 36
the possibility of tetrahedral Fe3+ in the annealed ringwoodite. 37
These results lead to a reinterpretation of the broad OH band, which is a combination of 38
several bands, mainly [VMg(OH)2]x), a weaker high-energy band at 3680 cm-1 ([VSi(OH)4]x) 39
and a shoulder at 3420 cm-1 ([(Mg/Fe)Si(OH)2]x). 40
41
Keywords: ringwoodite, water, iron, oxygen fugacity, hydrogen location, spectroscopy 42
43
Introduction 44
Ringwoodite is the most abundant mineral in the lower part of the transition zone in the 45
Earth’s mantle. The transition from the orthorhombic β-polymorph (wadsleyite) to the high-46
pressure γ-polymorph of (Mg,Fe)2SiO4 (ringwoodite) is believed to cause the discontinuity in 47
seismic wave velocity at 520 km depth, where ringwoodite has the cubic spinel structure with 48
space group Fd3m . Ringwoodite belongs to the group of nominally anhydrous minerals, but 49
can incorporate up to 2.5 wt% water as OH- via point defects (e.g. Kohlstedt et al. 1996; 50
Kudoh et al. 2000). The location of hydrogen within the structure is still an object of diverse 51
discussion, since the cubic structure of ringwoodite becomes more complex as shown for 52

3
example by polarized Fourier transform infrared (FTIR) spectroscopy. Kudoh et al. (2000) 53
proposed that the broad IR-active band around 3165 cm-1 indicates the location of hydrogen 54
atoms between O-O pairs of the 16c (vacant) and the 16d (partially vacant) octahedral sites. In 55
contrast, Smyth et al. (2003) and Chamorro et al. (2006) assigned that broad band to 56
protonation of tetrahedral edges. The latter authors also stated that the smaller high-energy 57
band at 3679 cm-1 is caused by hydrogen located at octahedral edges. The above mentioned 58
studies all indicate octahedral vacancies and Mg-Si disorder as potential charge balancing 59
mechanisms for the hydrogen incorporation. Blanchard et al. (2009) likewise support the idea 60
of OH defects associated not only with octahedral vacancies but also with partial cationic 61
inversion of the structure. Based on a first-principles study they assigned the broad OH-band 62
to protonation of octahedral edges (similar to Kudoh et al. 2000) and suggested a 63
hydrogarnet-type defect for the smaller band at app. 3675 cm-1. 64
The question of where hydrogen atoms are located in the structure becomes more 65
complex when iron is present in the system, because additional factors such as iron oxidation 66
state and thus oxygen fugacity have to be taken into consideration. Naturally occurring 67
ringwoodite contains an assumed amount of about 11 % Fe (Kleppe et al. 2002). The presence 68
of iron in two oxidation states (Fe2+ and Fe3+) increases the number of possible protonation 69
sites, for example when Fe3+ is reduced to Fe2+ in the course of OH group formation (Kleppe 70
et al. 2002; Ingrin and Skogby 2000). 71
While the oxidation state of iron in ringwoodite and the incorporation of water are each 72
interesting issues themselves, the mutual interaction of both mechanisms is even more 73
complex, but needs to be studied in order to understand mantle behavior and processes, as 74
performed for example by McCammon et al. (2004) for the mantle minerals olivine, 75
wadsleyite, ringwoodite and majorite. 76
The method of choice for this kind of investigation, in which minor elements and species 77
and their local environment are of interest, is spectroscopy. The present study focuses on the 78
4
incorporation of OH-, Fe2+ and Fe3+ and their mutual interaction by applying FTIR, 79
Mössbauer (MB), electron energy loss (EEL), and UV-VIS spectroscopy. Furthermore, we 80
combined these spectroscopic measurements with heating experiments both in situ and ex situ 81
to evaluate the response of the structure and species to temperature and thus obtain further 82
insight into their structural location and correlation with each other. 83
84
Experimental and analytical methods 85
Syntheses 86
Multi-anvil apparatus. 87
The high-pressure syntheses of wadsleyite were performed in a multi-anvil apparatus similar 88
to that of Walker (1991), but with a special tool that allows alternatively a continuous 360° 89
rotation or a 180° rocking motion of the Walker high-pressure module during the run with 5° 90
s-1 in order to avoid separation of the fluid from the solid parts of the run and thus ensure a 91
homogeneous starting material (see Schmidt and Ulmer 2004; Deon et al. 2010). We used a 92
10/5-assembly (octahedron length/truncation length) with an MgO-based octahedron serving 93
as the pressure-transmitting medium, a stepped graphite heater and pyrophyllite gaskets. The 94
temperature was controlled by a W5%Re-W26%Re thermocouple. Details of the 95
experimental set up are given in Koch-Müller et al. (2009). 96
Oxide mixtures of different composition served as starting materials for the syntheses and 97
were filled into Pt capsules (length 1.78 mm, outer diameter 2.54 mm). Run MA327 98
contained 57Fe-enriched Fe2O3 (Fe 90% enriched) as an iron oxide component for later MB 99
spectroscopy. 100
Oxygen fugacity in runs MA311 and MA327 was set to oxidizing conditions by adding 101
Re/ReO2 to the starting material, while Run MA313 was performed under more reducing 102
conditions by adding Fe/FeO in a separate (but hydrogen permeable) part of the sample 103
capsule. In all runs an amount of 0.4 mg (4 wt%) distilled water was first filled into the 104

5
capsule before adding the starting material, and the filled capsule was then cold-sealed. The 105
experimental conditions are summarized in Table 1. 106
107
Analyses 108
FTIR spectroscopy. 109
OH-absorption spectra were measured using a VERTEX 80v FTIR spectrometer (Bruker 110
Optics) with an attached Hyperion microscope. A globar served as a light source, and further 111
devices were an InSb detector and a KBr beam splitter. The spectra were collected in a range 112
from 6000 to 2000 cm-1 with a resolution of 2 cm-1 and averaged over 256 scans. We 113
performed measurements for quantification purposes on doubly polished crystal plates of 114
known thickness. 115
The integral intensities of the OH-bands were obtained using the PeakFit software by 116
Jandel Scientific. We applied a Gaussian plus Lorentzian distribution function to all 117
component bands. Water contents were calculated using the formula 118
c (wt% H2O) = Ai (cm-1) * 1.8/[t (cm) * D (g/cm3) * εi (l*mol-1*cm-2)] 119
where Ai is the total integral intensity of bands, D is the density, t is the thickness of the 120
sample and εi is the integral molar absorption coefficient of ringwoodite = 100000 +/- 10000 121
l*mol-1*cm-2 (Koch-Müller and Rhede 2010). Since ringwoodite is isotropic the total integral 122
intensities were calculated by multiplying the integrated area of the bands by three. 123
To investigate the temperature-dependence of OH-bands, we collected spectra up to 600 124
°C in a Linkam FTIR600 heating/cooling stage with N2- and air flushing, respectively. 125
Temperature was increased in steps of 100 °C and each measurement was started after an 126
annealing time of about 20 minutes. 127
128
EEL spectroscopy. 129

6
The ferric iron to total iron ratio of the samples was determined by EEL spectroscopy. 130
Therefore thin foils (thickness should not exceed 100 nm) were cut from polished single 131
crystals using a FEI FIB200 focused ion beam device (Wirth 2004), with a Ga-ion source 132
operated at an acceleration voltage of 30 kV. The final transmission electron transparent foil 133
was removed from the sample with an ex situ-manipulator and placed onto a perforated 134
transmission electron microscope (TEM) carbon grid. No further carbon coating was required. 135
Analyses were performed with a FEI Tecnai G2 F20 X-Twin TEM operating at 200 kV with a 136
field emission gun (FEG) electron source and a Gatan Tridiem energy filter with an energy 137
resolution of 1 eV. The EEL spectra were acquired in the diffraction mode with a camera 138
length of 770 mm and a collection angle of 10 mrad. They were averaged over 5 scans, with 1 139
second acquisition time each. The spot size was 5 nm, and we measured about 10 different 140
locations in each foil. 141
The determination of Fe3+/ΣFe was carried out applying the technique of the modified 142
integral Fe L23 white-line intensity ratio (van Aken and Liebscher 2002). As per their 143
description, the background was fitted to a double arctan function with its height scaled to the 144
minima behind the Fe L3- and L2-edges and fixed inflection points at 708.65 and 721.65 eV. 145
After subtracting the background, two integration windows of 2 eV width each were 146
positioned around 709.5 and 720.7 eV for L3Fe3+ and L2Fe2+, respectively. The final Fe3+/ΣFe 147
ratios were calculated applying the following calibration curve (with a = 0.193 (7), b = - 0.465 148
(9), c = 0.366 (3)) 149
I(L3)I(L2 )mod
=1
ax2 + bx + c− 1. 150
The background subtraction and determination of Fe3+/ΣFe ratios were performed using a 151
program written by C. Petrick (Helmholtz-Zentrum Potsdam, Deutsches 152
GeoForschungsZentrum - GFZ, Potsdam, Germany). 153
154

7
MB spectroscopy. 155
MB spectra were recorded at room temperature (293 K) in transmission mode on a constant 156
acceleration MB spectrometer with a nominal 370 MBq 57Co high specific activity source in a 157
12 µm thick Rh matrix. The velocity scale was calibrated relative to 25 µm thick α-Fe foil 158
using the positions certified for (former) National Bureau of Standards standard reference 159
material no. 1541; line widths of 0.36 mm/s for the outer lines of α-Fe were obtained at room 160
temperature. For the measurements, a grain of each sample was embedded in a small amount 161
of Apiezon grease and then crushed between two glass slides. The material was removed 162
using cellophane tape, which was then placed over a piece of mylar. Subsequently, a piece of 163
25 µm thick Ta foil (absorbs 99% of 14.4 keV gamma rays) with a hole of 250 - 300 µm 164
diameter was centered over the sample powder. 165
Based on sample composition, iron enrichment and estimated physical thickness, the 166
dimensionless thickness of the samples was estimated to be roughly 8, which corresponds to 167
about 20 mg Fe (unenriched)/cm2. Data were fitted using the fitting program MossA written 168
by C. Prescher (Prescher et al. 2012). 169
170
UV-VIS spectroscopy. 171
Optical absorption spectra were measured in the range from 370 to 1800 nm (ca. 27000 - 172
5555 cm-1) with a single-beam micro spectrophotometer constructed based on a SpectraPro-173
275 triple grating monochromator, a highly modified mineralogical microscope MIN-8 and a 174
PC. Ultrafluars (10×) serve as objective and condenser. Two exchangeable highly stabilized 175
quartz-halogen and Xenon lamps (70 W each) are used as a light source. Two exchangeable 176
photomultiplier tubes and a cooled PbS-cell act as photo detectors. A mechanical high-177
stabilized 300 Hz-chopper and a lock-in amplifier were applied to improve the signal/noise 178
ratio. The spectra were scanned in steps of Δλ = 1 nm, 2 nm and 5 nm in the range of 270-179
450, 450-1000 and 1000-1800 nm, respectively. The spot size was 100 μm maximum. 180

8
The samples of synthetic ringwoodite were prepared as thin sections of about 50 µm 181
thickness. For this purpose, optically homogeneous grains of ringwoodite were glued with epoxy 182
on a supporting glass plate and doubly polished with diamond powders and pastes until 183
transparent thin sections were obtained that were suitable for optical spectroscopic 184
measurements. Optical absorption spectra of the thin sections were measured at ambient 185
conditions. The reference beam position was always taken on a supporting glass plate near to 186
where the thin section was measured. 187
188
Electron microprobe analysis (EMPA). 189
For chemical analyses, several ringwoodite single crystals (MA327 and MA311) and one half 190
of a cut sample capsule (run MA313) were embedded in epoxy, polished and coated with 191
carbon. Compositions were measured with a JEOL JXA-8500F electron microprobe using 192
wavelength-dispersive spectrometers with a PAP correction procedure. The microprobe was 193
operated at 15 kV with a beam current of 10 nA and a spot size of 2 μm. Counting times were 194
20 s on peak and 10 s on the background. A well-characterized ringwoodite (MA056) served 195
as a standard. 196
197
Single crystal X-ray diffraction (XRD). 198
The lattice parameters of the ringwoodite crystals were determined using a Rigaku R/AXIS-199
SPIDER diffractometer operating at 40 kV and 30 mA. A rotating Cu anode served as the 200
source where the emitted light is directed through an arrangement of mirrors to yield 201
monochromatic CuKα radiation. The detection system consists of a cylindrically shaped 202
image plate, which reads out the diffracted radiation in a 2θ range of – 60 to 144° in 203
horizontal and +/- 45° in vertical direction. The program RAPID/XRD Rigaku was used for 204
data acquisition with an exposure time of 10 min. Data treatment was performed using the 205
software AreaMax – Rigaku/MSC. 206

9
207
Results 208
Ringwoodite after synthesis 209
The synthesized ringwoodite crystals were xenomorphically shaped and their size ranged 210
from 20 to 200 µm. Their color varied from light blue (MA313 with xFe = 0.11) to darker blue 211
(MA311 and MA327 with xFe = 0.18 and 0.24, respectively) with increasing Fe-content. In all 212
samples a silicon deficit was observed with xSi ranging between 0.95 and 0.97. The amount of 213
incorporated water was determined to a maximum value of 1.9 (3) wt% H2O in MA313. EEL 214
spectroscopy revealed the ferric iron contents (relative to total iron) to be 6 (3) % in the more 215
reduced runs and up to 12 (3) % in the experiments under more oxidized conditions. See 216
Table 1 for detailed information for each run. Based on EMP analyses, calculated water 217
contents and Fe3+ fractions (values taken from EELS) we determined the following 218
stoichiometric formulae: 219
(Mg0.79(2)Fe2+0.16(1)Fe3+
0.02(1))2Si0.97(4)H0.20(4)O4 (MA311), 220
(Mg0.86(1)Fe2+0.10(1)Fe3+
0.01(1))2Si0.95(1)H0.31(4)O4 (MA313) and 221
(Mg0.76(1)Fe2+0.21(1)Fe3+
0.03(1))2Si0.95(1)H0.15(4)O4 (MA327). 222
The MB spectrum of the original ringwoodite crystal was fitted to one Fe2+ and one Fe3+ 223
doublet. The Fe2+ doublet displays large center shift (1.069 mm/s relative to α-Fe) and 224
quadrupole splitting (2.767 mm/s) that is consistent with octahedral coordination for Fe2+. The 225
other doublet with low center shift (0.665 mm/s) and quadrupole splitting (1.063 mm/s) is 226
assigned to octahedral Fe3+, resulting in 9 (3) % of ferric iron. Table 2 lists the MB data and 227
assignments resulting from the fitting process. 228
229
Heating experiments 230
FTIR spectroscopy. 231

10
We performed several heating experiments on crystals from runs MA313 and MA327 to a 232
maximum temperature of 600 °C and performed in situ FTIR spectroscopy. For the purpose 233
of comparison we additionally investigated a ringwoodite sample of magnesium endmember 234
composition (MA308) and other iron-bearing ringwoodites in order to evaluate the effect of 235
iron on the OH band structure of original and annealed ringwoodite. 236
The most striking observation was a color change of the crystals from the original blue to 237
green starting at about 300 °C, which was non-reversible upon cooling (see Figure 1). The 238
color modification was accompanied by a dramatic change in the infrared spectrum between 239
4000 and 2000 cm-1 where the OH stretching bands occur. Figure 2 displays the absorbance 240
spectra of MA313 ringwoodite at ambient conditions, in situ at 500 °C and after quenching to 241
room temperature. There are four main changes in the spectra: 242
(1) The high energy OH stretching band at 3680 cm-1 is strongly enhanced during heating and 243
displays a slight irreversible shift to lower wavenumbers. 244
(2) The shoulder at 3420 cm-1 is only weakly pronounced in the spectrum at ambient 245
conditions but increases strongly at 500 °C. 246
(3) In contrast, the broad stretching band around 3150 cm-1 shows a distinct decrease during 247
heating. 248
(4) The band group around 2500 cm-1 vanishes almost completely at 500 °C, but returns once 249
the sample is cooled down to room temperature. 250
Except for the last mentioned change, all modifications are non-reversible and therefore 251
visible in the spectrum after quenching. Apart from the obvious rearrangement of the OH 252
stretching bands, the ringwoodite loses about 30 % of its initial water content due to heating.253
We performed the experiments both under rather oxidizing (air-flushing) and more or less 254
inert (N2-flushing) conditions and observed no differences with respect to the appearance of 255
the spectra or calculated water contents. The annealed crystals were checked by Raman 256
spectroscopy and still showed the signature of ringwoodite. 257

11
258
UV-VIS spectroscopy. 259
Figure 3 shows the optical absorption spectra of sample MA313 of the original crystal (blue 260
curve, ambient), and the 500 °C - (green, 500 °C) and the 600 °C - annealed crystals (orange, 261
600 °C). The blue curve of the original crystal shows the spin-allowed dd-transition band of 262
octahedral Fe2+ at 12700 cm-1 with a smaller shoulder at 9900 cm-1. The second important 263
feature is the intervalence charge transfer band (IVCT) of Fe2+/Fe3+ at about 18200 cm-1. 264
Compared to the original spectrum, the green curve of the crystal annealed at 500 °C displays 265
three characteristic modifications: a strong decrease of the spin-allowed transition bands of 266
octahedral Fe2+, a decrease of the IVCT band and the appearance of a band at 21400 cm-1, 267
which is assigned to a spin-forbidden transition of Fe3+. This band is further enhanced in the 268
600 °C-treated sample, in which, likewise, the low-energy edge of the ligand-metal transition 269
band of O2- → Fe3+ is visible. 270
271
Determination of Fe3+. 272
EEL spectroscopy on all treated samples showed an increase of the ferric iron content due to 273
heating to more or less the same percentage of approximately 16 % Fe3+/ΣFe. In sample 274
MA313 a larger fraction of Fe2+ is oxidized to Fe3+ (6 % → 16 %) when compared to the 57Fe 275
enriched sample MA327, in which an increase from 12 to 15 % was determined using EELS 276
(MB spectroscopy revealed an increase from 9 to 11 %). 277
Figure 4 shows the MB spectrum of the annealed ringwoodite with four doublets fit to the 278
data. The two doublets with large center shift (> 1mm/s) and quadrupole splitting are assigned 279
to ferrous iron in octahedral coordination. When compared to the untreated sample, using two 280
Fe2+ doublets instead of one gave a better fit, suggesting a slight variation in the next-nearest 281
neighbor environment of Fe2+ in octahedral sites. The other two doublets with small center 282
shift (< 1 mm/s) and quadrupole splitting can be assigned to Fe3+ in octahedral and possibly 283

12
tetrahedral coordination. When we assume Fe2+-Fe3+-charge transfer to be slower than the 284
timescale of the Mössbauer effect, the models give total Fe3+ fractions of about 12 % 285
assuming only octahedral Fe3+, and about 11 % assuming both octahedral and tetrahedral Fe3+ 286
(9 % octahedral and 2 % tetrahedral Fe3+). 287
288
Discussion 289
In the present study, a maximum water content of 1.9 (3) wt% H2O is reported in sample 290
MA313 with a Fe3+ fraction of 0.06 (3) under reducing conditions. Under increased oxygen 291
fugacity, synthesized ringwoodite contains higher fractions of ferric iron (up to 0.12 (3) in 292
MA327 with 0.8 wt% H2O). These values are comparable to those in other experimental 293
ringwoodite studies such as McCammon et al. (2004) and Smyth et al. (2003) who reported 294
Fe3+ fractions of 0.03 (2) to 0.18 (4) (with the total Fe ranging from 0.2 to 0.3, comparable to 295
the values determined in our study) and water contents up to 2.2 wt% at slightly higher 296
pressure and temperature conditions. These studies also found a silicon deficit (xSi<1) in most 297
of their samples. We observed the same behavior in our runs with silicon values for 298
ringwoodite ranging between 0.95 and 0.97. The silicon deficit is most likely a consequence 299
of the incorporation of water. 300
Our experiments show that incorporation of ferric iron in ringwoodite is strongly 301
influenced by whether synthesis conditions were oxidizing or reducing. For all of our 302
experiments, the amount of Fe3+ is higher in the more oxidized runs compared to the reduced 303
experiments. We infer that dissociation of molecular water into H2 and O2 and subsequent 304
diffusion of the small H2 molecule through the permeable Pt capsule walls leads to excess O2 305
within the capsule and hence oxidation of ferrous iron. 306
307
Correlation between H+ and Fe3+ 308

13
On the basis of our analyses of samples with different Fe content, there is no clear correlation 309
between the incorporation of ferric iron and the incorporation of hydrogen as proposed earlier 310
by McCammon et al. (2004), although the mechanism of ferrous iron plus OH- transforming 311
into Fe3+ + O2- + ½ H2 (Ingrin and Skogby 2000) provides a reasonable correlation. But, as 312
described below, the formation of hydrogen defects in ringwoodite is based on more than one 313
mechanism of hydrogen incorporation. Therefore a simple correlation between Fe3+ and OH- 314
is not likely, nor could it be observed in our study. This holds true for the formation of 315
hydrogen defects during the process of crystal growth. In contrast, the heating experiments on 316
different ringwoodite crystals indeed suggest a correlation of dehydration and likewise 317
increasing Fe3+ fractions. The annealed crystals lose about 30 % of their initial water content 318
that is coupled to an increased amount of ferric iron. Interestingly, the gain of Fe3+ throughout 319
the heating process is highest in the ringwoodite sample with the lowest starting value and 320
vice versa, in such a way that in the end both samples (MA313 and MA327) reach more or 321
less the same fraction of ferric iron. Based on these data and other data in the literature (e.g. 322
Smyth et al. 2003), it seems reasonable to infer a maximum amount for Fe3+ incorporation in 323
ringwoodite up to 20 % of the total Fe. 324
325
Location of hydrogen 326
The manner in which the OH bands change during heating provides further insight into the 327
possible location of hydrogen within the ringwoodite structure. The main broad band around 328
3150 cm-1 decreases strongly during heating, characterizing the dehydration, and it most 329
likely is responsible for up to 30 % of the initial amount of water that is lost during heating 330
(see Fig. 2). Simultaneously the ferric iron content is increased throughout the heating process 331
following the relation 332
Fe2+ + OH- = Fe3+ + O2- + ½ H2 (Ingrin and Skogby 2000). 333

14
The broad band therefore likely represents more loosely bound hydrogen. Blanchard et al. 334
(2005) calculated the defect binding energies for ringwoodite. These values represent the gain 335
of energy for the system when an isolated OH species is bound to a negatively charged defect. 336
In this way the defects with the largest negative values are expected to be more stable, since 337
they represent the largest energy gain for the structure. According to their calculations the 338
most favored combination of an OH species with a defect is to a vacant tetrahedron with an 339
energy gain of about -15 eV per each hydrogen, followed by hydrogen combining with Mg-340
substituted tetrahedra (~ -12 eV per H) and lastly, the hydrogen bound to a vacant octahedron 341
(~ -10 eV per H). However, the inverse conclusion would be that by introducing energy to the 342
system, the hydrogen atoms bound to a vacant octahedron represent the least stable 343
configuration and would be released first. The broad band around 3150 cm-1 displays a 344
distinct intensity decrease during heating. Thus we assume that the binding mechanism of 345
hydrogen causing that band must be the least stable and it is therefore most likely due to 346
octahedral defects [VMg(OH)2]x. The other defects ([VSi(OH)4]x and [MgSi(OH)2]x) are more 347
stable and could be assigned to the bands that increase during heating. Thus we consider a 348
rearrangement of hydrogen atoms to the more stable configuration of tetrahedral vacancies 349
(hydrogarnet-type) and Mg-substituted tetrahedra. The slightly visible shift of the increased 350
band at 3680 cm-1 to lower wavenumbers at 500 °C and after heating (see Fig. 2) represents a 351
side effect of the decreased intensity of the broad absorption band around 3150 cm-1. 352
In addition to the altered shape and visibly shifted maxima in the OH absorption spectra, the 353
band deconvolution plots in Figure 5 also clearly show the rearrangement of the bands. The 354
original ringwoodite spectrum (top) consists of five Gaussian and Lorentzian-shaped 355
functions with the most intense one around 3131 cm-1. The comparison to the bottom plot of 356
the annealed sample shows that the bands at 3446 and 3649 cm-1 are significantly enhanced at 357
the expense of the formerly strongest band around 3127 cm-1. Thus the heating process not 358

15
only leads to the loss of part of the initial water content but also induces a rearrangement of 359
the hydrogen. 360
Comparing IR-spectra of iron-bearing with iron-free ringwoodite supports these findings. 361
Figure 6 clearly shows that the higher the amount of incorporated iron, the closer the bands at 362
3115 cm-1 and 3700 cm-1 (both values for Mg endmember) move towards each other. 363
Concerning the band at 3115 cm-1, the substitution of iron for magnesium in the octahedral 364
site leads to expansion of the octahedron and thus to increased O-O distances or weaker O … 365
H bonds. According to Libowitzky (1999) this would result in a shift of the band towards 366
higher wavenumbers as is actually observed. 367
For the band around 3700 cm-1, we observe a shift towards lower wavenumbers with 368
increasing Fe content. The assignment of the band to hydrogen atoms bound to a vacant 369
tetrahedron (hydrogarnet-substitution) does not initially appear to relate to the incorporation 370
of iron into the structure. However, since the tetrahedron shares an oxygen with the Fe-371
substituted octahedron, the expansion of the octahedron would push the oxygen towards the 372
vacant tetrahedron and thus shorten O-O distances. As a consequence of this structure 373
modification, the O … H bonds would become stronger and therefore shift to lower 374
wavenumbers as is indeed observed with increasing iron incorporation. Beyond that, the 375
original location of the band at 3680 cm-1 (3700 cm-1 in iron-free ringwoodite) is typical for 376
the hydrogarnet-substitution (i.e. Andrut et al. 2002), where 4 hydrogen atoms (H+) substitute 377
for the tetrahedrally coordinated Si4+. The mechanism is associated with the enlargement of 378
the vacant (OH)4-tetrahedra as compared to the smaller SiO4-tetrahedra (i.e. Armbruster et al. 379
2001) and affects properties including the elasticity and rheology at high pressure (Prewitt 380
and Parise 2000). 381
The shoulder around 3420 cm-1 is only weakly developed in the original crystals but 382
becomes the main band in the spectra of the annealed ringwoodite. It is also observed in iron-383
free ringwoodite (around 3250 cm-1) even though it is poorly visible. As a result of increasing 384

16
xFe the shoulder shifts towards higher wavenumbers. Interestingly in the Mg endmember the 385
band is very little or not at all enhanced during heating compared to the iron-bearing 386
ringwoodite. From that we infer a possible assignment of the broad band as caused by two 387
hydrogens bound to a cation-substituted tetrahedron (Mg for silicon). Its strong enhancement 388
in the iron-bearing samples could be an indication of additional tetrahedral Fe3+. In that case 389
one would find only one hydrogen bound to a tetrahedron instead of two due to charge 390
balance. 391
At first glance, the position of the band group around 2500 cm-1 is indicative of OH 392
groups with strong hydrogen bonding and distances R(O-H…O) around 2.6 Å (Libowitzky 393
1999). At the same time, it has been assigned to either X-OH bending vibrations (Bolfan-394
Casanova et al. 2000) or as combination of overtones of Si-O-related vibrations and 395
translations of octahedral and tetrahedral cations (Hofmeister and Mao 2001). Interestingly, 396
the band group is not only found in hydrous but also in anhydrous ringwoodite (Hofmeister 397
and Mao 2001) and thus cannot be related to OH within the structure. Latter authors describe 398
the modes that build up the band group as combinations of ν3 (Si-O tetrahedral stretch), ν4 399
(O-Si-O tetrahedral bend), and translations of the octahedral cation and SiO4 unit (T(M) and 400
T(mix)). Furthermore, they show that all modes (except for ν3) display a dependence of the 401
composition such that with increasing Mg content the bands shift to higher wavenumbers. We 402
observe exactly the same, when comparing the band group in IR spectra of different Fe 403
content (see Fig. 6): the slight shift of the band group to lower wavenumbers with increasing 404
iron content thus is a consequence of the shift of the contributing fundamental bands between 405
200 and 600 cm-1. 406
407
Fe in ringwoodite 408
The expansion of the structure as a result of iron incorporation is linked to increased lattice 409
parameters due to the higher ionic radius of iron compared to magnesium. The same effect is 410

17
observed with hydrogen incorporation. The anhydrous magnesium endmember displays the 411
lowest lattice parameter with a = 8.0649 (1) Å (Sasaki et al. 1982); whereas Inoue et al. 412
(1998) determined a for hydrous iron-free ringwoodite (2.2 wt% water revealed by secondary 413
ion mass spectrometry (SIMS)) to be 8.0786 (4) Å. Inoue et al. (2004) and Ye et al. (2009) 414
also reported increased lattice parameters of hydrous versus anhydrous ringwoodite. The 415
lattice parameter of our ringwoodite sample (MA313) with xFe = 0.11 was determined to be 416
even higher at 8.096 (4) Å. Although our sample contains less water (1.9 wt%) and thus 417
should display less of an increase in lattice parameters, the incorporated iron leads to a higher 418
a-value. The same effect is observed in the annealed ringwoodite samples. XRD data of 419
ringwoodite (MA313) revealed an increase of a from 8.096 (4) Å in the original sample to 420
8.112 (3) Å in the annealed crystal. As aforementioned, the initial a-value is already high 421
compared to other ringwoodite data due to the high water content of the sample. Inoue et al. 422
(2004) performed high-temperature XRD measurements and determined an increase of a in 423
hydrous ringwoodite (with 2.6 wt% H2O) from 8.065 (1) Å at ambient conditions to 8.105 (2) 424
Å at 500 °C. They also determined breakdown temperatures around 700 °C for anhydrous 425
ringwoodite and 400 °C for hydrous ringwoodite. Ye et al. (2009) also performed heating 426
experiments up to 646 °C (919 K), and likewise observed a unit-cell expansion with 427
increasing temperature and breakdown temperatures of different iron-free ringwoodite 428
crystals depending on the amount of incorporated water. The sample with the highest water 429
content (2.4 wt% H2O) broke down at 333 °C (606 K); whereas the ringwoodite with only 430
0.20 wt% H2O had been stable up to 638 °C (911 K). The samples in our study maintained a 431
ringwoodite signature at the highest temperature of 600 °C (873 K). Based on that observation 432
we assume a stabilizing effect of iron on the structure of hydrous ringwoodite up to higher 433
temperatures. 434
The UV-VIS spectrum of the heated crystal also displays indications that argue for the 435
expansion of the structure. The IVCT band around 18200 cm-1 responsible for the blue color 436

18
of ringwoodite (Taran et al. 2009) vanishes and causes the crystal to appear greenish. The 437
mechanism that causes the band is electron hopping in overlapping atomic orbitals between 438
two adjacent Fe2+ and Fe3+ octahedra. The heating of the sample leads to an expansion of the 439
structure and thus probably to separation of the overlapping orbitals such that electron 440
hopping is no longer possible. The IVCT band vanishes and the crystal takes on a green color. 441
The evolution of the optical absorption spectra during the temperature treatment (see 442
Fig. 3) reflects an oxidation of Fe2+ to Fe3+. Indeed, both spectroscopic features related to 443
Fe2+, the Fe2+/Fe3+ IVCT band at around 18200 cm-1 and, especially, the broad band at 444
~12700 with a weaker shoulder at ~9900 cm-1, assigned to the electronic spin-allowed dd 445
transition 5T2g → 5Eg of Fe2+, split by the dynamic Jahn-Teller effect (Taran et al. 2009), 446
continually decrease with increasing temperature (see Fig. 3). This behavior evidently 447
indicates the decrease of Fe2+. On the other hand, there is a significant intensification of the 448
high-energy absorption edge, which is most probably caused by the strong UV absorption 449
induced by the electronic ligand-to-metal charge-transfer transition O2- → Fe3+. Besides, the 450
shoulder around 22000 cm-1, that very likely may be assigned to the spin-forbidden 6A1 → 451
4A1, 4E (4G) transition of Fe3+, appears and considerably increases with temperature. That 452
again indicates an oxidation of Fe2+ to Fe3+ induced by heating. 453
This is confirmed by EELS and MB analyses that clearly yield increased contents of ferric 454
iron in the annealed ringwoodite crystals. 455
There is still some uncertainty about which sites Fe3+ occupies in the ringwoodite 456
structure, concerning whether it enters only the octahedral or also the tetrahedral site. Neither 457
the UV-VIS nor the MB spectra of the original crystals indicate tetrahedral Fe3+ within the 458
resolution of the data. However, analyses of the annealed crystals provide an option for Fe3+ 459
in the tetrahedron. The UV-VIS spectrum displays a band around 22000 cm-1, which could be 460
related to either octahedral or tetrahedral Fe3+. Although the energy of the two spin-forbidden 461
bands of tetrahedral Fe3+ 6A1 → 4T1 and → 4T2 are expected to be shifted to higher energies 462
19
compared with similar bands of octahedral Fe3+, the most prominent spin-forbidden transition 463
6A1 → 4A1, 4E (4G), which very likely might be the band at ~22000 cm-1, does not depend on 464
the crystal field strength Dq. Therefore the energy of this transition may be nearly the same 465
for Fe3+ in tetrahedral and octahedral coordination (see Burns 1993 pp. 222-223 and Table 466
5.15 for transition band values of octahedral and tetrahedral Fe3+ in various minerals). The 467
MB data reveal a similar picture. The spectrum of the annealed 57Fe enriched sample was 468
fitted to different models with no significant difference in the statistical goodness of fit 469
depending on the position of Fe3+ doublets. When we assume that all Fe2+ and Fe3+ is static on 470
the timescale of the Mössbauer effect, the small Fe3+-doublet with lower center shift can be 471
assigned to Fe3+ in the tetrahedron. However, in contrast to analyses of the original 472
ringwoodite, both methods show possible evidence for Fe3+ in tetrahedral sites in the annealed 473
samples. In fact our assignment of the OH band around 3420 cm-1 is based on the presence of 474
cation disorder; thus at least Mg in tetrahedral sites should be present. The shoulder around 475
3420 cm-1 in iron-bearing ringwoodite becomes the main band in the spectrum measured after 476
heating and is less enhanced in the spectrum of the annealed Mg endmember. Taking into 477
account the fact that the ferric iron content also rises due to heating, we favor the possibility 478
of Fe3+ substituting for silicon in the tetrahedron. Since this process is supplementary to Mg 479
entering tetrahedral sites, the band is more intense than in the pure Mg endmember 480
ringwoodite. We therefore support the idea of tetrahedral Fe3+ at least in the annealed 481
samples. 482
In summary, the presence of iron and especially Fe3+ in ringwoodite does not appear to 483
influence the total amount of water that is stored in the mineral. In our proposed band 484
assignments we mainly agree with Blanchard et al. (2009) with hydrogen located between O-485
O pairs of the 16c and 16d octahedral sites (for [VMg(OH)2]x) and protonation of tetrahedral 486
edges (for [Mg/Fe2+/Fe3+Si(OH)2]x). However, the broadness of the band around 3150 cm-1 487
indicates that it is a combination of various bands at least due to slightly different O … H 488

20
distances which are again due to variable environments and hydrogen disorder as already 489
stated by Panero (2010). Blanchard et al. (2009) also exemplarily chose one additional defect 490
([VMg(OH)2MgSiSiMg]x) to calculate its OH frequencies. According to their findings such a 491
defect of hydrogen atoms bound to a vacant Mg-octahedron near to Mg-Si substitution would 492
cause an OH band also located in the range of the broad band around 3150 cm-1. Furthermore 493
we could anticipate that the full width at half maximum (FWHM) of the band is actually 494
increasing with higher Fe content. Thus iron is indeed increasing the number of OH bands in 495
that region. Nevertheless a higher amount of incorporated water due to more possibilities of 496
hydrogen atom locations is not observed in our experiments. 497
498
Acknowledgements 499
We thank Oona Appelt and Dieter Rhede for their help with the electron microprobe analyses 500
and Anja Schreiber who prepared thin foils for TEM. We also gratefully acknowledge the 501
comments and recommendations of A. Beran, an anonymous reviewer and AE B. Mihailova. 502
The work was supported by a grant from the Deutsche Forschungsgemeinschaft (Ko1260/11-503
1) within the priority program SPP1236. 504
505

21
References cited 506
507
Andrut, M., Wildner, M., and Beran, A. (2002) The crystal chemistry of birefringent natural 508
uvarovites. Part IV. OH defect incorporation mechanisms in non-cubic garnets derived 509
from polarized IR spectroscopy. European Journal of Mineralogy, 14, 1019-1026. 510
Armbruster, T., Kohler, T., Libowitzky, E., Friedrich, A., Miletich, R., Kunz, M., Medenbach, 511
O., and Gutzmer, J. (2001) Structure, compressibility, hydrogen bonding, and 512
dehydration of the tetragonal Mn3+ hydrogarnet, henritermierite. American 513
Mineralogist, 86, 147-158. 514
Blanchard, M., Balan, E., and Wright, K. (2009) Incorporation of water in iron-free 515
ringwoodite: a fist-principles study. American Mineralogist, 94, 83-89. 516
Blanchard, M., Wright, K., and Gale, J.D. (2005) Atomistic simulation of Mg2SiO4 and 517
Mg2GeO4 spinels: A new model. Physics and Chemistry of Minerals, 32, 332-338. 518
Bolfan-Casanova, N., Keppler, H., and Rubie, D.C. (2000) Water partitioning between 519
nominally anhydrous minerals in the MgO-SiO2-H2O system up to 24 GPa: implications 520
for the distribution of water in the Earth´s mantle. Earth and Planetary Science Letters, 521
182, 209-221. 522
Burns, R.G. (1993) Mineralogical applications of crystal field theory. Cambridge University 523
Press, 2nd Edition, Cambridge. 524
Chamorro, P.E.M., Daniel, I., Chervin, J.C., Dumas, P., Bass, J.D., and Inoue, T. (2006) 525
Synchrotron IR study of hydrous ringwoodite γ-Mg2SiO4 up to 30 GPa. Physics and 526
Chemistry of Minerals, 33, 502-510. 527
Deon, F., Koch-Müller, M., Rhede, D., Gottschalk, M., Wirth, R., and Thomas, S.-M. (2010) 528
Location and quantification of hydroxyl in wadsleyite: New insights. American 529
Mineralogist, 95, 312-322. 530

22
Hofmeister, A.M., and Mao, H.K. (2001) Evaluation of shear moduli and other properties of 531
silicates with the spinel structure from IR spectroscopy. American Mineralogist, 86, 622-532
639. 533
Ingrin, J., and Skogby, H. (2000) Hydrogen in nominally anhydrous upper-mantle minerals: 534
concentration levels and implications. European Journal of Mineralogy, 12, 543-570. 535
Inoue, T., Weidner, D.J., Northrup, P.A., and Parise, J.B. (1998) Elastic properties of hydrous 536
ringwoodite (γ-phase) in Mg2SiO4. Earth and Planetary Science Letters, 160, 107-113. 537
Inoue, T., Tanimoto, Y., Irifune, T., Suzuki, T., Fukui, H., and Ohtaka, O. (2004) Thermal 538
expansion of wadsleyite, ringwoodite, hydrous wadsleyite and hydrous ringwoodite. 539
Physics of the Earth and Planetary Interiors, 143-144, 279-290. 540
Kleppe, A.K., Jephcoat, A.P., Smyth, J.R., and Frost, D.J. (2002) On protons, iron and the 541
high-pressure behavior of ringwoodite. Geophysical Research Letters, 29. 542
Koch-Müller, M., and Rhede, D. (2010) IR absorption coefficients for water in nominally 543
anhydrous high-pressure minerals. American Mineralogist, 95, 770-775. 544
Koch-Müller, M., Rhede, D., Schulz, R., and Wirth, R. (2009) Breakdown of hydrous 545
ringwoodite to pyroxene and spinelloid at high P and T and oxidizing conditions. Physics 546
and Chemistry of Minerals, 36, 329-341. 547
Kohlstedt, D.L., Keppler, H., and Rubie, D.C. (1996) Solubility of water in the α, β, and γ 548
phases of (Mg,Fe)2SiO4. Contributions to Mineralogy and Petrology, 123, 345-357. 549
Kudoh, Y., Kuribayashi, T., Mizobata, H., and Ohtani, E. (2000) Structure and cation disorder 550
of hydrous ringwoodite, γ-Mg1.89Si0.98H0.30O4. Physics and Chemistry of Minerals, 27, 551
474-479. 552
Libowitzky, E. (1999) Correlation of O-H stretching frequencies and O-H. . . O hydrogen 553
bond lengths in minerals. Monatshefte Chemie, 130, 1047-1059. 554
McCammon, C.A., Frost, D.J., Smyth, J.R., Laustsen, H.M.S., Kawamoto, T., Ross, N.L., and 555
van Aken, P.A. (2004) Oxidation state of iron in hydrous mantle phases: implications for 556

23
subduction and mantle oxygen fugacity. Physics of the Earth and Planetary Interiors, 143-557
144, 157-169. 558
Panero, W.R. (2010) First principles determination of the structure and elasticity of hydrous 559
ringwoodite. Journal of Geophysical Research, 115, 1-11. 560
Prescher, C., McCammon, C.A., and Dubrovinsky, L. (2012) MossA - a program for 561
analyzing energy-domain Mossbauer spectra from conventional and synchrotron sources. 562
Journal of Applied Crystallography, 45, 329-331. 563
Prewitt, C.T., and Parise, J.B. (2000) Hydrous Phases and Hydrogen Bonding at High 564
Pressure. Reviews in Mineralogy and Geochemistry, 41, 309-333. 565
Sasaki, S., Prewitt, C.T., Sato, S., and Ito, E. (1982) Single crystal X-ray studies of γ-566
Mg2SiO4. Journal of Geophysical Research, 87, 7829-7832. 567
Schmidt, M.W., and Ulmer, P. (2004) A rocking multianvil; elimination of chemical 568
segregation in fluid-saturated high-pressure experiments. Geochimica et Cosmochimica 569
Acta, 68, 1889-1899. 570
Smyth, J.R., Holl, C.M., Frost, D.J., Jacobsen, S.D., Langenhorst, F., and McCammon, C.A. 571
(2003) Structural systematics of hydrous ringwoodite and water in Earth's interior. 572
American Mineralogist, 88, 1402-1407. 573
Taran, M.N., Koch-Müller, M., Wirth, R., Abs-Wurmbach, I., Rhede, D., and Greshake, A. 574
(2009) Spectroscopic studies of synthetic and natural ringwoodite, γ-(Mg,Fe)2SiO4. 575
Physics and Chemistry of Minerals, 36, 217-232. 576
van Aken, P.A., and Liebscher, B. (2002) Quantification of ferrous/ferric ratios in minerals: 577
new evaluation schemes of Fe L-23 electron energy-loss near-edge spectra. Physics and 578
Chemistry of Minerals, 29, 188-200. 579
Walker, D. (1991) Lubrication, gasketing, and precision in multianvil experiments. American 580
Mineralogist, 76, 1092-1100. 581

24
Wirth, R. (2004) A novel technology for advanced application of micro- and nanoanalysis in 582
geosciences and applied mineralogy. European Journal of Mineralogy, 16, 863-876. 583
Ye, Y., Schwering, R.A., and Smyth, J.R. (2009) Effects of hydration on thermal expansion 584
of forsterite, wadsleyite, and ringwoodite at ambient pressure. American Mineralogist, 585
94, 899-904. 586
587
588
Figure Captions 589
Figure 1. 590
Ringwoodite crystal of run MA313 showing its original blue color and acquired green color 591
after the heating cycle up to 500 °C. 592
593
Figure 2. 594
OH-absorption spectra of ringwoodite (MA313) at ambient conditions, 500 °C and after 595
heating. Spectra are offset for clarity. Black lines indicate the OH band maxima (directly read 596
from the spectrum). 597
598
Figure 3. 599
UV-VIS spectra of original ringwoodite (blue) and after annealing at 500 °C (green) and 600 600
°C (orange) of run MA313. Black lines indicate the band assignments (directly read from the 601
spectra). 602
603
Figure 4. 604
MB spectrum of annealed 57Fe enriched ringwoodite (MA327). The two intense doublets with 605
large center shift are assigned to VIFe2+ (in slightly different environments) and the two 606

25
smaller doublets with lower center shift are due to Fe3+ in octahedral (larger area and low QS) 607
and tetrahedral (smaller area and higher QS) sites. 608
609
Figure 5. 610
Band deconvolution plots of the OH-absorption spectra of the original (top) and the annealed 611
(bottom) ringwoodite (MA313) including the five fitted Gaussian and Lorentzian-shaped 612
functions. Peak positions are indicated and represent the maxima of the fitted functions. 613
614
Figure 6. 615
OH-absorption spectra of ringwoodite with different iron contents. Note the shift of the low 616
energy band to higher wavenumbers and vice versa the shift of the high energy band towards 617
lower wavenumbers with increasing xFe. Spectra are offset for clarity. 618


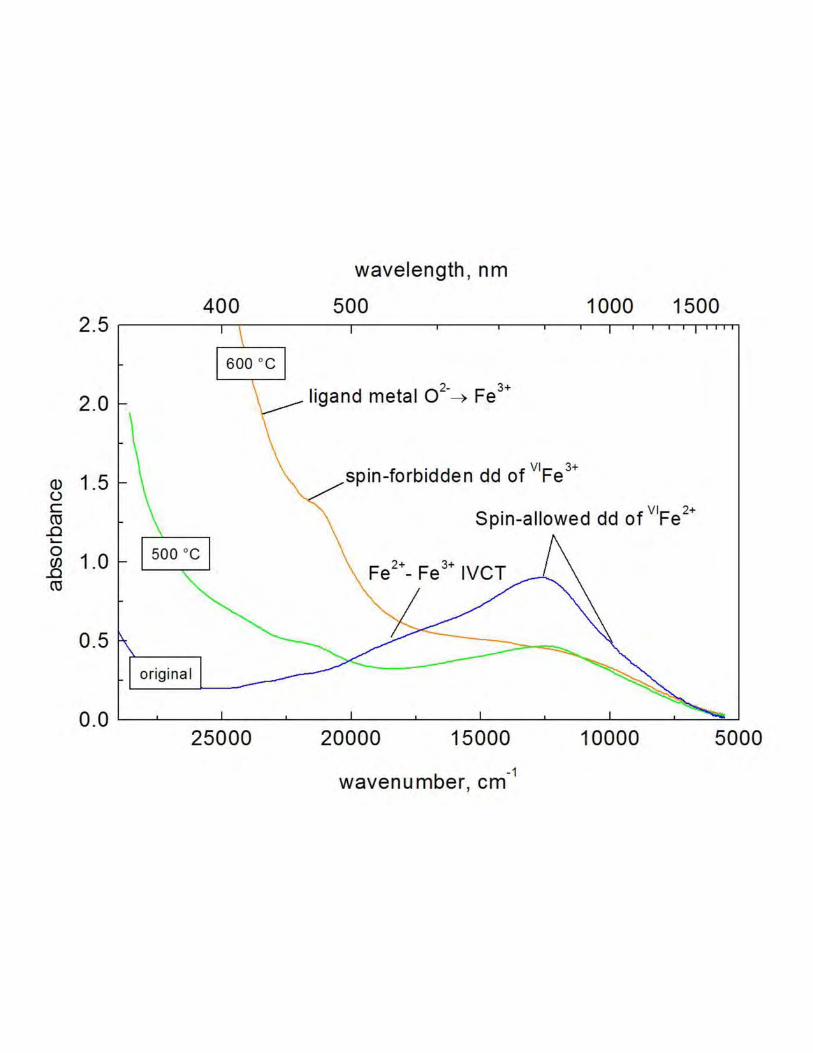


Table 1: Details of run conditions, via FTIR calculated water contents, total iron content xFe#
(EMPA), EELS and MB analyses.
run MA311 MA313 MA327* MA305 MA308 MA316
P [GPa] 16.5 17.0 18.3 16.7 18.3 17.0
T [°C] 1200 1200 1200 1200 1025 (3h) 975 (6h) 1200
t [h] 4 2 4.5 6 9 4 buffer Re/ReO2 Fe/FeO Re/ReO2 - - -
H2O [wt.%] 1.2 (2) 1.9 (3) 0.8 (2) 0.8 (2) 0.3 (2) 0.7 (2)
xFe 0.18 (1) 0.11 (1) 0.24 (1) 0.15 (1) - 0.18 (1)Fe3+/Fetotal
unannealed [%]
10 (3) 6 (3) EELS: 12 (3) MB: 9 (3) 7 (3) - 4 (2)
Fe3+/Fetotal annealed
[%] - 16 (2) EELS: 15 (3)
MB: 11 (3) - - -
# with xFe corresponding to (Mg1-xFex)2SiO4 * 57Fe enriched

Table 2: Mössbauer parameters and doublet assignments; the spectrum of the annealed
ringwoodite with fitted doublets is given in Fig. 4.
center shift
[mm/s]
quadrupole splitting [mm/s]
FWHM [mm/s]
integral area
doublet assignment
original ringwoodite1.069 2.767 (01) 0.454 (01) 90.7 (3) VIFe2+
0.665 (12) 1.063 (22) 0.812 (36) 9.3 (3) VIFe3+
annealed ringwoodite 1.082 2.708 (10) 0.403 (03) 63 (3) VIFe2+
1.077 (01) 2.940 (12) 0.326 (12) 25 (3) VIFe2+ 0.663 (17) 0.729 (27) 1.019 (74) 9.0 (7) VIFe3+ 0.175 (11) 1.425 (24) 0.354 (35) 2.3 (3) IVFe3+