
Revised Sept. 22 - Nelson
103
i Revised Sept. 22.11
Transcript of Revised Sept. 22 - Nelson

i
Revised Sept. 22.11

ii
Acknowledgements
Development of Low Carbon Path to 2040 was a City of Nelson initiative. The Plan‘s vision, strategies
and actions have been strongly shaped by input from Council, staff, community stakeholders and the
broader public. See Appendix F: Engagement Attendees for a list of those that contributed to the Plan.
Funding
Developing this Plan would not be possible without financial support from the Union of BC Municipalities,
the British Columbia Provincial Government, and the Government of Canada.
Steering Committee
The project has been guided by a Council-Staff-Community Steering Committee:
Kevin Cormack, City Manager, City of Nelson
Kim Charlesworth, Councillor, City of Nelson
Dallas Johnson, Planner, City of Nelson (Project Coordinator)
Alex Love, General Manager, Nelson Hydro
Donna Macdonald, Councillor, City of Nelson
Mel Reasoner, Climate Science Advisor, West Kootenay Eco Society
Dave Wahn, Manager, Development Services & Sustainability, City of Nelson (Project Manager)
Blair Weston, FortisBC
Advisors
HB Lanarc led engagement, analysis and strategic guidance with Community Energy Association support:
Alex Boston, Project Director, Senior Policy Analyst, HBL
Patricia Dehnel, Community Planner, CEA
Bud Fraser, Buildings & Infrastructure Advisor, HBL
Adam James, Buildings and Energy Supply Analyst, CEA
Micah Lang, Project Manager, HBL
Aaron Licker, Modeling & Mapping Specialist, HBL
Sean Tynan, Buildings and Infrastructure Analyst, HBL
Photo Credits
Cover: Photos by Doug Craig and design by Christina Worster
Chapter heading photo banners: Doug Craig
Other credits accompany photos.

iii
Executive Summary Nelson has a long tradition of conscientious community building from the economic vitality of our
downtown to our 100 year old hydro-electric utility and the vibrant diversity of community organizations.
Today, our community is vulnerable to the twin risks of global warming and steadily rising, volatile energy
prices.
Low Carbon Path to 2040 is a Plan to strengthen the resilience of our community by minimizing these
threats. This Plan builds on the City‘s complete, compact, highly-liveable character and heritage building
preservation. It is informed by and will help shape existing municipal priorities including implementation
of the community‘s Path to 2040 sustainability strategy. Designing and implementing the Plan relies on the
community‘s most critical resource – its enterprising residents, businesses, workforce, community
organizations, municipal staff and Council. This path leads to more resilient land use, transportation,
buildings, energy supply, and waste systems. It has also helped strengthen the vibrancy, prosperity, and
liveability of Nelson.
Goals
This Plan provides a vision and a clear path that builds on the community‘s priorities, foremostly the
Sustainability Strategy, with strategies in all major energy and emission sectors:
Land use
Transportation
Buildings
Energy Supply
Solid Waste
Community Wide municipal implementation priorities
Defensible targets underpin these strategies and can be used to guide implementation, monitoring and
evaluation, as well as meet the City‘s legislative requirement to the Province to include greenhouse gas
reduction targets, policies and actions in its Official Community Plan. The Plan includes a framework for
implementing short-term priority actions.
Energy and Emissions Profile
Community Energy Use: As with most BC
communities, Buildings use a majority of community
energy, followed by Transportation.
Community Emissions: As with Energy Use,
Transportation and Buildings are the largest sources of
emissions. Solid Waste sent to landfill is responsible for
a relatively small share of emissions.
The Energy and Emissions profile in Nelson looks very similar to most communities in British Columbia,
with Transportation as the largest source of emissions, and Buildings the largest source of energy use.1 In
1 Emissions reflect a combination of the quantity of energy used and the type of fuel. As electricity is a low-emissions
source of energy in Nelson, Buildings are responsible for a smaller share of emissions than of energy, while transportation is responsible for a larger share of emissions than of energy. In either sector, emissions can be
Trans-portation,
40%
Buildings, 60%
(Solid Waste, 0%)
Trans-portation,
59%
Buildings, 40%
Solid Waste,
1%

iv
2007, Nelson used 1,421,072 gigajoules of energy and was responsible for 66,753 tonnes of CO2e.
Emissions in 2007 were approximately 7 tonnes CO2e per person. This is fairly good performance
relative to other BC Interior communities.
These energy and emission consumption figures miss some of the underlying trends within the Community.
Nelson, for example, has a stock of vehicles and buildings that are older and less efficient than the stock of
many other communities. This drives up energy use and emissions despite the behaviour of Nelson‘s
citizens, who drive significantly less than comparable communities and live in smaller buildings.
Energy Spending and Economic Development
In 2007, Nelson residents and businesses spent more than $30 million on energy, or approximately
$3,200 per person per year.2 The $21.4 million in residential energy expenditures works out to an average
of $5,150 per household. Energy expenditures for small and medium sized business totalled $6.6 million,
or $6,940 per business.
The vast majority of this spending leaves town. With rising electricity and oil costs, these expenditures –
along with the economic vulnerability of many people – will dramatically increase. The conservation,
efficiency and renewable energy strategies in this Plan are intended to keep a larger portion of these
expenditures in the community, stimulating the local economy.
Investing in renewable energy creates twice as many jobs as equivalent investments in new supply; and
investing in conservation and efficiency creates four times as many jobs. Some of this spending is in local
hardware and lumber or green building jobs for the construction trades, entry level employment in
weatherization, and engineers in renewable energy system design. An even greater portion is the re-
spending effect from reduced energy spending redirected towards other local economic activity such as
recreation and leisure, retail and restaurants.
Strategies & Targets Overview
The Low Carbon Path to 2040 will enable Nelson to achieve the following targets over a 2007 baseline by
2040:
57% reduction in per capita GHG emissions (from 7 to 3 tonnes per year)
43% reduction in community-wide GHG emissions
26% reduction in community-wide energy use
The strategies and key targets are summarized below by sector.
improved either through increased energy efficiency or through switching to low-carbon fuel sources, or a combination of the two. 2 These figures are based on energy consumption from the 2007 Ministry of Environment Community Energy and
Emissions Inventory and average 2007 energy expenditures from Nelson Hydro, FortisBC gas rates, transportation fuel costs, and fuel oil costs.

v
Land Use determines where residents live, work, shop, and play, and influences how they get there.
Land-use policies strongly influence energy use and emission from transportation and buildings. The Path
to 2040 Sustainability Strategy, along with specific strategies and actions provided below, can inform the
Downtown and Waterfront planning processes.
Strategies
A. Build on the Community‘s Complete, Compact and
Centered Form to maximize low carbon transportation
options and district energy
B. Encourage Secondary Suites and Infill Cottages for their
inherent superior energy performance.
C. Climate Protection Design Guidelines to encourage
buildings, landscapes and activity patterns that are both
low-carbon and resilient to climate change
Key Targets
By 2040, 80% of dwellings are within a 10
minute walk from local services
Transportation produces a majority of Nelsons‘ emissions. The strategies in this sector and the
Land Use sector will complement those that have already been identified in the Active Transportation Plan.
Strategies
A. Mainstream Low Carbon Transportation throughout the
community
B. Build Kootenay Rideshare Capacity
C. Enhance Public Transit Locally and Regionally
D. Implement the Nelson Active Transportation Plan
E. Low Carbon Transportation Education and Outreach to
strengthen citizen and employer action
Key Targets
By 2020, household Vehicle Kilometres
Traveled (VKT) is reduced 12% from 2007
By 2040, household VKT is reduced 33% from
2007
Buildings Most GHG emissions from buildings result from natural gas used for space and water heating.
Nelson‘s building stock is significantly older than the Provincial average. Some of the most effective
measures to reduce energy use and emissions are improvements to building envelopes (insulation) and
more efficient appliances for both new construction and existing buildings.
Strategies
A. Establish a Home and Business Energy Retrofit
Program
B. Increase efficiency in New Buildings
C. Encourage Secondary Suites and Infill Cottages
D. Advance Building-scale Renewable Heat
E. Capacity Building and Social Marketing to
Program to ensure success of Buildings sector
strategies
Key Targets
Increase building energy retrofit rate for existing
buildings to 2% by 2020
Renewable energy is installed in 75% of buildings
constructed annually by 2020

vi
Energy Supply the source and type of energy supply influences emissions in the buildings sector.
Nelson is already exploring the potential for District Energy and renewable heat. Due to steep terrain, there
may also be micro-hydro opportunities in Nelson.
Strategies
A. Establish District Energy Systems in Lakefront
and Selkirk-Davies
B. Maintain Near-Zero Emissions for Electricity
C. Explore Sustainable Wood for High Efficiency
Heating
Key Targets
Maintain emissions from electricity at 2007 levels
Connect 70,000 square meters of floor space to District
Energy by 2040
Solid Waste Diverting organic materials from landfill can reduce greenhouse gas emissions. There is
substantial local interest in using organic waste for compost and gardening.
Strategies
A. Advance Zero Waste Education through
Collaboration with the Regional District
B. Increase Recycling and Organics Diversion
with Improved Local Services
C. Implement a Comprehensive Building
Demolition Waste Management Program to
divert waste from landfill
D. Reduce Solid Waste Generation through
targeted local and regional policy
Key Targets
By 2020, Increase organics diversion rate to 50%
By 2040, Increase organics diversion rate to 80%
Community Wide measures cross traditional energy and emission sectors and
municipal line departments and extend out into the community. These measures help ensure the
municipality‘s ongoing business activity supports a low carbon agenda.
Strategies
A. Build City staff‘s capacity to support low
carbon community development
B. Engage with Citizens, Businesses, Non-
Profits, and Public Sector Organizations to
move down the Low Carbon Path
C. Support regional food and agriculture
systems to reduce greenhouse gases and
vulnerability to rising food prices.
Key Targets
By 2015, all City departments have integrated qualitative
assessment of greenhouse gas emissions into their planning
and budgeting processes.

vii
Priority Actions
For each strategy, priority actions were developed in order to provide short term implementation guidance.
In addition, the priority actions were assigned scores in each of five categories: greenhouse gas reduction
potential, cost, profile (potential for community and public interest) and ease of implementation. Based on
the average score of each priority action a priority ranking of ―high, medium or low‖ was assigned. The
priority actions and their rankings, in parentheses, follow below.
Land Use
Integrate land use strategies into an OCP (Official Community Plan) Update and Land Use Regulation
Bylaw (Medium)
Infill home pilot project (Medium)
Update OCP and Land Use Regulation Bylaw with infill home provisions (High)
Climate Protection Design Guidelines (Medium)
Transportation
Low carbon transportation policy (Medium)
Requirement for Transportation Master Plan for new commercial developments (Medium)
Collaborate with Kootenay Rideshare to explore enhancements to service (Medium)
Integrated Low Carbon Transportation Study (Medium)
Identify and address barriers to implementing the Active Transportation Plan (Medium)
Social marketing and education (Medium)
Buildings
Building retrofit pilot (Medium)
Put in place one or more policy tools that will move developers to construct buildings that exceed BC
Building Code energy performance requirements (High)
Energy Supply
Strategic plan for district energy (Low)
Pressure reducing valve micro-hydro monitoring and assessment (Low)
Run-of-river micro-hydro monitoring and assessment (Low)
Incorporate Biomass Recommendations into District Energy (DE) Phase 2 Study (High)
Develop a Solar Ready Bylaw (Medium)
Solid Waste
Additional recycling and composting drop-off sites (Medium)
Reduction of corporate carbon liability through community composting (Medium)
Construction, deconstruction and demolition pilot project (Low)
Letter of support to provincial and federal government to extend producer responsibility (High)
Community Wide
Put in place a Community Carbon Offset Framework (High)
Municipal finance carbon accounting analysis policy (Medium)
Low carbon local business advising (High)
Low carbon community pledge (High)
Education and outreach hub (Medium)
Energy and emissions economic development (High)

viii
Low Carbon Path – Modeled Results
The Low Carbon Path is comprised of sector-specific objectives, strategies and priority actions
that will result in significant GHG emission reductions and strengthen local energy sustainability.
To ensure the strategies result in an emissions path that is both achievable and ambitious,
modeling techniques were used to forecast future energy and emissions levels based on
assumptions developed through consultations with staff, Council and community stakeholders (see
Appendix A for more details) and informed by a critical appreciation of related strategies in North
America. Performance assumptions labelled as ―outputs‖ are generated through this modeling
process and are reflected in many of the maps and graphs, notably those projecting GHG
implications.
These charts reflect annual
emissions in Nelson under two
possible emissions futures: the
Low Carbon Path, and a ―no
action‖ scenario.
The top line represents potential
GHG emissions if no additional
policies or actions are undertaken
after 2012. Existing building and
vehicle stock are still replaced with
more efficient units, but only to
the point where they meet 2012
standards.
The Low Carbon Path Emissions
line represents projected emissions
if all policies in this Plan are
implemented at both local and
senior government levels. Even if
all policies are implemented, a
significant amount of emissions
remain.
The Greenhouse Gas Emissions
Reduction Wedge Chart provides a
more detailed analysis of
emissions reductions in the Low
Carbon Path. Each wedge
represents a bundle of closely
related policies and actions.
Wedges are divided by local and
senior government based on which
has the most direct ability to
infleunce outcomes.

ix
Table of Contents
Executive Summary .................................................................................................... iii
Table of Contents ........................................................................................................ ix
List of Figures ...............................................................................................................x
1. Context ......................................................................................................11
Vision and Goals ...........................................................................................................2
Report Structure ............................................................................................................4
General Methodology ...................................................................................................5
Climate, Energy & Our Community ...........................................................................10
Deep Reductions: Local & Senior Government Action .............................................14
Nelson's Community Energy & Emission Profile ......................................................16
2. Taking Action ...........................................................................................20
Overview .....................................................................................................................21
Land Use .....................................................................................................................26
Transportation .............................................................................................................33
Buildings .....................................................................................................................40
Energy Supply ............................................................................................................50
Solid Waste .................................................................................................................57
Community Wide Measures .......................................................................................62
Citizen and Business Action .......................................................................................67
3. Implementation, Funding & Monitoring ......................................70
Implementation Framework ........................................................................................71
Priority Action Ranking ..............................................................................................78
Funding .......................................................................................................................82
Monitoring and Indicators ..........................................................................................87

x
List of Figures Figure 1: The Greenhouse Effect ................................................................................................................. 11
Figure 2: Trends in Atmospheric Concentrations ......................................................................................... 11
Figure 3: Government Spheres of Influence: . ............................................................................................. 14
Figure 4: Comparison of per capita emissions ............................................................................................. 18
Figure 5 – Nelson Energy Sankey Diagram ................................................................................................. 19
Figure 6 – Emissions Wedge Chart ............................................................................................................... 23
Figure 7 - Transportation Mode Hierarchy .................................................................................................... 34

L
Low Carbon Path to 2040 11
1. Context

2 City of Nelson Climate Action & Energy Plan
Vision and Goals
Low Carbon 2040 Vision
Nelson has a long tradition of conscientious community building
from the economic vitality of our downtown to our 100 year old
hydro-electric utility and the vibrant diversity of community
organizations.
Today, our community is vulnerable to the twin risks of global
warming and steadily rising, volatile energy prices.
Low Carbon Path to 2040 is a Plan to reduce these threats. This
Plan builds on the City‘s complete, compact, highly-liveable
character and heritage building preservation. It is informed by
and will help shape existing municipal priorities including
implementation of the community‘s Path to 2040 sustainability
strategy. Designing and implementing the Plan relies on the
community‘s most critical resource – its enterprising residents,
businesses, workforce, community organizations, municipal staff
and Council. This path leads to more resilient land use,
transportation, buildings, energy supply, and waste systems. It
has also helped strengthen the vibrancy, prosperity, and
liveability of Nelson.
Land Use & Transportation
The appeal of walking downtown has extended across most of
the community with good sidewalks and tree-lined streets
providing shade during the increasingly hot summers. An
extensive bike network provides well connected and safe routes,
increasing the allure of biking. Conveniently located grocery
stores, cafes and parks across many neighbourhoods have
contributed greatly to predominance of biking and walking for
most local trips. A range of vans and electric buses on
convenient routes allow residents, students and the regional
workforce to move easily and rapidly around town and to
neighbouring communities.
Nelson‘s ground-breaking ride share initiative uses high-tech,
hand-held trip coordination and security features and old
fashioned hitching posts to allow drivers and riders to easily
coordinate safe trips for work, college, recreation and retail
activity within the region.
Diverse travel modes are facilitated by an innovative multi-
modal strategy that involves extensive collaboration amongst the
City, Regional District, School Board, College, BC Transit, local
non-profits and business groups, allowing residents, students,
workers to move seamlessly from foot to bike to bus to car.
Buildings
A pioneering energy retrofit program led by Nelson Hydro with
active engagement by FortisBC and many community partners
and the local building industry has preserved the charm of the
City‘s heritage buildings while transforming them into high
efficiency, high comfort, state-of the art structures. New homes,
businesses and institutional buildings reduce energy demand to
absolute minimums with ultra high thermal performance,
electricity and mechanical systems. A diversity of homes from
low rises, row houses, single-detached, as well as small infill
cottages provide options for the community‘s diverse incomes
and ages, allowing citizens to live their entire lives in the
community.
Energy Supply
New buildings and many older ones use renewable heating and
cooling, including passive design. More compact, mixed use
areas such as the early 21st century Waterfront, the historic
Downtown, and Fairview are part of neighbourhood energy
systems that distribute heating and cooling from renewable
energy.
Solid Waste
The community diverts the vast majority of it waste from
landfills and is on its way to realizing its zero waste goal.
Material consumption has been reduced by senior government
leadership on packaging and product design. Backyard and
neighbourhood composts dot the community. Centralized
composting is used for select businesses and institutions.
Businesses and residents are dedicated users of convenient eco-
depots and curbside programs. Several businesses have high
efficiency, low emission furnaces that burn unusable wood from
construction waste, trimmings and fire guards.

Low Carbon Path to 2040 3
Agriculture
People across the region have responded proactively to changes
in rainfall patterns, heat intensity, and weather predictability,
growing a much larger share of their own food as well as
processing it. This increased regional self reliance has reduced
resident and business exposure to the rising cost of food.
Municipal Alignment
Amongst its many other priorities, the City has aligned its
organization with taking action on climate and energy, notably
in finance, planning and development, and operations.
Economy
Residents and businesses have avoided massive growth in
energy spending through efficiency and conservation, despite
skyrocketing prices for traditional forms of energy with gasoline
leading the way. A large portion of these avoided costs have
resulted in increased local spending. A much larger share of
energy-related spending, including conservation, efficiency and
renewable energy supply, is spent locally. Reliable, affordable
heat, power, and mobility have attracted many entrepreneurs and
knowledge based workers to the community who have the
flexibility to perform their work wherever they chose.
A thriving local green building industry composed of trades
people, young trainees, architects, engineers and technicians has
been the heart of local building and renewable energy advances.
They are also exporting their talent far beyond the community to
build low carbon homes, offices and neighbourhoods.
Community
Programs and partnerships have provided residents, businesses,
the building industry, public institutions with strategic guidance
to advance sustainable energy and reduce greenhouse gases.
People have been compelled to take action because of a
knowledge that these programs are helping protect the climate
upon which they depend and their commitment has helped
strengthen the resolve of other communities and contributed to a
country and world-wide climate protection movement.
We are also confident that the agenda we have participated in
and shaped, along with our parents and grandparents has helped
strengthen the vibrancy, liveability and resilience of Nelson.
Goals The Plan‘s goals are several-fold:
Provide a meaningful vision informed by the community‘s
past and present experiences and future aspirations
Map out the situational context for developing and
implementing strategies, including the policy context and
current community energy and emission profile
Define a clear path that builds upon goals and principles of
the City‘s Sustainability Strategy and integrates and makes
recommendations to existing City policies and plans
Outline clear strategies in key energy and emission sectors:
o Land use
o Transportation
o Buildings
o Energy Supply
o Solid Waste
Establish defensible greenhouse gas reduction targets and
policies and actions to achieve them that meet the BC
government‘s Official Community Plan requirements in
section 877 of the Local Government Act
Delineate a near term implementation and monitoring
strategy with guidance on funding and partnerships
Provide guidance on delivering strategies to promote low
carbon lifestyles and local businesses.

4 City of Nelson Climate Action & Energy Plan
Report Structure
Report Outline
This plan is organized into three major sections, in addition to a set of appendices.
Section 1: Context
This section sets the scene for the action plan.
The Vision and Goals for the Plan are introduced
The Methodology for developing the Plan is described,
including an overview of the modeling and mapping, use of
indicators and targets, and synergies with Nelson`s Path to
2040 sustainability strategy
Climate, Energy and our Community provides an overview
of these twin challenges and their relevance to community,
along with a discussion of the local opportunity and current
activities in Nelson that complement this agenda
Nelson‘s Energy and Emissions Profile is described
Section 2: Taking Action
This is the essence of the Plan.
An overview includes a description of the major strategies
and the modeled energy and emissions results from
implementing the strategies
This is followed by a sector by sector delineation of
objectives, strategies, targets, performance indicators, and
priority actions covering:
o Land Use
o Transportation
o Buildings
o Energy Supply
o Solid Waste
o Community-Wide Measures
Section 3: Implementation, Funding & Monitoring
This section provides implementation and monitoring guidance.
An implementation framework that contains lead players,
partners, marginal costs and funding opportunities for
priority actions
A list of potential funds for further planning and
implementation
A monitoring strategy that emphasizes key indicators and
performance metrics, and the integration of key actions into
existing Nelson activities
Section 4: Appendices
The following appendices provide reference material
Appendix A: Technical Modeling Methodology
Appendix B: Modeling Performance Assumptions
Appendix C: Climate Protection Pledge
Appendix D: Sustainability Checklist Recommendations
Appendix E: Draft OCP Amendment – Targets, Policies and
Actions
Appendix F: Engagement Event Attendees
Appendix G: Building & Business Sectors – Key Comments
Appendix H: Tools to Support Green Buildings
Appendix I: Select Resources
Land Use
Transportation Buildings Energy Supply Waste Cross-Cutting

Low Carbon Path to 2040 5
General Methodology This Plan was developed through active engagement, rigorous analysis, innovative policy and planning, including integration of best
practices that are appropriate for the Nelson context. A description of the engagement streams, and modeling and mapping approach
follow the five step general methodology.
Key Tasks • Preliminarily examine existing related activity, community priorities, challenges and opportunities
• Generate community energy and emission profile, providing a baseline of current performance and
understanding of major variables driving and constraining growth
Engagement • Project Steering Committee
• Key City Staff
Deliverable • Community Energy & Emission Situational
Analysis
Tasks • Identify preliminary strategies to inform development of a plan
• Foster stakeholder knowledge of climate change, sustainable energy and community
Engagement • Public Open House
• Chamber of Commerce-City Business Workshop
• Development Sector Workshop
• Multi-Stakeholder Workshop
Tasks • Develop draft objectives, strategies and actions based on community and stakeholder input and
knowledge of best practices
• Estimate performance changes based on the draft strategies and calculate the energy and emission
implications
Engagement • Project Steering Committee
• City Staff
Deliverables • Sustainability ―Test Run‖ Paper of Draft
Objectives, Strategies and Actions
• Business Actions & Options Survey
Tasks • Solicit feedback on draft strategies and actions and seek direction on additional analysis
• Further strengthen stakeholder knowledge of climate change, sustainable energy and community
Engagement • Chamber of Commerce-City Business Consultation
• Development Sector Workshop
• Multi-Stakeholder Workshop

6 City of Nelson Climate Action & Energy Plan
Engagement Streams
The Plan‘s vision, strategies and actions have been strongly
shaped by the input of Council, staff, community stakeholders
and the broader public:
Project Steering Committee: This steering committee
provided direction and feedback on process and substance
with representation from Council, Administration,
Development Services, Nelson Hydro, FortisBC, and West
Kootenay EcoSociety.
Council: As well as Steering Committee representatives,
other councilors and the Mayor participated in workshops,
providing input on all sectors.
Staff: Development Services staff managed the project.
Key staff from Operations and Engineering, and
Administration participated in workshops, providing input
on strategies they would likely play a role implementing.
Business Community: The City collaborated closely with
the Chamber of Commerce to involve businesses in
identifying relevant strategies pertaining to them and
maximizing local economic benefit.
Development Sector: Local builders, developers,
architects, energy auditors, engineers and renewable energy
experts provided input on buildings and energy supply
strategies.
Community Stakeholders: A wide diversity of public,
private, and non-profit organizations covering social,
environmental, economic and cultural interests offered input
on all strategies.
Public: An open house early on in the process was hosted to
get feedback from additional, interested members of the
community.
See Appendix F: Engagement Event Attendees for more details
Modeling & Mapping Overview
Future energy and emissions have been calculated using the
Community Energy and Emissions Modeling and Planning tool
(CEEMAP). See CEEMAP tool diagram on the following page.
CEEMAP is based on several dynamic, interactive models that
incorporate key indicators – ostensibly model inputs – that drive
and constrain energy use and greenhouse gas emissions covering
socio-economic considerations and all major community energy
and emission sectors over which local governments have
significant influence. CEEMAP uses the following indicators:
Socio Economic Data, e.g. residential and employment
population
Land Use & Community Design, e.g. location and density
of commercial and residential buildings
Transportation Technology & Patterns, e.g. number and
type of automobiles, transit routes and frequency
Building Type & Performance, e.g. single detached or multi
family home type, building energy rating, retrofit rate
Heat & Electricity Supply, e.g. electricity from grid or other,
specific district energy technology, building-scale
Solid Waste Management, e.g. waste composition and mass,
management practice
A baseline model is populated using values for the year for
which the best data is available. In this case 2007 is used – also
the year in which the BC government established its emission
reduction targets.
Tasks • Update strategies and actions and reinforce with additional analysis
• Refine estimate of performance changes based on the updated strategies and re-calculate the energy
and emission implications
• Develop implementation and monitoring strategy
Engagement • Project Steering Committee
• Key City Staff
Deliverables • Draft Final Plan
• Final Plan

Low Carbon Path to 2040 7
Values for these indicators are then projected into the future
based on the type and intensity of strategies Nelson is planning
to implement. For example, a building retrofit strategy would
change the energy performance of a specific number of existing
buildings per year by a specific amount. A ride share strategy
would change the number of vehicles travelling to specific
destinations. CEEMAP also considers the impact of senior
government policies on community activity. BC Building Code
updates, for example, will change the energy rating of future
buildings, and vehicle Tailpipe Standards will change the
performance of future vehicle stock.
CEEMAP then uses empirically-derived knowledge of the
relationship (i.e. function) between these indicators (i.e. model
inputs) to calculate energy and emissions changes (i.e. model
outputs) at future milestones (in this case at 2020 and 2040, the
final horizon for Nelson‘s Sustainability Strategy).
As well as changes to energy use and greenhouse gas emissions,
CEEMAP generates other outputs such as vehicle kilometers
travelled by neighbourhood and across the community, and
building energy consumption by neighbourhood. Additional
outputs developed by the tool include illustrative charts and
maps.
Because so many indicators influencing energy and emissions in
transportation and buildings as well as energy supply are
influenced by location, current and future conditions are
graphically shown using maps generated through Geographic
Information Systems (GIS).
See Appendix A: Technical Modeling Methodology for a more
detailed description of the variables and their energy and
emission relationships

8 City of Nelson Climate Action & Energy Plan
Indicators, Targets, Implementation & Monitoring
At the end of each energy and emission sector in Part II: Taking Action is a table of Indicator Highlights with the values for key
indicators used as inputs to model the energy and greenhouse gas implications of the strategies in that sector. These summary tables
contain a subset of the full list of indicators that are in the Monitoring section. The following table explains the terminology used in
the table.
Indicator Highlights Table
Indicator Explanation 2007 Base Year Low Carbon Path
Key variable influencing energy
and/or emissions used in the model
to map the community’s energy and
emissions future
Significance of this
indicator
Value in 2007
Variable value at future milestone years as a
result of the implementation of sector specific
strategies
Example:
Vehicle Kilometres Traveled (VKT)
per household
A measure of how much
residents drive in one year
averaged at the household
level.
24,415 kilometres
2020: 21,400 (-12% from 2007)
Implementation & Monitoring
These indicators will be used to assist with implementation,
providing meaningful guidance for more detailed policy and
program development, and support ongoing measurement and
monitoring for staff, council, and the community. See Section 3:
Implementation, Funding & Monitoring
Targets
Targets are values for strategically important values identified
by an organization -- in this case the City of Nelson -- to help
muster the intellectual, financial and social resources necessary
to advance a strategy as well as monitor progress and, in turn,
make coarse adjustments.
Requirements under the Local Government Act to include GHG
reduction targets, policies and actions in Official Community
Plans have given much greater stature to community GHG
targets. At the same time, the urgency of our energy security
and climate stabilization challenges will ultimately demand more
defensible and strategic quantitative evaluation of strategies by
all levels of government.
This planning process has generated targets and indicator values
used in the modelling process. These targets and the associated
indicator values should be refined and updated over time as
more detailed planning and implementation work is undertaken
for specific strategies.
Good targets are SMART:
• Specific
• Measureable
• Achievable
• Relevant, i.e. to Council, staff and/or the community
• Timebound, i.e. a timetable is associated with the target

Low Carbon Path to 2040 9
Nelson Path to 2040 Sustainability Strategy Synergies
Path to 2040 icons are used at the beginning of each energy and
emission sector in Part II: Taking Action to show the synergies
between the strategies in this Plan and Nelson‘s broader
Sustainability Strategy entitled Path to 20403
Arts, Culture and
Heritage
Local Economy
Energy and
Climate Change
Natural Areas,
Recreation and
Leisure
Food, Food
Security and
Agriculture
Solid Waste
Healthy Living
and Social Well-
Being
Transportation and
Mobility
Land Use
Water, Waste
Water, Stormwater
Strategies, Actions, Priority Actions, Targets and the Low
Carbon Path
The Low Carbon Path is divided by sector (land use,
transportation, buildings energy supply, solid waste and
Community Wide measures), with each sector comprised of
several strategies that address the opportunities and challenges
for reducing greenhouse gas emissions and energy use. Each
strategy is made up of one or more actions that describe a
specific next step that should be taken to advance the strategy.
Within some of the strategies there are also priority actions,
which detail key next steps for advancing the strategy and
emission reductions within Nelson.
Strategies, actions and priority actions were selected for
inclusion in this Plan according to the following considerations:
Interest from stakeholders, staff, Council and the
community
Greenhouse gas emission reduction potential
Synergy with existing community priorities and
initiatives
Feasibility of implementation given local conditions
and regional/provincial/national trends. Feasibility
3 These icons were developed by Stantec Consulting s a part of the
“Nelson Path to 2040 Sustainability Strategy” project. They are reproduced with permission.
includes technological, economic and social
considerations.
The name Low Carbon Path was chosen to describe the
collection of strategies and actions, as one purpose of the Plan is
to help the community understand both the direction Nelson
should be heading in and how it can get there. The strategies are
long term initiatives that encompass numerous activities within a
sector. The actions, priority actions and policy/practice vignettes
(that appear within text boxes) describe what should or could be
done in the short term to advance the strategies. Because the
focus is on near term next steps (2011–2020, with most likely
taking place in 2011-2016), Nelson will need to identify
additional actions and regularly revise and refine the strategies in
order to achieve the emission reductions in 2040 that have been
highlighted using CEEMAP. The graphs, charts and maps
produced from CEEMAP illustrate the results of implementing
the actions and priority actions and give snapshots of the Low
Carbon Path at three key milestones: the 2007 baseline, 2020
and 2040.

10 City of Nelson Climate Action & Energy Plan
Climate, Energy & Our Community
Challenge & Opportunity
Communities are particularly vulnerable to climate change due
to the extensive infrastructure threatened by the increasing
intensity of weather related disasters. They are vulnerable to
rising and volatile energy prices because of the sheer amount of
energy consumed. A growing number of policies by senior
governments are increasing the importance of GHG reductions
and sustainable energy.
Local governments have significant influence over community
emissions. Moreover, taking action can strengthen the economic
and social vitality of our community.
Climate Change Challenges
The relative stability of the earth‘s climate over the last 10,000
years has allowed human civilization to flourish. However,
through burning oil, coal, and gas, and by clearing large tracts of
land for housing, forestry and agriculture, humans have
increased carbon dioxide concentrations in the atmosphere to
levels not seen for at least 800,000 years. These heat-trapping
gases are contributing to an incremental rise in global
temperatures disrupting natural and physical systems upon
which our health and prosperity depend.
The most recent International Panel on Climate Change (IPCC)
report (IPCC 2007a) concluded that global emissions need to
peak before 2015, with 50-85% reductions below 2000 levels by
2050, if we are to avoid tipping points that will cause dangerous
disruptions, such as severe agricultural collapses, water
shortages, droughts and sea level rise.
The economics are also increasingly clear. Commissioned by
the British Government and authored by former World Bank
Chief Economist Nicholas Stern, the Economics of Climate
Change estimated the costs of reducing greenhouse gas
emissions to a safe level were one percent of global gross
domestic product; compared to a loss of up to 20% of global
GDP if we do nothing. Stern concluded that ‗the benefits of
strong, early action on climate change outweigh the costs.‘ 4
4 HM Treasury. Stern Review on the Economics of Climate Change.
http://www.hm-treasury.gov.uk/sternreview_index.htm
Communities are vulnerable to climate change due to an
extensive infrastructure supporting high concentrations of people
and economic activity. Insurance Bureau of Canada data show
costs of property damage from natural catastrophes doubling
every 5 to 10 years and has attributed much of this growth to
Climate Change.5 From floods to fires and windstorms, BC
communities have been experiencing higher and higher costs.
Many local governments have also begun to realize that when
disaster strikes, they are on the front lines.
Changes expected in Nelson area during this century include:6
Warmer annual temperature
Glacier retreat in surrounding areas
Changes in seasonality of stream flow
Increased evaporation
Longer fire seasons may result in more interface fires that
threaten communities and infrastructure
Winter warming
Mid-winter thaw events may damage roads and cause ice
jams and flooding with damage to infrastructure such as
bridges
Fewer days of snow, impacting winter recreation/tourism
such as skiing
Warmer, drier summers
Possibility of more prolonged and intense droughts with
lower water supply during periods of peak demand
Reduced soil moisture and increased evaporation, increasing
irrigation needs at the same time of year that streamflows
are expected to decline
Higher temperatures encourage the growth of unfavourable
algae and bacteria, adversely impacting water quality
Possible declines in recharge rates for groundwater sources
Improved potential for high value crops, if sufficient water
is available; warmer temperatures may favour weeds,
insects and plant diseases
In addition, the community will experience disruptions that
occur in other parts of the world such as the rising price and
periodic constraints in agricultural production.
5 Insurance Bureau of Canada. (May 4, 2003) Hurricane Juan insurance
tab tops $113 million: points to need for preventive measures. 6 Pacific Climate Impacts Consortium 2010. Data accessed from
Plan2Adapt tool: www.plan2adapt.ca

Low Carbon Path to 2040 11
Figure 1: The Greenhouse Effect (University of Washington)
The Greenhouse Effect & Climate Change
Greenhouse gases including carbon dioxide, methane and even
water vapour occur naturally in the atmosphere maintaining a
temperature that has been conducive for ecosystems and human
civilization to flourish for 10,000 years. This is the natural
greenhouse effect (Figure 1).
Burning oil, coal and gas for energy and clearing forests for
cities and agricultural has released an additional 30% carbon
dioxide into the atmosphere since the beginning of the industrial
revolution (Figure 2). Methane emissions have also increased
from livestock and decomposition of solid waste in landfills. The
increased presence of these gases has created an enhanced
greenhouse effect. This enhanced greenhouse effect has trapped
more heat in the atmosphere leading to climatic changes, such as
shifting precipitation patterns and intensifying storms leading to
floods and droughts; reducing snow packs, glaciers and sea ice
leading to rising sea levels, hydro-electric insecurity; changing
ecosystems allowing pine bark beetles to endure warmer winters.
Deep GHG reductions will allow us to avoid the most serious
consequences of climate change.
Figure 2: Trends in Atmospheric Concentrations and Anthropogenic
(human generated) Emissions of Carbon Dioxide (Oak Ridge National
Laboratory, US DoE)
Energy Security Challenges
Energy has been called the Achilles Heel of modern Western
society. Energy inputs to our economy and society have grown
dramatically – everything we consume and do in our
communities depends on energy – while easily accessible (low-
cost) supply is declining.
The International Energy Agency expects global energy
demand to increase 45% by 2030.7
The US Energy Information Administration low cost
estimate of oil is $115 per barrel by 2020. Their high
estimate is $185.8
Provincial electricity rates are forecasted to double by
2020.9
Natural gas prices are expected to rise 13-85%, by 2020.10
The volatility in oil and natural gas prices expected by most
industry and government sources is potentially worse than rising
energy costs. These fluctuations create uncertainty about the
future, compromising budget forecasting and long term
planning.
7 International Energy Association. World Energy Outlook 2008 Fact
Sheet: Global Energy Trends. 8 Energy Information Administration 2009. Annual Energy Outlook, p.
161. 9 BC Hydro Directive 17, 2006 IEP/LTAP Long Term Rate Increase
Forecast filed with BC Utilities Commission. The average residential customer spends about $720 per year on electricity. 10
Energy Information Administration 2009. Annual Energy Outlook.

12 City of Nelson Climate Action & Energy Plan
BC Climate and Energy Policy Developments
In light of the scientific evidence on the dangers of climate
change, the BC Government announced in 2007 a commitment
to reduce provincial GHG emissions 33% below current levels
by 2020 and 80% by 2050. While many factors influenced
development of these targets, the most important from a risk
management perspective is their consistency with scientific
evidence on the scale of reductions necessary to avoid
dangerous, runaway climate change.
The BC Government is developing policies that will require and
support all sectors to contribute to these commitments. Many of
these policies reinforce complementary efforts to reduce energy
consumption and promote low carbon energy supply – another
important provincial agenda. Developments that pertain to local
governments include:
Green Communities Act: Amongst other changes, Bill 27
required new content in Official Community Plans and
Regional Growth Strategies, specifically: ―…targets for the
reduction of GHGs… and policies and actions... [for]
achieving those targets‖
Climate Action Charter: The BC Government and the vast
majority of local governments, including the City of Nelson,
signed a voluntary commitment to:
o Measure and report community GHG emissions
o Create complete, compact, energy-efficient
communities
o Become carbon neutral in local government operations
by 2012
GHG Reduction Targets Act: Bill 44 added rigour to the
provincial targets, specifically:
o Province-wide emissions will be legislatively required
to be 33% below 2007 levels by 2020 and 80% by 2050
o Public sector organizations, including school districts,
health authorities and post secondary institutions, will
be legislatively required to be carbon neutral
BC Energy Plan: Launched in 2007, the Plan features 55
policy actions to address climate change and energy
security. Key policies include:
o Clean generation and conservation goals
o Building energy efficiency goals (see BC Building
Code below)
BC Building Code: Recent revisions contain some of North
America‘s highest building energy efficiency standards. The
BC Energy Plan includes 2020 targets for 20% reductions in
energy use per home, and a 7% reduction in energy
consumption per m2 of commercial floor space. Due to the
long turnover of building stock, reaching these targets will
require stringent energy efficiency requirements for new
buildings in the Building Code, and aggressive retrofit
measures. Provincial officials have indicated that by 2030,
net zero energy homes may be required, standards for larger
(part 3) buildings may be 43% more efficient than current
regulations.11
Nelson Hydro and FortisBC: Because of its hydroelectric
dams, Nelson Hydro has relatively low infrastructure costs,
and thus customers enjoy some of the lowest electricity rates
in North America. To mitigate against rising energy demand
and costs, FortisBC operates energy conservation and
efficiency programs for residential, commercial and
industrial customers.
Climate Protection: Convenient Opportunity
Climate Change is not just an inconvenient truth. It is a
convenient opportunity!
Strategies to reduce greenhouse gases and advance sustainable
energy can advance core priorities that that deeply resonate with
Council, staff and the community. The best emission reduction
plans are as much about these other core priorities as they are
about climate protection. Priorities that complement a low
carbon agenda that have shaped this Plan are:
o Strengthening the local economy by re-directing energy
spending through avoided energy costs to local
businesses, and efficiency and renewable energy and
Nelson`s budding green building sector
o Improving affordability by increasing housing choice,
improving energy performance, and reducing
transportation costs.
o Reducing business and resident financial risk from
rising and volatile energy prices, notably gasoline.
o Strengthening the City‘s asset management regime by
building lighter, more strategic infrastructure.
o Encouraging healthy lifestyles, liveability and safety by
enhancing neighbourhood design with support for
viable micro commercial activity, parks and extending
walking and bicycling infrastructure
11
Based on HB Lanarc’s communications with Provincial code authorities

Low Carbon Path to 2040 13
Local governments also have significant capacity to manage
community emissions. Local government decisions influence
approximately 50% of greenhouse gases.12
They have significant
influence over local land use, transportation patterns, building
energy use and solid waste management — all large emission
sources.
Of all levels of government, local governments also have the
most direct relationship with citizens – through the services they
deliver. If personal carbon footprints are going to change, it is
because local governments will help them step more lightly.
Current Community Actions
The City of Nelson and the broader community is already
actively involved in a wide range of activities that promote
sustainable energy and manage emissions, including:
Transportation
Transportation Planning Review and Project
Implementation Strategy (2007): Phased strategy for
implementation of prioritized recommendations from a
series of transportation studies.
Comprehensive Active Transportation Plan (2010):
Comprehensive plan to highlight multi-use trails and
network for active transportation.
Regional Transportation Plan (forthcoming 2010): Currently
being developed between RDCK and RDKB to address
regional transportation issues and service levels.
Local Motion Grant Funding (2007 & 2009): Funding
received for integrated walking and cycling network;
upgrades to sidewalks and multi-use paths within the City.
Public Transit Exchange: Establish a multi-modal
downtown transit hub, improve public transit, and improve
roadways to encourage transit and active transportation, and
active transportation network integration.
City Transit: Strong Municipal system and update of bus
fleet with the purchase of 6 new GHG-friendly buses.
Kootenay Carshare Co-op & Ride Share
Nelson Electric Tramway
Buildings
Sustainability Checklist (2009): A checklist was created to
help evaluate land development applications through the
lens of the four sustainability pillars: economic,
environmental, cultural, and social.
Land Use Bylaw Amendment (2009): Allows for secondary
suites in all residential zones.
12
Several sources arrive at similar figures including: Torrie, Ralph. (1998) Municipalities Issue Table Foundation Paper prepared for the Canadian Government’s National Climate Change Process; and BC Ministry of Environment and BC Ministry of Community Development calculations used in public presentations (2008, 2009).
Sustainable Downtown/Waterfront Master Plan
(forthcoming 2010/2011): Creation of a comprehensive plan
to guide the revitalization/development of the downtown
and waterfront areas, including Design Guidelines.
Fire Department and FortisBC (ongoing) – Fire Department
personnel are working with FortisBC to identify power
conservation opportunities with business owners during
commercial building inspections.
Green Building Covenant: The City placed a covenant on
land it was selling to ensure new buildings would meet
EnerGuide 80 performance and be in duplex form or
secondary-suite ready
PowerSmart Program (ongoing): Nelson Hydro participates
in the PowerSmart Program and Nelson Hydro Customers
have access to all the PowerSmart incentives for improving
energy efficiency.
Local Energy Supply
Nelson Hydro: Nelson Hydro has a variety of ongoing
initiatives to reduce energy use such as:
o Downtown conversion project from 5kV to 25kV to
reduce distribution losses.
o Evaluates transformer purchases using total ownership
cost which considers transformer efficiency.
o Substation rebuild (high efficiency power transformers
selected).
o Considers smaller and hybrid vehicles where practical.
District Heating Pre-Feasibility Study (2010): To study the
feasibility of a district heating system using lake water as a
source of heat.
Geothermal Project at Selkirk College (ongoing): Design,
Build and Operate new heating system for the renovated
dorms at Selkirk College
Solid Waste
Curbside Recycling and Waste program (2008): Blue Bag
program and bi-weekly garbage collection to reduce the
number of vehicle trips and increase recycling rates by
making recycling convenient to our residents.
The traditional sustainable waste management hierarchy
(i.e. reduce, re-use, recycle) is similar in its prioritization to
a low carbon management framework. This is elaborated
upon in the Taking Action: Waste section.
RDCK Resource Recovery Plan (forthcoming 2010/2011):
The Regional District is in the process of updating its
Resource Recovery Plan to provide the policies and
strategies to guide the delivery of solid waste management
and resource recovery services in the future. The plan will
include zero waste principles.
Composting (ongoing): Provided land for Earth Matters to
set up demonstration project on composting.
Zero Waste Action Plan (2003).

14 City of Nelson Climate Action & Energy Plan
Deep Reductions: Local & Senior Government
ActionThe BC Government‘s emission reductions targets are roughly
in line with the balance of scientific evidence on the reductions
necessary to avoid dangerous, run-away climate change.
Thirty-three percent emission reduction by 2020 and 80%
emission reductions by mid-century will require active
engagement by all levels of government and the broad diversity
of actors over which they have influence – commercial,
institutional, non-profit and individuals. To foster local
government efforts, the BC Governments established the Green
Communities Act (Bill 27) requiring municipalities to establish
GHG reduction targets, policies and actions in their Official
Community Plans – indeed a major driver for this plan.
The intensity and focus of effort by municipalities should be
informed by an appreciation of the spheres of influence of
different levels of government. There are many instances where
influence is shared with senior governments and in many cases
where senior governments have pre-eminent influence, e.g.:
Regulatory authority over building codes and automobile
efficiency standards which has huge influence over energy
and emission activity.
Financial authority is greater provincially and federally and is critical in sectors like public transit and community
energy supply development.
This should not suggest action should not be taken in these
aforementioned sectors. However, it should be explicitly
acknowledged, for example, that provincial and senior levels of
government drive the most change on building codes and
municipal governments can take a leadership role at the margins,
preparing the local development sector for change, facilitating
market transformation, and ensuring steadily rising standards are
being met.
Municipal Role
Municipal decisions influence almost half of GHG emissions in
Canada13
. This influence is pre-eminent in land use planning
including location and density of growth and commercial,
residential and institutional buildings and green space, building
types, as well as street design and network, and urban design.
These decisions powerfully shape transportation, building, and
energy supply opportunities. Transportation infrastructure, waste
13
Several sources arrive at similar values: Torrie, Ralph. (1998) Municipalities Issue Table Foundation Paper prepared for the Federal National Climate Change Process; BC Ministry of Environment, BC Ministry of Community Development (2008).
Figure 3: Government Spheres of Influence: Different levels of
government share influence over energy and emission activity. One
level typically has greater influence over some sectors. This figure
makes generalizations that do not hold true in all contexts. For
instance, because Nelson operates its own electric utility, it has
greater influence over its electricity emissions.

Low Carbon Path to 2040 15
management practices, and other infrastructure decisions also
shape emissions.
Local governments can also facilitate change by raising
awareness and facilitating action by businesses, developers,
individuals and other community actors.14
Of all levels of
government, municipalities have the most direct relationship
with citizens through the services they deliver. If personal
carbon footprints are going to change, it is in large part because
local governments will help individuals and households step
more lightly.
Influence, Control and Burden Sharing
While 80% emission reductions globally and potentially more in
Canada by mid-century are appropriate levels to aim for, this
target may not necessarily be the level a community should be
striving for. 15
Control vs. Influence: While municipalities have considerable
influence, they have limited control over most emissions within
their boundaries. The City of Nelson‘s 67,000 tonnes of GHGs
emitted annually are widely distributed across hundreds of
businesses and 10,000 residents using cars and powering and
heating their homes.
While the City can carry out land use planning that supports
efficient and effective public transit, ultimately individuals will
decide whether they drive or take the bus.
Almost 40% of the Province‘s emissions are from industry. The
vast majority are from less than 100 point sources, over which a
single company has direct control. Many emit more annually
than the combined commercial and residential emissions of the
entire Kootenays Region. For instance, Duke Energy has several
gas plants in NE BC that each generate over 1 million tonnes of
GHGs annually. The Rio Tinto Alcan plant in Kitimat and a
Lehigh Cement Plant in Delta also generate more than 1 million
tonnes annually.16
Deep emission reductions from a large single point source over
which there is direct control are – not always – but often easier
and more cost effective than smaller, more widely distributed
emissions where an actor only has modest influence.
14
REN21, ISEP and ICLEI 2009. Global Status Report on Local Renewable Energy Policies – Working Draft, 12 June 2009. 15
This is an approximation based on extending the 2007 total of 6.7 million tonnes. The figure was calculated through a combination of actual and modeled emission data. 16
BC Ministry of Environment, 2007
While the City acknowledges its dependence and prosperity on
many of these industrial outputs –e.g. cement, aluminum, and oil
and gas – it is committed to forging a low carbon path, and
notably reducing oil and gas dependence. It aims to do this by
establishing a more liveable, safe community.
Burden Sharing: In the long run, it will be important for the BC
Government and Government of Canada to consult with
municipalities, industrial actors and others to establish an
efficient and equitable approach to sharing the responsibility of
deep emission reductions between and across sectors and
provinces in a manner that strengthens the long term economic,
social and environmental sustainability of province and country.
Net emissions and growth rate, reduction costs, transition
opportunities, economic and social co-benefits are some of the
criteria that should determine provincial, municipal and sector
emission reduction responsibilities.

16 City of Nelson Climate Action & Energy Plan
Nelson's Community Energy & Emission ProfileThe energy and emission profile for Nelson looks similar to
most communities in British Columbia, with transportation and
buildings comprising the largest shares of energy use and
greenhouse gas emissions (see figures on right). Table 1
provides a snapshot of community-wide energy (converted to
gigajoules—GJ) and emissions (reported in tonnes of carbon
dioxide equivalent-T-CO2e).
Two obvious differences stand out when comparing energy use
and emissions. Buildings comprise a larger share of community
energy use and solid waste only appears in community GHG
emissions. Buildings emissions are relatively smaller than their
energy use because in British Columbia the vast majority of the
energy used to generate electricity does not produce GHG
emissions (hydroelectric power generation).
Nelson Community GHG Emissions by Sector
Nelson Community Energy Use by Sector
Trans-portation,
59%
Buildings, 40%
Solid Waste,
1%
Trans-portation,
40%
Buildings, 60%
(Solid Waste, 0%)
Table 1: Nelson Energy and GHG Emission Summary, 2007
ENERGY GHG EMISSIONS
Category GJ % T-CO2e %
Tran
spo
rtat
ion
Passenger Vehicles 465,285 33%
40%
31,835 49%
59%
Recreation Vehicles 4,589 0% 306 0%
Commercial Vehicles 90,817 6% 6,340 10%
Buses 9,150 1% 631 1%
Bu
ildin
gs
Residential 447,613 31%
60%
15,228 23%
40% Commercial/Small-Medium Industrial 403,618 28% 11,629 17%
Large Industrial (UNKNOWN) - - - 0.0%
Solid Waste 0 0.0% 0% 604 0.9% 1%
TOTAL 1,421,072 100% 66,573 100%

Low Carbon Path to 2040 17
The majority of emissions come from the combustion of fossil
fuels (i.e. natural gas, gasoline, diesel, and heating oil) that emit
carbon dioxide into the atmosphere. The primary type of energy
use in the waste sector is for the collection and transport of
waste from homes and businesses to transfer stations and
landfills, registering at less than one percent of community wide
energy use. GHG emissions from landfills, however, are not-
energy related and thus do not appear in the energy profile.
Landfill emissions occur in the form of methane – a greenhouse
gas that is generated from decomposition in the absence of
oxygen of food, yard waste, wood, paper products and other
materials that come from living matter.
The pie charts below illustrate these two points and show that
gasoline accounts for the largest amount of energy consumed
and a majority of the greenhouse gas emissions.
Community GHG Emissions by Fuel Type
Community Energy Consumption by Fuel Type
Energy Expenditures
In 2007, Nelson residents and businesses spent a combined
$30.4 million on energy or approximately $3,200 per person
per year.17
The $21.4 million in residential energy expenditures
works out to an average of $5,150 per household. Energy
expenditures for small and medium sized business totalled $6.6
million, or $6,940 per business. The other major category of
energy expenditures that it is possible to estimate is fuel for
tractor trailer trucks. In 2007, approximately $2 million, or
$25,440 per truck, was spent on tractor trailer fuel.
Secondary Measures of Energy and Emission
Performance
In each sector there are secondary measures of energy and
emissions that can be used to better understand the aggregated
energy and emission numbers. These secondary measures
include intensity—which is the amount of energy/emissions
divided by a relevant related unit, such as population, building
floor area, or amount of emissions per unit of energy. Indicators
are a way of monitoring trends in energy and emissions through
related activities. There is scientific evidence that GHGs will
need to be reduced to an average of 1 tonne CO2e per person,
per year by 2050 to avoid catastrophic climate change. This is
equivalent to an 80% global reduction in emissions. In 2007,
GHG emissions in Nelson were at 7.0 tonnes CO2e per person,
per year--among small communities in Interior British
Columbia, this ranks quite well.
17
These figures are based on energy consumption from the 2007 Ministry of Environment Community Energy and Emissions Inventory and average 2007 energy expenditures from Nelson Hydro, Terasen Gas rates, transportation fuel costs, fuel oil costs
Diesel, 12%
Electricity, 0.4%
Gasoline, 47%
Heating Oil, 1%
Natural Gas, 37%
Other Fuel, 0.3%
Propane, 2%
Solid Waste,
1%
Diesel, 8%
Electricity, 24%
Gasoline, 32%
Heating Oil, 1%
Natural Gas, 34%
Other Fuel, 0.3%
Propane, 1%

18 City of Nelson Climate Action & Energy Plan
Energy and Emission Excluded in the Profile
Several emission sources are not included in the BC provincial
government Community Energy and Emission Inventory report,
which the majority of the data in this briefing is drawn from.
These include:
o large industry
o boats
o airports (planes and ground transportation)
o off-road vehicles
o construction equipment and yard/maintenance
equipment
o agriculture (vehicles and livestock)
o ―upstream‖ emissions from extraction, processing and
transportation of goods consumed locally
Some of these sources could be significant. Others are relatively
small. Some are difficult to quantify. Others are easy. None will
be quantitatively evaluated through this project. Going forward,
however, the community may wish to quantify some of these
emission sources and consider measures to reduce emissions
from these sources.
Figure 4: Comparison of per capita emissions (tonnes CO2e per person)

Low Carbon Path to 2040 19
Energy Flow Chart - Baseline
Energy use in Nelson, as represented in Figure 5 below, can be traced from the generation activity (Source), to the type of energy (Consumption), the
sectors it is used in and how it is used within each sector (End Use), all the way to the amount that is put to productive use, versus loss through
inefficiencies (Efficiency). The ―Sankey*
‖ diagram below shows the flow of energy through these stages. At each stage, the width of the line is
proportional to the amount of energy. Figure 5 shows a large dependence on fossil fuels (under Source and Consumption) and approximately 40% of the
energy in the community being wasted through inefficiencies (under Efficiency **
). When selecting the greenhouse gas emission reduction strategies in
the Taking Action section of this Plan, key criteria were strategies that will reduce the use of fossil fuels, decrease the demand for energy and use energy
more efficiently. * Sankey diagrams are named after Irish Captain Matthew Henry Phineas Riall Sankey, who is considered to have been the first to use this type of diagram in 1898 in a
publication on the energy efficiency of a steam engine. **Efficiency was calculated using data from Natural Resources Canada on BC average energy use in buildings and vehicles.
Figure 5 – Nelson Energy Sankey Diagram - 2007

20 City of Nelson Climate Action & Energy Plan
2. Taking Action
.

Low Carbon Path to 2040 21
Overview The Low Carbon Path is comprised of sector-specific
objectives, strategies and priority actions that will result
in significant GHG emission reductions and strengthen
local energy sustainability. To ensure the strategies
result in an emissions path that is both achievable and
ambitious, modeling techniques were used to forecast
future energy and emissions levels based on
assumptions developed through consultations with staff,
Council and community stakeholders (see Appendix A
for more details) and informed by a critical appreciation
of related strategies in North America. Performance
assumptions labelled as ―outputs‖ are generated through
this modeling process and are reflected in many of the
maps and graphs, notably those projecting GHG
implications.
The Low Carbon Path is organized into the following
sub-sections:
Analysis Overview: This section provides a summary of
the impact of the strategies across all sectors.
Land Use: Land use planning and design are closely
connected to emissions in the transportation and buildings
sectors. The strategies in this sector have significant co-
benefits in the areas of housing affordability, active
transportation and enhancing community liveability.
Transportation: Transportation sector strategies seek to
reduce vehicle emissions through programs and policies that
will make it comfortable, safe and convenient to walk, cycle
and rideshare and use public transit.
Buildings: Emissions from Nelson‘s buildings will be
reduced primarily through an innovative retrofit strategy
that focuses on the city‘s heritage building stock and a
diverse portfolio of policy mechanisms that makes it easier
for builders and home owners to construct efficient
buildings that use renewable energy.
Energy Supply: District energy implementation is the
major area of focus for the energy supply sector.
Solid Waste: Close partnership with regional and provincial
government agencies to increase recycling and composting
rates will have the biggest impact on reducing solid waste
sector emissions.
Community-Wide Measures: The final sector contains
strategies that are non-sectoral in nature; involving aligning
municipal finance with energy and emissions, capacity
building, and education and outreach.
This low carbon path reflects a realistic, ambitious effort that
will require significant engagement by the City. Successfully
implementing the low carbon path depends on close
collaboration with residents, businesses, public sector
organizations and non profits, as well as neighbouring local
governments, and senior levels of government, utilities and
transportation authorities. The Low Carbon Path is also
underpinned by a strong commitment to strengthen the local
economy, citizen health, and community liveability.

22 City of Nelson Climate Action & Energy Plan
Community-Wide Energy & Emissions
Analysis
Implementing the Low Carbon Path would steadily decrease
greenhouse gas emissions, on a sector-by-sector basis, through
the year 2040, with total emissions decreasing 43% below the
2007 baseline. When emissions are normalized by population,
the reductions are greater, starting at 7 tonnes per person in 2007
and decreasing to 3 tonnes per person in 2040 (a 57% reduction).
Reductions for residential and commercial buildings are more
modest than the other sectors largely due to the 2% annual
population growth rate that was used for the years 2010-2020.
Transportation emissions decrease by the largest amount, going
from 38,000 tonnes CO2e in 2007 to 19,000 tonnes in 2040.
Community-wide vehicle kilometres traveled increases over this
time period due to population growth, but decrease on a
household basis due to the implementation of land use and
sustainable transportation strategies. The most important policy
change in this sector is the steady improvement in vehicle fuel
efficiency that will be mandated by the BC provincial
government. In the Low Carbon Path, the average fuel efficiency
of a vehicle in Nelson will improve, from 14.5 litres per 100 km
in 2007 to 5.5 litres per 100 km in 2040.
Emissions from solid waste also decrease significantly, reducing
from 608 tonnes CO2e in 2007 to 90 tonnes in 2040. These
reductions are primarily driven by a large increase in the rate of
organic waste that is composted and the installation of a landfill
gas capture system at the landfill post 2020.
Annual Energy Use by Sector
As with emissions, energy use in Nelson will decrease steadily
in Nelson in the Low Carbon Path. Transportation energy use
decreases because residents and businesses drive less and use
more fuel efficient vehicles. The reduction in residential and
commercial buildings energy use will result from new buildings
that are more energy efficient, the incorporation of building
scale renewable energy technologies and the retrofit of existing
buildings to be more energy efficient.

Low Carbon Path to 2040 23
Figure 6

Low Carbon Path to 2040 24
The Wedge Chart above estimates the potential contribution of categories of strategies and actions to the overall Low Carbon Path.
Senior governments (Provincial and Federal) are the primary regulator of several initiatives, such as vehicle fuel efficiency standards
and improvements to the Building Code. Others are largely within the influence of local governments, primarily the City but also the
RDCK.
Wedge or Policy
Bundle
Description Primary
Level of
Government Sustainable Waste
Management
Waste Management includes two major policies: a substantial
reduction in the amount of organic waste sent to landfill, and eventual
landfill gas capture. This has a relatively small effect on community-
wide emissions, however.
Nelson and RDCK
Energy Supply Energy Supply is driven largely by the implementation of District
Energy, and assumes a renewable energy supply for connected
buildings. A small fraction of this wedge is from local electricity
generation.
Nelson
Buildings – Local
Action
This wedge represents measures that Nelson can undertake within the
Building sector. A large share of this wedge assumes a robust and
innovative retrofit program managed by Nelson Hydro and assisted by
FortisBC. In addition, education and incentives to promote green new
construction play a significant role.
Nelson
Integrated Land use
and Transportation
Land Use and Transportation allows a strong role for local
governments. Land-use, urban design, and infrastructure decrease
distances travelled by single-occupant vehicle, while promoting trips
using rideshares, public transit, bicycle, and foot.
Nelson
Building Code and
Efficiency
Assumes that a new Building Code is put in force by 2013, after which
no improvements to the Code are made. This is primarily a senior
government initiative, although Nelson plays a critical role in
enforcement of these standards.
By 2013, it is expected that the Building Code will require
significantly more efficient buildings than those we are constructing
today. However, the wedge only has a significant effect once a
substantial number of new buildings have been constructed.
Provincial
Government
Vehicle Efficiency
Standards
The second wedge shows the effect of vehicle efficiency standards.
This is almost entirely a senior-government initiative, although local
personal and commercial vehicle choice can also play a role
Provincial and
Federal
Governments
Remaining Emissions The bottom wedge represents estimated remaining emissions if all Low
Carbon path strategies are implemented All

Low Carbon Path to 2040 25
$-
$1,000
$2,000
$3,000
$4,000
$5,000
$6,000
$7,000
$8,000
2005 2015 2025 2035
Energy Spending per capita
No Action With Action
$-
$20,000,000
$40,000,000
$60,000,000
$80,000,000
$100,000,000
$120,000,000
2005 2015 2025 2035
Total Community Energy Spending
No Action With Action
Effect of Actions on Energy Costs
Future energy prices are difficult to predict. Most long-term energy price projections show large increases in the cost of fuel and
electricity, likely doubling by 2030.18
Future total community spending on energy is driven by a combination of increasing total
population, changes in demand per capita, and increasing energy costs. Without action,19
energy spending would double along with
energy prices and further with population, likely reaching more than $100 million in annual total community spending by 2040.
Annual household energy costs could reach an average of $15,000 per household during this period.20
Under the Low Carbon Path, energy consumption per capita (and per household) is expected to decrease by approximately half from
2007 levels by 2040. This could reduce total energy spending by at least 50% below what it would in a ―no action‖ scenario.
18
Based on Energy Information Administration Annual Energy Outlook 2011, BC Hydro Long Term Acquisition Plan, discussions with Nelson Hydro, and original analysis by HB Lanarc. 19
Under the “no action” scenario, currently energy use patterns and intensities are projected forward based on population. 20
Note that total energy spending for utilities (Hydro and Natural Gas) include some fixed costs that are independent of energy prices. These would be unlikely to decrease based on reduced demand. Therefore total energy spending, which includes these fixed costs, doesn’t entirely reflect changes in the price per unit of energy (per gigajoule for natural gas or per kilowatt-hour for electricity).

26 City of Nelson Climate Action & Energy Plan
Land Use Land use is intimately connected to transportation and buildings. Land use determines where we live, work,
shop, and play, and influences how we get there. Building type and form allows more efficient buildings with access to renewable
energy. Thoughtful land use strategies that acknowledge these connections can have transformative impacts. Nelson has strong
influence over this sector relative to senior government.
The Path to 2040 Sustainability Strategy provides a framework that can be used to evaluate land-use and development decisions. The
Strategy, along with specific strategies and actions provided below, can inform the Downtown and Waterfront planning processes.
Primary Objective
Create sustainable land uses that maximize opportunities for diverse, low-carbon transportation options, green buildings and low
carbon energy supply.
Complementary Objectives
Buffer residents and businesses from energy price volatility and overall expenditures.
Increase community liveability and sustain downtown vitality using for safety, mobility, economic security, and health.
Support long term City fiscal performance by lowering demand for additional infrastructure
Nelson Path to 2040 Synergies
Direct
Related

Low Carbon Path to 2040 27
Strategies
A. Build on the Community’s Complete, Compact and
Centered Form to maximize low carbon transportation
options and district energy
1. Mixed-use development will be expanded to brownfields
within the municipal boundary. There is no Greenfield
development
2. Infill and redevelopment will occur in Waterfront &
around Mt. St Francis Hospital and downtown
3. Downtown is maintained as the central business district.
4. Mixed use nodes are encouraged in Mt. St Francis
redevelopment, East and West Waterfront according to the
Waterfront Development Plan, and to Granite Point area.
5. Micro mixed-use development is encouraged in select
neighbourhoods, e.g. Fairview and Rosemont
Priority Action
Integrate land use strategies into an OCP Update and new
Land Use Regulation Bylaw
B. Encourage Secondary Suites and Infill Cottages for their
inherent superior energy performance.
Small homes, such as secondary suites and infill cottages, have
shared walls and less space to heat than a conventional home,
lowering energy use and emissions from heating. Small homes
can increase population density, supporting low-carbon
transportation, and can also improve housing affordability for
both renters and buyers.
1. Infill cabins/cottages encouraged in strategic locations, e.g.
heritage single family, through land-use policies and
capacity building for residents and construction sector
2. Support innovative work-live arrangements, such as lofts in
commercial buildings, to reduce transportation emissions
and promote affordability.
3. Recognize telecommuting as an effective low carbon
strategy and remove barriers for home office creation,
including creating financial incentives.
Neighbourhood Grocery Stores
Neighbourhood grocery stores are on the front line of
defence against climate change. One in five trips is for
shopping. One of the top contributors to the steady
increase in distances people travel is the shift to large,
car-oriented retail outlets in low density areas. A large
body of literature shows people who live near small
stores walk more for errands and, when they do drive,
their trips are shorter. Moreover, the presence of small
retailers influences the likelihood that people take
public transit because they are able to chain errands on
their commute home. Living close to grocery stores and
even fast food outlets also lowers the likelihood of
obesity. A small, but growing number of jurisdictions
are establishing policies to promote neighbourhood
grocery stores for the wide variety of social economic
and environmental gains.
Sources
Obesity linked to fewer neighbourhood food options
http://www.unews.utah.edu/p/?r=102609-2
Neighbourhood Grocery Stores and the Fight Against Global Warming http://www.newrules.org/retail/article/neighborhood-stores-
overlooked-strategy-fighting-global-warming

28 City of Nelson Climate Action & Energy Plan
C. Climate Protection Design Guidelines to encourage
buildings, landscapes and activity patterns that are both
low-carbon and resilient to climate change
Local governments can establish Development Permit Areas
(DPA‘s) to influence the form and character of private
development, the conservation of energy and water, and the
reduction of green house gas (GHG) emissions. Local
governments are also responsible for developing, implementing
and maintaining public streetscape and open space standards.
This gives Nelson measureable influence to promote low carbon
infrastructure and transportation.
1. Establish Development Permit Area Guidelines that
promote energy efficiency, renewable energy, low carbon
transport, and adaptation to climate change. Use Guidelines
that respond to Nelson‘s unique context including its rich
architectural heritage, arts culture and winter climate.
Street design will be enhanced to maximize walking
and cycling enjoyment.
Engage Nelson’s arts community to create art bike
racks
Enhance connectivity between the Waterfront Trail
and downtown; increase amenities along the
waterfront trail
Priority Action
Climate Protection Design Guidelines: both community-wide
and neighbourhood-specific Guidelines encompassing both
public and private realms. In particular, the Waterfront
development provides an opportunity to implement and pilot
these Guidelines.
The following components should be included in the
development process:
Technical Analysis and Review of best practices and
precedents, and identification of opportunities and site
characteristics to promote low carbon buildings and
transportation
Public Engagement to gather local knowledge, identify
local opportunities and challenges, and to build
education and awareness regarding low carbon
buildings and transportation
See Appendix H: Select Resources for reference material
Priority Actions
Infill Home Pilot Project: Conduct a pilot to build 10 small
format residential homes on existing lots. Such homes can
support ultra low per-capita building and transportation energy
consumption, facilitate affordable home ownership opportunities
and rental units. The intention of the pilot project is to learn how
a policy could be applied more broadly and infill housing could
be appropriately accommodated in Nelson. Conditions for the
pilot project could include:
Corner lot
500 meters (walking distance) from diverse commercial
activity
Units could be new or conversions of existing building.
The City could wave building and development permit
fees.
The City may be interested in facilitating stratification or
subdivision to enable the units to be sold as affordable housing.
Issues the City is interested in exploring through the pilot
include: servicing, aesthetics, views, neighbourhood character,
safety, parking, future development opportunity costs, staff
administrative burden, affordability, staff/builder capacity
building needs.
Infill Housing OCP and Land Use Regulation Bylaw Update: Learning from the Infill Home Pilot Project, and the City‘s
ongoing work on secondary suites could be applied to
developing further small format housing opportunities, such as
enhancing work-live arrangements, and expanding the Infill
Home pilot.

Low Carbon Path to 2040 29
Case Study: Infill Housing
This converted garage is now a small (290 square ft.) home.
Like conventional secondary suites, such small-format
housing can maintain existing character and scale of the
neighbourhood while allowing increased density and high
building efficiency. Approximately 50 potential sites for
garage conversions exist in Nelson, according to David
Dobie and Rod Taylor.
.
Source Rod Taylor & David Dobie
Design Guidelines for Climate Protection
Urban Design plays a significant role in low carbon
transportation, buildings, and infrastructure. Design
strongly influences how people get around, where they go,
where they gather, and how they feel about their
community, their neighbourhoods, and themselves. Design
guidelines can influence green and open spaces, create a
sense of safety, and ensure ―human-scale‖ design.
The appeal of walking and cycling is strongly influenced by
design. Design guidelines can promote energy efficiency
through landscaping, building materials, and building
orientation that promotes passive solar heating and cooling.
Design guidelines can cover the private realm shaping the
activity of developers and builders, encouraged through the
permitting process. Guidelines can also cover the public
realm, shaping the way Cities design a wide variety of
systems and infrastructure. Low Carbon Design Guidelines
can address the following elements:
Building form and site design, including building
orientation, layout, size, materials, and character. These can
include green roofs and walls.
Outdoor spaces and public infrastructure, including
streetscape, landscape, stormwater, and transportation
infrastructure, street trees, sidewalk aesthetics, landscaping,
public art, and even edible landscapes.

30 City of Nelson Climate Action & Energy Plan
In 2
00
7 a
ll
Nels
on fo
od
mark
ets
we
re
locate
d
Dow
nto
wn
,
mea
nin
g m
ost
resid
en
ts d
id n
ot
live w
ithin
walk
ing
dis
tance.
Th
e a
dditio
n o
f
foo
d m
ark
ets
in
Rose
mo
nt, U
phill
and
Wate
rfro
nt
Nort
h g
reatly
incre
ases t
he
num
be
r o
f
resid
en
ts t
hat
are
in w
alk
ing
dis
tance o
f th
eir
gro
ceri
es b
y
202
0.
Additio
nal
pop
ula
tion g
row
th
in a
rea
s c
lose t
o
foo
d m
ark
ets
furt
he
r in
cre
ases
the p
erc
enta
ge o
f
resid
en
ts t
hat
can
walk
to th
e s
tore
by a
few
perc
en
tag
e p
oin
ts
in 2
040
.
A “
local F
oo
d M
ark
et”
is
a r
eta
il sto
re t
ha
t sells
som
e p
roduce o
r o
ther
min
imally
pro
cessed
foo
d.

Low Carbon Path to 2040 31

32 City of Nelson Climate Action & Energy Plan
Indicator Highlights: Land Use Sector
At the core of ―creating sustainable land uses that maximize opportunities for diverse, low-carbon transportation options…‖—one of
the objectives of the Land Use sector strategies—is co-locating key destinations and where people live. The four indicators that are
highlighted below illustrate the impact of land use changes that are proposed in Nelson, through the Waterfront and Downtown
planning processes. By centering future growth in the Downtown and Waterfront areas, a larger percentage of residents will be located
close to food stores, shops and services, and other amenities. This development pattern will also enable residents to walk, bike and use
transit for a larger percentage of the weekly trips.
Indicator Description 2007 (Base Year) Low Carbon Path
Dwellings within a 10 minute
walk to local services such as
banks or government offices
See description above 50% 80% in 2040
Dwellings within a 10 minute
walk to local food store
50% 75% in 2040
Dwellings within a 10 minute
walk of the Downtown area
35% 53% in 2040
Dwellings within a 10 minute
walk of neighbourhood retail
37% 88% in 2040
Please also refer to the future Neighbourhood Retail, Food and Parks Walkshed maps.

Low Carbon Path to 2040 33
Transportation
Transportation produces a majority of Nelson‘s emissions. Nelson has an older, less efficient vehicle
stock than the BC average, and its steep terrain demands innovative approaches for cycling and
walking breakthroughs. Despite these challenges, Nelson is already a leader in British Columbia and
Canada in low carbon transportation with 31% of residents primarily walking or biking to work.21
Its
compact land form and unique character make it possible to further increase this percentage, as well
as increase the number of residents who share rides and take public transit. The strategies in this
sector and the Land Use sector will complement those that have already been identified in the Nelson
Active Transportation Plan. Nelson is also a major origin and destination for work and college related trips in the region. Progress in
reducing the number of single passenger trips will require collaboration between the City, Regional District, School Board, BC
Transit, Selkirk College, local business, and non-profits.
Objectives
Enhance the convenience and comfort of active and low carbon transportation modes
Active transportation becomes the largest share of local trips
Complementary Objectives
Residents lead healthier lives because walking and cycling becomes a larger share of regular transportation activity
Increase the amount of money re-invested locally, instead of spent on fuel and vehicles from outside the Province
Nelson Path to 2040 Synergies
Direct
Related
21
Based on Census data.
59%
Share of Emissions

34 City of Nelson Climate Action & Energy Plan
Strategies
A. Mainstream Low Carbon Transportation throughout
the community
1. Develop a City Low Carbon Transportation Policy that
guides planning and design, infrastructure spending, traffic
management, and parking policies of the city
2. Optimize parking regulations to support low carbon
transportation objectives, including number and location of
spaces, pricing, and priority parking for low carbon, ride
share and car share vehicles
Explore creation of a visitor park-and-ride with a
shuttle bus running frequent loops to downtown.
Reduce parking requirements in exchange for active
transportation infrastructure and car share for new and
re-development
3. Require all new large (BC Building Code, part 9) buildings
to have covered, secure bike parking and showers for
residents, employees; and covered/accessible bike parking
for customers
4. Develop a program and bylaws to reduce idling
5. Electric vehicle parking incentives:
Create development permit areas that require bicycle
parking and electric vehicle charging in parking spaces
Require new mixed use, multi-unit residential and
parking buildings to have electric vehicle charging
infrastructure; Create parking requirements for new
and re-development that support the City‘s goals to
reduce transportation emissions
6. Explore car sharing promotion through priority parking,
reduced parking requirements in new developments, and/or
City use of car share to replace a portion of its vehicle fleet
Priority Actions
Adopt a Low Carbon Transportation Policy, update parking
bylaws, and design guidelines to achieve these objectives. The
policy should be based on a transportation mode hierarchy that
addresses the needs of
First: pedestrians
Second: bicyclists
Third: public transit, and car pooling / ride sharing / car
sharing
Fourth: low carbon vehicles (including hybrids, next
generation of plug-in electric and hybrid vehicles)
Fifth: standard internal combustion engine vehicles
Parking Bylaws – Update existing bylaws so that parking priority is
given to low carbon modes of transportation.
Design Guidelines – Review existing neighbourhood and
community wide design guidelines to ensure that pedestrian
access is prioritized and safe and convenient bicycle parking is
required for businesses.
Transportation Plan requirement for all new commercial
developments and redevelopment to address employee
commuting and business related transportation.
B. Build Kootenay Rideshare Capacity through technology,
coordination and social marketing.
Nelson is a major transportation hub in the Kootenays and a
community with trust and cooperation among residents. These
factors created the preconditions for the formation of Kootenay
Rideshare, and also make it possible for ride sharing to become
an even more important form of transportation in Nelson. The
recommended actions that comprise this strategy could make
ride-sharing more convenient, safer, economical and attractive to
a wider cross-section of residents, for a greater variety of trip
types.
Priority Action
Kootenay Rideshare Capacity Building:
Collaborate with Kootenay Rideshare to explore the following
enhancements to ridesharing service in Nelson and the region:
Create designated “hitching posts” for rider pick-up
Put in place an incentive structure for drivers
Integrate safety, security, communications and
navigation with new technologies
Key steps:
Identify funding to update the Kootenay Rideshare
business plan and to implement the identified service
improvements.
Conduct research and engage public on potential service
improvements, including the identification of barriers and
benefits to ride sharing
Create a business and implementation plan
Figure 7 - Transportation Mode Hierarchy
1. Pedestrian
2. Bicyclists
3. Public transit and ride sharing
4. Low carbon vehicles
5. Coventional vehicles

Low Carbon Path to 2040 35
Small Town Transit Solutions
Small towns typically struggle with identifying public
transit options that are convenient and frequent enough to
attract ridership. Nelson is not a typical small town,
however, with a vibrant downtown and relatively compact
urban form—both which create the opportunity for a
variety of transit solutions.
Restaurant/Pub Ride-Home Shuttle – Enjoying a drink
with dinner is a part of eating out for many Nelson
residents at the numerous restaurants and eateries
concentrated in Downtown. With a shuttle service that
provides a guaranteed ride home, the number of drunk
drivers on the road would likely decrease and restaurant
patronage would increase as those who live Uphill and
further from Downtown would have a convenient option
to get home. There are several successful examples of
single restaurants/pubs offering ride-home services,
including the Hummingbird Pub Bus on Galiano Island1
and the Bier Craft shuttle in Vancouver. 2
Employer Funded Commuter Transit Service – In
York, Pennsylvania, a partnership between area
employers and the transit company has created an all-day
transit service, called Rabbit Transit, which connects
workers to their jobs, in addition to serving the broader
community. The majority of the costs of the service are
paid by the employers, but the general public provides a
diversified revenue base.3
Flexible Route Bus Service – PRTC Transit in Prince
William County Virginia offers an on-demand flexible
route option for its riders, called OmniLink. Off-route
pickup and drop-off can be scheduled by riders from 2
days to 2 hours in advance and costs $1.00.4 A flexible
route option in Nelson could provide residents with more
options to get where they need to go and to access transit
from home.
Bicycles on Buses – A number of Nelsonites use bicycles
as a regular means of transportation, but for most the steep
hills are a major deterrent for daily trips. Some
communities with similar geography have equipped their
buses with higher capacity bike racks to accommodate
cyclists that want to get up the hills. Several different
designs have been developed that can accommodate more
bikes than the typical 2-3 bike front-loading system.5
Sources
(1): http://www3.telus.net/hummingbirdpub/index.html (2):http://www.cityfood.com/drink/beer/local_companies_promise_beer
_without_fear?tpid=265
(3): http://www.rabbittransit.org/ (4): http://www.prtctransit.org/local-bus/howtouse.php
(5): www.lbl.gov/Workplace/Facilities/Support/Busses/bicyclists.html
Community Ride Share Success Stories
By some measures Kootenay Ride Share is one of the most
successful ride-share programs in Canada, given the large
number of users and the small population of the central
Kootenays. There is, nevertheless, significant untapped
potential. Its greatest strength is single long distance
excursions. There is limited activity associated with regular
commuting to work and college in the region, despite that
every 5 minutes during the day single passenger
automobiles leave Nelson for communities like Trail and
Castlegar, and the vice versa.
Some of the challenges that would have to be overcome
include: making it easier to find and offer a ride; and
reducing risks for riders and drivers. Success stories from
other jurisdictions can point to opportunities for
strengthening Kootenay Ride Share, requiring some
capacity building resources and collaboration with other
community partners.
Designated “Hitching” Posts – Informal commute ride
sharing systems in the Washington DC metro1 and San
Francisco Bay area2 use designated pickup points for
passengers seeking a ride to specific destinations. The City
of Nelson could seek to establish such a system in order to
facilitate commute ride sharing for Nelson residents who
work in neighbouring communities.
Technology and Service Enhancements for Ride-
Matching – Rideshare services across North America are
turning to advancements in communication technology to
improve the ease and efficiency of matching drivers with
riders, as well as reducing risk. In Prince William County,
Virginia the OmniMatch ride matching service uses a
regional database and a simple online or telephone
questionnaire to connect commuters that are looking to
share a ride.3 PickupPal uses social networking-like
profiles, a Google-Maps integrated search engine and
smartphone apps to assist riders and drivers to connect.4
Sources (1): http://www.slug-lines.com
(2): http://www.ridenow.org/carpool
(3): http://www.prtctransit.org/ridesharing/index.php
(4): http://www.pickuppal.com

36 City of Nelson Climate Action & Energy Plan
C. Enhance Public Transit Locally and Regionally to make
it a comfortable and convenient option for residents,
workers and visitors
1. Work with BC Transit, regional communities,
businesses and other key partners for more effective
routes (for example, Stanley St. Express), cost
effective buses and social marketing for local and
regional routes
2. Implement intra-Nelson transit services to give
residents desirable options to get to work, go downtown
and return home
Priority Action
Integrated Low Carbon Transportation Study: Undertake
a study to explore and advance local and regional low carbon
transportation. The study would minimally entail:
Partnerships: work with BC Transit, Regional District,
School Board, Chamber of Commerce, Interior Health
Authority, Selkirk College and non-profits to undertake this
project.
Multi Criteria Analysis: Infrastructure costs, operation &
maintenance costs, GHG reductions, ridership
Transportation Options local and inter-community route
adjustments including peak/off peak scheduling, optimizing
existing infrastructure alternative infrastructure and route
options (including micro buses, unscheduled buses/share
taxis, and Kootenay ride share), multi-modal capacity
building
Funding Options including BC Government/BC Transit,
local businesses, and major employer/school volume
discounts.
Social Marketing program development
See Small Town Transit Solutions above
D. Implement the Nelson Active Transportation Plan to
improve public health, safety and liveability
1. Strengthen pedestrian and cycle routes,
infrastructure and services
Priority Action
Active Transportation Plan Implementation: Identify and
address barriers to implementing the Active Transportation
Plan and create an implementation timeline.
E. Low Carbon Transportation Education and Outreach to
strengthen citizen and employer action
Social marketing & education to promote low carbon
transportation in schools/colleges, businesses, and the
general public
1. Businesses: Promote walking, ride share/car share/car
pool, parking policies, bike facilities, employee transit
pass discounts/benefits, and green fleet advising.
2. Schools/colleges: Create partnerships and promote
discount passes, car/ride share promotion,
intensification of walking school bus, improve
connectivity/infrastructure to schools, reduce idling, use
health (air pollution and obesity) to reduce parent drop
offs, U Pass, cycling clubs
3. Low Carbon Vehicle Education Campaign: Many
Nelson residents pride themselves on their low
environmental impact lifestyles and make a conscious
effort to do little things that will, for example, reduce
consumption of material goods, walk and cycle when
possible, buy local foods and support local businesses.
The cars that Nelsonites drive tell a different story,
however, as they are 12% less fuel efficient than the BC
average. A campaign could be developed likely
focussing on fuel costs and human health to compel
local residents to purchase more efficient cars, or trade
in the clunker for a lower carbon vehicle, a bike and
take advantage of the incentives offered by the BC
Scrap-It program
High Volume
Bus Bicycle
Rack.22
22
Source http://www.lbl.gov/Workplace/Facilities/Support/Busses/bicyclists.html

Low Carbon Path to 2040 37
Indicator Highlights for Transportation Sector
The indicators described below were selected to illustrate the reduction in vehicle kilometres traveled, the shift in how residents get to
work, and the GHG emissions emitted at a household level.
Indicator Description 2007 Base Year Low Carbon Path
Vehicle Kilometres
Traveled (VKT) per
household
A measure of how much
residents drive in one year
averaged at the household
level.
Household VKT 2007 =
24,415 23
Household VKT 2020 = 21,400 (-12% from 2007)
Household VKT 2040 = 16,763 (-33% from 2007)
Commute to Work
Mode Shift
One measure of
transportation mode split is
how people get to work.
For the Low Carbon Path
this has been estimated
based on modeled shifts in
VKT.
2007 (StatsCan)
Auto-Driver: 57%
Auto-Passenger: 8%
Public Transit: 2%
Walking and Cycling:
31%
2040 (estimate)
Auto-Driver: 27%
Auto-Passenger: 13%
Public Transit: 9%
Walking and Cycling: 52%
GHG emissions per
household resulting
from personal vehicle
travel
Total residential
transportation emissions
are averaged at the
household level and
reported in tonnes of
carbon dioxide-equivalent
units. This indicator is a
reflection of annual VKT,
mode split, and the
efficiency of vehicles.
7.8 tonnes CO2e per
household 24
2.3 Tonnes of CO2e/ household in 2040
23
2007 CEEI report for Nelson. See the Land Use – Transportation modeling method description for more details. 24
Ibid
Key Senior Government Policies
Bill 39: Vehicle Emissions Standards Act (2008) - The Act enables the BC government to set vehicle greenhouse gas (GHG)
emission standards equivalent to those laid out in California‘s 2004 regulation. The Act will be brought into force by regulation –
enacted when the equivalent California regulation and standards are implemented. As shown in the Community Wide Emissions
Analysis, above, this measure would have a significant impact on transportation emissions in the future.

38 City of Nelson Climate Action & Energy Plan
Within the Transportation sector, emissions are
expected to decrease substantially on a per capita
basis, to approximately one third of 2007 levels.
Personal transportation emissions reductions are
likely to result from the combination of policies
listed above, including stricter vehicle tailpipe
standards and a reduction in the number of local and
regional vehicle trips due to land use and
transportation changes and programs.
The reduction in commercial transportation energy
and emissions is largely outside of local government
jurisdiction. This reduction was assumed to be
driven by mode shift and technology advances due
to transportation costs and increasing energy prices.

Low Carbon Path to 2040 39
202
0 s
how
s a
sig
nific
ant
decre
ase
in e
mis
sio
ns d
ue to
the incre
ased
num
be
r o
f re
sid
ents
that
live w
ithin
walk
ing d
ista
nce t
o
key d
estinations
inclu
din
g local jo
bs,
wid
er
part
icip
ation
in r
ide s
ha
re
pro
gra
ms fo
r
com
muting
, as w
ell
as a
shift
to m
ore
fuel effic
ient
vehic
les.
Mod
ele
d e
mis
sio
ns
in 2
007
sh
ow
a
sig
nific
ant
diffe
rence a
mon
g
Nels
on's
neig
hb
ou
rho
od
because o
f th
e
concentr
ation o
f key
destinations in
Dow
nto
wn
, w
hile
oth
er
neig
hb
ou
rho
ods
were
pre
dom
ina
ntly
resid
en
tial.
In 2
04
0 a
sig
nific
ant
incre
ase in v
ehic
le
fuel effic
iency a
nd
the a
bili
ty fo
r m
ost
resid
en
ts t
o w
alk
or
bik
e t
o m
eet all
of
their
daily
nee
ds w
ill
mea
n t
hat
avera
ge
vehic
le e
mis
sio
ns
acro
ss t
he C
ity w
ill
red
uce
to n
ear
1.0
ton
ne p
er
ca
pita
.

40 City of Nelson Climate Action & Energy Plan
BuildingsBuildings comprise sixty percent of all energy consumed and are the second largest source of GHGs in
Nelson, accounting for approximately forty percent of emissions. Most of these emissions result from
natural gas used for space and water heating in homes and businesses.
Some of the most effective measures to reduce energy use and emissions in buildings include
improvements in building envelopes (insulation), more efficient appliances, passive design, and
building typology (smaller format buildings).
Older buildings will benefit the most from energy efficiency upgrades (insulation). Nelson has a high proportion of older buildings
relative to most BC communities. This makes baseline emissions higher, but also provides large opportunities for improvement
through retrofits.
Local governments in BC have limited control over efficiency in new buildings and moderate ability to promote efficiency in existing
buildings. The Province has the most significant regulatory tool (the BC Building Code), and will require significantly more efficient
buildings during a code update in 2012/2013. Local governments can moderately influence building energy consumption by
influencing building typology: smaller format buildings use less total energy. Changing the energy supply – also a significant
opportunity – is discussed in the next section.
Objective
Strengthen the energy and emission performance of
Nelson‘s current and future building stock
Complementary Objectives
Reduce expenditures on energy for local businesses and
residents, and keeps money in the region due to local
re-spending
Strengthen the local green building industry for local
and external markets
Nelson Path to 2040 Synergies
Direct
Related
40%
Share of Emissions
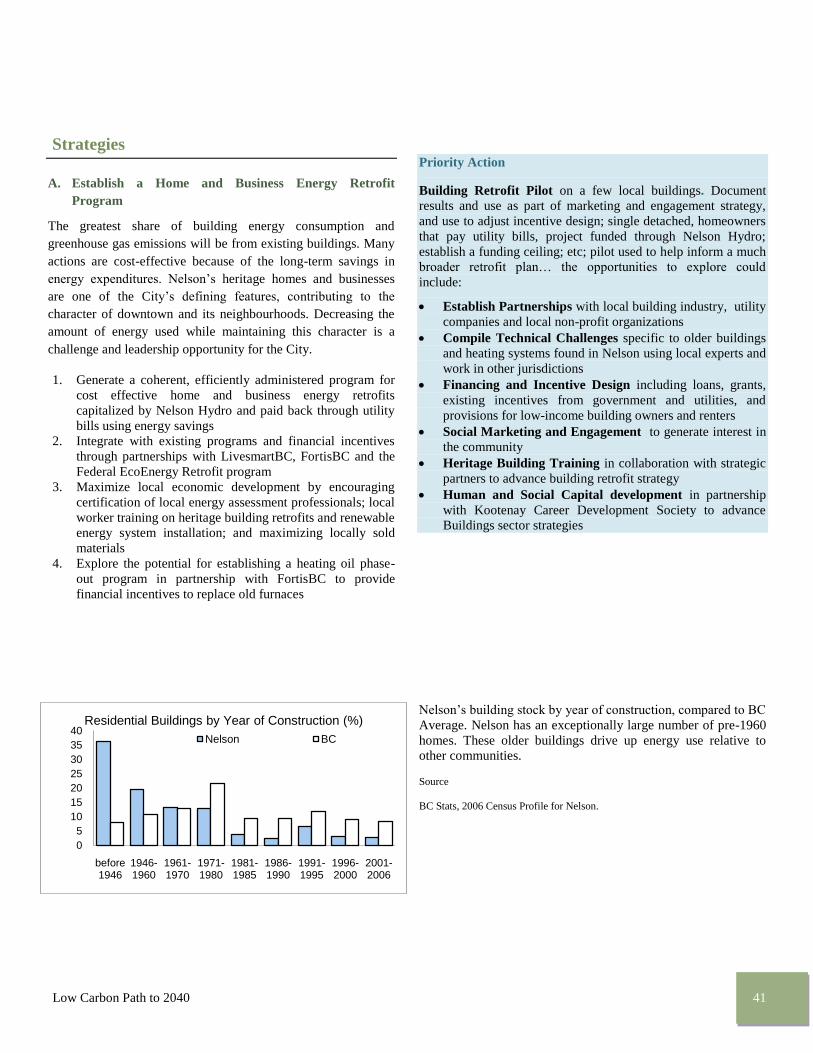
Low Carbon Path to 2040 41
0
5
10
15
20
25
30
35
40
before1946
1946-1960
1961-1970
1971-1980
1981-1985
1986-1990
1991-1995
1996-2000
2001-2006
Residential Buildings by Year of Construction (%)
Nelson BC
Strategies
A. Establish a Home and Business Energy Retrofit
Program
The greatest share of building energy consumption and
greenhouse gas emissions will be from existing buildings. Many
actions are cost-effective because of the long-term savings in
energy expenditures. Nelson‘s heritage homes and businesses
are one of the City‘s defining features, contributing to the
character of downtown and its neighbourhoods. Decreasing the
amount of energy used while maintaining this character is a
challenge and leadership opportunity for the City.
1. Generate a coherent, efficiently administered program for
cost effective home and business energy retrofits
capitalized by Nelson Hydro and paid back through utility
bills using energy savings
2. Integrate with existing programs and financial incentives
through partnerships with LivesmartBC, FortisBC and the
Federal EcoEnergy Retrofit program
3. Maximize local economic development by encouraging
certification of local energy assessment professionals; local
worker training on heritage building retrofits and renewable
energy system installation; and maximizing locally sold
materials
4. Explore the potential for establishing a heating oil phase-
out program in partnership with FortisBC to provide
financial incentives to replace old furnaces
Priority Action
Building Retrofit Pilot on a few local buildings. Document
results and use as part of marketing and engagement strategy,
and use to adjust incentive design; single detached, homeowners
that pay utility bills, project funded through Nelson Hydro;
establish a funding ceiling; etc; pilot used to help inform a much
broader retrofit plan… the opportunities to explore could
include:
Establish Partnerships with local building industry, utility
companies and local non-profit organizations
Compile Technical Challenges specific to older buildings
and heating systems found in Nelson using local experts and
work in other jurisdictions
Financing and Incentive Design including loans, grants,
existing incentives from government and utilities, and
provisions for low-income building owners and renters
Social Marketing and Engagement to generate interest in
the community
Heritage Building Training in collaboration with strategic
partners to advance building retrofit strategy
Human and Social Capital development in partnership
with Kootenay Career Development Society to advance
Buildings sector strategies
Nelson‘s building stock by year of construction, compared to BC
Average. Nelson has an exceptionally large number of pre-1960
homes. These older buildings drive up energy use relative to
other communities.
Source
BC Stats, 2006 Census Profile for Nelson.

42 City of Nelson Climate Action & Energy Plan
Case Study: Energy Efficient Retrofits
Retrofits for Homes:
Like Nelson, Quispamsis New Brunswick has a relatively old
building stock. Through the Efficiency New Brunswick
program, Quispamsis retrofitted around 400 of its 5,000 private
dwellings (7%). Annual emissions were reduced by 1,600
tonnes, and program participants save an average $1,000 each
year. That is a payback of approximately 10 years for
homeowners. Although program costs and benefits will likely
differ substantially in Nelson due to lower energy prices, there is
still great potential for a locally focused residential building
retrofit program to build on existing incentives, such as those
offered by LiveSmart BC.
Commissioning for Large Buildings:
Regular maintenance is important to keep heating systems
working properly. For large buildings, re-commissioning of the
heating system can provide substantial energy and greenhouse
gas savings.
During routine maintenance of the heating system in the
Touchstones building, a technician noticed the 10 year old boiler
was only firing at the highest setting. A more detailed
investigation led to $3,000 of repairs to recommission the boiler.
Annual fuel consumption for the building dropped 42%, from
$14,000 to $8,000, and the recommissioning work paid for itself
in less than a year. Nelson could promote heating system
recommissioning as part of their building energy strategy.
The historic Touchstones building in Nelson
Sources
Personal interview, 2011, Best, L . http://www.touchstonesnelson.ca/ http://www.fcm.ca/cmfiles/SCC2011_presentations/ElizabethWeir.pdf
Retrofits Through Financing Innovations
Many older buildings can improve energy efficiency by 30%
through upgrades to the walls, windows, and air tightness, as
well as optimizing HVAC, mechanical and electrical systems of
larger, more complex buildings. Retrofit payback periods range
from 2 to 12 years.
The up-front cost of an energy retrofit is the major disincentive
for most building owners. Many do not have the up-front capital
to make the investment, or will not occupy the building long
enough to see a financial return. Utilities and municipalities are
significantly accelerating retrofit rates by offering low-interest
loans which can be repaid through utility bills, largely offset by
reduced energy consumption. The loan transfers to a new
building owner at time of sale. It is common for these programs
to offer assistance for low-income program participants. Two
examples that use electric utility bills include.
City of Portland
Clean Energy Works Portland is a partnership driven by the
City. Upfront financing is made available through the private
sector at around 5% interest. A private utility uses its bill to
collect the loan. The retrofit is delivered by a non-profit and
involves skilled trades as well as unemployed and
underemployed workers being trained for the construction
sector. The successful program started in the single family
residential sector and is being extended to commercial and
multifamily buildings.
Manitoba Hydro
Manitoba Hydro has offered a residential loan program for
energy efficiency retrofits since 2001. On average, loans are
offered for a 5 year loan at around 5% interest.
Source
http://web.mit.edu/colab/resources/On-Bill_Repayment.pdf

Low Carbon Path to 2040 43
Energy Retrofits for Heritage Homes
Older buildings can be more challenging to retrofit than newer
homes. Older buildings are typically not insulated, making
ceilings and walls the major source of heat loss. In this case,
window replacement with higher-efficiency windows will
provide few benefits as most heat will still be lost in other areas.
This is nearly the opposite of retrofitting newer homes.
Retrofitting heritage homes provides more challenges: in official
heritage homes, some ―character defining elements‖ must be
preserved, while others can be changed. Overall, older buildings
may require additional training for construction workers and
tradesmen.
Efficiency New Brunswick offers a two-day training course for
local trades people and workers, focused on retrofitting older
homes. Efficiency New Brunswick and Natural Resources
Canada would be willing to share their training materials for
local adaptation.
Sources
http://oee.nrcan.gc.ca/residential/personal/new-home-improvement/heritage.cfm?attr=4
http://www.gov.mb.ca/chc/hrb/pdf/green_guide_2010.pdf
Best Practices in New Building Energy Efficiency
Policy
Nelson, like all BC municipalities, is limited in its ability to
require energy efficiency or renewable energy beyond that laid
out in the BC Building Code. A small number of municipalities
are crafting policies and incentives to increase the energy
efficiency of new construction.
City of North Vancouver: a green building zoning bylaw
that increases density allowance in exchange for
performance-based higher efficiency in single detached
homes and larger buildings
The District of Saanich provides rebates on building permit
fees and home energy assessments for new and renovated
homes. Incentives for buildings and homeowners include
fee exemptions and reductions for small homes, building
retrofits, and solar hot water installations
The Bowen Island Municipality developed a council policy
whereby rezoning applicants are expected to achieve Built
Green™ Gold and an EnerGuide for New Houses with a
rating of 80
Outside of BC, the Town of Canmore‘s Green Building
Policy requires new buildings in need of a Building Permit
or Development Permit to be built to a green building
standard, such as LEED, EnerGuide, or equivalent
Sources
http://www.cnv.org/server.aspx?c=3&i=661
http://www.saanich.ca/living/natural/greenrebate.html
http://www.communityenergy.bc.ca/sites/default/files/Policy_Manual_final.pdf
http://gmf.fcm.ca/files/Municipal_Sustainable_Bylaw_Collection/Canmore_Gree
n_Building_Policy.pdf

44 City of Nelson Climate Action & Energy Plan
B. Increase Efficiency in New Buildings to ensure energy
security and strengthen local green building sector
Increasing efficiency in new buildings can take advantage of
technological innovations, and avoid unnecessary emission
growth and energy consumption in the next generation of
buildings. City efforts will help the local building industry
respond to increasingly demanding requirements established by
the province and support a vibrant local green building sector.
This diverse sector includes builders, architects, engineers,
inspectors and renewable energy technicians working locally, in
surrounding communities, and beyond BC. With growing
demand in green buildings, this sector can become an
increasingly important part of the local economy.
Specific elements of this strategy could include the phasing in of
some of these policies over time:
1. A Rezoning Tool that requires increased efficiency, such as
an updated Sustainability Checklist or building bylaw
2. Collaboration with developers on major new developments
such as Waterfront and Nelson Landing
3. Financial incentives including no and low cost municipal
tools, such as development permit fastracking and permit
fee waiver, as well as leveraging the private sector, such as
support from FortisBC and Green Loans from banks and
credit unions to reduce capital costs
4. Regulations introduced over time, such as energy audits
and labelling of new buildings.
5. This Program would be developed in tandem with the
Climate Protection Guidelines (below), and maximize
synergies with Home and Business Retrofit Program
(above).
6. Capacity Building for staff, building sector and other key
constituencies such as real estate agents and landlords.
Programming could be delivered through the Cool
Community Hub (see Community Wide sector) and in
collaboration with partners such as the Kootenay Career
Society and Selkirk College
See Appendix H: Tools to Support Energy Efficiency in New
Buildings for a list of relevant policies and actions.
Priority Action
New Building Energy Efficiency Policy: To build on current
efforts to encourage new building performance, the City could
negotiate with builders and developers to voluntarily increase
new building performance. This could be addressed at the
development permit or building permit stage and could be done
through an updated Sustainability Checklist.
For single family homes and multi-family residents up to
four storeys, the City could work to achieve an EnerGuide
rating of 80. This should progressively move marginally
beyond each BC Building Code update (e.g. EnerGuide 83
with the next Code update)
For commercial buildings and multi-family residences over
four storeys, the City could work with developers to build to
ASHRAE 2007 standards. This should progressively increase
with each BC Building Code update (e.g. ASHRAE 2010
with the next Code update)
During rezoning and with larger developments, there is a unique
opportunity to work with developers and builders to maximize
achieving these gains. In some communities, e.g. Ucluelet,
Canmore and the City of North Vancouver, similar ―policies,‖
have eventually become more of a requirement. It is worthwhile
working with developers and staff to build capacity to enable
this to become more ―regulatory.‖
This measure could be done independently or in tandem with
other policy tools under Strategy B above.
See Appendix G: Buildings & Business Sector Comments for
preliminary feedback on program opportunities.
C. Encourage Secondary Suites and Infill Cottages for their
inherent superior energy performance
(See Land Use section for strategy description)

Low Carbon Path to 2040 45
D. Advance Building-Scale Renewable Heat for Homes and
Businesses
1. Work with the regional district to enhance, extend and
promote high efficiency wood-stove incentive program.
2. Work with local utilities to add building-scale renewable
energy technology and passive heating and cooling design
retrofits to existing or incentive programs.
3. Explore options for achieving City of Nelson corporate
carbon neutrality through ―offsets‖ from renewable energy
retrofits, working in collaboration with the BC Climate
Action Secretariat.
4. Phase in policies that encourage building scale renewable
energy technologies and design:
Guidelines and information on heat pumps, with a
focus on water-to-water or water-to-air pumps in
Waterfront areas and neighbourhoods with District
Energy potential
New single family homes meet a minimum percentage
of heat through renewables by 2020
Passive Design Guidelines for select neighbourhoods
with solar exposure, e.g. street orientation, solar
access, vegetation, wind turbine height variation scaled
to location
Priority Action
Design Guidelines for Climate Protection: for new
Neighbourhood Area Plans, the Sustainable Waterfront and
Master Plan and infill that cover public realm‖ and ―private
realm‖ (city active)
See Land Use sector strategies for more details
E. .Create Capacity Building and Social Marketing
Program to ensure success of Buildings sector strategies
Technical knowledge and skills related to financing, green
building rating systems, and building practices will be critical to
effective program implementation.
1. Community partnerships with developers, builders, real
estate agents, landlords, building and homeowners
2. Internal capacity and training needs, including Council,
senior management, engineers, planners, inspectors, and
select clerks
3. Partners to develop education programs and add capacity
FortisBC is likely the main partner, as the PowerSense
program has staff available for capacity training. They
can also provide linkages to other communities in the
region
Other potential partners include CHBA Rockies/East
Kootenays and Kootenay Leaf of the Cascadia Green
Building Council
4. Low Carbon College: collaborate with Selkirk College to
advance green buildings, including new buildings, heritage
retrofits, and building scale renewable energy. Programs
would be linked to community priorities and focus on
unique needs of different constituencies. Northern Lights
College, for example, has a focussed program on Solar
Thermal Systems Installation which is so popular it is being
delivered across the province. A short heritage building
energy retrofit program may be a program with both local
and broader market opportunities.
5. Large Building Partnership: Collaborate with major
employers to strengthen strategies, achieve economies of
scale for new and existing buildings, building manager
training.

46 City of Nelson Climate Action & Energy Plan
Building energy use is expected to decline substantially over time. These reductions in energy use are expected to result from a
combination of a far-reaching retrofit program (existing buildings) and improvements to the Building Code
Similarly, building emissions are expected to decline by half on a per capita basis due to a combination of improved efficiency, the
phasing out of heating oil, and increases in renewable heating supply.

Low Carbon Path to 2040 47
Due to improvements to the Building Code and Energy Efficiency Act, Nelson will still be able to have a large impact on new
buildings over the next one or two decades. As code becomes more stringent, however, the marginal benefit of measures to improve
efficiency beyond code will decrease.

48 City of Nelson Climate Action & Energy Plan
In 2
00
7 th
ere
wa
s a
ran
ge
of
pe
r ca
pita
em
issio
ns a
mo
ng
the
ne
igh
bo
urh
oo
ds in
Nels
on
. T
his
is larg
ely
du
e t
o t
he
hig
her
pe
rce
nta
ge
of
ap
art
me
nt
bu
ildin
gs
an
d s
ma
ller
form
at
ho
me
s in
Do
wnto
wn
an
d t
he
exis
ten
ce
of
larg
er
ho
me
s in
Gyro
an
d t
he
Nort
h
Wa
terf
ront.
In 2
02
0,
the
Wate
rfro
nt
an
d D
ow
nto
wn w
ill b
e
ne
arl
y c
om
ple
ted
de
ve
lop
ed
, re
su
ltin
g in
a g
rea
ter
num
be
r o
f
low
er
en
erg
y in
ten
sity
ap
art
me
nts
and
tow
nh
om
es. In
th
e
City's
oth
er
ne
igh
bo
urh
oo
ds,
retr
ofitt
ing
old
er
bu
ildin
gs a
nd
th
e
ad
ditio
n o
f se
co
nd
ary
su
ite
s a
nd
infill
ho
me
s
will
re
su
lt in
a d
ecre
ase
in p
er
ca
pita
em
issio
ns,
pa
rtic
ula
rly in a
rea
s
su
ch
as G
yro
an
d
Rose
mo
nt.
In 2
04
0,
the
co
ntin
uin
g
retr
ofit a
nd
red
eve
lopm
en
t o
f sin
gle
fam
ily h
om
es t
o
incre
asin
gly
hig
he
r
bu
ildin
g e
ffic
ien
cy
sta
nd
ard
s r
esu
lts in
sig
nific
an
tly lo
wer
pe
r-
ca
pita
bu
ildin
gs
em
issio
ns.
Th
e
co
mm
un
ity-w
ide
ave
rag
e d
ecre
ase
s t
o
1.0
to
nn
e.

Low Carbon Path to 2040 49
Indicator Highlights: Buildings Sector
Indicator Description Performance in Baseline
Year (2007)
Low Carbon Path Performance
Average Building size of
New Single Family
Homes*
(square meters)
More compact housing uses
less energy for heating 180 m
2 90% of 2007 levels by 2020
Performance
Beyond BC Code
(%)**
Building efficiency. E.g.
increased insulation
unknown 3% by 2020
0% by 2040
Retrofit Rate
(%, Annual)
% of existing buildings
retrofitted each year to
improve energy efficiency
0.5% or 20 buildings per year
(estimated BC average)
2% by 2020 or 75 buildings per year
Building Scale
Renewables:
Existing Buildings
(annual % or number
of buildings)
% of existing buildings which
install a renewable energy
system (e.g. solar, geo-
thermal)
unknown All original buildings will be replaced,
retrofitted, or include renewable energy
by 2060
2% by 2020
1% by 2040
0.25% by 2060
Building Scale
Renewables: New
Buildings
Phase in, 2020-2040
(% of new buildings,
annual)***
% of newly constructed
buildings which include a
renewable energy system (e.g.
solar, geo-thermal)
unknown 75% by 2020
80% by 2040
100% by 2060
This is aggressive but with some
reasonable local effort would be
realistic on the short term. Medium
and longer term efforts will be code
driven.
*Achieved primarily through secondary suites and small-format housing (infill housing)
** Includes space heat, water heat, and electricity (appliances)
*** Includes Heat Pumps (air-source, geo-exchange), solar thermal, etc., many of which are already more economical for homeowners than
conventional heating technologies
Key Senior Government Policies
BC Building Code - the Province is updating the BC Building Code to include some of North America‘s highest building
energy efficiency standards. As shown in the Community Wide Emissions Analysis, this measure would have a significant
impact on building emissions in the future.

50 City of Nelson Climate Action & Energy Plan
Energy Supply The source and type of energy supply determines emissions in other sectors, notably heat and power in buildings. Nelson residents and
businesses already enjoy the cleanest (lowest carbon) electricity in North America due to dominance of hydro power from Nelson
Hydro. Other parts of BC have some natural gas-fired power and import some coal-fired power. Growing demand requires new
sources of clean electricity to be found, although the driving force behind increasing local supply is more likely energy security and
economic development.
Heating buildings with natural gas is a more significant source of emissions, but can be more flexible than electric baseboard heating,
potentially permitting integration with renewable sources in the future. Nelson is currently exploring the potential for District Energy
and renewable heat at the community scale to reduce emissions, and has already completed a pre-feasibility study.
Objective
Develop cost effective, local, reliable, low impact energy
supply
Complementary Objectives
Increase energy security and reduce emissions through local
generation and lower natural gas consumption
Increase local energy spending and create some local jobs
Strengthen non-tax revenue streams for the Municipality to
help reduce local taxation
Nelson Path to 2040 Synergies
Direct
Related

Low Carbon Path to 2040 51
Strategies
A. Establish District Energy Systems in
Lakefront and Selkirk-Davies to increase
energy efficiency and enable renewable
heating technologies
District Energy Systems include a system of
underground pipes to share energy. They provide
efficiency benefits and economies of scale and can
readily use renewable energy sources. They can
provide reduced cost to users and new revenue
streams for the City to reduce local taxation demands.
The City has carried out pre-feasibility work in two
neighbourhoods.
1. Conduct further feasibility work, including a
business plan, to ensure the viability of the
project and identify a path forward
2. Adjust land use plans and implement bylaws to
encourage or require buildings to connect to the
District Energy System, such as design
guidelines, zoning, and phasing agreements
Priority Actions
Strategic Plan for District Energy: finalize
decision on ownership and governance of District
Energy System. The Strategic Plan should include the
following components:
Governance and Ownership: costs and benefits
of different ownership models, which might or
might not include private sector involvement.
This should be done first as private sector partners
are often able to carry out full feasibility and
business planning at minimal cost or sharing cost
with the Municipality
Critical Path: identification of planning phases
and key actions to proceed with in project
development, including key decision and delivery
dates for further feasibility work in relation to
land use planning, funding applications, and
preliminary engagement needs for community,
with a focus on developers and builders
Other Elements: include integration with the
Waterfront Plan and exploration of the potential
to include other renewables such as biomass
B. Maintain Near-Zero Emissions for Electricity
Supply in Nelson
The vast majority of the electricity used in Nelson is
from hydroelectric power generation. Due to
Nelson‘s hilly geography, some streams may have
sufficient hydro resources for small-scale power
production. Wind is unlikely to be feasible in Nelson
given low resource potential identified through
Provincial-scale wind mapping.
1. Harness cost effective, local renewable power
opportunities, focusing on immediate micro-
hydro opportunities.
Priority Action
Micro-hydro from water system: monitor water
pressure and flow at select Pressure Reducing Valve
(PRV) sites and identify strategic opportunities for
turbine integration, such as installing during regulator
maintenance and replacement schedule
Run-of-river Micro-hydro: gather stream flow
monitoring data; calculate power potential,
environmental impacts (fish) and social impacts
(visual, recreational)

52 City of Nelson Climate Action & Energy Plan
District Energy Business Case Basics
Under the right conditions, district energy can provide cost effective energy services, high energy and environmental
performance, and manage risk from energy commodity price volatility.
Good systems generate heat at a high efficiency central plant or a series of mini plants, replacing less advanced
boilers and furnaces in multiple buildings. Heat is distributed through a network of pipes and is returned to be re-
heated. Cooling can be similarly provided. Some systems can also generate electricity.
Many older District Energy systems are fuelled predominantly by natural gas. Newer systems often incorporate
renewable fuels including waste heat from sewage or industrial activity, wood, biogas from agricultural waste, solar
hot water, or ground or water heat pumps or a combination thereof, and may still use natural gas during periods of
peak demand.
Four general criteria determine the viability of new District Energy Systems.
1. High, concentrated heat demand, typically from significant floor space or high building density or potentially
a building that requires large heat demand like a brewery.
2. Balanced load based on different buildings requiring heat at different times of day to avoid peaks. This usually
requires ―mixed use‖ developments. Strategic co-location of buildings that require heat, e.g. swimming pools,
and those that generate heat, e.g. ice rinks, can facilitate this opportunity.
3. Integrated and rapid build out normally starting with one large or several large new buildings with additional
ones added quickly in succession, subsequently permitting HVAC system retrofits of some existing buildings.
Infrastructure development should be timed to permit heat distribution piping deployment simultaneously with
water infrastructure, roads and/or telephone lines.
4. Cost effective, secure energy supply to minimize long-term business risks. This could include a design that
permits diverse feedstocks that are ideally renewable.
If some of these four criteria are strong, the strength of others is not as critical. On the other hand, if many or all of
the criteria are only modestly met, other options may be preferable for improving energy and emission performance
in a cost effective manner.
System ownership and design, land use planning, and permitting are other important priorities to include in business
planning.
District Energy Viability Criteria
District Energy Schematic Diagram

Low Carbon Path to 2040 53
C. Explore Sustainable Energy Options for High
Efficiency Heating in the community
Biomass (wood) and solar energy can make an
important contribution to reducing greenhouse gas
emissions by displacing natural gas. The City and
Regional District are in a unique position to secure
enough sustainably sourced waste-biomass to supply
a large commercial boiler or a District Energy
System. This biomass could include an estimated 800
tonnes from Nelson‘s municipal waste stream,
several times as much from regional fire protection
(which is currently burned) and 60,000 dry tonnes per
year from mill residues. And while the topography of
Nelson makes some parcels unsuitable for building-
scale solar hot water heating, there are other sites
with more sun exposure that would be good
candidates for such systems.
Priority Actions
Develop a Solar Ready Bylaw specific to the
Nelson context
Explore development of Solar Ready Bylaw for solar
hot water systems on new buildings that would allow
developers to opt-out if a site does not have sufficient
solar access. In the long run, this Bylaw could
potentially be updated through development of a
solar resource map that identifies zones in the City
where new development requires Solar Ready
building components.
Priority Actions
Incorporate Biomass Recommendations into
District Energy Phase 2 Feasibility Study
In the recently released Biomass Feedstock
Assessment report prepared for Nelson (B.A.
Blackwell & Associates, 2011), several pragmatic
recommendations are put forward for shaping the
terms of reference for further district energy
feasibility analysis in the City. These
recommendations include:
define the range of moisture content of biomass
for the district energy boilers being considered
define allowances for contaminants such as
paint, nails, rocks, mud, and plastics
consider all of the costs and required facilities
for biomass feedstock management
explore the engineering and economic
feasibility of installing a suspension boiler
dedicated to dry sawdust
define the cost per GJ required to achieve
economic viability of biomass relative to other
fuel sources
In addition to these recommendations, a preliminary
assessment of the human and environmental health
impacts of a biomass fired boiler in Nelson should be
included in the terms of reference for Phase 2.

54 City of Nelson Climate Action & Energy Plan
Safeguarding Sustainability in Biomass Energy
Forest and agricultural fibre can be a sustainable, low impact feedstock for generating heat under some conditions.
However, there are health, environmental and socio-economic considerations to safeguard sustainability.
Protecting food production: Energy crops should not displace food production. Marginal agricultural land can be
an ideal location for some energy crops.
Sustainable harvest: Wood, in particular, must be harvested at a rate that permits replacement to be considered
―carbon neutral.‖ This will range from decades to well over a hundred years for some wood types. Therefore waste-
wood, such as that from construction or the forestry sector, is often a more beneficial source of wood for biomass
energy.
Life cycle analysis: A full life-cycle accounting of energy and carbon should be made, including transportation of
wood and agricultural fibre and cultivation and harvesting of crops, to ensure net positive energy balances and net
greenhouse gas emission reductions.
Maximizing energy value: Biomass combustion should take advantage of heat, not just power. Heat is the primary
energy value derived from combustion. State of the art systems procure more energy than older systems. High
efficiency wood stoves can make an important contribution in some smaller-scale contexts. Combined heat and
power gasification boilers can be appropriate at a larger scale.
Health protection: Biomass combustion can release air pollutants like PM 2.5. The health impacts depend on the
local environmental conditions, e.g. low lying areas, and the technology used: modern, larger-scale high-efficiency
technologies have very minor air pollution impacts.
The full range of costs and benefits need to be evaluated to determine an optimal solution

Low Carbon Path to 2040 55

56 City of Nelson Climate Action & Energy Plan
Indicator Highlights: Energy Supply
Indicator Description Performance in Baseline
Year (2007)
Low Carbon Path Performance
District Energy
connections
(square meters)
Total floor area of buildings
connected to a District
Energy System
None 2020: 20,000
2040: 70,000
2050: 80,000
Electricity Emissions
Factor
(grams co2e/kWh)
Amount of greenhouse gas
emissions associated with
electricity generation
3 grams
Maintain 3 grams
Assumes some new supply from
micro-hydro

Low Carbon Path to 2040 57
1%
Share of Emissions
Solid Waste
Emissions related to solid waste come largely from organic waste in the landfill, which forms greenhouse
gases. Currently Nelson matches the provincial average for waste generation per person. There is
substantial interest in using compost from organic waste in Nelson for gardening. Below highlights the
opportunity for increased diversion of organic waste.
Authority and responsibility for waste management are split between the City of Nelson and the Regional
District of Central Kootenay (RDCK). Waste planning must be closely aligned between Nelson and the RDCK. There is already
considerable alignment between Nelson and RDCK priorities, demonstrated in Nelson‘s Zero Waste Action Plan (2004) and the
RDCK‘s Zero Waste goal in the new Resource Recovery Plan for the region.
Objective
Approach ―zero waste‖ by maximizing resource reduction, reuse, recycling, and recovery for all waste types
Eliminate organics from the landfill as soon as feasible
Complementary Objectives
Support local businesses in the recycling and reuse industry, promoting economic development
Reduce municipal spending on waste management and disposal
Nelson Path to 2040 Synergies
Direct
Related
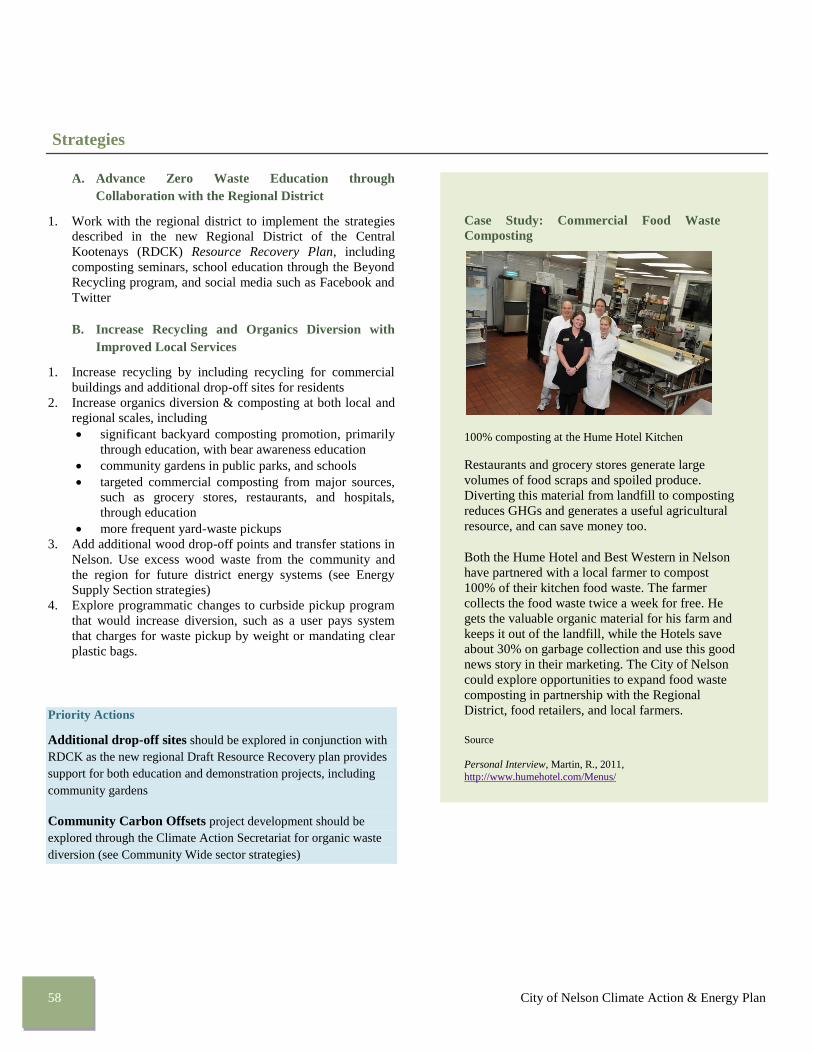
58 City of Nelson Climate Action & Energy Plan
Case Study: Commercial Food Waste
Composting
100% composting at the Hume Hotel Kitchen
Restaurants and grocery stores generate large
volumes of food scraps and spoiled produce.
Diverting this material from landfill to composting
reduces GHGs and generates a useful agricultural
resource, and can save money too.
Both the Hume Hotel and Best Western in Nelson
have partnered with a local farmer to compost
100% of their kitchen food waste. The farmer
collects the food waste twice a week for free. He
gets the valuable organic material for his farm and
keeps it out of the landfill, while the Hotels save
about 30% on garbage collection and use this good
news story in their marketing. The City of Nelson
could explore opportunities to expand food waste
composting in partnership with the Regional
District, food retailers, and local farmers.
Source
Personal Interview, Martin, R., 2011,
http://www.humehotel.com/Menus/
Strategies
A. Advance Zero Waste Education through
Collaboration with the Regional District
1. Work with the regional district to implement the strategies
described in the new Regional District of the Central
Kootenays (RDCK) Resource Recovery Plan, including
composting seminars, school education through the Beyond
Recycling program, and social media such as Facebook and
B. Increase Recycling and Organics Diversion with
Improved Local Services
1. Increase recycling by including recycling for commercial
buildings and additional drop-off sites for residents
2. Increase organics diversion & composting at both local and
regional scales, including
significant backyard composting promotion, primarily
through education, with bear awareness education
community gardens in public parks, and schools
targeted commercial composting from major sources,
such as grocery stores, restaurants, and hospitals,
through education
more frequent yard-waste pickups
3. Add additional wood drop-off points and transfer stations in
Nelson. Use excess wood waste from the community and
the region for future district energy systems (see Energy
Supply Section strategies)
4. Explore programmatic changes to curbside pickup program
that would increase diversion, such as a user pays system
that charges for waste pickup by weight or mandating clear
plastic bags.
Priority Actions
Additional drop-off sites should be explored in conjunction with
RDCK as the new regional Draft Resource Recovery plan provides
support for both education and demonstration projects, including
community gardens
Community Carbon Offsets project development should be
explored through the Climate Action Secretariat for organic waste
diversion (see Community Wide sector strategies)

Low Carbon Path to 2040 59
Reuse
Recover
Recycle
Reduce
Residuals Management
C. Implement a Comprehensive Building Demolition
Waste Management Program to divert waste from
landfill
1. Encourage innovative construction and demolition waste
recycling and reuse through a program that promotes
―Deconstruction.‖ Include a combination of regulations,
education, and incentives such as streamlined building
permitting processes
Priority Action
Construction and Demolition Pilot Project with a focus on
Deconstruction. A local building owner and contractor should be
identified through a Call of Interest. Through the process of
deconstructing the pilot building, the project should seek to
estimate waste diversion potential and identify barriers, and
incentives, capacity and training needs, market demand for used
materials, and potential for job creation. Best practices from the
US and emerging lessons from the City of Vancouver pilot
program should also be considered.
Sustainable Waste Management Hierarchy
While reduction is the most sustainable management practice, it
is rarely prominent. It is also a practice over which senior
governments have greater influence.
The Three ―R‘s‖ is often supplemented with two additional
ones:
Recover ―Energy‖ in a sustainable manner
Residuals Management – sustainably manage residual
waste
D. Reduce Solid Waste Generation through targeted
local and regional policy
1. Support senior government programs to reduce packaging
and extend responsibility of waste reduction and
management to producers (companies, manufacturers,
retailers)
Priority Action
Senior Government Action on Waste Reduction. Write a
letter to provincial and federal governments urging them to
regain Canada‘s leadership position on waste management
through minimizing packaging and strengthening extended
producer responsibility. Amongst others, send carbon copies to
UBCM, FCM, Recycling Council of BC and Metro Vancouver
(the latter are initiating efforts to get senior government
engagement in solid waste reduction).
Deconstruction & Waste Diversion
A home being deconstructed in Vancouver, BC. Photo courtesy of Justin Langille
Each home demolished using conventional practices send around 40 tonnes
of waste to landfill. Some diversion programs require a portion of this waste
to be separated out, but this occurs after a conventional demolition practice.
By contrast, deconstruction focuses on salvage, re-use, and recycling,
diverting over 90% of waste. Deconstruction is also more labour intensive
than demolition, and therefore provides opportunities for job creation. The
City of Vancouver, in partnership with a local non-profit, an industry partner,
and funding from Service Canada, recently completed a pilot project aimed at
training at-risk youth to deconstruct homes. Promoting deconstruction
requires regulatory changes, education, and incentives, as well as a market
for used building materials and equipment.
Source Building jobs by tearing down houses the green way , Kimmett, C., 2011, http://thetyee.ca/News/2011/01/18/TearingDownHouses/

60 City of Nelson Climate Action & Energy Plan
Climate, Energy & Waste
There are different sources of GHGs associated with waste. Most commonly, emissions are associated with the practice
of landfilling where anaerobic decomposition generates methane, a GHG 25 times more potent than carbon dioxide.
Other waste management practices also result in emission increases or decreases. Waste type, shipping distance and
mode of transport also influence a waste management practice. There are also significant emissions embedded in waste
from extraction, processing and transport of products. A strong emission management plan for waste management can
minimize GHGs by considering all of these emissions sources to determine the optimal management practice.
Waste and Embodied GHGs
Embodied CO2e per tonne of waste differs significantly by material type:
Embodied CO2e per Tonne of Waste by Material Type
Plastic Milled Lumber Aluminum Office Paper Computer
2 t 2 t 8 t 8 t 56 t
Some waste types have relatively low material and GHG inputs, e.g. wood. There are also waste types that are so
valuable (due to immense embedded material inputs and GHGs) that they should be prioritized for higher order
management practices, i.e. not landfilled or combusted.
Waste Management Practices and GHGs
GHGs vary significantly by management practice and waste type. Recycling and reduction results in avoided virgin
material inputs and emissions from extraction, processing and transportation. Combusting biogenic carbon (e.g. paper,
wood) avoids potent landfill methane emissions and the emitted carbon is assumed to be re-absorbed by new trees.
Combusting plastic is more GHG-intensive than landfilling.
Tonnes of CO2e by Waste Management Practice Per Tonne of Waste
Recycling Landfilling Combustion
Office paper -3 t +2 t 0 t
Milled lumber -2.5 t +1 t 0 t
Plastic -1.5 t +0.1 t +1 t
Numbers are rounded and include generic assumptions which are not specific to Nelson‘s context. However, they remain useful for relative comparisons across different waste management practices.
Source: US EPA: http://www.epa.gov/climatechange/wycd/waste/calculators/Warm_home.html .

Low Carbon Path to 2040 5 61
Indicator Highlights: Waste Sector
Indicator Description Performance in Baseline
Year
(2007)
Low Carbon Path Performance
Total Waste Generated
per capita per year
(tonnes)
All solid waste generated,
including all recyclable and
compostable materials
0.75 tonnes / person
Historically, per capita
waste generated has
increased across BC
Maintain till 2020 (instead of
increase)
10% lower by 2040
Maintain to 2060
Organics Diversion Rate
(%)
Amount of organic waste
diverted from landfill
33% 2020: 50%
2040: 80%
2050: 85%
Wood diversion for energy
(tonnes)
Amount of wood-waste
diverted for fuel
None 2020: 110 homes equivalent
(700 tonnes per year)
Regional Landfill Gas
capture rate
(%)
Amount of gas at landfill that
is captured and flared or used
for energy generation to reduce
emissions
0% 2020: ~50% combustion*
* Based on study contracted by RDCK: SNC-Lavalin 2010. ―RDCK Resource Recovery Plan -Landfill Consolidation and Waste
Transfer System Financial modeling‖ http://www.rdck.bc.ca/publications/pdf/SNC%20Resource%20Recovery%20Plan-
%20Phase%201%20rpt(FINAL).pdf
Over the short term (2011-2020), GHG emissions from solid
waste are expected to remain constant. Although waste
emissions improve on a per capita basis over this period, this
improvement is balanced out by an increase in population. Over
the longer time frame, a combination of high organic waste
diversion and the capture of landfill gas substantially reduce
greenhouse gas emissions to a small fraction those emitted in
2007.
Clean Wood12%
Other Organics
23%
Recycled Materials
33%
Other Materials
32%
Estimated Waste Composition (2007)

62 City of Nelson Climate Action & Energy Plan 5
Community Wide Measures The following measures cut across traditional energy and emission sectors and municipal line departments and extend out into the
community. They are designed to foster alignment within the municipality, and consolidate support for the Plan and action on the
strategies internally within the City, stakeholders in the community and the broader public. These measures help ensure a
municipality‘s ongoing business activity does not undermine a low carbon agenda, as is often the case and very easy to happen.
Objectives
Strengthen the City‘s institutional capacity and
mechanisms to support implementation
Maximize local economic development opportunities
Consolidate support for the Plan and action on the
strategies
Provide preliminary direction for reducing energy price
shocks to local food security
Complementary Objectives
Strategies
A. Build the City’s Institutional Capacity to support low
carbon community development
1. Community Carbon Offsets Framework Development: Develop a framework that enables the City to meet its
corporate carbon neutral commitment and financially
support high value, community emission reduction projects
that can be used as offsets.
2. Carbon & Municipal Financial Management: Develop
mechanisms enabling staff and council to be informed of the
impact of municipal spending on increasing or decreasing
community greenhouse gas decisions to facilitate decision
making.
3. Community Energy and Emission Manager: Explore
development of a staff position to support Plan
implementation in partnership with other communities in
the Central Kootenay Regional District. This position could
potentially be supported financially by utilities as is the case
with a small but growing number of BC communities.
Nelson Path to 2040 Synergies
Direct
Related

Low Carbon Path to 2040 63
Community Carbon Offsets
The City of Nelson is a signatory community to the BC Climate
Action Charter25
, which includes a voluntary commitment to
become carbon neutral in government operations by 2012. As
administrator of the charter, the Green Communities
Committee26
has been exploring several options that would
allow communities to meet their commitments in a flexible
manner. One of these options, anticipated to be formally
announced during the second half of 2011, is for local
governments to support the development of greenhouse gas
reduction projects in the broader community. The reductions that
occur through these projects would then be subtracted from the
government operations total. The mechanism through which this
works is applying the same principles that are used for carbon
credit projects certified through the Kyoto Protocol`s Clean
Development Mechanism and the Voluntary Carbon Market,
with a lesser emphasis on quantification and verification of
emission reductions, reporting and monitoring.
Community Carbon Offsets are an alternative to purchasing
carbon credits through the Pacific Carbon Trust or another
vendor to achieve carbon neutrality. This should be an attractive
opportunity for Nelson and many other communities because it
would allow them to: Leverage spending for community emission reductions projects
with significant community co-benefits
Help achieve carbon neutrality in municipal operations while
keeping expenditures local
Contribute to advancing emission reduction efforts provincially
and specifically for BC municipalities
Project Requirements
For a community project to be eligible, reductions must be: Additional to those that would be possible without the financial /
technical / coordination contributions of the local government
Real and Permanent The emission reductions need to meet
minimum standards that prevent against leakage (activities shifting
to a different locale or to occur in the future) and safeguards should
be put in place to ensure that carbon emissions that are avoided or
sequestered are not released during and after completion of the
project
Measureable and documented according to approved
methodologies or methodology guidelines
Clearly owned by the City of Nelson through documentation and
written agreements when multiple parties are involved
Project Types
There are a number of different projects that have been identified
in this Plan that have the potential to become community carbon
offset projects, including: District energy
Residential and commercial building retrofits
Expansion of ride share programs
Centralized organic waste composting
25
Summarized in the Context section of this Plan. 26
A joint committee of the BC provincial government and the Union of British Columbia Municipalities
Low carbon police vehicles
The BC Climate Action Secretariat is developing methodologies
for some of these project types. Guidelines for the development
of new GHG reduction quantification methodologies are also
anticipated to be a part of the program launch.
Costs and Benefits
For the majority of projects that Nelson could consider for
inclusion as a community carbon offset project the costs
associated with implementation will be much greater than the
cost of purchasing carbon credits from the Pacific Carbon Trust,
which will be sold to local governments at $25 per tonne of CO2
equivalent. When there are significant community co-benefits
associated with a project, the comparatively greater costs
associated with implementation—versus purchasing carbon
credits—could very likely be justified.
Priority Action
Community Carbon Offset Framework: Develop a
framework for offsetting the City of Nelson‘s corporate carbon
emissions with high quality community projects that includes the
first principles and general approach for such projects. Important
actions to take include:
Liaise with the BC Climate Action Secretariat and other
leading local governments27
to vet opportunities, share
information and build capacity in Nelson.
Identify projects and develop methodologies
Explore development of a community carbon offset trust to
retain money that would have been spent on offsets outside
the community for local projects
Put in place administrative systems to support project
monitoring and reporting
(Re)negotiation of City contracts to clarify and safeguard
ownership of emission reductions when implementation
involves other organizations and/or service providers. This
will be important to demonstrate ownership of emission
reductions.
27
Other local governments may develop methodologies that City of Nelson could use

64 City of Nelson Climate Action & Energy Plan 5
Energy and Emissions and Finance
Different capital investments options have different long term
cost implications for operation, maintenance and replacement.
They can also drive or constrain greenhouse gas emission
growth. Capital investments that are highly energy efficient or
use renewable energy are often more costly than conventional
investments but tend to be less expensive to operate and
maintain. When life cycle costing is integrated into financial
decisions, it often leads to lower long term municipal costs and
lower emissions for the municipality as well as residents and
businesses. Incorporating life cycle costing and carbon
quantification into municipal finance allows richer decision-
making. Key opportunities for such analysis include:
Annual budget
Capital planning
Procurement
Priority Action
Managing Costs, Carbon and Municipal Finance: Integrate
mechanisms into Council and staff decision making to
understand and evaluate the life cycle costs and carbon
implications of large capital expenditures. Options may include:
Capital Planning Carbon and Life Cycle Costing
Analysis: The capital planning process integrates life cycle
cost and greenhouse gas implications of projects. These
assessments could be qualitative in nature and eventually
become high level quantitative assessments for large capital
projects in the future.
Carbon and Life Cycle Costing Analysis for
Procurement: Procurement processes require carbon and
life cycle costing analysis in RFPs and tendering for capital
projects greater than a prescribed threshold.
Annual Budget Carbon and Life Cycle Costing Analysis:
Submissions assess the GHG implications and life cycle
costs of budget proposals, starting with qualitative
assessments.
It may be appropriate to couple these mechanisms with
complementary ones to monitor and evaluate corporate
greenhouse gas emissions.
B. Engage with Citizens, Businesses, Non-Profits, and
Public Sector Organizations to move down the Low
Carbon Path
1. Energy & Emissions and Economic Development Lens: Integrate climate and energy into local economic
development efforts by reinforcing key energy and emission
strategies and job retention and creation sectors
2. Low Carbon Business Capacity Building: Support local
businesses in measuring and reducing energy and emissions
3. Education and Outreach Program: Develop a focussed
and strategic program to consolidate support and maximize
action on sectoral strategies.
Use community based social marketing to inform
detailed planning of initiatives involving behavioural
change.
Develop a brand for Low Carbon Path initiatives.
Integrate broadly, e.g. ―community climate champion‖
bumper stickers for ride share drivers, lawn signs on
home retrofits, shop window stickers for businesses
with carbon management plans, jean jacket badges for
local green builders, etc.
Create a low carbon action hub to provide direction
and support for action through online and face-to-face
outreach, resourced by a staff person to develop and
deliver the focussed support for initiatives. The
program would involve extensive collaboration with
private, public and non-profit partners.
4. Low Carbon Community Pledge: Work with stakeholder
to develop a pledge that can be used with stakeholders and
the public to kick start outreach, consolidate support for the
Plan and provide direction for action. The Pledge could be
deeply integrated into the Low Carbon Path hub.
Energy, Emissions and Economic Development:
Rising energy costs will increase economic vulnerability for
residents and business. With upwards of $30 million (2007)
spent annually on energy locally and steadily climbing,
conservation, efficiency and renewable energy can be part of an
economic development strategy focussed on keeping a larger
percentage of this money locally. Investing in renewable energy
creates twice as many jobs as equivalent investments in new
supply; and investing in conservation and efficiency creates four
times as many jobs.
Benefits of initiatives like the Building Energy Retrofit Program
can be accrued directly through spending in local hardware and
lumber or green building jobs for the construction trades, entry
level employment in weatherization, and engineers in renewable
energy system design.
An even greater portion of reduced energy spending is
redirected towards other local economic activity such as
recreation and leisure, retail and restaurants.
Source
Comparative Analysis of Employment from Air Emission Reduction Measures,
Hornung, R., 1997

Low Carbon Path to 2040 65
Priority Actions
Low Carbon Local Business Advising: Collaborate with
ClimateSmart, FortisBC and local partners to encourage local
businesses to participate in a capacity building program to
enable them to measure and reduce their energy and emissions.
Low Carbon Community Pledge: Develop a Pledge that can be
rolled out to citizens, businesses, non-profits and public sector
organizations to consolidate support and provide direction for
action. See Appendix C: Climate Protection Pledge
Education and Outreach Hub: Explore development of this
hub through development of a phased high level plan, including
financial support for a staff person and potential funding
sources, notably utilities that share complementary demand side
management priorities in the building sector, and philanthropic
non-profits with climate action programs.
Priority Action
Energy and Emissions and Economic Development: Integrate
an energy and emissions lens into the Economic Development
Partnership.
Sectors that could be prioritized for job retention and creation,
and strategies that could be reinforced include the following.
Job Retention
and Creation
Relevance Complementary
Strategies
Local workforce
commuting from
surrounding
communities
Reduce vulnerability
to rising
transportation costs
and reduce GHGs.
Nelson
Rideshare,
Regional Transit
Local green
building and
renewable energy
sector
This growth sector is
disproportionately
large locally.
Includes entry level,
trades, architects,
technicians,
engineers.
Home and Office
Retrofit Program,
Knowledge
Workers with the
flexibility to work
remotely
Can be attracted
domestically and
internationally
All energy
security, mobility
and liveability
strategies
Nelson
Businesses
Buying local
services and locally
made products can
reduce GHGs
Integrate Think
Global. Shop
Local. into
campaigns
Local and
regional
agriculture and
food processing
Reduce local
vulnerability to
rising energy costs
and reduce GHGs
Regional Food
and Ag Strategy
(Think Global.
Eat Local.)
Education, Outreach and Social Marketing
A strong education and outreach program can deepen, sustain and
elicit action. Effective programs are integrated into a suite of
mutually reinforcing policies and actions. Moreover, the process
of designing an effective educational program complements the
design of good policies and measures, and collectively they
should inform one another. For instance, identifying target
audiences, their motivations and barriers to desired behaviours,
and analyzing their situational context will not only shape
effective education and outreach, it should also shape broader
policy design, such as the type of bike safety and security
infrastructure critical to increase the likelihood of cycling in a
specific constituency. Building the right infrastructure will
automatically get a certain response. This critical outreach
approach is known as Community Based Social Marketing
(CBSM). As more detailed Low Carbon Path planning work is
undertaken CBSM can be incorporated.
Community Based Social Marketing Introduction
Most information and awareness programs aimed at changing
tried and true behaviour, fail. Desired behaviour changes can
best be supported by targeting specific populations and using
customized strategies such as obtaining commitments, providing
behavioural prompts, encouraging or seeding social diffusion, and
establishing new norms with credible validators. Community-
based social marketing is a methodology with well defined steps:
1. Identify the behaviour(s) you want to target, focusing on the
impacts and probability of the adoption of each behaviour.
2. Uncover the benefits and barriers to the adoption of each
behaviour, using a literature review, observation, focus
groups and surveys.
3. Develop a strategy that will reduce the barriers and increase
the benefits to the behaviour you are targeting (or if this is
not possible develop a strategy to increase the barriers and
reduce the benefits to the behaviour(s) you want to
discourage). Strategic tools include: commitments, social
diffusion, prompts, establishing norms, communications,
incentive and convenience.
4. Pilot the strategy with a small sample. A staggered baseline
design is effective for large programs that are best piloted
more than once to sharpen their focus.
5. Implement broadly and evaluate, ensuring adequate long-
term measuring.

66 City of Nelson Climate Action & Energy Plan
RDCK Energy and Emissions Reduction Program
ClimateSmart, in partnership with FortisBC, the RDCK and
LiveSmart BC, is offering a program to assist small businesses
in cutting energy use and greenhouse gas (GHG) emissions. The
program includes skills training, assistance in GHG
measurement and developing business-specific energy reduction
strategies, and funding for energy retrofits. Nelson businesses
are invited to participate, with subsidies available from FortisBC
and RDCK. Recruitment for the program is currently underway;
sessions begin in June 2011
C. Support regional food and agriculture systems to reduce
greenhouse gases and vulnerability to rising food prices.
Contemporary food production is energy and greenhouse gas
intensive during every phase of activity: growing, processing,
shipping and storage. As energy prices rise, the cost of growing,
processing and transporting food will also rise. The risk of food
crops being displaced with energy crops will also grow. Global
food production is additionally projected to experience
significant disruptions due to climate change.
Strategically focussed efforts can modestly increase the share of
locally and regionally-grown and processed food, and can reduce
greenhouse gases in certain cases. Moreover, it can strengthen
the local economy, through job creation and by reducing some of
the vulnerability to rising energy prices and global food
production disruptions.
Nelson already has a solid foundation upon which to build with a
well supported farmers` market, some food and beverage
processing, and local as well as regional food growing.
1. Collaborate with the Regional District and local non-profits
to advance this strategy.
2. Explore strategies to support connecting regional growers
and food processors to local residents and businesses
including enhancing the farmer`s market, networks
connecting restaurants with regional and local producers.
3. Explore the potential for food production and processing in
the City such as fruit trees and perennial food crops in parks
and public spaces, community Gardens, etc.
4. Reinforce the waste management strategy and local nutrient
recycling through community composting, potentially
focussed in businesses and institutions with high centralized
concentrations of food waste.
5. Encourage the sharing and growth of local gardening and
food processing knowledge, potentially through the College
or a master gardening group.
Local Food Does Not Necessarily Mean Lower GHGs
Local food production will not reduce Nelson`s local greenhouse
gas emissions under current emissions accounting practices.
While local food can reduce emissions in other communities,
especially within the transportation sector, there may be higher
embodied greenhouse gas emissions from other sources. For
example, reduced transportation GHGs in locally grown fruit can
be offset over a winter by increased energy and emissions from
storage.
Local food production and processing can have other benefits
not directly related to GHGs, including reduced vulnerability to
rising food prices from more expensive oil and disruptions to
global food production from climate change, or to provide local
economic development benefits through new business
opportunities.

Low Carbon Path to 2040 67
Citizen and Business Action This section highlights actions that citizens and businesses in Nelson can take to reduce greenhouse gas emissions and expenditures on
energy, and help the City meet its climate protection and sustainability goals. The successful implementation of the Strategies and
Priority Actions in this Plan require action on the part of businesses, schools, community groups and individuals. Six specific, tangible
actions that people can do in support of the Plan‘s strategies are described below.
Transportation
Reducing dependence on automobiles and switching to more efficient vehicles are the two major areas of action for transportation.
1. Replace Some Car Trips with Walking, Bicycling, Car-
Pooling and Transit
Each time you travel to work, school, the store, church, library,
pub, park, ski hill, or beach, you make a choice about which
mode of transportation to take. Each of these choices has an
impact on your personal carbon footprint and the City‘s
emissions as a whole. Strategies in the Plan that will support
citizen and business action include:
Build on the Community‘s Complete, Compact and
Centered Form (Land Use - A).
Climate Protection Design Guidelines (Land Use - C).
Mainstream Low Carbon Transportation (Transportation -
A), which includes:
o Covered, secure bike parking and showers for residents,
employees; and covered/accessible bike parking for
customers
o Exploration of new car share opportunities
Build Kootenay Rideshare Capacity (Transportation - B).
Enhance Public Transit Locally and Regionally
(Transportation - C)
Implement the Nelson Active Transportation Plan
(Transportation - D)
✓Biking to work could save you $2,000/year compared to
driving. Cyclists are the happiest commuters.
✓If you can eliminate one car, you could save about
$9,000/year.
! Riding the bus produces less than 1/3 of the emissions per
person as a trip alone in a car
2. If Purchasing a Car, Buy the Most Fuel-Efficient
Possible
The residents of Nelson are leaders in BC and Canada in a
number of areas of sustainability, but their choice of vehicle to
drive is not one of them. In 2007, the average vehicle on the road
in Nelson was 12% less efficient than the British Columbia
average. Strategies in the Plan that will support citizen and
business action include:
Mainstream Low Carbon Transportation (Transportation -
A), which includes:
o Electric vehicle parking incentives
Low Carbon Transportation Education and Outreach
(Transportation - E)
✓You could save $1000 or more per year in fuel costs.
! SUVs use almost twice the fuel and release nearly twice the
emissions as a car that seats the same number of people

68 City of Nelson Climate Action & Energy Plan
Buildings
3. Get an Energy Audit of Your Home / Business
The first step to making your home or business more energy
efficient is hiring a professional to conduct an energy audit. An
energy will identify and help you prioritise the improvements
that could be made to reduce energy consumption and lower
your electricity and heating bills. An energy audit can also give
your home/business an energy rating score, which allows you to
compare your building‘s performance with provincial and
national standards. Strategies in the Plan that will support citizen
and business action include:
Home and Business Retrofit Program (Buildings – A)
Capacity Building and Social Marketing (Buildings – E)
✓A more energy-efficient home will lower your utility bills and
reduce greenhouse gas emissions
! The average Canadian house consumes twice as much energy
as an average vehicle in one year
4. Turn Down Your Thermostat to 15◦C at Night and
When Not at Home
There are many simple things that residents and business owners
can do to reduce energy use—among the simplest and most
effective is turning down the heat when not at home and at night.
An energy audit can help you identify other zero and low cost
adjustments that you can make that to reduce your energy
expenditures and greenhouse gas emissions. Strategies in the
Plan that will support citizen and business action include:
Capacity Building and Social Marketing (Buildings – E)
✓You‘ll save 10-15% of your energy bill
! Nearly 60% of energy used in Canadian homes is related to
heating

Low Carbon Path to 2040 69
Solid Waste
5. Compost and Recycle
When thrown in the garbage and sent to a landfill, yard and food
waste produce large amounts of methane—a highly potent
greenhouse gas. Putting a composting bin in your backyard and
participating in future City and Regional District organic waste
collection programs can help eliminate an easily avoidable
source of greenhouse gas emissions. Recycling is easy and can
have an even larger impact on global emissions, by reducing
energy use and resource extraction for new goods and materials.
Strategies in the Plan that will support citizen and business
action include:
Zero Waste Education (Solid Waste – A)
Improved Local Services for Recycling and Composting
(Solid Waste – B)
Local and Regional Policies for Reducing Waste Generation
(Solid Waste – D)
✓Composting and recycling takes pressure off our landfills and
reduces energy use and the need for resource extraction for new
materials
! Garbage buried in landfills produces methane, a potent
greenhouse gas
Community Wide
6. Buy Local
When there are local alternatives of the food and products that
you need, buying these is a good option for keeping money in
the community and reducing greenhouse gas emissions from
long range freight transport. Strategies in the Plan that will
support citizen and business action include:
Support for Regional Food and Agriculture Systems
(Community Wide – C)
✓Buying locally produced goods reduces the transportation
energy and supports local farmers and businesses
! Food travels an average of 2800 km from where it is produced
to where it is consumed.

70 City of Nelson Climate Action & Energy Plan
3. Implementation, Funding
& Monitoring

Low Carbon Path to 2040 71
Implementation Framework
Introduction
This Framework outlines the key components for implementing the Plan‘s priority actions. These actions will be
implemented within the next 5 years to jump start action on the strategies over each of the Plan‘s sectors.
The sector-specific information in the tables that follow focus on estimates of the Implementation Costs for the
City.
Many priority actions require time of existing Nelson “City Staff.‖ "Other Costs" could be in the form of work
completed by a consultant or a contractor with the City. The latter could be financed in whole or part by a by
external financing.
“Total Costs” refers to the entire costs of a priority action. In some cases priority actions relate to existing
―Committed Work” and may already be partially or fully funded. The “Incremental Costs‖ are the capital and
human resource costs required to implement the priority action beyond what has already been committed or what
would be normally done. For example, the Infill Home Pilot Project is only partially motivated by climate and
energy objectives. There has been an interest in this work for other reasons such as housing affordability and some
work has already happened in the community. City Staff and Other Costs associated with this Pilot Project would
only partially be attributed to the Low Carbon Path, e.g. 80%. Other actions are completely new or beyond would
normally be done – these costs are 100% incremental. Some priority actions simply provide some energy and
emission management guidance to existing work with minor to 0% incremental costs.
These costs are rough estimates given uncertainty about the final policy and action design. The information is a
starting point for preliminary planning purposes and should be updated and revised on an ongoing basis as actions
are further defined, new budget and funding figures become available, and project timing is confirmed.
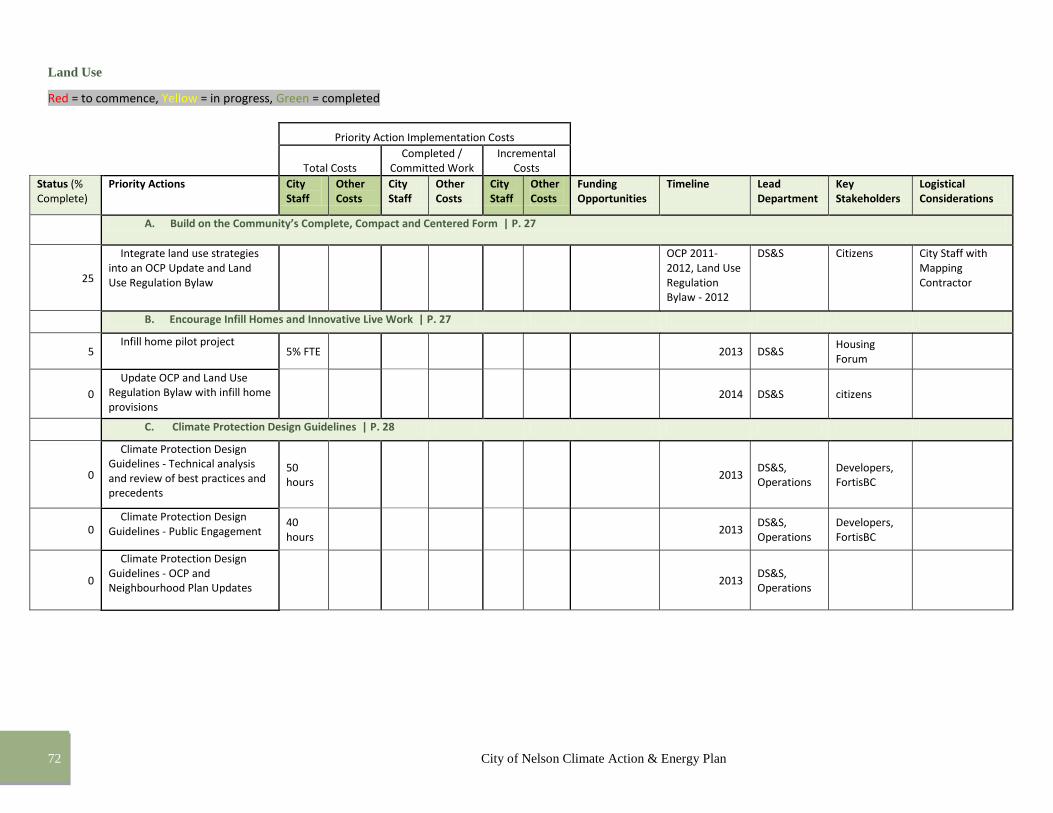
72 City of Nelson Climate Action & Energy Plan
Land Use
Red = to commence, Yellow = in progress, Green = completed
Priority Action Implementation Costs
Total Costs Completed /
Committed Work Incremental
Costs Status (%
Complete) Priority Actions City
Staff Other Costs
City Staff
Other Costs
City Staff
Other Costs
Funding Opportunities
Timeline Lead Department
Key Stakeholders
Logistical Considerations
A. Build on the Community’s Complete, Compact and Centered Form | P. 27
25
Integrate land use strategies into an OCP Update and Land Use Regulation Bylaw
OCP 2011-2012, Land Use Regulation Bylaw - 2012
DS&S Citizens City Staff with Mapping Contractor
B. Encourage Infill Homes and Innovative Live Work | P. 27
5 Infill home pilot project
5% FTE
2013 DS&S Housing Forum
0
Update OCP and Land Use Regulation Bylaw with infill home provisions
2014 DS&S citizens
C. Climate Protection Design Guidelines | P. 28
0
Climate Protection Design Guidelines - Technical analysis and review of best practices and precedents
50 hours
2013 DS&S, Operations
Developers, FortisBC
0 Climate Protection Design
Guidelines - Public Engagement 40 hours
2013 DS&S, Operations
Developers, FortisBC
0
Climate Protection Design Guidelines - OCP and Neighbourhood Plan Updates
2013 DS&S, Operations

73 Low Carbon Path to 2040
Transportation
Priority Action Implementation Costs
Total Costs
Completed / Committed Work
Incremental Costs
Status (% Complete)
Priority Actions City Staff
Other Costs
City Staff
Other Costs
City Staff
Other Costs
Funding Opportunities
Timeline Lead Department
Key Stakeholders
Logistical Considerations
A. Mainstream Low Carbon Transportation throughout the community | p 34
0
Low Carbon Transportation Policy - Update Parking Bylaws 50
hours
Operations, DS&S
0
Low Carbon Transportation Policy - Review and Update Design Guidelines
80 hours
Operations, DS&S
0
Requirement for Transportation Master Plan for new commercial developments
80 hours
Nil Developers DS&S
B. Build Kootenay Ride Share Capacity | p 34
0
Collaborate with Kootenay Rideshare to explore enhancements to service
Nil Operations, DS&S
C. Enhance Public Transit Locally and Regionally | p 36
0
Integrated Low Carbon Transportation Study 40
hours $25K - $50K
BEAT ($25,000)
40 hours
FCM, BC Transit, MoT
Operations, DS&S, Transit, Finance
ACT Completed - needs to be integrated
D. Implement the Nelson Active Transportation Plan | p 36
0
Identify and address barriers to implementing the Active Transportation Plan
40 hours
Nil Operations, DS&S, Transit, Finance
E. Low Carbon Transportation Education and Outreach | p 36
75 Social Marketing and
Education 80 hours

74 City of Nelson Climate Action & Energy Plan
Buildings
Priority Action Implementation Costs
Total Costs Completed /
Committed Work Incremental
Costs Status (%
Complete) Priority Actions City
Staff Other Costs
City Staff
Other Costs
City Staff
Other Costs
Funding Opportunities
Timeline Lead Department
Key Stakeholders
Logistical Considerations
A. Establish a Home and Business Energy Retrofit Program | P. 41
0
Building Retrofit Pilot
5% FTE $200k 2013
Nelson Hydro, Finance, DS&S
0 Establish Partnerships 1% FTE 2012
0
Compile Technical Challenges
80 hours (or $15k)
2012
Nelson Hydro, Finance, DS&S
0
Financing and incentive program design and structuring 120
hours 2013
Nelson Hydro, Finance
0 Social marketing and engagement
2014
0
Heritage building training program
2.5% FTE 2013-2015
Nelson Hydro, Finance, DS&S
0
Human and social capital development in partnership with Kootenay Career Development Society 1% FTE
2013-2015
Nelson Hydro, Finance, DS&S
Kootenay Career Development Society
B. Increase Efficiency and Renewable Energy Supply of New Buildings | P. 44
0
Put in place one or more policy tool that will move developers to construct buildings that exceed BC Building Code energy performance reqirements
120 hours
2012 DS&S developers, contractors, builders

75 Low Carbon Path to 2040
Energy Supply
Priority Action Implementation Costs
Total Costs
Completed / Committed
Work Incremental
Costs Status (%
Complete) Priority Actions City
Staff Other Costs
City Staff
Other Costs
City Staff
Other Costs
Funding Opportunities
Timeline Lead Department
Key Stakeholders Logistical Considerations
A. Establish District Heating in Lakefront and Selkirk-Davies | P. 51
50
Strategic Plan for District Energy 120
hours $25,000
2012-2013
Nelson Hydro
Waterfront / Downtown Developers, existing businesses and property owners, consultant
B. Maintain Near-Zero Electricity Emissions | P. 51
0 Pressure Reducing Valve
Micro-Hydro monitoring / assessment
2% FTE
2013-2015
Nelson Hydro, Operations
0
Run-of-river Micro-Hydro monitoring / assessment
2% FTE
2013-2015
Nelson Hydro, Operations
C. Explore Sustainable Wood | P. 53
0 Incorporate Biomass
Recommendations into DE Phase 2 Study
0 Develop a Solar Ready
Bylaw
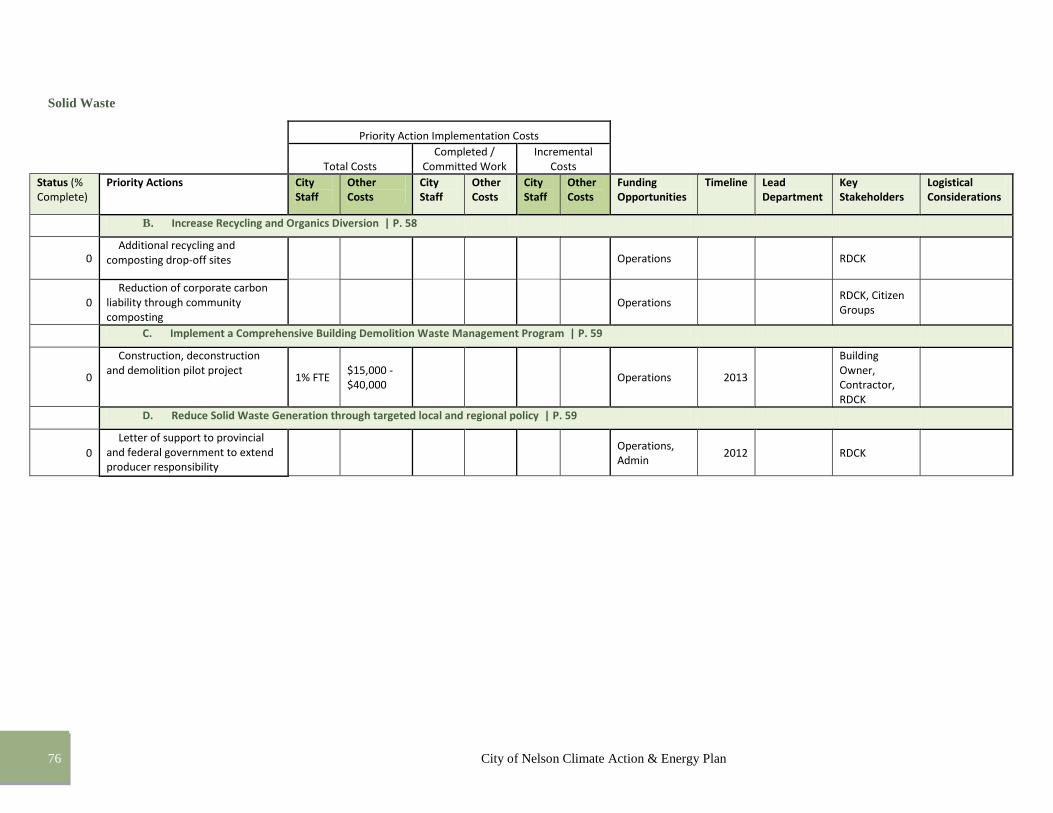
76 City of Nelson Climate Action & Energy Plan
Solid Waste
Priority Action Implementation Costs
Total Costs Completed /
Committed Work Incremental
Costs Status (%
Complete) Priority Actions City
Staff Other Costs
City Staff
Other Costs
City Staff
Other Costs
Funding Opportunities
Timeline Lead Department
Key Stakeholders
Logistical Considerations
B. Increase Recycling and Organics Diversion | P. 58
0 Additional recycling and
composting drop-off sites Operations RDCK
0 Reduction of corporate carbon
liability through community composting
Operations RDCK, Citizen Groups
C. Implement a Comprehensive Building Demolition Waste Management Program | P. 59
0
Construction, deconstruction and demolition pilot project
1% FTE $15,000 - $40,000
Operations 2013
Building Owner, Contractor, RDCK
D. Reduce Solid Waste Generation through targeted local and regional policy | P. 59
0
Letter of support to provincial and federal government to extend producer responsibility
Operations, Admin
2012 RDCK

77 Low Carbon Path to 2040
Community Wide
Priority Action Implementation Costs
Total Costs
Completed / Committed
Work Incremental
Costs Status (%
Complete) Priority Actions City Staff Other
Costs City Staff
Other Costs
City Staff
Other Costs
Funding Opportunities
Timeline Lead Department
Key Stakeholders Logistical Considerations
A. Build the City’s Institutional Capacity to support low carbon community development | P. 62
0
Put in place a Community Carbon Offset Framework
120 hours 2012 Finance, Public Works, City Manager
Consultant, BC Climate Action Secretariat
0
Municipal Finance Carbon Accounting Analysis Policy
120 hours (setup / initiation requirements) + ongoing reporting requirements for department heads
2012 - 2013
Finance and all departments
B. Engage with Citizens, Businesses, Non-Profits, and Public Sector Organizations to move down the Low Carbon Path | P. 64
0
Low Carbon Local Business Advising 1% FTE
2011-2012
Admin, DS&S ClimateSmart
ClimateSmart begun holding training sessions in Nelson in summer 2011
0 Low Carbon
Community Pledge
1% FTE 2011-2012
Admin, DS&S
0 Education
and Outreach Hub
25-50% FTE 2012 - 2015
Admin, DS&S
0
Energy and Emissions Economic Development 25-50% FTE
2012 - 2015
Admin
Kootenay Career Development Society, Nelson Chamber of Commerce, Regional District economic development organization(s)

78 City of Nelson Climate Action & Energy Plan
Priority Action Ranking In order to preliminarily prioritize the priority actions, a simple scoring matrix was utilised. Each priority action was qualitatively evaluated according to GHG
reduction potential, cost, its potential for public interest (profile) and ease of implementation. A ranking for these four categories was then applied. For each of
the categories in the table below, Green represents High Impact/Low Cost/Easy Implementation, Yellow represents Average, and Red represents Modest Impact/
High Cost/Challenging Implementation. This ranking has resulted in an evaluation for the Overall Opportunity each Priority Action represents and this is
visually represented using a colour gradient.
Priority Action
GHG Reduction Potentiala Cost Profileb
Ease of Impleme-ntationc
Overall Opportunity
Lan
d U
se
A. Build on the Community’s Complete, Compact and Centered Form
Integrate land use strategies into an OCP Update and Land Use Regulation Bylaw
B. Encourage Laneway Cottages and Innovative Live Work Infill home pilot project
Update OCP and Land Use Regulation Bylaw with infill home
provisions
C. Climate Protection Design Guidelines
Climate Protection Design Guidelines - Technical analysis and review of best practices and precedents
Climate Protection Design Guidelines - Public Engagement
Climate Protection Design Guidelines - OCP and Neighbourhood Plan Updates
aGHG Reduction: Potential for greenhouse gas reductions relative to other priority actions. bProfile: Potential for exposure in community and public interest cEase of implementation: staff hours, coordination, partnership involvement

79 Low Carbon Path to 2040
Priority Action
GHG Reduction Potentiala Cost Profileb
Ease of Implementationc
Overall Opportunity
Tran
spo
rtat
ion
A. Mainstream Low Carbon Transportation throughout the community Low Carbon Transportation Policy - Update Parking Bylaws
Low Carbon Transportation Policy - Review and Update Design
Guidelines
Requirement for Transportation Master Plan for new commercial developments
B. Build Kootenay Ride Share Capacity
Collaborate with Kootenay Rideshare to explore enhancements to service
C. Implement the Nelson Active Transportation Plan
Integrated Low Carbon Transportation Study
D. Implement the Nelson Active Transportation Plan
Identify and address barriers to implementing the Active Transportation Plan
E. Low Carbon Transportation Education and Outreach
Social Marketing and Education
aGHG Reduction: Potential for greenhouse gas reductions relative to other priority actions. bProfile: Potential for exposure in community and public interest cEase of implementation: staff hours, coordination, partnership involvement

80 City of Nelson Climate Action & Energy Plan
Priority Action
GHG Reduction Potentiala Cost Profileb
Ease of Implementationc
Overall Opportunity
Bu
ildin
gs
A. Establish a Home and Business Energy Retrofit Program
Building Retrofit Pilot (overall score)
Establish Partnerships
Compile Technical Challenges
Financing and incentive program design and structuring
Social marketing and engagement
Heritage building training program
Human and social capital development in partnership with Kootenay Career Development Society
B. Increase Efficiency and Renewable Energy Supply of New Buildings
Put in place one or more policy tool that will move developers to construct buildings that exceed BC Building Code energy performance requirements
Ener
gy S
up
ply
A. Establish District Heating in Lakefront and Selkirk-Davies
Strategic Plan for District Energy
B. Maintain Near-Zero Electricity Emissions Pressure Reducing Valve Micro-Hydro monitoring / assessment
Run-of-river Micro-Hydro monitoring / assessment
C. Explore Sustainable Wood
Incorporate Biomass Recommendations into DE Phase 2 Study
Develop a Solar Ready Bylaw
aGHG Reduction: Potential for greenhouse gas reductions relative to other priority actions. bProfile: Potential for exposure in community and public interest cEase of implementation: staff hours, coordination, partnership involvement

81 Low Carbon Path to 2040
Priority Action
GHG Reduction Potentiala Cost Profileb
Ease of Implementationc
Overall Opportunity
Solid
Was
te
B. Increase Recycling and Organics Diversion
Additional recycling and composting drop-off sites
Reduction of corporate carbon liability through community composting
C. Implement a Comprehensive Building Demolition Waste Management Program
Construction, deconstruction and demolition pilot project
D. Reduce Solid Waste Generation through targeted local and regional policy
Letter of support to provincial and federal government to extend producer responsibility
Co
mm
un
ity
Wid
e
A. Build the City’s Institutional Capacity to support low carbon community development
Put in place a Community Carbon Offset Framework
Municipal Finance Carbon Accounting Analysis Policy
B. Engage with Citizens, Businesses, Non-Profits, and Public Sector Organizations
Low Carbon Local Business Advising
Low Carbon Community Pledge
Education and Outreach Hub
Energy and Emissions Economic Development
aGHG Reduction: Potential for greenhouse gas reductions relative to other priority actions. bProfile: Potential for exposure in community and public interest cEase of implementation: staff hours, coordination, partnership involvement

82 City of Nelson Climate Action & Energy Plan
Funding Some planning and implementation funding may be available to Nelson for some of the strategies outlined in this document. The first table below lists funds
currently available at time of writing. As funding opportunities change frequently, a second table is provided which contains frequently maintained lists of funds.
Fund Priority
Actions
Primary
Funding
Purpose
Description Maximum
Amount
Funding
Availability
(intake)
More Info
Community Wide (three or more sectors)
BC Local Government
Infrastructure Planning Grant
Program
Multiple Plan, Study For feasibility studies of infrastructure related to
energy and climate action. $10,000 Ongoing www.cscd.gov.bc.ca
Build Canada Fund -
Communities Component Multiple Implement
Transport, air, and water-related projects may be
eligible Variable Limited
www.bcbuildingcanadaf
undcommunities.ca
Community Development
Program (Columbia Basin Trust) Multiple
Plan, study,
implement
Funds available for projects related to
environmental, social, or economic development
within the Trust area
Variable Ongoing www.cbt.org/
Community Action on Energy
and Emissions (CAEE) Multiple Plan, Study
Financial and research support to local governments
for energy efficiency, energy conservation and
emissions reductions measures.
Variable Limited www.bcclimateexchang
e.ca
Gas Tax Agreement -
Innovations Fund, Community
Works fund, and Strategic
Priorities Fund
Multiple Plan, study,
implement
Substantial funds available for projects that reduce
greenhouse gases. Some funding available for local
government capacity building.
Tied to
population Limited www.ubcm.ca

83 Low Carbon Path to 2040
Fund Priority
Actions
Primary
Funding
Purpose
Description Maximum
Amount
Funding
Availability
(intake)
More Info
Community Wide (three or more sectors)
Green Municipal Fund Multiple Plan, study,
implement
Funds and low-interest loans available for projects
related to energy generation and efficiency, waste
diversion, and transportation
Variable Ongoing www.fcm.ca/gmf
Towns for Tomorrow Multiple Plan, study,
implement
Wide range of energy, transport, and wastewater
projects have been funded. $375,000 Ongoing
www.townsfortomorro
w.gov.bc.ca/
Buildings
FortisBC PowerSense Retrofit
Financing Implement
FortisBC provides financial assistance to residential
and commercial building owners. Opportunities for
funding energy studies.
Up to $5,000 Ongoing www.fortisbc.com
LiveSmart BC & ecoENERGY
incentives
Retrofit
Financing Implement
Incentives available for energy efficiency and
renewable energy upgrades to homes and businesses Variable
Some limited,
some ongoing www.livesmartbc.ca
Solar BC Incentive Other Implement
Funds are available for the installation of solar hot
water systems. Some areas of Nelson may receive
enough direct sunlight for this to be a worthwhile
option.
$2,000 Ongoing www.solarbc.ca/
Vancity/Real Estate Foundation
Green Building Grant Program
Retrofit
Financing
Plan, study,
implement
Funding related to building renovations, regulatory
change to advance green building and development,
or education to increase understanding of green
building strategies. Partnerships (government,
business, and non-profit) encouraged.
$50,000 Ongoing www.vancity.com/MyC
ommunity

84 City of Nelson Climate Action & Energy Plan
Fund Priority
Actions
Primary
Funding
Purpose
Description Maximum
Amount
Funding
Availability
(intake)
More Info
Energy Supply
Innovative Clean Energy Fund All energy
supply Implement
Funds pre-commercial technologies that produce or
transmit clean and renewable energy Variable Limited www.tted.gov.bc.ca
Federal Tax Exemptions Other Implement Energy generating equipment is often eligible for an
accelerated tax write-off under the Income Tax Act Tax reduction
www.cra-arc.gc.ca
Efficient Boiler Program Other Implement Funding available for the purchase of high-efficiency
boilers. $6,000 Ongoing
Cycling Infrastructure
Partnership Program (CIPP) Other Implement
Construction of new cycling transportation
infrastructure $100,000 Ongoing www.th.gov.bc.ca
Land Use
Affordability and Choice Today
(ACT) Program
Infill Cabin
Study &
Secondary
Suite Study
& retrofit
financing
Plan, Study Funding available to address regulatory barriers to
innovative housing. $5,000 Ongoing www.actprogram.com

85 Low Carbon Path to 2040
Fund Priority
Actions
Primary
Funding
Purpose
Description Maximum
Amount
Funding
Availability
(intake)
More Info
Waste
Regional District of Central
Kootenays
Increase
share of
organic
waste
diversion
Plan, study,
implement
RDCK support for public education and community
gardening projects. May not include funding
May not include
funding
Some limited,
some ongoing www.rdck.bc.ca
Regional District of Central
Kootenays Wood-waste Implement
Funding already allocated to Nelson for wood-
storage bins, but grinding is to be done at
Ootischenia
Some limited,
some ongoing www.rdck.bc.ca

86 City of Nelson Climate Action & Energy Plan
Table 2 - Regularly Updated Lists of Funding Opportunities
Source Sectoral Focus Notes Link
Civic Info BC (UBCM) Various Updated frequently http://www.civicinfo.bc.ca/18.asp
Community Energy
Association
Various Last updated mid-2010 http://www.communityenergy.bc.ca/news/funding-your-community-energy-and-climate-
change-initiatives-2010-update
Lighthouse Buildings Updated frequently http://www.sustainablebuildingcentre.com/resourcecentre/grants_incentives
LiveSmart BC Buildings Updated frequently http://www.livesmartbc.ca/homes/incentives.html#primary
Natural Resources Canada
Cross-Canada Database
Various Updated occasionally http://oee.nrcan.gc.ca/corporate/statistics/neud/dpa/policy_e/programs.cfm?attr=20
Natural Resources Canada
Financial Assistance for
Commercial &
Organizations
Various Updated occasionally http://oee.nrcan.gc.ca/commercial/financial-assistance/index.cfm?attr=20
Ministry of Community,
Sport and Cultural
Development (MCD):
Local Government
Department
Various Updated occasionally http://www.cscd.gov.bc.ca/lgd/

87 Low Carbon Path to 20400
Monitoring and Indicators Monitoring the change in key indicators over time is one of the most effective mechanisms to track Nelson's
progress towards meeting its emission reduction targets. By tracking these indicators the City can also identify
successes and shortfalls of specific actions, providing information that can be used to make adjustments in
implementation. The indicators in this table were selected based on the following criteria: 1) data can be
gathered/monitored by the city and 2) they have a significant impact on energy use and emissions. Some of this data
is not available on an annual basis, e.g. Statistics Canada data, so reporting intervals may be different for different
indicators.
A monitoring program is most successful if data is regularly gathered and there are reporting mechanisms that
integrate results into evaluation and course correction processes.

88 Low Carbon Path to 2040
Land Use
Indicator 2007 (Base Year)
Proposed Target - Low Carbon Path
2011 2012 2013 … Recent Trend
Data Sources Notes/Comments
Density: New growth n/a 20 UPH In Existing Residential
Development Services
60 UPH In New Residential Areas
Infill Growth Pattern n/a 4% Single Detached / 48% Townhouse / 48% Low Rise
Development Services
Dwellings to Jobs ratio
0.6 1:1 by 2040 Development Services, Chamber of Commerce
Potential to partner with Chamber of Commerce
Dwellings within a 10 minute walk to local services such as banks or government offices
50% 80% in 2040 Development Services
Dwellings within a 10 minute walk to local food store
50% 75% in 2040 Development Services
Number of Food Stores
Development Services
Dwellings within a 10 minute walk of the Downtown area
35% 53% in 2040 Development Services
Dwellings within a 10 minute walk of neighbourhood retail
37% 88% in 2040 Development Services

89 City of Nelson Climate Action & Energy Plan
Indicator 2007 (Base Year)
Proposed Target - Low Carbon Path
2011 2012 2013 … Recent Trend
Data Sources Notes/Comments
Number of secondary suites
Building permit applications
Number of infill homes
at least two Building permit applications
Transportation Indicator 2007 (Base Year)
Proposed Target - Low Carbon Path
2011 2012 2013 … Recent Trend
Data Sources Notes/Comments
Vehicle Kilometres Traveled
Household VKT 2007 = 24,415
Household VKT 2020 = 21,400 (-12% from 2007)
CEEI report
Household VKT 2040 = 16,763 (-33% from 2007)
Commute to Work Mode Split
2007 (StatsCan) 2040 (estimate) Census; Bi-Annual Community Survey
Auto-Driver: 57%
Auto-Driver: 27%
Auto-Passenger: 8%
Auto-Passenger: 13%
Public Transit: 2%
Public Transit: 9%
Walking and Cycling: 31%
Walking and Cycling: 52%
GHGs resulting from personal vehicle travel
7.8 tonnes CO2e / household
2.3 Tonnes of CO2e/ household in 2040
CEEI report

90 City of Nelson Climate Action & Energy Plan
Indicator 2007 (Base Year)
Proposed Target - Low Carbon Path
2011 2012 2013 … Recent Trend
Data Sources Notes/Comments
Bike lane kilometres Public Works Department
Number of Annual Kootenay Ride Share trips originating from Nelson
Kootenay Ride Share
kWh per year used recharging cars at public charging points
Public Works Department and Nelson Hydro
Number of transit trips in Nelson
BC Transit
The most common mode of transport used for work trips
Auto-Driver Walking and Cycling
Bi-Annual Community Survey
The most common mode of transport used for non-work trips
Walking and Cycling
Bi-Annual Community Survey

91 Low Carbon Path to 2040
Buildings Indicator 2007 (Base
Year) Proposed Target - Low Carbon Path
2011 2012 2013 … Recent Trend
Data Sources Notes/Comments
Average Building size of New Single Family Homes*
180 m2 160 m2 in 2020 Building permit applications; BC Assessment reports
Average energy demand intensity (kWh/ m2/ year) Residential
198 136 in 2040 Nelson Hydro, FortisBC; BC Assessment
Commercial 355 263 in 2040
Annual Building Energy Retrofits performed
0.5% or 20 buildings per year
2% by 2020 or 90 buildings per year
Building permit applications; Development Services
Residential (excluding apartments)
17 buildings 80 buildings
Commercial 3 buildings 10 buildings
Building Scale <1% 2% by 2020 Building permits
Renewables: 1% by 2040
Existing Buildings 0.25% by 2060
(annual % or number of buildings)
All original buildings will be replaced, retrofitted, or include renewable energy by 2060

92 City of Nelson Climate Action & Energy Plan
Building Scale Renewables: New Buildings
<1% 75% by 2020 Building permits
Phase in, 2020-2040 80% by 2040
(% of new buildings, annual)***
100% by 2060
See also, Land Use Indicators
*Achieved primarily through secondary suites and small-format housing (infill housing)
** Includes space heat, water heat, and electricity (appliances)
*** Includes Heat Pumps (air-source, geo-exchange), solar thermal, etc., many of which are already more economical for homeowners than conventional heating technologies
Energy Supply Indicator 2007 (Base Year)
Proposed Target - Low Carbon Path
2011 2012 2013 … Recent Trend
Data Sources Notes/Comments
District Energy 0 units 2020: 20 units Development Services, Building permits
Connections 2040: 60 units
2050: 100 units
Electricity Emissions 3 grams CO2e/kWh
Maintain 3 grams CO2e/kWh
Nelson Hydro
Factor*
Number of heating oil connections
unknown 2020: 0 connections
Nelson Hydro or City Survey

93 Low Carbon Path to 2040
Solid Waste Indicator 2007 (Base Year)
Proposed Target - Low Carbon Path
2011 2012 2013 … Recent Trend
Data Sources Notes/Comments
Total Waste Generated per capita
0.75 Maintain till 2020 (instead of increase)
RDCK, City waste services
(tonnes / person / year)
10% lower by 2040
Total includes waste and recyclables.
Historically, per capita waste generated has increased across BC
Maintain to 2060
Recycling and Composting Rate
X % 2020: X % RDCK, City waste services
2040: X %
Organics Diversion 33% 2020: 50% lower RDCK, City waste services
(% diverted from landfill)
2040: 80% lower
2050: 85% lower
Wood diversion for energy
0 2020: 700 tonnes per year
RDCK, City waste services
Solid waste GHG emissions per capita (tonnes/person/year)
0.06 2020: 50% CEEI report
2040: 80%
2050: 85%

![Financial Result for Sept 30, 2015 (Revised) [Company Update]](https://static.fdocuments.us/doc/165x107/577c98651a28ab163a8b5d1b/financial-result-for-sept-30-2015-revised-company-update.jpg)


