Revised Revenue Proposal - TransGrid › what-we-do › Business-Planning... · 2017-12-05 ·...
158
Revised Revenue Proposal 2018/19 – 2022/23
Transcript of Revised Revenue Proposal - TransGrid › what-we-do › Business-Planning... · 2017-12-05 ·...

Revised Revenue Proposal
2018/19 – 2022/23


CONTENTS | 2018/19-2022/23 C
Page 3 of 158
1. Executive Summary................................................................................................................. 6
1.1 TransGrid’s Revised Revenue Proposal 2018/19 – 2022/23 .......................................... 6
1.2 Recent changes in the sector .......................................................................................... 6
1.3 Reducing prices for electricity consumers ....................................................................... 7
1.4 Consumer consultation .................................................................................................... 8
2. Introduction and Context ...................................................................................................... 10
2.1 TransGrid’s Revised Revenue Proposal ....................................................................... 10
2.2 Overview of the Revised Proposal ................................................................................ 10
2.3 Changes in the sector since January 2017 ................................................................... 14
2.4 Consumer consultation .................................................................................................. 18
2.5 Maximum Allowed Revenue building blocks ................................................................. 18
2.6 Price path ....................................................................................................................... 19
3. Consumer Engagement ........................................................................................................ 20
3.1 Introduction .................................................................................................................... 20
3.2 Engagement since submission ...................................................................................... 22
3.3 Key issues raised by the AER in its draft determination ............................................... 25
3.4 Key issues raised by the CCP ....................................................................................... 27
3.5 Powering Sydney’s Future ............................................................................................. 30
3.6 Response to public submissions ................................................................................... 32
4. Capital Expenditure ............................................................................................................... 36
4.1 Introduction .................................................................................................................... 36
4.2 Overview ........................................................................................................................ 36
4.3 TransGrid’s overarching response ................................................................................ 43
4.4 Powering Sydney’s Future ............................................................................................. 51
4.5 Replacement expenditure (including Security & Compliance) ...................................... 62
4.6 Augmentation (excluding PSF) ...................................................................................... 82
4.7 IT expenditure ................................................................................................................ 92
4.8 Contingent projects ........................................................................................................ 95
4.9 Network support events ............................................................................................... 105
4.10 Network Support and Control Ancillary Service .......................................................... 105
5. Operating Expenditure ........................................................................................................ 108
5.1 Introduction .................................................................................................................. 108
5.2 Summary of TransGrid Proposal ................................................................................. 110
5.3 Summary of AER’s Draft Decision ............................................................................... 112
5.4 TransGrid’s Revised Proposal ..................................................................................... 113
5.5 Base operating expenditure ......................................................................................... 115

TRANSGRID REVISED REVENUE PROPOSAL | 2018/19-2022/23 C
Page 4 of 158
5.6 Rates of change ........................................................................................................... 116
5.7 Step Changes .............................................................................................................. 120
5.8 Debt Raising Costs ...................................................................................................... 121
6. Incentive Schemes .............................................................................................................. 122
6.1 Introduction .................................................................................................................. 122
6.2 Capital Expenditure Sharing Scheme .......................................................................... 122
6.3 Service Target Performance Incentive Scheme .......................................................... 124
6.4 Efficiency Benefit Sharing Scheme ............................................................................. 126
7. Rate of Return ...................................................................................................................... 138
7.1 Introduction .................................................................................................................. 138
7.2 TransGrid’s approach .................................................................................................. 138
7.3 Cost of debt .................................................................................................................. 140
7.4 Cost of equity ............................................................................................................... 140
7.5 Averaging Periods ........................................................................................................ 141
7.6 TransGrid’s revised proposal ....................................................................................... 141
8. Depreciation & Regulatory Asset Base ............................................................................. 142
8.1 Depreciation ................................................................................................................. 142
8.2 Regulatory Asset Base ................................................................................................ 143
9. Maximum Allowed Revenue ............................................................................................... 146
9.1 Building Block Approach .............................................................................................. 146
10. Pass through events, Negotiating Framework and Pricing Methodology .................... 152
10.1 Introduction .................................................................................................................. 152
10.2 Pass through events .................................................................................................... 152
10.3 Negotiating framework ................................................................................................. 153
10.4 Pricing Methodology .................................................................................................... 153
11. Glossary ................................................................................................................................ 154
12. Appendices........................................................................................................................... 158

CONTENTS | 2018/19-2022/23 C
Page 5 of 158

EXECUTIVE SUMMARY | 2018/19-2022/23 1
Page 6 of 158
1. Executive Summary
1.1 TransGrid’s Revised Revenue Proposal 2018/19 – 2022/23
TransGrid is pleased to submit our revised revenue proposal to the Australian Energy Regulator (AER)
which will reduce transmission costs for electricity consumers in NSW and the ACT. Our proposed
investments and operational funding will allow us to maintain a safe and reliable electricity service to
households and businesses and deliver greater price relief than proposed in our revenue proposal
lodged in January 2017.
TransGrid acknowledges that electricity prices are currently of significant concern for Australians.
In preparing our revised proposal, we have not only paid heed to the AER’s recent draft decision on our
proposal, we have also responded to the views and expectations of our customers and the community.
With this in mind TransGrid is proposing to take additional steps in the next regulatory period designed
specifically to lower prices even further than initially proposed.
This revised proposal represents the second consecutive period of real price reductions. Between the
2009/10 to 2013/14 and 2014/15 to 2017/18 regulatory periods we cut transmission prices by more than
seven per cent. Our revised submission for the 2018/19 – 2022/23 regulatory period will further reduce
transmission prices.
We will achieve this outcome for consumers by:
closely aligning our operating expenditure forecasting method with the AER’s method;
accepting the AER’s decision on the rate of return;
accepting the AER’s decision on the value of imputation credits;
applying all of the AER’s incentive schemes consistent with the AER’s guidelines; and
investing in our network to maintain a safe and reliable transmission service, including a modified
proposal to reinforce the power supply to Inner Sydney to meet reliability standards.
TransGrid has been working closely with consumer and customer representatives through our advisory
council and other engagement to ensure our proposal responds to community views. After carefully
considering the draft decision and the AER’s rationale, TransGrid now proposes revenue of $3,781
million for the five-year period. We have proposed capital expenditure targeted at maintaining an
appropriate balance between risk and cost for customers. While our focus is on driving prices down,
without investing where it is needed, consumers will become dissatisfied with the performance of the
electricity system and significant economic disruption may result from loss of supply.
We thank the AER for giving due consideration to our proposal and recognise the substantial amount of
work in preparing the draft decision. In this revised proposal we have incorporated corrections identified
by the AER and updates for new information. We have also provided further information to support our
proposal where requested by the AER.
1.2 Recent changes in the sector
Since the submission of our revenue proposal in January 2017, the energy sector has experienced an
unprecedented rate of change, industry disruption and policy uncertainty. We recognise that the energy
sector is undergoing a transition, and that demands on our network in the future will be greater than
those of the past.

TRANSGRID REVISED REVENUE PROPOSAL | 2018/19-2022/23 1
Page 7 of 158
The foreshadowed integrated grid plan, prospective renewable energy zones and the Snowy 2.0
expansion may require us to build new networks within the next regulatory period to support the
industry’s transition to renewables. Working with the information currently available and recognising the
uncertainty that still exists, TransGrid has proposed four new contingent projects that fit the most likely
areas requiring investment under these new initiatives. This approach positions TransGrid to respond to
emerging needs without cost to consumers until such costs and needs are certain and fully justified.
As the nation’s Energy Ministers and the Energy Security Board have recognised, transmission
networks will be critical to a successful transition from the ageing and increasingly obsolete fossil
fuelled generation fleet to new era renewable generators. Networks will also have a role in addressing
the challenges that will come with more distributed and intermittent patterns of both supply and
demand. If the regulatory framework is applied with agility and rigour, investors will have both incentives
and certainty to continue investing in the industry. Similarly, customers will pay no more than is
necessary for the quality transmission services they require from our dynamic industry.
1.3 Reducing prices for electricity consumers
TransGrid has undertaken a comprehensive transformation program commencing in early 2015 and
continuing through the privatisation process and into the present. Our approach to capital expenditure
forecasting has been completely revised with a robust risk assessment of every capital project in the
business. We benchmark competitively within our own industry and across comparator industries and
we continually assess how we can do better.
In the revised proposal we have provided further information to support the proposed capital
expenditure program and provided further detail on our risk assessment methodology. We have also
modified our proposed solution for the Powering Sydney’s Future project acknowledging both customer
concern about reliability of supply and the AER’s concerns around future uncertainty. We believe that
reinforcing the electricity supply to the Sydney CBD is vital if we are to avoid an unacceptable risk of
extended power interruptions.
We have closely aligned our operating expenditure forecasting method with the AER’s method. Where
appropriate we proposed some improvements to the method to improve accuracy of the forecast and
ensure our forecast was compliant with requirements in the National Electricity Law and Rules. In the
revised proposal we have accepted many of the AER’s comments and adopted the AER’s draft
decision approach with updates from the AER’s benchmarking report.
We adopted the AER’s guideline approach for the rate of return and whilst we maintain our approach to
the estimation of the market risk premium is consistent with the guideline we have accepted the value in
the AER’s draft decision. We have also accepted the AER’s decision on the value of dividend
imputation credits, whilst noting a reliable estimate for the utilisation method can be calculated using the
ATO tax statistics method without the need for further adjustments or assumptions.
We have adopted all of the AER’s incentive schemes without adjustment in our revenue proposal but
accept the AER’s interpretation of the STPIS scheme in their draft decision and have reflected their
interpretation in the revised proposal. We have identified improvements needed in both our calculation
and the AER’s for CESS to achieve the objectives of the scheme. We have not applied the AER’s
retrospective adjustments to the EBSS scheme in our revised proposal.
Chapter 2 sets out an overview of the proposal, summarising what we have accepted in the AER’s draft
decision and where we have made changes.

EXECUTIVE SUMMARY | 2018/19-2022/23 1
Page 8 of 158
1.4 Consumer consultation
TransGrid understands consumer engagement has fundamental importance to both our business and
the development of the industry; particularly in this time of change for the industry. Customers have told
us their foremost concerns are for reliable service and lower prices. We have consulted intensively with
consumer groups and other stakeholders on our revenue requirements for the next regulatory period
and we are confident that our proposal is aligned with customer expectations. Our proposal is focused
on delivering real price reductions in the next regulatory period and maintaining the safety and reliability
of the electricity service we provide.
An example of TransGrid’s willingness to collaborate with consumers is our approach to the Powering
Sydney’s Future (PSF) project. Customers urged us to “find a solution” with the AER. Accordingly, we
proposed that we modify the PSF project to be undertaken in two stages and only look for approval in
the next period for stage one. This ensures we meet our reliability requirements, whilst minimising the
upfront costs of the project and offering a more agile solution. Should demand not grow as forecast, or
should more cost-effective demand management solutions come to market during the interim, it may be
that we are able to delay the second stage further, which will deliver savings for customers. This
proposal was unanimously endorsed by the TransGrid Advisory Council and has been adopted in our
revised proposal.

TRANSGRID REVISED REVENUE PROPOSAL | 2018/19-2022/23 1
Page 9 of 158

INTRODUCTION AND CONTEXT | 2018/19-2022/23 2
Page 10 of 158
2. Introduction and Context
2.1 TransGrid’s Revised Revenue Proposal
TransGrid is pleased to submit its revised revenue proposal. The AER has agreed with just over 91% of
the revenue proposed by TransGrid, and it is our shared opinion that TransGrid and the AER are not
substantially in disagreement. This proposal focuses on the remaining points of difference, which are
predominantly:
The appropriate level of capital expenditure
Calculation of the efficiency benefit sharing scheme.
We are also pleased the AER has an open mind on our most substantive points of difference, and has
invited us to submit further information to support our position on the capital expenditure needs for the
NSW and ACT network.
Whilst working within the requirements of the National Electricity Rules (Rules), TransGrid has focused
this revised proposal on the substantive issues and looked to reach agreement wherever possible.
Revenue proposals are complex and detailed documents that require rigorous justification to support
material revenue requirements. The AER’s decision underpins the financial viability of our business and
its ability to operate efficiently within a technical and increasingly highly regulated environment of
reliability, safety, security and environmental obligations. Once the AER’s decision is made, TransGrid
must get on with the business of providing a safe and reliable electricity supply to the people of NSW
and the ACT, irrespective of the economic and regulatory context within which it finds itself.
This chapter provides an overview of our revised proposal, the key rationale for our position, what has
changed since we submitted our revenue proposal in January this year, and what these changes mean
for the business, customers and stakeholders. For those who then want to dive into the detail, we invite
you to read on. For many, we hope this chapter gives you the key information you need to understand
TransGrid’s priorities and perspectives for this upcoming regulatory period.
2.2 Overview of the Revised Proposal
The table below provides an overview of TransGrid’s revised proposal and some high level context and
rationale for our approach. The table follows the order of the chapters in the remainder of this document
and starts with capital expenditure, the component for which TransGrid and the AER have the greatest
difference of opinion.
TRANSGRID REVISED REVENUE PROPOSAL | 2018/19-2022/23 2
Page 11 of 158
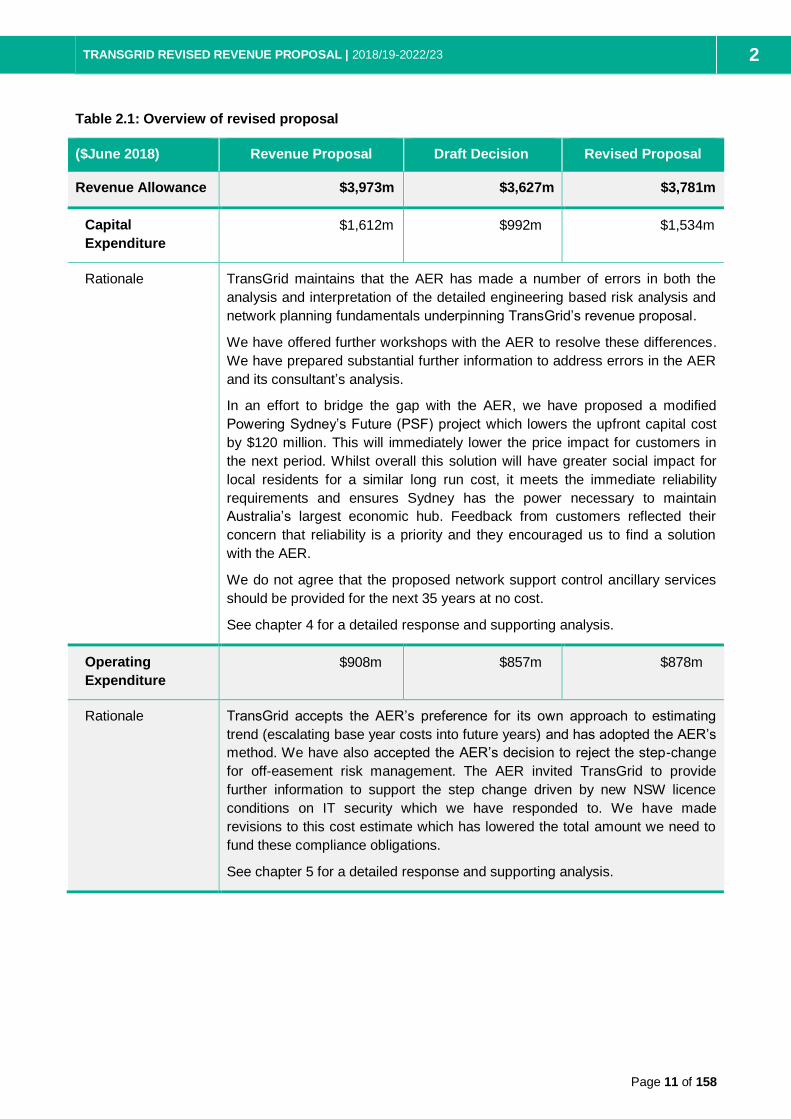
Table 2.1: Overview of revised proposal
($June 2018) Revenue Proposal Draft Decision Revised Proposal
Revenue Allowance $3,973m $3,627m $3,781m
Capital
Expenditure
$1,612m $992m $1,534m
Rationale TransGrid maintains that the AER has made a number of errors in both the
analysis and interpretation of the detailed engineering based risk analysis and
network planning fundamentals underpinning TransGrid’s revenue proposal.
We have offered further workshops with the AER to resolve these differences.
We have prepared substantial further information to address errors in the AER
and its consultant’s analysis.
In an effort to bridge the gap with the AER, we have proposed a modified
Powering Sydney’s Future (PSF) project which lowers the upfront capital cost
by $120 million. This will immediately lower the price impact for customers in
the next period. Whilst overall this solution will have greater social impact for
local residents for a similar long run cost, it meets the immediate reliability
requirements and ensures Sydney has the power necessary to maintain
Australia’s largest economic hub. Feedback from customers reflected their
concern that reliability is a priority and they encouraged us to find a solution
with the AER.
We do not agree that the proposed network support control ancillary services
should be provided for the next 35 years at no cost.
See chapter 4 for a detailed response and supporting analysis.
Operating
Expenditure
$908m $857m $878m
Rationale TransGrid accepts the AER’s preference for its own approach to estimating
trend (escalating base year costs into future years) and has adopted the AER’s
method. We have also accepted the AER’s decision to reject the step-change
for off-easement risk management. The AER invited TransGrid to provide
further information to support the step change driven by new NSW licence
conditions on IT security which we have responded to. We have made
revisions to this cost estimate which has lowered the total amount we need to
fund these compliance obligations.
See chapter 5 for a detailed response and supporting analysis.

INTRODUCTION AND CONTEXT | 2018/19-2022/23 2
Page 12 of 158
($June 2018) Revenue Proposal Draft Decision Revised Proposal
CESS $24m $26m $34m
Rationale TransGrid accepts the modifications the AER has made to the CESS
calculation but we have also identified inconsistencies in the calculation of
CESS payments with the intended operation of the scheme. The calculation
both TransGrid and the AER applied incorrectly assumed benefits for financing
costs arise in the first year of the regulatory period. In addition, a nominal
WACC has been incorrectly applied rather than a real WACC. The revised
proposal addresses this.
See chapter 6 for a detailed response and supporting analysis.
EBSS $62m $15m $34m
Rationale TransGrid has accepted various material modifications and adjustments to the
EBSS calculation that the AER has made. However, we do not agree with
either of the final year adjustments (for 2013/14 and 2017/18) the AER has
imposed. Neither of these adjustments is consistent with a proper application
of the AER’s guideline. The adjustments unreasonably apply material and
disproportionate penalties that are inconsistent with the guidelines, the
incentive based regulatory framework and good regulatory practice.
TransGrid expects its performance in the current period, and its year on year
efficiency savings achieved over the last two financial years and forecast for
the current financial year, to be recognised for what they are. Retrospective
adjustments to economic incentive schemes are inconsistent with good
regulatory practice.
See chapter 6 for a detailed response and supporting analysis.
STPIS Parameters only for
service and market
components.
20 network capability
(NCIPAP) projects
Accepted all but 1 of
the proposed
parameters
12 NCIPAP projects
accepted
Accept
Rationale TransGrid accepts the AER’s preferred method to calculate the STPIS
parameter.
We have included only the AER approved NCIPAP projects in our revised
NCIPAP project list.

TRANSGRID REVISED REVENUE PROPOSAL | 2018/19-2022/23 2
Page 13 of 158
($June 2018) Revenue Proposal Draft Decision Revised Proposal
WACC 6.6% 6.49% 6.49%
Rationale TransGrid has accepted the AER’s draft decision for rate of return, noting the
risk-free rate will be updated in accordance with the agreed averaging period.
Nevertheless we maintain our position that the AER’s Guideline approach
should be applied to the current market evidence. This currently generates an
MRP of 7.0%.
See chapter 7 for a more detailed response.
Gamma 0.25 0.4 0.4
Rationale We have accepted the AER’s draft decision.
TransGrid notes that a reliable and robust estimate for the utilisation approach
of 0.34 can be calculated using the ATO Tax statistics method without reliance
on assumptions or adjustments.
See section 9.1.7.
Forecast Inflation AER Method AER Method Accept
Rationale AER intends to apply the outcome of the current inflation review to the forecast
inflation in their final decision. TransGrid has accepted this position.
Debt Raising
Costs
$40m $17m Accept AER’s
Approach
Rationale TransGrid has accepted the AER’s approach.
Pricing
Methodology
Method only Accepted Accept
Rationale TransGrid proposal accepted
Negotiating
Framework
Method only Accepted Accept
Rationale TransGrid proposal accepted
Pass Through
Events
Defined Events Accepted Accept
Rationale TransGrid proposal accepted. We have also noted that two recent Rule
changes should apply to TransGrid in the next regulatory period.

INTRODUCTION AND CONTEXT | 2018/19-2022/23 2
Page 14 of 158
($June 2018) Revenue Proposal Draft Decision Revised Proposal
Shared Assets Below threshold Accepted Accept
TransGrid proposal accepted
Contingent
Projects
5 Projects Accepted with
modifications to
triggers
Accept
Rationale AER modifications to contingent project triggers materially accepted and
clarified. TransGrid also submitted three new contingent projects in August to
support policy development arising from the Finkel Review and the Federal
Government’s announcement of the Snowy 2.0 scheme. These additional
projects, plus one further project, are included in our revised proposal.
2.3 Changes in the sector since January 2017
Since TransGrid lodged its revenue proposal in January 2017 the policy and regulatory landscape that
we operate in has changed significantly and remains volatile. The operating environment has also
altered with peak demand reverting to, or exceeding, historic highs with the potential that the system
overall is unable to meet demand.
Significant uncertainty remains in a range of areas, so we have tailored our modifications in the revised
proposal to ensure costs will only be borne by consumers when the costs (if any) are certain and are
proven to be the most cost-effective solution. No additional revenue has been directly included in this
revised proposal to address these concerns.
The following sections detail the changes and the implications for this revised proposal and the next
regulatory period.
2.3.1 Investment environment
The past year has seen a substantial decline in investment certainty across Australia’s electricity
industry. Our security holders and financiers have committed more than $10 billion to the business and
stand ready to invest further substantial sums. This level of investment has been repeated all over the
country by a range of Australian and international investors in electricity and other infrastructure sectors
that underpin the provision of essential services to the Australian economy and support the prosperity
families and businesses expect of a modern society.
Our investors must of course earn a reasonable return on their investment, as their investors in turn -
superannuation funds and private investors - expect a commercial, risk-adjusted return on their
investment. We are concerned that the decisions being made in recent months undermine the risk-
adjusted agreement investors entered into. Examples of these challenges are the:
AER’s decision to move away from its own guideline to determine an appropriate cost of equity
Federal Government’s decision to overturn a fundamental component of the regulatory framework
by removing the check and balance to the AER’s decision making powers through the removal of
limited merits review
AER’s decision that gamma should be measured on a utilisation basis that results in a larger
reduction in revenue to businesses and accordingly investors earning less than the rate of return
the AER determines is appropriate

TRANSGRID REVISED REVENUE PROPOSAL | 2018/19-2022/23 2
Page 15 of 158
AER’s draft decision to retrospectively adjust how the EBSS penalties should be applied
Increasing regulatory obligations on businesses that are expected to be undertaken without
funding; for example the:
AER’s draft decision to not fund the new RIT-T requirements for replacement capital
expenditure. TransGrid expects to run more than 50 individual RIT-Ts over the next
regulatory period, with each RIT-T taking up to a year to complete – such processes come
at a material cost that the AER has determined investors will fund without compensation
AER’s draft decision that NSCAS services, a new regulatory obligation since TransGrid’s
last revenue decision, should be provided to customers without charge; the assets to
provide this service are valued at $26 million but investors are not to be compensated for
this necessary investment
AEMC’s decision to place new regulatory obligations on transmission networks to provide services
such as system strength and inertia at cost, that is, the business carries all risk on delivery and
makes no return on this service
The exponential increase in cyber-attacks. Federal Government agencies including the Critical
Infrastructure Centre (CIC) and the Computer Emergency Response Team (CERT) have
expressed concerns particularly in relation to protecting critical infrastructure. In this regard,
TransGrid has worked with the Federal Government agencies to agree a program of system
improvements to provide for a more secure environment. These programs of work are set out in the
Transition Plan which will form part of the Licence Conditions (see section 5.7.2).
2.3.2 Operating environment changes
Maximum Demand
On 10 February 2017 NSW experienced a very high peak demand day. Mandatory load shedding was
implemented and calls were made across the State to reduce load. It is understood there was
significant, but unmeasurable, voluntary curtailment as well.
This event triggered a substantial level of analysis to understand what had occurred and why. Whilst
the problem was predominantly related to generation supply, the event placed strain on the network as
generation was sourced from all locations to meet demand.
The likelihood of this event reoccurring remains real and perhaps inevitable by 2022 when Liddell
Power Station retires, without substantial new investment in generation or inter-connectors into the
State to relieve the supply shortfall. All levels of government are now mobilised and considering the
most effective response both here in NSW and in other states.
TransGrid has reviewed what it can do to efficiently and effectively support this effort. The most
immediate priority is to ensure arrangements are in place to support new pathways from new
generation centres to load as future generation investments occur. We have proposed four new
contingent projects, which will only proceed if generation investment occurs and the network connection
supports benefits to consumers.
TransGrid has also made a modification to the triggers for existing contingent projects to allow them to
be assessed and proceed on the basis of reliability requirements, should they in fact be required.
AEMO has issued two updates to its maximum demand forecasts since TransGrid lodged its revenue
proposal. Each of these revised the outlook for maximum demand upwards over the coming years.

INTRODUCTION AND CONTEXT | 2018/19-2022/23 2
Page 16 of 158
TRANSGRID REVISED REVENUE PROPOSAL | 2018/19-2022/23 2
Page 17 of 158
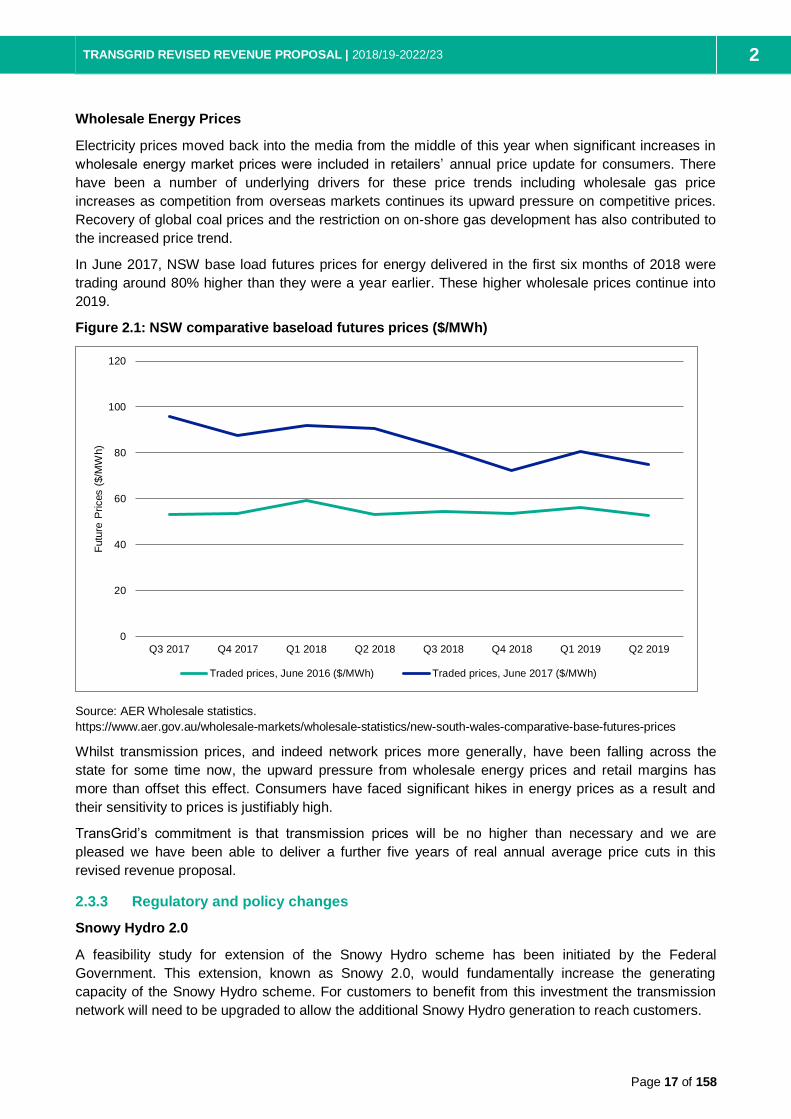
Wholesale Energy Prices
Electricity prices moved back into the media from the middle of this year when significant increases in
wholesale energy market prices were included in retailers’ annual price update for consumers. There
have been a number of underlying drivers for these price trends including wholesale gas price
increases as competition from overseas markets continues its upward pressure on competitive prices.
Recovery of global coal prices and the restriction on on-shore gas development has also contributed to
the increased price trend.
In June 2017, NSW base load futures prices for energy delivered in the first six months of 2018 were
trading around 80% higher than they were a year earlier. These higher wholesale prices continue into
2019.
Figure 2.1: NSW comparative baseload futures prices ($/MWh)
Source: AER Wholesale statistics.
https://www.aer.gov.au/wholesale-markets/wholesale-statistics/new-south-wales-comparative-base-futures-prices
Whilst transmission prices, and indeed network prices more generally, have been falling across the
state for some time now, the upward pressure from wholesale energy prices and retail margins has
more than offset this effect. Consumers have faced significant hikes in energy prices as a result and
their sensitivity to prices is justifiably high.
TransGrid’s commitment is that transmission prices will be no higher than necessary and we are
pleased we have been able to deliver a further five years of real annual average price cuts in this
revised revenue proposal.
2.3.3 Regulatory and policy changes
Snowy Hydro 2.0
A feasibility study for extension of the Snowy Hydro scheme has been initiated by the Federal
Government. This extension, known as Snowy 2.0, would fundamentally increase the generating
capacity of the Snowy Hydro scheme. For customers to benefit from this investment the transmission
network will need to be upgraded to allow the additional Snowy Hydro generation to reach customers.
0
20
40
60
80
100
120
Q3 2017 Q4 2017 Q1 2018 Q2 2018 Q3 2018 Q4 2018 Q1 2019 Q2 2019
Futu
re P
rices (
$/M
Wh)
Traded prices, June 2016 ($/MWh) Traded prices, June 2017 ($/MWh)

INTRODUCTION AND CONTEXT | 2018/19-2022/23 2
Page 18 of 158
Whilst the final outcome of this feasibility study is not yet known TransGrid has proposed a contingent
project, which would only be triggered if the Snowy scheme goes ahead. This ensures that TransGrid is
able to respond if the Federal Government proposal proceeds whilst ensuring customers face no costs
for this investment unless it is required.
System Strength and Inertia
The AEMC’s System Security Market Frameworks Review Final Report led to Rule changes which
place significant new responsibilities on transmission networks to procure solutions for the network to
manage system security. New needs are emerging in the network as the generation mix shifts from
traditional fossil fuel generators to renewable generators with different properties and impacts on the
stability of electricity networks.
The Rules have been established to allow material costs to be passed through to customers should
they occur and TransGrid’s pass through events component of the revised proposal has been modified
to reflect these new Rules. TransGrid is also allowed to include forecast costs in the revised proposal
for system strength, however at this time TransGrid does not expect to incur material costs related to
these obligations over the next five years and has not made any adjustments to revenue requirements
as a result of these Rule changes.
Finkel Review
COAG has adopted the majority of recommendations of the Independent Review into the Future of the
National Electricity Market, led by Professor Finkel, including an integrated grid plan. Whilst the precise
outcomes of this grid plan and many of the other recommendations such as the creation of renewable
energy zones are uncertain in terms of timing, location and precise form, it can be assumed that
change is coming to the sector.
To prepare for these uncertain changes in the most responsible manner, we have proposed three new
contingent projects in the most likely vicinity of future renewable energy zones. This approach again
positions TransGrid to respond to emerging needs in the industry without cost to consumers until costs
and needs are certain and fully justified.
2.4 Consumer consultation
TransGrid has met with both our Revenue Proposal Working Group and our TransGrid Advisory
Council to discuss the AER’s draft decision and hear their thoughts on how we should respond. We
were very pleased to see a high level of alignment between different customer representatives and our
own views on the draft decision.
The AER’s decision to reject Powering Sydney’s Future was the foremost concern for customers with
reliable supply into the CBD a priority for many customer representatives. Some business customers
questioned the reasonableness of expecting major business customers to habitually provide the buffer
for the system at times of peak load through targeted load shedding. Whilst they accepted it as an
emergency measure, they expressed that it should not be considered a business as usual option.
Customer representatives thought it essential that we conveyed to the AER the risk being placed on
NSW of this decision and that we should find a way to reach agreement on this project.
Overall, TransGrid saw good alignment. Further detail on the views of consumers, how we have worked
with them and taken their views into account is set out in chapter 3 of this revised proposal.
2.5 Maximum Allowed Revenue building blocks
The following Table 2.1, sets out the revenue building blocks for TransGrid for the next regulatory
period.

TRANSGRID REVISED REVENUE PROPOSAL | 2018/19-2022/23 2
Page 19 of 158
Table 2.1: Revised Unsmoothed Revenue Requirement ($m nominal)
2018/19 2019/20 2020/21 2021/22 2022/23 Total
Return on Capital 413.6 426.4 441.6 456.5 472.9 2,211.1
Return of Capital 99.9 118.4 132.4 136.4 148.0 635.1
Operating Expenditure 180.3 188.2 198.4 210.3 206.7 983.9
Revenue Adjustments 20.4 20.9 7.7 15.1 7.6 71.7
Net Tax Allowance 30.3 32.4 34.0 36.2 38.1 171.1
Annual Building Block Revenue
Requirement (Unsmoothed)
744.4 786.3 814.2 854.6 873.4 4,072.9
2.6 Price path
The average price path over the 2018/19 to 2022/23 period is shown in Figure 2.2. This figure shows
that TransGrid is still expecting to deliver real annual average price reductions in the next regulatory
period compared to both the current period and the prior regulatory period.
We note the reduction in the next period has increased from a 2.5% price reduction to a 3.9% price
reduction. Whilst the maximum allowed revenue in this proposal is 5% lower than our January revenue
proposal, the price impact is moderated by the drop off in AEMO’s most recent energy forecast which is
on average 3% lower than the prior year’s forecast. This drop in the energy forecast results in a smaller
price reduction than would previously be expected.
Figure 2.2: Average Price Path ($ June 18)

CONSUMER ENGAGEMENT | 2018/19-2022/23 3
Page 20 of 158
3. Consumer Engagement
3.1 Introduction
TransGrid regards proactive engagement with customers, stakeholders and energy consumers as an
essential component of our business. We work alongside a wide range of stakeholders including
directly connected customers, consumer representatives, government bodies, small businesses and
regulators, in the development of our business plans and priorities. In this way, we aim to ensure that
the views and positions of those at every stage of the energy supply chain are represented in and
contribute to the decisions we make. As a result of the ongoing engagement that has occurred since
our draft revenue proposal was submitted to the AER, TransGrid is pleased to provide further
information regarding our consumer engagement program as part of this revised proposal for the
2018/19 – 2022/23 regulatory period.
Figure 3.1: TransGrid’s engagement framework
TransGrid’s framework for engagement is centred on the recognition that different stakeholder groups
have differing levels of knowledge and interest in our business. In recognition of this, TransGrid tailors
our engagement program to include a variety of topics and channels. Central to our engagement
framework is the TransGrid Advisory Council (TAC). The TAC is the key stakeholder advisory body to
TransGrid, offering customer and consumer insights and engagement to improve the value of
TransGrid’s transmission services to NSW. The TAC forms a rich and consistent mode of engagement
and comprises executive level representatives from a cross-section of external stakeholders. Beyond

TRANSGRID REVISED REVENUE PROPOSAL | 2018/19-2022/23 3
Page 21 of 158
the TAC, TransGrid’s engagement is focused on working with stakeholders regarding areas of the
business that directly impact them, or in which they have an interest. Examples of this includes working
with customers and business representatives on transmission pricing methodologies, working with
impacted communities on easements and transmission plans, and engaging stakeholders in
consultation for our major projects.
Engagement on our revenue proposal took place through the TAC and the Revenue Proposal Working
Group (RPWG). The RPWG is a dedicated working group that was established by TransGrid to ensure
customers, large energy users, consumer representatives and interested parties have an opportunity to
understand and influence the approach to our revenue proposal. We engaged with the TAC and RPWG
members both through formal group meetings and on an individual basis.
Given the rapid changes that have occurred within the energy industry since January 2017, when
TransGrid submitted its revenue proposal, genuine open and collaborative engagement between
networks and consumers continues to be of critical importance. Working collaboratively with
stakeholders at all positions along the energy supply chain has been embedded within the organisation,
and is evidence of the current cultural shift within TransGrid. Our engagement focus reflects an
organisation that sees consumer engagement not as a means to an end, but as core operational value
that underlies all that we do. With the level of uncertainty that we are currently seeing in the energy
sector across Australia, TransGrid considers that genuine open and transparent consumer engagement
is critical to ensuring we are well placed as a network to serve NSW and to meet the challenges of the
future.
We are committed to working in collaboration with our stakeholders to deliver a revenue proposal that
reflects the views and feedback we have received from our stakeholders in our consultations, as well as
the valued feedback that we have received from the AER and the Consumer Challenge Panel (CCP). In
our revised revenue proposal, TransGrid has again submitted a proposal that would deliver lower costs
to consumers, and positions the business to continue to efficiently deliver safe and reliable energy to
NSW at the lowest cost in this constantly changing landscape.
Figure 3.2: TransGrid’s Consumer Engagement Journey
2015
Development of TransGrid's Consumer Engagement
Program and establishment of the TransGrid Advisory
Council (TAC)
2016
Consultation on TransGrid's Pricing Methodology and
revenue proposal with the TAC and Revenue Proposal
Working Group (RPWG)
2016
Research and reporting on TransGrid's Consumer Engagement Program
2017
TransGrid submits its revenue proposal for the 2018/19 - 2022/23 regulatory period
2017
TransGrid invites submissions from stakeholders on its
revenue proposal
2017
TransGrid continues with its Consumer Engagement
Program
2017
AER releases its draft determination on TransGrid's
revenue proposal
2017
TransGrid consulted with its TAC, RPWG, and key
stakeholders on the AER's decision and its revised
proposal
2018
TransGrid to continue with its Consumer Engagement
Program
CONSUMER ENGAGEMENT | 2018/19-2022/23 3
Page 22 of 158
3.2 Engagement since submission
In the time since TransGrid submitted its revenue proposal in January, we have continued to consult
with our TAC, the RPWG, consumer representative groups, industry representatives, government
bodies, impacted residents, and the general community on issues related to TransGrid’s operations and
our place in the changing National Electricity Market (NEM). TransGrid has worked closely with our
peak advisory body, the TAC, and our other advisory groups to ensure open access to information and
the opportunity to guide and influence our response to the many changes that the industry has faced
since the submission of our revenue proposal.
In 2017 TransGrid has consistently engaged with our TAC regarding positioning on the Finkel Report
and how TransGrid should respond, as well as on our strategy to support the development of large-
scale renewable zones in NSW, in line with the Finkel recommendations. We have also continued to
engage on the Powering Sydney’s Future project, see section 3.6 in this chapter.
TransGrid’s response to the Finkel Report
TransGrid consulted with the TAC to develop our position on the Finkel Report, and submitted
a consultation piece for consideration by the TAC on our proposed position and response to
Finkel
TransGrid found support from the TAC on our positioning and proposed response as a network
company, and has committed to further develop and consult on this position
TransGrid’s proposal to support the development of large-scale renewable zones in NSW
TransGrid presented its plans for the development of large-scale renewable zones in NSW to
the TAC for consultation in June, accepting feedback on the proposal and committing to further
research to answer questions put by the TAC
TransGrid heard that while there was support from the TAC regarding the plans and the
opportunity they presented to allow greater generation competition and renewables into the
grid, there were questions around the investment risk in the current regulatory space,
particularly the risk of stranding assets if the generation did not materialise or if technology
changed. The TAC was also interested in exploring new ways for these investments to be
costed beyond being placed in the RAB
TransGrid committed to working with the TAC to develop potential solutions that may make the
development of large-scale renewable zones in NSW cost effective, and on the cost and risk
structure that would underlie such investments.
3.2.1 TransGrid’s Revenue Proposal Working Group
In response to the AER’s draft decision and to support TransGrid in the development of its revised
revenue proposal, TransGrid met with the RPWG to consult with its consumer representatives and key
stakeholders. We held a full day meeting with members of the RPWG, observed by a member of the
CCP. RPWG members’ interests guided the consultation focusing on areas that the group felt were of
key importance. Key feedback from the RPWG is presented below.

TRANSGRID REVISED REVENUE PROPOSAL | 2018/19-2022/23 3
Page 23 of 158
Table 3.1: Key feedback from the RPWG
Feedback received Actions taken by TransGrid
RPWG wanted TransGrid to ensure that it
included a response to the Finkel Review in its
revised proposal
TransGrid has included a number of contingent
projects in its revised proposal designed to
support implementation of the Finkel Report
recommendations
RPWG expressed the need for solutions other
than load shedding as a means of demand
response to meeting growing demand in Sydney,
and supported a targeted approach to network
augmentation
TransGrid is proposing a site-specific network
augmentation program to ensure efficient
investment in the areas of the network most at
risk, including procurement of demand response
followed by a network solution as the most cost
effective approach that is in the long terms
interests of consumers
RPWG was supportive of the emphasis TransGrid
placed on asset management to ensure the
longest life possible from its assets
TransGrid will maintain the asset management
system as defined in the revenue proposal and
continue to look for further efficiencies in its assets
as part of its rigorous asset planning and
maintenance regime. TransGrid recently became
the first Australian organisation to receive the
Jacobs Asset Management Recognition Medal,
aligning the quality of our asset management
strategies with organisations like NASA and the
US Military
RPWG wanted to see TransGrid build more
analysis and impact of the social costs of projects
into its projections to ensure that proposals took
account of the broader impacts of various
proposed project options and timeframes
TransGrid will continue to include assessment of
social costs, benefits and opportunity costs into
the planning and design of its projects, which
includes consultation with affected residents and
communities on “least impact” options. For
example, the extensive engagement associated
with the Powering Sydney’s Future project
assessed 31 potential cable routes before a
preferred option was identified
RPWG wanted to understand why the AER had
not used AEMO’s latest 2017 forecasts in its draft
determination on the Powering Sydney’s Future
project
TransGrid is working with Ausgrid, AEMO and the
AER regarding the appropriate load forecasts for
assessing the timing and justification for the
Powering Sydney’s Future project. A forecasting
workshop, facilitated by the NSW Government,
was held in November 2017 to specifically address
load forecasts

CONSUMER ENGAGEMENT | 2018/19-2022/23 3
Page 24 of 158
Feedback received Actions taken by TransGrid
RPWG questioned on what basis the AER
rejected the need for Powering Sydney’s Future,
and put to TransGrid that the AER must come up
with alternative triggers and project timings if it
does not accept the project as proposed by
TransGrid
TransGrid is committed to working with the AER to
better understand the AER’s position on the
project and the reasons it does not support the
project as proposed in the current regulatory
period. In late September TransGrid held a
roundtable with the AER and CCP, and a
workshop in November 2017 with the AER,
AEMO, NSW Government and Energy Consumers
Australia, to discuss load forecasts. In addition,
TransGrid and the AER have had issue-specific
meetings on Powering Sydney’s Future since the
draft decision was published
RPWG commented that the AER’s decision on
Powering Sydney’s Future showed a different
appetite for risk than TransGrid. RPWG stated
that AER should declare the level of risk it feels is
reasonable for a project such as Powering
Sydney’s Future, to provide clarity over the
decision making process
TransGrid raised this concern of the RPWG with
the AER at the November workshop, and again in
our revised proposal
RPWG requested that the CCP challenge the
AER on its decision to not support Powering
Sydney’s Future in its draft decision, including the
need for greater justification by the AER of why
the project proposal was not supported
The CCP has attended RPWG meetings, as well
as TAC meetings and other engagement activities
related to Powering Sydney’s Future, and will offer
its views on the project in its next public
submission
RPWG stated that if forecasts such as those by
AEMO are not deemed suitable by the AER for
base projections for projects such as Powering
Sydney’s Future, then AEMO should be able to
work with networks on site specific projections
that accurately reflect demand within the project
area
TransGrid, Ausgrid and AEMO have been working
collaboratively in understanding differences in the
base forecasts and relevant factors for a forecast
suitable to assess the justification and timing of
Powering Sydney’s Future
RPWG questioned what the AER meant by a “Top
Down Challenge” regarding TransGrid’s proposed
capital expenditure costs, and requested
clarification as to what this would look like
TransGrid notes that previously it had been
understood to be the AER’s Repex model, a
version of which was relied on for assessing much
of Powerlink’s capital expenditure requirements.
TransGrid used a version of this model as a top
down check but this has been disregarded by the
AER. TransGrid also notes the higher discount
rate TransGrid has used in its risk model provides
a strong constraint bias to the forecasts, in effect a
top down constraint on the size of the capital
program

TRANSGRID REVISED REVENUE PROPOSAL | 2018/19-2022/23 3
Page 25 of 158
Feedback received Actions taken by TransGrid
RPWG felt that the AER’s draft decision on
TransGrid’s NSCAS proposal was not in the long-
term best interest of consumers, and would lead
to higher costs for consumers. RPWG commented
that it was unreasonable to expect the service to
be provided for free
TransGrid agrees with the RPWG that expecting
TNSPs to provide prescribed services for free is
unsustainable and unreasonable
RPWG wanted to understand the differences
between TransGrid’s and the AER’s approach to
WACC. There was uncertainty as to whether the
AER had been consistent with its own guidelines
TransGrid discussed the differences in approach
and explained the rationale for our position
In this revised proposal we have accepted the
AER’s decision, if not the rationale, recognising
that for consumers a lower WACC is a good
outcome for prices.
3.3 Key issues raised by the AER in its draft determination
TransGrid thanks the AER and the CCP for their affirmation and feedback on our consumer
engagement program. We are encouraged by the positive comments on our program as one that is
sustainable, supported from an executive level, and allows for clear and open provision of information,
including how stakeholders have influenced our decisions and positions. We are committed to
furthering our engagement program and continually looking to improve our processes.
We thank the AER, CCP, and stakeholders for their feedback on where we can continue to improve our
consumer engagement program. To ensure that we appropriately respond to the points raised by both
the AER and the CCP, we will deal with both as separate entities and have separated the feedback into
two distinct sections. Areas of feedback that were raised by both the AER and the CCP have been
discussed under the response to the AER’s feedback.
3.3.1 Industry models of engagement
TransGrid is committed to ensuring that its consumer engagement program is best practice, and notes
the regulated businesses the AER has identified in its draft decision may be examples that TransGrid
can learn from. In examining the processes that these businesses have undertaken to engage with
their stakeholders, notwithstanding the difference between their business models and ours, we have
identified some key areas within their engagement programs that we will investigate regarding their
applicability to be incorporated into our consumer engagement practices.
TransGrid notes the use by one organisation of a draft regulatory submission presented for
consultation to stakeholders prior to the submission of its proposal in 2017. This provided a strong
foundation for its early engagement on the submission itself and allowing its stakeholders to
provide feedback on the proposed submission prior to lodgement with the AER. Within this
regulatory period, TransGrid held workshops with the AER and our TAC to on our approach to
developing our regulatory proposal.
One of the outcomes of the process was the creation of the Regulatory Proposal Working Group as
a dedicated forum for stakeholders and consumers to input into TransGrid’s Regulatory Proposal.
Through the RPWG TransGrid raised:
Its new approach to capital expenditure forecasting

CONSUMER ENGAGEMENT | 2018/19-2022/23 3
Page 26 of 158
Our proposed approach to operating expenditure forecasting (which was further modified and
updated based on comments and feedback received)
Our proposed approach to WACC, gamma and pricing
TransGrid also published a consultation document on our Pricing Methodology for stakeholder
submissions and input. However, we appreciate that these steps can always be further improved.
We note the robust engagement framework demonstrated in another organisation’s approach to its
consumer engagement program, including a research phase from which key insights and results
were implemented in the form of workshops and demonstrably adjusted engagement and business
practises.
TransGrid sees the value in this form of consumer engagement evaluation and the implementation
of research findings and has undertaken a similar process in the development of its consumer
engagement program. We will continue to develop our research practices on our consumer
engagement program to ensure that it is best practice and is informed by implementing the
feedback of our stakeholders.
3.3.2 TransGrid’s engagement model
The AER has made a number of comments regarding TransGrid’s model of engagement and the depth
to which the process impacts TransGrid’s operations, providing some constructive ways in which
TransGrid could improve on its current engagement model to ensure a greater penetration of consumer
feedback. We are continuously looking to improve the way that we can engage with consumers and
appreciate the suggestions that the AER has made.
The AER has proposed that TransGrid should consider ways that it can more consistently move from
informing its stakeholders and sharing information with them, to directly consulting with them and
ensuring that they are involved in the decision making process. We have accepted this advice and
taken steps to better evaluate where on the spectrum our engagement sits based on feedback from
participants. This will help us make targeted and appropriate improvements.
TransGrid included in its revenue proposal key items that were directly influenced by the feedback from
our consumer engagements. For example, based on feedback received, we have modified our capital
expenditure forecasting method with a more rigorous risk model based assessment of network risks
and the costs to mitigate risks. TransGrid made changes to two of the three operating expenditure
escalation factors as a direct result of input and feedback from consumer forums. Further to this, based
on feedback from the RPWG, we revised our pricing methodology to ensure that the information was
accessible to consumers and easily understood. TransGrid also made various changes to the
presentation and depth of information provided throughout the proposal and supporting information.
Taking on the AER’s feedback, TransGrid engaged with the TAC at its final meeting of 2017 to seek
feedback on where our current level of engagement sits on the IAP2 engagement spectrum. TAC
members praised the effort TransGrid had demonstrated to improve its consumer engagement program
compared to other network businesses the members had exposure to, and identified that TransGrid’s
level of engagement tended to occur at the “consult” and “involve” levels of the IAP2 spectrum. Several
TAC members highlighted that in their view some specific areas of engagement, particularly within the
Powering Sydney’s Future program, fell into the “collaborate” category.
The TAC provided feedback to TransGrid that we should look to identify areas where our engagement
can move towards the “empower” category with stakeholders, rather than stop at “collaborate” as the
AER suggests. Establishing consumer views on the setting of the Value of Customer Reliability (VCR)
was provided as one example where TransGrid could do this. TransGrid is able to announce that this

TRANSGRID REVISED REVENUE PROPOSAL | 2018/19-2022/23 3
Page 27 of 158
feedback has already been put into action with our revised Powering Sydney’s Future project,
submitted within this revised revenue proposal.
3.3.3 Inviting challenge to assumptions of modelling
The AER suggested that TransGrid could go to greater lengths to ensure that the assumptions that
underlie the forecasts it provides to consumers are more open to critique. The value and necessity of
critiquing assumptions of forecasts is something that we understand to be of great importance.
TransGrid has worked to ensure that forecasts it puts forward are not only open to critique from
stakeholders and the public, but are also supported by independent analysis from third parties.
In the development of our revenue proposal, we held full day workshops with both our RPWG and TAC
on the development of our operating expenditure and capital expenditure submission. The focus of
these was to ensure that the assumptions that underlie the submissions were open to both challenge
and explanation. As mentioned earlier, this process led to modifications being implemented for our
operating expenditure forecast, based on consumer feedback, and a lower amount of revenue asked
for in the proposal.
Particularly highlighted by both the AER and the CCP as needing a greater level of critique, were the
assumptions that underlie the Powering Sydney’s Future project. TransGrid has completed two stages
of the Regulatory Investment Test for Transmission (RIT-T) as required by the AER. The purpose of the
RIT-T is to identify the transmission investment option which maximises net economic benefits and,
where applicable, meets the relevant jurisdictional or Electricity Rule based reliability standards. As part
of the RIT-T process, TransGrid released the Stage 1 – Project Specification Consultation Report
(PSCR) and Stage 2 – Project Assessment Draft Report (PADR). The final stage is the Project
Assessment Conclusions Report (PACR), which has been released in December 2017. TransGrid
sought input from a wide range of stakeholders as part of the project planning process and to feed into
each of the reports.
TransGrid undertook a separate comprehensive engagement program around the project, which
included a public forum on the drivers of the project and the assumptions underlying the forecasts. The
assumptions that underlie the forecasts and the project were also made public and consumers and
stakeholders were invited to provide submissions regarding the project. As well as the separate project-
specific engagement program, both the RPWG and TAC were briefed and consulted on the project,
including opportunities to provide input and feedback on the assumptions used and TransGrid’s
proposed approach to the project.
The outcome of these engagements was that TransGrid pursued the involvement of non-network
alternatives to try and defer expenditure on the project, based on consumer feedback. TransGrid,
however, also understands that there is always work to be done to ensure that the assumptions that
underpin the forecasts it uses for its projects are regularly reviewed and updated, and are open for
critique. As outlined in section 3.2.1 above, TransGrid has engaged with its RPWG on the forecasts
used for the Powering Sydney’s Future project, submitted as a key capital expenditure project within
this proposal, and highlighted by both the AER and the CCP as a project for which the underlying
assumptions were not critiqued appropriately.
3.4 Key issues raised by the CCP
In approaching the feedback provided to TransGrid by the CCP, we would like to recognise and thank
the CCP for its characterisation of our engagement as “transparent and open”, and for the
communication from that positive feedback received by them from TransGrid’s stakeholders regarding
its engagement. We would also like to thank the CCP for its constructive feedback to TransGrid

CONSUMER ENGAGEMENT | 2018/19-2022/23 3
Page 28 of 158
regarding how to continue to improve our engagement approach. We have summarised key elements
of feedback provided by the CCP and our responses below.
3.4.1 Level of information provided to stakeholders
The CCP provided feedback that there was an inconsistency of reception from stakeholders as to the
level of information provided in consultation sessions, with some stakeholders finding the level of
information clear and sufficient, while others found it too in-depth and hard to follow. This feedback
highlights the difficulties in effective engagement with a range of stakeholders who have varying levels
of background knowledge and differing perspectives. TransGrid agrees with the CCP on the need to
ensure that the information being presented is accessible and finds the right balance on the level of
detail.
To ensure that the information being presented to the TAC and RPWG is appropriate, TransGrid uses
evaluation forms to collect feedback on each meeting and the level of information provided. For the
engagement meetings for 2017, the level of information provided by TransGrid to the TAC and RPWG
has been rated at an average of 8.15/10. We recognise that this is always an area that needs to be
refined based on feedback and will continue to work with stakeholders to ensure that they receive the
information they require and the level of depth that they would like.
Through our current evaluation processes, TransGrid has not received the same feedback provided by
the CCP that the level of information provided by TransGrid may not be appropriate. As such, we
appreciate the separate feedback provided by the CCP. Due to this disconnect in feedback received,
we will look to further improve and enhance the evaluation processes and systems we utilise for each
engagement meeting, in consultation with our stakeholders and consumers.
The CCP encouraged us to move from “inform” to “involve” and “collaborate”, as set out in the IAP2
spectrum. Encouraged by this, we sought guidance from our advisory council as to where they
assessed we currently sit and what we should be targeting. Our TAC members confirmed that not only
are we improving in our consultation but they already felt we were mostly at “involve” and some areas
should be considered at the “collaboration” level using the IAP2 spectrum as their guide. Customers
have also set our target high; they would like to see us aiming for our engagement at “empower” level
wherever possible. TransGrid has accepted this challenge and will work to move further along this path.
3.4.2 Framework for the measurement and ongoing improvement of consumer
engagement
Measurement of the effectiveness of a consumer engagement program is paramount to its success in
genuinely including consumers in the decision making process. We are constantly engaging our
consumers and stakeholders both formally and informally, and as part of that engagement we are
looking for ways to improve our process. Feedback is taken after engagement sessions and used to
inform subsequent engagements. Further to this, we complete an annual reputation survey which
includes its consumers and stakeholders to collect feedback on our performance as an organisation
and to identify areas for improvement.
TransGrid recognises that continuing to develop the evaluation framework for its engagement program
is an area where further development is required, and accepts the CCP recommendation. Developing a
more formal and transparent framework to measure levels and effectiveness of engagement, including
set engagement markers/times for framework evaluation and feedback, will provide us with greater
insights into how to further embed the consumer voice within the decisions that it makes. We look
forward to following up the CCP’s recommendation and investigating ways to further formalise and
improve our consumer engagement framework.

TRANSGRID REVISED REVENUE PROPOSAL | 2018/19-2022/23 3
Page 29 of 158
We are currently undertaking our 2017 annual reputation survey. This independent survey is structured
to ask consistent questions to identify and track changes over time. TransGrid finds this a valuable and
robust method to source honest and direct feedback on our performance across the business’
operations and activities.
3.4.3 More proactive response to the changing energy market
The CCP has suggested TransGrid could take a more active role in responding to the changing energy
market. Since the submission of our revenue proposal in January 2017, the energy industry has
undergone a series of distinct changes that have called for leadership and progressive thinking from the
industry. We see our role as a transmission network as positioning the organisation to be a leader
within the industry, and have proactively worked with our stakeholders to respond to the risks and
opportunities present in the future network. We have particularly taken a proactive role working with the
TAC on how to respond to the Finkel Report, and particularly the role it can play in the development of
large scale renewable energy zones as advocated by Finkel.
We have engaged with the TAC consistently since the Finkel recommendations were released, as well
as consulting with industry and consumer stakeholders within varying contexts to collect feedback on
our proposals. In answer to questions from the TAC, we have undertaken research into the potential
locations for the proposed renewable zones and are currently engaged in discussions on the most
appropriate way that such developments could be undertaken to ensure that the benefit and risk is
equitably shared and to ensure that any decisions are in the best interests of consumers.
TAC members have challenged TransGrid on the role that non-network options could play in alleviating
constraints on the network and responding to the changing energy landscape. In response to this, we
are continuing to investigate how non-network options such as demand response and batteries can be
used alongside network options to manage emerging network constraints.
3.4.4 Greater efficiency in the capital and operational expenditure
The CCP has expressed that it would like to see greater operating and capital expenditure efficiency
demonstrated within TransGrid’s revenue proposal, based on feedback that it has received from
stakeholders. TransGrid has worked extensively with stakeholders on the capital and operating
expenditure that it is proposing, including holding full day meetings with the TAC and RPWG to go
through the proposed capital and operating expenditure forecasts, which led to a revised approach to
the operating expenditure forecast. Ensuring that stakeholders are involved in the discussions to a level
of their satisfaction is always something that must continually be evaluated and we appreciate the CCP
feedback. With this feedback in mind, we have met with both the RPWG and TAC to consult with them
on how we should respond to the AER and what should be included in its revised revenue proposal.
TransGrid recognises consumers need to have confidence in the efficiency of the business’ operating
and capital expenditures. In the lead up to the revenue proposal, TransGrid participated in various
independent benchmarking studies that assessed the relative efficiencies of the business. These
studies were submitted as part of the revenue proposal. TransGrid also notes the AER undertakes its
own benchmarking studies and publishes these results.
3.4.5 Enhanced engagement around RIT-T
The CCP has noted that TransGrid has met and in some places exceed the AER guidelines for
engagement on RIT-T projects, and we are thankful for the recognition of our efforts to engage the
public around these projects. We do of course recognise that there are improvements that can be made
regarding including consumer feedback at a greater depth in decisions and ensuring that consumers
are engaged in the decision making process. TransGrid will continue to examine its engagement

CONSUMER ENGAGEMENT | 2018/19-2022/23 3
Page 30 of 158
framework surrounding RIT-T investment to ensure that best practice engagement is embedded into
the process frameworks.
3.4.6 Limitations of the underlying assumptions of Powering Sydney’s Future
Further detailed discussion of the Powering Sydney’s Future project can be found in chapter 4.
3.5 Powering Sydney’s Future
TransGrid appreciates the feedback received from both the AER and CCP that TransGrid has gone
further than most to engage consumers and the industry in RIT-T consultation. We strive to ensure that
consumers are engaged in consultation at all levels and stages of the development of our capital works.
Both the AER and the CCP have expressed concerns, however, that the critical assumptions that
underlie the project, including Ausgrid’s peak demand forecasts, have not been appropriately tested
and challenged by consumers. Further to this, concerns were raised regarding TransGrid’s assessment
of non-network and demand management options that could defer investment in the project. We
welcome the opportunity to provide more information to the AER and the CCP on the consumer
engagement that occurred specifically regarding the Powering Sydney’s Future project, and to address
the specific concerns that have been highlighted.
3.5.1 Consumer engagement on Powering Sydney’s Future assumptions
The assumptions that underlie the need for the Powering Sydney’s Future project have been presented
publicly on numerous occasions in the development of TransGrid’s revenue proposal. This has included
holding public forums and inviting submissions on the project as part of the RIT-T process. Further
engagement with consumers and stakeholders, including discussion on the assumption on the demand
forecasts, has occurred as part of our consultation with the RPWG, TAC, and in one to one stakeholder
consultations in the lead up to TransGrid’s revenue submission, and continuing beyond it. TransGrid is
confident in the assumptions that underlie the need for this project and has engaged with its
stakeholders extensively on these. We have engaged with both the RPWG and the TAC in the wake of
the AER’s draft decision to examine the project needs and assumptions that underlie it, to ensure that
consumers are comfortable with the approach that we had undertaken.
Meeting with the RPWG in October 2017, we again went through the assumptions and forecasts that
underlie the need for the Powering Sydney’s Future project, including AEMO’s 2017 NSW and Sydney
forecasts, encouraging questions and critiques. The RPWG commented that although there are issues
with the specificity of AEMO’s 2017 forecast, and Ausgrid’s peak demand forecasts, neither of these
are grounds to assume that the demand is not there, noting that the area of Inner Sydney cannot be
adequately reflected in broader geospatial forecasts based off an average demand. The RPWG
questioned the AER’s use of 2016 forecasts in its decision, despite the availability of more updated
forecasts released by AEMO, and noted that the lack of granularity in the larger geospatial forecasts is
reflective of a need for more detailed forecasts for areas such as the Inner Sydney region, that should
be created in consultation with the local operators to ensure out of trend developments are reflected.
The RPWG was broadly supportive with the approach that TransGrid had taken regarding the forecasts
and assumptions for Powering Sydney’s Future. Further to this, the RPWG members specifically
requested the CCP challenge the AER on the lack of detail and feedback in its decision to not approve
Powering Sydney’s Future in its draft determination, and to provide a better explanation of the exact
basis on which it was decided the project would not be needed in this next regulatory period. RPWG
members expressed that if the AER felt there were necessary grounds to reject the project as
proposed, then the AER should be able to provide a set of triggers for the project as well as an
expected timeframe wherein the project would be needed. TransGrid has committed to the RPWG to

TRANSGRID REVISED REVENUE PROPOSAL | 2018/19-2022/23 3
Page 31 of 158
continue working with the AER to ensure that there is an understanding and agreement for the
assumptions that underlie the project.
Further to meeting with the RPWG to discuss the Powering Sydney’s future project, TransGrid met with
the TAC in November to discuss the AER’s draft determination and to seek feedback on how we should
position our revised proposal. We communicated the sentiments of the RPWG to the TAC, and again
consulted on key assumptions underlying the need for the project. TAC supported the underlying
assumptions on which the project need is based, recognising that although there is uncertainty involved
in predicting future demand, there was a need for a solution to ensure the security of supply to the city.
Further to this, the TAC members provided feedback to the CCP that they were concerned about the
lack of guidance provided by the AER with its rejection of the project, advocating that clarity around the
methodology behind the AER’s decision was essential for TransGrid to be able to deliver a solution that
was acceptable to the AER.
3.5.2 Consideration of the risks involved in Powering Sydney’s Future
The AER and the CCP have highlighted that greater consideration is needed of the risk involved with
using demand forecasts for Powering Sydney’s Future, and more broadly the impact of a premature
triggering of capital investment for the project. TransGrid indeed recognises that there is a risk inherent
in projects such as Powering Sydney’s Future and that it is important that projects are triggered at the
optimal time to ensure consumers are paying no more than necessary, no sooner than necessary.
Regarding Powering Sydney’s Future, there is also the parallel risk in the delaying of investment and
the increased risk to security of supply. Both of these risks are of importance and should be balanced.
TransGrid’s risk model is specifically developed to make such an assessment with a robust and reliable
framework.
TransGrid, in discussions with its RPWG and TAC, detailed the drivers behind the need for the project
to be included in this regulatory period, such as the increasing demand forecasts (including spot loads
not identified by AEMO) and increasing risk of cable failure over time. Feedback from customers to
TransGrid highlighted that there was a different appetite for risk regarding the security of supply to the
Sydney CBD between TransGrid and the AER’s approach to the Powering Sydney’s Future project,
with consumers viewing the AER’s appetite for allowing risk for the CBD being significantly higher than
TransGrid’s. Consumers provided feedback that due to the obvious differing appetites for risk; the onus
should be on the AER to define clearly the level of risk it feels is appropriate to take regarding the
security of supply to the Sydney CBD. In particular, the level of risk should be taken into account in its
decision to reject the project in the upcoming regulatory period, having regard to the licence conditions
and reliability standards TransGrid is required to comply with. Consumers did not think it was
appropriate for the project to be denied without clear definitions from the AER as to what circumstances
would be required before the project would be considered, and without a clear articulation of the risk
that was acceptable to take with the security of supply to Sydney’s CBD.
3.5.3 Pursuit of non-network options
TransGrid has undertaken a comprehensive approach to procuring non-network solutions to defer
investment on the Powering Sydney’s Future project. TransGrid held public information forums for non-
network providers and has gone to market for expressions of interest from non-network providers.
Engaging with the TAC at its meeting in August 2017, we presented our progress to date for the
procurement of non-network options for Powering Sydney’s Future. The TAC was satisfied with the
approach that we had taken in sourcing non-network options with one TAC member stating that “you
[TransGrid] have gone through a very rigorous process, and should be commended for that”.

CONSUMER ENGAGEMENT | 2018/19-2022/23 3
Page 32 of 158
In the examination of the role that demand response could play in meeting the needs of the Sydney
CBD and deferring the project, we engaged with the RPWG on how this would best be achieved, and
included this as a consistent area of engagement with the TAC. There was support among the RPWG
and the TAC for the role of demand response in future solutions to ensuring the security of supply to the
Sydney CBD, however some customers expressed that demand response was only a last resort for
their operations and that this should not be thought of as a regular or even permanent part of the
solution for meeting growing demands within Sydney. Customers agreed that non-network options were
important; however there was consensus that these could not replace a permanent solution to securing
the supply to Sydney in the long term.
3.5.4 TransGrid’s revised solution
Having engaged with consumers on the Powering Sydney’s Future project, including its assumptions
and concerns raised by consumers, stakeholders, RPWG, TAC and the AER and CCP, TransGrid has
proposed an amended project to reflect the feedback we have heard. TransGrid’s engagement with its
consumers and stakeholders, and particularly with the RPWG and TAC, has supported the need for the
implementation of the Powering Sydney’s Future project as a solution to meeting the forecast demand
for the Sydney CBD and ensuring the security of supply as the current Ausgrid cables are retired.
In response to this feedback regarding the uncertainty that forecast demand will eventuate, we have
amended the project to include only a single cable, with the option of laying a second cable in the future
if demand forecasts are realised. This solution has been informed directly through engagement with
consumers and key stakeholders, and was endorsed by our TAC at its last meeting as a reasonable
and responsible proposal to ensure both the security of supply and greater optionality for the future. A
single cable option allows for the possibility of greater use of demand response and non-network
solutions in the future, providing optionality for the growing needs of the city to be met in the most
efficient way available at the time, while still ensuring that the security of supply to the Sydney CBD is
ensured in the short-medium term.
3.6 Response to public submissions
TransGrid appreciates the submissions put forward by its stakeholders and consumers, and would like
to thank them for the time taken to do so. Below are outlines of each of the submissions, and
TransGrid’s response.
3.6.1 City of Sydney
The City of Sydney is a key stakeholder for TransGrid, representing the local government body that
governs the Sydney CBD and Inner Sydney area, and sits on both the TAC and RPWG. We are
pleased to see that the City of Sydney supports TransGrid’s strategic vision for the future, for the
widespread deployment of renewable and low emission generation, and the City’s recognition of the
need for TransGrid to be appropriately resourced to ensure the continued supply of safe, secure and
reliable electricity to the City.
The City of Sydney has made a number of comments within its submission on TransGrid’s revenue
proposal, with a particular focus on TransGrid’s proposed capital and operating expenditure. The City of
Sydney has emphasised the increased role that demand response should play in the management of
critical network assets, including those in central Sydney that are part of the Powering Sydney’s Future
project. The City of Sydney has also noted that the Sydney CBD must continue to have a high level of
electricity security given its important economic position within NSW and Australia. TransGrid has
engaged extensively with the City of Sydney regarding the Powering Sydney’s Future project on a
continual basis through the TAC and the RPWG, including discussing the growing demand within the
city and the non-network options that are available to defer the project to the point it is currently at. The

TRANSGRID REVISED REVENUE PROPOSAL | 2018/19-2022/23 3
Page 33 of 158
City of Sydney is a key stakeholder for the CBD area and TransGrid is committed to ensuring that the
security of the electricity supply is not compromised.
Asset management was also highlighted by the City of Sydney as being in consumers’ best interests,
with the submission encouraging TransGrid to extend the life of assets where possible and to be
properly compensated where this has been done. As discussed previously, this approach to asset
management is consistent with TransGrid’s current risk management framework, where assets to
ensure they are maintained in a fashion that ensures the longest life and the least cost to consumers.
The City of Sydney also notes that the future of the electricity markets are uncertain, and that there was
concern that growing levels of local generation may not be properly recognised in forward forecasts.
Regarding current transmission charges, the City of Sydney has recommended that the transmission
charges that are applied to local generation be reduced as this would be both economically efficient and
suitable.
TransGrid is obliged to price in accordance with the National Electricity Rules, however we do note that
the existing pricing framework places a very small proportion of the costs on generation.
3.6.2 Origin Energy Limited
Origin Energy’s submission focused on our capital expenditure program and grid planning. Origin has
provided commentary on how greater efficiencies in the delivery of capital projects can be found in the
alignment of the timing and delivery of compatible projects, and has highlighted the importance of
accurate risk and condition based analysis to underpin replacement expenditure. TransGrid agrees with
these comments and is pleased to confirm that our forecasting method and asset management
practices deliver on these objectives. We have aligned our replacement expenditure forecasts with a
risk based approach to asset maintenance and replacement, ensuring that assets are maintained and
replaced based on their condition and function to ensure maximum efficiencies in our expenditure.
Regarding TransGrid’s proposed capital expenditure, Origin has proposed that the Powering Sydney’s
Future project should not be approved, but rather should be included as a contingent project until the
RIT-T is concluded. We take Origin’s feedback on board on this matter; however we maintain the need
for Powering Sydney’s Future to be a key capital expenditure project, and since Origin’s submission, we
have published the final RIT-T document. A further discussion of TransGrid’s inclusion of the Powering
Sydney’s Future project can be found in chapter 4.
Origin also highlighted that there is great uncertainty in the future of the NEM, particularly around
forecasts for the update of small scale renewable energy, and so questions how TransGrid will assess
the impact this might have on the grid and its assets. We are continually monitoring the development
and implementation of new technology and how that affects future use of the network. Origin also
questioned the stability of TransGrid’s grid planning model, recommending that the AER conduct a
back-casting exercise to help determine the accuracy and stability of the model and its outputs.
TransGrid has developed and maintains a robust up-to-date grid model of the NSW transmission
network and beyond. This includes detailed models of the NEM and downstream distribution networks.
TransGrid has implemented annual external reviews for quality assurance that have improved accuracy
and have set up our models for greater stability in future years.
3.6.3 Snowy Hydro Limited
Snowy Hydro Limited submitted specific comment on the proposed contingent project within
TransGrid’s revenue proposal pertaining to the reinforcement of the Southern network, stating that this
project was an important strategic investment that would be critical for the decarbonisation of the NEM.
Snowy Hydro proposed that TransGrid both expand the scope of the project to ensure that the Snowy

CONSUMER ENGAGEMENT | 2018/19-2022/23 3
Page 34 of 158
2.0 project is not constrained, and amend the triggers events that the project is based on, removing the
RIT-T as a trigger and including approval for final investment from the Snowy Hydro Board, completion
of the economic evaluation, and commitment from the TransGrid Board to proceed with the
augmentation.
Snowy 2.0 was announced by the Federal Government after TransGrid’s revenue proposal was
submitted. We made a further submission to the AER in August 2017 on contingent projects reflecting
outcomes of the Finkel Review, the Federal Government’s announcement of Snowy 2.0 and having
assessed the reliability consequences of 10 February 2017 generation shortfall in NSW.
TransGrid has proposed a specific contingent project related to Snowy 2.0, which would mean that if
the generation project proceeds we would be able to provide the necessary network connections.

TRANSGRID REVISED REVENUE PROPOSAL | 2018/19-2022/23 3
Page 35 of 158

CAPITAL EXPENDITURE | 2018/19-2022/23 4
Page 36 of 158
4. Capital Expenditure
4.1 Introduction
Capital expenditure includes expenditure on new assets to increase network capacity and reliability, on
replacement of existing assets at the end of their service lives and on assets which support the
business.
4.2 Overview
TransGrid proposed a capital expenditure program of $1,612 million in the revenue proposal,
comprising $160 million for augmentation of the network, $962 million for replacement of existing assets
and $331 million for the Powering Sydney’s Future project which is needed to secure the Inner Sydney
network on the basis of condition of existing assets and future growth in demand.
The draft decision for the 2018/19 to 2022/23 period has reduced TransGrid’s capital expenditure
allowance by $620 million (or 38%) to $992 million.1 These cuts comprise broadly a rejection of the
Powering Sydney’s Future project and a 23% cut to the remainder of the capital program. Our proposed
contingent projects were accepted with suggested amendments to the project triggers.
TransGrid disagrees with the proposed capital expenditure reduction, much of which appears to be
based on erroneous analysis and a misinterpretation of our forecasting approach. The reduction is not
in the long term interests of consumers; it will increase the risk of loss of supply events, lead to higher
asset lifecycle costs and has potential safety and environmental impacts.
The AER has a different view:
In making our draft decision, we specifically considered the impact our decision will have on the
safety and reliability of TransGrid's network. We consider this capex forecast should be sufficient for
a prudent and efficient service provider in TransGrid's circumstances to be able to maintain the
safety, service quality, security and reliability of its network consistent with its current obligations.
(Draft Decision 6-15)
Consequences of the proposed reduction
We recognise customer concerns about electricity prices; however such a large reduction in capital
expenditure will have consequences which may also impact customers and others in our community.
1 These values (and others in this chapter) exclude the NSCAS assets unless specifically stated.

TRANSGRID REVISED REVENUE PROPOSAL | 2018/19-2022/23 4
Page 37 of 158
At a time of significant and rapid change, where policy uncertainty has been the primary driver of
higher electricity prices, the draft decision serves to further deter efficient long-term investment and
does not further the provision of affordable, reliable and secure electricity.
We appreciate that the AER has remained open to reviewing further information.
AER draft decision
Details of the AER draft decision’s $620 million capital expenditure reduction are shown in Table 4.1.
Table 4.1: Capital expenditure draft decision and reasons ($m June 18)
Component
Draft
decision
($m)
AER assessment and rationale
Powering Sydney’s Future (PSF)
0
Reduction in our forecast: -100%
AER rejected this project due to presumed uncertainty in key drivers including demand, cable availability and value of customer reliability.
Replacement
(inc. Security & Compliance)
757.9
Reduction in our forecast: -21%
AER considers that the risks being managed by the program are overstated, so considers that the forecast is overstated.
Augmentation (ex-PSF)
96.6
Reduction in our forecast: -40% in total across the category
Economic benefits driven – AER found the identified needs were valid but investment benefits may be materially overstated (-51%)
Connection driven – AER consider that historical connection capex would be more accurate than TransGrid’s forward looking view (-79%)
Localised demand driven – AER accepted most of this category but found insufficient information was provided for one project (-15%)
Reliability – AER accepted the proposal, with a small update for inflation (-0.5%)
Non-Network
(IT and business support)
137.7
Reduction in our forecast: -13%
AER did not agree with elements of the project benefit analysis for the IT projects (eg, failure rates, risk costs, options analysis). Business support costs were accepted.
Total 992.2

CAPITAL EXPENDITURE | 2018/19-2022/23 4
Page 38 of 158
The AER accepted the five proposed contingent projects subject to slight changes to the trigger events.
Concerns with the AER’s conclusions and their basis
Our forecasting method is based on established asset management practices and a recognised
approach to risk analysis. We are concerned with the AER’s draft decision for capital expenditure as it:
Draws upon erroneous or inapplicable analysis, which we identified and brought to the AER’s
attention in August 2017
Is based on an incorrect interpretation or misunderstanding of aspects of our risk analysis and
forecasting approach
Does not properly reflect the most recent and relevant information.
We are also concerned that the AER’s process has allowed incorrect information about our forecasting
approach into the public domain.
We appreciated the opportunity to fact-check Energy Market Consulting Associates’ (EMCa) draft
report.2 Despite notifying the AER of more than thirty factual and interpretative errors
3, the unchanged
report was published without any indication that corrections could be required. Many of the most
significant errors form the basis of the draft decision - especially the examples where risk consequence
costs have been misinterpreted.
For example, the AER concluded that our use of “worst case” risk assumptions in risk analysis4 is
“overly risk averse” and so “capital expenditure is likely to be overstated” (Draft Decision 6-3). This
appears to be based on a poor understanding of our actual approach.
2 Review of aspects of TransGrid's forecast capital expenditure 2018-23, June 2017 3 Letter to AER, 23 August 2017.
4 This is a valid approach in risk management, ensuring high consequence risks are properly considered, even if they are unlikely.

TRANSGRID REVISED REVENUE PROPOSAL | 2018/19-2022/23 4
Page 39 of 158
Correcting (at least) the most material errors prior to publishing would have allowed stakeholders and
customers to respond based on factual information. Many analytical errors and misinterpretations are
addressed in section 4.3.2 and the capital expenditure reductions these errors were used to support are
identified throughout this chapter.

CAPITAL EXPENDITURE | 2018/19-2022/23 4
Page 40 of 158
TransGrid’s response to the draft decision
We agree with the AER:
That contingent projects triggers can be amended largely as suggested
To correct minor analytical errors, decreasing some parts of the forecast
To update the IT investment analysis and provide further information as suggested.
We disagree with the AER that Powering Sydney’s Future is not required when proposed, nor do
we consider it should be treated as a contingent project.
There is very strong support from customers and
stakeholders for securing the Inner Sydney network,
especially in light of committed infrastructure projects,
economic growth and historically high level of building
approvals. 5
The AER’s comparison of the PSF demand forecast
to out-dated AEMO forecasts covering different
geographical areas is not appropriate. Its subsequent
conclusions about demand uncertainty do not reflect
available information, such as AEMO’s 2017 forecast
or evidence that large new loads are already
connecting.
As a compromise, we are proposing a two-stage project to address the immediate supply risk and stop
the oil leaks by retiring the old cables. This may also provide an opportunity to delay the second cable
with demand management. However, we will need to manage additional community disruption from the
second construction phase, potentially as soon as four or five years after the first construction period.
We disagree with the AER that forecast replacement expenditure is based on overstated risks.
The AER’s reliance on past trends appears to penalise a forecast created to address emerging and
future risks. We have reviewed the areas of concern and analysed the latest asset condition information
and have provided a similar forecast with minor updates.
We disagree with the AER that other parts of the augmentation forecast should be reduced.
Economic benefits are not overstated and the forecast of expenditure related to new large but uncertain
demand connections should be based on future conditions, not the past.
We propose a compromise in relation to the labour escalation forecast. For capital expenditure,
the AER accepted the proposed labour cost escalation based on a Wage Price Index (WPI) for the
Electricity, Gas, Water and Waste Services (EGWWS), prepared by BIS Shrapnel. However, the AER
did not accept the same labour cost escalation forecast for operating expenditure, replacing it with a
WPI EGWWS forecast prepared by Deloitte Access Economics.
As we clearly face the same labour cost escalation for both areas, we propose a compromise approach
which is consistent with the AER’s preferred approach in our current revenue determination. We have
applied the average of an updated BIS Shrapnel6 forecast and the AER’s Deloitte Access Economics
forecast to both capital and operating expenditure in this revised proposal. This ensures the integrity of
5 Source: Australian Bureau of Statistics, Building Approvals, Australia, catalogue number 8731.0
6 Since the submission of our proposal in January, BIS Shrapnel has been renamed BIS Oxford Economics

TRANSGRID REVISED REVENUE PROPOSAL | 2018/19-2022/23 4
Page 41 of 158
the respective forecasts. This update of the labour escalation has reduced our capital expenditure
forecast by $13.5 million compared to the January 2017 proposal.
Updated forecast
TransGrid’s revised capital expenditure forecast in comparison with our proposal and the draft decision
is shown in Table 4.2.
Table 4.2: Revised capital expenditure forecast and rationale ($m June 18)
Program component Proposal Draft
decision
Revised
forecast Comments Section
Powering Sydney’s
Future 331.7
7 0 252.3
We propose a two-stage project in response to AER and following customer consultations
4.4
Replacement (inc
Security & Compliance) 961.8 757.9 937.1
Minor amendments made in response to AER comments
4.5
Augmentation (ex-PSF) 160.08 96.6 186.6
Ten “ex-NCIPAP” projects added to the ex-ante capital program
Updated supporting information is provided
4.5.7
Non-Network (IT and
business support) 158.8 137.7 157.9
New IT option analysis has been completed in response to AER comments
4.7
Total 1,612.3 992.2 1,534.0
This revised forecast has been influenced by new asset and demand information, updated analysis,
consultation with stakeholders and aspects of the draft decision.
Overview of changes
The most significant change in this revised proposal is that we are proposing PSF as a two-stage
solution – one cable first, with a second cable to be installed later. As the economic analysis for the
RIT-T identified several options with similar benefits, the original single-stage option was “preferred” as
it minimised the construction impact on the community.
However, we acknowledge the concerns of the AER and Consumer Challenge Panel (CCP) relating to
flexibility. We therefore reviewed the options to consider the appropriate balance between retaining
optionality, decreasing the initial capital cost and minimising community disruption.
Following this, we sought the views of customers and stakeholders represented by our TransGrid
Advisory Council. They supported a two-stage option. A wider group of consumers, transmission
customers, the AER and CCP also supported a two-stage option particularly as it provides flexibility.
The installation of the second cable could be delayed if demand growth is lower than forecast and/or a
higher quantity of lower cost non-network options emerges. The opposite could also occur and this
7 Our original forecast was $330.9 million. The AER moved $0.8 million from the connection forecast into the PSF forecast. We
updated the PSF forecast in June 2017 to incorporate new information. W e notified the AER of an increase to $373 million on 23rd
June 2017
8 As noted for PSF, the AER moved $0.8 million from the connection forecast into PSF. Our original forecast for augmentation (which
includes connection) expenditure was $160.8 million.

CAPITAL EXPENDITURE | 2018/19-2022/23 4
Page 42 of 158
option would allow us to respond with a second cable earlier than planned should that become
necessary.
The downside of a two-stage option is the second period of construction-related traffic congestion and
related community impacts later in the next decade. This may not be trivial – for example, one of the
impacted roads is currently used by almost 27,000 vehicles daily9. While these wider economic impacts
cannot be included in a RIT-T, they still need to be properly considered. Nevertheless, we undertake to
minimise these impacts. For example, this could be achieved by laying both sets of cable ducts in a
single trench during the first phase and by carefully selecting joint bay locations to minimise later
disruption where feasible.
Changes to the replacement expenditure forecast are the result of:
Revising the scope of projects and programs in the forecast to account for the latest asset
information and AER and EMCa comments
Modelling corrections to reflect AER and EMCa comments.
The augmentation expenditure forecast (excluding PSF) now includes ten additional small projects
which were not accepted into the Network Capability Incentive Parameter Action Plan scheme. Each of
these projects results in positive market benefits at relatively low cost.
The IT expenditure forecast is slightly lower as a result of revised investment analysis.
Contingent projects
The five contingent projects have been updated with amended triggers in line with the AER’s
suggestions. There are also four new contingent projects: three related to the establishment of
renewable energy zones and one for the proposed Snowy Hydro expansion. Three of these were
foreshadowed to the AER in a letter on 22 August 2017.
Capital expenditure chapter content
The remainder of this chapter presents:
An overarching response to the draft decision
Detailed responses to specific cuts including new information where relevant, comments on the
AER’s analysis and how it has been applied
Our updated forecast
Updates to the contingent projects.
9 Georges River Road traffic station reports around 27,000 vehicles pass that section of the proposed route on average each day in
2017. The source of vehicle count data is under Station ID 7275 at:
http://www.rms.nsw.gov.au/about/corporate-publications/statistics/traffic-volumes/aadt-map/index.html#/?z=13&lat=-33.90921191659774&lon=151.0794010162358&id=7275&tb=1&hv=1

TRANSGRID REVISED REVENUE PROPOSAL | 2018/19-2022/23 4
Page 43 of 158
4.3 TransGrid’s overarching response
4.3.1 Areas of agreement and the inclusion of new information
TransGrid agrees with EMCa and the AER’s assessments in some areas including that:
Minor modelling errors should be corrected
Some scope items could be removed from compliance projects.
As a result of these adjustments, and updating to account for new information, the revised proposal
capital expenditure forecast is slightly lower than the January 2017 forecast. Table 4.3 shows a
summary of changes from the revenue proposal forecast. 10
Table 4.3: Summary of changes from the revenue proposal forecast ($m June 18)
Change made Impact ($m) Reason More
information
Actuals: Updated with 2016/17 actuals
and 2017/18 forecast 11.5 Update to 2017/18 forecast -
PSF: Update to Powering Sydney’s
Future Project -78.0
Cost decreased as single cable
option proposed 4.4
Augmentation: Timing change to 1443-
Canberra Sub - Installation 132kV Switch
bay - Line Single CB
0.1 Response to AER’s draft decision -
Augmentation: Removal of Travelling
Wave Fault Location Project -2.5
Removed from forecast following
review of the need 4.6.1
Augmentation: Inclusion of projects not
accepted in NCIPAP 21.6
Projects with clear benefits added
to ex-ante forecast 4.6.1
Replacement: Project 1254 SCADA
replacement timing change -3.1
Project brought forward so some
expenditure now in 2017/18 4.5.3
Replacement: Reduction and removal of
projects -9.1 Response to AER’s draft decision 4.5.2
Replacement: Scope increase in
replacement project (1556-Trans. Line
Low Span St. 2)
3.8
Scope of measures required to
remediate were different, leading
to an increased estimate
4.5.3
IT: Revised IT Forecast 0.1 Response to AER’s draft decision 4.7
Inflation: Updates to actual and forecast
inflation -9.1
Actuals for 2015/16 (corrected)
and 2016/17 (added)
Inflation forecast is 2.25% for
2017/18 and 2.47% thereafter11
-
Escalation: Labour escalation updates -13.5 Average of DAE and updated BIS
Shrapnel forecast 5.6.2
Total12
-78.3
10 Note: this table summarises changes made between CAM model submitted for the Revenue Proposal filename, ‘TransGrid-Capital
Accumulation Model-0117-PUBLIC.xlsb’, dated 31/01/2017 and the CAM model submitted with this Revised Proposal filename, ‘TransGrid-Capital Accumulation Model-1217-PUBLIC.xlsb’, dated 01/12/2017.
11 Inflation based on geometric average of Reserve Bank of Australia Statement on Monetary Policy for two years and the midpoint of
its target range for eight years 12
Note that table values do not add to this due to rounding. This is the correct total based on the unrounded individual entries.

CAPITAL EXPENDITURE | 2018/19-2022/23 4
Page 44 of 158
4.3.2 Areas of disagreement
There are also aspects of the draft decision which we do not agree with.
A $620 million reduction in capital expenditure is not in the interests of consumers as it increases the
risks of:
Loss of supply events across the network, including sustained supply interruptions in the Sydney
CBD (the source of around 7% of Australia’s Gross Domestic Product)
Higher asset lifecycle costs, which will ultimately flow through to customer bills
Safety and environmental impacts within our community.
Given our concerns about the potential impacts on consumers and the community, we have carefully
reviewed the rationale these aspects of the revised proposal are based on.
We consider that our risk analysis is robust but does not appear to have been well understood by
EMCa and the AER. The draft decision and EMCa’s report contain factual errors and misconceptions
about the process and its inputs - the quantification of risk is the subject of many of these, including:
Risk values being misread from a spreadsheet and presented as “evidence” of a systemic bias
A lack of understanding of our risk analysis which has led to conclusions that we assume events to
be a factor of a thousand more likely than actually modelled.
It is especially concerning that the draft decision relies so heavily on these:
…we found some aspects of TransGrid's proposal were not consistent with the NER. Our findings on
TransGrid's quantification of reliability, safety and environment (bushfire) risks used to derive project
cost estimates largely explain why we are not satisfied that TransGrid's proposed total forecast
capex meets the capex criteria. (Draft Decision 6-10)
TransGrid notified the AER in writing in August 2017 that there were a range of errors in the EMCa
report. Other issues are the result of incorrect or inapplicable analysis and examples of both are
provided throughout this chapter.
Issues with the AER and EMCa’s analysis
We understand that revenue reset processes are time constrained and involve the review of large
amounts of information. Mistakes are possible and we appreciate that the AER and EMCa have given
TransGrid an opportunity to correct errors in its material.
However, some of the AER’s (and EMCa’s) significant conclusions rely upon incorrect or inapplicable
analysis and misinterpretation of our information. We are concerned about the adequacy of a process
which has led to a $620 million capital expenditure reduction.
The EMCa Report
The EMCa report contained more than 30 factual errors but the AER published it
uncorrected and relied on the report to support many of its own conclusions.
The $620 million reduction in capital expenditure is largely based on the AER’s findings
in relation to the quantification of risks. Given the extent and nature of the errors and
misunderstanding in relation to this, the AER’s conclusions do not seem reasonable.

TRANSGRID REVISED REVENUE PROPOSAL | 2018/19-2022/23 4
Page 45 of 158
The EMCa report, ‘Review of aspects of TransGrid’s forecast capital expenditure’, draws conclusions
on TransGrid’s capital expenditure forecast and is heavily quoted by the AER. We appreciated the
opportunity to undertake a fact-check and identified more than thirty errors of fact and many
interpretative errors in a response to the AER on 23 August 2017. We are disappointed that the AER
issued the EMCa report without making any corrections and without indicating that some corrections
could be required.
We are also concerned about direct contradictions between the draft decision and the EMCa report:
EMCa found … bias in … risk assessment methodology: inadequate justification and overstated
project risk cost parameter assumptions (includes probability of failure, likelihood that a
hazardous event will lead to a consequence and the cost consequence of asset failures) (Draft
Decision 6-70). [Added emphasis]
On balance, we consider that TransGrid has applied a reasonable process, and that application
of its process is likely to produce a reasonable estimate of the PoF (EMCa Report p26) [Added
emphasis]
Examples of errors, misinterpretations and misinformed conclusions
Various EMCa and AER analytical errors and misinterpretations are used to help justify many
expenditure cuts. Significant examples are presented below with others provided in the sections
detailing the relevant parts of the forecast.
The AER relied heavily upon EMCa’s report, even re-quoting some of the more obvious errors to
support its conclusions, for example:
EMCa's concerns regarding a lack of portfolio optimisation is supported by its observation that
TransGrid's risk cost modelling assumes that it is exposed to $1.6 trillion of risk per annum …if this
was considered to be a reasonable estimate of risk exposure, ...TransGrid would be investing to
manage this risk in the current (2015-18) regulatory control period…TransGrid is presently spending
less than was forecast for the 2014-18 regulatory period. This suggests that TransGrid's estimated
risk costs for the 2018-23 regulatory control period used in support of its proposed capex may not be
credible. Further, this also suggests that TransGrid's proposed expenditure to manage risks is
inconsistent with its actual practices. (Draft Decision 6-65)
The data used actually values pre-investment risk at $1.6 billion and we notified the AER of this in
writing.13
Regardless, $1.6 trillion is a large risk value - close to the value of Australia’s 2016/17 GDP. It
is reasonable to expect that a rigorous process would have identified such a large number if it was
going to be used to demonstrate a flaw in TransGrid’s approach.
13 It appears that EMCa has summed a column in a spreadsheet but has incorrectly concluded that $1,620,425,704 is $1.6 trillion.
Example 1: EMCa and AER incorrectly interpreted risk cost information and reported that the total
network risk is $1.6 trillion.
Usage: to conclude that we either overstate risk or are underspending imprudently in this period.

CAPITAL EXPENDITURE | 2018/19-2022/23 4
Page 46 of 158
This basic analysis of connection point utilisation does not provide useful network planning information
and the AER’s conclusion cannot reasonably be reached from it.
A TNSP would be negligent to apply such an approach in considering how best to meet its obligations.
Material flaws in this analysis include that:
Past average connection point utilisation provides no indication of whether customer needs or
obligations can be met in the future at a particular connection point14
It provides no insight into where a problem might exist, nor does it identify other constraints (such
as voltage or thermal limits on the network supplying the connection point)
While non-coincident peak demand would be more representative, an “average utilisation”
calculation is still not useful
14 Average utilisation across two connection points at peak time might be 50% but the implications of this cannot be understood
without looking at the individual connection points. For example, one could be 10% utilised and the other could be 90% utilised or they could both be 50% utilised.
Example 2: An average connection point utilisation calculation is not fit-for-purpose in credible
network planning. The draft decision also appears to misrepresent the results of the calculation.
Usage: The calculation and results are used to conclude that demand driven augmentation should
remain at historical levels.

TRANSGRID REVISED REVENUE PROPOSAL | 2018/19-2022/23 4
Page 47 of 158
The AER used “coincident demands” measured at each connection point at the system-wide peak.
Many connection points have much higher demands at other times (so will appear to be less
utilised at the system peak). Six examples are shown in Figure 4.1.
Figure 4.1: Connection point demands at coincident ‘system’ peak and actual peaks (2013/14)
Source: TransGrid (transmission) 2013-14 - Category Analysis RIN - Templates (updated August 2015).
Transformer “nameplate” capacities used give no information on the secure capacity at the
connection point (ie, taking account of credible contingency events). Secure capacity is much more
relevant as it relates to meeting reliability standards.
In addition to the inappropriate use of the above method, we are concerned that Figure 6.6 in the draft
decision appears to misrepresent the results of the calculation. The spreadsheet provided to us shows
that the chart presented did not use the calculated values. It used significantly rounded manually
entered values. The corrected chart in Figure 4.2 compares calculated actual values with the “rounded
up” values shown by the AER (Draft Decision, Figure 6.6).
Figure 4.2: 2013/14 and 2015/16 connection point utilisations (Coincident demand)
1.4 3.9
37.0
5.9 12.8
7.3
31.4
14.2
95.9
14.6
27.6
15.5
0
10
20
30
40
50
60
70
80
90
100
Munyang 33 kV Cooma 66 kV Wallerawang 132kV
Glen Innes 66 kV Inverell 66 kV Finley 132 kV
Co
nn
ecti
on
Po
int
dem
an
d (
MV
A)
Coincident and peak demands at selected Connection Points (MVA)
C.P. Demand at'coincident' systempeak (MVA)
Actual C.P. (non-coincident) peakdemand (MVA)
Actual peak is 22 times
higher than coincident peak used by AER

CAPITAL EXPENDITURE | 2018/19-2022/23 4
Page 48 of 158
The chart shows how the AER’s rounding presents a much more significant 10% “reduction in
utilisation” between 2013/14 and 2015/16, rather than the calculated 2.1%15
. This is an indicator of a
lack of rigour and quality control within a process which has concluded with a reduction of $620 million
in capital expenditure.
Table 4.4 summarises why calculating and applying an “average connection point utilisation” does not
support the AER’s conclusion.
Table 4.4: Assessment of conclusions from average Connection Point utilisation
AER conclusion
(Draft Decision 6-42)
Is this
reasonable? Comments
On average there has been
a decrease in connection
point utilisation on
TransGrid's network
X
Conclusion is not possible as analysis did not use:
Actual non-coincident peak demands for each connection point (ie, the ‘real’ demand peaks)
Secure capacity at each connection point.
Taken together with the
declining and flat demand
growth, this suggests there
is sufficient capacity in the
network.
X
Even with correct demand, this analysis cannot conclude
the network has “sufficient capacity”, as:
It only covers one element of “TransGrid’s network” – transformers at connection points
Average demand growth has no bearing on needs in areas with fast demand growth
Past history provides no insight into future demand and constraints.
Relevantly, this suggests
that demand driven
augmentation expenditure
is unlikely to be above
recent historical levels.
X
Even correcting all the above flaws, this analysis cannot
support any relevant conclusion about future investment
needs.
Recent historical levels of augmentation are not a
reasonable reference point for possible future needs.
15 Connection point utilisations of 26.7% and 24.6% respectively were rounded to 20% and 30%.

TRANSGRID REVISED REVENUE PROPOSAL | 2018/19-2022/23 4
Page 49 of 158
We note that our Transmission Annual Planning Report (TAPR) publishes a range of useful information
on connection point demand, network capacity and potential areas of constraint. Examples from TAPR
2017 are shown in Figure 4.3.16
Figure 4.3: Examples of published network utilisation and demand information
Note: the only demand-driven augmentation expenditure in the next period is at Macarthur (orange) and Vineyard (red)
connection points.
The chart created was incorrect but the conclusion about “limited benefits” cannot be drawn from this
data in any event – it is not a comparison of total benefits against capital expenditure.
The chart of cumulative risk versus capital expenditure was incorrect as it showed that forecast
replacement expenditure (in red) and total capital expenditure (in blue) have exactly the same
cumulative annual risk cost savings (left hand chart, y-axis). It appears that the “repex only” trace used
the wrong column of cumulative risk savings.
The chart also included projects which were not applicable for this analysis (including some which are
not part of the ex-ante capital forecast).17
These projects were forecast on a different basis and had no
equivalent relevant values to include in the AER’s analysis.
16 These examples are Figure A3.2 - TransGrid N and N-1 line utilisations - Sydney and Newcastle (p.93) and Figure 4.7 - BSP
summer forecast growth rates (p.60) in the 2017 Transmission Annual Planning Report available at: https://www.transgrid.com.au/news-views/publications/Pages/default.aspx
17 Projects which were not relevant to this analysis included: Those required to manage ALARP safety risks and which by their nature,
do not include a calculated ‘risk cost saving’ (eg, the Fleet Replacement forecast uses a base-step-trend method); Network Capacity Incentive Parameter Action Plan (NCIPAP) projects; and projects which continue from the current regulatory period.
Example 3: EMCa created a chart of risk reduction versus capital investment which was incorrect; it
also included projects which were not relevant to the analysis.
Usage: the chart was used incorrectly to conclude that $200 million of investment has limited
benefits.

CAPITAL EXPENDITURE | 2018/19-2022/23 4
Page 50 of 158
A corrected version of the chart is shown alongside the EMCa / AER version18
in Figure 4.4.
Figure 4.4: Corrected version of cost Vs annual risk saving chart
The EMCa / AER version:
Included inapplicable projects
Showed that “Repex only” benefits were equal to the benefits of the “Total capex” forecast (but this
is not credible)
Highlighted areas do not show investment with “marginal benefits”. This is because y-axis shows
annual cumulative benefits at a point in time (not the total benefits of an investment).
In TransGrid’s corrected version:
Fleet, NCIPAP and current period carryover projects were excluded and the impacts of minor
modelling updates were incorporated19
Annual “total capex” benefits (y-axis, green) are higher than the “replacement only” benefits
forecast (y-axis, blue).
If the EMCa/AER chart was correct, it would indicate that TransGrid’s entire augmentation expenditure
forecast is associated with no benefit at all. However, this is clearly not the case (nor was it the AER’s
conclusion). The AER focused on the highlighted areas, concluding that these showed expenditure with
limited marginal benefit. This is not correct as the y-axis is showing “annual risk reduction benefits” at a
point in time (which in this case is assumed to be the mid-point of the regulatory period).
It does not show “total risk savings” of investments so highlighting these apparent areas of “marginal
benefit” expenditure is misleading. These risk savings change over time so this is not an informative
way to review the portfolio in any event.
This example indicates that application of our risk model and our investment analysis has not been fully
understood. In fact, any project which is assessed as having a positive NPV has done so in spite of a
conservative treatment of future benefits. We used a 10% nominal discount rate which conservatively
reduced the present value of investment benefits. This inherent bias against capital expenditure in our
18 Sources: Draft Decision: Figure 6-12 TransGrid - Areas of low incremental benefit (risk reduction) and EMCa, Review of aspects of
TransGrid's forecast capital expenditure 2018-23, June 2017, p. 40 19
For example, refinement of the ALARP methodology, as discussed in the Replacement Expenditure section

TRANSGRID REVISED REVENUE PROPOSAL | 2018/19-2022/23 4
Page 51 of 158
analysis makes the investment hurdle higher and adds further support to the need for the proposed
expenditure. The approach is described further in section 4.5.
While modelling errors can occur, this and the other examples above suggest that:
EMCa and the AER may not have adequate quality control processes in place
There has not been sufficient understanding of our approach or the information we provided, for the
AER to draw conclusions about our expenditure.
Analysis errors and process failings undermine the draft decision
TransGrid is concerned by the nature and extent of the errors and misunderstandings in EMCa’s report
and the draft decision. As outlined above, significant capital expenditure cuts appear to be loosely
based on analysis which is not credible or fit for purpose.
Apparent quality control failings also undermine the draft decision’s capital expenditure conclusions.
TransGrid is particularly concerned that the process has not accounted for the many issues we
identified in August 2017.
Many more instances of errors and misunderstandings which have been used to support the draft
decision occur throughout this revised proposal.
4.4 Powering Sydney’s Future
4.4.1 Background
The Inner Sydney and CBD network is not only important to the local community it serves - it is
essential to the NSW and national economies. It generates around 7% of Australia’s Gross Domestic
Product and is the site of more than 620,000 jobs.20
It is home to a growing population with 22%
population growth recorded in the City of Sydney LGA over the last five years. 21
However, the electricity supply is increasingly at risk because:
Many important transmission cables are deteriorating in condition – they are an increasing
environmental risk through oil leakage and Ausgrid has plans to progressively retire them
As the condition on remaining in-service cables deteriorates further, failure rates will increase and
outages of up to 8 weeks will become more common.22
Higher failure rates and long repair times
increase the chance of coincident outages and loss of supply
Peak demand is increasing, driven by the economic activity and new major infrastructure identified
above.
A solution is needed by 2022 to secure the reliability of supply to Australia’s largest city. A RIT-T
process has been undertaken over the past year and a technically and economically feasible solution
has been identified.
20 As at June 2016, there were 623,760 jobs – 6.9% higher than the previous year. Source: National Institute of Economic and Industry
Research (NIEIR), data published by City of Sydney 21
Source: Australian Bureau of Statistics, Regional Population Growth, Australia (3218.0). 22
The nature of these cables is that repair times are long as they need to be drained of oil before work commences then refilled after. Repairs are also more specialised than they would be with modern cable technology.

CAPITAL EXPENDITURE | 2018/19-2022/23 4
Page 52 of 158
Consultation throughout the RIT-T and separately for our revenue proposal indicates that PSF is
strongly supported by customers and stakeholders.
4.4.2 AER assessment
The AER has rejected all forecast expenditure for the Powering Sydney’s Future (PSF) project. It notes
there is uncertainty around the key drivers, especially the demand forecast, the ratings and availabilities
of existing cables and the Value of Customer Reliability used in modelling.
As a result, the optimal timing for the Powering Sydney's Future project is likely to be beyond the 2018-
23 regulatory control period. (Draft Decision 6-36)
However, the AER has remained open to further discussion:
the key issue is whether the timing and scope of the upgrade is reasonable rather than whether an
upgrade to the network is necessary. (Draft Decision 6-96)

TRANSGRID REVISED REVENUE PROPOSAL | 2018/19-2022/23 4
Page 53 of 158
While we agree there is some uncertainty, it is not to the extent portrayed by the AER. As demonstrated
in the Project Assessment Conclusions Report (PACR) for the RIT-T, the project is robust under a
number of reasonable scenarios.
Specific concerns
The AER’s concerns and our responses are summarised below:
Demand forecast: the AER is not convinced about the growth in the demand forecast and has asked
for more information about new spot loads. The AER’s conclusion relied on AEMO’s forecast which
covers a much larger geographical region and was already revised significantly upwards before
the draft decision was published.
Cable ratings: the AER concludes that TransGrid’s cable capacity assumptions are inconsistent with
industry practice, suggesting emergency ratings should be used instead of cyclic ratings. The highest
technically feasible ratings have been modelled and the AER has misinterpreted the information
provided.
Cable availabilities: The AER rejected the inclusion of corrective outages in cable unavailability rates
because they include events within the control of Ausgrid. The AER’s own consultants, EMCa, found
the approach reasonable and it is unclear why the AER has disagreed with them . TransGrid and
Ausgrid maintain that the cable availability modelling conducted by Ausgrid is a robust and
reasonable basis for the forecast.
Value of Customer Reliability: The AER notes that TransGrid has value of customer reliability (VCR)
assumptions higher than estimates used in determining planning standards for the Inner Sydney and
the CBD network. TransGrid has re-run the analysis using the VCR value used in IPART’s
planning standards; there is no change in the scope or timing of the project.
Sensitivity analysis: The RIT-T process included a range of sensitivity modelling but the AER was
interested in specific scenarios relating to the demand, VCR, load growth and cable failure rates. These
scenarios have been completed and provided to the AER.
4.4.3 Impact of failing to secure Sydney’s electricity supply
If Powering Sydney’s Future does not go ahead, the impacts for the community and economy are
potentially serious:
Sustained power supply interruptions, lasting weeks or even months
Environmental damage, via increasing cable oil leaks
Higher costs to customers over the long term.
4.4.4 Response to AER’s concerns
Demand forecasts - AER comparisons were inappropriate
The AER did not base its draft decision on the most recently released demand forecasts from AEMO.
The forecasts it used were more than a year out of date and covered different geographic areas. The
AER published the chart in Figure 4.5 to question the growth in the PSF demand forecast (in blue).

CAPITAL EXPENDITURE | 2018/19-2022/23 4
Page 54 of 158
Figure 4.5: AER comparison of demand growth
The figure is misleading as these “comparison” forecasts all have a different basis:
AEMO’s “Sydney” connection point forecast (green):
is for a much wider area, including outer suburbs and the Central Coast
has been ‘reconciled’ to the NSW Region forecast.23
BIS Shrapnel (red) specifically does not include spot loads
AEMO’s whole of NSW forecast (purple) is prepared to support an assessment of total generation
capacity – it is not directly relevant for local network planning.
This is not a criticism of these forecasts – they are simply inappropriate for comparison purposes.
23 This is where AEMO’s regional forecasts are reconciled to the NSW Region forecast. In this process, some unreconciled regiona l
forecasts increase and some will decrease. While this step ensures that AEMO’s forecasts are internally consistent and reflect State
level trends, they may not reflect trends which exist at the granular level..

TRANSGRID REVISED REVENUE PROPOSAL | 2018/19-2022/23 4
Page 55 of 158
Figure 4.6 shows the significant differences in geographical areas covered by the PSF and AEMO
Sydney Region forecasts.
Figure 4.6: Differences in demand forecast areas
AEMO’s “Sydney Region” connection point forecast (blue area) extends north across the Hawksbury
River into the Central Coast area and goes past Cronulla in the south. It is a much wider area which
includes significantly different customer and demand profiles, including a higher proportion of residential
and medium density load. It includes eight TransGrid Connection Points.24
It does not provide a good comparison for the PSF forecast (red area) which has two TransGrid
Connection Points and where non-residential customers account for 85% of summer peak. Differences
in residential and non-residential customer demand include their respective load profiles (eg. they peak
at different times of day) and their different responses to price. The PSF demand forecast was
developed to account for the specific characteristics of the underlying load, including the connection of
large new spot loads (which the AEMO forecast does not include25
).
The expectation that there will be load growth is supported by the most recently recorded PSF area
summer peak and AEMO’s latest “Sydney Region” forecast.
24 AEMO forecasts over this wider area as significant sub-transmission meshing in the Sydney area which limits its visibility of changes
in demand at individual connection points. 25
AEMO’s method assumes that loads less than 5% of the maximum demand are captured in the underlying growth trend.

CAPITAL EXPENDITURE | 2018/19-2022/23 4
Page 56 of 158
Figure 4.7 shows that the summer 2016/17 raw demand for Inner Sydney coincides with the “high”
forecast published as part of the RIT-T consultation.
Figure 4.7: Inner Sydney (PSF) peak demand forecast and actuals
Note: “Raw” actual demand is the metered flow into the area on 10 February 2017 (via “cut-set 1” feeders).
More recent versions of AEMO’s NSW and Sydney Region forecasts were available from July and early
September 2017, respectively. Both were revised upwards compared to the 2016 forecasts. Figure 4.8
shows the difference between the latest (2017) AEMO “Sydney Region” forecast and the 2016 version.
Figure 4.8: AEMO Sydney Region peak demand forecasts

TRANSGRID REVISED REVENUE PROPOSAL | 2018/19-2022/23 4
Page 57 of 158
The most recent AEMO forecast indicates load growth for the Sydney Region. While it is still different to
the PSF forecast there is much less divergence than suggested in the 2016 forecast comparison
published by the AER.
While there is uncertainty in any forecast, this projected demand growth is supported by other lead
indicators. For example, Figure 4.9 shows that residential and commercial construction approvals are at
historic highs.
Figure 4.9: Value of building approvals in City of Sydney LGA 2001/02 to 2016/17
Source: Australian Bureau of Statistics, Building Approvals, Australia, catalogue number 8731.0.
Significant one-off infrastructure projects are underway and many residential and commercial
developments are in progress. As a result, Ausgrid’s latest PSF load forecast includes around 340MW
of spot loads in 2022/23, including:
Large new infrastructure and commercial loads, including:
WestConnex motorway tunnels – 38MVA by 2021
Light Rail & Sydney Metro – up 7MW until 2021, then increasing to 69MW
Data centre loads – 35MW by 2022
Large residential and commercial developments, totalling around 18 MVA by around 2020
Many smaller spot loads of up to 150MVA by 2022, mainly connecting at 11kV. These will be driven
by increases in medium and high-density dwellings (replacing lower density residences).
All these forecast spot load values have been reduced by a probability weighting, based on how close
they are to being committed and historical conversion rates for proposed spot loads.26
The weightings
for the large new infrastructure loads also account for an average load diversity factor for the specific
industry class.27
26 Weightings are based on analysis of recent history. More developed 11kV loads are weighted by 0.78 and other less likely
connections are weighted by 0.34. For example, a development seeking a 5MW connection at 11kV but which is not yet well developed will go into the forecast as 1.7MW.
27 This load diversity factor reduces loads to account for the fact their highest levels may not coincide with the local system peak.
There are different factors for rail, data centres, road tunnels and airports for example.
$3.53 billion of approved
construction
-
1,000
2,000
3,000
4,000
5,000
6,000
Valu
e o
f ap
pro
vals
($ m
illio
ns)
Value of Building Approvals, City of Sydney LGA
Non-residential
Residential

CAPITAL EXPENDITURE | 2018/19-2022/23 4
Page 58 of 158
Both WestConnex and Light Rail & Sydney Metro are currently under construction, so their omission
from demand forecasts is not credible. Demand in the CBD and Inner Sydney is growing and the
forecast for PSF remains valid.
Cable availabilities
Cable availability assumptions are based upon outage histories (to determine outage frequencies) and
a study of the failure types (to determine mean time to repair). The resulting annual “cable
unavailability” assumptions are important factors in the calculations of “unserved energy”.
The AER did not consider the modelled cable availabilities for PSF to be valid. This is contrary to their
expert adviser, EMCa’s advice which concluded:
Ausgrid’s models are likely to provide a reasonable estimate of cable unavailability for the cables we
reviewed, namely the eight Ausgrid 132kV cables identified for replacement in the PSF project.
(EMCa Report, page iv.)
TransGrid has applied the results of the above modelling without further modification. The use of the
unavailability data is discussed further below.
The AER disagrees with the cable availability modelling inputs as they were calculated from historical
outage data which includes “planned corrective” cable outages as well as “breakdown” ones. The issue
is partly related to the categorisation of outages. Some “planned corrective” outages are only planned in
the sense that they are not automatic outages due to faults– they are arranged at very short notice to
avoid imminent faults, further damage and/or manage oil leaks. Based on a further review of outage
data, Ausgrid has estimated that about 40% of these planned outages needed a quick response for
these reasons. It is therefore incorrect to exclude all planned corrective outages from the availability
calculation.
There is also a limit on how many outages can be planned for shoulder periods. Currently, it is the
longer planned outages, such as those with longer recall times, which are scheduled for outside peak
periods. Review of data from September to mid-October 2017 shows that there were at least two, and
up to four planned outages at any one time across the group of cables in the PSF area. This outage
congestion makes it impractical to move all nominally discretionary outages to the shoulder period.
The AER also presented an alternative view regarding the use of a weighted average to calculate the
average mean time to repair (MTTR) of cable faults. We did not apply this approach during the initial
analysis due to data availability. Further review and data consolidation has now allowed us to apply it.
Even if 60% of planned corrective outages were moved to a shoulder period and the alternatively
derived MTTR values were applied, sensitivity analysis shows that the optimal timing of PSF does not
change.

TRANSGRID REVISED REVENUE PROPOSAL | 2018/19-2022/23 4
Page 59 of 158
Cable ratings
The AER concluded that PSF analysis should have
assumed that cables could use emergency ratings during
faults (increasing supply capacity when most needed).
The modelling did assume “emergency cyclic ratings”
whenever this was technically feasible. That is,
emergency cyclic ratings were applied if:
A cable was in a trench by itself, or
A cable was adjacent to another which was
assumed to be out of service.
This resulted in the use of emergency cyclic ratings on
22 of 27 cables covered by the analysis, with an average
capacity increase of 16%.
The suggested alternative −applying emergency ratings to all situations − would be neither prudent (as
it increases the likelihood of a fault) nor efficient (as higher temperatures accelerate cable degradation).
The AER’s conclusion that the use of emergency ratings would move the need for PSF beyond 2023 is
neither technically feasible, nor based on an accurate understanding of our modelling. It would not be
prudent, as it would require cables to be operated outside the parameters advised by the
manufacturers.
Value of Customer Reliability
The RIT-T analysis conducted for the Powering Sydney’s Future (PSF) project used VCRs of $90/kWh
for customers in the Inner Sydney and $170/kWh for CBD customers. These were based on analysis by
HoustonKemp of earlier VCR studies. The AER considers these to be too high.
The values were used to take into account the nature of the disruptions to supply that may occur, and
accurately reflect the costs imposed on the particular customers affected. In the case of PSF and the
Inner Sydney and CBD network:
Outages of fluid-filled cables could be prolonged
High value commercial loads are located in the Inner Sydney and CBD area and major transport
networks run through it.
Based on this, TransGrid and Ausgrid concluded for the PSF RIT-T:
AEMO’s standard VCR estimates were not appropriate
A higher VCR was appropriate for the CBD compared to the rest of Inner Sydney although the
value chosen was higher than that defined by IPART for the NSW transmission reliability
standards.
We acknowledge that consistency with the IPART VCR values is desirable so we have changed the
PSF analysis to reflect this. A central VCR estimate of $90/kWh is used for customers in both the CBD
and Inner Sydney. As shown in the sensitivity analysis in the following section, this does not impact on
the timing of the project need.
Sensitivity analysis
The Project Assessment Draft Report (PADR) for the RIT-T identified Option 7 as the “preferred” option
– an efficient solution across different scenarios which also accounted for external community impacts.

CAPITAL EXPENDITURE | 2018/19-2022/23 4
Page 60 of 158
The option envisaged the use of non-network solutions from 2018/19 to 2021/22 with two new 330kV
cables installed by 2022/23.
A range of further sensitivities were undertaken, testing if the “trigger year” moved in response to
changes in: discount rates (pink/purple), load growth (blue), capital costs (red) and VCR (orange/brown)
and an extended life for Cable 41 (black). Results are shown in Figure 4.10.
Figure 4.10: Option 7 trigger year for various sensitivities
The conclusion was that the trigger year for this option was 2022/23 in a majority of scenarios.
Using significantly lower VCRs or a discount rate of 10% would extend the commissioning year to the
next period, although construction would still need to begin in the 2018/19 to 2022/23 period. These are
relatively adverse assumptions that depart from those normally applied. Only under the low load growth
scenario would the trigger year be late enough for construction to begin after 2022/23.28
This is
considered very unlikely in light of the latest forecast information and spot loads identified above.
4.4.5 Updated proposal for PSF
Given the information presented above, it is our view that:
The need for PSF is demonstrated and the assumptions used in the economic analysis are
reasonable (including that the most recent AEMO demand forecasts provided further support)
The project is strongly supported by customers and stakeholders and this has been clear from
consultation throughout the RIT-T process.
Analysis for the RIT-T process showed that several options have similar NPVs. In the PADR, Option 7
was identified as “preferred” after taking into account feedback on minimising community disruption with
a single stage project.
However, we also acknowledge the valid concerns of the AER and Consumer Challenge Panel (CCP)
relating to future uncertainty. As a result, we reviewed the PSF options to consider the appropriate
balance between minimising community disruption, having a lower initial capital cost and retaining
28 The “low load growth” demand forecast is very unlikely. It would require, for example, that the under-construction WestConnex and
Sydney Metro are stopped.
2021/22 2022/23 2023/24 2024/25 2025/26 2026/27 2027/28
Option 7 trigger year for sensitivity analysis Central results
High load growth
Low discount rate (3.48%)
High VCR (120%)
Low capital costs (75%)
High capital costs (125%)
$90/kWh VCR
Cable 41 with a 20 year life
High discount rate (8.78%)
10% discount rate
Low VCR (AEMO)
VCR: $90/kWh CBD, $28.7/kWh metro
Low load growth / no new spot loads

TRANSGRID REVISED REVENUE PROPOSAL | 2018/19-2022/23 4
Page 61 of 158
optionality in the face of uncertainty. Following this, we consulted further with consumers, transmission
customers, the AER and CCP and found there was broad support for a two-stage option with a lower
initial capital cost and optionality.
We are therefore proposing a two-stage cable option, with the first cable being commissioned in the
2018/19 to 2022/23 regulatory period, following a period of demand management.
Proposed two-stage option
The proposed two-stage option is based upon Option 2A in the RIT-T analysis but with an additional
year of deferral using demand management. The option includes:
A combination of various non-network solutions for four years, managing the risk of unserved
energy before the first cable is commissioned in 2022/23
Operating TransGrid’s Cable 41 at 132 kV, installing two 330 kV cables in separate stages
Decommissioning Ausgrid cables in two stages.
Analysis indicates that the economic timing of Option 2A would be 2021/22, following only three years
of demand management29
. However, we propose to maintain the original timing of PSF, with four years
of demand management before the first stage of the network option commissions ahead of summer
2022/23.
The expectation is that this will contribute to the development and maturing of the demand
management market and lead to lower cost contract prices. These are important factors in realising the
value of the optionality in this two-stage cable option. Delaying the second cable due to (say) a lower
demand forecast is clearly more viable if DM costs are lower and the providers have a demonstrated
track record of delivering.
The two-stage option will have a higher community impact with a second period of construction-related
road congestion and noise later in the next decade. We undertake to minimise this impact by laying
both sets of ducts in the same trench during the initial phase, carefully selecting the location of joint
bays and considering similar design options during the first stage.
Network support costs
As noted above, demand management is a critical component of the Powering Sydney’s Future project.
The resulting network support cost forecast has been developed as a result of market sounding
throughout the RIT-T process and engagement with the proponents. The estimated costs which have
been included in the Maximum Allowed Revenue calculation are shown in Table 4.5.
Table 4.5: PSF Network support costs forecast ($m June 18)
PSF Network Support costs ($m) 2018–19 2019-20 2020–21 2021–22 2022–23 Total
Forecast used in MAR calculation 0.7 2.55 5.83 10.04 - 19.1
TransGrid will treat this as a network support pass through under Clause 6A.7.2 of the Rules.
29 This is because the lower capital cost has a lower deferral value which suggests demand management is less economic in the
fourth year (2021/22).

CAPITAL EXPENDITURE | 2018/19-2022/23 4
Page 62 of 158
Interaction with Ausgrid’s forecast
Ausgrid has confirmed that its upcoming revenue proposal will not include replacement capital
expenditure, or material operating expenditure to manage the condition of cables scheduled for
retirement beyond the anticipated commissioning date of Powering Sydney's Future. This is on the
understanding that the most cost-effective solution to address the asset condition problems is via the
Powering Sydney’s Future project. Ausgrid has reserved the position to change this in its revised
proposal, if Powering Sydney’s Future is deferred or not accepted by the AER.
Revised forecast for the two-stage option
An updated forecast for this option is shown in Table 4.6. It does not include the expenditure for
installing the second cable which will be considered in the subsequent regulatory period.
Table 4.6: Revised capital expenditure forecast for Powering Sydney's Future ($m June 18)
Powering Sydney's
Future
2018–19 2019-20 2020–21 2021–22 2022–23 Total
Original proposal 1.1 15.9 32.6 133.7 147.6 330.9
Revised proposal 27.0 25.6 57.5 116.7 25.4 252.3
Difference 26.0 9.8 24.8 -17.0 -122.2 -78.6
4.5 Replacement expenditure (including Security & Compliance)
The draft decision recommends a $203.9 million cut to the forecast replacement expenditure. An
overview of the reduction, the AER’s reasons and our response is shown in Table 4.7.
Table 4.7: Summary of response to draft decision on replacement expenditure
AER expenditure reduction and reasons TransGrid’s response
Asset replacement program
Reduction of $191 million (-20%)
The Risk Model is a work in progress
TransGrid’s assumptions are conservative
Risks are overstated, therefore the forecast
is overstated.
Optimal timing is not demonstrated
The $191 million reduction relies upon a range of
analytical errors and misunderstandings
The AER was notified of many of the errors its draft
decision was based upon in August.
The Risk Model is robust and reflects accepted asset
management practice. The model is similar to the
approach accepted by Ofgem in the UK and ElectraNet
in South Australia.
The assumptions are indeed conservative and bias the
model outputs against investment.

TRANSGRID REVISED REVENUE PROPOSAL | 2018/19-2022/23 4
Page 63 of 158
AER expenditure reduction and reasons TransGrid’s response
Regulatory Investment Tests for
Transmission (RIT-T) costs
Reduction of $2.8 million (-100%)
Expenditure is not required as it covers what
a prudent business would already be doing.
The AER is not correct to disallow expenditure to
meet a new regulatory requirement
Undertaking RIT-Ts for replacement expenditure is a
new regulatory requirement as of September 2017.
Significant costs arise from this Rule change and
TransGrid expects to do in excess of 50 RIT-Ts in the
period.
In absence of a regulatory requirement, a prudent
business would not choose to undertake a process
which adds substantial cost and almost a year to the
investment pathway.
“Tools, plant and compliance costs”
Reduction of $10.1 million (-100%)
This is duplicated within the “Non-network”
capital expenditure allowance (within a
“heavy plant” category).
The AER has confused this category with another
part of the forecast.
This is not a duplicate of the “heavy plant” forecast – it
is for tools and test equipment related to network asset
work.
These are discussed in turn following a short summary of our risk assessment and investment analysis
approaches.
4.5.1 Recap of TransGrid’s robust approach
Overview
TransGrid’s robust approach to replacement forecasting is summarised in Figure 4.11. It is evolving, as
any good asset management framework should be but it is not a ‘work in progress’.

CAPITAL EXPENDITURE | 2018/19-2022/23 4
Page 64 of 158
Figure 4.11: Replacement Expenditure Planning Process
The key aspects of this process are:
Risk assessment methodology
Uses externally verifiable parameters to calculate asset health and failure consequences30
Assesses and analyses asset condition to determine remaining life and probability of failure
Applies a worst case asset failure consequence and significantly moderates this down to reflect
the likely consequence in the particular circumstances
Identifies safety and compliance obligations with a linkage to key enterprise risks
Investment analysis inputs are biased against investment to ensure efficient timing (eg, a 10%
discount rate). Only NPV positive (or compliance) projects proceed
“Top down” portfolio checks
Review of changes in expenditure levels including comparisons with the content and quantum
of previous investment
Alignment with long term Repex modelling
Investment modelling selects the most efficient option.
Sensitivity analysis around key inputs.
Calculation of risk costs
A fundamental part of the approach is calculating the “risk costs”. These are the monetised impacts of
the reliability, safety, environmental and other risks.
30 For example, AEMO’s VCR, Federal Government Guidelines and Royal Commission Findings - Refer to Network Asset Health
Framework and Network Asset Criticality Framework.

TRANSGRID REVISED REVENUE PROPOSAL | 2018/19-2022/23 4
Page 65 of 158
The method is structured and follows an accepted approach for calculating risk impacts. Figure 4.12
shows the generic calculation model for every risk cost assessment.31
Figure 4.12: Quantification of risk
Risk costs are calculated based on the Probability of a Failure (PoF), the Consequence of Failure (CoF)
and the corresponding Likelihood of consequence (LoC) in the particular situation.
It is important to note that consequence costs in TransGrid’s risk assessment are reduced depending
on the chance they will occur in those circumstances. The high consequence costs which have been
highlighted by the EMCa and the AER are heavily moderated when they are applied in the modelling.
Probability of Failure
Each failure mode that could result in a consequential impact is considered. For replacement planning,
only ‘life ending’ failures are ultimately used to calculate the risk cost32
. PoF is calculated for each
failure mode considering “conditional age” (chronological age adjusted by asset health); failure and
defect history and benchmarking studies. For “wear out” failures a Weibull curve may be fitted and for
random failures a static failure rate may be used.
Consequence of Failure (CoF) and Likelihood of Consequence (LoC)
TransGrid uses a moderated “worst case” consequence to value risk. This is an accepted approach in
risk management with the benefit of ensuring that low probability but high consequence events are not
dismissed or overlooked. It also excludes the risk costs of lower consequence but potentially more likely
events (as shown in the greyed out ‘risk cost’ boxes in Figure 4.12). This calculated risk is lower than it
would be if these were included.
31 Note that the figure does not show other consequence categories which contribute much less to risk costs. These include estimates
of legal costs, for example. 32
Other, lower impact failures are not considered in the risk consequences, regardless of the expected frequency of these. This means that calculated risk costs are lower than they would otherwise be.

CAPITAL EXPENDITURE | 2018/19-2022/23 4
Page 66 of 158
Use of a “worst case” LoC does not mean that
we are overly conservative nor does it mean
that risk is overstated. When “worst case” CoF
is multiplied by an appropriately small LoC it is
realistic and credible.
The LoC is the likelihood of this ‘worst case’
consequence occurring in the particular
situation, if the relevant failure occurs. LoC
generally reduces the CoF significantly, as the
worst case consequence is unlikely to occur
each time an asset failure occurs.
As noted in the example in section 4.2Error!
Reference source not found., the average
bushfire LoC applied to transmission lines is
0.7% to account for local factors such as
vegetation, terrain, land use and weather.
When applied, this LoC reduces the bushfire
consequence cost of $400m by 99.3% to $2.9 million, on average.
Figure 4.13 shows a map of moderated bushfire consequences for our transmission lines. It is
developed based on an assessment of bushfire risk factors in specific places.
Figure 4.13: Bushfire Consequence Map
Examples of risk cost moderation
The following examples show how high consequence risk costs are significantly moderated by
Likelihood of Consequence factors.
Safety example: TransGrid uses a Value of Statistical Life of $10 million for certain high consequence
safety risks, based on various relevant Work Health and Safety valuation studies. When this is used to
calculate a risk cost, it is moderated based on the likelihood that the consequence will occur in the
event of the relevant asset failure. Table 4.8 shows how this risk cost is moderated by LoC.

TRANSGRID REVISED REVENUE PROPOSAL | 2018/19-2022/23 4
Page 67 of 158
Table 4.8: Moderation of the safety risk consequence
Moderation factor (LoC) Source of LoC
Substations: likelihood that staff are adjacent to equipment in the event of a
failure = 4% on average (1% to 10%, depending on site)
After moderation, the $10 million consequence reduces to $400,000 on
average
Maintenance records
(excluding unplanned
and project work)
NB: This underestimates
actual time
Lines: likelihood that staff are working on a transmission line in the event of a
failure = 2.9% on average (for the line)
After moderation, the $10 million consequence reduces to $290,000 per
line on average
Routine maintenance
records with small
addition for general
public (high risk spans
only)33
To calculate the risk cost, the moderated consequence cost still has to be multiplied by the relevant
Probability of Failure (of the event which would lead to the particular consequence).
Reliability example: For reliability risks, TransGrid calculates the consequence cost using a Value of
Consumer Reliability (VCR). 34
The consequence cost is a function of VCR, the load subject to the fault
(MW) and the repair time (hours). It also takes account of load restoration.
An example of moderation of the reliability consequence of a transformer failure is shown in Table 4.9.
Table 4.9: Moderation of the reliability risk consequence
Moderation factor (LoC) Source of LoC
Transformers – A ‘redundancy factor’ is applied, based on how many parallel
failures are required (and the likelihood of this) before load is lost.
For the more common N-1 scenario (ie, one transformer failure can be tolerated)
the redundancy factor is 0.4% (based on historical unplanned unavailability
rates for transformers).
The relevant reliability consequence cost is only incurred once for every
250 transformer failures.
For an N-2 scenario the redundancy factor is 0.0016% {(0.4%)2} - the
consequence is incurred once for every 62,500 transformer failures.
TG network analysis
As for the transmission lines example, to calculate the full risk cost, the moderated consequence cost
still has to be multiplied by the relevant Probability of Failure (of the event which would lead to the
particular consequence).
Special case – testing if network safety obligations are met
TransGrid is required to comply with the Electricity Supply (Safety and Network Management)
Regulation 2014. This requires us to take all reasonable steps to ensure the following risks are
eliminated, or if that is not reasonably practicable, reduced ‘as low as reasonably practicable’ (ALARP):
33 These are identified in TransGrid’s Public Electricity Safety Awareness Plan (PESA)
34 AEMO’s VCR value published in ‘Value of Customer Reliability (VCR) Review’, September 2014 is escalated to the relevant year
($38.35/kWh)

CAPITAL EXPENDITURE | 2018/19-2022/23 4
Page 68 of 158
The safety of the public and persons working on the network
The protection of property and the environment
Safety aspects arising from the protection of the environment (including bushfire)
Safety aspects arising from the loss of electricity supply.
In the context of investment decisions “ALARP” is tested through the use of disproportionality factors
which increase the risk cost consequence in risk analysis. These increase risk consequence costs to
just below the level which the community, government and law would consider risk reduction
expenditure to be ‘grossly disproportionate’.35
The values we use (in Table 4.10) were determined
through a review of practises and legal interpretations across multiple industries, with particular
reference to the work of the UK Health and Safety Executive.
Table 4.10: TransGrid’s ALARP multipliers
Risk Consequence Severity Disproportionality multiplier
Safety Potential for single fatality contained within TransGrid
site (eg, explosive failure of substation equipment) 3
Safety
Potential for multiple fatalities outside of a TransGrid
controlled area (eg, conductor drop on transmission
line easement)
6
Bushfire Potential for multiple fatalities and extensive property
damage 6
Investment analysis
The risk costs are used alongside other inputs in the investment analysis steps.
We note that the AER and EMCa consider that our approach is conservative and is likely to overstate
the capital expenditure forecast. However, there are a number of controls built into the investment
analysis approach which significantly limit this possibility:
The list of possible investments is limited
Investment analysis is only undertaken where condition reports or other analysis suggests that
action might be required
The analysis approach and overall assumptions are biased against finding projects to be
economically viable
Investment analysis uses a 10% (nominal) discount rate. As a result, the present value of
“avoided risk benefits” in future years is reduced more than the capital expenditure is (as it
occurs earlier)
The risk values used in the NPV analysis are not escalated. As the discount rate is expressed
in nominal terms, this compounds the over-discounting of any benefits
Program investment analysis assumes that the benefits of avoided risk only begin to accrue
when the full program is complete.
35 For example, these levels are expressed in Regulation and Court recommendations

TRANSGRID REVISED REVENUE PROPOSAL | 2018/19-2022/23 4
Page 69 of 158
These significant constraints on the size of the “bottom-up” investment forecast have not been
recognised by EMCa or the AER.
4.5.2 Asset replacement program reductions
Concerns about AER’s methods and understanding of our approach
The AER summarises its conclusion on our replacement expenditure as follows:
We have found that TransGrid's:
Proposed unit costs are reasonable; however,
Proposed scope of works, and therefore the proposed capex, are overstated.
We have formed this view on the basis of the systemic issues that EMCa identified in
TransGrid's proposal. It appears that TransGrid has systemically overstated:
The risks associated with its assets; and therefore
Prudent and efficient capex.
We have placed significant weight on the outcomes of EMCa's technical review of
TransGrid's governance, asset risk framework, and forecasting methodologies and in its review of
TransGrid's major repex programs. As such, we consider TransGrid's proposed repex is materially
biased upwards. (Draft Decision 6-55) [Added emphasis]
Our interpretation of this decision process is that:
EMCa concluded that we systemically overstate asset risks therefore capital expenditure forecast is
overstated
The AER relied heavily on EMCa’s findings to reduce replacement expenditure by $200 million.
As noted throughout this revised proposal we are concerned that the conclusions in the draft decision
are not supported. The AER ‘placed significant weight’ on EMCa’s report yet was aware it contained:
Factual errors - including examples where risk values have been misread from a spreadsheet and
presented as “evidence” of a systemic bias
Fundamental misunderstandings of our actual asset management framework and forecasting
approaches – including examples concluding that our model assumes events are a factor of a
thousand more likely than we have modelled.
Despite TransGrid identifying these errors and misunderstandings in writing, the AER relied upon the
EMCa report and incorporated some of the same errors in its draft decision.
Other conclusions in the draft decision are supported by analysis and assertions which do not reflect a
strong understanding of transmission network planning, TNSP obligations or the context in which we
operate. In one example, the AER has suggested that the actual failure rate for a specific transmission
line should be replaced by the system-wide average transformer failure rate.

CAPITAL EXPENDITURE | 2018/19-2022/23 4
Page 70 of 158
Replacement expenditure cut relies on errors and misunderstandings
Figure 4.14 illustrates our view that the main “building blocks” of the AER’s $200m reduction in
replacement expenditure are poorly supported.
Figure 4.14: Basis of AER conclusions on replacement expenditure
The sections below provide details on the errors and misunderstandings which support each of the five
“building blocks” of the replacement conclusions.
1. Approach is a work in progress
Our approach, summarised in section 4.5.1, is not a work in progress (Draft Decision 6-66) and the
AER and EMCa’s rationale for concluding this is not valid. This conclusion appears to disregard the
detailed information provided throughout this process.
An example of EMCa’s misunderstanding of our process and the risk cost analysis was its creation of
an incorrect chart showing that “$200m investment has limited benefit”. As detailed in Section 4.2.3, this
was incorrectly constructed, using inapplicable project data and was not interpreted correctly.
From the extent and nature of the errors and misunderstandings in EMCa’s report and the draft
decision, it is our view that our approach has not been well understood. As a result the conclusion
cannot credibly be reached.
TransGrid’s view: this conclusion cannot reasonably be drawn.
2. TransGrid is ‘overly risk averse’
On the basis of errors and misunderstandings, the draft decision has concluded that TransGrid is:

TRANSGRID REVISED REVENUE PROPOSAL | 2018/19-2022/23 4
Page 71 of 158
overly risk averse, such that prudent and efficient capital expenditure is likely to be overstated. (Draft
Decision 6-3)
It has been based on identifying high value risk cost examples in our models and highlighting these
outside of the context of the full risk analysis to conclude that we over-state risks. Many examples
indicate that our approach and modelling has been misunderstood.
TransGrid's risk cost modelling assumes that it is exposed to $1.6 trillion of risk per annum. (Draft
Decision 6-65)
The highlighted risk value was taken incorrectly from a spreadsheet and increased by a factor of 1000.
It is reasonable to assume that such a high risk value should have prompted further investigation - $1.6
trillion is close to Australia’s annual GDP. We notified the AER of EMCa’s error but it was used to
conclude that our process results in assessed risks which are too high (more details in example in
section 4.3.2).
EMCa found…inadequate justification and overstated project risk cost parameter assumptions…
(includes probability of failure, likelihood that a hazardous event will lead to a consequence and the
cost consequence of asset failures). (Draft Decision 6-70)
It is our view that there are too many examples of EMCa misunderstanding our process for it to
reasonably make this conclusion. For example, in relation to its review of substation civil structures
projects, EMCa interpreted a 2% Likelihood of Consequence incorrectly:
TransGrid allocate a 2% LoC, based on its assessment that the whole substation will lose this level
of load for this period of time, which is comparable to a 1 in 50 years event. (EMCa p70)
This conclusion misrepresents LoC – it is not the combined probability of the event occurring and the
consequence being realised. It is the probability that the consequence will occur, following a
catastrophic failure.
In this case, the PoF was 1% - one failure is expected every 100 years. The 2% LoC means that, if this
event happened, there is a one in fifty chance of the consequence occurring. The likelihood of failure
and complete load loss is therefore: 1% (PoF) x 2% (LoC) = 0.02% or 1 in 5,000 years (not 1 in 50
years).
TransGrid’s view: there are too many examples of EMCa misunderstanding our process for this
conclusion to be reasonably reached.
Aurecon Report used selectively
To support its conclusion that we materially over-state risk, the AER quoted an Aurecon assurance report*.
Aurecon commented that:
… TransGrid has gone to great lengths to provide credible referenced sources to validate potential CoF values,
albeit erring towards worst-case scenarios as supported by one of the key elements of the NACF, namely a
likelihood based element to assess the likelihood of the worst-case consequence occurring. Whilst the
consequence magnitude should not be underestimated (or overestimated) a realistic estimate is deemed
advisable. When the stakes are high, as is the case with several key hazardous events, a range of techniques
as well as industry expertise is suggested to arrive at a cost of risk estimate that is credible and realistic [AER
emphasis].
… indicates that TransGrid’s risk analysis is biased towards worst-case hazardous events and worst-case
consequences such that it is likely to materially overstate network risks and therefore proposed capex.’ Draft
Decision (p 6-69)
Aurecon actually concluded:
…Aurecon believes that TransGrid’s framework for the preparation of its capital expenditure plan for the 18/19
to 22/23 regulatory period will result in a CAPEX forecast that is in accordance with good electricity utility
practice and will meet the capital expenditure criteria... [Added emphasis]
*Aurecon, Independent Review of TransGrid's CAPEX Plan, Final Report, 25 January 2017

CAPITAL EXPENDITURE | 2018/19-2022/23 4
Page 72 of 158
3. Bottom up forecast overstated
The draft decision has concluded that the bottom up forecast is overstated because:
Individual project benefits are overstated
There is no portfolio optimisation process.
These are addressed in turn.
Firstly, the AER is incorrect to state that project cost estimates are derived from the risk costs:
Our findings on TransGrid's quantification of reliability, safety and environment (bushfire) risks
used to derive project cost estimates largely explain why we are not satisfied that TransGrid's
proposed total forecast capex meets the capex criteria. (Draft Decision 6-10) [Added emphasis]
Risk costs are used to identify if there will be a net benefit via a reduction in risk, if a project is
implemented. Project costs are derived separately based on recent project costs.
Even if project costs were derived from the risk costs, many examples of ‘overstated benefits’ in the
draft decision are based on incorrect analysis. Two examples are provided below.
..the outage rate for the line (94M) at 49 per cent is higher than the average line outage rate of 17
per cent across its network… potential to overstate the level of reliability risk. This may have the
effect of overstating the benefits… (Draft Decision 6-141)
This conclusion is based on incorrect analysis. The 17 per cent average outage rate is the system-wide
value for transformers (not lines). Our analysis has correctly used the actual outage rate for a 132kV
transmission line.
In another example, TransGrid’s calculation of a reliability consequence has not been understood.
TransGrid apply a $/hour assumption to calculate the reliability consequence of load at risk for loss
of a major substation element (ie, line, transformer etc.). EMCa noted that it is not clear how the
analysis considers the moderation of the “effective” outage duration by load restoration activities and
is likely to overstate the reliability impact, and therefore results in a forecast that does not reflect a
prudent and efficient level of capex. (Draft Decision 6-73)
The effect of load restoration activities has been accounted for. This is done by determining two
separate values of load at risk. An initial (higher) value from the time of the incident until load
restoration occurs and, a lower value for the period after load restoration until the repair of the failed
equipment.

TRANSGRID REVISED REVENUE PROPOSAL | 2018/19-2022/23 4
Page 73 of 158
The overall reliability consequence cost is an average of the two “load at risk” values, as shown in
Figure 4.15.
Figure 4.15: Risk cost based on load before and after restoration begins
The conclusion that the reliability is overstated is based on EMCa’s lack of understanding of the
approach, rather than finding an actual problem with it.
The AER considered that our:
capital investment framework does not appear to include an effective portfolio optimisation process
(Draft Decision 6-13).
Our forecast does take account of the portfolio optimisation process. Firstly, project cost inputs are
based on past actual investments, which include the impact of portfolio optimisation. Also, portfolio
impacts are considered during the needs identification and options evaluation process. Issues which
interact are considered together and optimised where appropriate. An example of this was considering
the renewal of 22kV primary plant at Broken Hill when secondary systems replacement options were
being assessed.
TransGrid’s view: the conclusion that the bottom up forecast is overstated is not supported by the
analysis.
4. Project timing is not justified
The AER considers that TransGrid does not target its efforts managing risk.
an absence of evidence that TransGrid has taken a targeted approach to managing any identified
risks (Draft Decision 6-72)
This is not supported by evidence. Our risk management process aims to identify risks and determines
how to address only those which are critical for compliance or which have the greatest net benefit.
Investment analysis is only undertaken where a potential need has been identified in asset condition
information or a similar indicator. This results in a forecast which is targeted at the highest net benefit in
terms of risk reduction. This is evident in:
Transmission line programs which target only those structures and line components which have an
identified risk (rather than complete line rebuilds)
Undertaking substation asset programs rather than complete substation replacement projects
0
1,000
2,000
3,000
4,000
5,000
6,000
0 10 20 30 40 50
Reli
ab
ilit
y R
isk (
$/h
r)
Time (hrs)
Reliability risk cost - calculation of average
Actual(Instantaneous) Risk
Effective (Averaged)Risk
Risk cost before
load restoration
Risk cost after load
restoration but before repair

CAPITAL EXPENDITURE | 2018/19-2022/23 4
Page 74 of 158
Wood pole replacement program is targeted
The AER stated:
EMCa observed that TransGrid appears to be
replacing all wooden poles…It is not clear how to
us, how entire pole replacement and the
proposed strategy of targeted pole replacement
based on condition is evidence of uniform
application of its asset management approach
(Draft Decision 6-76)
EMCa had access to detailed needs statements
and options evaluation reports (OERs) so it is
unclear how this conclusion could be reached.
OER 1558 “132kV TL Wood Pole Replacement”
identifies the number of planned pole
replacements per line. Four lines have less than
ten pole replacements planned and Line 97A has
only two.
EMCa’s conclusion that we are “replacing all
wooden poles” is therefore not credible.
Development of secondary system relay
replacement programs where feasible (as
opposed to wider secondary system
replacements).
As already noted, the investment analysis is
biased against capital expenditure. A 10%
discount rate is used and the model assumes that
benefits only accrue when a program ends.
Despite this, each replacement project in the
forecast (excluding compliance projects) has a
positive net benefit. This indicates that project
timing is optimised.
However, EMCa and the AER consider that timing
of the replacement program has not been
optimised:
The economically optimum project
implementation time is when the annual risk
cost exceeds the annualised cost of
avoiding/mitigating the risk (Draft Decision 6-75)
We agree with this statement. It is not inconsistent with our approach of only including replacement
projects with a positive net benefit. This similarity of the two approaches is illustrated in the Figure 4.16.
The point at which the “annual risk cost exceeds the annualised cost of avoiding/mitigating the risk” is
the point which maximises the net benefit of the investment.
Figure 4.16: Illustration – NPV optimisation
To validate the timing of projects in the forecast, we calculated the change in benefits with a deferral of
one year. In every case, the present value of the investment benefit reduces with a one year delay. We
also compared the annual risk cost against the annualised cost of mitigating the risk – in all cases
0%
20%
40%
60%
80%
100%
120%
$0
$20
$40
$60
$80
$100
$120
1 2 3 4 5 6
Pro
ject
NP
V (%
)
An
nu
ali
sed
co
st
Year
Illustration: NPV optimisation Vs comparing annualised cost and risk
Annualised project cost ($) Risk ($) NPV of project

TRANSGRID REVISED REVENUE PROPOSAL | 2018/19-2022/23 4
Page 75 of 158
(except for compliance and “ALARP” driven investments), AER / EMCa’s test of the ‘economically
optimum project implementation time’ was passed.
TransGrid’s view: timing is a key consideration in TransGrid’s process and analysis and we have
demonstrated that the net benefits reduce if replacements programs are deferred.
5. Reduced repex forecast closer to “trend”
The AER does not consider that the proposed increase in replacement expenditure (compared to the
current period level) has been supported by the risk assessment practice. Given the number of errors
and extent of misunderstanding of our approach, this is not a reasonable conclusion.
It also suggests that the other supporting information has not been considered appropriately. A range of
information we provided shows that asset replacement needs are changing. Figure 4.17 shows that,
replacement needs for some asset types are lower over the next period.
Figure 4.17: Changes in replacement volumes
In the case of disconnectors, it is the application of our risk analysis which has shown that this decrease
is prudent. While proposed replacement rates are significantly lower than the expected long term
average the analysis gives confidence that this forecast is appropriate. A simple “trend” method would
not identify this change.
For some assets, an increase in replacement expenditure is forecast over the 2018/19 to 2022/23
period and this is supported by the underlying age, performance and condition information which has
been provided. The example in Figure 4.18 shows age and condition trends for transmission line
structures.
141
76 73 66
139
63
19
50
0
20
40
60
80
100
120
140
160
CTs VTs Disconnectors Circuit Breakers
Av
era
ge n
o.
of
assets
rep
laced
/ p
lan
ned
fo
r
rep
lacem
en
t
Average annual replacement quantities - 2013/14 to 2017/18 Vs 2018/19 to 2022/23
RP1 Average
RP2 Average
74%
decrease

CAPITAL EXPENDITURE | 2018/19-2022/23 4
Page 76 of 158
Figure 4.18: Transmission line structures; lifetime and condition issue trends
In this example, the increase in identified issues is partly due to the implementation of a new inspection
regime which is aimed at collecting more detailed asset condition information to support better decision-
making.36
However, this more granular data collection is uncovering a higher number of issues which
need to be dealt with relatively soon. For example, between 2015/16 and 2016/17 there was more than
a threefold increase in transmission lines issues to be dealt with within a year.37
The data demonstrates
an increase in condition related issues in a manner which aligns with what could be expected from the
age profile.
It seems reasonable to conclude that the types of information highlighted in Figure 4.17 and Figure 4.18
above would have provided some indication of whether an increase in asset replacement was justified.
However, the AER concluded that an increase in replacement expenditure was not supported. This was
based on an incorrect understanding of the risk analysis and without referencing the underlying asset
information. It reduced the replacement forecast back towards a historical average,
our reduction of 20 per cent to TransGrid's major repex programs forecast will provide a level of
repex that is consistent…[with]…the 2015-18 regulatory control period. (Draft Decision 6-56)
A TNSP would be negligent to forecast efficient expenditure solely based on historical spend and
without considering a range of indicators on the condition of the assets. A reliance on trend for
transmission asset replacement is inadequate, as the AER itself notes:
Transmission, however, is characterised by fewer assets that are high value in nature, and are
replaced in groups, leading to lumpy expenditure over time. (Draft Decision 6-34)
36 For example climbing inspections on all structures (poles and towers) are undertaken rather than ground based inspections.
37 The highest increases were in category P4 (respond within 12 months) up to 1896 from 540 in 2015/16; and in category P5
(respond at next outage/maintenance) up from 567 to 2779 in 2015/16.
-
500
1,000
1,500
2,000
2,500
3,000
3,500
4,000
4,500
5,000
2008/09 2009/10 2010/11 2011/12 2012/13 2013/14 2014/15 2015/16 2016/17
Co
un
t o
f str
uctu
res a
nd
defe
cts
TL structures approaching 'end of life' and annual defects recorded
Number of structuresexceeding 85%nominal life
Number of TLdefects raised

TRANSGRID REVISED REVENUE PROPOSAL | 2018/19-2022/23 4
Page 77 of 158
We disagree that our approach does not include a “top down” portfolio review. The AER disregarded
the version of the ‘repex model’ which was provided. Modifications we made to make this more relevant
for looking forward are not considered valid. Output showed that our proposed increase in replacement
expenditure did not halt the increase in average asset class ages.
TransGrid’s view: a 20% reduction in replacement expenditure does not have a basis. It is based
on a backward looking trend analysis and does not adequately consider future asset condition and
risks. It relies on a risk methodology review which included many errors
4.5.3 Addressing specific AER comments
Incentive costs removed
As identified by EMCa, benefits associated with increased incentive scheme revenue were erroneously
included in the analysis for two projects. We accept these findings and have adjusted the analysis to
exclude these benefits. This updated analysis led to a reduction in replacement expenditure of $0.9
million for the VT Renewal Program.
Note, more recent condition information has identified the need to replace additional Haefely type units
which has moderately increased the program costs. The net impact of these changes is a reduction
$0.23 million.
Safety consequences – legal and legislative costs input
The AER noted that the modelling for transmission line portfolio applied a total safety consequence cost
of $20 million. This analysis correctly used the value of statistical life (VoSL) of $10 million. However,
the addition of legal and legislative costs incorrectly brought the total to $20 million; this total should
have been $11 million. The correction has been made, however it results in no change to the required
investments in the transmission line portfolio.
Review of ALARP methodology
While EMCa did not dispute the use of the ALARP methodology, it considered that the cost of capital
should be applied when annualising the cost of the investment. TransGrid has revised the ALARP
methodology to include the cost of capital (using 6.75%). This correction has led to the reduction in
scope of two projects and a reduction in the replacement expenditure of $0.95 million.
Reduced scope - substation security (CCTV) and noise compliance
Following review of the EMCa report and AER draft determination, revised analysis was carried out on
the following needs:
CCTV System Renewal (1398)
Substation Noise Non Compliance Program (1454).
TransGrid has accepted some of the AER’s findings and modified the CCTV program (relating to
thermal vision). This has reduced the replacement expenditure by $3.4 million.
For the Substation Noise Non Compliance Program, we re-evaluated the potential risk and risk
mitigation strategies. As a result we reduced the total number of targeted sites from six down to two.
This led to a reduction of $4.9 million.
Of the two remaining sites one has already had noise complaints and the other has an increasing noise
source (ie, 55 years old transformer) that will likely increase in noise level in the next regulatory period.

CAPITAL EXPENDITURE | 2018/19-2022/23 4
Page 78 of 158
4.5.4 Changes in the replacement forecast
Changes made to the replacement forecast but not described elsewhere in this chapter are
summarised here.
SCADA replacement project
The SCADA replacement project has been brought forward to facilitate its completion by 2020. This
deadline is driven by TransGrid’s Licence Conditions relating to cyber security and is the result of
discussions with IPART and other government agencies. Further detail was provided to the AER on 6th
July 2017.
The result is that the replacement forecast for 2018/19 to 2022/23 is reduced by $3.1 million as this
amount will now be spent in 2017/18 to accommodate the earlier commissioning date.
Project scope increases
Since January 2017 updated asset health, asset condition and cost information has become available.
As a result, the forecast for one project has increased slightly.
The cost estimate for the Transmission Line Low Spans Stage 2 project (1556) has increased after a
further assessment of the expected cost of remediation measures. This has resulted in an increase to
the forecast of $3.8 million.
Summary of replacement forecast changes
All changes made to the replacement expenditure forecast are shown in Table 4.11. Note that these are
the changes after the inflation and labour escalation updates shown in section 4.3.
Table 4.11: Changes to the replacement expenditure forecast ($m June 18)
Project need description Updated
forecast
Change from
Proposal
Reason
Yanco Sub Low 33kV Busbar
Clearance 0 -0.57 Amended ALARP methodology
Various Locations Bushing Renewal 5.47 -0.38 Amended ALARP methodology
Substation Noise Non Compliance
- Muswellbrook & Molong 5.64 -4.93 Reviewed program and removed
lower risk sites
CCTV System Renewal 7.92 -3.39 Review showed less project need
Various Locations VT Renewal
Program 17.67 -0.69
Net impact of removing incentive
benefits and adding Haefely VTs
Transmission Line Low Spans Stage 2 6.85 3.84 New information identified
increased need
SCADA replacement 12.6 -3.1
Brought forward to ensure NSW
licence compliance – some
expenditure in 2017/18
Net change -9.22

TRANSGRID REVISED REVENUE PROPOSAL | 2018/19-2022/23 4
Page 79 of 158
Consequences of the replacement expenditure cut
The replacement portfolio has been reviewed to consider the impact of the AER’s reduction. As we are
aware of risks to the community, safety and environmental (especially bushfire-related) expenditure will
be prioritised.
It is more likely therefore that the largest impacts of this expenditure reduction will be increases in:
Reliability risk (that is, supply interruptions will be more likely)
Asset lifecycle costs – there will be higher operating costs as asset failure rates increase and asset
replacement is pushed back in time.
Analysis of the replacement portfolio
demonstrates that we will not undertake
expenditure where the project costs are
lower than costs and risks avoided.
The present value of the net benefits from
the projects which might not be undertaken
is estimated at around $130 million. This is
an additional economic cost on customers
via reliability risk, higher asset lifecycle costs
and safety risks.
Table 4.12 provides some details about Secondary Systems and Substation projects which would be
unlikely to proceed if the draft decision became final.
Table 4.12: Projects unlikely to proceed under the draft decision
Investment category
and details
Projects not undertaken Impacts
Secondary Systems
22 projects, total cost $63
million
Renewals of:
8 full secondary systems
Instrument transformers
415V distribution systems
Protection relays and busbar
protection.
Unrealised benefits (NPV) of $114
million across 22 projects
Outstanding annual reliability risk
valued at $18 million
Substations
4 projects, total cost $24
million
Renewals of: reactors, bushings at
various locations, transformers.
Unrealised benefits (NPV) of $24 million
across 4 projects
Outstanding annual reliability risk
valued at $0.5 million
Higher lifecycle costs $0.75 million per
year

CAPITAL EXPENDITURE | 2018/19-2022/23 4
Page 80 of 158
4.5.5 Rejection of increased RIT-T costs
Overview
The forecast included $2.8 million to cover the cost of what was (in January 2017) expected to be a
new regulatory requirement to undertake Regulatory Investment Tests for Transmission (RIT-T) for
replacement expenditure.
AER assessment
The AER did not allow this expenditure and reduced the allowance by the full amount. It reasoned that
the expenditure covered what a prudent business would already be doing.
Response
TransGrid supports increased transparency in transmission investment decision making. However, in
absence of a regulatory requirement, a prudent business would not choose to undertake a process
which adds substantial cost and almost a year to the investment pathway. Undertaking RIT-Ts for
replacement expenditure is a completely new requirement which will cause TransGrid to incur new
costs.
Under Part 1 of the National Electricity Law, ‘7a Revenue and pricing principles’:
A regulated network service provider should be provided with a reasonable opportunity to recover at
least the efficient costs the operator incurs in — …(b) complying with a regulatory obligation or
requirement National Electricity (South Australia) Act 1996, Part 1, 7A
As a result, TransGrid considers that the draft decision is not in line with the “Revenue and pricing
principles”.
The new requirement is due to the “replacement expenditure planning arrangements” Rule which was
implemented in 2017. In implementing the Rule, the AEMC’s final rule determination recognised the
likely cost increase:
There will be some increase in regulatory burden from extending the regulatory investment tests to
replacement expenditure.38
While replacement expenditure has always been subject to economic analysis, the RIT-T process is
more onerous, requiring public consultation. For this to be meaningful, some effort is required to ensure
documentation is accessible to those consulted and to undertake consultation.
Each RIT-T will take a minimum of about nine months and there is a requirement to publish at least two
rounds of consultation documentation. As TransGrid expects to do in excess of 50 RIT-Ts in the period
this Rule change drives significant costs.
In line with the revenue proposal, we have included $2.8 million in the revised capital forecast.
4.5.6 Rejection of “tools, plant and compliance costs”
Overview
The forecast included $10.1 million for tools and test equipment related to network asset activities.
38 National Electricity Amendment (Replacement expenditure planning arrangements) Rule 2017, Determination, p70

TRANSGRID REVISED REVENUE PROPOSAL | 2018/19-2022/23 4
Page 81 of 158
AER assessment
The AER did not allow this expenditure and reduced the allowance by the full amount. It reasoned that
tools and equipment capital expenditure was already allowed for within the “Non-network” capital
expenditure allowance.
Response
The “Tools and Equipment” forecast is not duplicated in the non-network capital expenditure forecast
(which is for ICT and Motor Vehicle).
This forecast includes a range of specialised tools and test equipment such as protection testing
equipment, SF6 gas analysers, thermovision cameras, hydraulic crimping/cutting equipment and oil
degasification plant.39
It appears that the AER’s conclusion is because the “Tools and Equipment” forecast is allocated to the
same regulatory asset class category as “Motor Vehicle and Mobile Plant”, namely “Minor plant, motor
vehicles and mobile plant (2018-23)”.
TransGrid has included $10 million for Tools and Equipment capital expenditure in line with the revenue
proposal amount (adjusted for inflation).
4.5.7 Revised replacement expenditure forecast
An updated forecast for replacement expenditure is shown in Table 4.13.
Table 4.13: Revised replacement capital expenditure forecast ($m June 18)
Replacement expenditure 2018–19 2019-20 2020–21 2021–22 2022–23 Total
Original proposal 142.2 189.5 225.3 197.5 207.4 961.8
Revised proposal 158.6 194.4 213.9 184.8 185.4 937.1
Difference 16.4 4.9 -11.4 -12.7 -22.0 -24.7
In total, it is $24.7 million lower than our original proposal. This is driven by the program-specific
decreases detailed in section 4.5.3 and the adjustments to labour escalation and inflation.
39 As part of the information gathering process a breakdown of this part of the forecast was provided to the AER on 5
th June 2017

CAPITAL EXPENDITURE | 2018/19-2022/23 4
Page 82 of 158
4.6 Augmentation (excluding PSF)
The draft decision recommends an allowance of $96.7 million for augmentation expenditure (excluding
PSF). Our forecast of $160.8 million has been reduced by $64.1 million. An overview of the reduction,
its reasons and our response is shown in Table 4.14.
Table 4.14: Summary of AER draft decision and reasons
Expenditure reduction and reasons TransGrid response
Economic benefits driven
Reduction of $31.5 million (-51%)40
5 project forecasts were reduced by 20%. AER
agreed the needs were valid but considered the
benefits to be materially overstated.
The remaining Dynamic Voltage Support project
was rejected due to uncertainty but the AER
suggested it could be a contingent project.
Conclusion partly relies upon a misunderstanding of
the risk cost modelling and investment analysis.
All risk cost (ie, benefit) assumptions were moderated
for the specific circumstances.
The dynamic voltage support projects are too small to
be eligible as contingent projects but new generation is
now committed in the relevant areas and further new
generation connections are now more likely.
Reliability and security driven
Reduction of $0.2 million
Program accepted in full with adjustment for a
small correction in historical CPI.
We accept this adjustment.
Connection driven
Reduction of $28.5 million (-79%)
Historical connection capex more reasonably
reflects expected demand.
New connections are less likely than TransGrid
has assumed.
Historical connection capex is not relevant.
The forecast is forward-looking, driven by known,
possible new large mining and resources loads.
Updated information is presented to support the
likelihood of the new connections.
This forecast was created on a probabilistic basis to
reflect the uncertainty of any one project proceeding. It
reflects the fact that across the identified projects, some
will connect and expenditure will be required.
Localised demand driven
Reduction of $3.2 million (-15%)
Insufficient evidence to justify timing of new
switch bays at Macarthur.
Macarthur switch bays are required
Further information clarifies that these are part of the
most efficient solution developed in joint planning (with
Endeavour Energy).
Further detail on each of these areas follows.
4.6.1 Economic benefits driven capital expenditure
Overview
This program consists of augmentation projects which result in net economic benefits by improving
power quality, load restoration times, network resilience and operational efficiency.
40 This includes $0.8 million of two connections project that the AER moved to Powering Sydney’s Future

TRANSGRID REVISED REVENUE PROPOSAL | 2018/19-2022/23 4
Page 83 of 158
Ten projects with clear net economic benefits have been added to this part of the capital expenditure
forecast. These projects were originally included in the January 2017 proposal as part of the Network
Capacity Incentive Parameter Action Plan (NCIPAP). The AER determined they did not meet the
specific objective of the NCIPAP scheme – to increase network capacity in response to an identified
network limitation. TransGrid accepts this decision and has transferred them into the main capital
program.
AER assessment
The AER removed one project (suggesting it should be a Contingent Project) and reduced the forecast
for the five others by 20%. This reduced expenditure from $62.7 million to $30.4 million, a reduction of
51%. For the 20% reduction, the AER’s view was that:
Identified needs seem valid but the benefits calculated were “likely to be materially overstated”
Proposed timing was not evidenced.
For the Dynamic Voltage Support project, the AER concluded that the uncertainty about the need was
sufficient that the project could be a Contingent Project. We appreciate the AER has remained open to
receiving more information about this project.
Response – five projects reduced by 20%
The rationale largely relies on EMCa and the AER’s conclusions that there was “systemic
overestimation” of risk cost savings (ie, investment benefits) in the replacement forecast:
For the same reasons outlined in our assessment of repex, we are not satisfied that the proposed
augex that is driven by economic benefits is reasonably likely to reflect prudent and efficient costs.
Furthermore, as there is evidence of the same systemic overestimation of risk for augex and augex
we have applied a 20 per cent reduction. (Draft Decision 6-48)
The AER’s reliance on EMCa’s report and its findings on replacement expenditure are problematic as
these findings have been shown to be weakly supported.
In relation to EMCa’s review of these projects41
, we respond to specific concerns as follows:
For the smart grid control projects, the reliability risk calculation does include moderation of
peak load in case it is not peak time when a fault occurs. A factor of 0.5 is applied
For the Yass Circuit Breaker capacity increase project, EMCa queried the different circuit
breaker “outage” and “failure” rates. These differ because the modelled failures are different
events, with an outage being more likely than a failure. The risk cost calculation use both, as
both events need to occur in sequence for this risk impact to eventuate.
As observed for the replacement program, an arbitrary reduction of 20% appears to have been applied
on the basis of a flawed review of our risk analysis method.
Following a review of the need and AER feedback on the project, the Travelling Wave Fault Location
project, which was originally part of this group of projects, has been removed.
Response – dynamic voltage support
The dynamic voltage support project is a response to the impact of increasing renewable generation
connections in weaker parts of the network. The original forecast was probability weighted. The total
41 EMCa Report, page 47

CAPITAL EXPENDITURE | 2018/19-2022/23 4
Page 84 of 158
forecast capital cost for responding to these generation connections was discounted by 40% to account
for the uncertainty around actual connections.
The AER noted:
We are satisfied that TransGrid has demonstrated that its dynamic voltage support program would
be required to achieve the capex objectives in the event the forecast demand materialises. However,
we consider that the need for the project and the associated costs are not sufficiently certain. (Draft
Decision 6-48)
We appreciate that the AER recognises that the potential need is valid but uncertain. As this project is a
grouping of two potential needs, individually, neither of these is large enough to meet the contingent
project threshold.42
Since January 2017, renewable generation has been committed in the areas in question and increasing
levels of proposed renewable generation are progressing through the connection process. Table 4.15
shows new generation activity in relation to the connection levels which trigger the need for reactive
support.
Table 4.15: Dynamic voltage support triggers and latest generation connection interest
Area / likely
location 43
Generation level triggers
Generation activity since January 2017
South west
Darlington Pt
330kV
617 MVA 230 MW of generation is committed (Connection
Agreements signed)
880 MW of generation at an advanced stage (two are close
to committing)
Central west
Wellington 330kV
1234 MVA 180 MW of generation is committed (Connection
Agreements signed)
250 MW of generation at an advanced stage
North
Tamworth 330kV
1649 MVA 250 MW of generation at an advanced stage
1,000 MW of connection enquiries in the region
From this information, TransGrid’s view is that the south west need is very likely to be triggered and
potentially quite soon.
Ten additional projects with economic benefits
Ten projects were originally proposed as part of the Network Capacity Incentive Parameter Action Plan
(NCIPAP) incentive scheme. They were not accepted into that scheme as they did not meet its
relatively narrow objective to increase network capacity.
However, they will all result in net benefits, addressing reliability risk and improving wholesale market
efficiency. TransGrid therefore proposes to include the projects detailed in Table 4.16 in the capital
expenditure forecast.
42 Clause 6A.8.1(b)(iii) of the National Electricity Rules (NER) states that ‘the proposed contingent capital expenditure exceeds either
$30 million or 5% of the value of the maximum allowed revenue for the relevant Transmission Network Service Provider for the first year of the relevant regulatory control period whichever is the larger amount. ’
43 Other locations considered have already been shared with the AER in NOS 1650

TRANSGRID REVISED REVENUE PROPOSAL | 2018/19-2022/23 4
Page 85 of 158
Table 4.16: New economic benefits projects (ex-NCIPAP) ($m June 18)
Projects Forecast ($M) Benefit and reasons
Deniliquin full SCADA
augmentation 0.4
Reliability
Reduces fault restoration time of Deniliquin 66 kV
network
Overvoltage control after automatic
under-frequency load shedding 4.1
Reliability
Reduces overvoltage risk in the event of under-
frequency load shedding (UFLS).
Remote or self-reset of bus
protection 4.1
Reliability
CCTV system allows remote busbar switching to
significantly reduce supply restoration times following
a busbar fault
Two-way disconnector to replace
line tee connection to Morven
substation
3.0
Reliability
Reduces the duration of supply interruptions
following any fault on line 996
Finley full SCADA augmentation 0.3
Reliability
Significantly reduces the fault restoration time of the
Finley 66kV supplies.
Two-way disconnector replaces line
976 tee connection to
Murrumbateman substation
2.8
Reliability
Reduces duration of supply interruption to customers
following any fault on line 976
Albury area under voltage load
shedding scheme 0.2
Reliability
UVLS allows 132kV system to remain supplied
during outages at Jindera44
Taree 132 kV bus capacity
augmentation 1.0
Reliability
Establishing two bus bar protection zones halves the
impact of a busbar section trip
Remote relay interrogation 2.0
Market efficiency
Faster diagnostics and better accuracy of voltage
and transient stability constraints. Can improve inter-
regional transfer limits.
Two-way Disconnector On Line
94M for Ilford Tee 2.9
Reliability
Reduces the duration of supply interruptions
following any fault on line 94M
Total 20.9
44 Outages of a Jindera 330/132 kV transformer or Jindera-ANM 132 kV line or Jindera-Albury 132 kV line

CAPITAL EXPENDITURE | 2018/19-2022/23 4
Page 86 of 158
Updated forecast
An updated forecast for economic benefits driven expenditure is shown in Table 4.17.
Table 4.17: Economic benefits driven capital expenditure ($m June 18)
Economic benefits driven
expenditure
2018–19 2019-20 2020–21 2021–22 2022–23 Total
Original proposal 3.0 15.2 26.7 7.3 10.5 62.745
Revised proposal 8.2 22.1 29.4 9.8 11.4 80.946
Difference 5.1 7.0 2.7 2.4 0.9 18.1
This revised forecast is $18.1 million higher than the amount we proposed in January. This is the net
effect of removing the Travelling Wave Fault Location project and adding the ten ex-NCIPAP projects.
4.6.2 Reliability driven expenditure
Overview
This program is driven by investment to meet new reliability standards.
AER assessment
The program was accepted in full and we acknowledge the AER’s decision and maintain the project in
the revised proposal. However, for both Molong and Mudgee supply points, the AER requested further
information on:
The basis for not considering network support services
Whether we considered the flexibility in the reliability standard in complying with the obligation.
Response
There is limited flexibility in the reliability standards47
. TransGrid can deviate from the specified
unserved energy limit if there is a demonstrable firm plan to satisfy local reliability needs, which
provides a greater net benefit. Approval for this is at the discretion of IPART.
TransGrid fully supports the use of non-network solutions. However, contracting with non-network
service providers for compliance purposes will be complex. There is not enough time to find
proponents48
, clearly communicate our requirements, agree legal and commercial terms, execute
contracts and have these reviewed and approved by IPART in time to comply.
Updated forecast
An updated forecast for reliability driven expenditure is shown in Table 4.18.
45 Note that the Draft Decision presented our forecast for Economic Benefits Driven Expenditure as $61.9 million (p 6-38). This was
because the AER moved $0.8 million from this forecast into the Powering Sydney’s Future project. 46
This forecast also includes the expenditure for the two projects which were treated as PSF by the AER. These are separate projects required at Beaconsfield and Haymarket irrespective of PSF. Further information is provided in TransGrid-OER 1440 Beaconsfield 132kV Cable Replace-0117-PUBLIC and TransGrid-OER 1448 Haymarket 132 kV Ausgrid Cables Replace-0117-PUBLIC
47 Section 4 of the NSW Electricity Transmission Reliability and Performance Standard 2017
48 For compliance purposes, we might need more than one provider.

TRANSGRID REVISED REVENUE PROPOSAL | 2018/19-2022/23 4
Page 87 of 158
Table 4.18: Reliability driven capital expenditure
Reliability driven
expenditure
2018–19 2019-20 2020–21 2021–22 2022–23 Total
Original proposal 15.5 25.6 0.0 0.0 0.0 41.2
Revised proposal 21.9 26.6 0.0 0.0 0.0 48.6
Difference 6.4 1.0 0.0 0.0 0.0 7.4
In total, it is $7.4 million more than the amount we proposed in January. This is caused by a delay to
the Mudgee project.
4.6.3 Connection driven capital expenditure
Overview
This part of the augmentation capital expenditure forecast is to manage constraints created by large
new customer connections.
The forecasting process involved identifying the possible impacts of a number of known potential
industrial and resource extraction loads which were not included in other forecasts. We have forecast
the costs of managing the four identified constraints and reduced it by 40 per cent to reflect the
uncertainty around the connections. This means that TransGrid has shared the risk – it will still need to
manage the constraints if a majority of these loads connect.
AER assessment
The AER reduced connection driven expenditure from $36.0 million to $7.5 million, a reduction of 79%.
It considers that the forecast expenditure does not reflect a realistic demand forecast as:
Past connection-related investment provides a more realistic basis for the forecast
It has different views on the likelihood of the specific new connections the forecast is based on.
Response
The AER is correct that there is uncertainty. However, it is TransGrid’s view that it is unreasonable to
use past connection-related investment as an indicator of future needs. A prudent TNSP would
consider the possible impacts in light of available forward looking information and these large, diversely
located spot loads are not covered in historic trends.
That is why we have applied a reduced probability-weighted forecast - balancing the costs of managing
the potential constraints with the need to connect the new loads, if they eventuate. Consultation with
our stakeholders about this revised proposal, suggests there is a high level of support for this type of
approach when there is uncertainty. It is our view that many of the 19 possible connections will connect
and some expenditure will be required. New information suggests that some of these have become
more likely since January 2017.
Each constraint area is discussed in turn below.
Beryl area constraint
The constraint is the potential for voltage collapse following a trip of Line 94B, once Bowden’s silver
mine and another identified coal mine are added to the existing load.

CAPITAL EXPENDITURE | 2018/19-2022/23 4
Page 88 of 158
In August 2017, Bowden’s silver mine submitted a connection enquiry to TransGrid. Its development
approval has also progressed further – the specification for its Environmental Impact Statement (EIS) is
finalised and the EIS is expected to be exhibited in early 2018. 49
In response to the AER comments about the analysis method:
The calculated cost of unserved energy does not assume a trip has to occur at the peak time.
This is not the assumption – as indicated in Figure 4.19, the load will be above the supportable
level for 60% of the year with both mines connected. Even with Bowden’s silver mine only, there
is potential for a constraint.
Figure 4.19: Beryl load duration curve showing the ‘supportable’ demand level
The 10MVAr expected reactive shortage noted by the AER is a calculated reactive margin for the
Beryl busbar as recommended under the Rules support shortfall. It is not the shortfall
Static reactive support is not a viable solution – reactive compensation already in place means the
network is very sensitive to voltage instability. More static reactive support would worsen this
A network support service is not viable. Load curtailment is not one hour per year. As indicated
above, it would be around 4,500 hours per year
The options considered focused on dynamic reactive support – 35MVAr is insufficient and the
option for 50MVAr of support cost is only marginally higher than for 40MVAr. This is currently
preferred, as it allows for future growth.
In summary, TransGrid considers that its analysis of the Beryl area constraint is valid and the option
used for the forecast is efficient. One of the mining loads has progressed to the point where a
connection enquiry has been submitted. This constraint is more likely than it was in January 2018.
49 https://bowdenssilver.com.au/environmental-impact-statement/

TRANSGRID REVISED REVENUE PROPOSAL | 2018/19-2022/23 4
Page 89 of 158
Thermal limitation on 969 line
This constraint will exist if the Shenhua mine connects. Calculations for the January 2017 proposal
showed that there was enough capacity for 20 to 25MW of mine load. However, the latest demand
forecasts for Gunnedah and Narrabri have increased significantly. Updated analysis shows that only
around 10 – 18MW of new mining load could be supported.
The Shenhua mine is understood to be progressing - in September 2017 it had further discussions with
Essential Energy in relation to its connection.
Connection of the Narrabri gas project
The Narrabri gas project will create the potential for voltage collapse at both Narrabri and Gunnedah if
either the 968 or the 969 line trips.
The draft decision is not correct in stating that four events need to occur for the constraint to exist.
Neither the local load nor the gas plant demand need to be at their peak – the load duration curve in
Figure 4.20 shows that the constraint would exist for around 30 per cent of the year (2,500 hours) by
2023. This includes the latest forecast of Narrabri peak load in 2023, which has increased to 55MW
from 44MW in the previous forecast.
Figure 4.20: Narrabri load duration curve showing the “supportable” demand level
The only event of consequence is the trip of either the 968 or the 969 lines. Northerly power flows are a
worst case scenario but not the only scenario that causes the issue. Both of these lines have had
extended outages of 96 hours in the recent past, so the use of the average 132kV feeder restoration
time of 24 hours was considered valid. Also, the nature of voltage collapse caused by the trip of these
lines means that an outage of the entire Narrabri load is a valid assumption.

CAPITAL EXPENDITURE | 2018/19-2022/23 4
Page 90 of 158
We concur with the AER’s view that coal seam gas approvals are complex. However, s ince January
2017, the project’s Environment Impact Statement (EIS) was exhibited and submissions are under
review. The project is considered more likely than it was in January 2017.
Strengthening Far West NSW network
This constraint will exist when the Hawsons Iron Project connects near Broken Hill. The connection
creates the potential for a non-compliant transient voltage if the mine trips when local loads are low.
The AER’s view is that six events need to coincide for the problem to occur.
The first is the trip described above and the remaining five are inter-related. It is reasonable to expect
that these could coincide, as some are related to the same mining load and the others occur for a
majority of the time. In relation to these, we note that:
A high flow on the X2 line would coincide with the trip of the mine, as this high flow will be caused
by supplying this mining load
A trip of the entire mine load is viable as there is likely to be one point of failure at the mining
substation transformer, and two circuit breakers that connect it to a TransGrid site which can cause
the whole load to trip
Mining loads are typically flat, so assuming it is at (or close to) maximum is a reasonable
assumption
The gas turbines at Broken Hill are normally not operating
The Broken Hill Solar Farm is semi-scheduled intermittent generation so cannot be relied upon at
all times.
The planning undertaken assumed typical mining site load patterns and more detailed analysis would
be completed as part of responding to the constraint in reality. However, analysis shows that the
maximum supportable load on the X2 line is around 60MW to remain within the Rule requirements. This
is around 50MW less demand than the mine site originally nominated for the feasibility study. Further,
TransGrid has an obligation to ensure it has sufficient network capability to meet the new mines’
demand while complying with Rule clause S5.1a.4 pertaining to Power Frequency Voltage levels, under
light load and transient conditions.
It is TransGrid’s view that its analysis in relation to this possible constraint remains valid and this
problem is a real possibility if the mine connects.
TransGrid is open to demand management and non-network solutions but these can have limited
application in managing dynamic voltage swings in these circumstances. In the event that the issue at
Broken Hill eventuates, we will consider both network and non-network solutions. Should a non-network
solution be the most economic option, TransGrid will treat this as a network support pass-through under
Clause 6A.7.2 of the Rules.
TransGrid proposes a network support payment for Broken Hill in each year of the regulatory control
period of $0 million. As we noted in the Revenue Proposal, this appears superfluous with no dollar
value. However, this provides access a network support pass-through payment if network support is
required. Should no requirement for network support eventuate during the regulatory control period,
there will be no cost to consumers.
Updated forecast
An updated forecast for connection driven expenditure is shown in Table 4.19.

TRANSGRID REVISED REVENUE PROPOSAL | 2018/19-2022/23 4
Page 91 of 158
Table 4.19: Connection driven capital expenditure
Connection driven
expenditure
2018–19 2019-20 2020–21 2021–22 2022–23 Total
Original proposal 5.4 16.5 10.9 0.9 2.3 36.0
Revised proposal 3.8 18.8 10.8 0.8 2.3 36.5
Difference -1.6 2.3 -0.1 0.0 0.0 0.5
This is $0.5 million higher than in our original proposal due to a minor change in the timing for
Strengthening Far West NSW network project and Connection of the Narrabri gas project.
It is important to note that this forecast for connection driven expenditure balances the costs to
consumers but includes some risk for TransGrid. The forecast capital expenditure is 60 per cent of the
amount we estimate is required to manage all the above constraints.
4.6.4 Localised demand driven capital expenditure
Overview
This area of the forecast is driven by known demand growth which is requiring the development of new
distribution connection points for brand new suburbs (mainly in Sydney’s North West and South West
Growth centres). These circumstances are well suited for joint planning – in this case, TransGrid and
Endeavour Energy have worked together to find the most efficient combination of transmission and
distribution infrastructure to meet the need. For example, creation of a new transmission connection
point can remove the need for new or uprated distribution feeders.
AER assessment
AER rejected a component of one project which was the result of joint planning with Endeavour Energy.
It appears that the information provided by Endeavour relating to the need for a new switch bay at
Macarthur was misinterpreted from a complex options analysis.
We note that the proposed new switch-bay at Macarthur facilitates Endeavour Energy’s plan to
duplicate the Macarthur-Ambarvale 66 kV line (line 853) to accommodate the future load growth.
Notably, Endeavour Energy’s annual planning report shows that line 853 will have 11MVA spare
capacity by 2021. (Draft Decision 6-128)
Response
The need for the switch bay has been confirmed. It is required to provide supply to Menangle Park
Zone Substation which will service new residential connections. It is not intended to facilitate duplication
of the Macarthur – Ambarvale 66kV line 853.
This is the most efficient option, as alternative supply for Menangle Park Zone Substation would be
multiple 11kV augmentations. The Macarthur Supply Point is only 2km from the Menangle Park site and
the new switch bay will facilitate the connection via a 66kV feeder.
Updated forecast
An updated forecast for localised demand driven expenditure is shown in Table 4.20.

CAPITAL EXPENDITURE | 2018/19-2022/23 4
Page 92 of 158
Table 4.20: Localised demand driven capital expenditure forecast ($m June18)
Localised demand driven
expenditure
2018–19 2019-20 2020–21 2021–22 2022–23 Total
Original proposal 2.6 2.4 2.9 6.3 6.7 21.0
Revised proposal 1.2 2.2 2.9 7.7 6.8 20.7
Difference -1.5 -0.2 0.0 1.4 0.1 -0.3
In total, it is $0.3 million less than the amount we proposed in January. The difference is the result of a
minor cost adjustment.
4.6.5 Revised total augmentation (ex-PSF) capital expenditure forecast
The updated forecast for all of the augmentation (ex-PSF) expenditure is shown in Table 4.21.
Table 4.21: Augmentation (ex-PSF) capital expenditure ($m June18)
Augmentation (ex-PSF)
expenditure
2018–19 2019-20 2020–21 2021–22 2022–23 Total
Original proposal 26.5 59.7 40.5 14.5 19.5 160.8
Revised proposal 35.0 69.8 43.1 18.3 20.4 186.6
Difference 8.5 10.1 2.6 3.8 0.9 25.8
In total, it is $25.8 million higher than our original proposal. This is largely due to the addition of the
projects which were not eligible for the NCIPAP allowance.
4.7 IT expenditure
Overview
Information Technology (IT) expenditure is included in the “Non-network” category by the AER,
alongside other business support expenditure. The draft decision recommended a $21.1 million
reduction to the forecast IT expenditure only, with a new total of $81.8 million (-20%). Other expenditure
in the “Non-network” category was unchanged.
AER assessment
The AER concluded that the forecast was not well justified and raised concerns with the IT project risk
assessments and lack of justification for increases in capability and IT/OT strategy.
In terms of investment analysis, the AER considered that:
The options analysis was inadequate
There was “double counting” in parts of the risk analysis and risk costs were not appropriate
Efficiency benefits had inappropriately been included
“Bundling” of risk assessments made it harder to review components of programs.
The AER also considered that
A prudent TNSP would extend the asset life of software assets beyond the “standard life”
The proposed costs for meeting the NSW Licence Conditions were not justified.
TRANSGRID REVISED REVENUE PROPOSAL | 2018/19-2022/23 4
Page 93 of 158
Response – investment analysis approach
In light of the AER’s comments, TransGrid reviewed and amended its approach to investment analysis
for the IT portfolio. The revised approach:
Uses a new risk model which is more appropriately aligned to IT requirements and is more
transparent for a reviewer
Includes options analysis for all programs. This now includes consideration of a base case
(replacing asset as planned), a two year delay (ie, a life extension) and a five year delay
Includes updated risk assumptions, including the removal of efficiency benefits and revised risk
impacts which the AER was concerned might be double counted.
The investment analysis now considers the options of delaying each program by two and five years.
TransGrid generally assumes that software assets have a five year lifetime, in line with accounting
treatment. We agree that it is not prudent to automatically replace a system or software after five years
- the trigger for replacement or upgrade depends on a risk analysis.
The option analysis takes account of the increased risk of running software past this lifetime. It takes
into account:
Increased risk of failures and poor performance
Cyber security risks, which increase once software is no longer supported. The impacts of these
could include high costs, data breaches, non-compliance and in worse cases, network asset
impacts
Higher ongoing support costs. Based on our experience with the current ERP, we have assumed
an increase of 20 per cent per year for the first two years of “out-of-support” delay. After two years,
we have assumed that this increase is 40 per cent. At this point, it is less likely that vendor support
is available so some reliance on specialist third parties is expected
Higher costs when upgrades are completed later – due to more complex data migration, the need
to manage compatibility with interacting systems and to implement more significant changes in the
organisation.
Each program investment analysis now includes three options:
Option A – Replace current systems at end of asset life
Option B – Extend the asset life of current systems by 2 years then replace
Option C – Extend the asset life of current systems by 5 years then replace.
Updated investment analysis is now detailed in the Options Evaluation Reports for each of the IT
programs.
Response – cyber security increase
The significant increase in the volume and sophistication of cyber-attacks against the electricity industry
drives the need to enhance the capability in detecting and countering these. Our revenue proposal in
January 2017 included a program to address this.
Since January 2017 it has become clear that compliance with our Licence Conditions requires
additional capability with a consequent increase of $2.5 million in the “Pervasive Security” program.
The Licence requires TransGrid to ensure that:
The transmission system can only be operated and controlled from within Australia (condition
6.1(b))

CAPITAL EXPENDITURE | 2018/19-2022/23 4
Page 94 of 158
Data on the quantum of electricity delivered and personal information is accessible only from within
Australia (conditions 7.1(a) and (b)).
Compliance also requires an enhanced monitoring and event logging capability to identify changes in
vulnerabilities and abnormal data network traffic.
Other changes to the forecast
There have been other changes to programs within the forecast. Items of scope which were previously
justified on the basis of efficiency savings have been removed. These have been offset by increases in
the Pervasive Security program (discussed above) and an increase in the Digital Enterprise program.
Table 4.22 shows the changes in each of the eight programs.
Table 4.22: changes in the IT capital expenditure forecast ($m June18)
Program Updated
estimate ($m)
Change
($m)
Reason
Digital Enterprise 38.5 1.3
Forecast ERP implementation cost reduced slightly following
recent market analysis. The integration platform scope was
transferred in to better align the work program.
Scope items transferred to Information Infrastructure
Refresh for greater program alignment50
Digital Field Force 6.3 -2.6 Efficiency-driven scope items have been removed
Intelligent
Operations Centre 7.3 -3.1
Integration platform scope transferred to Digital Enterprise
“Asset monitoring and predictive analytics” items (previously
based on efficiency savings) were removed
Intelligent Asset
Design 2.6 -0.5 Efficiency-driven scope item has been removed
Pervasive Security 10.1 2.5 Increase to support data protection license requirements
Enterprise
Analytics Platform 7.6 -0.8
Efficiency-driven “KPI dashboards” scope was removed
Following updated market analysis implementation costs for
enterprise content management increased slightly
Information
Infrastructure
Refresh
18.1 2.5
Scope items on power system analysis, workflow
management and integrated service delivery added for
greater program alignment
Corporate Data
Network Refresh 11.6 0.0 No change
Total 102.251
-0.5
50 Items relate to power system analysis, workflow management and integrated service delivery
51 Table entries sum to $102.1 million. The difference of $0.1 million is expenditure on a program continuing from 2017/18

TRANSGRID REVISED REVENUE PROPOSAL | 2018/19-2022/23 4
Page 95 of 158
Updated Information Technology forecast
The updated IT capital forecast showing in Table 4.23 is $102.2 million, $0.5 million lower than our
original proposal.
Table 4.23: Information Technology capital expenditure forecast ($m June18)
IT expenditure 2018/19 2019/20 2020/21 2021/22 2022/23 Total
Original proposal 13.8 28.4 28.0 14.9 17.6 102.7
Revised proposal 28.6 28.5 7.7 20.0 17.5 102.2
Difference 14.8 0.0 -20.4 5.1 -0.1 -0.5
4.8 Contingent projects
4.8.1 Overview
TransGrid proposed five contingent projects in January 2017. The AER was satisfied that these might
reasonably be required if certain events occurred but it suggested changes to the trigger events. We
have reviewed these and have updated our triggers in response.
We have also made additional updates to the triggers in response to changes in the sector. We notified
the AER of these in August 2017.
Also in response to the rapidly changing circumstances, this revised proposal includes a further four
contingent projects. We notified the AER about three of these in August 2017, while the potential need
for the fourth only became apparent after that.
These four new projects and the revisions to the triggers of the original five reflect:
The possibility that a new pathway for transmission investment may be developed
The possibility that some projects have potential reliability triggers as well as market benefits
triggers.
These are described in turn below.
Possible new method of initiating transmission investment
The ongoing policy and regulatory reform which followed the endorsement of the Finkel Review
recommendations could create a new method (or methods) for the initiation of transmission investment.
The possible changes are mainly reflected in two Finkel Review recommendations (5.1 and 5.2)52
which
can be summarised as:
AEMO is to develop an integrated grid plan to identify efficient locations for renewable energy
zones and subsequently to identify potential priority transmission projects to facilitate the
connection of these
Specifying a potential role for governments in supporting specific transmission investments, if the
market does not deliver. This would be supported by a rigorous framework of project evaluation, to
be developed by the AEMC. The intention was that this process minimises the risk to consumers of
52 Independent Review into the Future Security of the National Electricity Market, Blueprint for the Future, June 2017. Covered on
pages 124 to 127

CAPITAL EXPENDITURE | 2018/19-2022/23 4
Page 96 of 158
bearing unnecessary cost. It is possible that this could be separate from, or an alternate to the RIT-
T process.
AEMO’s first Integrated Plan is in development and is expected to be released in mid-2018. TransGrid
and other TNSPs are providing AEMO with detailed information to assist development of the plan.
Reliability corrective action
A ‘reliability corrective action’ is an investment to meet the service standards related to technical
requirements in schedule 5.1 of the National Electricity Rules (NER) or in another ‘applicable regulatory
instrument’, such as a jurisdictional transmission licence.
A reliability corrective action investment can still be justified with a negative net economic benefit (ie, a
net cost) and this is reflected in the requirements of the RIT-T. An example of an investment to comply
with schedule 5.1 of the Rules could be one which manages a voltage constraint. The inclusion of
“reliability corrective action” triggers for these contingent projects reflects the need to comply with the
NSW Electricity Transmission Reliability and Performance Standard 2017. This trigger is most likely to
occur for the Broken Hill project.
Commitment to work with the AER
The updated triggers and four new contingent projects have been written to reflect the possible new
transmission investment initiation mechanism and the possibility of projects having reliability as well as
market led triggers.
TransGrid understands that the uncertainty around the investment mechanism complicates the AER’s
assessment but we are committed to a continued dialogue with the AER should further information or
refinement be required.
4.8.2 AER assessment and our response on the original five contingent projects
TransGrid proposed the following five contingent projects in January 2017:
New South Wales to South Australia Interconnector
Reinforcement of Southern Network
Reinforcement of Northern Network (QNI upgrade)
Support of South Western NSW for Renewables
Supply to Broken Hill.
Background information and supporting documentation for these five contingent projects was provided
in the Revenue Proposal. To avoid repetition, general project information is not covered again.
This section presents only amended triggers and cost ranges for the five contingent projects proposed
in January 2017. The new triggers are largely in line with the AER’s suggestions.
New South Wales to South Australia Interconnector – revised trigger
Having reviewed the AER’s suggested wording, TransGrid proposes the following updated trigger:
(a) Two or more of the following:
(i) Inclusion of interconnection between NSW and South Australia in AEMO’s Integrated Grid Plan
or similar plan as recommended by the Independent Review in to the Future Security of the
National Electricity Market by Professor Alan Finkel and accepted by the COAG Energy
Council

TRANSGRID REVISED REVENUE PROPOSAL | 2018/19-2022/23 4
Page 97 of 158
(ii) Notification to TransGrid by the Federal Government, COAG Energy Council, NSW
Government, South Australia Government or the Energy Security Board that it considers that
interconnection between NSW and South Australia is required in order to meet or manage the
expected demand for prescribed transmission services or comply with an applicable regulatory
obligation or requirement associated with the provision of prescribed transmission services
(iii) Successful completion of a RIT-T or alternate framework introduced in response to the
recommendation of the Independent Review in to the Future Security of the National Electricity
Market by Professor Alan Finkel and accepted by the COAG Energy Council (including
comprehensive assessment of alternative options) demonstrating that:
(A) new interconnection between NSW and South Australia is the option or part of the option
that maximises the positive net economic benefits; or
(B) new interconnection is the option that most cost effectively addresses system security
issues
(iv) Determination by the AER that the proposed investment satisfies the RIT-T or abovementioned
alternate framework
(b) TransGrid Board commitment to proceed with the project subject to the AER amending the revenue
determination pursuant to the Rules.
The AER’s suggested trigger is slightly modified by the addition of the system security objective.
The NSW component of the project has a cost estimate ranging between $276 million (low capacity) to
$1,074 million (high capacity) depending on the option. The cost estimate exceeds the applicable
contingent project threshold of $30 million or 5% of MAR.
Reinforcement of Southern Network – revised trigger
Taking into account the AER’s draft decision, TransGrid proposes the following updated trigger:
(a) New generation of more than 350 MW is committed in southern NSW at any current or future
connection point(s) south of Bannaby and Marulan or NSW import capacity from Southern
Interconnectors is determined to be increased by more than 350 MW due to committed expansion
of southern interconnections.
(b) Two or more of the following:
(i) Inclusion of renewable energy zones in Southern NSW and/or Northern Victoria in AEMO’s
Integrated Grid Plan or similar plan as recommended by the Independent Review in to the
Future Security of the National Electricity Market by Professor Alan Finkel and accepted by the
COAG Energy Council
(ii) Notification to TransGrid by the Federal Government, COAG Energy Council, NSW
Government, Victorian Government or the Energy Security Board that it considers that
augmentation of the transmission network to deliver increased capacity from Southern NSW
and/or Northern Victoria is required in order to meet or manage the expected demand for
prescribed transmission services or comply with an applicable regulatory obligation or
requirement associated with the provision of prescribed transmission services
(iii) Successful completion of a RIT-T or alternate framework introduced in response to the
recommendation of the Independent Review in to the Future Security of the National Electricity
Market by Professor Alan Finkel and accepted by the COAG Energy Council (including
comprehensive assessment of alternative options) demonstrating that increasing the capacity
of the network in Southern NSW at 330/132kV or other voltages used in future is the option
that maximises the positive net economic benefits

CAPITAL EXPENDITURE | 2018/19-2022/23 4
Page 98 of 158
(c) Determination by the AER that the proposed investment satisfies the RIT-T or abovementioned
alternate framework
(d) TransGrid Board commitment to proceed with the project subject to the AER amending the revenue
determination pursuant to the Rules.
The project has a cost estimate ranging between $60 million to $393 million, which exceeds the
applicable contingent project threshold of $30 million or 5% of MAR.
Reinforcement of Northern Network (QNI upgrade)
Having reviewed the AER’s suggested wording, TransGrid proposes the following updated trigger:
(a) One or more of the following:
(i) Committed retirement of more than 1,100 MW of generation in the Hunter or Central Coast
area
(ii) New generation of more than 1,100 MW is committed in northern NSW at any current or future
connection point(s) north of Armidale
(iii) New generation of more than 350 MW is committed at any current or future connection point(s)
south of Liddell and Bayswater
(b) Two or more of the following:
(i) Inclusion of an augmentation to increase the capacity of the interconnection between NSW and
Queensland in AEMO’s Integrated Grid Plan or similar plan as recommended by the
Independent Review in to the Future Security of the National Electricity Market by Professor
Alan Finkel and accepted by the COAG Energy Council
(ii) Notification to TransGrid by the Federal Government, COAG Energy Council, NSW
Government, Queensland Government or the Energy Security Board that it considers that
augmentation of the transmission network to increase the capacity of the interconnection
between NSW and Queensland is required in order to meet or manage the expected demand
for prescribed transmission services or comply with an applicable regulatory obligation or
requirement associated with the provision of prescribed transmission services
(iii) Successful completion of a RIT-T or alternate framework introduced in response to the
recommendation of the Independent Review in to the Future Security of the National Electricity
Market by Professor Alan Finkel and accepted by the COAG Energy Council (including
comprehensive assessment of credible options) demonstrating that increasing capacity of the
network between Bulli Creek and Liddell zones at 330/132kV or other voltages used in future is
the option or part of the option that maximises the positive net economic benefits
(iv) Determination by the AER that the proposed investment satisfies the RIT-T or abovementioned
alternate framework
(c) TransGrid Board commitment to proceed with the project subject to the AER amending the revenue
determination pursuant to the Rules.
The project has a cost estimate ranging between $63 million to $141 million, which exceeds the
applicable contingent project threshold of $30 million or 5% of MAR.
Support of South Western NSW for Renewables
Taking into account the AER’s draft decision, TransGrid proposes the following updated trigger:
(a) One or more of the following:
(i) New generation more than 400 MW is committed in South Western NSW (west of Wagga)
(ii) New generation is committed in North West Victoria:

TRANSGRID REVISED REVENUE PROPOSAL | 2018/19-2022/23 4
Page 99 of 158
(A) exceeding 800 MW for connection to the Ballarat - Waubra - Ararat - Horsham 220 kV
Lines or connection point(s); and/or
(B) exceeding 200 MW for connection to the Redcliffs – Weman – Kerang 220 kV Lines or
connection point(s); and/or
(C) exceeding 500 MW for connection to the Ballarat – Terang – Moorabool 220 kV Lines or
connection point(s); and/or
(D) exceeding 1,500 MW in the North West Victoria zone
(b) Two or more of the following:
(i) Inclusion of renewable energy zones in South Western NSW and/or North Western Victoria in
AEMO’s Integrated Grid Plan or similar plan as recommended by the Independent Review in to
the Future Security of the National Electricity Market by Professor Alan Finkel and accepted by
the COAG Energy Council
(ii) Notification to TransGrid by the Federal Government, COAG Energy Council, NSW
Government, Victorian Government or the Energy Security Board that it considers that
augmentation of the transmission network to deliver increased capacity from South Western
NSW and/or North Western Victoria is required in order to meet or manage the expected
demand for prescribed transmission services or comply with an applicable regulatory obligation
or requirement associated with the provision of prescribed transmission services
(iii) Successful completion of a RIT-T or alternate framework introduced in response to the
recommendation of the Independent Review in to the Future Security of the National Electricity
Market by Professor Alan Finkel and accepted by the COAG Energy Council (including
comprehensive assessment of credible options) demonstrating that increasing capacity of the
network in South Western NSW at 330/220/132kV or other voltages used in future is the option
that maximises the positive net economic benefits
(iv) Determination by the AER that the proposed investment satisfies the RIT-T or abovementioned
alternate framework
(c) Where the optimal solution involves works in NSW and Victoria, successful completion of joint
planning obligations under the NER demonstrating that strengthening the high voltage
interconnection between New South Wales and Victoria is the option that maximises the positive
net economic benefits
(d) TransGrid Board commitment to proceed with the project subject to the AER amending the revenue
determination pursuant to the Rules.
The project has a cost estimate ranging between $89 million to $470 million, which exceeds the
applicable contingent project threshold of $30 million or 5% of MAR.
Supply to Broken Hill
Taking into account the AER’s draft decision, TransGrid proposes the following updated trigger:
(a) Notification from Essential Energy of available capacity of backup generation at Broken Hill that
would result in expected unserved energy exceeding 10 minutes at average demand
(b) Either:
(i) Where the investment is driven by market benefits:
(A) Successful completion of the RIT-T (including a comprehensive assessment of the credible
options) that demonstrates a network investment by TransGrid maximises the market
benefits while meeting reliability of supply obligations to the Broken Hill area
(B) Determination by the AER that the proposed investment satisfies the RIT-T; or

CAPITAL EXPENDITURE | 2018/19-2022/23 4
Page 100 of 158
(ii) Where the investment is driven by a need for reliability corrective action that emerges during
TransGrid’s 2018-2023 regulatory control period, successful completion of economic
evaluation demonstrating that a network investment is the most efficient option to meet the
applicable electricity transmission reliability standard
(c) TransGrid Board commitment to proceed with the project subject to the AER amending the revenue
determination pursuant to the Rules.
The project has a cost estimate ranging between $52 million to $177 million, which exceeds the
applicable contingent project threshold of $30 million or 5% of MAR.
4.8.3 New contingent projects
In total there are four new contingent projects, three are related to renewable energy generation zones
and one is for the proposed Snowy Hydro upgrade. Three of these were foreshadowed to the AER in a
letter on 22 August 2017.
The new contingent projects are:
> Reinforcement of Southern Network in response to Snowy 2.0
> Support Central Western NSW for Renewables
> Support North Western NSW for Renewables
> Renewables development in the Mt Piper to Wellington area.
These projects and their associated triggers are described below.
4.8.4 Reinforcement of Southern Network in response to Snowy 2.0
Background
The Federal Government’s announcement of the Snowy 2.0 expansion occurred after the submission of
TransGrid’s revenue proposal. TransGrid’s revenue proposal included “Reinforcement of Southern
Network” as a contingent project but the scale of this is not sufficient to accommodate the transmission
augmentation required to connect Snowy 2.0.
As the timing and exact requirements of the augmentation are not yet known it is appropriate to treat
this as a contingent project, rather than incorporating it into the ex-ante capital expenditure forecast.
As noted in section 4.8.1, there is some uncertainty about the exact process for investment in the
transmission network to support Snowy 2.0. We have therefore included a description of potential
trigger mechanisms which may eventuate from ongoing policy and regulatory reform.
TransGrid anticipates that transmission investment to enable the output from Snowy 2.0 will form part of
AEMO’s inaugural integrated grid plan which is due by mid-2018.
Driver of investment
It is likely that there will be market benefits from transmission to connect the new Snowy 2.0, including:
Lower costs associated with meeting the supply reliability standard in NSW, through facilitating
access to the output from expanded Snowy 2.0 generation
A reduction in the risk of blackouts (and therefore unserved energy) at times where demand is high
and the output from renewable generators is low, such as occurred in the summer of 2016/17
Lower market dispatch costs (and hence lower prices for consumers) resulting from the additional
output from Snowy 2.0 and the facilitation of additional output from new renewable generators.

TRANSGRID REVISED REVENUE PROPOSAL | 2018/19-2022/23 4
Page 101 of 158
Project trigger
TransGrid proposes the following trigger to augment the Southern Network if a commitment is made to
build Snowy 2.0:
(a) Notification from Snowy Hydro that its Board has made a final investment decision to proceed with
Snowy 2.0
(b) Two or more of the following:
(i) Inclusion of the Snowy 2.0 transmission augmentation in AEMO’s Integrated Grid Plan or
similar plan as recommended by the Independent Review in to the Future Security of the
National Electricity Market by Professor Alan Finkel and accepted by the COAG Energy
Council
(ii) Notification to TransGrid by the Federal Government, COAG Energy Council, NSW
Government, Victorian Government or the Energy Security Board that it considers that
augmentation of the transmission network to deliver increased output from Snowy 2.0 is
required in order to meet or manage the expected demand for prescribed transmission
services or comply with an applicable regulatory obligation or requirement associated with the
provision of prescribed transmission services
(iii) Successful completion of a RIT-T or alternate framework introduced in response to the
recommendation of the Independent Review in to the Future Security of the National Electricity
Market by Professor Alan Finkel and accepted by the COAG Energy Council (including
comprehensive assessment of credible options) demonstrating that a Snowy 2.0 transmission
augmentation is the option that maximises the positive net economic benefits
(iv) Determination by the AER that the proposed investment satisfies the RIT-T or abovementioned
alternate framework
(c) TransGrid Board commitment to proceed with the project subject to the AER amending the revenue
determination pursuant to the Rules.
The trigger is specific and capable of objective verification, relates to a specific location or locations,
and is probable but too uncertain to include the proposed contingent project in the forecast capital
expenditure in this proposal.
The project has a cost estimate ranging between $831 million to $1,228 million, which exceeds the
applicable contingent project threshold of $30 million or 5% of MAR.
4.8.5 Support Central Western NSW for Renewables
Background
TransGrid has interest from renewable energy proponents seeking to connect to its network in South
Western New South Wales. It is possible that South Western New South Wales will be identified as a
renewable energy zone in AEMO’s integrated grid plan.
This network impacted is around the Wellington area. It is a parallel network of 132 kV and 330 kV lines
connecting to the 500 kV substations at Mt Piper and Wollar.
There is around 150 MW of generation currently connected in the area. A further 230 MW of new
generation is committed and more than 400 MW of capacity is well advanced. As the timing and exact
requirements of the augmentation are not yet known it is appropriate to treat this as a contingent
project, rather than incorporating it into the ex-ante capital expenditure forecast.

CAPITAL EXPENDITURE | 2018/19-2022/23 4
Page 102 of 158
Driver of investment
If transmission constraints are addressed, it is anticipated that new generator connections in Central
Western NSW would deliver market benefits. Sources of benefits include:
Lower costs for meeting the supply reliability standard in New South Wales, through facilitating
access to the output from these generation connections
Lower market dispatch costs (and hence lower prices for consumers) assuming these are low cost
generators.
As noted in section 4.8.1, there is some uncertainty about the exact process for investments which
facilitate renewable energy zones. We have therefore included a description of potential trigger
mechanisms which may eventuate from ongoing policy and regulatory reform.
Transmission investment to enable a Central Western NSW renewable energy zone may be identified
in AEMO’s 2018 integrated grid plan.
Project trigger
TransGrid proposes the following trigger:
(a) New generation more than 900 MW is committed in Central Western NSW (west of Wollar and Mt
Piper)
(b) Two or more of the following:
(i) Inclusion of renewable energy zones in Central Western NSW in AEMO’s Integrated Grid Plan
or similar plan as recommended by the Independent Review in to the Future Security of the
National Electricity Market by Professor Alan Finkel and accepted by the COAG Energy
Council
(ii) Notification to TransGrid by the Federal Government, COAG Energy Council, NSW
Government or the Energy Security Board that it considers that augmentation of the
transmission network to deliver increased capacity from Central Western NSW is required in
order to meet or manage the expected demand for prescribed transmission services or comply
with an applicable regulatory obligation or requirement associated with the provision of
prescribed transmission services
(iii) Successful completion of a RIT-T or alternate framework introduced in response to the
recommendation of the Independent Review in to the Future Security of the National Electricity
Market by Professor Alan Finkel and accepted by the COAG Energy Council (including
comprehensive assessment of credible options) demonstrating that increasing capacity of the
network in Central Western NSW at 330/132kV or other voltages used in future is the option
that maximises the positive net economic benefits
(iv) Determination by the AER that the proposed investment satisfies the RIT-T or abovementioned
alternate framework
(c) TransGrid Board commitment to proceed with the project subject to the AER amending the revenue
determination pursuant to the Rules.
The trigger is specific and capable of objective verification, relates to a specific location or locations,
and is probable but too uncertain to include the proposed contingent project in the forecast capital
expenditure in this proposal.
The project has a cost estimate ranging between $120 million to $455 million, which exceeds the
applicable contingent project threshold of $30 million or 5% of MAR.

TRANSGRID REVISED REVENUE PROPOSAL | 2018/19-2022/23 4
Page 103 of 158
4.8.6 Support North Western NSW for Renewables
Background
TransGrid has received applications for a number of generator connections to the North Western NSW
transmission system.
Some of these projects are proposed to connect to the 132 kV and 66 kV network, increasing the power
flow from the local 132 kV network to 330 kV network. One generator of 170 MW is partially
commissioned and other well advanced projects have a total capacity of 280 MW.
Connections directly to the 330 kV network are also expected. There is 270 MW of committed
generation capacity and 200 MW at an advanced stage of development. There is little spare capacity
on this part of the 330 kV network.
Across this whole network area, a further 1,000MW of generation capacity has expressed interest in
connecting.
Driver of investment
If transmission constraints are addressed, it is anticipated that new generator connections in North
Western NSW would deliver market benefits. Sources of benefits include:
Lower costs for meeting the supply reliability standard in New South Wales, through facilitating
access to the output from these generation connections
Lower market dispatch costs (and hence lower prices for consumers) assuming these are low cost
generators.
Project trigger
The proposed trigger is:
(a) New generation more than 800 MW is committed in North Western NSW (north of Bayswater and
Liddell)
(b) Two or more of the following:
(i) Inclusion of renewable energy zones in North Western NSW in AEMO’s Integrated Grid Plan or
similar plan as recommended by the Independent Review in to the Future Security of the
National Electricity Market by Professor Alan Finkel and accepted by the COAG Energy
Council
(ii) Notification to TransGrid by the Federal Government, COAG Energy Council, NSW
Government or the Energy Security Board that it considers that augmentation of the
transmission network to deliver increased capacity from North Western NSW is required in
order to meet or manage the expected demand for prescribed transmission services or comply
with an applicable regulatory obligation or requirement associated with the provision of
prescribed transmission services
(iii) Successful completion of a RIT-T or alternate framework introduced in response to the
recommendation of the Independent Review in to the Future Security of the National Electricity
Market by Professor Alan Finkel and accepted by the COAG Energy Council (including
comprehensive assessment of credible options) demonstrating that increasing capacity of the
network in North Western NSW at 330/132kV or other voltages used in future is the option that
maximises the positive net economic benefits
(iv) Determination by the AER that the proposed investment satisfies the RIT-T or abovementioned
alternate framework

CAPITAL EXPENDITURE | 2018/19-2022/23 4
Page 104 of 158
(c) TransGrid Board commitment to proceed with the project subject to the AER amending the revenue
determination pursuant to the Rules.
The trigger is specific and capable of objective verification, relates to a specific location or locations,
and is probable but too uncertain to include the proposed contingent project in the forecast capital
expenditure in this proposal.
The project has a cost estimate ranging between $500 million to $945 million, which exceeds the
applicable contingent project threshold of $30 million or 5% of MAR.
4.8.7 Renewables development in the Mt Piper to Wellington area
Background
There is strong interest from at least three renewable energy proponents seeking to connect to the
132 kV network between Mt Piper and Wellington in New South Wales.
The three generation connections have a total combined capacity of around 360MW. The project
proponents and their details are confidential (although they can be made available to the AER). Of the
three, one is committed (it has signed a Connection Agreement) and the others are at advanced
development stages but are not yet committed.
Driver of investment
If all three of these renewable generators connect, their outputs will be constrained under system
normal conditions to maintain the transmission network within acceptable limits. The constraint is due to
the thermal rating of the network and it will limit the ability to transfer power out of the area. Initial
market modelling indicates there would be net market benefits from augmenting the transmission
network to provide additional capacity.
Project trigger
TransGrid proposes a new contingent project to support these and future renewables. The proposed
trigger is:
(a) New generation more than 150 MW is committed in Mt Piper to Wellington area
(b) Successful completion of a RIT-T or alternate framework introduced in response to the
recommendation of the Independent Review in to the Future Security of the National Electricity
Market by Professor Alan Finkel and accepted by the COAG Energy Council (including
comprehensive assessment of credible options) demonstrating that increasing capacity of the
network between Mt Piper and Wellington at 132kV or other voltages used in future is the option
that maximises the positive net economic benefits
(c) Determination by the AER that the proposed investment satisfies the RIT-T or abovementioned
alternate framework
(d) TransGrid Board commitment to proceed with the project subject to the AER amending the revenue
determination pursuant to the Rules.
The trigger is specific and capable of objective verification, relates to a specific location or locations,
and is probable but too uncertain to include the proposed contingent project in the forecast capital
expenditure in this proposal.

TRANSGRID REVISED REVENUE PROPOSAL | 2018/19-2022/23 4
Page 105 of 158
The estimated project cost is $36.8 million, which is expected to exceed the applicable contingent
project threshold of 5% of MAR53
.
4.9 Network support events
The AEMC’s System Security Market Frameworks Review Final Report led to Rule changes which
place significant new responsibilities on transmission networks to procure solutions which manage
system security.
The two Rule changes were:
Managing power system fault levels (system strength) – to address potential shortfalls in fault
levels as large synchronous generators retire
Managing the rate of change of power system frequency - to address potential shortfalls in inertia
within potential network islands, especially as large synchronous generators are replaced by
generation with low physical inertia.
These Rules have been established to allow material costs to be passed through to customers, either
via the general pass-through provisions of clause 6A.7.3 or via the network support pass through
provisions of clause 6A.7.2 of the Rules.
At this point, TransGrid does not expect there to be an increase in cost related to these new services
but it will seek to recover costs if this changes within the 2018/19 to 2022/23 period.
4.10 Network Support and Control Ancillary Service
Background
TransGrid currently provides Network Support and
Control Ancillary Service (NSCAS) for voltage control
based on a contract executed with AEMO in 2013.
Currently, this is a non-prescribed service and the
related reactor assets are not part of the regulatory asset
base (RAB).
The contract was put in place after new Rules relating to
NSCAS commenced in April 2012.54
These require TNSPs to respond to an ‘NSCAS gap’
identified by AEMO. TNSPs can put in place an
operational or asset based solution or can procure the
service directly. NSCAS is then treated as a prescribed
service, with revenue recovered depending on the
solution in place.
However, after the implementation of these Rules in 2012 there was insufficient time for TransGrid to
undertake a RIT-T for an NSCAS gap identified from July 2013.55
In line with the Rules, AEMO then ran
an open tender process to procure the service from the lowest cost source.
53 When $36.8 million is converted to a nominal amount ($39.9 million), it is higher than 5% of the first year MAR in this revised
proposal (around 38.5 million) 54
The Network Support and Control Ancillary Services rule (ERC0108) became live on 5 April 2012. However, the process for procuring this particular service was already in progress so the existing process applied.
55 ‘Network Support and Control Ancillary Service (NSCAS) Assessment 2012’, AEMO, p8

CAPITAL EXPENDITURE | 2018/19-2022/23 4
Page 106 of 158
TransGrid made the lowest offer to the competitive tender and the non-prescribed contract was put in
place with AEMO. It is due to expire at the end of June 2019 after which the service is expected to still
be required.
This NSCAS contract is costing consumers much less than it did before 2013/14. AEMO’s “Non-Market
Ancillary Services Cost and Quantity Report” shows that the service cost $30 million less in 2013/14
than it did in 2012/13 with a different provider.56
4.10.1 TransGrid’s proposal
The NSCAS contract will expire at the end of June 2019. As the service is still expected to be required
at that point, TransGrid propose to provide it as a prescribed service.
We proposed that this could be achieved by incorporating the relevant reactor assets into the RAB from
1 July 2019, at a depreciated value of $26 million. The service would then be funded like any other
prescribed service provided by assets in the RAB.
4.10.2 AER draft decision
The AER accepted the need for the service and accepted that the assets should be included in the
RAB. However, it proposed that their asset value should be set at $0.
In effect, the AER is proposing that TransGrid provides this service for free for the next 35 to 40
years.
The rationale was that TransGrid should earn no further revenue from the assets as by July 2019, their
costs will have been recovered via the NSCAS contract revenue.
4.10.3 Our response
TransGrid is confident that the existing assets can provide the required service for the lowest cost.
However, it is unreasonable to require a business to provide a free service for 35 to 40 years. Like any
business, TransGrid is entitled to make a fair return on its investments.
The fact that some costs may have been recovered prior to their use as a prescribed asset does not
lessen the need for the business to make a return on the investment.
Higher risk for TransGrid, savings for customers
TransGrid is providing a service which reduces electricity costs to consumers but is exposed to higher
risk while doing so.
This NSCAS service has resulted in considerable customer savings – in the region of $30 million per
year based on the contract in place previously. In fact, TransGrid responded to AEMO and installed the
assets earlier than planned so that the customer savings could be realised earlier.57
However, the
NSCAS contract exposes us to a higher level of risk than a prescribed service as it includes onerous
penalties for asset unavailability.
56 AEMO publishes annual NSCAS costs for each state in its ‘Non-Market Ancillary Services Cost and Quantity Report’. Table 5 of the
2016/17 report shows: In 2012/13 and 2013/14, the costs for the previous provider of this service were $23,772,200 and $44,497,327 respectively. In 2014/15, consumers paid $9,896,698 for TransGrid’s service.
57 This was reflected in the contract terms, which allowed for partial service delivery prior to the full service commencement date in the
event that we fully commissioned some of the reactor assets early.

TRANSGRID REVISED REVENUE PROPOSAL | 2018/19-2022/23 4
Page 107 of 158
Adding the assets to the RAB at a depreciated value and earning a fair return is a reasonable
proposition. It is consistent with both the regulatory framework and reasonable business expectations.
The AER’s draft decision is not reasonable in that:
It will require us to provide a free service for many years
It does not offer a fair return on assets which have saved customers possibly up to $100 million
since 2013 (assuming the previous contract had continued on).
TransGrid discussed this decision with its Revenue Proposal Working Group, which comprises
consumer representative groups and transmission customers. All members seemed perplexed by the
AER’s decision and some expressed that it was unreasonable.
Regulatory precedent
This draft decision may be unprecedented in requiring a business to earn no revenue on assets put in
place for the benefit of consumers over so many years.
In fact, there is also some evidence of a contradictory precedent. The Directlink Market Network
Service Provider (MNSP) converted to regulated status in 2006. When the regulatory test (a precursor
of the RIT-T) was applied, it was found that neither Directlink nor an alternative was a justified
investment.
In its draft decision, the AER described the situation as follows:
On the one hand it could be argued that Directlink should be provided with an asset value of zero
since its construction could not be justified today. However, on the other hand as Directlink already
exists and provides benefits to market participants over and above its operating costs, an
asset value that is greater than zero would be appropriate. 58
[added emphasis]
Then in reviewing an alternative asset valuation method, it was also noted that:
In applying this approach the AER was conscious of the need to avoid adversely affecting
incentives for future investment. [added emphasis]
This approach was considered reasonable, as it provided a fair and reasonable risk adjusted return on
efficient investment.
It is acknowledged that much time has passed, the circumstances were different and we now operate
under different Rules. However, the example highlights the contrast with our situation. At that time it
was considered fair and reasonable that an existing asset whose construction “could not be justified”
was still able to earn a return.
In contrast, our assets provide a necessary and valued service and yet are to be provided for free.
4.10.4 Revised proposal
TransGrid has reviewed the rationale of the draft decision. We feel that it is unreasonable and have
found that consumer representatives and customers support this conclusion.
We therefore propose that, from 1 July 2019, the assets providing the NSCAS service should be
incorporated into the RAB with a depreciated value of $26 million.
The assets will earn a fair return while continuing to provide a valuable service to consumers, who have
already benefited greatly from the cost savings they have created.
58 ‘DJV application for conversion and revenue cap—draft decision’ (Page ix), AER, 5 December 2005

OPERATING EXPENDITURE | 2018/19-2022/23 5
Page 108 of 158
5. Operating Expenditure
5.1 Introduction
In its revenue proposal, TransGrid submitted a forecast operating expenditure that is an efficient,
prudent and realistic level of expenditure, developed using up to date forecasts and closely aligned with
the AER’s guidelines. TransGrid proposed a total forecast operating expenditure of $908 million ($June
2018) for 2018/19 to 2022/2359
. An additional $14 million ($June 2018) step change relating to
compliance with TransGrid’s licence conditions was subsequently included and considered by the AER
in addition to our January 2017 revenue proposal.
In the draft decision, the AER proposed an alternative total forecast operating expenditure of $857
million ($June 2018), excluding debt-raising costs, representing a 5.6% reduction. Debt-raising costs
are covered separately in Section 5.8.
The comparison between the revenue proposals and draft decision is shown in Table 5.1 below.
Table 5.1: TransGrid’s proposed operating expenditure and the AER draft decision60
($m June
18)
2018/19 2019/20 2020/21 2021/22 2022/23 Total
TransGrid proposed
operating expenditure
177.2 178.8 181.3 184.0 186.4 907.7
AER draft decision operating
expenditure
169.6 170.7 171.4 172.2 173.2 857.1
TransGrid revised proposal
operating expenditure
172.0 173.4 175.3 177.4 179.6 877.6
Source: TransGrid. Totals may not add due to rounding.
The Rules61
require the AER to accept the transmission network service provider’s forecast operating
expenditure included in the revenue proposal if it is satisfied that the operating expenditure for the
regulatory control period reasonably reflects:
The efficient costs of achieving the operating expenditure objectives
The costs that a prudent operator would require to achieve the operating expenditure objectives
A realistic expectation of the demand forecast and cost inputs required to achieve the operating
expenditure objectives62.
TransGrid has spent considerable time in reviewing alternatives and improving its operating
expenditure estimates to ensure the obligations of the Rules are met and that there is a sufficient and
efficient level of operating expenditure to deliver transmission services.
59 Excludes debt raising costs.
60 All numbers exclude debt raising costs.
61 National Electricity Rules.
62 National Electricity Rules, Clause 6A.6.6(c).

TRANSGRID REVISED REVENUE PROPOSAL | 2018/19-2022/23 5
Page 109 of 158
These considerations were set out in our revenue proposal and included:
How TransGrid’s operating expenditure aligns with our commitment to:
Testing new ideas and practices to drive improvements
Listening and responding to consumers
Demonstrating a strong level of efficiency and performance
Considering alternative and more balanced approaches for determining forecasted growth
Committing to achieve ongoing cost savings through transformational change
Seeking independent experts assessments and benchmarking reports to confirm its estimates
presented and when considering differing approaches
Establishing a base year.
In this revised proposal, TransGrid has carefully considered whether to accept the AER’s draft decision
operating expenditure estimate and the methodology used to prepare its operating expenditure
forecasts. Overall, the AER has not accepted most of the improvements proposed by TransGrid and
has applied the same approach and benchmarks used in its recent Network Service Provider (NSP)
determinations and TransGrid’s last determination.
The AER has accepted TransGrid’s more accurate starting forecast and acknowledges this. TransGrid
accepts the AER’s preference for its own approach to estimating trend and has adopted the AER’s
method. TransGrid has also accepted the AER’s decision on the step-change for off-easement
management.
Within these parameters, TransGrid has set out a forecast operating expenditure it considers is
required to achieve the operating expenditure objectives for the 2018/19 to 2022/23 regulatory period of
$877.6 million, which is marginally higher than the AER’s alternative estimate by 2.4%.
The primary drivers for the increase over the AER’s draft determination are:
Utilising the latest available information and data since submitting the proposal
Utilising the same rate of change methodology as the AER, and updating the factors using the
AER’s latest benchmarking results
Reconfirming the step change requirement to meet NSW licence requirements
Correcting the AER’s operating expenditure model errors.
In this revised proposal, TransGrid has updated its expenditure forecast considering the matters raised
by the AER in its draft decision as well as noting that the AER will consider updating its final
determination with the latest data available including the economic benchmarking results from the
AER’s 2017 Transmission Benchmarking Report.63
The total forecast operating expenditure as a result of these amendments set out above has reduced
TransGrid’s proposed operating expenditure by approximately $44 million over the 2018/19 to 2022/23
period compared to the revenue proposal.
63 AER: Draft Decision TransGrid transmission determination 2018 to 2023, September 2017, p.7-32.

OPERATING EXPENDITURE | 2018/19-2022/23 5
Page 110 of 158
The table below sets out our proposed operating expenditure.
Table 5.2: TransGrid’s Proposed operating expenditure and the AER draft decision ($m June 18)
$m June 2018 2018/19 2019/20 2020/21 2021/22 2022/23 Total
Revised proposal
operating expenditure64
172.0 173.4 175.3 177.4 179.6 877.6
Source: TransGrid. Totals may not add due to rounding.
This revised proposal operating expenditure compared to the AER’s draft determination is set out in
Figure 5.1.
Figure 5.1: Comparison of operating expenditure forecasts, $m June18
5.2 Summary of TransGrid Proposal
Chapter 6 of TransGrid’s revenue proposal sets out the methodology, key inputs and assumptions used
to determine the operating expenditure forecast for the next regulatory control period.
TransGrid closely aligned its forecast methodology with the AER’s expenditure forecast assessment
guideline with a small number of variations supported by independent expert advice. Specifically
TransGrid undertook enhanced approaches for the following areas:
Forecast starting point
Weighting of the wage forecast
Industry productivity
Output growth.
64 Excludes debt raising costs.
50
100
150
200
2012
/13
2013
/14
2014
/15
2015
/16
2016
/17
2017
/18
2018
/19
2019
/20
2020
/21
2021
/22
2022
/23
$m
(Ju
ne
20
18
)
Historical Actual Revised Proposal Draft Decision - AER

TRANSGRID REVISED REVENUE PROPOSAL | 2018/19-2022/23 5
Page 111 of 158
5.2.1 Forecast Starting Point
The forecast starting point for TransGrid’s operating expenditure estimate of the control period did not
use the AER approach. The AER’s methodology for forecast starting point, takes the current regulatory
period (2014/15 – 2017/18) base year under, or over spend, away from the final year allowance as the
basis for setting the future allowance for the next regulatory period (2018/19 – 2022/23). TransGrid
proposed a more accurate measure of establishing the starting point allowance for the proposal by
taking its latest revealed base year operating expenditure (2016/17) and escalating it using the most
recently available estimates of cost escalators resulting in a 3% real planned cost savings in 2017/18.
Whilst TransGrid has proposed to deliver cost savings during 2017/18, we recognised that further
material savings may not be achievable in the near term based on an environment of increasing
regulatory pressures65
and benchmarking trends indicating negative industry productivity66
.
5.2.2 Escalation Trend
Weighted wage forecasts were based on BIS Shrapnel’s independent forecast of wage changes with
weightings based on TransGrid’s actual internal labour composition. We applied an internal labour
proportion of 70% of operating expenditure in the 2016/17 base year reflecting:
The long term trend of TransGrid’s actual labour ratios
An efficient actual operating expenditure according to various sources, including the AER’s final
revenue decision in 2015, the AER’s 2016 Benchmarking Report and the 2015 ITOMS report.
Forecast industry productivity was set to zero instead of the AER’s benchmarked 0.2%. We considered
a wide range of independent productivity measures that all indicated negative productivity for Australian
utilities.
The output growth methodology used by the AER for the majority of its recent decisions for
transmission network service providers was replaced with network growth factors in our proposal. Our
approach was to calculate output growth by considering commissioned augmentation relative to the
replacement cost of the network, modified by economies of scale. TransGrid considers that it reflects a
more accurate method and the AER had accepted a similar network growth approach proposed by
AusNet. At the time of submitting our revenue proposal, we addressed the AER’s concerns around the
AusNet methodology and were reluctant to adopt the AER’s methodology given concerns with the
accuracy of the AER’s benchmarking approach.
5.2.3 Step Changes
TransGrid identified two step changes in operating expenditure that were scheduled to commence in
2018/19 and continue through the regulatory period, specifically:
Off easement risk management
Compliance with NSW Licence conditions.
We included the step change of $37.5 million in our forecast for ‘off-easement risk management’ to
mitigate fire risks from trees which are outside TransGrid easements but could contact conductors if
they fell. This requirement is related to the new compliance framework put in place when our safety
regulator changed.
65 TransGrid: Revenue proposal, January 2017, p.123.
66 TransGrid: Revenue proposal, January 2017, p.145.

OPERATING EXPENDITURE | 2018/19-2022/23 5
Page 112 of 158
TransGrid’s second step change is the need to comply with the Transmission Operators Licence under
the Electricity Supply Act 1995 (NSW), introduced on 7 December 2015 and various conditions from the
Foreign Investment Review Board arising from the change in ownership. At the time of the revenue
proposal, TransGrid did not have sufficient information to complete any cost adjustments. A business
case, further details and responses to information requests were subsequently provided to the AER
prior to its determination. TransGrid recommended an additional $14.4 million of operating expenditure
and submitted this to the AER on 5 July 2017.
5.2.4 Debt Raising Costs
TransGrid proposed debt raising costs of $40 million comprising benchmark unavoidable costs which
include arrangement fees, legal fees, company credit rating fees and other transaction costs that are
incurred in the course of debt raising activity.
We used modern debt management practices to ensure businesses can maintain appropriate credit
ratings to estimate the benchmark efficient costs of raising debt. The debt raising costs proposed by
TransGrid comprise three main drivers, which are:
The transaction related costs of issuing the bonds
Refinancing maturing debt at least three months ahead of the debt maturing
Meeting formal requirements with respect to liquidity (which refers to the buffer the business has to
meet for short term cash requirements).
Whilst the AER has previously accepted transaction related costs, TransGrid engaged economic
consultants, Incenta, to consider the other two drivers and based upon their advice we considered that:
refinancing three months ahead and liquidity costs are costs that a prudent and efficient operator
will incur when participating in debt markets over the next regulatory control period
Incenta has demonstrated that a prudent and efficient operator incurs costs to meet the
requirement in relation to liquidity and the timing of refinancing of debt in order to maintain an
investment grade credit rating as well as maintaining an investment grade credit rating67
.
5.3 Summary of AER’s Draft Decision
In the draft decision, the AER used a base-step-trend approach to forecast the operating
expenditure. The AER draft decision did not accept TransGrid’s proposed forecast of $908 million68
($June 2018) and estimated an amount of $857 million ($June 2018)69
.
The AER estimate was lower due to:
Applying a lower rate of change for forecast growth in prices, output and productivity
Excluding the step change for off-easement risk management and allowing only part of the costs
for NSW licence compliance
Setting a lower forecast of debt raising costs.
67 Incenta (December, 2016), Debt Raising Cost – TransGrid’s 2018/19 to 2022/23 Revenue Determination, Report for TransGrid.
[TransGrid-Incenta-Appendix L Debt Raising Cost TransGrid 2018_19 to 2022_23 Revenue Determination-0117-PUBLIC], p.1. 68
Excluding debt raising costs. 69
Excluding debt raising costs.

TRANSGRID REVISED REVENUE PROPOSAL | 2018/19-2022/23 5
Page 113 of 158
5.3.1 Forecast Starting Point
The AER was satisfied with TransGrid’s starting point operating expenditure estimate as the basis of
establishing the 2018/19-2022/23 allowance. The AER has accepted that our 2016/17 expenditure
drivers which establish the starting point are likely to reflect those in the forecast period. Having also
considered the benchmarking results the AER is satisfied that the estimate is not materially inefficient70
.
The AER accepted TransGrid's forecast for 2017/18 efficiency improvements for transformational
changes and carried these forward into the 2018/19-2022/23 operating expenditure forecast as
proposed by TransGrid71
.
5.3.2 Escalation Trend
The AER forecast trend for output was based on the results of its 2016 partial factor productivity
benchmarking for transmission businesses72
and did not accept TransGrid’s alternative of considering
commissioned augmentation relative to the replacement cost of the network, modified by economies of
scale.
The AER did not accept the BIS Shrapnel labour escalation forecasts used by TransGrid but rather
used forecasts prepared by Deloitte Access Economics.
Further the AER forecast productivity growth of 0.2 percent per year based on its expert consultant’s,
Economic Insights, recommendations as well as evidence of historical measured productivity growth73
.
The AER did not accept TransGrid’s input price weights based on actuals of 70% labour and 30% non-
labour and used a 62% and 38% weighting respectively.
5.3.3 Step Changes
The AER did not accept TransGrid’s step change for off easement risk management totalling $37.5
million and partially accepted the step change for TransGrid’s compliance with NSW Licence conditions
for $7.8m of the requested $14.4 million.
5.3.4 Debt Raising Costs
The AER did not accept TransGrid’s approach to measuring debt raising costs (comprising transaction,
debt raising and liquidity costs) and based the forecast debt raising costs transaction costs only.
5.4 TransGrid’s Revised Proposal
TransGrid is pleased that the AER has accepted the 2016/17 year as an efficient base year for
forecasting future costs. 2016/17 represents the first full year of operations under the new ownership.
Further, the AER accepted that our 2016/17 expenditure drivers which establish the starting point are
likely to reflect those in the forecast period. Having also considered its benchmarking results the AER is
satisfied that the estimate is not materially inefficient. TransGrid’s actual operating expenditure result for
2016/17 is lower than forecast, having achieved additional efficiency savings since submitting its
proposal.
70 AER: Draft Decision TransGrid transmission determination 2018 to 2023, September 2017, p.7-21.
71 AER: Draft Decision TransGrid transmission determination 2018 to 2023, September 2017, p.7-38.
72 AER: Draft Decision TransGrid transmission determination 2018 to 2023, September 2017, p7-33.
73 Economic Insights, Memorandum: TNSP MTFP Results, 29 April 2016, p.5.

OPERATING EXPENDITURE | 2018/19-2022/23 5
Page 114 of 158
The AER has accepted TransGrid’s more accurate method of determining the starting point forecast
and acknowledges this. The AER has also accepted our 3% efficiency saving forecast for 2017/18
comprising wages and output growth and transformation program expenditure savings.
TransGrid accepts the AER’s preference for its own approach to estimating trend and has adopted the
AER’s method.
TransGrid has also accepted the AER’s decision on the step-change for off easement management.
We note the AER has only partially accepted the increased costs arising from the NSW licence
conditions for IT security and has requested further information. TransGrid proposes a reduced amount
of $13.9 million is required to support these new obligations and has provided further detail in
confidential Appendix B with a summary in section 5.7.1.
TransGrid considers that the AER’s operating expenditure forecast needs to be increased; otherwise it
understates the efficient costs of achieving the necessary operating expenditure objectives for a
transmission business. The key drivers for TransGrid’s revised operating expenditure forecast are:
Utilising the latest available information and data since the proposal
Utilising the AER’s rate of change methodology
Updating the rates of change with the AER’s latest benchmarking results
Reconfirming the step change requirement to meet NSW licence requirements
Removing the step change for off-easement risk management
Correcting a CPI calculation error in the AER’s operating expenditure model used in the draft
determination.
In preparing our alternative forecast, we have used the latest available information and data since our
original submission in January 2017. Specifically, the revised operating expenditure forecast has been
updated to incorporate:
2016/17 actual operating expenditure set out in the annual economic benchmarking RIN and
TransGrid’s Annual Regulated Accounts, both submitted to the AER on 25 October 2017
The most recent forecast of inflation and Reserve Bank inflation forecasts74
, consistent with the
AER’s practice of using the most recent information at the time of a decision
The most recent forecast labour escalation, adopting the AER’s previous determination practice of
applying an average of the forecast from BIS Shrapnel for EGWWS WPI for NSW (October 2017)
and Deloitte Access Economics (supplied by the AER in October 2017 draft determination Opex
Model)
The AER’s method of using TransGrid’s forecasts outputs measures and the AER’s benchmarked
weights, and updated both of these to be consistent with the AER’s latest benchmarking report75
.
TransGrid has accepted the AER’s preferred approach to output growth, trends and industry
productivity. We have applied the AER’s output growth trend and productivity trend updated for the
latest 2017 AER benchmarking report.
TransGrid has accepted the AER’s draft determination for the removal of the step change for off
easement risk management. The implications of this exclusion from the forecast operating expenditure
over the next regulatory period is discussed at section 5.7.2.
74 RBA statement of monetary policy inflation forecast, August 2017, Table 6.1
75 AER, Annual Benchmarking Report, Electricity transmission network service providers Draft Only, November 2017.

TRANSGRID REVISED REVENUE PROPOSAL | 2018/19-2022/23 5
Page 115 of 158
As a result of these amendments set out above, the forecast operating expenditure has reduced by
approximately $44 million over the 2018/19 to 2022/23 period compared to our revenue proposal.
The table below sets out a summarised breakdown of our revised proposal, taking into consideration
the amendments outlined above, compared to the AER’s draft determination76
.
Table 5.3: TransGrid’s operating expenditure proposals and the AER draft decision ($m June 18)
Source: TransGrid. Totals may not add due to rounding.
5.5 Base operating expenditure
In the draft decision the AER accepted TransGrid’s forecast operating expenditure in 2016/17 as an
efficient base year expenditure. Further, the AER has accepted that our 2016/17 expenditure drivers
which establish the starting point are likely to reflect those in the forecast period. Having also
considered the benchmarking results, the AER is satisfied that the estimate is not materially inefficient.
TransGrid cited a number of benchmarks to confirm its operating expenditure efficiency.
The AER accepted TransGrid’s starting point for forecasting operating expenditure in 2018/19-2022/23.
From the base year we use a differing approach to the AER to forecast the operating expenditure. We
take the latest revealed base year operating expenditure (2016/17) and escalate it using the most
recently available estimates of cost escalators, including planned cost savings in 2017/18. It is our view
that a more accurate estimate is obtained by this approach. Our operating expenditure proposal
includes an additional cost savings expected in 2017/18 to deliver a further 3% net reduction compared
to 2016/17 expenditure.
TransGrid identified an error in the CPI table of the AER’s operating expenditure model, which impacted
the value of the starting point, and this has now been corrected in this revised proposal.
76 Excluding debt raising costs.
TransGrid
Proposal (Incl. revised
Step Change)(1)
AER
Alternative
Estimate
Difference
to TransGrid
TransGrid
Revised
Proposal
Difference
to AER
Alternative
Estimate
Based on reported operating expenditure in 2016/17 868.7 862.9 -5.8 864.3 1.4
2016/17 to 2017/18 Increment -26.6 -26.4 0.2 -25.9 0.5
Output growth* 2.3 2.7 0.4 6.3 3.6
Price growth* - Wage Increases/Labour Ratio 26.0 15.1 -10.9 19.1 4.0
Productivity growth* 0.0 -5.1 -5.1 0.0 5.1
Step change - (Off Easement & Licencing Conditions) 51.7 7.8 -43.9 13.9 6.1
Total operating expenditure 922.1 857.1 -65.0 877.7 20.6* Revised proposal based on AER draft TNSP benchmarking results November 2017 1 TransGrid has removed the AER's economies of scale assumption w hen re-presenting Output Grow th & Productivity Grow th

OPERATING EXPENDITURE | 2018/19-2022/23 5
Page 116 of 158
5.6 Rates of change
5.6.1 Overall Approach
The AER’s approach to forecasting a trend for operating expenditure comprises:
Price change, which measures how the underlying prices are expected to change over time
Output change, which measures how the total quantity of a business’ output is expected to change
over time
Productivity change, which is a measure of how an industry’s efficiency of production is assessed
to change over time.
The AER has relied on its annual benchmarking report from 2016, prepared by its expert consultant,
Economic Insights as the basis for preparing rate of change for revenue determination purposes.
TransGrid has previously disagreed with aspects of the benchmarking of TNSPs and the AER’s
approach to forecasting the rate of change of operating expenditure when preparing its current
regulatory period revenue proposal77
Again, when preparing this proposal we looked at alternative
methods and benchmarking data for particular components of the rates of change to assist in
developing a forecast with the best information and data available.
Given that the AER has again applied its standard approach, we will accept the AER’s preferred
approach to the rate of change in the revised proposal.
5.6.2 Price Change
Given the changes in ownership, TransGrid sought to apply a wages growth index that reflected a
broader industry Wages Price Index (WPI) measure that applied to private utilities.
In the draft decision the AER adopted forecast growth in the public and private WPI for the NSW utilities
industry to forecast labour price growth provided by Deloitte Access Economics (supplied by the AER in
October 2017 draft determination)
Accepting the AER’s concerns about the use of a private utility index for all of Australia, TransGrid has
sought an update from BIS Shrapnel using the NSW wage price index for the Electricity Gas Water
Waste & Sewage sector.
Consistent with the AER’s previously used methodology, TransGrid has updated the price change index
to use an average of the NSW EGWWS WPI forecasts from BIS Shrapnel (updated October 2017) and
Deloitte Access Economics (supplied by the AER in September 2017 draft determination). BIS
Shrapnel’s latest forecast is set out at Appendix A.
The AER has also adjusted the forecast for CPI based on more up to date information and TransGrid
has corrected a CPI index table in the operating expenditure model and agreed with the AER those
corrections
In our proposal, we sought independent advice to confirm the applicability of using our internal labour to
expense ratio as a substitute for the AER’s benchmark values, as we considered that:
AER’s benchmarking rates were out of date, where the 62% estimate for labour composition was
initially developed in 2004 by Pacific Economics Group and later reviewed by Economic Insights78
.
77 TransGrid, Revised revenue proposal 2014/15 – 2017/18, 13 January 2015, p.89.
78 Economic Insights: Memorandum to the AER – Operating expenditure input price index weights, 19th February 2016, pp.2-3.

TRANSGRID REVISED REVENUE PROPOSAL | 2018/19-2022/23 5
Page 117 of 158
AER’s estimate was based on five electricity and one gas distribution business with assets, service
requirements and operations which are quite different from TransGrid’s
Third party advice from Herbert Smith Freehills supported the use of TransGrid’s rate “… the
operating expenditure objectives require an accurate forecast to be determined. We do not
consider that the 62% weighting recently used by the AER would result in an accurate forecast that
would reflect the realistic input costs of TransGrid.79
Whilst the AER did not accept TransGrid’s estimate of 70% and applied 62% weighting to labour, the
AER recognised that over time the efficient input mix could change and anticipated the 2017
benchmarking process would conclude prior to making a final determination80
and that if further analysis
is done the AER will consider this in its final decision.
With the 2017 benchmarking data now available, TransGrid has updated the labour weighting to 70.4%
consistent with the AER’s expert consultant, Economic Insights, benchmarking report81
stating:
Across all TNSP’s, the proportion of labour (from in-house labour, field services contracts and non-
field-services contracts) was 70.4 per cent. We used the updated proportion in this report for all
years.
5.6.3 Output Change
A measure of output change is required to adjust the base year costs for the differing levels of activity in
the future years, for example, as the network grows then a larger operating and maintenance
expenditure may be required (all else being equal).
TransGrid’s proposal considered a network growth moderated by economies of scale methodology.
The AER had accepted a similar approach by AusNet in its November 2015 proposal. Noting the AER
had a number of qualifications, we took care to address the AER’s concerns on this approach. In
developing our revised approach we sought advice from the TransGrid Advisory Council, and based on
the advice from our customers and stakeholders, forecast network growth as follows:
𝑁𝑒𝑡𝑤𝑜𝑟𝑘 𝑔𝑟𝑜𝑤𝑡ℎ𝑡 =𝐹𝑜𝑟𝑒𝑐𝑎𝑠𝑡 𝑝𝑟𝑒𝑠𝑐𝑟𝑖𝑏𝑒𝑑 𝑎𝑢𝑔𝑚𝑒𝑛𝑡𝑎𝑡𝑖𝑜𝑛 𝑒𝑥𝑝𝑒𝑛𝑑𝑖𝑡𝑢𝑟𝑒𝑡
𝐹𝑜𝑟𝑒𝑐𝑎𝑠𝑡 𝑟𝑒𝑝𝑙𝑎𝑐𝑒𝑚𝑒𝑛𝑡 𝑐𝑜𝑠𝑡 𝑜𝑓 𝑝𝑟𝑒𝑠𝑐𝑟𝑖𝑏𝑒𝑑 𝑛𝑒𝑡𝑤𝑜𝑟𝑘 𝑡
To calculate the effect of network growth on operating expenditure TransGrid used similar economies of
scale factors to AusNet, applied on a lagging one year basis:
𝐺𝑟𝑜𝑤𝑡ℎ 𝑖𝑛 𝑜𝑝𝑒𝑥 𝑟𝑒𝑞𝑢𝑖𝑟𝑒𝑚𝑒𝑛𝑡𝑡+1 = 𝑁𝑒𝑡𝑤𝑜𝑟𝑘 𝑔𝑟𝑜𝑤𝑡ℎ𝑡 𝑥 𝐸𝑐𝑜𝑛𝑜𝑚𝑦 𝑜𝑓 𝑆𝑐𝑎𝑙𝑒 𝐹𝑎𝑐𝑡𝑜𝑟𝑡
We explored this alternative approach against the AER’s standard approach82
as we held concerns
around the benchmarking method and were reluctant to adopt the AER’s methodology until the AER
and Economic Insights had an opportunity to consider our proposal and comment on Frontier
Economics report83
. This report set out a number of concerns with the AER’s benchmarking
methodology.
79 Herbert Smith FreeHills: TransGrid – Operating expenditure, 23
rd January 2017. [TransGrid-Herbert Smith Freehills-Appendix K
Operating expenditure advice-0117-PUBLIC] 80
AER: Draft Decision TransGrid transmission determination 2018 to 2023, September 2017, p7-27. 81
Economic Insights: Economic Benchmarking Results for the AER’s 2017 TNSP Benchmarking Report, p.6. 82
AER: Draft Decision TransGrid transmission determination 2018 to 2023, September 2017, p.7-30. 83
TransGrid; Revenue Proposal, 31 January 2017, Appendix G.

OPERATING EXPENDITURE | 2018/19-2022/23 5
Page 118 of 158
In its draft determination the AER did not accept TransGrid’s approach for measuring output growth and
adopted its standard approach of applying benchmarked output measures with TransGrid’s asset
information supplied in TransGrid’s RIN submitted with the revenue proposal.
TransGrid has accepted the AER’s approach to establish output growth from the AER’s draft
determination in this revised submission and has updated the operating expenditure model with:
Output measures, using Economic Insights 2017 benchmarking report from the AER84
Replacing connection points with the AER’s NSW customer data used in the benchmarking report
(2006-2016 customer data) and extrapolating customer numbers for the next regulatory period
using the ordinary least squares regression method to establish a historical based customer growth
rate.
We note that the Distributors RINs will be available in January 2018 to the AER, which will enable the
AER to update TransGrid’s estimate of the forecast customer numbers before it completes its final
determination.
From the draft decision we note that the AER is currently reviewing its economic benchmarking report
including the consideration of using end users rather than voltage-weighted connections as well as
updating the weights.
Economic Insights in preparing its Benchmarking report for the AER stated that:
There was general support for all aspects of the revisions other than the substitution of end-user
numbers for the voltage-weighted number of connections. On balance, we view moving to
incorporating end user numbers as beneficial in capturing important aspects of scale and
complexity, removing some anomalous results, and utilising robust data that is already
available85
.
The AER in its draft benchmarking report agreed with Economics Insights assessment in moving to
customer numbers.86
5.6.4 Productivity Change
A measure in productivity change captures the ability to identify and implement efficiency improvements
and benefits from broader economy wide productivity improvements such as technology changes.
TransGrid in establishing a suitable productivity measure for forecasting efficiency changes for its
revenue submission wanted to make an informed decision rather than relying on the AER’s historical
measures. Our recent change in ownership structure and new licencing obligations pose additional
constraints on how the business can operate and will potentially reduce opportunities that could drive
productivity in the future.
TransGrid considered the following potential alternatives to establish an appropriate productivity factor:
The Productivity Commission’s Productivity Update for 2016, where the report indicates that
EGWWS productivity has declined by 1.2% p.a. over the 1989/90 to 2014/15 period87
84 Economic Insights: Economic Benchmarking Results for the Australian Energy Regulator’s 2017 TNSP Benchmarking Report, 12
September 2017. 85
Economic Insights: Economic Benchmarking Results for the Australian Energy Regulator’s 2017 TNSP Benchmarking Report, 12 September 2017, p.5.
86 AER: Annual Benchmarking Report – Electricity transmission service providers Draft Only, November 2017, p.10.
87 Productivity Commission Productivity update, April 2016, p.10.

TRANSGRID REVISED REVENUE PROPOSAL | 2018/19-2022/23 5
Page 119 of 158
Productivity in NSW by David Buckland & Harley Smith, NSW Trade & Investment, published 18
September 2014, indicates a decline in NSW utility productivity of approximately 1.86% p.a.
between 1995 and 2013 using a multi factor productivity measure88
The AER’s latest assessment of distribution networks productivity, from their 2016 benchmarking
report, where the aggregate Australian distribution network service provider productivity in
operating expenditure terms has declined at a rate of approximately 1.8% per annum since
2005/0689
.
Whilst the results from the productivity reports above all indicate a significant negative industry
productivity trend. TransGrid assumed no change in industry productivity for the forecast period in its
proposal.
This was a conservative assumption, which reduced TransGrid’s forecast revenue requirement. The
AER did not accept TransGrid’s productivity growth measures, which they considered less suitable than
the industry measure they had used90
. The AER’s productivity measure in the draft determination and
other recent transmission determinations91
implies 0.2% productivity growth factor for Australian
TNSPs. This is based on the operating expenditure specific measure of productivity called industry-
level partial factor productivity-opex. The AER forecast is based on analysis undertaken by its expert
consultant, Economic Insights, from the 2016 benchmark data.92
Since the AER’s draft determination, the AER’s draft benchmarking data has become available. Based
on this, TransGrid has calculated regression based growth rates using the same models as Economic
insights, for:
2006-2016, partial productivity operating expenditure rate, (using Economic insights new
specification) -0.37% indicating a productivity decrease
2006-2016, partial productivity operating expenditure rate, (using Economic insights old
specification) +0.07, indicating a negligible productivity growth.
The figure below sets out a comparison of the partial productivity operating expenditure factors of the
transmission businesses comparing the AER’s 2016 benchmarking data to the 2017 benchmarking
data, using the old and new benchmarking methods. Transmission businesses productivity levels have
been clearly trending down since 2013. The trend growth rate of operating expenditure partial
productivity from 2006 to 2015 was 0.2 percent per annum and under the new method the trend growth
rate has subsequently fallen to -0.37 per cent.
88 David Buckland & Harley Smith, NSW Trade & Investment, Productivity in NSW, 18 September 2014.
89 AER, Economic Insights DNPS benchmarking data files, 7 November 2016, Series PP Operating expenditure.
90 AER: Draft Decision TransGrid transmission determination 2018 to 2023, September 2017, p.7-35.
91 AER: Draft decision Powerlink transmission determination operating expenditure model September 2016.
92 Economic Insights: Memorandum: TNSP MTFP, 29 April 2016, p.5.

OPERATING EXPENDITURE | 2018/19-2022/23 5
Page 120 of 158
Figure 5.2: Comparison of AER 2016 & 2017 operating expenditure productivity benchmarks
Source: TransGrid using AER economic benchmarking data (2016 and 2017).
TransGrid in its revised proposal has held its view, supported by the latest benchmarking results, that
productivity in the transmission and associated industries is clearly in decline. However adopting a
negative trend is inconsistent with TransGrid’s expected performance and we have again assumed no
change in the industry productivity for the forecast period. Again, this is a conservative assumption
compared to the available information, including the AER’s benchmarking report. The assumption
reduces TransGrid’s revenue.
In its revised proposal, TransGrid has a 3% real efficiency saving target for 2017/18 over 2016/17
results.
In one part of its draft decision the AER incorrectly applied TransGrid’s proposed economies of scale
which were part of the output growth measure to industry productivity. This is incorrect and inconsistent
with TransGrid’s revenue proposal93
.
5.7 Step Changes
5.7.1 Licence Conditions
This step change arises from the need for TransGrid to comply with the Transmission Operators
Licence under the Electricity Supply Act 1995 (NSW), introduced on 7 December 2015 and the various
conditions from the Foreign Investment Review Board arising from TransGrid’s change in ownership.
TransGrid submitted the details of the step change request to the AER on 5 July 2017, requesting
$14.4 million to meet the new compliance requirements and supplemented this request through
subsequent information requests from the AER.
93 AER: Draft Decision TransGrid transmission determination 2018 to 2023, September 2017, p.7-33.
0.8500
0.9000
0.9500
1.0000
1.0500
1.1000
2006 2007 2008 2009 2010 2011 2012 2013 2014 2015 2016
Par
tial
Pro
du
ctiv
ity
-O
pex
Fac
tor
PPOpex - 2017 Annual Benchmarking - New Method PPOpex - 2017 Annual Benchmarking - Old Method
PPOpex - 2016 Annual Benchmark data sent by AER to TransGrid - Old -Method Linear (PPOpex - 2017 Annual Benchmarking - New Method)
Linear (PPOpex - 2016 Annual Benchmark data sent by AER to TransGrid - Old -Method)

TRANSGRID REVISED REVENUE PROPOSAL | 2018/19-2022/23 5
Page 121 of 158
The AER in its draft determination included an amount of $7.8 million as it was not satisfied that
TransGrid required the full cost increase it proposed to comply with the licence conditions in the
2017/18 – 2022/23 regulatory control period94
.
Since the AER’s draft determination the NSW government has drafted revised licence conditions which
are expected to be completed prior to the AER’s final revenue determination in April 2018. The
business needs and the extent of the allowance for the step change differs between the existing
conditions and the final version of the proposed conditions and the timing of any approval by the State
and Commonwealth. Therefore, TransGrid has prepared this step change submission, with its revised
revenue submission, based on two possible outcomes:
The step change allowance requirement under the retention of the “existing” licence conditions,
requiring incremental costs of $13.9 million ($June 2018), a reduction from the original submission
The step change allowance under the “proposed” licence conditions, if and when they become
approved, which would reduce the incremental costs to $8.0 million ($June 2018).
TransGrid has prepared a confidential paper with the further information requested at Appendix B. This
paper sets out:
Findings from the recently completed IPART audit of TransGrid’s licence conditions
An explanation of the expenditure required to comply with and maintain compliance.
Until the proposed licence conditions have been ratified, our revised revenue proposal includes an
amount of $13.9 million for the next regulatory period.
5.7.2 Off Easement Risk Management
TransGrid’s revenue proposal set out the detailed requirement to address the management of off
easement trees that pose a safety and reliability risk to the network. Whilst the costs are new, material
and real TransGrid accepts the AER’s view that they do not fit within the definition of step changes and
have not included these costs in the revised proposal.
5.8 Debt Raising Costs
TransGrid maintains that the debt raising costs included in the January 2017 revenue proposal are an
accurate estimate of the benchmark costs for an efficient business. The AER’s approach is out of date
and does not recognise the increased costs businesses face in raising debt post the global financial
crisis (GFC). TransGrid also believes the AER is incorrect to claim timing of the PTRM calculations can
offset these costs. These costs, as the AER recognises, are not working capital.
Nevertheless TransGrid accepts the AER will not recognise these costs in the revenue decision and
has not included them in the revised proposal. In practice, equity investors will be further
undercompensated as a result of this decision.
Table 5.4: Proposed debt raising costs ($m June 18)
$m June 2018 2018/19 2019/20 2020/21 2021/22 2022/23 Total
Debt Raising Costs 3.2 3.3 3.3 3.3 3.4 16.5
Source: TransGrid. Totals may not add due to rounding.
94 AER: Draft Decision TransGrid transmission determination 2018 to 2023, September 2017, p.7-47.

INCENTIVE SCHEMES | 2018/19-2022/23 6
Page 122 of 158
6. Incentive Schemes
6.1 Introduction
This chapter covers the three incentive schemes:
Capital Expenditure Sharing Scheme (CESS)
Service Target Performance Incentive Scheme (STPIS)
Efficiency Benefit Sharing Scheme (EBSS).
6.2 Capital Expenditure Sharing Scheme
The capital expenditure sharing scheme (CESS) allows savings to be shared between consumers and
a transmission business when capital expenditure in a period is lower than the capital expenditure
allowance. Consumers benefit through lower future network charges and the transmission business
receives a financial benefit for becoming more efficient. The business could also be subject to a
financial penalty if actual capital expenditure is higher than the allowance.
TransGrid accepts the modifications and updates the AER has made to TransGrid’s revenue proposal
for the CESS allowance. However, following a review, we have identified inconsistencies in the
approach TransGrid and the AER have used with the intended operation of the scheme. Following a
review by HoustonKemp, expert economic advisors, we have made three further modifications to the
calculation of the CESS allowance, to align it with the AER’s intended operation.
6.2.1 TransGrid’s Proposal
CESS was presented in chapter 14 of TransGrid’s revenue proposal and calculated based on CESS
Version 1. As the CESS has never been applied before, we acknowledge there may be some
refinement required in how to accurately calculate the CESS allowance.
TransGrid’s proposed CESS revenue of $24.3 million ($m June 18):
Excluded capital expenditure incurred for the network capability component of the Service Target
Performance Incentive Scheme (STPIS)
Excluded capital expenditure deferred into the 2018/19 to 2022/23 control period
Was based on net capital expenditure
Adopted a June to June CPI adjustment
Used the nominal vanilla WACC updated for cost of debt for the regulatory years 2015/16, 2016/17
and 2017/18
Proposed that the CESS would apply to the 2018/19 to 2022/23 regulatory control period, excluding
capital expenditure incurred for the network capability component of the Service Target
Performance Incentive Scheme (STPIS) and based on net capital expenditure.
6.2.2 AER’s Draft Decision
The AER’s draft decision accepted TransGrid’s proposal for CESS but:
updated the calculation for CPI
updated the WACC values for more recent information
adjusted the approach used to smooth the CESS revenue across the regulation period.

TRANSGRID REVISED REVENUE PROPOSAL | 2018/19-2022/23 6
Page 123 of 158
6.2.3 Response to Draft Decision
TransGrid accepts the modifications as set out in the AER’s draft decision; however, following a quality
review by HoustonKemp, we suggest that further adjustments are necessary.
The AER’s Framework and approach for TransGrid final decision states that the CESS version 1
(November 2013) will apply subject to the following clarifications:95
The calculation of costs and benefits already incurred is to be consistent with the timing
assumptions within the post-tax revenue model (PTRM), including:
The PTRM assumes that capex is incurred in the middle of the year. The return on capital
is not calculated until the start of the next year. To compensate the service provider for the
time between when capex is assumed to have been incurred and when the return on
capital is calculated, before it is rolled into the RAB, we inflate the nominal capex by a half
yearly WACC.
The use of an appropriate rate of return, ie:
When applying the rate of return to calculate incentive payments under the CESS we do
not intend to reward or penalise a service provider for inflationary effects.
That the CESS will apply to capital expenditure net of both capital contributions and disposals.
Following advice from HoustonKemp included as Appendix D, our revised proposal contains the
following changes from the model we submitted with our revenue proposal (January 2017), and that
adopted by the AER in the draft decision:
The removal of any financing benefit in the year that the underspend or overspend is incurred,
because a return on capital is not provided on capital expenditure until the start of the following
year
The financing benefit for each subsequent year incorporates the capitalisation of a ½ year return on
capital, consistent with the approach adopted in the PTRM and roll forward model (RFM)
The financing benefit for each subsequent year is calculated by multiplying the underspend (or
overspend) grossed up for the ½ year return on capital and the real Vanilla WACC, because the
PTRM delivers a real rate of return.96
The results for actual capital expenditure for 2015/16 and 2016/17 and forecast capital expenditure in
2017/18 are shown in Table 6.1.
95 AER, Framework and approach for TransGrid | For regulatory control period commencing 1 July 2018, July 2016, pages 20-22.
96 An explanation of why the regulatory framework delivers a real return on capital is set out in the AER’s, Regulatory treatment of
inflation | Preliminary position, October 2017, pages 60-61.

INCENTIVE SCHEMES | 2018/19-2022/23 6
Page 124 of 158
Table 6.1: Current period CESS performance ($m nominal)
2015/16 2016/17 2017/18
CESS capital expenditure target 309.7 242.4 230.2
Actual/forecast CESS capital expenditure 237.3 174.7 220.4
Difference
(actual/forecast underspend against CESS target) 72.4 67.7 9.7
Source: TransGrid. Totals may not add due to rounding.
On the basis of the outlined modifications to the AER's model, a CESS total of $32.8 million ($m June
18) has been included in TransGrid’s revised revenue proposal for 2018/19 to 2022/23.97
The CESS
payment for each year of the regulatory control period is set out in Table 6.2.
Table 6.2: CESS payment per year ($m June 18)
2018/19 2019/20 2020/21 2021/22 2022/23 Total
Revenue Proposal CESS 4.9 4.9 4.9 4.9 4.9 24.3
AER Draft Decision CESS 5.3 5.3 5.3 5.3 5.3 26.5
Revised Proposal CESS 6.7 6.7 6.7 6.7 6.7 33.7
Source: TransGrid. Totals may not add due to rounding.
6.3 Service Target Performance Incentive Scheme
The service target performance incentive scheme (STPIS) provides incentives for transmission network
service providers to improve and maintain the performance of the network for the benefit of consumers.
The scheme incentivises the business to outperform relative to its own previous performance which
becomes increasingly challenging over time. TransGrid has participated in the service target
performance incentive scheme since 2004. We have responded to the incentives to maintain or
improve reliability in accordance with the service component, reducing transmission congestion during
equipment outages in accordance with the market impact component. The STPIS is composed of three
components:
Service Component (SC)
Market Impact Component (MIC)
Network Capability Component (NCC).
6.3.1 TransGrid’s Proposal
STPIS was presented in chapter 16 of TransGrid’s revenue proposal.
In accordance with the scheme, TransGrid proposed:
Performance targets, caps and floors for parameters of the SC
97 The modified model used to calculate the CESS payment is attached to this revised proposal.

TRANSGRID REVISED REVENUE PROPOSAL | 2018/19-2022/23 6
Page 125 of 158
A performance target, unplanned outage event limit and dollar per dispatch interval for the MIC
Delay of the introduction of the symmetrical financial incentive
A Network Capability Incentive Parameter Action Plan (NCIPAP) for the NCC containing 22
priority projects.
6.3.2 AER’s Draft Decision
In the draft decision, the AER has:
Accepted the performance targets, caps and floors for parameters of the SC with the exception of
the lines rate fault parameter based on the Anderson-Darling statistic
Determined the SC lines rate fault parameter based on the Kolmogorov-Smirnov statistic
Provided placeholder performance targets for the MIC, to be updated with 2017 data
Not accepted the proposed delayed introduction of the symmetrical financial incentive for the MIC
Accepted 12 of the 22 priority projects from TransGrid’s NCIPAP.
6.3.3 Response to Draft Decision
TransGrid:
Accepts the AER’s performance targets, caps and floors for parameters of the SC
Accepts the introduction of the symmetrical financial incentive for the MIC
Accepts a NCIPAP with the 12 approved projects.
For clarity, the NCIPAP projects accepted by the AER in the draft decision and included in this revised
proposal are:
North Western transfer tripping scheme
Replace limiting high voltage plant at Wagga 132 kV substation (Line 99X rating augmentation)
SMART wires on Upper Tumut-Yass 330 kV line
Dynamic line rating monitoring
Implementation of transfer tripping scheme at Cooma
Implementation of transfer tripping scheme at Gadara, Tumut and Burrinjuck
Queensland-New South Wales (QNI) interconnector capacitor bank
Implement dynamic rating system for Darlington Point 330/220 tie transformers
Replace limiting high voltage plant on Mt Piper-Wallerawang 330 kV lines (TL 70 and 71)
Armidale capacitor transfer tripping scheme
Increase ratings of Wagga-Lower Tumut 330 kV line (TL 051)
Capacitor bank to improve NSW-Vic transfer limit.
These projects amount to $27.13 million ($m June 18), representing 0.68% of the MAR in our revenue
proposal and therefore below the scheme’s threshold of 1%.
The AER asked us to provide the 2017 data with the revised proposal. It has been agreed with the
AER this data will be provided at the end of January 2018 following end of year and the availability of a
complete data set.

INCENTIVE SCHEMES | 2018/19-2022/23 6
Page 126 of 158
6.4 Efficiency Benefit Sharing Scheme
6.4.1 Introduction
The efficiency benefit sharing scheme (EBSS) provides incentives for transmission network service
providers to make ongoing efficiency improvements in operating expenditure. The version of the EBSS
used by the AER and TransGrid for this revenue determination is EBSS version two98
, with a default
carryover period of five years.
The EBSS is intended to work in combination with a revealed cost approach to setting operating
expenditure forecasts. This ensures there is a continuous incentive for network service providers
(NSPs) to make operating expenditure efficiency savings and a fair sharing of any efficiency gains and
losses between NSPs and their customers99
. In simple terms, both objectives are achieved by setting
future operating expenditure allowances on the basis of revealed efficient costs and carrying over the
incremental differences (gains/losses) between operating expenditure allowances and actual
expenditures from the current regulatory period into the next regulatory period. With a five year
regulatory period and a five year EBSS carryover period, this results in a ‘benefit-sharing ratio’ between
the NSP and its customers in respect of the present value (PV) of any efficiency gains and losses of
approximately 30:70, respectively, assuming a 6% real discount rate.
It’s important to note that any efficiency gains/losses represented in the EBSS carryover amounts are
derived from the application of the Rules and EBSS framework to historically determined operating
expenditure allowances and actual expenditure achievements/outcomes resulting from decisions made
several years prior (often two prior regulatory periods) to the upcoming regulatory control period.
TransGrid has focused on achieving year-on-year efficiencies via a number of initiatives in its business
operations and has achieved expenditure levels below allowances set for the current 2014/15 –
2017/18 regulatory period. We have delivered real year-on-year savings, notwithstanding the
absorption of costs from ownership changes, increased compliance, licencing requirements and
regulatory risk. In setting our operating expenditure we intend to deliver a 3% real cost reduction from
2016/17, effectively delivering $26 million ($June 2018) of savings to customers for the next regulatory
period.
In its draft decision the AER accepted TransGrid’s operating expenditure in the 2016/17 base year as
relatively efficient expenditure (based on its benchmarking data) and found no evidence of material
inefficiency100
.
The AER’s draft EBSS decision reduced TransGrid’s proposed EBSS carryover amounts due to:
Differing assumptions and sources of information used by TransGrid and the AER
A mix of one-off and permanent adjustments to address EBSS framework inconsistencies.
The AER’s draft determination approved carryover amounts totalling $15.3 million from the application
of the EBSS in the 2014/15 – 2017/18 regulatory control period compared to TransGrid’s $62.4 million
in its proposal. TransGrid’s revised submission is for $33.7 million as set out in the table below.
98 AER: Efficiency Benefit Sharing Scheme for Electricity Network Service Providers, November 2013
99 AER: Framework and Approach for TransGrid 2018-2023, July 2016, p.13.
100 AER: TransGrid transmission draft determination 2018-23, September 2017, p.7-21.

TRANSGRID REVISED REVENUE PROPOSAL | 2018/19-2022/23 6
Page 127 of 158
Table 6.3: Revised EBSS carryover from the current period ($m June 18)
Regulatory year 2018/19 2019/20 2020/21 2021/22 2022/23
EBSS Carryover 13.1 13.1 0.4 7.0 -
Source: TransGrid.
6.4.2 Summary of TransGrid Proposal
TransGrid in its submission to the AER raised two matters regarding the EBSS framework:
The length of the EBSS carryover period, when there is a change in the regulatory control period
The inter-relationship between TransGrid’s operating expenditure forecast and the EBSS.
Having addressed these issues, TransGrid applied the AER’s EBSS guidelines along with the AER’s
EBSS model and proposed the following EBSS carryover values.
Table 6.4: Proposed EBSS carryover from the current period ($m June 18)
Regulatory year 2018/19 2019/20 2020/21 2021/22 2022/23
EBSS Carryover 25.4 25.4 3.4 8.3 -
Source: TransGrid.
Length of carryover period
In the AER’s May 2015 determination for TransGrid, the AER determined that a four-year carryover
period would apply for the 2014/15 to 2017/18 regulatory control period. At the time of the
determination, TransGrid’s next regulatory control period commencing 2018/19 was anticipated to be
four years in duration.
With the forthcoming regulatory control period set to five years, TransGrid raised concerns with the
AER that the four year carryover period for the EBSS may not be in the long term interests of
consumers. TransGrid provided a number of examples in its revenue submission where we showed
that the four-year EBSS carryover does not function correctly.
TransGrid prior to its revenue proposal had submitted to the AER through the Framework and
Approach process that the current four year carryover period should be replaced with a five year
carryover period for the EBSS incentives to work correctly101
. The AER responded in the Framework
and Approach final decision:
…we understand TransGrid’s concern that applying a four year carryover period may create
inappropriate incentives.
We consider the NER provides the flexibility for us to implement an EBSS in a way which will
address any inappropriate incentives arising from a change in the duration of regulatory control
periods. Noting this, if TransGrid considers that a four year carryover period creates inappropriate
incentives, TransGrid should continue to pursue efficiency gains in line with the objectives of the
EBSS. If, at the time of submitting its regulatory proposal, TransGrid maintains that a five year
101 TransGrid, Proposal to change EBSS carryover resulting from the current regulatory control period from 4 to 5 years, Letter to the
AER, 11 April 2016 [TransGrid-Letter to AER Regarding TransGrid 4 Year Carryover-0416-PUBLIC]

INCENTIVE SCHEMES | 2018/19-2022/23 6
Page 128 of 158
carryover period is preferable, then we will consider whether that better meets the requirements of
the NER. 102
On the basis of the AER’s advice TransGrid continued to pursue efficiency gains for the remainder of
the current regulatory period and when submitting its revenue proposal applied a five year carryover
period for its EBSS proposal.
Relationship between the EBSS and TransGrid’s operating expenditure forecasts
In our revenue proposal, TransGrid proposed an alternative approach to estimating final year operating
expenditure for the purposes of deriving operating expenditure forecasts over the upcoming regulatory
control period. Our alternative is based on utilising the most recently available information about
efficient costs to formulate the forecast rather than costs forecast at the previous regulatory reset.
In establishing the starting point for its operating expenditure forecast, TransGrid also considered the
inter-relationship between the setting of operating expenditure forecasts and the application of the
EBSS. We contended that it was appropriate to use our alternative approach to estimating an efficient
and appropriate level of final year operating expenditure while using the AER’s original approach when
determining EBSS payoffs.
TransGrid progressed with this approach supported by advice provided by Frontier Economics; this
advice indicated that there are no perverse or unintended outcomes in TransGrid using an alternative
forecast for 2017/18 for its operating expenditure forecast in conjunction with version two of the EBSS:
… it would be appropriate to continue applying the EBSS by using the existing methodology for final
year estimation of actual opex alongside the use of the alternative methodology for forecasting opex
for the next RCP [regulatory control period]. This combination would expose the TNSP to
approximately 30% of the one-off gain or loss arising from differences between RoCn and RoCn+1. 103
RoCn and RoCn+1 means the rate of change of operating expenditure in the current period and the
rate of change of operating expenditure in the next period.
Therefore, TransGrid retained the AER’s standard approach for calculation of the EBSS payments
whilst adopting a modified approach to estimation of actual operating expenditure in the final year of the
current regulatory control period.
6.4.3 Summary of AER’s Draft Decision
In the draft decision, the AER approved EBSS carryover amounts from the 2014-2018 regulatory
control period totalling $15.3 million ($2017-18). This is $47.1 million less than TransGrid’s proposal of
$62.4 million.
The AER applied version 2 of the EBSS104
to TransGrid in the 2018/19 – 2022/23 regulatory control
period with debt raising, network support and network capability costs excluded from the scheme105
.
The AER’s draft EBSS decision reduced TransGrid’s proposed EBSS carryover amounts due to:
102 AER: Framework and approach for TransGrid for regulatory control period commencing 1 July 2018, July 2016, pp. 16-17
103 Frontier Economics: Prescribed operating expenditure forecast starting point, January 2017, p.16 [TransGrid-Frontier Economics-
Appendix J Opex forecast starting point-0117-PUBLIC] 104
AER: Efficiency Benefit Sharing Scheme for Electricity Network Service Providers, November 2013 105
AER Draft Decision TransGrid transmission determination 2018-2023, September 2017, p.9-7.

TRANSGRID REVISED REVENUE PROPOSAL | 2018/19-2022/23 6
Page 129 of 158
Differing assumptions and sources of information used by TransGrid and the AER
Newly introduced EBSS adjustments by the AER to address perceived inconsistencies in
TransGrid’s EBSS carryover amounts.
The reduction in EBSS carryover amounts was a result of the AER making the following decisions:
1. Reducing the carryover amount by $13.1 million to reflect a new modification to the EBSS made
in response to one of the consequences of changing from a four to five year carryover period.
According to the AER, changing from a four to five year carryover period in respect of
incremental efficiencies made in the current regulatory period would result in TransGrid unfairly
benefitting from an incremental efficiency loss made in the final year of the previous regulatory
period (2013/14). To address this, the AER proposed to carry over the 2013/14 loss for an extra
year, into the first year of the next regulatory period (2018/19).
2. Adjusting for an error in the AER’s EBSS template that was incorrectly lagging inflation used to
calculate the carryover amounts, resulted in a reduction of $10.8 million (the actual impact was
calculated by TransGrid to be $13 million)
3. Reducing the carryover amount by $9 million to reflect differing:
a. forecast determination allowances for 2009/10-2013/14 and 2014/5-2017/18 regulatory
control periods (2014-18 adjustments were as a consequence of the incorrect lagging of
inflation above)
b. provision movements in defined benefits contributions and other employee provisions
based on additional information
4. Reducing the carryover amount by $8.4 million to reflect a modification to the AER’s standard
approach, as set out in its EBSS guideline, to estimating final year (2017/18) operating
expenditure for the purposes of determining EBSS carryover amounts. The AER instead used
the same estimate of final year operating expenditure it used for the purposes of setting
operating expenditure allowances for the next regulatory period. This resulted in treating $1.7
million of the underspending achieved in 2016/17 that was not repeated in 2017/18 as a ‘non-
recurrent efficiency gain’ in 2016/17 and deducting it from TransGrid’s carryover rewards for the
next regulatory period.
5. Alignment of operating expense categories, as a consequence of differing AER decisions from
one regulatory period to the next has resulted in expense categories (for example, self-
insurance and demand management) being included or excluded from the EBSS allowances; to
calculate the EBSS rewards or penalties on the same basis across regulatory periods (2009/10-
2013/14 and 2014/15-2017/18) the cost categories have been aligned, resulting in a reduction
of $5.9 million.
6.4.4 TransGrid’s Revised Proposal
TransGrid accepts the AER’s draft decision for points 2, 3 and 5 above and we explore the AER’s
decisions further in this section. TransGrid does not accept all of the AER’s adjustments to the EBSS
carryover amounts proposed in the draft determination. We have been penalised by the AER in its draft
determination of the EBSS for:
Changes to the regulatory control periods from five to four years in 2014/15 – 2017/18 and back to
five years in 2018/19 – 2022/23
Setting a realistic forecast of efficient expenditure.
The table below summarises the AER’s adjustment to the EBSS carryover amounts and TransGrid’s
response to these.

INCENTIVE SCHEMES | 2018/19-2022/23 6
Page 130 of 158
Table 6.5: Summary of AER adjustments in the revised proposal
AER Draft Decision Adjustment TransGrid Response
1 AER adjustment to impose an
additional one year penalty for an
incremental efficiency loss in
2013/14.
TransGrid does not accept the AER’s draft decision.
TransGrid considers this to be a retrospective adjustment
that should not apply, and the reasons are explained further
in Section 13.4.2.
2 AER adjustment for an error in
the AER’s template for inflation. TransGrid accepts the AER’s draft decision.
3 AER adjustments for:
Forecast determination
allowances
Provision of movements in
defined benefits contributions
and other employee
provisions.
TransGrid accepts the AER’s draft decision.
TransGrid sourced its data from the final applicable AER
revenue decision.106
The AER has chosen to use an
alternative source. The difference between the information
used by TransGrid and the AER is immaterial, so TransGrid
will accept the AER’s decision.
For 2013/14-2017/18 allowance adjustments the AER used a
differing calculation method to convert to June 2018 dollars.
4 AER adjustment for 2017/18
operating expenditure forecasts.
TransGrid does not accept the AER’s draft decision.
TransGrid considers that the original guideline-based
estimate of 2017/18 operating expenditure should not be
adjusted and should be used for the purposes of determining
EBSS carryover amounts. Making such an adjustment is
inconsistent with the operation of the EBSS and imposes an
inappropriate penalty on the business.
TransGrid’s reasons are explained further in Section 13.4.3.
5 AER adjusted 2012/13 and
2013/14 for expenses excluded in
2014/15.
TransGrid accepts the AER’s draft decision.
Context to TransGrid’s revised proposal for EBSS carryover amounts
The process of establishing the EBSS carryover amounts should be a result of:
A simple application of the EBSS framework calculating the movements between allowances set in
the prior periods and actual expenditure, taking away excluded expenditure, adjusting for
accounting provisions and using the AER’s determinations and the NSP’s audited regulatory
accounts
Confidence by the business, when making expenditure decisions, that outcomes from the scheme
are predictable and without risk of retrospective adjustments.
106 AER: AER – Statement on updates for TransGrid transmission determination 2009-10 to 20013-14, Table 5: AER conclusion on
TransGrid’s controllable operating expenditure, for EBSS purposes. 25th November 2009.

TRANSGRID REVISED REVENUE PROPOSAL | 2018/19-2022/23 6
Page 131 of 158
TransGrid sought guidance from the Rules when preparing its revised proposal and considering
whether to accept or not accept the EBSS adjustments and modifications by the AER in its draft
determination.
Under the Rules, Section 6A.6.5, the EBSS should provide for a fair sharing of:
Efficiency gains derived from the operating expenditure for a regulatory control period being less
than the AER allowance
The efficiency losses derived from the operating expenditure for a regulatory control period being
more than the AER allowance107
.
Further, under Section 6A.6.6 a revenue proposal should include the forecast operating expenditure a
TNSP considers is required to achieve the operating expenditure objectives. The AER must accept the
forecast expenditure if it is satisfied that it reasonably reflects:
The efficient costs of achieving the operating expenditure objectives
The costs that a prudent operator would require to achieve the operating expenditure objectives108
.
The Rules do not contemplate the EBSS mechanism being used to allow the AER to reach into the next
regulatory control period and penalise NSPs for costs incurred by the NSP, in the present regulatory
period, that the AER has already found to be prudent and efficient and incorporated in the next period’s
operating expenditure allowance. The EBSS is explicitly set up to ensure fair sharing of the efficiency
gains and losses made within a regulatory period, compared to the allowance set by the AER.
TransGrid’s revenue proposal achieves the objectives of the Rules for both operating expenditures and
EBSS, in a manner consistent with the AER’s Expenditure Forecast Assessment Guideline and EBSS
Guideline without recourse to special, punitive adjustments that do not meet the intent of the rules.
The AER’s adjustments are considered further below.
Length of the carryover period
The five year carryover period adopted by TransGrid results in a:
Resolution of the issues raised by TransGrid in a manner consistent with the representations made
to TransGrid during the Framework and Approach process
Fair sharing of efficiency gains and losses made in the current regulatory period (the EBSS aims to
achieve a 30:70 sharing ratio with customers of incremental gains/losses based on a notional
WACC of 6%).
Frontier Economics confirms that adopting TransGrid’s five year carryover period for incremental
efficiencies made in the current regulatory period achieves the above outcomes and correctly solves
the problem of a change in carryover period lengths109
.
TransGrid has prepared its revenue submission in good faith
With the forthcoming regulatory control period set to five years, we raised concerns with the AER during
the Framework and Approach process110
that the four year carryover period for the EBSS may no
107 NER, cl 6A.6.5 (a) (1), (2).
108 NER, cl 6A.6.6.
109 Frontier Economics: Starting point operating expenditure and the efficiency benefit sharing scheme, November 2017, p.6.
110 TransGrid, Proposal to change EBSS carryover resulting from the current regulatory control period from 4 to 5 years, Letter to the
AER, 11 April 2016 [TransGrid-Letter to AER Regarding TransGrid 4 Year Carryover-0416-PUBLIC]
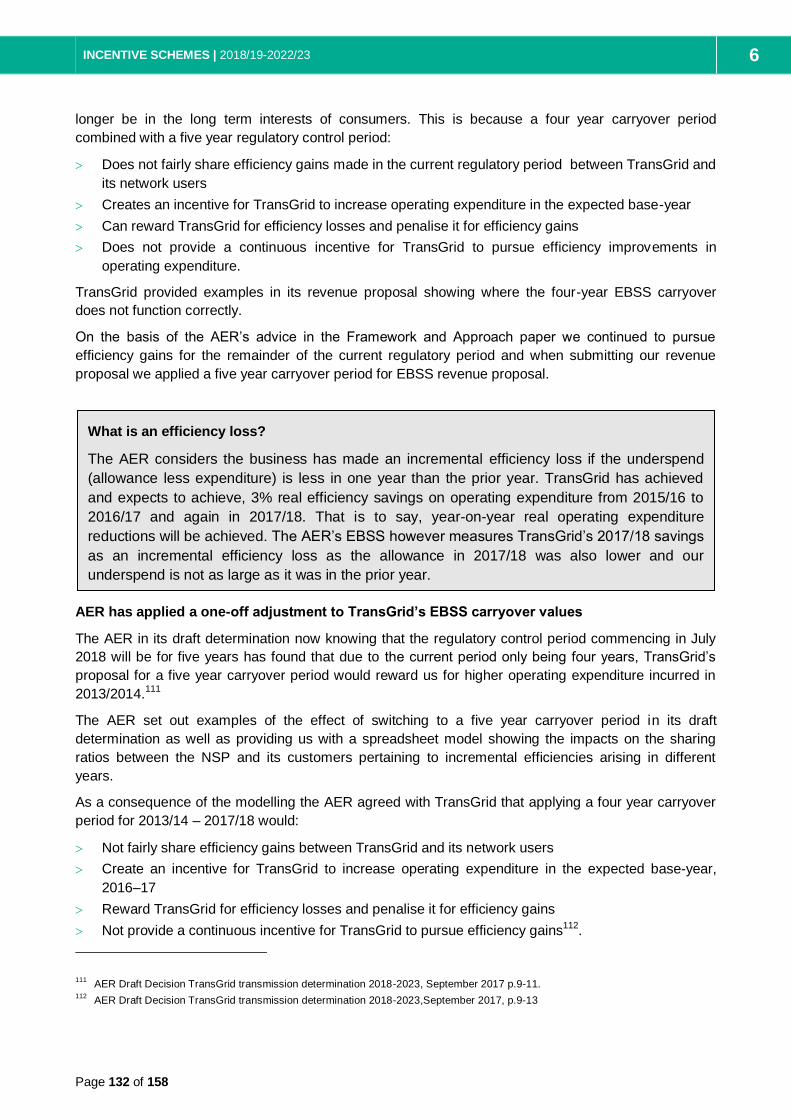
INCENTIVE SCHEMES | 2018/19-2022/23 6
Page 132 of 158
longer be in the long term interests of consumers. This is because a four year carryover period
combined with a five year regulatory control period:
Does not fairly share efficiency gains made in the current regulatory period between TransGrid and
its network users
Creates an incentive for TransGrid to increase operating expenditure in the expected base-year
Can reward TransGrid for efficiency losses and penalise it for efficiency gains
Does not provide a continuous incentive for TransGrid to pursue efficiency improvements in
operating expenditure.
TransGrid provided examples in its revenue proposal showing where the four-year EBSS carryover
does not function correctly.
On the basis of the AER’s advice in the Framework and Approach paper we continued to pursue
efficiency gains for the remainder of the current regulatory period and when submitting our revenue
proposal we applied a five year carryover period for EBSS revenue proposal.
AER has applied a one-off adjustment to TransGrid’s EBSS carryover values
The AER in its draft determination now knowing that the regulatory control period commencing in July
2018 will be for five years has found that due to the current period only being four years, TransGrid’s
proposal for a five year carryover period would reward us for higher operating expenditure incurred in
2013/2014.111
The AER set out examples of the effect of switching to a five year carryover period in its draft
determination as well as providing us with a spreadsheet model showing the impacts on the sharing
ratios between the NSP and its customers pertaining to incremental efficiencies arising in different
years.
As a consequence of the modelling the AER agreed with TransGrid that applying a four year carryover
period for 2013/14 – 2017/18 would:
Not fairly share efficiency gains between TransGrid and its network users
Create an incentive for TransGrid to increase operating expenditure in the expected base-year,
2016–17
Reward TransGrid for efficiency losses and penalise it for efficiency gains
Not provide a continuous incentive for TransGrid to pursue efficiency gains112
.
111 AER Draft Decision TransGrid transmission determination 2018-2023, September 2017 p.9-11.
112 AER Draft Decision TransGrid transmission determination 2018-2023,September 2017, p.9-13
What is an efficiency loss?
The AER considers the business has made an incremental efficiency loss if the underspend
(allowance less expenditure) is less in one year than the prior year. TransGrid has achieved
and expects to achieve, 3% real efficiency savings on operating expenditure from 2015/16 to
2016/17 and again in 2017/18. That is to say, year-on-year real operating expenditure
reductions will be achieved. The AER’s EBSS however measures TransGrid’s 2017/18 savings
as an incremental efficiency loss as the allowance in 2017/18 was also lower and our
underspend is not as large as it was in the prior year.

TRANSGRID REVISED REVENUE PROPOSAL | 2018/19-2022/23 6
Page 133 of 158
The AER also considered that TransGrid’s proposal to use a five year carryover period did not solve
these problems and that it only changes the timing of them113
.
The AER draft decision referenced the NER requirement that the EBSS provides continuous
incentives114
and the AER generally considers this occurs when the length of the carryover period is the
same as the length of the regulatory control period. However, we note that the Rules allow for changes
in base years and regulatory control period lengths115
, but do not contemplate any adjustments to the
EBSS (including carryover period) for changes of regulatory period lengths.
Therefore the AER has applied its own alternative approach by making a one off adjustment in respect
of the incremental efficiency loss in 2013/14 by carrying it over for an additional year, into 2018/19. This
means that the AER will be modifying TransGrid’s carryover payments and operating expenditure target
in the next regulatory period as a result of outcomes in the previous regulatory period. The value of this
adjustment was a $13.1 million reduction in TransGrid’s EBSS carryover amounts in the 2017/18-
2022/23 regulatory period.
TransGrid’s EBSS carryover amounts should not include a one-off adjustment
TransGrid proposes that a five year carryover period should be applied in calculating the EBSS
component of the next revenue decision. This is because the current four year carryover period
produces inappropriate rewards and penalties that are at odds with the objectives of the EBSS and a
five year carryover period would align with the length of the next regulatory control period. We have
honoured the spirit of the scheme and acted in accordance with its intended incentive properties and
the AER’s assurances, rather than seeking to take advantage of the potential gaming opportunities
available under the current four year carryover period (eg, by boosting 2016/17 operating expenditure).
TransGrid rejects the AER’s adjustment of $13.1 million to the EBSS carryover amounts for the next
regulatory period.
As a regulatory principle, changing how a business is rewarded or penalised under an incentive
scheme four years after the fact is at best, poor regulatory practice, and at worst an appropriation of
business value.
TransGrid considers that the AER’s adjustment:
Is not consistent with the specific NER provisions, and
Retrospectively alters EBSS payments in respect of incremental (in)efficiencies arising in the
previous regulatory period even though TransGrid’s business and operating decisions in 2012/13
and 2013/14 would not have been made on the basis of receiving any future windfall rewards or
penalties as a consequence of the changing regulatory control period lengths and carryover
periods.
The AER has not previously indicated any issues nor potential adjustments to the EBSS when the
NSPs request a change in their regulatory control period lengths, and TransGrid’s change was known
well before TransGrid submitted its revenue proposal.
TransGrid engaged Frontier Economics to review the AER’s justifications for adjusting the EBSS
carryover amounts for the next regulatory period. We have attached their report which is set out at
Appendix C. We set out below their key observations in respect of the AER’s adjustment below.
113 AER Draft Decision TransGrid transmission determination 2018-2023, September 2017, p.9-13
114 NER, cl 6A.6.5 (b) (1).
115 NER, cl 6A4.2 (a)(7)
INCENTIVE SCHEMES | 2018/19-2022/23 6
Page 134 of 158
I also note that the AER’s modifications are not justifiable by reference to the specific NER
provisions the AER emphasised in its EBSS guideline and explanatory statement regarding
the length of the carryover period: The AER’s modifications are not relevant to ensuring
TransGrid faced continuous and balanced incentives to make opex savings in 2013/14. This
is because at that time, TransGrid had no reason to believe that it did not face a continuous
incentive to make efficiency savings or that it had incentives to (inefficiently) capitalise
expenditure. The decision to adopt a four year RCP (2014/15 to 2017/18) and a four year
carryover period was made too late to realistically influence TransGrid’s opex and
capitalisation incentives for that year. Thus, there is no efficiency purpose served by now
retrospectively altering the EBSS payoffs in respect of the last RCP116
.
Conversely, TransGrid’s behaviour from 2016/17 onwards was explicitly and directly
influenced by the AER’s representation that TransGrid “should continue to pursue efficiency
gains in line with the objectives of the EBSS”. No such undertaking was made by the AER
prior to that representation, even though the adoption of the current four year RCP naturally
altered the sharing ratios applicable to incremental savings made in the previous (2009/10 to
2013/14) RCP117
.
Further:
Modifications made now to sharing ratios that apply retrospectively to 2013/14 could not and
will not affect TransGrid’s incentives to make opex efficiencies and/or capitalisation
decisions at any point in time. As such, they are inconsistent with the intrinsically forward-
looking nature of expenditure incentive schemes and incentive regulation more generally118
The AER’s modifications represent a far more detailed and ad hoc change to the EBSS than
simply altering the length of the carryover period. Unlike the question of carryover length, the
AER’s modifications have not previously been discussed or even flagged in either the NER,
the EBSS guideline or the AER’s explanatory statement to the guideline. In this context, I
highlight again that the AER’s modifications have not even been defined algebraically, as the
existing EBSS has.
For all these reasons, adoption of the AER’s additional modifications to the EBSS would
represent a departure from good regulatory practice119
.
Conclusion
TransGrid does not necessarily disagree with the intentions of the AER to appropriately apply the Rules
and the EBSS Guidelines to ensure that the incentives, rewards and integrity of the EBSS scheme are
maintained. However the application of an ad hoc, retrospective adjustment to TransGrid’s carryover
amounts in the EBSS serves no efficiency purposes, is inconsistent with the EBSS guideline, has not
been previously flagged and accordingly, undermines good regulatory practice.
116 Frontier Economics: Starting point operating expenditure and the efficiency benefit sharing scheme, November 2017, p6.
117 Frontier Economics: Starting point operating expenditure and the efficiency benefit sharing scheme, November 2017, p6.
118 Frontier Economics: Starting point operating expenditure and the efficiency benefit sharing scheme, November 2017, p8.
119 Frontier Economics: Starting point operating expenditure and the efficiency benefit sharing scheme, November 2017, p8-9.

TRANSGRID REVISED REVENUE PROPOSAL | 2018/19-2022/23 6
Page 135 of 158
6.4.5 Forecast Starting Point
TransGrid’s expenditure is accepted as efficient
The AER has accepted TransGrid’s 2016/17 base year operating expenditure incorporating up to date
escalation to be the appropriate basis of establishing the 2018/19-2022/23 allowance. The AER’s
benchmarking has accepted that TransGrid operates relatively efficiently when compared to the other
service providers in the NEM. Having considered its benchmarking results, the AER is satisfied that
TransGrid’s estimate of operating expenditure in 2016/17 in not materially inefficient.120
In the latest
AER benchmarking study (2017), TransGrid is ranked second for operating expenditure partial factor
productivity measurement121
, reflecting operational cost effectiveness.
TransGrid has been focused on achieving ongoing sustainable efficiency savings across all aspects of
its business in the current regulatory period, including a critical evaluation of the business, externally
undertaken by various independent parties for the purposes of the TransGrid lease transaction. The
new lease holders acting on this advice implemented various business improvements following the
award of the lease on 15 December 2015.
The long term cost savings initiatives and change of ownership has resulted in:
Achieving an aggregate operating expenditure level in the current four year 2014/15 – 2017/18
regulatory period below the aggregate allowance set for the period
An overall reduction in operating expenditure in real terms, year on year, for the past four years
The 2016/17 year reflects the first full year of operations under a new ownership structure with a
further reduction in actual operating expenditure compared to the forecast submitted by TransGrid
in its revenue proposal
TransGrid maintaining a high level of operating expenditure productivity in the AER’s annual
benchmarking study results
The AER accepting TransGrid’s forecasted operating expenditure in the 2016/17 base year as
relatively efficient expenditure.
The 2016/17 results have been achieved notwithstanding that the nature and structure of the
organisation has changed with TransGrid incurring increased costs in order to comply with new
regulatory and statutory obligations following privatisation. This has occurred at the same time as public
attention on the sector has increased, demanding increased participation in – and the allocation of
managerial and staff resources to – the public energy policy debate and energy reviews, while at the
same time dealing with increasing levels of regulatory and security risk.
Further, TransGrid in setting its operating expenditure for the next regulatory period intends to deliver a
3% real cost reduction from 2016/17 from its transformation program, effectively delivering $26 million
($June 2018) of savings to customers through a lower operating expenditure allowance for the next
regulatory period.
120 AER: Draft Decision TransGrid transmission determination 2018-2023, September 2017, p.7-21
121 AER: Annual benchmarking report, electricity TNSPs Draft, November 2017, p.33.

INCENTIVE SCHEMES | 2018/19-2022/23 6
Page 136 of 158
TransGrid’s EBSS carryover amounts should not contain penalties for efficient expenditure
The AER, in its draft decision, stated that it will adopt TransGrid’s estimate of 2017/18 operating
expenditure for the purposes for setting TransGrid’s forecast allowance for the 2018/19 – 2022/23
regulatory control period. In doing so, the AER inferred that TransGrid’s estimate implied a “non-
recurrent efficiency gain” of $1.7 million in 2016/17, as TransGrid’s 2017/18 estimate was $1.7 million
higher than the estimate obtained using the AER’s standard methodology122
.
The AER’s standard methodology to establish the forecast starting point under its Expenditure Forecast
Guideline123
subtracts the current regulatory period (2014/15 – 2017/18) base year under or over spend
from the final year operating expenditure allowance. This final year (2017/18) allowance was set in April
2015, using a trend forecast developed in 2014 as the basis for setting the allowance for the next
regulatory period (2018/19 – 2022/23). This approach effectively uses a fictional starting point to
estimate future efficient operating expenditure.
Put simply, the AER has accepted TransGrid’s more accurate operating expenditure forecast for the
2018/19 – 2022/23 period but this, accordingly, has resulted in a $1.7 million higher allowance than it
would have achieved if the AER applied its standard methodology. The AER has offset the same
amount in the EBSS for the next five years.
TransGrid’s EBSS carryover amounts should not contain penalties for efficient expenditure
TransGrid does not accept that the presumed “non-recurrent efficiency gain” in 2016/17 should be
subtracted from EBSS payments made in the next period, especially as our base year operating
expenditure has been accepted as an appropriate and efficient level of expenditure moving forward.
Therefore, the fact that our 2017/18 allowance is below our 2016/17 allowance (which contributes to the
inference of a non-recurrent saving in 2016/17) should not be taken into account in either setting our
operating expenditure allowance for the next regulatory period or our EBSS payments in respect of
incremental efficiencies made in the current period.
TransGrid does not agree with the EBSS adjustment as:
It appears to be contrary to section 7A(2) the National Electricity Law by not allowing TransGrid a
reasonable opportunity to recover at least its efficient costs
Using efficient actual levels of expenditure as the base for the next regulatory control period will
ensure that the magnitude of EBSS gains and losses are more representative of the real
expenditure performance against the allowance set
It will effectively discourage network service providers (NSPs) from submitting a realistic and
efficient level of expenditure required to meet their operating requirements, as there is no incentive
to do so with equal offsetting increase/decrease adjustments to the EBSS carryover amounts
The AER’s adjustment, in effect, undermines the very intent of the Rules 6A.6.6 which requires the
AER to approve an efficient operating expenditure allowance
The AER’s approach does not consider any rate of change (RoC) impact that occurs over time from
one regulatory period to the next when applying this adjustment, to the extent that TransGrid’s final
year estimate reflects updated RoC, it would be more appropriate to estimate final year operating
expenditure for EBSS purposes using the old RoC (determined at the previous reset); this is
because changes to the RoC are outside the NSP’s control and hence there is no efficiency
purpose served in exposing NSPs to the unmanageable risk of RoCs changing over time.
122 AER: Expenditure Forecast Assessment Guideline November 2013.
123 AER: Expenditure Forecast Assessment Guideline for Electricity Transmission, November 2013, p.30-31.

TRANSGRID REVISED REVENUE PROPOSAL | 2018/19-2022/23 6
Page 137 of 158
Conclusion
The AER’s approach to adjusting EBSS carryover payments as a corollary to adopting TransGrid’s
proposed starting point operating expenditure estimate is not in accordance with the setting of an
appropriate net operating expenditure target for the coming regulatory period. This is inconsistent
with the requirements of the National Electricity Law and Rules, which provide that network service
providers have a reasonable opportunity to at least recover their efficient costs.
6.4.6 Proposed carryover amounts from the current period
TransGrid has calculated the following carryover amounts using the AER’s EBSS determination and
adjusting for the items that TransGrid did not accept in this revised proposal.
Table 6.6: Proposed EBSS carryover from the current period ($m June 18)
Regulatory year 2018/19 2019/20 2020/21 2021/22 2022/23
EBSS Carryover 13.1 13.1 0.4 7.0 -
Source: TransGrid.
6.4.7 Application of the EBSS 2018/19 – 2022/23
TransGrid proposes the following operating expenditure forecast for EBSS purposes which is consistent
with its operating expenditure forecast and excludes debt raising costs.
Table 6.7: Forecast operating expenditure for EBSS 2018/19 to 2022/23 ($m June 18)
Regulatory year 2018/19 2019/20 2020/21 2021/22 2022/23
Forecast operating expenditure for EBSS 172.0 173.4 175.3 177.4 179.6
Source: TransGrid.

RATE OF RETURN | 2018/19-2022/23 7
Page 138 of 158
7. Rate of Return
7.1 Introduction
The allowed return on capital is the building block component that covers the costs to the business of
both debt and equity capital funding.
In all respects, TransGrid’s proposal and the AER’s draft decision were consistent on the approach to
calculating the return on capital with the exception of the estimation of the market risk premium (MRP).
In our January 2017 proposal we estimated the MRP at 7.5% by applying the estimation method set out
in the 2013 Guideline to the data that was available at the time of our proposal. Our estimate of the
MRP is currently 7.0%, reflecting more recent movements in market rates. By contrast, the AER has
consistently allowed an MRP of 6.5% since the publication of its 2013 guidelines, even as the relevant
evidence has changed materially.
We note that the AER’s MRP is now lower than almost every other recent regulatory decision issued in
the last year. In its draft decision for TransGrid, the AER considered 14 recent regulatory
determinations. Of these, 12 adopted an MRP above 7%, one adopted an MRP of 6.5% and one was
legislatively required to use an MRP of 6%.
Nevertheless, in this revised proposal we have elected to accept the AER’s draft decision MRP of 6.5%
in the interests of reaching a consensus with the AER and minimising prices for consumers.
All other WACC parameters of the AER’s draft decision and TransGrid’s revenue proposal are agreed
and TransGrid maintains these positions in this revised proposal.
7.2 TransGrid’s approach
TransGrid’s approach is in accordance with the AER’s draft decision as follows:
The allowed return is estimated as the vanilla weighted-average cost of capital (WACC) – a
weighted average of the estimates of the cost of equity and the cost of debt
The allowed cost of equity is estimated using the Sharpe-Lintner Capital Asset Pricing Model (SL-
CAPM) and the AER’s preferred values for the equity beta of 0.7, the MRP of 6.5% and the risk
free rate.
The allowed cost of debt is estimated as the yield on Australian 10-year broad BBB-rated
corporate bonds in accordance with the estimation methods and transition approach set out in the
Guideline and the AER’s subsequent decisions
Gearing (the relative proportion of debt financing) is estimated in accordance with the Guideline.
TransGrid proposes an allowed return (vanilla WACC) of 6.49%. We note that the risk-free rate and
cost of debt will be updated with observations from the agreed averaging period prior to the AER’s final
decision being made and that the allowed cost of debt will be updated at the beginning of each year of
the next control period.
Our return on capital proposal differs from the rate proposed in January 2017. These differences reflect:
Current measures for the risk-free rate, which the AER will update again with observations from
the agreed averaging period when it occurs
A MRP of 6.5%, which reflects the AER’s draft decision.

TRANSGRID REVISED REVENUE PROPOSAL | 2018/19-2022/23 7
Page 139 of 158
Table 7.1: Summary of TransGrid’s Approach to the Rate of Return
Parameter AER Rate of Return Guideline TransGrid’s approach Value
Risk-free rate Estimated at the commencement of each regulatory period as the yield on 10-year CGS averaged over 20 days.
Follows Guideline estimation approach.
To be updated prior to the final decision.
2.66%
Equity beta 0.7 Adopts Guideline fixed estimate. 0.7
Market risk premium
Estimated at the commencement of each regulatory period commensurate with the prevailing market conditions.
Greatest124
consideration to the
long-run mean of historical
excess returns;
Significant125
consideration to the
AER’s DGM estimates.
Two-step approach:
Set a range based on the
aggregated ranges of its historical
excess returns and DGM
estimates; and
Use other relevant evidence to
select a point estimate from
within that range.
Accept AER draft decision
6.5%
Cost of equity Sharpe-Lintner CAPM formula. Follows Guideline approach. 7.2%
Cost of debt
Spot cost of debt estimated at the commencement of each regulatory year as the mid-point of RBA and Bloomberg estimates of the yield on Australian 10-year broad BBB-rated bonds.
AER 10-year transition method applied.
Updated at the beginning of each year of the regulatory period.
Follows Guideline estimation and transition approach.
Quoted rate is for first year of regulatory period and reflects TransGrid’s current transition path.
To be updated prior to the final decision.
6.01%
Gearing 60% Adopts Guideline fixed estimate. 60%
WACC Vanilla WACC formula. Follows Guideline approach. 6.49%
124 AER Rate of Return Guideline, Explanatory Statement, p. 95.
125 AER Rate of Return Guideline, Explanatory Statement, p. 97.

RATE OF RETURN | 2018/19-2022/23 7
Page 140 of 158
7.3 Cost of debt
In relation to the cost of debt, TransGrid has adopted, in full, the approach set out in the AER’s 2013
Rate of Return Guideline. We have taken the mid-point of estimates provided by the Reserve Bank of
Australia and Bloomberg for 10-year Australian BBB-rated corporate bonds and have applied the AER’s
transition from a “rate on the day” approach to the “trailing average” approach.
The AER has agreed with TransGrid’s estimation of the cost of debt and we acknowledge this. We
maintain the same approach to estimating the cost of debt in this revised proposal noting that the cost
of debt allowance will be updated following completion of the agreed averaging period, and that this
updated value will be applied in the final decision.
The cost of debt allowance will continue to be updated annually in accordance with the AER’s transition
approach.
7.4 Cost of equity
In relation to the cost of equity, TransGrid has aligned its estimate with the AER’s draft decision in using
the Sharpe-Lintner Capital Asset Pricing Model (SL-CAPM) as a foundation model.
TransGrid has adopted a risk-free rate of 2.66%, estimated as the yield on 10-year Commonwealth
Government Securities in accordance with the AER’s Guideline approach.126
TransGrid has adopted an equity beta of 0.7, consistent with the fixed estimate adopted in the AER’s
Guideline. TransGrid considers this figure to be conservatively low in that:
More recent evidence indicates an increase in statistical beta estimates
The AER’s estimate does not fully correct for the low-beta bias that has been documented for the
SL-CAPM
The AER’s estimate does not consider unregulated infrastructure firms that operate in workably
competitive markets.
TransGrid has accepted a MRP estimate of 6.5% reflecting the AER’s draft decision. However, we note
that since the 2013 Guideline was published, the excess returns estimate has remained largely the
same whereas the AER’s DGM estimates have increased materially. This leads to a MRP of 7.0% for
the prevailing market conditions. This is higher than the 6.5% estimate that the AER adopted for the
financial market conditions in 2013. This higher MRP is commensurate with the change in market
evidence over the ensuing period, and the application of the AER’s Guideline approach to the more
recent evidence.
Nevertheless, TransGrid’s proposed cost of equity is based on:
A risk-free rate of 2.66%
An equity beta of 0.7
A MRP of 6.5%.
This produces a cost of equity estimate of 7.2%,127
which is 16% less than the allowed cost of equity in
the 2013 Guideline.128
126 This will be updated to reflect an averaging period close to the commencement of the next regulatory control period, in accordance
with the Rate of Return Guideline. 127
2.66%+0.7×7.0%=7.6%. This estimate will be revised to reflect data over the specified averaging period prior to the commencement of the next regulatory control period

TRANSGRID REVISED REVENUE PROPOSAL | 2018/19-2022/23 7
Page 141 of 158
The AER and TransGrid have agreed on the model to be used to estimate the cost of equity, the
averaging period for the risk-free rate observations, and the equity beta. TransGrid maintains all of
these positions in the revised proposal. Furthermore, TransGrid accepts the AER’s draft decision MRP
of 6.5%.
7.5 Averaging Periods
The AER has accepted TransGrid’s proposed averaging periods for both the cost of debt allowance and
the cost of equity allowance. TransGrid appreciates this and accepts the AER’s decision.
7.6 TransGrid’s revised proposal
TransGrid’s revised proposal for the rate of return is 6.49%, reflecting a cost of debt estimate of 6.01%
and a cost of equity estimate of 7.2%.
128
4%+0.7×6.5%=8.6%.

DEPRECIATION AND RAB | 2018/19-2022/23 8
Page 142 of 158
8. Depreciation & Regulatory Asset Base
8.1 Depreciation
Regulatory depreciation is part of the annual revenue building block reflecting the depreciated value of
the regulatory asset base (RAB) over the 2018/19 to 2022/23 regulatory period.
8.1.1 TransGrid’s Proposal
Depreciation was presented in chapter 10 of TransGrid’s revenue proposal and calculated based on the
AER’s approach set out in the Roll Forward Model (RFM) and the Post-Tax Revenue Model (PTRM)
respectively.
8.1.2 AER’s Draft Decision
In the draft decision, the AER has:
Accepted the straight-line depreciation calculation methodology
Accepted the weighted average method to calculate remaining asset lives
Accepted the inflation forecast methodology
Accepted TransGrid’s proposal to most of the standard asset lives except for Transmission Line
Life Extension asset class. The AER has extended the proposed asset life of 25 years to 35 years
Rejected the proposed roll-in amount for NSCAS and replaced it by the amount of zero
Rejected the proposed depreciation for 2018/19 to 2022/23 period resulting from the changes
made to forecast capital expenditure and updated for inflation and actual WACC adjustments on
opening RAB.
8.1.3 Response to Draft Decision
TransGrid acknowledges the AER’s acceptance of:
The straight-line depreciation methodology
The weighted average method to calculate the remaining asset lives
Inflation forecast methodology
Standard asset lives for most asset classes except for Transmission Line Life Extension asset
class.
TransGrid accepts the AER’s draft decision to extend the standard asset life for Transmission Line Life
Extension asset class to 35 years. We do not accept all of the AER’s changes to the capital expenditure
forecast, and have revised our capital expenditure forecast as set out in chapter 4. TransGrid disagrees
with the AER’s draft decision to roll-in NSCAS at zero value. This is further discussed in chapter 4.
8.1.4 Revised Depreciation Forecast
The revised regulatory depreciation forecast on the basis of the revised capital expenditure and the
latest RBA inflation forecast is shown in Table 8.1.

TRANSGRID REVISED REVENUE PROPOSAL | 2018/19-2022/23 8
Page 143 of 158
Table 8.1: Depreciation forecast ($m nominal)
2018/19 2019/20 2020/21 2021/22 2022/23
Straight-line depreciation 257.6 281.0 300.8 310.5 328.4
Less: Inflation adjustment on RAB -157.8 -162.6 -168.4 -174.1 -180.4
Regulatory depreciation 99.9 118.4 132.4 136.4 148.0
Source: TransGrid. Totals may not add due to rounding.
8.2 Regulatory Asset Base
The value of the regulated asset base is calculated in the AER’s roll forward model (RFM). It refers to
assets used by TransGrid to provide regulated network services.
8.2.1 TransGrid’s Proposal
Chapter 7 of TransGrid’s revenue proposal provided details of the proposed values for RAB as at 1 July
2018 and 30 June 2023 using the AER’s RFM and post-tax revenue model (PTRM).
8.2.2 AER’s Draft Decision
In the draft decision, the AER:
Updated the opening RAB value as at 1 July 2018 reflecting the latest actual inflation and WACC
for 2016/17
Revised the forecast closing RAB at 30 June 2023 to reflect its draft decision forecast capital
expenditure and regulatory depreciation
Accepted the inclusion of the Network Support and Control Ancillary Services (NSCAS) assets as
part of RAB but with a roll-in value of zero.
8.2.3 Response to Draft Decision
8.2.3.1 Opening RAB at 1 July 2018
TransGrid accepts the AER’s RFM updates for 2016/17 actual inflation and the actual WACC input for
2017/18 and its effect on the level of depreciation. We acknowledge that the AER accepted the actual
capital expenditure in our proposal for the 2014/15 and 2015/16 regulatory years.
In this revised proposal, we have updated the RFM with the actual audited capital expenditure for
2016/17, consistent with the annual regulatory accounts submitted to the AER for 2016/17 financial
year. We have also substituted the 2017/18 capital expenditure forecast and asset disposals with the
latest update. In addition, we have updated the forecast inflation for 2017/18 based on the August RBA
Monetary Policy.
All of these updates are consistent with the AER’s preferred approach.
The revised opening RAB as at 1 July 2018 is shown in Table 8.2.

DEPRECIATION AND RAB | 2018/19-2022/23 8
Page 144 of 158
Table 8.2: Roll Forward Value of the RAB ($m nominal)
RAB 2014/15
Actual
2015/16
Actual
2016/17
Actual
2017/18
Expected
Opening RAB 6,075.8 6,190.6 6,284.9 6,286.0
Net capital expenditure as incurred 254.6 251.7 188.0 230.4
Straight-line depreciation -244.2 -261.9 -279.7 -265.0
Inflation adjustment 104.4 104.5 92.8 125.7
Closing RAB 6,190.6 6,284.9 6,286.0 6,377.0
Opening RAB 1 July 2018 6,377.0
Source: TransGrid. Totals may not add due to rounding.
8.2.3.2 Forecast Closing RAB at 30 June 2023
TransGrid accepts the updates on the inflation, actual WACC in the RFM and the amendment to the
standard asset life for the “Transmission line life extension” asset class that we proposed.
We do not accept the AER’s draft decision on forecast capital expenditure and the roll-in value of zero
for NSCAS.
In our revised proposal, we have revised downward our forecast capital expenditure for 2018/19 to
2022/23 as set out in chapter 4. We also updated the inflation forecast based on the August RBA
Monetary Policy. Consequently the regulatory depreciation has been revised in section 9.1 of this
chapter in accordance with the AER approved methodology.
Using the opening RAB shown in Table 8.2, the revised forecast capital expenditure and regulatory
depreciation, the forecast RAB for 2018/19 to 2022/23 is shown in Table 8.3.
Table 8.3: Forecast Regulatory Asset Base ($m nominal)
RAB 2018/19 2019/20 2020/21 2021/22 2022/23
Opening RAB 6,377.0 6,573.8 6,807.6 7,038.1 7,291.1
Net Capital Expenditure as Incurred 296.6 352.2 362.9 389.4 295.2
Straight-line Depreciation -257.6 -281.0 -300.8 -310.5 -328.4
Inflation Adjustment 157.8 162.6 168.4 174.1 180.4
Closing RAB 6,573.8 6,807.6 7,038.1 7,291.1 7,438.3
Source: TransGrid. Totals may not add due to rounding.

TRANSGRID REVISED REVENUE PROPOSAL | 2018/19-2022/23 8
Page 145 of 158

MAXIMUM ALLOWED REVENUE | 2018/19-2022/23 9
Page 146 of 158
9. Maximum Allowed Revenue
The maximum allowed revenue (MAR) defines the maximum amount of revenue TransGrid proposes to
be allowed to recover in each year of the upcoming regulatory control period.
9.1 Building Block Approach
9.1.1 Regulatory Asset Base
The revised opening RAB based on the updated actual capital expenditure for 2016/17 and revised
forecast capital expenditure for 2017/18 is $6,377.0 million.
Asset values have been rolled forward using revised forecast capital expenditure described in chapter 4
and forecast regulatory depreciation and forecast RAB for 2018/19 to 2022/23 regulatory period are
detailed in chapter 9. The revised forecast regulatory asset base is set out in Table 9.1.
Table 9.1: Revised Forecast Regulatory Asset Base ($m nominal)
RAB 2018/19 2019/20 2020/21 2021/22 2022/23
Opening RAB 6,377.0 6,573.8 6,807.6 7,038.1 7,291.1
Net Capital Expenditure as Incurred 296.6 352.2 362.9 389.4 295.2
Straight Line Depreciation -257.6 -281.0 -300.8 -310.5 -328.4
Inflation Adjustment 157.8 162.6 168.4 174.1 180.4
Closing RAB 6,573.8 6,807.6 7,038.1 7,291.1 7,438.3
Source: TransGrid. Totals may not add due to rounding.
9.1.2 Inflation
The AER has accepted TransGrid’s proposal to apply the current AER inflation forecast methodology
based on the Reserve Bank of Australia’s Statement of Monetary Policy.
TransGrid has applied 2.47% inflation based on the August 2017 Reserve Bank of Australia’s
Statement of Monetary Policy. We have used the RBA forecast for June 2018 and June 2019 with the
mid-point of its long term target for this revised proposal as a proxy. This will be updated with the RBA
June 2019 and June 2020 forecasts as they will be available when the AER makes the final decision.
The AER is currently undertaking a review of the approach to calculate expected inflation. The final
decision is expected to be made by the end of 2017. In its draft decision, the AER has stated that it wi ll
adopt changes made to the Post Tax Revenue Model (PTRM) and Roll Forward Model (RFM) from the
inflation review in the final decision. TransGrid accepts this position.
Currently, TransGrid bears the risk of any difference between forecast and actual inflation under the
rules. In the 2014/15 to 2017/18 regulatory period, there has been a mis-match between forecast and
actual inflation that is resulting in TransGrid receiving significantly reduced revenue than what would
have been allowed if there had not been a mis-match. The level of under-recovery in this period to date
is unprecedented. The revenue shortfall for 2014/15 to 2017/18 period arising from the error in the
inflation forecast is $150 million in nominal dollars.

TRANSGRID REVISED REVENUE PROPOSAL | 2018/19-2022/23 9
Page 147 of 158
We note that the AER’s approach of using a 10-year estimate, but re-setting everything after 5 years
will always result in a mis-match between actual and forecast inflation. The impact of using a 10 year
estimate means the forecast would on average be correct if applied for 10 years (assuming no bias in
the forecast) but when reset every 5 years with a future 10 years of data means it will always mis-match
actual inflation. IPART’s WACC Review Draft Decision moves to a 5-year inflation forecast for precisely
this reason.
9.1.3 Return on Capital
The return on capital has been calculated by applying the post-tax nominal vanilla WACC to the
opening RAB in the respective year using the PTRM.
The revised post-tax nominal vanilla WACC is 6.49% detailed in chapter 7. The revised return on
capital is summarised in Table 9.2.
Table 9.2: Revised Return on Capital ($m nominal)
2018/19 2019/20 2020/21 2021/22 2022/23 Total
Opening RAB 6,377.0 6,573.8 6,807.6 7,038.1 7,291.1
Return on Capital 413.6 426.4 441.6 456.5 472.9 2,211.1
Source: TransGrid.
9.1.4 Regulatory Depreciation
The revised regulatory depreciation, ie, return of capital, is discussed in chapter 9 and calculated using
the PTRM and shown in Table 9.3.
Table 9.3: Revised Return of Capital ($m nominal)
2018/19 2019/20 2020/21 2021/22 2022/23 Total
Return of Capital 99.9 118.4 132.4 136.4 148.0 635.1
Source: TransGrid.
9.1.5 Operating Expenditure
The revised operating expenditure is discussed in chapter 5. The forecast operating expenditure for
2018/19 to 2022/23 is summarised in Table 9.4.
Table 9.4: Revised Operating Expenditure ($m nominal)
2018/19 2019/20 2020/21 2021/22 2022/23 Total
Operating Expenditure 176.2 182.1 188.6 195.6 202.9 945.4
Network Support Cost 0.7 2.7 6.3 11.1 - 20.7
Debt Raising Cost 3.3 3.4 3.5 3.7 3.8 17.8
Total 180.3 188.2 198.4 210.3 206.7 983.9
Source: TransGrid. Totals may not add due to rounding.

MAXIMUM ALLOWED REVENUE | 2018/19-2022/23 9
Page 148 of 158
9.1.6 Revenue Adjustments
9.1.6.1 Efficiency Benefit Sharing Scheme and Capital Expenditure Sharing Scheme
The revised efficiency benefit sharing scheme (EBSS) and capital expenditure sharing scheme (CESS)
outcomes are discussed in chapter 6. A summary of the EBSS and CESS amounts are detailed in
Table 9.5.
9.1.6.2 Shared Assets
TransGrid acknowledges that the AER considers the shared assets proposal is reasonable and the
materiality threshold is not met in any year of the 2018/19 to 2022/23 regulatory period and that the
AER has not applied a shared asset revenue adjustment.
Updates contained in this revised proposal do not change this position and TransGrid maintains the
position set out in the revenue proposal. No material updates to shared asset revenue or the maximum
allowed revenue necessitate a further submission.
Table 9.5: Revised Revenue Adjustments ($m nominal)
2018/19 2019/20 2020/21 2021/22 2022/23 Total
EBSS 13.5 13.8 0.5 7.7 - 35.4
CESS 6.9 7.1 7.2 7.4 7.6 36.2
Total 20.4 20.9 7.7 15.1 7.6 71.7
Source: TransGrid. Totals may not add due to rounding.
9.1.7 Value of Imputation Credits
The AER’s draft decision for the value of imputation credits is 0.4 based on a utilisation method. In this
revised proposal we have accepted this decision recognising the positive benefits to customers.
Nevertheless, we do not agree with the AER that 0.4 reflects the best estimate. Rather, if applying a
utilisation rate then the most appropriate and reliable method for estimating gamma is the ATO
statistics approach which generates an estimate of 0.34. Further, the AER’s analysis indicates that the
ATO tax statistics approach provides an upper bound for the estimate of gamma.
We believe the AER overstates the difficulties in implementing reliably the ATO tax statistics approach,
and understates the problems with its alternative estimation technique, the equity ownership approach
which requires assumptions and adjustments to the data to generate an estimate.
9.1.8 Corporate Tax
Clause 6A.5.4(a)(4) of the Rules requires that the estimated cost of the corporate income tax allowance
must be made as part of the post-tax nominal approach to the revenue decision.
TransGrid’s proposed corporate tax was presented in chapter 11 of the revenue proposal.
In the draft decision, the AER has accepted the opening tax asset base at 1 July 2018 of $4,025 million.
This has been updated for actual audited 2016/17 capital expenditure, consistent with the annual
regulatory accounts submitted to the AER for the 2016/17 financial year. TransGrid has also revised its
forecast capital expenditure and updated forecast inflation for 2017/18 in the revised proposal. The
revised tax asset base for the 2014/15 to 2017/18 regulatory period is shown in Table 9.6.
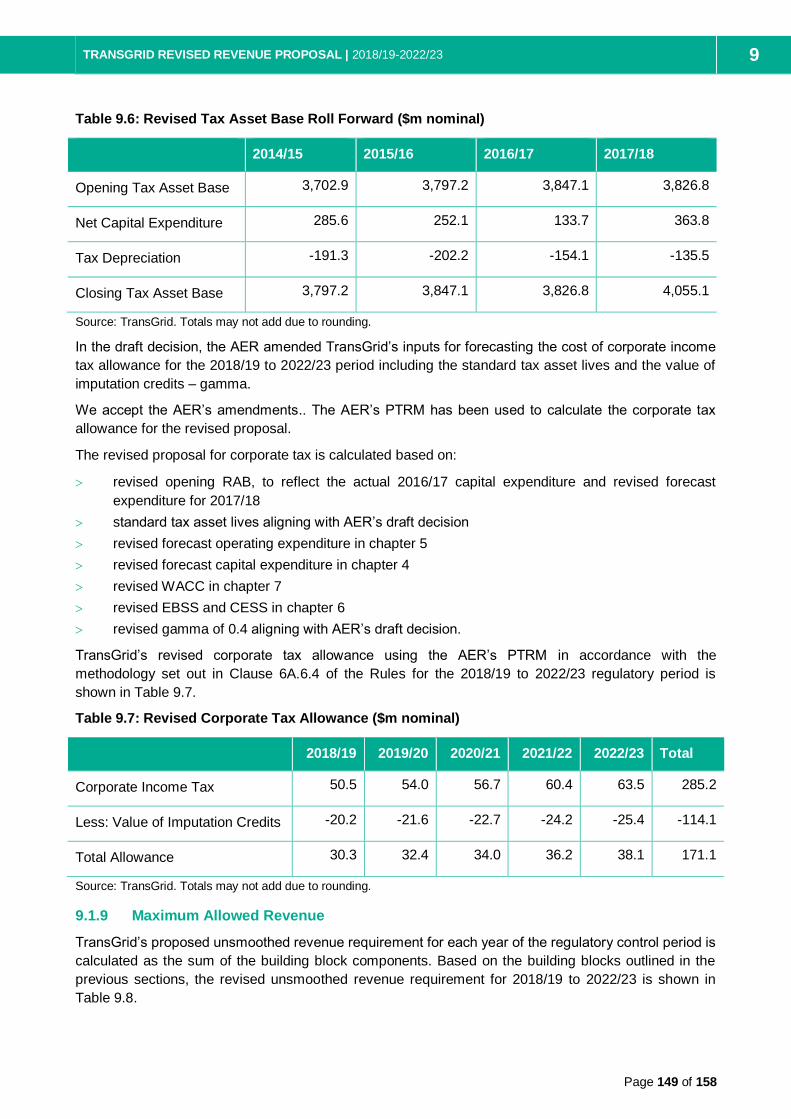
TRANSGRID REVISED REVENUE PROPOSAL | 2018/19-2022/23 9
Page 149 of 158
Table 9.6: Revised Tax Asset Base Roll Forward ($m nominal)
2014/15 2015/16 2016/17 2017/18
Opening Tax Asset Base 3,702.9 3,797.2 3,847.1 3,826.8
Net Capital Expenditure 285.6 252.1 133.7 363.8
Tax Depreciation -191.3 -202.2 -154.1 -135.5
Closing Tax Asset Base 3,797.2 3,847.1 3,826.8 4,055.1
Source: TransGrid. Totals may not add due to rounding.
In the draft decision, the AER amended TransGrid’s inputs for forecasting the cost of corporate income
tax allowance for the 2018/19 to 2022/23 period including the standard tax asset lives and the value of
imputation credits – gamma.
We accept the AER’s amendments.. The AER’s PTRM has been used to calculate the corporate tax
allowance for the revised proposal.
The revised proposal for corporate tax is calculated based on:
revised opening RAB, to reflect the actual 2016/17 capital expenditure and revised forecast
expenditure for 2017/18
standard tax asset lives aligning with AER’s draft decision
revised forecast operating expenditure in chapter 5
revised forecast capital expenditure in chapter 4
revised WACC in chapter 7
revised EBSS and CESS in chapter 6
revised gamma of 0.4 aligning with AER’s draft decision.
TransGrid’s revised corporate tax allowance using the AER’s PTRM in accordance with the
methodology set out in Clause 6A.6.4 of the Rules for the 2018/19 to 2022/23 regulatory period is
shown in Table 9.7.
Table 9.7: Revised Corporate Tax Allowance ($m nominal)
2018/19 2019/20 2020/21 2021/22 2022/23 Total
Corporate Income Tax 50.5 54.0 56.7 60.4 63.5 285.2
Less: Value of Imputation Credits -20.2 -21.6 -22.7 -24.2 -25.4 -114.1
Total Allowance 30.3 32.4 34.0 36.2 38.1 171.1
Source: TransGrid. Totals may not add due to rounding.
9.1.9 Maximum Allowed Revenue
TransGrid’s proposed unsmoothed revenue requirement for each year of the regulatory control period is
calculated as the sum of the building block components. Based on the building blocks outlined in the
previous sections, the revised unsmoothed revenue requirement for 2018/19 to 2022/23 is shown in
Table 9.8.

MAXIMUM ALLOWED REVENUE | 2018/19-2022/23 9
Page 150 of 158
Table 9.8: Revised Unsmoothed Revenue Requirement ($m nominal)
2018/19 2019/20 2020/21 2021/22 2022/23 Total
Return on Capital 413.6 426.4 441.6 456.5 472.9 2,211.1
Return of Capital 99.9 118.4 132.4 136.4 148.0 635.1
Operating Expenditure 180.3 188.2 198.4 210.3 206.7 983.9
Revenue Adjustments 20.4 20.9 7.7 15.1 7.6 71.7
Net Tax Allowance 30.3 32.4 34.0 36.2 38.1 171.1
Annual Building Block Revenue
Requirement (Unsmoothed)
744.4 786.3 814.2 854.6 873.4 4,072.9
Source: TransGrid. Totals may not add due to rounding.
9.1.10 Smoothed Maximum Allowed Revenue
The unsmoothed revenue is required to be smoothed over the 2018/19 to 2022/23 regulatory period.
The revised smoothed revenue and x-factors over 2018/19 to 2022/23 period are shown in Table 9.9.
Table 9.9: Revised Smoothed Revenue Requirement ($m nominal)
2018/19 2019/20 2020/21 2021/22 2022/23 Total
Unsmoothed Revenue 744.4 786.3 814.2 854.6 873.4 4,072.9
Smoothed Revenue 744.4 778.2 813.4 850.2 888.7 4,074.9
X-factor -1.88% -2.00% -2.00% -2.00% -2.00%
Source: TransGrid. Totals may not add due to rounding.
9.1.11 Average Price Path
TransGrid calculates its transmission charges based on the AER’s approved revenue and the pricing
principles in Clause 6A.23 of the Rules. The indicative average price path is estimated using the AER’s
PTRM, by dividing the smoothed revenue requirement by the energy delivered in New South Wales
forecast by AEMO. The AER has adopted the June 2017 neutral operational forecast in its draft
decision. We have adopted the same category data. TransGrid has used the latest demand forecast
that was published by AEMO in its NEM Electricity Statement of Opportunity on 5 September 2017129
.
AEMO’s latest energy forecasts have reduced by an average of 3.2% since we submitted the revenue
proposal, this reduction in energy increases the calculated average price for customers. TransGrid’s
revised proposal annual average price reduction has accordingly reduced compared to the January
proposal, to an average 3.89% real price reduction.
The average price path over the 2018/19 to 2022/23 period is shown in figure 9.1.
129 AEMO, NEM Electricity Statement of Opportunity, September 2017. TransGrid notes that the AEMO confirmed that the years
indicated in the forecast are referring to financial year end.

TRANSGRID REVISED REVENUE PROPOSAL | 2018/19-2022/23 9
Page 151 of 158
Figure 9.1: Average Price Path ($ June 18)
Source: TransGrid.

PASS THROUGH, NEGOTIATING FRAMEWORK & PRICING METHODOLOGY | 2018/19-2022/23 10
Page 152 of 158
10. Pass through events, Negotiating Framework and Pricing Methodology
10.1 Introduction
This chapter covers:
Pass through events
Negotiating Framework
Pricing Methodology.
10.2 Pass through events
Cost pass through arrangements provide for adjustments to the allowed revenue if a non-controllable
predefined event occurs that leads to a material change in TransGrid’s costs. It is intended for a TNSP
to recover at least the efficient costs of uncontrollable, material events that either cannot be insured for
or where the establishment of self-insurance is not economically viable.
The AER has accepted TransGrid’s nominated pass through events.
TransGrid notes that since submission of its revenue proposal the Rules have changed and further
prescribed pass through events have been included within Clause 6A.7.3., reflecting new obligations
placed on transmission network businesses. We expect that these new pass through events will apply
to TransGrid in the event they should occur during the 2018/19 to 2022/23 regulatory period.
10.2.1 TransGrid’s proposal
Chapter 17 of our revenue proposal sets out the following nominated pass through events in addition to
those prescribed by Clause 6A.7.3 of the Rules:
Insurance cap event
Terrorism event
Insurer credit risk event
Natural disaster event.
Under Clause 6A.7.3 the prescribed pass through events at the time of TransGrid’s revenue
submission, were:
Regulatory change event
Service standard change event
Tax change event
Insurance event.
10.2.2 AER’s Draft Decision
The AER has accepted TransGrid’s nominated pass through events in the draft decision.
10.2.3 Response to Draft Decision
We acknowledge the AER’s acceptance of the proposed nominated pass through events.
On 17 September 2017, the Australian Energy Market Commission (AEMC) made a final rule to place
an obligation on Transmission Network Service Providers (TNSPs) to procure minimum levels of inertia
or procure other services such as frequency control services that reduce the minimum level of inertia

TRANSGRID REVISED REVENUE PROPOSAL | 2018/19-2022/23 10
Page 153 of 158
required. The relevant TNSP must make continuously available minimum required levels of inertia,
determined by AEMO, where an inertia shortfall exists in a sub-network either by itself or procure inertia
services from third parties such as generators. The Rules permit the TNSPs to invest in or contract with
third-party providers of alternative frequency control services (“inertia support activities”), including fast
frequency response (FFR) services, as a means of reducing the minimum required levels of inertia, with
approval from AEMO.
The final Rule determination states that a new category of pass through event – an “inertia shortfall
event” will be added under chapter 6A.7.3 of the Rules130
.
On 19 September 2017, the AEMC published a final rule to place an obligation on TNSPs to maintain
minimum levels of system strength131
. The final rule enables the TNSPs to procure these services in a
timely manner needed to maintain system security.
The final rule adds a new category of pass-through event under Clause 6A.7.3 – a “fault level shortfall
event”. A fault level shortfall event occurs where a TNSP is required to provide, or cease providing,
system strength services and meeting this requirement materially increases or decreases the TNSP’s
costs of providing prescribed transmission services.
TransGrid expects the final decision should reflect the new Rules which will apply to TransGrid should
any inertia shortfall event or fault level shortfall event occur during the 2018/19 to 2022/23 regulatory
period.
10.3 Negotiating framework
In its draft decision the AER approved TransGrid’s proposed negotiating framework for Negotiated
Transmission Services for the 2018/19 to 2022/23 regulatory period.
TransGrid accepts the AER’s draft decision and maintains this position in the revised proposal.
10.4 Pricing Methodology
In its draft decision the AER approved TransGrid’s proposed Pricing Methodology for the 2018/19 to
2022/23 regulatory period.
TransGrid accepts the AER’s draft decision and maintains this position in the revised proposal.
130 Rule Determination National Electricity Amendment (Managing the rate of change of power system frequency) Rule 2017,
Australian Energy Market Commission, Executive Summary, P10. 131
Rule Determination National Electricity Amendment (Managing power system fault levels) Rule 2017, Australian Energy Market Commission, Executive Summary

GLOSSARY | 2018/19-2022/23 11
Page 154 of 158
11. Glossary
Acronym/Term Definition
ABS Australian Bureau of Statistics
ACT Australian Capital Territory
AEMC Australian Energy Market Commission
AEMO Australian Energy Market Operator
AER Australian Energy Regulator
ALARP As low as reasonably practicable
ASD Australian Signals Directorate
ATO Australian Taxation Office
BEE Benchmark Efficient Entity
CAPM Capital Asset Pricing Model
CBD Central Business District
CCP Consumer Challenge Panel
CDN Corporate Data Networks
CERT Computer Emergency Response Team
CESS Capital Expenditure Sharing Scheme
CIC Critical Infrastructure Centre
CPI Consumer Price Index
COAG Council of Australian Governments
CoF Consequence of Failure
DGM Dividend growth model
DM Demand management
EBSS Efficiency Benefit Sharing Scheme
EGWWS Electricity, Gas, Water and Waste Services
EIS Environment Impact Assessment
EMCa Energy Market Consulting Associates
ES C2M2 Electricity Subsector Cybersecurity Capability Maturity Model
FFR Fast frequency response
FTE Full time equivalent
Gamma The value of dividend imputation tax credits

TRANSGRID REVISED REVENUE PROPOSAL | 2018/19-2022/23 11
Page 155 of 158
Acronym/Term Definition
GFC Global financial crisis
IAP2 International Association for Public Participation
IPART Independent Pricing and Regulatory Tribunal
ISMS Information Security Management System
LoC Likelihood of consequence
MAR Maximum allowed revenue
MIC Market Impact Component
MRP Market risk premium
NASA National Aeronautics and Space Administration
NCC Network Capability Component
NCIPAP Network capability incentive parameter action plan
NEM National Electricity Market
NER National Electricity Rules
NIEIR National Institute of Economic and Industry Research
NPV Net Present Value
NSCAS Network Support Control Ancillary Services
NSP Network Service Provider
NSW New South Wales
NTNDP National Transmission Network Development Plan
OER Option Evaluation Report
PACR Project Assessment Conclusion Report
PADR Project Assessment Draft Report
PESA Public Electricity Safety Awareness Plan
PoF Probability of failure
PSCR Project Specification Consultation Report
PSF Powering Sydney’s Future
PTRM Post Tax Revenue Model
PV Present value
QNI Queensland-New South Wales Interconnector
RAB Regulatory asset base
RBA Reserve Bank of Australia
RCP Regulatory Control Period
GLOSSARY | 2018/19-2022/23 11
Page 156 of 158
Acronym/Term Definition
Repex Replacement capital expenditure
RFM Roll Forward Model
RIT-T Regulatory Investment Test for Transmission
RPWG Revenue Proposal Working Group
Rules National Electricity Rules
SC Service Component
SCADA Supervisory control and data acquisition
SL-CAPM Sharpe-Lintner Capital Asset Pricing Model
SSZ Substation Security Zone
STPIS Service Target Performance Incentive Scheme
TAC TransGrid Advisory Council
TAPR Transmission Annual Planning Report
US United States of America
VCR Value of Customer Reliability
VoSL Value of Statistical Life
WACC Weighted-average cost of capital
WPI Wage Price Index

TRANSGRID REVISED REVENUE PROPOSAL | 2018/19-2022/23 11
Page 157 of 158

APPENDICES | 2018/19-2022/23 12
Page 158 of 158
12. Appendices
Appendix Topic Author
A Expected Wage Changes BIS Oxford Economics
B IT Step Change compliance with NSW licence conditions TransGrid
B1 Licence Conditions Audit HIVINT
B2 Licence Draft Transition Plan TransGrid
C AER modifications to the EBSS Frontier Economics
D Review of the CESS model HoustonKemp