Revised B.FLT.0385 final report (2017-03-13) (1)
117
Project code: B.FLT.0385 Prepared by Peter Watts 1 and Bernadette McCabe 2 Feedlot Services Australia T/A FSA Consulting 1 and National Centre for Engineering in Agriculture 2 Date published: 30 September 2015 PUBLISHED BY Meat and Livestock Australia Limited PO Box 1961 NORTH SYDNEY NSW 2059 Feasibility of using feedlot manure for biogas production Meat & Livestock Australia acknowledges the matching funds provided by the Australian Government to support the research and development detailed in this publication. This publication is published by Meat & Livestock Australia Limited ABN 39 081 678 364 (MLA). Care is taken to ensure the accuracy of the information contained in this publication. However MLA cannot accept responsibility for the accuracy or completeness of the information or opinions contained in the publication. You should make your own enquiries before making decisions concerning your interests. Reproduction in whole or in part of this publication is prohibited without prior written consent of MLA. final report
Transcript of Revised B.FLT.0385 final report (2017-03-13) (1)

Project code: B.FLT.0385 Prepared by Peter Watts1 and Bernadette McCabe2 Feedlot Services Australia T/A FSA Consulting1 and National Centre
for Engineering in Agriculture2 Date published: 30 September 2015 PUBLISHED BY Meat and Livestock Australia Limited PO Box 1961 NORTH SYDNEY NSW 2059
Feasibility of using feedlot manure for biogas production
Meat & Livestock Australia acknowledges the matching funds provided by the Australian Government to support the research and development detailed in this publication. This publication is published by Meat & Livestock Australia Limited ABN 39 081 678 364 (MLA). Care is taken to ensure the accuracy of the information contained in this publication. However MLA cannot accept responsibility for the accuracy or completeness of the information or opinions contained in the publication. You should make your own enquiries before making decisions concerning your interests. Reproduction in whole or in part of this publication is prohibited without prior written consent of MLA.
final report

B.FLT.0368 Final Report – Feasibility of using feedlot manure for biogas production
Page 2 of 117
Executive summary
Anaerobic digestion has the potential to reduce greenhouse gas (GHG) emissions while also providing biogas as an energy source. With rising energy costs and the introduction of the Emissions Reduction Fund (ERF), there has been an increasing interest in extracting energy from feedlot manure in the form of biogas. While biogas capture has been cost effective in the Australian pig industry, the successful conversion of beef feedlot manure into biogas has not been proven on a similar scale. This is largely because feedlot pen manure in its current form is an unsuitable substrate for biogas production. There is currently a lack of knowledge within the Australian feedlot industry regarding the biomethane potential (BMP) of beef feedlot manure of differing ages and how harvest techniques impact on BMP values. Consequently there is a need for further analysis and understanding of 1) feedlot manure as a substrate for methane production and 2) the techno-economic feasibility of using this feedstock to produce biogas. Specific project objectives of this study include:
1. A comprehensive review on the application of anaerobic digestion technologies treating agricultural waste for energy recovery including the identification of technically-feasible technologies for beef feedlot manure.
2. An understanding of feedlot feedstock and current manure handling practices at feedlots throughout Australia.
3. A technical and economic assessment of the different anaerobic treatment systems. 4. The results of biomethane potential (BMP) using different aged manures at lab scale. 5. Development of a pre-treatment system(s) to produce optimal influent material from feedlot
manure as managed in existing systems. 6. Recommendations for systems worth trialling in a future farm-scale pilot trial. 7. A preliminary economic assessment of the system at a 10,000 head feedlot.
A comprehensive review of the literature has revealed that the economic value of feedlot manure for anaerobic digestion is largely determined by the composition (quality) of the manure. Pen cleaning timing, frequency and method affects the quality of the manure removed. The wide range of organic (volatile solid (VS)) content in material harvested from feedlot pens obtained from literature demonstrates the influence of pen design and management on the quality of manure removed from the pens. Data from these feedlots suggest that the material harvested contains material other than manure. This additional material (e.g. rocks and/or soil) influences the biomethane potential results by increasing the quantity of material harvested and lowering the organic content. The data from the literature highlights the need to be fully aware of the circumstances behind pen manure samples when assessing the substrate as a biogas feedstock. Low VS contents can either be due to prolonged manure breakdown or due to mixing of manure with soil. This study reported on the BMP and chemical composition of feedlot manure samples from three Australian feedlots. Four types of manure were tested namely, 1) fresh manure (FM): faeces that are freshly dropped; 2) pen surface manure (PSM): faeces and urine that are excreted to the pen and left on the pen surface before pen cleaning; 3) freshly scraped pen manure (FSPM): a mixture of faeces and urine that are excreted and left on the pen over a period of time and includes gravel and soil that is mixed up when the pen is cleaned by machinery and 4) stockpiled manure (SM): scraped pen manure stockpiled over a period of time, usually a few months. Analysis of the organic matter content in the form of lignin, fat (lipid), volatile fatty acids (VFA), cellulose, hemicellulose, starch and protein were conducted alongside total solids (TS) and VS content for each sample. These were then correlated with corresponding BMP results of each sample. Biomethane potential testing resulted in methane yields of FM (218 L CH4/kg VS), PSM (173 L CH4/kg VS), FSPM (135 L CH4/kg VS) and SM (13 L CH4/kg VS). SM biogas generation is 7.5% of the amount generated by the clean pen manure (PSM) while the fresh and the pen feedlot manures have shown comparable methane

B.FLT.0368 Final Report – Feasibility of using feedlot manure for biogas production
Page 3 of 117
potential. The results indicate that contamination with soil may be the main factor that affects biogas production therefore highlighting the importance of pre-treatment systems over the time of collection. Two preliminary pre-treatment experiments of pen surface manure from one feedlot were conducted. The trials examined the effect of stirring on particle size and TS and VS content. The trials demonstrated that there were vast differences between the calculated and tested TS% pen which was attributed to dry crusty nature of the sample. Further testing will need to be completed at increased TS% between the 4-8% range. To determine the economic feasibility of a feedlot manure biogas system, an engineering firm provided a broad cost estimate for capital expenditure (CAPEX) and an ongoing operational expenditure (OPEX) for the proposed 10,000 SCU manure-biogas development. Working from current market prices, industry knowledge and experience from similar projects, the firm provided costs associated to design and construct a fully engineered, quality control tested and project managed facility. The estimated CAPEX for a biogas development of this nature is expected to range from $8,100,000 - $9,500,000, with an annual OPEX of $350,000/year. Various measures to increase the economic feasibility of the biogas feasibility include:
A review of manure harvest management techniques and the modification of existing machinery to improve the quality of the feedstock.
A review of low cost biogas technology options which could be suitable for feedlots using manure as a single substrate.
An investigation into the use of various waste streams in addition to feedlot manure (ie co-digestion) and the subsequent exploration into supply chain management.

B.FLT.0368 Final Report – Feasibility of using feedlot manure for biogas production
Page 4 of 117
Acknowledgements
The authors would like to thank the following, who helped make this project possible. The National Centre for Engineering in Agriculture (NCEA) at the University of Southern Queensland (USQ) project team:
Bernadette McCabe
Craig Baillie
Ihsan Hamawand
Peter Harris Feedlot Services Australia (T/A FSA Consulting) project team:
Peter Watts
Eugene McGahan
Orla Keane
Mingjia Yann
David Carberry Kerwee Feedlot (Jondaryan, QLD) staff

B.FLT.0368 Final Report – Feasibility of using feedlot manure for biogas production
Page 5 of 117
Table of contents
Executive summary ............................................................................ 2
Acknowledgements ............................................................................ 4
List of Tables ...................................................................................... 5
List of Figures ..................................................................................... 9
List of Photographs .......................................................................... 10
List of Abbreviations and Terms ....................................................... 12
1. Introduction ...................................................................... 14
1.1 Background ..................................................................................................... 14
1.2 Scope of work .................................................................................................. 14
2 Literature Review .............................................................. 14
2.1 Cattle Feedlots ................................................................................................. 15
2.1.1 Location of feedlots in Australia .............................................................................. 15
2.2 Feedlot manure management systems ............................................................. 17
2.2.1 Manure management overview .............................................................................. 17
2.2.2 Pen cleaning systems ............................................................................................... 18
2.2.3 Quantity of harvested feedlot pen manure ............................................................ 21
2.3 Feedlot manure characteristics ........................................................................ 25
2.3.1 Manure moisture, ash, thermal energy and nutrient characteristics ..................... 25
2.3.2 Biomethane potential .............................................................................................. 28
2.3.3 Physical contaminants in feedlot manure ............................................................... 28
2.4 Feedlot runoff control ...................................................................................... 33
2.4.1 Controlled drainage system ..................................................................................... 33
2.4.1 Sediment removal systems and holding ponds ....................................................... 34
2.4.2 Feedlot effluent quality ........................................................................................... 34
2.4.3 Biogas from feedlot effluent ................................................................................... 34
2.5 Energy consumption at cattle feedlots ............................................................. 35
2.6 Anaerobic digestion operating parameters....................................................... 36
2.6.1 The anaerobic digestion process ............................................................................. 36
2.6.2 Digester temperatures ............................................................................................ 37
2.6.3 Ammonia content .................................................................................................... 37
2.6.4 pH and VFAs ............................................................................................................. 38
2.6.5 Antibiotics and feed additives ................................................................................. 38

B.FLT.0368 Final Report – Feasibility of using feedlot manure for biogas production
Page 6 of 117
2.7 Types of anaerobic digesters ............................................................................ 41
2.7.1 Anaerobic Ponds ...................................................................................................... 42
2.7.2 Liquid mixed digester .............................................................................................. 42
2.7.3 Liquid plug flow ....................................................................................................... 42
2.7.4 Solid phase (leach bed) ............................................................................................ 43
2.7.5 High-rate anaerobic digesters ................................................................................. 43
2.8 AD process outputs .......................................................................................... 43
2.8.1 Biogas yield .............................................................................................................. 43
2.8.2 Cogeneration and combined heat sand power (CHP) plant .................................... 50
2.8.3 Digestate and sludge handling and disposal ........................................................... 50
2.9 Biogas regulations and safety ........................................................................... 51
2.9.1 Biogas regulations.................................................................................................... 51
2.9.2 Biogas safety ............................................................................................................ 51
2.9.3 Environmental protection ....................................................................................... 51
2.10 Agricultural Biogas plants in Australia .............................................................. 51
2.11 Experiences with biogas production at US feedlots........................................... 54
2.11.1 Overview of feedlot biogas projects in USA ............................................................ 54
2.11.2 Hampton Feedlot Inc. .............................................................................................. 56
2.11.3 E3 Biofuels ............................................................................................................... 61
2.11.4 Hi-Mark Feeders/Biogas .......................................................................................... 67
2.11.5 Western Plains Energy ............................................................................................. 67
2.11.6 Colorado State University Leach bed system .......................................................... 68
2.11.7 Summary of feedlot biogas in the USA .................................................................... 71
2.12 Improving biogas yield of feedlot manure ........................................................ 71
2.12.1 Change manure harvesting techniques ................................................................... 71
2.12.2 Pre-treatment of feedlot manure ............................................................................ 72
2.12.3 Dilution and mixing of feedlot manure ................................................................... 73
2.12.4 Co-digestion of manure with other products .......................................................... 73
2.12.5 Improvement of C:N ratio in manure feedstock ..................................................... 74
3 Methodology .................................................................... 74
3.1 Feedlot manure sampling ................................................................................ 74
3.1.1 Biomethane potential testing and chemical composition ...................................... 74
3.1.2 Physical characterisation ......................................................................................... 77
3.2 Biomethane potential batch tests .................................................................... 77
3.2.1 Sample Preparation ................................................................................................. 77
3.2.2 Chemical characterisation ....................................................................................... 78

B.FLT.0368 Final Report – Feasibility of using feedlot manure for biogas production
Page 7 of 117
3.2.3 BMP set up and operation ....................................................................................... 78
3.2.4 Inoculum (sludge) source ........................................................................................ 80
3.2.5 Inoculum: substrate ratios (ISR) .............................................................................. 80
3.2.6 Blanks and controls .................................................................................................. 80
3.2.7 Preparation of bioreactors and start-up procedure ................................................ 81
3.3 Physical characterisation: turbidity, bulk density and settling velocity .............. 81
3.4 Pre-treatment systems .................................................................................... 81
3.4.1 Pre-treatment trial ................................................................................................... 82
4 Results and discussion ....................................................... 83
4.1 Manure characterisation .................................................................................. 83
4.1.1 Chemical composition ............................................................................................. 83
4.1.2 Physical characteristics ............................................................................................ 86
4.2 Methane yields (BMP) ..................................................................................... 86
4.3 Preliminary pre-treatment trials ...................................................................... 88
4.3.1 Effect of stirring on particle sizes ............................................................................ 89
4.3.2 Effect of pretreatment on TS and VS contents ........................................................ 89
4.3.3 Effect of secondary pre-treatment on particle size................................................. 90
4.4 Proposed physical design parameters of a feedlot biogas plant ........................ 91
4.4.1 Manure harvesting .................................................................................................. 92
4.4.2 Manure screening .................................................................................................... 92
4.4.3 Mixing tank .............................................................................................................. 96
4.4.4 Digester .................................................................................................................... 99
4.4.5 Biogas handling and use ........................................................................................ 100
4.4.6 Digester sludge removal ........................................................................................ 100
4.4.7 Sludge and effluent dewatering ............................................................................ 103
4.5 Economic assessment of a feedlot biogas system ........................................... 103
4.5.1 Proposed biogas system design and indicative cost ............................................. 103
4.5.2 Fertilizer sales ........................................................................................................ 105
4.5.3 Emissions Reduction Fund (ERF) ............................................................................ 106
5 Conclusions and recommendations ................................. 106
6 References ...................................................................... 109

B.FLT.0368 Final Report – Feasibility of using feedlot manure for biogas production
Page 8 of 117
List of Tables
Table 1 – Location of current feedlots with respect to mean annual rainfall ............................................ 15
Table 2 – Current distribution of feedlots in seasonal rainfall regions ....................................................... 17
Table 3 - Typical range of biogas components............................................................................................ 44
Table 4 – Maximum methane-producing capacity of the manure (Bo) ...................................................... 44
Table 5 - Biogas yield from different feedstocks ........................................................................................ 46
Table 6 – Methane yields from various types of animal waste .................................................................. 47
Table 7 – Maximum methane producing capacity for US livestock fresh manure ..................................... 48
Table 8 – Biochemical methane potential (B0) of manure samples collected at three Australian feedlots50
Table 9 – Australian biogas plants operating and proposed (2010) ........................................................... 53
Table 10 – Beef anaerobic digester operational projects – 2014 (Agstar) ................................................. 55
Table 11 – Feedlot manure sampling information ..................................................................................... 75
Table 12 – Chemical components of the fresh, pen, and stockpile manure from feedlot 1, 2 and 3 ........ 84
Table 13 - Biomethane potential (BMP) of fresh (FM), pen surface (PSM), freshly scraped pen manure (FSPM), and stockpile (SM) manure from feedlot 1, 2 and 3 after 32 days incubation ............................. 87
Table 14 - Comparison of feedlot pen surface manure - BMP and age of pen surface manure ................ 88
Table 15 - Chemical components of the fresh, pen and stockpile manure from feedlot 1, 2 and 3 .......... 89
Table 16 – Comparative income of manure and digestate as fertilizers .................................................. 105

B.FLT.0368 Final Report – Feasibility of using feedlot manure for biogas production
Page 9 of 117
List of Figures
Figure 1 – Location of Australian feedlots vs. annual rainfall ..................................................................... 16
Figure 2 – Location of Australian feedlots vs. seasonal rainfall zones ........................................................ 17
Figure 3 – Manure depth vs. days since cleaning (all pens, Davis et al. (2012)) ......................................... 24
Figure 4 – Volatile solids remaining over time (Feedlot D, Davis et al. (2012)) .......................................... 24
Figure 5 - Comparison of measured versus predicted manure (TS) removed from pens at different moisture contents ....................................................................................................................................... 25
Figure 6 – Relationship between ash content and moisture content for various feedlot manure samples26
Figure 7 – Relationship between ash content and moisture content for pen surface manure ................. 27
Figure 8 - Controlled drainage area for a feedlot ....................................................................................... 34
Figure 9 – Average monthly total energy usage at eight feedlots (MJ/head-on-feed/month) during March 2007 to February 2008 ................................................................................................................................ 35
Figure 10 – Anaerobic digestion process .................................................................................................... 36
Figure 11 – Free ammonia levels, and ammonia inhibition ........................................................................ 38
Figure 12 – Effective concentration of some antibiotics when 10% inhibition was found on methane production from anaerobic digestion (EC10).............................................................................................. 40
Figure 13 – Operating conditions (HRT and feed solids concentration) of different types of anaerobic digestion ...................................................................................................................................................... 41
Figure 14 – Reported BMP (L CH4 / kg VS) in literature .............................................................................. 49
Figure 15- Schematic outline of E3 Biofuels ............................................................................................... 62
Figure 16 – CSU leach bed system .............................................................................................................. 69
Figure 17 – Relationship between Biochemical methane potential (BMP) and VS content of feedlot manure samples .......................................................................................................................................... 72
Figure 18 – BMP (L CH4 / kg VS) of mono- and co-digested substrates ...................................................... 74
Figure 19 - Schematic presentation of AMPTS ........................................................................................... 79
Figure 20 - Pre-treatment trial 1. Left: illustration of pre-treatment system; right: mixing manure with water by stirrer ........................................................................................................................................... 82
Figure 21 A, B and C - Components of manure samples A) F1 SM, B) F1 PSM and C) F2 PSM based on dry basis ............................................................................................................................................................ 85
Figure 22 - Methane yields from three manure types originating from three feedlots ............................. 87
Figure 23 - Methane yields from three manure types (fresh, pen surface and freshly scraped pen) types originating from one feedlot ....................................................................................................................... 88
Figure 24 - Calculated and tested TS% (wb) of freshly scraped pen manure (FSPM) and pen surface manure (PSM) from feedlot 3 through top, middle, bottom and base layers of the pre-treatment system .................................................................................................................................................................... 90
Figure 25 - Five versions of in-tank mixers by GEA ..................................................................................... 98
Figure 26 - Desirable layout of anaerobic pond to facilitate desludging (Watson 1999) ......................... 101
Figure 27 - Airlift pump (Watson 1999) .................................................................................................... 101
Figure 28 – Flow chart incorporating key elements of a proposed biogas system suitable for feedlots . 104

B.FLT.0368 Final Report – Feasibility of using feedlot manure for biogas production
Page 10 of 117
List of Photographs
Photograph 1 - Typical view of cattle in an Australian feedlot ................................................................... 15
Photograph 2 - Pen cleaning using a box scraper under dry conditions .................................................... 19
Photograph 3 - Pen cleaning using a box scraper under wet conditions ................................................... 19
Photograph 4 - compacted manure interface layer over compacted gravel .............................................. 20
Photograph 5 - Pen cleaning while retaining a compacted manure interface layer .................................. 20
Photograph 6 - Pen cleaning with a front-end loader where the interface is removed exposing the clay base ............................................................................................................................................................. 21
Photograph 7 - A US feedlot with pen surface of uncompacted soil .......................................................... 22
Photograph 8 - Feedlot pen with manure mound ...................................................................................... 23
Photograph 9 - Pen cleaning where soil is removed with manure ............................................................. 29
Photograph 10 - Pen cleaning where only manure is removed.................................................................. 30
Photograph 11 - Example of large rocks being used to repair a high-traffic area in a feedlot pen ............ 30
Photograph 12 - Placement of gravel to repair a pen surface .................................................................... 31
Photograph 13 - Stockpile of rocks screened from pen manure ................................................................ 31
Photograph 14 - Intake bin to manure screening plant showing baling twine........................................... 32
Photograph 15 - Example of hair in a manure dag in pen manure ............................................................. 32
Photograph 16 - Example of contaminant - wire cable in removed manure ............................................. 33
Photograph 17 – Covered anaerobic pond for biogas production ............................................................. 42
Photograph 18 – Anaerobic Digester – Denmark farm facility ................................................................... 43
Photograph 19 – Aerial photograph of Hampton Feedlot .......................................................................... 57
Photograph 20 – Mixing tank close to confinement barns ......................................................................... 57
Photograph 21 - Macerator on influent line ............................................................................................... 58
Photograph 22 – Heat exchanger on influent line ...................................................................................... 58
Photograph 23 – Positive displacement pumps on influent line ................................................................ 59
Photograph 24 – Two of the six digester tanks .......................................................................................... 59
Photograph 25 – Electricity generator using biogas ................................................................................... 60
Photograph 26 – Control system for anaerobic digester and generator .................................................... 60
Photograph 27 – Separated solids from digester effluent.......................................................................... 61
Photograph 28 – Google Earth image of E3 Biofuels .................................................................................. 62
Photograph 29 – Cattle on slatted flooring in confinement barn............................................................... 63
Photograph 30 – Manure slurry holding pond ........................................................................................... 63
Photograph 31 – Slurry pump with confinement barns in background ..................................................... 64
Photograph 32 – Manure mixing tank ........................................................................................................ 64
Photograph 33 – Anaerobic digester tank .................................................................................................. 65
Photograph 34 – Detail of anaerobic digester tank .................................................................................... 65
Photograph 35 – Biogas pump from digester to ethanol plant .................................................................. 66
Photograph 36 – Excess biogas flare........................................................................................................... 66
Photograph 37 – Belt press for effluent dewatering (not operating) ......................................................... 67
Photograph 38 - Google Earth image of Western Plains Energy ................................................................ 68
Photograph 39 – General view of Western Plains anaerobic digesters ..................................................... 68
Photograph 40 – CSU mobile leach bed system ......................................................................................... 70

B.FLT.0368 Final Report – Feasibility of using feedlot manure for biogas production
Page 11 of 117
Photograph 41 – Control panel at CSU leach bed system .......................................................................... 70
Photograph 42 – Screened manure for leach bed trials ............................................................................. 71
Photograph 43 – Fresh manure sampling at feedlot 1 ............................................................................... 75
Photograph 44 – Pen surface manure sampling at feedlot 1 ..................................................................... 76
Photograph 45 – Manure from freshly scraped pen at feedlot 3 ............................................................... 76
Photograph 46 – Stockpile manure sampling at feedlot 1 ......................................................................... 77
Photograph 47 – Laboratory set up of the Automatic Methane Potential Test System (AMPTS) ............. 79
Photograph 48 – Operation of the pressure cleaner to break up manure clods........................................ 83
Photograph 49 – Positioning of the three sample valves ........................................................................... 83
Photograph 50 – Particle sizes of freshly scraped pen manure from feedlot 3 before (bottom) and after (top) the pre-treatment .............................................................................................................................. 89
Photograph 51 – Gravel and tough manure clods after cleaning ............................................................... 91
Photograph 52 – Wetter manure slurry after pressurized washing ........................................................... 91
Photograph 53 – Pen cleaning of surface material only ............................................................................. 93
Photograph 54 – Manure handling within pens ......................................................................................... 93
Photograph 55 – Manure removal from pens ............................................................................................ 94
Photograph 56 – Three-way vibrating screen ............................................................................................. 94
Photograph 57 – Rotating Trommel ........................................................................................................... 95
Photograph 58 – 10mm screen size ............................................................................................................ 95
Photograph 59 – Carrot washer .................................................................................................................. 96
Photograph 60 – Wet vibrating screen ....................................................................................................... 96
Photograph 61 – Mixing tank with delivery of manure by conveyor ......................................................... 97
Photograph 62 - Jet and propeller mixers in mixing tank ........................................................................... 97
Photograph 63 – Positive displacement slurry pumps ............................................................................... 98
Photograph 64 - In-line macerator ............................................................................................................. 99
Photograph 65 – Covered anaerobic pond (CAP) ..................................................................................... 100
Photograph 66 – Installation of sludge removal pipe system .................................................................. 102
Photograph 67 – Installation of sludge removal pipe system .................................................................. 102
Photograph 68 – Sludge extraction pipelines (deflated pond cover) ....................................................... 103

B.FLT.0368 Final Report – Feasibility of using feedlot manure for biogas production
Page 12 of 117
List of Abbreviations and Terms
AD Anaerobic digestion
ADF Acid detergent fibre
ADG Average daily gain
ADL Acid detergent lignin
Bo Maximum methane producing capacity
BD Bulk density
BEEFBAL Feedlot nutrient balance model
BOD Biochemical oxygen demand
BMP Biochemical methane potential
C Carbon
CAP Covered anaerobic pond
CAPEX Capital expenditure
CHNOS Carbon, hydrogen, nitrogen, oxygen, sulphur
CH4 Methane
COD Chemical oxygen demand
CO2 Carbon Dioxide
DM Dry Matter
DMD Dry Matter Digestibility
DMDAMP Dry Matter Digestibility Approximation of Manure Production
DMI Dry Matter Intake
DOF Days on Feed
EC Electrical conductivity
ERF Emissions Reduction Fund
FCR Feed conversion ratio
FS Fixed Solids
GHG Greenhouse gas
HHV Higher heating value
HRAD High rate anaerobic digester
HRT Hydraulic retention time
LWT Liveweight
MC Moisture content
MCF Methane conversion factor
MLA Meat & Livestock Australia

B.FLT.0368 Final Report – Feasibility of using feedlot manure for biogas production
Page 13 of 117
M&E Mass and energy
MJ Megajoule
MSW Municipal solid waste
MW Megawatt
MWh Megawatt hour
N Nitrogen
NDF Neutral detergent fibre
NOx Oxides of nitrogen
NPV Net present value
O&M Operating and maintenance
OPEX Operational expenditure
P Phosphorus
PFD Process flow diagram
REC Renewable energy credit
SAR Sodium absorption ratio
SCU Standard cattle unit (regulatory standard in Queensland)
SOx Oxides of sulphur
TN Total nitrogen
TP Total phosphorus
TS Total solids
TFLBR Trickle flow leach bed reactor
VFA Volatile Fatty Acids
VS Volatile solids

B.FLT.0368 Final Report – Feasibility of using feedlot manure for biogas production
Page 14 of 117
1. Introduction
1.1 Background
Beef feedlot manure has a relatively high energy content, similar to other organic waste materials. As such, it offers the potential for energy recovery using thermal processes such as combustion, gasification or pyrolysis and biological processes such as anaerobic digestion. Anaerobic digestion has the potential to reduce Green House Gas (GHG) emissions while also providing biogas as an energy source. With rising energy costs and the introduction of the Emissions Reduction Fund (ERF), there has been an increasing interest in extracting energy from feedlot manure in the form of biogas. While biogas capture has been cost effective in the Australian pig industries, the successful conversion of beef feedlot manure into biogas has not been proven on a similar scale. This is largely because feedlot pen manure in its current form is thought to be an unsuitable substrate for biogas production. Some preliminary Australian manure characterisation has been undertaken by the Advanced Water Management Centre (AWMC), a research centre at the University of Queensland. Additionally, methane emissions from a feedlot holding pond have been measured by the CSIRO. There are significant and confusing differences between these results. The work conducted at the AWMC, reported low methane yields from feedlot manure when compared to piggery waste. However, it also reported less than expected differences in yields between fresh and aged feedlot manure, which is not consistent with the relative volatile solids content of the two substrates. On the other hand, the CSIRO measurements reported much higher methane yields from the effluent than would be expected from first principles. These conflicting results highlight the need for further analysis and understanding of feedlot manure as a substrate for methane production.
1.2 Scope of work
This project investigated the feasibility of anaerobic digestion systems for feedlot manure for optimal biogas production. An initial review of the international research literature on anaerobic digestion of cattle manure and similar waste streams, along with case studies on existing plants was conducted to define the required characteristics of an influent substrate for anaerobic digestion and to identify the current status of energy recovery using anaerobic digestion from feedlot manure, with a particular focus on US practices. Further analysis of manure samples from Australian feedlots were undertaken to provide an understanding of the range of variation of feedstock. The project utilised laboratory scale studies to determine the optimum solids concentration and pre-treatment of manure prior to anaerobic digestion. This will inform the design of pre-treatment technologies at the medium scale deployed in the field. A preliminary economic assessment was then conducted The results of this work are of particular importance and relevance to feedlots that have committed to investment in anaerobic digesters or are considering such investment.
2. Literature Review
The literature review has been divided into three main sections. The first section describes the Australian lot feeding sector including the provision of data on the quantity and quality of organic wastes produced at feedlots. The second section describes the anaerobic digestion process and its application to the production of biogas from organic wastes. The third section discusses the issues around the production of biogas from feedlot wastes.

B.FLT.0368 Final Report – Feasibility of using feedlot manure for biogas production
Page 15 of 117
2.1 Cattle feedlots
A cattle feedlot is a facility where beef cattle are housed in open pens and fed a prepared diet until they reach a specified weight (See Photograph 1). Only weaned cattle enter the feedlot and no breeding of cattle occurs at the feedlot. The pen surface is typically compacted clay or gravel. Depending on site-specific conditions, feedlot pens are stocked at between 10 and 20 m2/head. Animal size is sometimes standardised to SCU (standard cattle units) (Skerman 2000).
Photograph 1 - Typical view of cattle in an Australian feedlot
2.1.1 Location of feedlots in Australia
Feedlots are generally located across the grain-growing regions of Australia. The climatic zones in which feedlots are located are of relevance to this study. The amount and annual patterns of rainfall affect the moisture content of manure on the pen surface and the rate at which that manure breaks down. Table 1 below details the distribution of Australian feedlots relative to mean annual rainfall (Watts et al 2013a).
Table 1 – Location of current feedlots with respect to mean annual rainfall
No. of Feedlots % of Feedlots Av. Capacity Pen Capacity % Pen Capacity
Summary
< 750 mm 629 74% 1940 1 185 809 88%
> 750 mm 225 26% 709 159 636 12%
< 600 mm 137 16% 2579 353 256 26%
600-649 mm
77 9% 1748 134 569 10%
650-699 mm
176 21% 1953 343 683 26%
700-750 mm
239 28% 1482 354 301 26%
> 750 mm 225 26% 709 159 636 12%
TOTAL 854 100% 1694 1 345 445 100%

B.FLT.0368 Final Report – Feasibility of using feedlot manure for biogas production
Page 16 of 117
Figure 1 – Location of Australian feedlots vs. annual rainfall
Figure 1 illustrates the current feedlot distribution relative to mean annual rainfall (Watts et al 2013a). Overall, 26% of individual feedlots are in areas that have greater than 750 mm of annual rainfall. While this is a significant number of individual feedlots, it only represents 12% of Australia’s current total pen capacity. The distribution of rainfall throughout the year has a significant bearing on the management of a feedlot (Tucker et al. 1991). Feedlots located in areas with high winter rainfall and low evaporation rates have problems with odour management, as a wet pad is the main cause of odour generation (Tucker et al. 1991). This clearly has a bearing on the viability of anaerobic digestion because water is needed to convert feedlot manure into liquid feedstock. Table 2 and Figure 2 details a summary of Australia’s current feedlots in relation to seasonal rainfall (Watts et al 2013a). Currently, 72% of individual feedlots are located in summer dominant rainfall areas. This accounts for 60% of current pen capacity. This also has a bearing on the viability of anaerobic digestion because warm weather is favourable for manure decomposition.

B.FLT.0368 Final Report – Feasibility of using feedlot manure for biogas production
Page 17 of 117
Table 2 – Current distribution of feedlots in seasonal rainfall regions
Climatic Zone No. of Feedlots % of
Feedlots
Average
Capacity
Pen Capacity % Pen Capacity
Winter Dominant 56 6.6% 1347 75 404 6%
Winter 136 15.9% 2108 286 718 21%
Total Winter 192 22.5% 1727 362 122 27%
Summer Dominant 34 4.0% 1955 66 472 5%
Summer 580 67.9% 1269 735 932 55%
Total Summer 614 72% 1612 802 404 60%
Arid 1 0.1% 400 400 <1%
Uniform 47 5.5% 3840 180 499 13%
TOTAL 854 100% 1895 1 345 425 100%
Figure 2 – Location of Australian feedlots vs. seasonal rainfall zones
2.2 Feedlot manure management systems
2.2.1 Manure management overview
Cattle excrete fresh manure (urine plus faeces) onto the pen surface (known as the feedpad) where it immediately begins to breakdown. Ammonia and other volatile components such as Volatile Fatty Acids (VFAs) are lost from the manure. After a period of time, machinery removes the dry manure from the pens (See Photograph 2 - Pen cleaning using a box scraper under dry conditions). The removed manure is typically held in a manure stockpile area where it may be composted prior to sale off-site or spreading as an organic fertiliser on agricultural land. A small percentage of manure is removed from pens by runoff

B.FLT.0368 Final Report – Feasibility of using feedlot manure for biogas production
Page 18 of 117
during heavy rainfall events. Dry matter (mainly carbohydrates) is lost from manure to the atmosphere as CO2 and CH4 in all phases of manure handling and storage. Manure management is site-specific, since it depends on feedlot design, management, labour, climate and seasonality. In Australian feedlots, the components of manure management are:
Pen cleaning and manure harvesting
Manure stockpiling and/or composting
Manure utilisation as fertiliser. Potentially, manure is a valuable organic fertiliser but the monetary value depends on local circumstances. It is also the source of most odour emitted from a feedlot. Hence, there has been considerable research undertaken over the years into the characteristics of feedlot pen manure.
2.2.2 Pen cleaning systems
As cattle occupy feedlot pens, excreted manure accumulates on the pen surface. It is now well understood that excessive accumulation of manure has an adverse effect on animal performance, animal welfare and environmental impact. Hence, pens should be cleaned of manure at a frequency that prevents adverse effects. Pens are typically cleaned using box scrapers, front-end loaders or excavators. In some instances, scrapped manure is immediately removed from the pens. In other instances, manure is mounded into a pile in the centre of the pen. The mound is then removed at a later date. Further breakdown of the manure occurs in the mounds so feedlots that mound generally remove a reduced tonnage of manure from the pens. The frequency at which pens are cleaned (pen cleaning frequency) depends on a range of factors including:
pen stocking density (head per m2)
occupancy (% of time that pen is occupied by cattle)
feed processing method (feed processing improves feed conversion reducing manure excretion)
animal live weight and daily feed intake
pen manure moisture content. Taking all of the above factors into account, pen cleaning frequency can range from every three weeks to every six months. A short-term issue that affects pen cleaning frequency is the moisture content of the pen surface. If the pen surface is too dry, pen cleaning causes significant dust. It is difficult to form stable manure mounds (See Photograph 2). Under wet pen conditions (such as are experienced in southern feedlots in the winter), it is difficult to remove the manure as it becomes close to a slurry (See Photograph 3). Most lot feeders agree that the optimum moisture content at which to clean pens is about 35% (which is too wet for all thermal energy options of biogas generation). On top of the original pen surface, it is typical for what is called the interface layer to form. This is a layer of hard-compacted manure immediately on top of the base gravel or clay (see Photograph 4 - compacted manure interface layer over compacted gravel). Some lot feeders ensure that pen cleaning does not remove this interface layer. This ensures that a soft pen surface is left for the cattle and that excess clay or gravel is not removed from the pens. Photograph 5 below, is an example of a pen surface where about 25 mm of loose dry manure has been removed, but the hard, compacted interface layer is retained. In this case, the removed manure is not contaminated with clay or gravel. In some cases, during pen cleaning the interface layer is completely removed leaving a compacted clay base (See Photograph 6). In

B.FLT.0368 Final Report – Feasibility of using feedlot manure for biogas production
Page 19 of 117
this instance, it is inevitable that some clay contaminates the manure, thus reducing its quality as a fertiliser or an energy source. The differences in pen manure quality resulting from different manure management practices will be documented in later sections of this report.
Photograph 2 - Pen cleaning using a box scraper under dry conditions
Photograph 3 - Pen cleaning using a box scraper under wet conditions

B.FLT.0368 Final Report – Feasibility of using feedlot manure for biogas production
Page 20 of 117
Photograph 4 - compacted manure interface layer over compacted gravel
Photograph 5 - Pen cleaning while retaining a compacted manure interface layer

B.FLT.0368 Final Report – Feasibility of using feedlot manure for biogas production
Page 21 of 117
Photograph 6 - Pen cleaning with a front-end loader where the interface is removed exposing the clay base
2.2.3 Quantity of harvested feedlot pen manure
An economic analysis of the energy recovery options for manure requires an estimate of the quantity of manure produced at a feedlot. While there are many studies that report the characteristics (quality) of feedlot pen manure (from a fertiliser perspective), surprisingly few studies have quantified the manure removed from feedlot pens. As the following section shows, when assessing “manure” production, it is important to understand the proportion that is manure and the proportion that is soil, clay or gravel. Kissinger et al. (2006b) and several others measured manure removal from a number of feedlot pens. Kissinger et al. (2007) reviewed available literature on the characteristics and quantity of manure removed from feedlot pens in the USA. Further details from these two reports can be found in the BEEFBAL model upgrade report (Davis et al. 2012). However, when using this data in Australia, care should be taken in interpreting the results as there are significant variations in:
Feedlot pen characteristics
Manure management methods
Manure sampling and handling protocols
Manure testing methods
Climatic conditions Sweeten et al. (1985) analysed manure harvested from several different feedlots in the USA in 1979 and 1980. Samples were analysed for ash content, moisture content, total-N, sulphur and heat of combustion. Average manure depth is stated to be 115 mm above the original soil layer. For the surface layer, VS is 72.5% but this decreases to only 26.5% in the interface layer. This means that the manure in the interface layer is either well degraded or it is mixed with soil. This would be common at feedlots in the USA at that time when limited feedlot pad preparation was undertaken and soil was often harvested with the manure. Photograph 7 below, documents a US feedlot where virtually no earthworks are undertaken and the pens are simply located on bare uncompacted soil. In this situation, it is common to harvest considerable soil volumes with manure during pen cleaning. Sometimes, earth mounds are constructed in the middle of feedlot pens to provide a dry refuge for cattle during wet conditions (See Photograph 8).

B.FLT.0368 Final Report – Feasibility of using feedlot manure for biogas production
Page 22 of 117
This data highlights the need to be fully aware of the circumstances behind pen manure samples. Low VS contents can either be due to prolonged manure breakdown or due to mixing of manure with soil. For example, Miller (2001) undertook a study looking at the compounds in “feedlot soil” that might contribute to odour emissions (in US studies, “feedlot soil” refers to the combination of soil and manure harvested from pens.). The organic matter (assumed to be VS) of their manure sample taken from the feedlot pens was 32.4% (DM basis) with a total-N of 1.82%. This low VS content clearly indicates that this sample is a combination of manure and soil. Kissinger et al. (2007) reports the results of manure harvesting data from six Nebraska feedlots. The average TS and VS removal were 5.3 and 1.5 kg/head/day respectively. This implies a VS content of the removed material to be 28%, on average, indicating a large proportion of soil in the harvested manure. However, they did report a large range for VS/TS ratio from 19% to 55%. They reported that different management practices resulted in different proportions of soil removed during pen cleaning. Kissinger et al, (2006a) reported manure removal from 4.7 kg DM/head/day to 8.8 kg DM/head/day (1.7 to 3.2 t DM/head/yr) depending on climatic and pen harvesting conditions. The VS content of the harvested manure ranges from 10% to 55% depending on the amount of VS breakdown and the soil content of the manure. None of these studies provided any data on the amount of soil or gravel that is replaced into pens to restore the level of the original pen surface. In Australia, for many years, the “standard” amount of manure removed from feedlot pens was assumed to be 1 t DM/head/yr (2.74 kg DM/head/day). In recent years, some lot feeders have indicated that their manure harvesting records indicate the real number could be half of this (0.5 t DM/head/yr or 1.37 kg DM/head/day). It is reasonable to suggest that improved diet formulation and feed processing methods have improved diet digestibility so that less manure is excreted per head.
Photograph 7 - A US feedlot with pen surface of uncompacted soil

B.FLT.0368 Final Report – Feasibility of using feedlot manure for biogas production
Page 23 of 117
Photograph 8 - Feedlot pen with manure mound
Six feedlots across Australia, which are representative of climatic zones, feeding regimes and manure management processes, were selected as study sites by Davis et al. (2012). A methodology to measure manure accumulation rates was developed based on a grid-sampling pattern to provide a feedlot ‘manure budget’. The results showed that manure depth was quite variable across the pen due to deposition rates and moisture content at the time of measurement. Under dry conditions (i.e. Feedlot D in Figure 3), on average across the pen, about 20 mm of manure had accumulated after about 25 days. Manure accumulated gradually to about 30 mm after 75 days. With continued dry conditions, the manure pack gradually increases to around 35 mm after a further 50 days. These data indicate that the feedpad compacts very tightly under dry conditions. Further, it is likely that some manure is removed from the pen as dust under these conditions but this loss was not able to be quantified in this study. Conversely, under wet conditions (i.e. Feedlot F in Figure 3), on average across the pen, a manure depth of 30 mm was measured after about 25 days. After 75 days, a manure depth of 50 mm on average was measured. When the compact manure pack is moistened due to rainfall, it can expand the dry compacted depth two-fold or more. The wetter the pen surface, the greater the variation across the pen. Greater depth measurements indicate areas of higher manure deposition and pugging of the manure due to cattle concentration. Davis et al. (2012) regularly measured the VS content of the manure on the pen surface. Pen manure samples were obtained directly after pen cleaning, prior to harvest and in between. Over time, the VS in the manure breaks down and is released to the atmosphere as CH4 or CO2. The loss of VS from the pen surface was calculated. Davis et al. (2012) concluded from the pen manure decomposition that:
After 20 days, a reduction of between 60 and 70% in VS in the pad manure compared to fresh manure was measured. Fresh faeces typically have about 80% VS. The greatest rate of VS decomposition occurs in the first 10-20 days (Figure 4).
After 35 days, a reduction of 70% in VS in the pad manure compared to fresh manure was measured.
After 80-100 days, a reduction of 75% in VS in the pad manure compared to fresh manure was measured.

B.FLT.0368 Final Report – Feasibility of using feedlot manure for biogas production
Page 24 of 117
Figure 3 – Manure depth vs. days since cleaning (all pens, Davis et al. (2012))
Figure 4 – Volatile solids remaining over time (Feedlot D, Davis et al. (2012))
In addition to manure depth, Davis et al. (2012) compared the estimated TS and VS from four feedlots with that predicted by BEEFBAL (Figure 5). BEEFBAL is a spreadsheet model specifically designed to estimate the quantity and composition of manure produced by cattle feedlots. Estimated data was comparable to predicted data at only one feedlot, where manure excretion ranged between 800 and 1200 kg DM/SCU/year. Dry conditions and maintenance of a manure interface layer ensured that the
0
10
20
30
40
50
60
70
80
90
100
0 25 50 75 100 125 150 175 200 225 250
Man
ure
Dep
th (
mm
)
Days of Manure Accumulation
Feedlot A Feedlot B Feedlot D Feedlot E Feedlot F
0
10
20
30
40
50
60
70
80
90
100
0 10 20 30 40 50 60 70 80 90
Vo
lati
le S
olid
s R
em
ain
ing
(F
res
h to
Ha
rve
st)
Period since pen cleaning (Days)
Pen A - Batch 1 Pen A - Batch 2 Pen A - Batch 3 Pen B - Batch 1
Pen B - Batch 2 Pen B - Batch 3 Pen C - Batch 1 Pen A - Batch 1 Harvested
Pen A - Batch 2 Harvested Pen A - Batch 3 Harvested Pen B - Batch 1 Harvested Pen B - Batch 2 Harvested
Pen B - Batch 3 Harvested Pen C - Batch 1 Harvested

B.FLT.0368 Final Report – Feasibility of using feedlot manure for biogas production
Page 25 of 117
material harvested was manure only, thus resulting in comparable data. At this site, the data suggests that little soil was harvested, which is consistent with an understanding of the management at that feedlot
Figure 5 - Comparison of measured versus predicted manure (TS) removed from pens at different moisture contents
At feedlots which cleaned their pens back to the gravel base, the measured TS was up to five times higher than the predicted value using dry matter digestibility approximation of manure production (DMDAMP) in BEEFBAL. In addition, the VS:TS ratio of the excreted manure was about half that of fresh manure. Data from these feedlots suggest that the material harvested contains material other than manure. This additional material (e.g. rocks and/or soil) influences the results by increasing quantity of material harvested and lowering the organic content. This is consistent with US feedlots where “feedlot soil” is harvested. The data of Davis et al. (2012) suggests that, when only manure is removed from pens, the annual manure harvested is about 1 t DM/head/yr or less as previously quoted. However, as with US experience, if soil is removed with the manure, the annual harvested tonnage is much higher. Fresh faeces mix with the manure on the pen surface and start to degrade. After only 10 to 20 days, 60% to 70% of the VS in the fresh faeces have been lost, and only 10 mm to 15 mm of manure would have accumulated on the pen surface. Pen moisture content is highly variable (10%-90%) depending on local weather conditions.
2.3 Feedlot manure characteristics
2.3.1 Manure moisture, ash, thermal energy and nutrient characteristics
The economic value of feedlot manure for anaerobic digestion is largely determined by the composition (quality) of the manure. Pen cleaning timing, frequency and method affects the quality of the manure removed. Davis et al. (2012) undertook a study of manure accumulation rates in feedlot pens. Watts et al. (2013) undertook a study into the use of manure as a thermal fuel. In both studies, a large number of
0
1000
2000
3000
4000
5000
6000
0.0 10.0 20.0 30.0 40.0 50.0 60.0 70.0 80.0 90.0 100.0
Tota
l So
lids,
kg
/SC
U/y
r
Moisture Content, %
Measured TS BEEF-BAL Predicted TS

B.FLT.0368 Final Report – Feasibility of using feedlot manure for biogas production
Page 26 of 117
feedlot manure samples were collected and analysed. The manure samples were divided into three groups: 1. fresh faeces; 2. pen manure; and 3. stockpiled / composted manure. The fresh faeces samples are fairly closely grouped. All have a moisture content of 75% or more. Most fresh faeces samples have an ash content of 10% - 25% (VS content of 75% - 90%) which is consistent with the data presented below in Figure 6. These samples are too wet to be a thermal fuel but if they could be dried in a cost effective manner without any loss of volatile content, they would be a suitable thermal fuel. The range in values for both the pen and stockpiled / composted samples is large. On average, the ash content of the stockpiled / composted samples is higher than pen manure samples. This is expected. If the interface layer is removed during pen cleaning (Photograph 6 - Pen cleaning with a front-end loader where the interface is removed exposing the clay base), clay and gravel can be mixed with the manure. This downgrades the manure and increases the ash content. Similarly, as the organic matter in the manure decomposes the relative ash content increases. Very few stockpiled / compost manure samples lie under the Higher Heating Value (HHV) target curve of 8.1 MJ/kg. HHV is the amount of heat (energy) produced by the complete combustion of a fuel. Hence, they are unsuitable as a thermal energy fuel. While there is a large range in the analyses of the pen manure samples, it is clear that a significant number of the samples lie under the HHV target curve of 8.1 MJ/kg. Watts, et al. (2013) showed that the ash content of pen manure is highly variable and there are significant differences between feedlots. Ash content can be similar to fresh faeces or similar to highly degraded manure. At each feedlot assessed by Watts, et al. (2013), there was a large range in pen manure characteristics due to management and climate. Hence, it is difficult, but not impossible, to have pen manure that consistently lies under the HHV target curve for thermal combustion of 8.1 MJ/kg.
Figure 6 – Relationship between ash content and moisture content for various feedlot manure samples
0
10
20
30
40
50
60
70
80
90
0 10 20 30 40 50 60 70 80
Mo
istu
re C
on
ten
t (%
wb
)
Ash (%db)
HHV Target = 8.1 MJ/kg Pen Manure Fresh Faeces Stockpiled/Compost

B.FLT.0368 Final Report – Feasibility of using feedlot manure for biogas production
Page 27 of 117
Figure 7 – Relationship between ash content and moisture content for pen surface manure
Similarly, the nutrient content of feedlot manure is highly variable. For each parameter, there is a wide range of results. Given the wide range of manure quality measured across many feedlots, it is concluded that energy recovery plans must be based on site-specific manure analyses rather than generic data such as in these tables. Gopalan (2013) has analysed manure samples from three different stages of decomposition (fresh, pad, and stockpiled) from three independent feedlots in South East Queensland. This study found that there was considerable loss of both moisture and organic solids as the manure aged, evidenced by an increasing total solids concentration and a decreasing VS fraction. The settling characteristics of feedlot manure is a key factor in the development of manure effluent strategies, particularly in the design of sedimentation basins (Lott et al. 1994). While particle size is important in determining the settling velocity of manure, many other factors including particle density, shape and roughness are key to determining the effective settleabilty of feedlot manure (Graf 1971). A study undertaken by Lott et al. (1994) found large remnants of undigested grains and roughage, along with large aggregates in the manure. These aggregates were thought to be comprised of an inner seed husk and wrapped in matted cotton fibre; a process that must have occurred during the digestion of feed. Analysis on the settling rates of feedlot manure found that 35 to 75% of solids could be removed quickly with a settling velocity of >0.003m/s. Assuming a depth of 1.8m this results in a removal time of 10 minutes (Lott et al. 1994). After the initial rapid settling, it was found that a large component (25 to 55%) of the solids could remain in suspension for extended periods of time and efforts to remove this in the sedimentation stage are ineffective. Similarly, Payne (1984) found that 70% solids of pig slurry settled within the first 10 minutes. Pepple et al. (2010) undertook a similar study evaluating the physical and chemical composition of feedlot manure. While comparing the particle density of manure runoff from concrete floored and earthen pens found the densities to be 1.47± 0.18 g/cm3 and 1.89±0.11g/cm3, respectively. Interestingly after testing the runoff influent entering and effluent exiting the sedimentation basin there was a 53.5%
0
10
20
30
40
50
60
70
80
90
0 10 20 30 40 50 60 70 80
Mo
istu
re C
on
ten
t (%
wb
)
Ash (%db)
HHV Target = 8.1 MJ/kg Feedlot 1 Feedlot 1 Avg Feedlot 2 Feedlot 2 Avg
Feedlot 3 Feedlot 3 Avg Feedlot 4 Feedlot 4 Avg Feedlot 5
Feedlot 5 Avg Feedlot 6 Feedlot 6 Avg

B.FLT.0368 Final Report – Feasibility of using feedlot manure for biogas production
Page 28 of 117
reduction in TS concentration, but there was no significant change in the VS/TS ratio. This changed from 51.1% and 50.5% at the entry and exit of the sedimentation basin respectively. One issue surrounding the digestion of feedlot manure is the apparent build-up of ash and in particular sand (silica) in the bottom of the digester. This is an obvious concern in earth lined pens, but also seems to be a problem on concrete floored pens, as a ‘sand’ substance was witnessed accumulating at the bottom of a digester tank (Watts pers comms 2014).
2.3.2 Biomethane potential
Biomethane potential (BMP) reflects the anaerobic biodegradability of feedstock, a determining factor of anaerobic digestion (AD). Biomethane potential is commonly quantified by relating the amount of methane produced with the amount of volatile solids (VS) in the substrate, e.g. per unit of VS destroyed or VS loaded (Moller et al. 2004). However, methane productivity does not only depend on total amount of VS. For example, stockpiled feedlot manure typically has 50% VS content while having very low BMP (Gopalan et al. 2013). This raises the question about what constitutes the total VS, i.e. chemical composition of the substrate, and the BMP of different components. A better understanding of the composition of feedlot manure during different stages (e.g. fresh, stockpile) should help explain the overall BMP of feedlot manure. Buswell’s formula (Symons and Buswell 1933) can be used to calculate the theoretical methane potential (Bu, L CH4 / kg VS) of organic materials:
𝑪𝒏𝑯𝒂𝑶𝒃 + (𝒏− 𝒂
𝟒− 𝒃
𝟐)𝑯𝟐𝑶 → (
𝒏
𝟐+ 𝒂
𝟖− 𝒃
𝟒)𝑪𝑯𝟒+ (
𝒏
𝟐− 𝒂
𝟖+ 𝒃
𝟒)𝑪𝑶𝟐 Equation 1
𝑩𝒖 =(𝒏
𝟐+𝒂
𝟖−𝒃
𝟒)×𝟐𝟐.𝟒
𝟏𝟐×𝒏+𝒂+𝟏𝟔×𝒃 Equation 2
Buswell’s formula assumes a complete redox reaction and that the only products of AD are water, methane, and carbon dioxide. Theoretical BMP of common substrates can therefore be calculated. For example, the Bu of volatile fatty acids (VFA), carbohydrates, protein and lipids is 370, 415, 496 and 1014 L CH4 / kg VS, respectively (Moller et al. 2004). Due to the time consuming nature of BMP testing and the relatively simple quantification of chemical composition of manure, there have been some attempts to determine the relationship between BMP of the substrate and chemical constituents. Triolo et al. (2011) found that the lignin content was the strongest predictor for the methane production of pig and cattle manure, whereas Gunaseelan (2007) and Thomsen et al. (2014) found that a combination of four to five chemical constituents can predict the BMP of plant biomass.
2.3.3 Physical contaminants in feedlot manure
Between excretion from cattle and removal from pens, feedlot manure can become contaminated with various physical contaminates. It is clear that the design of biogas units at cattle feedlots has underestimated the degree of physical contamination of the manure (see Section 2.2 Feedlot manure management systems). The physical contaminants include the following. Soil Soil can be added to pen manure during pen cleaning (See Photograph 9). This simply adds non-organic matter to the pen manure, thus reducing its value as an energy source. Photograph 10 below, documents correct pen cleaning technique, where a thin surface layer of fresh manure is scraped from the pen surface leaving the compacted interface layer of manure on the soil surface. Photograph 4 above, documents a manure interface layer being peeled off a compacted gravel base that contains rocks and

B.FLT.0368 Final Report – Feasibility of using feedlot manure for biogas production
Page 29 of 117
gravel that could potentially contaminate pen manure. The VS content of thinly scraped pen manure can be as high as 75% compared to a VS content of as low as 50% for pen manure containing soil. Rocks and gravel Repairs are often made to the surface of feedlot pens by adding rocks or gravel, particularly to high wear areas behind feed bunks and around water troughs (See Photographs 11 & 12). When pens are cleaned, this material can be mixed in with the manure. If pen manure is screened before its final disposal, the rocks can be removed. Photograph 13 below, documents an example of the volume of rocks and gravel that can be screened from manure. Clearly, these types of rocks could cause damage to biogas systems. Plastic items Various plastic items, such as ear tags, can contaminate pen manure. Baling twine is of particular concern. This material does not degrade and experience from the USA (see Section 4.7.7 Summary of feedlot biogas in the USA) suggests that bailing twine can wrap around mixing propellers causing them to jam. Photograph 14 below, documents the intake bin for a manure screening plant. There is considerable plastic baling twine caught in the intake screen. Hair At the end of winter, cattle shed their winter coats (hair). The hair cannot be easily seen in the pen manure but considerable quantities are present. Hair does not break down easily during the biogas anaerobic process. Photograph 15 below, documents an example of hair, captured in a manure dag, on a pen surface. Feedback from the few feedlot biogas plants in the USA suggested that "hair balls" often form inside the anaerobic digester and these are difficult to remove. Sundry contaminants Inevitably, despite attempts to keep pen manure clean, sundry physical contaminants such as lumps of concrete, bones, pieces of steel and other contaminants end up in cleaned pen manure. (See Photograph 16)
Photograph 9 - Pen cleaning where soil is removed with manure

B.FLT.0368 Final Report – Feasibility of using feedlot manure for biogas production
Page 30 of 117
Photograph 10 - Pen cleaning where only manure is removed
Photograph 11 - Example of large rocks being used to repair a high-traffic area in a feedlot pen

B.FLT.0368 Final Report – Feasibility of using feedlot manure for biogas production
Page 31 of 117
Photograph 12 - Placement of gravel to repair a pen surface
Photograph 13 - Stockpile of rocks screened from pen manure

B.FLT.0368 Final Report – Feasibility of using feedlot manure for biogas production
Page 32 of 117
Photograph 14 - Intake bin to manure screening plant showing baling twine
Photograph 15 - Example of hair in a manure dag in pen manure

B.FLT.0368 Final Report – Feasibility of using feedlot manure for biogas production
Page 33 of 117
Photograph 16 - Example of contaminant - wire cable in removed manure
2.4 Feedlot runoff control
2.4.1 Controlled drainage system
A key feature of a feedlot’s runoff control system is the formation of a controlled drainage area (Figure 8). It is typically established using:
a series of catch drains to capture runoff from the feedlot pens and all other surfaces within the feedlot
complex and to convey it to a collection system, and
a series of diversion banks or drains placed immediately upslope of the feedlot complex, which are
designed to divert ‘clean’ or uncontaminated upslope runoff (sometimes termed ‘run-on’) around the
feedlot complex. Where feedlots are built close to the crest of a hill or ridge, there will be minimal runoff
from upslope. In these cases, it is possible to have a controlled drainage area without any upslope
diversion banks or drains.

B.FLT.0368 Final Report – Feasibility of using feedlot manure for biogas production
Page 34 of 117
Figure 8 - Controlled drainage area for a feedlot
2.4.2 Sediment removal systems and holding ponds
Sediment removal systems are constructed to trap and detain runoff, allowing entrained sediment to ‘settle out’ before the runoff enters the feedlot holding pond. Their function is to reduce siltation of the holding pond. Holding ponds are designed to capture and store the runoff from the controlled drainage area. The application of holding pond wastewater to land, where it is sustainably utilised by crops and soil, is generally the preferred form of wastewater management.
2.4.3 Feedlot effluent quality
Feedlot runoff can contain high levels of nutrients. It might be expected that as the nitrogen content of effluent increases so would other major nutrients such as P and K. However, Watts, et al. (2013) showed that there is no relationship between Total N and Total P content of feedlot effluent, probably due to variable atmospheric losses of nitrogen from holding ponds and phosphorus settling in pond sediment. Given the wide range of effluent quality measured across many feedlots, it is concluded that effluent management plans must be based on site-specific effluent analyses rather than generic data.
2.4.4 Biogas from feedlot effluent
Unlike other intensive livestock systems such as piggeries, feedlot holding ponds and the effluent that is captured are poor candidates for biogas production. The reasons are:
1. As much of the manure as possible is removed from the effluent prior to storage in the holding pond by the use of sediment removal system. The vast majority of the organic matter produced in feedlot manure is retained on the feedlot pens and is not transferred to the holding pond. For example, Bierman et al. (1999) found that only 2-4% of organic matter excreted on the feedlot pen surface in their experiment was removed in runoff.

B.FLT.0368 Final Report – Feasibility of using feedlot manure for biogas production
Page 35 of 117
2. The inflow of effluent is highly variable as it is driven mainly by rainfall. Extended periods can occur where there is no fresh effluent inflow.
3. Feedlot holding ponds are usually configured to maximise evaporation loss. Hence, they are shallow with a large surface area. This makes them unsuitable to retrofit to become a covered anaerobic pond.
2.5 Energy consumption at cattle feedlots
Davis et al. (2009) undertook a study of energy usage at Australian feedlots. Eight feedlots were selected such that the feedlots represent a cross section of geographical, climatic and feeding regime diversity within the Australian feedlot industry. A number of energy sources are used in a feedlot. Electricity is principally used for grain movement, feed processing, and administration, to pump water from bores and to wash cattle. Gas (Natural, LPG - Propane, LPG - Butane) is the predominant energy source for boiler equipment used in heat/steam generation. Diesel predominantly and to a lesser extent petrol is used in mobile plant and equipment. Energy usage is largely driven by the feed management and the processing system employed by the feedlot. Among them, feed management is the largest single consumer of energy in the feedlot. The average monthly total energy usage across all feedlots for March 2007 to February 2009 ranged from 49 MJ/head-on-feed/month to 160 MJ/head-on-feed/month. Feedlots with steam flaking feed processing systems had an average usage in the order of 120 MJ/head-on-feed/month, compared with an average of about 45 MJ/head-on-feed for feedlots that process grain by other means. It appears that energy usage at feedlots with steam flaking tends to be higher in winter and lower in summer, although this is not clear for feedlots without steam flaking. Considering that biogas production in winter, as influenced by ambient temperature and production, can be lower than in summer, the mismatch between energy consumption and production needs to be considered for biogas production in feedlots.
feedlots -no steam flaking feedlots - steam flaking
Figure 9 – Average monthly total energy usage at eight feedlots (MJ/head-on-feed/month) during March 2007 to February 2008
0.0
20.0
40.0
60.0
80.0
100.0
120.0
140.0
Mar Apr May Jun Jul Aug Sep Oct Nov Dec Jan Feb
Ene
rgy
use
of
fee
dlo
ts
(MJ/
he
ad-o
n-f
ead

B.FLT.0368 Final Report – Feasibility of using feedlot manure for biogas production
Page 36 of 117
For steam flaking systems, the average monthly gas energy usage measured in 2007-2008 ranged from 240 to 380 MJ/t grain processed. Slightly higher levels were measured in 2008-2009 (260-430 MJ/t grain processed). There were three types of gases used within the four feedlots with steam flaking systems. These were LPG, butane and natural gas. All of these gas sources have different calorific values (heating content) and pricing structures and therefore impact on energy consumption. Some of the variation in gas usage can be attributed to heating efficiency during winter months. However, mill management also impacts on energy consumption.
2.6 Anaerobic digestion operating parameters
2.6.1 The anaerobic digestion process
Anaerobic digestion is a biological mechanism that converts organic material into methane and carbon dioxide in the absence of oxygen. The energy in the material being digested is retained in the produced gas as methane. Anaerobic digestion is a natural process that takes place in the absence of oxygen. The digestion process occurs in several steps. Figure 10 shows an overview of the process (Pavlostathis & Giraldo-Gomez 1991).
Figure 10 – Anaerobic digestion process
Source: Pavlostathis & Giraldo-Gomez (1991)
Can be rate-limiting
Particulate Carbohydrates,
Proteins and Lipids
Hydrolysis by
Extracellular Enzymes
Sugars, and Amino Acids
Alcohols, and
Organic Acids
Long Chain
Fatty Acids
Fermentation by
fermentative microbes
Acetogenesis by
Obligate Hydrogen Producing Acetogens
En
zym
es
Acetic AcidHydrogen
Methanogenesis by
Hydrogenotrophs
Methanogenesis by
Aceticlastic Microbes
Methane Methane
CO2
CO2
CO2
CO2

B.FLT.0368 Final Report – Feasibility of using feedlot manure for biogas production
Page 37 of 117
The key steps involved in anaerobic digestion include (Monnet 2003, Pavlostathis & Giraldo-Gomez 1991):
a. Hydrolysis – This is a chemical process where hydroxyl groups break down complex organic molecules into sugars, amino acids and fatty acids. This step can often limit the rate of the digestion process due to the nature of the feedstock. To reduce the possibility of rate limitation, the feedstock should be reduced to small particulate size. Significant rate limitation in this step will lead to an overall poor digester performance. This would be evident with undegraded material being washed out.
b. Acidogenesis / Fermentation – This is a biological process in which sugars and amino acids a converted into volatile fatty acids, alcohols, and carbon dioxide. It is almost never rate-limiting, but will decrease pH, and may inhibit other steps.
c. Acetogenesis – Organic acids and alcohols are converted to acetic acid, and hydrogen in this biological process. It is generally only rate-limiting in very high rate processes.
d. Methanogenesis – The final stage in anaerobic digestion, methanogenesis involves the action of two groups of methanogenic bacteria. The first group (aceticlastic methanogens) splits acetate into methane and carbon dioxide, and the second group (hydrogenotrophic methanogens) combines hydrogen and carbon dioxide to produce methane.
2.6.2 Digester temperatures
Typically, most digesters are designed for either mesophilic or thermophilic conditions. Mesophilic digestion takes place optimally around 30 to 38 °C, or at ambient temperatures between 20 and 45 °C, where mesophiles are the primary microorganism present; while thermophilic digestion takes place optimally around 49 to 57 °C, or at elevated temperatures up to 70 °C, where thermophiles are the primary microorganisms present. In general, with increasing temperature, the digester performance improves, comparable digester size is reduced due to higher loading rates but the thermophilic digesters are regarded as being less stable (Batstone 2006). There appears to be an upper temperature limit of around 60°C above which there is a rapid reduction in microbial activity (Chynoweth et al. 1998). Sudden
changes in reactor temperature of (°C) can lead to the last stage of digestion (methanogenesis) to fail. Sufficient energy is normally available from the gas engine system to heat the digester to at least mesophilic temperatures without an external heat source (Batstone 2006).
2.6.3 Ammonia content
Ammonia inhibition is caused by the free form of ammonia (i.e., NH3, not the ammonium ion NH4+).
Inhibition by ammonia is strongly influenced by pH and is also temperature dependent, as demonstrated in Figure 11 (Batstone et al. 2002, Siegrist et al. 2002).

B.FLT.0368 Final Report – Feasibility of using feedlot manure for biogas production
Page 38 of 117
Figure 11 – Free ammonia levels, and ammonia inhibition
Ammonia inhibition has a strong impact on the final step of aceticlastic methanogenesis and in the short term, will cause inhibition. In the long term, it will cause a fundamental change in microbiology that causes the system to operate in a sub-standard way (Karakashev et al. 2006). Despite its negative impacts, ammonia can also have a positive impact in that its presence maintains a pH of >7, which is vitally important for anaerobic digesters. The fermentation step produces acids, which lowers the pH and the presence of ammonia helps maintain the pH at a higher level. At a pH of below approx. 6.5-7.0, methanogenesis stops (Batstone et al. 2002), fermentation continues and the system enters an acid overload from which it is very difficult to recover (caustic dosing is required). Ammonia acts as a base, and keeps the pH at a high level. Most of the ammonia-nitrogen in feedlot manure is produced from urine. Due to the nature of feedlot manure management, pen manure contains little ammonia-nitrogen. Considering the positive impact of ammonia in AD, however, the buffer capacity of feedlot manure may be smaller than other manure (e.g. pig manure) that contains higher amount of ammonia-nitrogen.
2.6.4 pH and VFAs
Eghball et al. (1997) found that pH of feedlot manure collected from unpaved pen varied from 7.4 to 8.9. The amount of VFAs and ammonia that are volatilised from manure mainly depends on manure pH and concentrations of VFA’s and ammonium nitrogen. As the pH is reduced, the proportion of VFA’s in the volatile form increases. At higher pH levels, the ammonium nitrogen equilibrium moves towards ammonia, which is more readily volatilised. In general, the optimum pH for anaerobic digestion is 6.5-7.5. The conversion rate of organic compounds to VFAs is faster than the conversion rate of VFAs to methane. At concentrations above 1,000 mg/L VFAs can be toxic to methanogenic bacteria. Significant toxic problems are unlikely to occur if the digestion process is operated in the pH range 6.5-7.5 with VFA concentrations below 1,000 mg/L (Svoboda 2003).
2.6.5 Antibiotics and feed additives
A wide range of antibiotic agents are registered for therapeutic use on cattle in Australia. Some of the most important antibiotic agents include benzathine penicillin, procaine penicillin, ampicillin, amoxycillin,
Free Ammonia at Total NH3/NH4+ of 2000 mg.L
-1
0
0.005
0.01
0.015
0.02
0.025
0.03
0.035
0.04
6.5 7 7.5 8 8.5 9
pH
Fre
e A
mm
on
ia (
M)
20C37C55C
Inhibition significant
Inhibition starts
Inhibition strong

B.FLT.0368 Final Report – Feasibility of using feedlot manure for biogas production
Page 39 of 117
cloxacillin, cefuroxime, cephalonium dihydrate, cefuroxime, ceftiofur, erythromycin, oxytetracycline, sulfadiazine, sulfadimidine, sulfadoxine, dihydrostreptomycin, novobiocin, trimethoprim, florfenicol, neomycin, tylosin and flunixin (Khan et al. 2008). In addition, there are more than 30 antibiotic products registered for ‘enteric’ uses in Australia, including polyether ionophores (monensin, lasalocid, narasin, salinomycin), macrolide (tylosin), oxytetracycline, and neomycin (Khan et al. 2008). Among these, monensin is the most common active ingredient of feed additives registered for enteric uses in Australia (Khan et al. 2008). Very few of the individual chemical contaminants have been thoroughly investigated in Australian feedlot manure and effluent. Enteric feed additives are likely to be significantly more prohibitive to biogas production than the agents used only intermittently to treat illness (Roser et al. 2011). For example, polyether ionophores such as salinomycin, lasalocid and monensin are used to improve feed conversion efficiency in feedlot beef cattle. However, polyether ionophores are toxic to many bacteria, protozoa, fungi and higher organisms. Not all of the antibiotics in livestock feed are metabolised during the digestion process. This incomplete digestion results in a significant percentage of the antibiotics, passing through the animal and being excreted in the parent form. For example, studies have found that approximately 40-50% of the monensin added to cattle feed was excreted (Hilpert et al. 1984; Elanco 1989), and at least 75% of monensin administered orally to steers was excreted within three days of intake (Herberg et al. 1978). Through the use of 14C (Carbon 14) radioactive marking, it has been determined that all of the excreted monensin is found in faeces and none in the urine (Herberg et al. 1978). Residual monensin levels as high as 1 to 5 mg/kg have been found in the manure of cattle provided with feed that contains the monensin additive (wet basis) (Donoho 1984; Elanco 1989). Studies have documented that monensin metabolites have a decreased biological activity (as compared to monensin) (Donoho 1984), while metabolites of other antibiotics still comprise antibiotic potency (Thiele-Bruhn 2003). Once excreted by the animals, metabolites are subjected to various biotic and abiotic degradation processes. Photodegredation and hydroxylation are the most important abiotic degradation and inactivation processes, however, the effects of these processes are thought to be limited when antibiotics fix to soil particle surfaces or get “sheltered” from pores within the soil matrix. The increased opportunity for biotic degradation, through microbial biotransformation in soil and manure is considered a more important degradation path (Thiele-Bruhn 2003). For this reason, monensin has been found to degrade faster in soil and manure. Research has illustrated the effectiveness of biotic degradation by comparing the half-life of monensin under different conditions. Under photolysis degradation the half-life of monensin was found to be 43.9 days (Elanco 2010), 13.5 days in soil (controlled laboratory), 3.8 days in the field without manure, and 3.3 days in the field with manure (Carlson and Mabury 2006). In another study, the half-lives of monensin and lasalocid in soils were found to be less than 4 days, while fresh liquid manure amendments did not significantly alter degradation (Sassman and Lee 2007). From the time of manure excretion, to final land application, various physical processes including leaching, runoff, and direct handling by staff provide opportunities for the antibiotics to be lost into the surrounding environment. Manure management therefore acts as an important “buffer” process to reduce the biological activity of antibiotics. Aerobic manure management (composting) has been found to result in similar or greater attenuation than anoxic or anaerobic management. Dolliver et al. (2008) found that stockpiling manure had a comparable effectiveness in reducing some antibiotics, when compared to manure managed by composting and vessel composting. At the end of the composting period (22–35 days), chlortetracycline reduced by 99%, monensin and tylosin reduction ranged from 54 to 76%, whereas sulfamethazine did not degrade (Dolliver et al. 2008). Kuhne et al. (2000) found that degradation of tetracycline was faster in ventilated liquid manure than in unventilated conditions.

B.FLT.0368 Final Report – Feasibility of using feedlot manure for biogas production
Page 40 of 117
Antibiotics have been found to inhibit the activity of anaerobic microbes and therefore, depending on dose rates may negatively affect biogas production (Dennis and Burke 2001). The inhibitive effects of antibiotics on anaerobic methane production vary significantly between different antibiotics. For example, the effective concentration (EC) that inhibited anaerobically digested methane production by 10% (EC10) was 130 mg/L for tylosin, but only 0.7 mg/L for imipenem (Figure 12). Data of open bars was from experiments with municipal sewage (Gartiser et al. 2007), data of filled bars was from experiments with fresh and screened cattle manure (Mitchell et al. 2013)
Figure 12 – Effective concentration of some antibiotics when 10% inhibition was found on methane production from anaerobic digestion (EC10).
Despite its wide use as a feed additive, very few studies have investigated the effect of monensin on anaerobic methane production. Gartiser et al. (2007)) found that adding monensin to municipal sewage, at a concentration between 25 and 100 mg/L reduced methane production by 77%. The study did not identify a dose response relationship however, it is important to note that different substrates have different microbial communities and thus, degradation of antibiotics varies from one substrate to another. Varel and Hashimoto (1982) found complete inhibition of methane production when manure from steers fed monensin at 29 mg per kg of feed was added to a biologically active 3L anaerobic digester. The study witnessed a six month period of microbe acclimation, before the system methane production returned to expected levels. Experience from dealing with covered anaerobic ponds at a piggery also suggest that trace amounts of monensin can kill a whole pond within a few days, leaving little chance of recovery (Jenkins S, per comm). In another study, Varel et al. (2012) found that anaerobic digestion at 38°C or 55°C may be an effective treatment to reduce chlortetracycline (CTC) in swine manure, but not monensin in cattle manure. After 28 days of anaerobic digestion, manure from cattle fed with monensin at 22 mg/kg dry feed matter and manure from swine fed CTC at 55 mg/kg dry feed matter, the concentration of CTC in the 22°C, 38°C and 55°C swine digester slurries decreased 70, 80 and 98%, whereas monensin decreased 3, 8 and 27%, respectively. Methane production was higher from the slurries in the 38°C than in the 22°C digesters, but fell to intermediate level in the 55°C slurries (Varel and Hashimoto 1982). At a commercial scale, use of monensin in a dairy farm was found to have no discernible effect on biogas production from the covered anaerobic lagoon (Martin 2008). However, without knowing the historical usage of monensin (and potentially other antibiotics) in animals and the resulting concentration in the slurry, it’s difficult to understand why inhibition was not observed.
0.7 2.1 3.1 3.1 3.3 4.9 5.5 8.212.3
2633.3
38.6
130
0
20
40
60
80
100
120
140
EC1
0, m
g/L
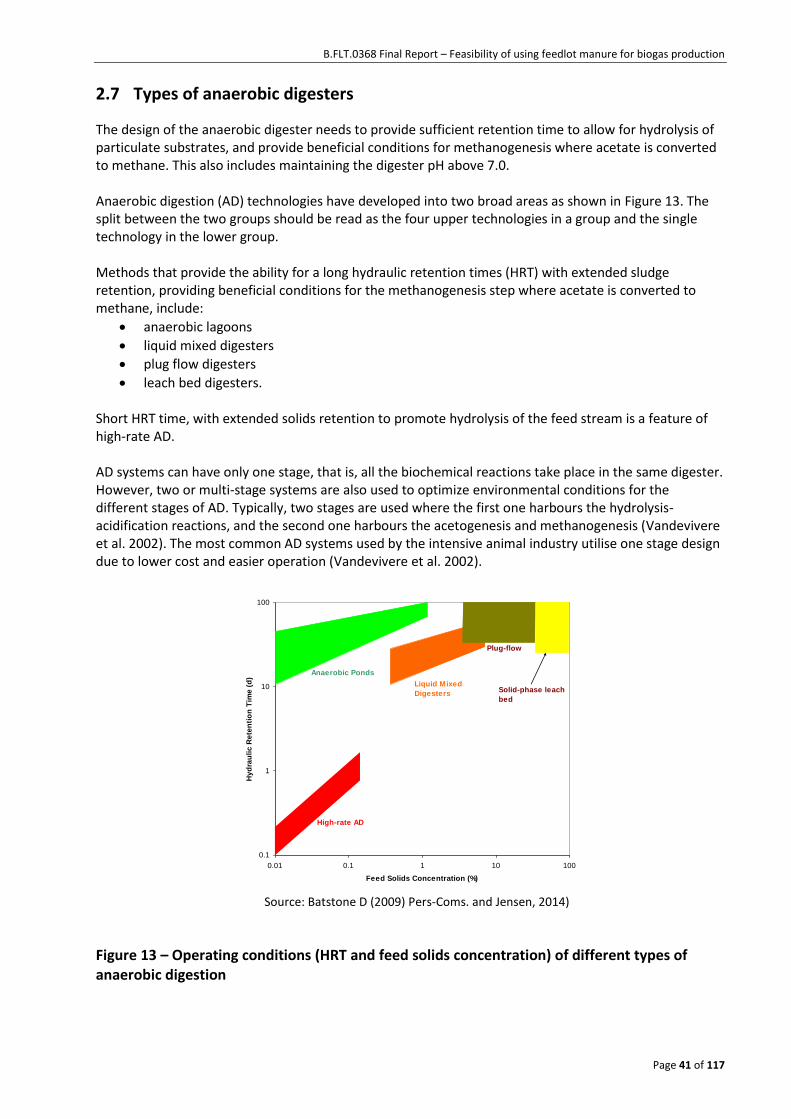
B.FLT.0368 Final Report – Feasibility of using feedlot manure for biogas production
Page 41 of 117
2.7 Types of anaerobic digesters
The design of the anaerobic digester needs to provide sufficient retention time to allow for hydrolysis of particulate substrates, and provide beneficial conditions for methanogenesis where acetate is converted to methane. This also includes maintaining the digester pH above 7.0. Anaerobic digestion (AD) technologies have developed into two broad areas as shown in Figure 13. The split between the two groups should be read as the four upper technologies in a group and the single technology in the lower group. Methods that provide the ability for a long hydraulic retention times (HRT) with extended sludge retention, providing beneficial conditions for the methanogenesis step where acetate is converted to methane, include:
anaerobic lagoons
liquid mixed digesters
plug flow digesters
leach bed digesters. Short HRT time, with extended solids retention to promote hydrolysis of the feed stream is a feature of high-rate AD. AD systems can have only one stage, that is, all the biochemical reactions take place in the same digester. However, two or multi-stage systems are also used to optimize environmental conditions for the different stages of AD. Typically, two stages are used where the first one harbours the hydrolysis-acidification reactions, and the second one harbours the acetogenesis and methanogenesis (Vandevivere et al. 2002). The most common AD systems used by the intensive animal industry utilise one stage design due to lower cost and easier operation (Vandevivere et al. 2002).
Source: Batstone D (2009) Pers-Coms. and Jensen, 2014)
Figure 13 – Operating conditions (HRT and feed solids concentration) of different types of anaerobic digestion
0.1
1
10
100
0.01 0.1 1 10 100
Feed Solids Concentration (%)
Hy
dra
uli
c R
ete
nti
on
Tim
e (
d)
High-rate AD
Anaerobic Ponds
Anaerobic Ponds
Liquid Mixed
Digesters
Plug-flow
Solid-phase leach
bed

B.FLT.0368 Final Report – Feasibility of using feedlot manure for biogas production
Page 42 of 117
2.7.1 Anaerobic Ponds
Ponds provide a long HRT and are perceived as a low capital cost option. Large ponds tie up land, can be a source of odour problems and require desludging approximately every 10 years. Desludging can be expensive and may require a pond shut down or an alternative waste handling system in operation while desludging occurs. Methane capture requires an impermeable cover and collection system (See Photograph 17). Methane capture from covered anaerobic ponds (CAPs) has generally been reported as relatively poor. However, recent work by the New Zealand National Institute of Water and Atmospheric Research (NIWA) demonstrates that biogas availability from a well-designed CAP is similar to the biogas availability from heated tank reactors (NIWA 2008). Solids loading heavily drive overall costs. The concentration of the waste stream to the pond is relatively low at around 1% for piggery effluent. Because of the large pond volumes, correction under failure can be extremely expensive or impractical.
Photograph 17 – Covered anaerobic pond for biogas production
2.7.2 Liquid mixed digester
The mixed digester operates at an inflow concentration range of 3-6% total solids. The digester is operated as a fully mixed system, with either gas recirculation, or mechanical mixers incorporated in the design. The feedstock can be continuous or batch fed with retention times of approximately 20 days. This is established technology and is used across many industries. The costs are relatively high to establish the plant and the tanks provide poor volumetric loading. The mixed digester produces a liquid digestate.
2.7.3 Liquid plug flow
Material is loaded at the front of the digester, and passes through the digester to become a product at the end. As the materials are not mixed, intimate contact between the bacteria and the biomass is poor. The liquid plug flow digester operates at semi-solid liquid (10-20% total solids) conditions in a long polyethylene tube. The plug flow digester has a very high loading rate.

B.FLT.0368 Final Report – Feasibility of using feedlot manure for biogas production
Page 43 of 117
2.7.4 Solid phase (leach bed)
This is similar to an engineered, high-rate landfill where material is loaded into a digester, tumbler, or baskets, and leachate or inoculum liquid is circulated through the solids in the digester. Very high loading rates are possible with very high feed solids concentrations of 20% or more total solids. Good gas conversion is possible due to retention of the active biomass. The digesters can be difficult to effectively seal. The digesters can operate in either batch or continuous form. The batch solid phase digester is operated until methane production stops and the digester is unloaded and reloaded. The biogas quality and quantity is variable. However, the batch plant can be relatively inexpensive. For the continuous solid phase digester, material is continually added and spent material removed. The digester produces a continuous biogas supply but is considerably more expensive than the batch process. The continuous process is only practical at a very large scale and is extremely expensive.
2.7.5 High-rate anaerobic digesters
High-rate anaerobic digesters normally operate with extended solids retention time, and short HRT by integrating solids retention within the main digester. They require a low solids feed, with relatively high amounts of soluble feed material, and are most often used for domestic sewage treatment, as well as industrial wastewaters (van Lier 2008). HRTs are normally short, typically less than 48 hours, while solids retention times can be very long. (See Photograph 18 – Anaerobic Digester – Denmark farm facility).
Photograph 18 – Anaerobic Digester – Denmark farm facility
2.8 AD process outputs
2.8.1 Biogas yield
Biogas produced anaerobically is primarily composed of methane (CH4) and carbon dioxide (CO2). The gas may also contain smaller amounts hydrogen sulphide, ammonia and trace elements of hydrogen,

B.FLT.0368 Final Report – Feasibility of using feedlot manure for biogas production
Page 44 of 117
nitrogen and carbon monoxide. The gas is usually saturated with water vapour and can also contain dust particles. Table 3 shows the typical range of biogas components. The actual content of a particular component will depend upon the feedstock mix.
Table 3 - Typical range of biogas components
Component Content rangea
Content rangeb
Methane 55 – 80% 63.2%
Carbon dioxide 15 – 45% 18.8%
Hydrogen Sulphide 0 – 5000 mg
Ammonia 0 – 450 mg/m3
Humidity Saturated
Calorific Value 20 – 25 MJ/m3
Source: a) Navickas (2007).
b) Birchall (2010). NOTE Methane content ranged from 54% to 70.4%
To determine the CH4 production from manure, it is necessary to convert VS content to CH4 generation by applying the Bo factor (maximum biomethane potential) and the Methane Conversion Factor (MCF). The methane emissions (kg CH4 /yr) can be calculated using the following equation:
𝑸𝒃 = 𝑽𝑺×𝑩𝒐 ×𝑴𝑪𝑭× 𝝆𝑪𝑯𝟒 Equation 3
Where: Q = methane production from the waste (kg/yr) VS = volatile solids production (kg) Bo = maximum methane-producing capacity MCF = methane conversion factor ρCH4 = density of methane (0.662 kg/m3) Bo factor Due to differences in digestive efficiency and feed type, Bo varies with animal type across the world. IPCC (2003) provides typical Bo values for different livestock species and locations (Table 4).
Table 4 – Maximum methane-producing capacity of the manure (Bo)
Animal Bo (m3 CH4/ kg VS)
Swine 0.45 Dairy cattle 0.24 Feedlot beef cattle 0.17
Source: (IPCC 2006) Moller et al. (2004) note that “methane productivity” from manure can be measured in terms of VS destroyed, VS loaded, volume, or animal production. Methane productivity measured in terms of VS destroyed (m3 CH4/kg VSDES) corresponds to the theoretical methane yield (Bo) if there is complete

B.FLT.0368 Final Report – Feasibility of using feedlot manure for biogas production
Page 45 of 117
degradation of all organic components of the manure. The theoretical methane potential can be calculated from Buswell’s formula. Methane productivity in terms of VS loaded (m3 CH4/kg VSload) as residence time approaches infinity is referred to as the ultimate Bo. The ultimate methane yield will always be lower than the theoretical methane yield because a fraction of the substrate is used to synthesise bacterial mass, a fraction of the organic material will be lost in the effluent, and lignin-containing compounds will only be degraded to a limited degree (Moller et al. 2004). Inhibition of the biological process by inhibitors such as ammonia and VFA is another factor contributing to the actual methane yield being lower than the potential yield which would be obtained if inhibition was not present. It has been observed that both the Bo and the volumetric methane production (L CH4/ m3 manure) of manure from different origins can be very variable. Moller et al. (2004) notes that the ultimate methane yield (m3 CH4/kg VS) is affected by various factors, including:
Incubation temperature (varies from 35°C to 55°C).
Source and amount of inocula added.
Timing and amount of mixing of the sample.
Amount of dilution of the sample.
Incubation time (50 to 157 days).
Not surprisingly, both Vedrenne et al. (2008) and Karim et al. (2002) have found that variation of any of these parameters affects maximum methane yield. Hence, apart from variations between species and feed type, Bo data will vary depending on experimental protocol and should be evaluated with knowledge of the experimental procedures adopted. For example, ICF Consulting (1999) provides Bo values for beef, dairy and swine for various diets as collated from a range of researchers (see Table 5, Table 6). This table shows the variability of the data. Angelidaki et al. (2009) pointed out that despite a mass of data having been generated; comparison of biodegradability data in the literature is very difficult. This is not only due to the variety of equipment, but also to the many different environmental conditions and protocols that are used. For example, the inoculum-nutrients mix, liquid and headspace volumes, pH, headspace pressure and the detection system can all differ from on test to another (Angelidaki et al. 2009). Recently, a guideline has been defined on components (e.g. substrates, inoculum, medium.) and also the procedure (e.g. how to report results) of the BMP test (Angelidaki et al. 2009). Biogas yield from anaerobic digestion of organic material is determined by the feedstock composition. Table 5 shows the wide range of biogas yields for different feedstocks. The quantity of VS in the wet biomass is not specified and this introduces a degree of uncertainty in the actual biogas yield from each biomass source. However, the intention of Table 5 is to show the range of biogas yields possible from different feedstocks. Table 6 also shows the Bo reported in literature. Gopalan (2013) demonstrated that, at beef feedlots, over 40% of initial methane potential from manure is lost in 2-3 weeks of drying on pads and this loss is over 70% in stockpiles (Table 8). There is significant reduction (up to 70%) in the non-degradable organic fraction of solids along with the expected reduction in the degradable fraction through the practice of stockpiling. Fresh manure degrades faster, as shown by first order coefficient (khyd) fitted using model analysis (Gopalan, 2013).

B.FLT.0368 Final Report – Feasibility of using feedlot manure for biogas production
Page 46 of 117
Table 5 - Biogas yield from different feedstocks
Biomass IEA Bioenergya (m3 biogas/ wet t
biomass)
Bioplin Technologyb (m3 biogas/ t
biomass)
Bo Maximum methane producing capacityc
(m3 CH4/kg VS)
Pig Manure 18 25 0.45 Fattening Cattle Manure 34 30 0.17 Dairy Manure 20 55 0.24 Poultry Manure 93 35 0.36-0.39 Distillery Waste 35 (Potato) 80 Vegetable Processing 35 Rape Seed Cake 612 Canteen Waste (high fat) 90 Canteen Waste (low fat) 44 Fat 108 (flotation fat) 800 (used fats) Fatty Waste 400 Vegetable Oil 350 Sewage Waste 80 Meadow Grass 98 Maize Silage 190 200 Grass Silage 183 110 Milled Grain 597 Corn Crop Mix (5.3% fibre) 391 Total Plant Grain Silage 195 Source: a) IEA Bioenergy 15
th European Biomass Conference & Exhibition; b) Navickas (2007); c) IPCC (2006), the Oceania
region

B.FLT.0368 Final Report – Feasibility of using feedlot manure for biogas production
Page 47 of 117
Table 6 – Methane yields from various types of animal waste
Type of animal waste B0 (L CH4/kg VS) References
Cattle manure (wheat straw bedding) 85 (Buendía et al., 2008)
Cattle manure 95 (Qiao et al., 2011)
Dairy cattle manure 148 (Møller et al., 2004)
Pigs-weaner 150 (Vedrenne et al., 2008)
Piggery waste-solid fraction 165-175 (Rodriguez & Lomas, 1999)
Pig manure 170 (Qiao et al., 2011)
Cattle manure 200 (Ahring et al., 2001)
Cattle manure(readily biodegradable
industrial by-products added)
200-260 (Kaparaju et al. 2008)
Pigs-grower/finisher 200-450 (Massé et al., 2000)
Cattle manure (6-8 weeks) 210 (Hashimoto et al., 1981)
Cattle manure 220 (Hill, 1984)
Cattle manure (fresh) 260 (Hashimoto et al., 1981)
Pigs-sow 270 (Møller et al., 2004)
Pig-dry sow 280 (Vedrenne et al., 2008)
Pig 320 (Hill, 1984)
Pigs-grower/finisher 320 (Vedrenne et al., 2008)
Pigs-farrowing 340 (Vedrenne et al., 2008)
Pigs-grower/finisher 350 (Møller et al., 2004)
Poultry manure 360 (Hill, 1984)
Cattle manure 420 (Karim et al., 2007)
Pigs- faeces 420-470 (Feng et al., 2008)
Pigs-grower, faeces 480 (Hashimoto et al., 1981)
Pigs-faeces and urine 580 (Feng et al., 2008)
Source: Gopalan (2013)

B.FLT.0368 Final Report – Feasibility of using feedlot manure for biogas production
Page 48 of 117
Table 7 – Maximum methane producing capacity for US livestock fresh manure
Animal Type Diet Converted Bo (L CH4/kg VS)
References cited
Beef
7% corn silage, 87.6% corn 290 (Hashimoto et al. 1981)
Corn-based high energy 330 (Hashimoto et al. 1981))
91.5% corn silage, 0% corn 170 (Hashimoto et al. 1981)
230 (Hill 1984)
330 (Chen et al. 1980)
Dairy
58-68% silage 240 (Morris 1976)
72% roughage 170 (Bryant et al. 1976)
140 (Hill 1984)
Roughage, poor quality 100 (Chen et al. 1988)
Pigs
Barley-based ration 360 (Summers & Bousfield 1980)
Corn-based high energy 480 (Hashimoto 1984)
320 (Hill 1984)
Corn-based high energy 520 (Kroeker et al. 1979)
Corn-based high energy 480 (Stevens & Schulte 1979)
Corn-based high energy 470 (Chen 1983)
Corn-based high energy 440 (Iannotti et al. 1979)
Corn-based high energy 450 (Fischer et al. 1975)

B.FLT.0368 Final Report – Feasibility of using feedlot manure for biogas production
Page 49 of 117
Figure 14 – Reported BMP (L CH4 / kg VS) in literature
(Data for feedlot stockpile, pen and fresh manure sourced Table 8 – Biochemical methane potential (B0) of manure samples collected at three Australian feedlots)
0 100 200 300 400 500 600
Feedlot fresh manure
Feedlot pen manure
Feedlot stockpile manure
Cattle manure (wheat straw bedding)
Cattle manure
Cattle manure (fresh)
Beef manure, 7% corn silage, 87.6% corn
Beef manure, corn-based high energy
Beef manure, 91.5% corn silage, 0% corn
Beef manure
Dairy cattle manure
Dairy manure, 58-68% silage
Dairy manure, 72% roughage
Dairy manure
Dairy manure, roughage, poor quality
Pigs-weaner
Pig manure
Pigs-sow
Pigs-dry sow
Pigs-grower/finisher
Pigs-farrowing
Pigs-grower, faeces
Pigs-faeces and urine
Swine manure, barley-based ration
Swine manure
Swine manure, corn-based high energy
Poultry manure

B.FLT.0368 Final Report – Feasibility of using feedlot manure for biogas production
Page 50 of 117
Table 8 – Biochemical methane potential (B0) of manure samples collected at three Australian feedlots
Manure source FA1 FB FA2 FC
Bo (L CH4/kg VS) Fresh 260±20 360±10 350±10 230±10 Pad 200±20 280±10 270±10 70±10 Stockpiled 160±30 200±20 150±10 60±10
Notes: Results presented as value ± 95%error for assays performed in replicates of three; FA, FB, FC represents different feedlots from Queensland, Australia. FA1 and FA2 are the same feedlot sampled in summer and winter to check for seasonal variability. Source: Gopalan (2013)
Methane conversion factor (MCF) The MCF reflects the portion of Bo that is achieved (IPCC 2006). The system MCF varies with the manner in which the manure is managed and the climate, and can theoretically range from 0 to 100%. Both temperature and retention time play an important role in the calculation of the MCF. Manure that is managed as a liquid under warm conditions for an extended period of time promotes methane formation. These manure management conditions can have high MCFs, of 65 to 80%.
2.8.2 Cogeneration and combined heat sand power (CHP) plant
Biogas can be used in a number of ways. Disposal through a flare stack burner is the least favourable option for energy recovery. Powering a conventional boiler to generate steam, or powering a gas engine or gas turbine in a cogeneration plant are the main pathways of energy recovery. Cogeneration is also known as a combined heat and power (CHP) plant. Biogas is burnt with oxygen in a reciprocating gas engine to produce mechanical energy. A variety of reciprocating gas engines have been used, including spark ignition and compression ignition. The gas engine drives an alternator, which generates electrical energy. To enable heat recovery, the radiator on a standard engine is replaced with a heat exchanger. Additional heat can be recovered from the engine exhaust gas. The conversion of biogas energy into electrical energy is approximately 30-35%. An additional 57% of biogas energy can be converted into heat energy if the gas engine is fitted with an efficient heat exchanger and heat from the flue gas is recovered (Navickas 2007). Approximately 8% of the energy contained in biogas is lost through system losses. The efficient conversion of the energy available in biogas will depend largely on the CHP plant design. In the larger European biogas plants, the generated electricity is sold at a premium price and the generated heat is supplied to a local residential community scheme. Recent development of biogas usage include supplying biogas to a microturbine for the generation of small electrical and heat loads, and also supplying biogas to a fuel cell where electricity is directly generated through an electrochemical process. These approaches may not be relevant to feedlots that don’t require mobile electrical energy.
2.8.3 Digestate and sludge handling and disposal
Anaerobic digestion produces digestate, which is a mixture of liquid and solid residue. The quality of the digestate will vary according to the feedstock processed. As the organic material passes through the anaerobic digestion process, the digested material becomes stable, with the majority of the organic material decomposed. This will produce higher concentrations of nutrients. The availability of the nutrients is higher in digestate than in untreated organic waste. The nutrients are mineralised to allow for improved plant uptake. Digestate has approximately 25% more available NH4-N and a higher pH than untreated liquid manure (Danish Biogas Association 2010).

B.FLT.0368 Final Report – Feasibility of using feedlot manure for biogas production
Page 51 of 117
Digestate originating from agricultural manure may contain antibiotics, pesticide residues and metals, which originate from animal feed additives. The European Commission is in the process of establishing policy in a “Green Paper” which is expected to regulate the level of contaminates in composts and digestate.
2.9 Biogas regulations and safety
2.9.1 Biogas regulations
The biogas plant is treated the same as an industrial gas installation and the installation of a biogas plant must comply with the local and state gas safety and environmental regulations. State gas safety agencies and environmental authorities are summarized in Davidson et al. (2013). Currently there are no existing biogas guidelines in Australia. In response, APL has recently developed a risk based Code of Practice for biogas production and usage at piggeries (Davidson et al. 2013) . The Code incorporates international best practice from Germany, Canada, US and New Zealand, and Australian regulations and standards relevant to on-farm biogas and Australian climatic conditions. The Code covers the life cycles of a biogas plant project, from planning, construction, on to operations and maintenance. It also covers health and safety and environmental protection throughout the biogas plant project. This has recently been published (see http://australianpork.com.au/wp-content/uploads/2013/10/2011_1013.423-FINAL-REPORT-CONSULTATION.pdf)
2.9.2 Biogas safety
Davidson et al. (2013) have reported on the properties of biogas production related to present health and safety issues. These include risk of fire and explosion, intoxication, asphyxiation and disease. These biogas-specific risks can be minimised through proper design, management practices, protective equipment and training. For example, to minimize explosion hazards, open flames should never be used near a digester. Also, large engines and electric generators must be carefully managed to avoid sparks that may ignite the gas. No smoking is allowed near the digester or related biogas pipes and equipment. To avoid diseases, personal protective equipment must be used to avoid contact with manure. Washing after working near the digester is also recommended. Keeping the digester facility clean will reduce disease hazards as well as the spread of odours and fly populations in the digester facility.
2.9.3 Environmental protection
Agricultural biogas production complements the existing manure handling and treatment, and thus can enhance the environmental protection aspects of modern agriculture. For example, digestate odour is significantly reduced compared to untreated liquid manure. The VFAs and mercaptans that are largely responsible for odour generation from animal manure are consumed during anaerobic digestion. However, biogas plants may require imported waste materials which present biosecurity risks. Also, emissions and discharges from biogas plants need to be carefully managed. For example, the operation of the digester at mesophilic temperatures is not regarded in Europe as providing enough sterilisation treatment to remove pathogens. The centralised AD plants include a pasteurisation stage in the process and this enables the safe distribution of digestate from the centralised plant to any of the feed stock supply farms, without the risk of spreading disease. A Danish monitoring programme reports that maintaining a thermophilic processing temperature for 53.5°C for eight hours has the same effect as pasteurising the mixture at 70°C for one hour (Danish Biogas Association 2010).
2.10 Agricultural Biogas plants in Australia
The majority of Australia’s AD industries are associated with municipal waste water treatment plants

B.FLT.0368 Final Report – Feasibility of using feedlot manure for biogas production
Page 52 of 117
(WWTP) with most sites employing cogeneration (CHP) units. Numbers for industry and agricultural AD facilities are difficult to obtain, however, an estimate has been provided in Table 9 – Australian biogas plants operating and proposed (2010). Renewable energy provided 14.8% of Australian electricity generation during 2013. Bioenergy totalled 6.9% of this, with biogas contributing to about 2% of the share of total renewable electricity capacity (CEC 2013). However, electricity generation from AD installations has shown most growth over the past five years. Goals of 2,413 and 55,815 GWh for bioelectricity were set for 2020 and 2050 respectively, to which on-farm AD and AD using biowaste and industrial organics are key contributors (CEC, 2008). The number of biogas facilities in Australia is currently being updated (see http://biogas.nceastg.usq.edu.au/biogas/) through the International Energy Agencies Bioenergy Subprogram Task 37 Energy from Biogas (see http://www.iea-biogas.net/).
Table 9 details a survey of the Australian biogas installations and proposed projects, which produce energy from anaerobic-digested feedstock. The location of the existing and proposed biogas plants in Australia is shown in Table 9 (Source: Geoscience Australia (2010).

B.FLT.0368 Final Report – Feasibility of using feedlot manure for biogas production
Page 53 of 117
Table 9 – Australian biogas plants operating and proposed (2010)
Company
State Waste Stream Feedstock
Electrical energy Capacity (kW)
Installation Date
QAF Meat Industries - Corowa NSW Piggery waste 240 Proposed AJ Bush & Sons NSW Rendering plant 85 Proposed Charles IFE Pty Ltd - Berrybank VIC Piggery waste 180 1990 Burrangong Meat Processors NSW Abattoir 600 Reopening AJ Bush & Sons QLD Rendering plant 1000 Developing Rockdale Beef NSW Abattoir 920 Unknown Westside Meat Works VIC Abattoir 100 Unknown EarthPower Technologies NSW Food waste 3500 2003 McCain's Foods VIC Food waste 3000 Unknown Werribee AGL VIC Sewage methane 10000 1996 Werribee Melbourne Water VIC Sewage methane 1300 1995 Werribee 2 Melbourne Water VIC Sewage methane 7000 1998 Diamond Energy - Shepparton VIC Sewage methane 1100 2007 Diamond Energy - Tatura VIC Sewage methane 1100 2009 Carrum Downs 1 & 2 VIC Sewage methane 17000 1975 WA Water Woodman Point WA Sewage methane 1200 1998 Water Corp WA WA Sewage methane 1200 1999 Brisbane City Council – Luggage Point
QLD Sewage methane 3200 1979
Stanwell Corp - Townsville QLD Sewage methane 270 2000 Brisbane City Council – Oxley Creek QLD Sewage methane 1030 2003 Gold Coast City Council - Elanora QLD Sewage methane 230 2005 Veolia Water - Ti Tree QLD Biomass 2200 2008 Sydney Water – North Harbour NSW Sewage methane 1400 2008 Sydney Water – Malabar NSW Sewage methane 3000 1999 Sydney Water – Cronulla NSW Sewage methane 497 2001 Sydney Water – Bondi NSW Sewage methane 970 2008 Sydney Water – Glenfield NSW Sewage methane 400 2008 Sydney Water – Liverpool NSW Sewage methane 230 2008 Sydney Water – Warriewood NSW Sewage methane 150 2008 Sydney Water – Wollongong NSW Sewage methane 400 2008
Carbon Partners - Scencorp Group VIC Greenwaste and
food waste 6800 Proposed
Victorian Farmers Federation / Bio-cogen
VIC Agricultural waste 2000 Proposed
Although biogas technology can be deployed with feedstock from any organic waste streams, it appears that, in Australia, a major area of potential deployment is within the agriculture and food processing industry. The CEC Australian Bioenergy Roadmap (2008) noted significant potential for increased use of agricultural wastes in Australia, from an estimated 791 GWh per year in 2020 to 50,566 GWh in 2050. This translates to an increase from a 1% bioenergy contribution from agricultural-related wastes in 2011 to 7% in 2020 and 69% by 2050. Currently 1.3 million tonnes of waste is produced from abattoirs. This industry has a projected potential to produce 33.7GWh/yr by 2020 and 1773 GWh/yr by 2050.

B.FLT.0368 Final Report – Feasibility of using feedlot manure for biogas production
Page 54 of 117
There is clearly a growing interest in biogas production from organic wastes in Australia. However, there are few examples in the intensive livestock sector. In the past few years, due to the introduction of the Carbon Farming Initiative (CFI), there has been strong interest in covering anaerobic treatment ponds at piggeries. Some examples of these developments will be discussed in following sections. However, there are currently no known biogas facilities at any Australian feedlot. Some examples of intensive livestock and processing industries which have adopted biogas capture from wastewater include:
Piggery waste o Berrybank piggery (Australian Centre for Cleaner Production, 2001) o Blantyre Farms (http://blantyrefarms.com.au/quality-sustainability) o Bears Lagoon piggery (RIRDC, 2010).
Red meat processing o King Island beef processing plant (Johns & Butler 2012) (decommissioned) o NH Foods, Oakey Beef Exports (http://www.mla.com.au/globalassets/mla-
corporate/generic/about-mla/covered-anaerobic-lagoons.pdf)
Poultry Farms o Darling Downs Fresh Eggs
(http://www.cleanenergyfinancecorp.com.au/media/63281/20130731-cefc-pdf-factsheet-darlingdownsfresheggs_lr.pdf)
2.11 Experiences with biogas production at US feedlots
2.11.1 Overview of feedlot biogas projects in USA
During the project, an opportunity arose to undertake a study tour of feedlot biogas developments in the USA. A search was undertaken to find operational biogas units that were using dry-lot feedlot manure. The Agstar site (http://www.epa.gov/agstar/projects/ ) was searched. While there are 39 pig and 199 dairy projects listed, only one relevant feedlot project (Hampton Feedlot) was found (See Table 10). Further searching located Western Plains Energy, which is a feedlot manure biogas unit based on the existing Hi-Mark Feeders unit in Canada. In addition, it was found that experimental work was being undertaken at Colorado State University. The lack of operational feedlot biogas projects in the USA indicates the considerable difficulties in getting a biogas system to work functionally and economically with the current state of knowledge.

B.FLT.0368 Final Report – Feasibility of using feedlot manure for biogas production
Page 55 of 117
Table 10 – Beef anaerobic digester operational projects – 2014 (Agstar)
Farm/Project Name City State
Digester Type
Year Operational
Animal Type
Population Feeding Digester
Co-Digestion Biogas End Use(s)
Suwannee Farms O'Brien FL Mixed Plug Flow
2009 Beef
Amana Farms, Inc. Amana IA Mixed Plug Flow
2008 Beef 4000 Sludge (Paper sludge substrate)
Cogeneration
Linkenmeyer Family Feeders / Link Energy, LLC
Riceville IA Mixed Plug Flow
2012 Swine and Cattle
4000; 5000
Additional substrates Electricity
Sievers Family Farms
New Liberty
IA Complete Mix
2011 Beef 4890 Agricultural substrates (corncobs, cornhusks, soybean stubble, hog manure)
Electricity
Bio Town Ag, Inc. Reynolds IN Mixed Plug Flow
2011 Swine and Cattle
800; 4500 Wastes from surrounding community
Cogeneration
Waste No Energy Monticello IN Complete Mix
2013 Swine and Cattle
4000; 300 Food waste, fats, oil, grease, organic waste
Cogeneration
Hampton Feed Lot Triplet MO Induced Blanket Reactor
2012 Cattle 2500 Electricity
Oak Hill Farm Nottingham PA Complete Mix
2011 Swine and Cattle
4400; 130 Food wastes Electricity

B.FLT.0368 Final Report – Feasibility of using feedlot manure for biogas production
Page 56 of 117
2.11.2 Hampton Feedlot Inc.
Hampton Feedlot is located near Triplett, Missouri. It can hold about 4000 beef cattle, of which 2400 head are in covered barns. Photograph 19 – Aerial photograph of Hampton Feedlot shows an aerial view of the site with conventional open feedlot pens and four covered barns. The incentive to develop a biogas plant on-site was not driven by the desire to generate energy but as a response to EPA compliance issues around the holding pond system, which was full of solids. In December 2009, the members of the Hampton Feed Lot organized Hampton Alternative Energy Products, LLC as an "eligible new generation processing entity" in order to build, operate and own a development facility and a renewable fuel production facility for its producer members, consisting primarily of the members of the Hampton Feed Lot. In 2010, Hampton Feedlot had undertaken a feasibility study and obtained a grant of $450,000 from the Missouri Department of Natural Resources towards the $4M project. The facility was built in 2011 and is now operational. Manure is scraped three to four times a day into pits beneath the four confinement barns. No manure from open feedlot pen is used as this is contaminated with soil. The manure is agitated in deep pits and then pumped to a mixing tank (See Photograph 20 – Mixing tank close to confinement barns). No screening of the manure occurs. The mixing tanks have these larger propeller agitators in them. The influent seems to come into the tank via a jet. The tanks are completely agitated so that nothing settles. Effluent from the holding pond system is added until the effluent has a solids content of 7-8%. It is then pumped, via a macerator (See Photograph 21 - Macerator on influent line) and heat exchanger (See Photograph 22 – Heat exchanger on influent line), into the base of one of six upflow anaerobic sludge blanket (UASB) reactors. The macerator is necessary to break up ear tags, hooves and other debris that gets through the mixing tanks. It also breaks the manure down into finer particles to improve digestion. The heat exchanger heats the influent prior to entering the digester. The heat comes from the exhaust of the methane-fuelled engine that runs a generator. Positive displacement slurry pumps are used to move all effluent (See Photograph 24 – Two of the six digester tanks). Photograph 24, documents two of the digester tanks. They can be seen under construction in the centre of Photograph 19 – Aerial photograph of Hampton Feedlot. Each tank is 130,000 L capacity and is operated at about 39°C. The system does not use any mechanical or hydraulic mixing in the tanks. The hydraulic retention time is 3-5 days. The Operator commented that sand” accumulates in the digester tanks and this is very difficult to remove. The Operator seemed to believe that this was silica derived from the feed as the manure is from concrete floors and is not contaminated with soil. Biogas is used to fuel an electricity generator (See Photograph 25 – Electricity generator using biogas) which provides all of the electricity requirements of the feedlot. A second generator could be installed to supply electricity to the local grid. They generate enough electricity to supply the “parasitic” load of the digester and the feedlot as well as selling some to the grid. There is a complex control system for the facility (See Photograph 26). The effluent from the top of the digester tanks goes through a solids separator (See Photograph 27). The liquid component is recycled and excess liquid is sent to the feedlot's holding pond where it has apparently caused the pond to become active and to breakdown much of the accumulated solids. The solids in the effluent are dried and are being sold as a soil conditioner.

B.FLT.0368 Final Report – Feasibility of using feedlot manure for biogas production
Page 57 of 117
Photograph 19 – Aerial photograph of Hampton Feedlot
Photograph 20 – Mixing tank close to confinement barns

B.FLT.0368 Final Report – Feasibility of using feedlot manure for biogas production
Page 58 of 117
Photograph 21 - Macerator on influent line
Photograph 22 – Heat exchanger on influent line

B.FLT.0368 Final Report – Feasibility of using feedlot manure for biogas production
Page 59 of 117
Photograph 23 – Positive displacement pumps on influent line
Photograph 24 – Two of the six digester tanks

B.FLT.0368 Final Report – Feasibility of using feedlot manure for biogas production
Page 60 of 117
Photograph 25 – Electricity generator using biogas
Photograph 26 – Control system for anaerobic digester and generator

B.FLT.0368 Final Report – Feasibility of using feedlot manure for biogas production
Page 61 of 117
Photograph 27 – Separated solids from digester effluent
2.11.3 E3 Biofuels
E3 Biofuels is an integrated facility near Mead, Nebraska that includes a 28,000 head covered feedlot, an anaerobic digester and an ethanol plant (See Photograph 28). Figure 15 details the connections in the system. The facility was built in 2006 but shutdown in 2007 after a boiler explosion and poor performance of the system. The facility has recently re-opened. Cattle are housed in confinement barns with slatted floors (See Photograph 29). Manure falls into under-floor channels from which it is pumped to a manure holding pond (See Photograph 30). Periodically, a slurry pump (See Photograph 31) pumps manure from the holding pond into a mixing tank (See Photograph 32). After the slurry is thoroughly mixed, it is transferred into one of the anaerobic digesters (See Photograph 33 & 34). Biogas from the digester is pumped to the ethanol plant to fuel boilers (See Photograph 35). Excess biogas is flared (See Photograph 36). The facility includes a complex system for dewatering the effluent from the digesters. This includes a belt press (See Photograph 37) which was meant to use polymers. There is also a sand filtration system. This system has never worked properly.

B.FLT.0368 Final Report – Feasibility of using feedlot manure for biogas production
Page 62 of 117
Figure 15- Schematic outline of E3 Biofuels
Photograph 28 – Google Earth image of E3 Biofuels

B.FLT.0368 Final Report – Feasibility of using feedlot manure for biogas production
Page 63 of 117
Photograph 29 – Cattle on slatted flooring in confinement barn
Photograph 30 – Manure slurry holding pond

B.FLT.0368 Final Report – Feasibility of using feedlot manure for biogas production
Page 64 of 117
Photograph 31 – Slurry pump with confinement barns in background
Photograph 32 – Manure mixing tank

B.FLT.0368 Final Report – Feasibility of using feedlot manure for biogas production
Page 65 of 117
Photograph 33 – Anaerobic digester tank
Photograph 34 – Detail of anaerobic digester tank

B.FLT.0368 Final Report – Feasibility of using feedlot manure for biogas production
Page 66 of 117
Photograph 35 – Biogas pump from digester to ethanol plant
Photograph 36 – Excess biogas flare

B.FLT.0368 Final Report – Feasibility of using feedlot manure for biogas production
Page 67 of 117
Photograph 37 – Belt press for effluent dewatering (not operating)
2.11.4 Hi-Mark Feeders/Biogas
Highland Feeders is a large cattle feedlot about 25 km north of Vegreville in Alberta, Canada. Highland Feeders was founded in 1983 when Mike and Bern Kotelko diversified their grain operation with 50 feeder cattle. Now the company operates the sixth largest feedlot in Canada with a standing capacity of 36,000 head. Some years ago, Highland Feeders decided to develop a biogas unit at the feedlot (http://himarkbiogas.com/ ). The first pilot plant was developed in 2003 and the company has continued to develop integrated biogas technologies in the intervening years. In 2005, the Growing Power Hairy Hill was commissioned (http://www.growingpower.com/). This site apparently uses feedlot manure as well as residential organic waste and is operating successfully.
2.11.5 Western Plains Energy
Western Plains Energy is an integrated ethanol / feedlot manure biogas plant near Oakley, Kansas. Photograph 38 documents the site with the biogas plant on the left and the ethanol plant on the right of the image. The biogas plant consists of four large anaerobic digesters and two covered lagoons. Photograph 39 documents a general view of the anaerobic digesters. The design of the facility was provided by Himark Biogas. Unfortunately, by the time of the visit, the site was subject to legal action between Himark BioGas and Western Plains Energy due to poor performance of the biogas plant. Hence, no detailed inspection of the plant was possible and details of the plant can be discussed. A press article about the project (Manure Manager – March/April 2013) can be accessed at http://magazine.agannex.com/publication/?i=150214&ver=html5&p=8

B.FLT.0368 Final Report – Feasibility of using feedlot manure for biogas production
Page 68 of 117
Photograph 38 - Google Earth image of Western Plains Energy
Photograph 39 – General view of Western Plains anaerobic digesters
2.11.6 Colorado State University Leach bed system
Dr Sybil Sharvelle at Colorado State University (CSU) is leading a project investigating biogas production from feedlot manure using a leach bed system. The system includes three stages. Hydrolysis is carried out in a trickle flow leach bed reactor (TFLBR) and methanogenesis can be carried out in a high rate anaerobic digester (HRAD) such as an upflow anaerobic sludge blanket reactor (as per Hampton Feedlot) or a fixed film reactor (Figure 16). Most of the work has focussed on optimising the performance of the TFLBR. The unit is housed in a mobile demonstration unit (See Photograph 40). Photograph 41 documents the control panel within the demonstration unit.

B.FLT.0368 Final Report – Feasibility of using feedlot manure for biogas production
Page 69 of 117
Since leach bed reactors (LBRs) are high solids reactors, studies have indicated clogging issues in LBRs handling 26% TS. Since TFLBRs are subjected to hydrolyze up to 90% TS, obtaining hydraulic flow through the reactor is a challenge. The objective of this research at Colorado State University is to (a) ensure good hydraulic flow through the TFLBRs and (b) evaluate and optimize the performance of the TFLBR to effectively hydrolyze the HSCM. The system is operated as a batch process with a hydraulic retention time (HRT) of 42 days without leachate recirculation. A layer of sand is added as dispersion media on top of the manure bed in the TFLBRs. This promotes good hydraulic flow through the reactor eliminating clogging issues. Organic leaching potential of a single pass (without leachate recirculation) TFLBR configuration was evaluated in terms of chemical oxygen demand (COD). Manure is naturally rich in nutrients essential for microbial growth in AD. In a typical MSLBR system, the TFLBRs are subjected to leachate recirculation, conserving the essential nutrients in the system. However, in this single pass system, the leachate removal flushes out the nutrients in the TFLBRs over time. So, nutrient solution is added to the TFLBRs to provide a constant supply of essential nutrients in the reactors for the purpose of this study and would not be necessary in a leachate recirculated TFLBR. A comparison between nutrient dosed and non-nutrient dosed TFLBRs was performed. The non-nutrient dosed and nutrient dosed TFLBRs indicated a COD reduction of approximately 66.3% and 73.5% respectively, in total in terms of dry mass. A total reduction in volatile solids (VS) of approximately 46.3% and 44.7% was observed in the non-nutrient dosed and nutrient dosed TFLBRs, respectively. Biochemical methane potential (BCMP) tests indicated a CH4 potential of approximately 0.17 L CH4/g COD leached and 0.13 L CH4/g COD leached from the non-nutrient dosed and nutrient dosed TFLBRs, respectively. Concentration of inorganics leached from the TFLBR was monitored periodically. To date, this is a demonstration unit only. No work has been done in preparation of manure removed from pens for placement in the TFLBR. Photograph 42 documents the pre-screened manure that is loaded into the TFLBR.
Figure 16 – CSU leach bed system

B.FLT.0368 Final Report – Feasibility of using feedlot manure for biogas production
Page 70 of 117
Photograph 40 – CSU mobile leach bed system
Photograph 41 – Control panel at CSU leach bed system

B.FLT.0368 Final Report – Feasibility of using feedlot manure for biogas production
Page 71 of 117
Photograph 42 – Screened manure for leach bed trials
2.11.7 Summary of feedlot biogas in the USA
Following investigations into feedlot biogas in the USA and site inspections of most of the currently operational sites, the following conclusions can be drawn. 1. There are very few (3-4) operational facilities for cattle feedlots. 2. Two of the operating facilities used manure from cattle housed in barns with concrete floors, thus
eliminating the issue of soil contamination in pen manure. 3. All operating facilities are based on the high capital cost option of in-tank anaerobic digesters. 4. No facility seemed to have successfully dealt with the issue of removing contaminants from pen
manure (although the facility in Canada was not visited). 5. All sites commented on rapid sludge / solids accumulation rates inside the digesters (greater than
anticipated in the design stage). This seems to indicate that the significance of pen manure contamination was under-estimated.
6. Most facilities had invested heavily in systems to dewater effluent coming out of the digesters and there were technical difficulties with these as well as high capital cost.
2.12 Improving biogas yield of feedlot manure
It is possible to propose actions that can be taken to improve the viability of generating biogas from feedlot manure through a clear understanding of the issues presented by feedlots. The following is a list of possible actions that could be taken to improve the biogas yield of feedlot manure.
2.12.1 Change manure harvesting techniques
Gopalan (2013) found that the degradability of feedlot manure decreased from fresh manure to pen manure to stockpiled manure, as shown by decreasing VS from 83 to 60% (See Figure 17). This suggests that easily degradable components such as VFAs, sugar and starch – rich carbohydrates have decomposed rapidly in the pen and further degraded during the storage of manure. Figure 4 details the reduction of VS on the feedlot pen surface over time.

B.FLT.0368 Final Report – Feasibility of using feedlot manure for biogas production
Page 72 of 117
Manure with low VS content is not going to be a good feedstock for AD because, although there may still be significant amount of VS left (e.g. 60%), it mainly contains lignocellulosic matter that can only be partly degraded during AD (Angelidaki & Ahring 2000). Triolo et al. (2011) found that lignin concentration in VS was the strongest predictor of BMP for both energy crops and animal manure – low lignin content indicates higher BMP.
Figure 17 – Relationship between Biochemical methane potential (BMP) and VS content of feedlot manure samples
Data source: Gopalan (2013)
2.12.2 Pre-treatment of feedlot manure
Pre-treatment of manure may be helpful to improve the biogas yield. Biological treatment such as incubating with hemicellulose degrading bacteria at 70°C has been found to increase biogas production by 30% (Angelidaki & Ahring 2000). Thermo-chemical treatment such as wet explosion (a steam explosion process) at 180°C for 10 minutes has been found to increase biogas production by 136% (Biswas et al. 2012). These approaches, although effective at laboratory scale, may be too complicated for implementation at feedlots. To maximise the degradation of organic materials, feedlot manure needs to be pre-treated so that particle sizes are reduced and foreign materials are removed. Common practice in manure composting can be directly used to treat manure for AD. Firstly, a windrow turner for manure composting may be used to break the clogs into smaller sizes. Secondly, common screening techniques such as rotating screen, brush roller, vibrating screen, and run-down screen can be used to remove gravel and other foreign materials. To enhance the AD of manure, techniques such as ultra-sonic treatment have been developed. Wu-haan et al. (2010) evaluated the effect of ultrasonication as a pre-treatment to AD of beef feedlot manure. Ultrasonic pretreatment was applied at two amplitudes (µmpp, peak-to-peak amplitudes in µm) and at two time settings (in seconds). Ultrasonic pretreatment increased the average soluble COD up to 92%, and the average methane yield up to 43%. Increasing the ultrasonic amplitude and treatment time resulted in an increase in manure soluble COD and methane production. The greatest methane production was obtained at the highest power and longest treatment time (160 µmpp, 30 seconds) and was found to be 230 mL CH4 g/VS for beef feedlot manure.
40
50
60
70
80
90
0 100 200 300 400
VS
(%
of
TS
)
BMP (L CH4 / kg VS)
Fresh
Pen
Stockpile

B.FLT.0368 Final Report – Feasibility of using feedlot manure for biogas production
Page 73 of 117
Thermal (up to 190 °C) and thermo-chemical treatment (with acid or alkaline) have been found to increase biogas production from pig, chicken and cattle manure (Carrère et al. 2009). For example, Carrère et al. (2009) found that methane yield (mL CH4/g COD) was increased by 64% with thermal treatment at 190 °C, and by 78% with a combination of 190 °C and pH = 10.0. However, few studies have evaluated the energy efficiency of these treatments. When Wu-haan et al. (2010) took into account the energy input for ultrasonication, the lowest ultrasonic amplitude combined with the shortest treatment time (80 µmpp, 15 seconds) achieved the greatest energy efficiency, i.e. increased methane yield providing 63% more energy than what was required to operate the ultrasonic process.
2.12.3 Dilution and mixing of feedlot manure
The following section provides some detail around dilution and mixing of feedlot manure. For one kg of pen manure with an initial solids content of 55%, about 3.6 kg of water must be added to achieve a slurry with TS of 12%. 55/(100+x) solids content =12/100 TS =>x=358 g water Considering a medium sized feedlot (10,000 head capacity) that generates manure of 1 t DM/head/yr, this would require 65.5 ML water annually. 10,000 t DM => 10,000/0.55 t “wet” manure =>10,000/0.55*3.6 t water A feedlot with 10,000 SCU has been predicted to generate effluent at 115 kL/d (Bridle, 2011), which amounts to 4.2 ML effluent annually. Considering that effluent contains solids as well, relying on effluent to dilute feedlot pen manure may not achieve a feasible TS content for plug flow digester. To utilise pen manure for AD would thus require either additional water, or solid phase digester. To utilise fresh manure (TS about 20%) would require much less dilution water. However, significant management practice has to be implemented which may not be cost effective.
2.12.4 Co-digestion of manure with other products
Co-digestion of animal manure with other easily degradable materials may be another way to improve biogas production. For example, Labatut et al. (2011) demonstrated that mixing raw dairy manure with used vegetable oil can increase BMP by 49% compared to raw dairy manure, and mixing with dog food and ice cream can increase BMP by 93% (See Figure 18). Synergistic activity has also been found in some co-digestion mixtures.

B.FLT.0368 Final Report – Feasibility of using feedlot manure for biogas production
Page 74 of 117
Figure 18 – BMP (L CH4 / kg VS) of mono- and co-digested substrates
Note: The value outside the bars is the average Bo with the sample number in parenthesis. Error bars represent the standard deviation of Bo for each substrate. Adopted from (Labatut et al. 2011).
2.12.5 Improvement of C:N ratio in manure feedstock
The production of methane from organic carbon depends upon the availability of carbon in the feedstock. The ideal C:N ratio range for optimum anaerobic digestion is 16:1–25:1 (Zhu 2010). A lower C:N ratio can lead to ammonia accumulation and pH values exceeding 8.5, which is detrimental to the methanogenic bacteria (Monnet 2003). Zhu (2010) suggests that increasing the C:N content of the piggery waste stream by the addition of waste streams with a high C:N ratio will increase the volume of biogas produced. It is suggested that it is also possible to increase the methane content of the biogas by the addition of certain feedstocks to the piggery waste stream, for example oat straw and corn stalks. This will have a significant impact on the economic viability of the plant. However, further research would be required to determine the biodegradability of potential additional organic materials available in Australia.
3. Methodology
3.1 Feedlot manure sampling
3.1.1 Biomethane potential testing and chemical composition
Three feedlots in Southeast Queensland with different feed processing technology and pen capacities were selected for this experiment. One pen per feedlot was used for all samples with multiple samples

B.FLT.0368 Final Report – Feasibility of using feedlot manure for biogas production
Page 75 of 117
within the pen taken and further processed as described below. Details about manure sample types and measurements performed are presented in Table 11.
Table 11 – Feedlot manure sampling information
F1 F2 F3
Steam flaking Yes No Yes
Manure collection date Jan 31st 2014 Feb 5th 2014 Jun 18th 2014
Weeks elapsed since last pen cleaning 25 n.r. a 6 b a not reported by feedlot manager;
b estimated by feedlot manager
Fresh manure (FM) samples were collected by walking along the pens and manually picked up using a small garden spade and then transferred into a plastic bag and sealed (See Photograph 43). At least three random scoops were taken for each bag and a total of three bags were collected. Freshly dropped piles were carefully taken to prevent contamination of other materials. When a hard surface exists on the manure pile, the hard surface was scraped out and only the fresh manure inside was collected. Samples were kept in eskies with ice packs to reduce the degradation of waste before transported to the lab.
Photograph 43 – Fresh manure sampling at feedlot 1
Pen surface manure (PSM) samples were also collected by walking along the pens and manually picked up using a small garden spade and then transferred into a plastic bag and sealed (See Photograph 44). PSM sampling was performed to mimic as close as possible manure harvesting depicted in photograph 5. At least three random scoops were taken for each bag and a total of three bags were collected. Three PSM samples were kept in eskies with ice packs to reduce the degradation of waste before transported to the lab. Another bulk PSM sample of about 40 kg were collected and kept in a 100 L wheelie bin in a cool place before the pre-treatment trial. Age of pad manure was calculated with reference to the last pad scraping event and therefore represents the maximum age (in weeks).

B.FLT.0368 Final Report – Feasibility of using feedlot manure for biogas production
Page 76 of 117
Photograph 44 – Pen surface manure sampling at feedlot 1
Freshly scraped pen manure (FSPM) samples were manually taken by hand on the same day when pen is cleaned by machinery, e.g. box scraper (Photograph 45 – Manure from freshly scraped pen at feedlot 3). About 40 kg of FSPM were sampled and kept in a 100 L wheelie bin in a cool place before the pre-treatment trial. Another three FSPM samples were kept in eskies with ice packs to reduce the degradation of waste before transported to the lab.]
Photograph 45 – Manure from freshly scraped pen at feedlot 3
Stockpiled manure (SM) samples were taken by hand from a minimal depth of 10 cm at about ten different locations around the stockpile (Photograph 46 – Stockpile manure sampling at feedlot 1).

B.FLT.0368 Final Report – Feasibility of using feedlot manure for biogas production
Page 77 of 117
Samples were kept in eskies with ice packs to reduce the degradation of waste before transported to the lab.
Photograph 46 – Stockpile manure sampling at feedlot 1
3.1.2 Physical characterisation
Testing of secondary parameters such as turbidity, bulk density and settling velocity of solids was carried out on 3 types of manure (fresh, pen and stockpile manure) from two feedlots (F4 and F5) located in Southeast Queensland. F4 uses steam flaking for grain processing while F5 uses a dry process. Details are given below:
1. F4 FM (Freshly cleaned manure from pen) 2. F4 PSM (Fresh surface pen manure) 3. F4 SM (Stockpile manure) 4. F5 PSM (Thinly scraped pen manure) 5. F5 SM (Old stockpile manure)
Details of the age of pen surface manure (weeks elapsed since last pen cleaning) were not provided.
3.2 Biomethane potential batch tests
3.2.1 Sample Preparation
A single composite sample was created from the three bags collected from each feedlot pen in the laboratory and immediately processed. Large components of the manure were broken into smaller sizes and large stones and gravel, if present, were removed. The manure was then placed into a domestic food processer (Kambrook KFP400) and processed for 60 seconds to break the manure into smaller, more
uniform particle sizes. This resulted in particle sizes of 1cm. The samples were then placed in a coffee
grinder (Sunbeam EM0415) for 45 seconds to decrease particle size to 2mm. One kilogram of the collected samples were processed each time and distributed in 200 g lots in snap-lock plastic bags. The
samples were then stored at 4C in a refrigerator until ready to be analysed for chemical composition and biomethane potential.

B.FLT.0368 Final Report – Feasibility of using feedlot manure for biogas production
Page 78 of 117
3.2.2 Chemical characterisation
TS, VS and MC measurement The solid content of the samples was determined according to Standard methods (APHA, 2005). For the
determination of total solid (TS), samples of 2 to 4 grams were placed in a ceramic crucible and weighed.
The crucibles were placed in a muffle furnace for 30 min to remove any contamination and then cooled in
a desiccator before use. The samples were then dried in an oven at 105 ± 2 °C for 18-20 hours
(recommended between 15-20 hours) until they reach constant weight. After cooling in a desiccator, the
samples were weighed again for TS measurement. The samples were then oxidized at 550 °C for 2 hours
for volatile solid (VS) determination. The volatile solids (VS) were determined by subtraction of the
minerals content of the sample (residual ash after oxidation) from the total solids content. The following
equations were used:
TS(%)=(W1-Wc)/(Ws-Wc)×100
VS(%)=(W1-W2)/(W1-Wc)×100
Where:
Wc : Clean crucible weight
Ws : Sample plus crucible weight
W1 : Crucible weight after drying at 105oC and cooling in a desiccator
W2 : Crucible weight after drying at 550oC and cooling in a desiccator
The total solid content is a measure of the amount of material remaining after all the water has been
evaporated, so moisture content of the sample can be calculated as:
MC (%)=100-TS(%)
Organic matter composition Further analysis of the organic matter content in the form of lignin, fat, volatile fatty acids (VFA),
cellulose, hemicellulose, starch and protein was performed by SGS Food and Agriculture (Brisbane, QLD).
3.2.3 BMP set up and operation
A multi-channel analyser - the automatic methane potential test system (AMPTSII, bioprocess control, Sweden) - was used to perform BMP testing of manure samples. The AMPTS consists of fifteen parallel reactors and the same number of gas flow meters attached to a data acquisition system (See Photograph 62). A schematic representation is illustrated below in Figure 19. (Modified from Badshah, Liu and Mattiasson (ND). Biogas, a mixture of methane and carbon dioxide, that is produced in temperature controlled reactors (fifteen sets) each with an overhead stirrer (1) passes through one-way valves and enters into scrubbing solution units (fifteen sets) where carbon dioxide is fixed (2) and methane passes to the sensor chamber (fifteen sets) (3) where the volume is quantified and recorded by the software (4). Arrow shows the direction of gas flow.

B.FLT.0368 Final Report – Feasibility of using feedlot manure for biogas production
Page 79 of 117
Photograph 47 – Laboratory set up of the Automatic Methane Potential Test System (AMPTS)
Figure 19 - Schematic presentation of AMPTS
AMPTS was developed for automatic real-time measurement of the biomethane production during anaerobic digestion of any organic biomass. The system consists of a water-bath having capacity of 15 bioreactors of 500 mL each. Each bioreactor is fitted with a mechanical agitator to provide gentle mixing for the bioreactor contents. Mixing is performed intermittently (30s on 120s off) during the whole experiment. The biogas produced in each bioreactor passes through Tygon® tubing (3 mm ID) to individual Schott bottles containing an alkaline solution (3M NaOH - 120 g NaOH mixed with 1 L distilled water). Several acid gas fractions, such as CO2 and H2S, are retained by chemical interaction with NaOH, only allowing CH4 to pass through to the biomethane gas monitoring unit. A pH indicator is added into each Schott bottle for controlling the acid binding capacity (thymolphthalein pH-indicator (4%, 40 mg in 9
N2 gas (for flushing prior to start up)
1. Stirred bioreactors (500 mL vol)
2. CO2 scrubbers ( 250 mL vol)
3. Methane measuring device
4. Data recording

B.FLT.0368 Final Report – Feasibility of using feedlot manure for biogas production
Page 80 of 117
ml ethanol (99.5%) followed by addition of 1 ml distilled water is added to the NaOH solution and mixed at a ratio of 5:1000 ml, 80 ml of the mixture then placed in 250 ml Schott bottles). The volume of CH4 gas released from the CO2 scrubbing bottles is measured using a wet gas flow measuring device with a multi-flow cell arrangement (15 cells). This measuring device works according to the principle of liquid displacement and buoyancy and can monitor ultra-low gas flows. A digital pulse is generated when a defined volume of gas flows through the device. An integrated embedded data acquisition system is used to record, display and analyse the results.
3.2.4 Inoculum (sludge) source
Inoculum used for every batch test was collected from the anaerobic digestion unit at Pittsworth, QLD wastewater treatment plant. The plant consists of overflow settling tank, anaerobic digester and a trickling filter. The anaerobic tank is an over ground concrete tank with semi-continuous stirring (dimensions: 3m diameter; 8m height; approximately 57 m3 volume). After collection the sludge was directly sieved (1.7 mm mesh) and mixed well for 60 seconds. In order to minimize the amount of biogas that is produced by the sludge itself, pre-incubation of the inoculum
under anaerobic conditions by applying N2 was carried out for 7 days at 37C in order to deplete the residual biodegradable organic material present. When no significant gas production is observed, the sludge is ready to be used. After the pre-incubation step, the pH, TS, VS, COD and MC of the sludge was measured.
3.2.5 Inoculum: substrate ratios (ISR)
Manure samples collected from the different feedlots as outlined in Section 6.1 were used as substrates in the biomethane batch tests. When preparing the experiment, a certain inoculum to substrate ratio (ISR) needs to be chosen. The appropriate ratio depends on the method chosen or the properties of the substrate. An inoculum to substrate ratio of 2:1 (on a VS basis) was used in this study. A total amount of 400 g liquid per reactor (for 500 mL bottle) including 300 ml inoculum and the solid substrate mixed in 100 ml distilled water was used for each batch reaction. An ISR was calculated according to the following equation:
Ratio 2:1 = (Minoculum × VS%inoculum) / (Msubstrate × VS%substrate)
Mtotal = Minoculum + Msubstrate = 400 g
Where M = amount in grams
3.2.6 Blanks and controls
Blank assays containing only sludge (inoculum) and distilled water (1:1) were used to compensate for the amount of biogas produced by the inocula itself (i.e. correct for background methane production from the inoculum. Positive control assays were also set up for every batch using pure cellulose powder (Fluka, Avicel PH-101, ~50µm particle size). Cellulose correlates well with volatile solids and provides an excellent estimate of the readily degradable organic content. The following details are specific for cellulose: TS: 95.5% VS (TS): 99.999% VS (total): 95.534% MC: 4.24%

B.FLT.0368 Final Report – Feasibility of using feedlot manure for biogas production
Page 81 of 117
The average methane yield for cellulose at an ISR of 2: 1 is approximately 350 L methane/kg VS. All blanks
and controls were set up in triplicate and maintained at 37C ± 1C and run at the same time the sample assays were performed.
3.2.7 Preparation of bioreactors and start-up procedure
Triplicates of each combination inoculum-substrate were used:
3 reactors as blanks containing only sludge (inoculum) + distilled water.
3 reactors as positive controls containing only sludge (inoculum) + cellulose in distilled water.
3 x 3 reactors with sludge (inoculum) + manure sample (substrate) All bottles were filled with the same amount of inoculum. For each manure sample, the calculated amount in grams (based on VS) was added to each one of the three replicate reactors. The bioreactors were flushed continuously with N2 for approximately 60 seconds to achieve anaerobic conditions before commencing each batch run. A single batch run was conducted for each manure sample and incubated for 30 to 35 days until methane production plateaued. The data for methane generation rate and accumulation was recorded by a data acquisition system and displayed graphically using computer software.
3.3 Physical characterisation: turbidity, bulk density and settling velocity
Slurries for each of the 5 manure samples from Feedlots 4 & 5 were firstly prepared by mixing a specific amount of manure and distilled water to create slurries with differing total solids content. The samples
were placed in a 1L bottle and shaken for 30 seconds before being stored at 4C for 60 hours to saturate the solid with moisture. The turbidity of the manure slurries were measured at 3 different time intervals; 10 seconds, 5 minutes and 36 hours (Holliday et al 2003). A 2100N turbidimeter (Hach) was used to measure turbidity for triplicate samples. Samples were brought to room temperature before being poured into a 1 litre measuring cylinder. They were then shaken for 10 seconds and then let to settle for 10 seconds before separating the liquid from the settled solids. The turbidity of the water and the weight of the solids were then measured. The separated liquid was again shaken for 10 seconds and then let to settle for 36 hours before separating the liquid from the settled solid. The turbidity of the water and the weight of the solid were similarly measured. Bulk density was determined by weighing the manure samples after being shaken in a 500mL measuring cylinder. Settling velocities were determined based on the method of Lott et al 1994. Settling velocities of different size particles were measured using a 1 L graduated cylinder. The slurry was shaken for 30 seconds and then left to settle for 10 seconds. The solid was separated and then weighed. This process was further repeated using settling times of 5 minutes and 36 hours.
3.4 Pre-treatment systems
Various pre-treatment approaches have been used in the literature, ranging from biological treatment such as incubating with hemicellulose degrading bacterium at 70°C, to thermal (up to 190°C) and thermo-chemical treatment (with acid or alkaline). These approaches, although effective at the laboratory scale, seem too complicated for implementation at a larger scale or commercial feedlots. Two pre-treatment options have been tested. The first option was a simple container with a stirrer and the second involved rolling/crushing the manure before washing it through a sieve with a pressurized water jet. Each of the

B.FLT.0368 Final Report – Feasibility of using feedlot manure for biogas production
Page 82 of 117
approaches was trialled on pen surface manure and freshly scraped pen manure. The hypothesis was that mixing manure with water can produce stratified fractions of different VS and TS contents and the fraction of high VS content can be a suitable feedstock for the AD.
3.4.1 Pre-treatment trial
Approximately 40 kg of freshly scraped pen manure (FSPM) and pen surface manure (PSM) from Feedlot 3 were collected and sub samples were taken by mixing and quartering the larger manure sample. This involved manual disaggregation of the manure clods before it was mixed, divided into quarters and sub samples were taken from one of the quarters. A simple pre-treatment system was developed using a 100 L wheelie bin (See Figure 2).Two valves were attached via bulk heads at a diameter of 25mm. Centres of the two outlets were 50 mm and 250 mm from the bottom of the bin, drawing the manure mixture from the mid and bottom layers. Manure samples were mixed with water to a total of 50 L to achieve estimated TS contents from 1% to 6%. A paint stirrer (1050 W, 500 rpm) was used to mix the contents for approximately 3 min at a depth of about 50-mm from the bottom of the bin. Two sampling approaches were tested: the first was to immediately sample from the outlets after stirring, the second was to leave the mixture settle for about 40 min after stirring and then sample from the outlets. For each approach, a small sample (approximately 1 L) was taken from each of the outlets and sent to lab within about two hours.
Figure 20 - Pre-treatment trial 1. Left: illustration of pre-treatment system; right: mixing manure with water by stirrer
Initial visual and handling inspections of the solids residue remaining at the bottom of the bin during the initial scoping (Trial 1) illustrated the need for an alternate approach to disaggregating and mixing the manure substrates. A revised approach was theorised involving two additional physical processes: crushing; and water pressure. The revised approach (Trial 2) used approximately 5 kg of the mixed sample. This was spread evenly onto a wooden sheet. The large clods were initially crushed with the broad side of a sledge hammer to provide a more consistent thickness across the sample. The sample was then spread across the board and a secondary board was placed on top before mass was applied. Approximately 75 kg was applied to further ‘roll’ the manure into a thin ‘cake’ with a uniform thickness between 20-30mm. After rolling, the manure was added to a 10mm sieve for further processing. A rotating water jet from a Karcher® pressure cleaner was applied to the manure to break up manure clods (See Photograph 48).
373
mm
mid layer
bottom layer50 mm
250
mm
top layer

B.FLT.0368 Final Report – Feasibility of using feedlot manure for biogas production
Page 83 of 117
Photograph 48 – Operation of the pressure cleaner to break up manure clods
A minor revision was applied in Trial 3, where manure was soaked in water for about 30 min before washed through the sieve. Enough solids to produce a theoretical 6.1% (for PSM samples) and 6.7% (for FSPM samples) TS content inside the 50L bin were prepared. The treated slurry from the sieving procedure was added to the bin used in the initial trial. Where required additional water was added to ensure the TS contents were closer to the values of initial mixer experiments. Detailed in Photograph 49 is the only alteration made to the bin during Trial 2 and 3, which was the installation of a third sample point directly in the centre of the bin bottom. This valve was included to allow sampling of the very bottom sludge layer. The electric stirrer was again used to suspend the manure and check the evenness of mixing throughout the water column. After three minutes of mixing, samples (<1 L) from each port were taken while the mixer was still operational.
Photograph 49 – Positioning of the three sample valves
4. Results and discussion
4.1 Manure characterisation
4.1.1 Chemical composition
The results from the characterisation analyses of fresh, pad and stockpiled manure samples are displayed in Table 12 – Chemical components of the fresh, pen, and stockpile manure from feedlot 1, 2 and 3.

B.FLT.0368 Final Report – Feasibility of using feedlot manure for biogas production
Page 84 of 117
Analysis of the organic matter content in the form of lignin, fat (lipid), volatile fatty acids (VFA), cellulose, hemicellulose, starch and protein are also found in Table 12 – Chemical components of the fresh, pen, and stockpile manure from feedlot 1, 2 and 3. Starch was not analysed for F1 SM, F1 PSM and F2 PSM. Not all sample components resulted in a full mass balance of all organic matter. It was noted that the levels of lignin were particularly high for F3 PSM, F3FM and F3 FSPM. Also, protein levels for these samples were not estimated due to variances in the total Kjeldahl nitrogen (TKN) and NH4-N values.
Table 12 – Chemical components of the fresh, pen, and stockpile manure from feedlot 1, 2 and 3
Unit
F1 SM
F1 PSM
F2 PSM
F3 PSM F3 FM F3 FSPM
TS %wb 73.0 52.5 74.2 39.5 20.7 50.6
VS %TS 42.4 81.4 72.9 77.2 87.9 75.2
Lignin (measured) %TS 2.4 4.5 5.0 17.8 21.3 16.2
Lipid (measured) %TS 0.7 1.3 1.4 0.6 2.3 0.5
VFA (measured) %TS 0.1 1.9 0.5 0.02 0.54 0.05
Cellulose (measured)
%TS 16.0 24.5 27.2 18.4 15 18.2
Hemicellulose (measured)
%TS 7.4 22.8 17.9 17.3 18.7 15.2
Starch %TS - - - 3.5 3.3 3.7
Protein (est.) %TS 13.8 13.9 14.3 - - -
Measured & est. VS %TS 42.4 70.9 68.4 77.16 87.5 74.3 Measured & est. VS as a proportion of total VS
% 100% 87% 94% 100% 99.5% 98.8%
Table 16 shows that VS contents of pen surface manure ranged from 72.9 to 81.4 TS while VS for stockpile manure was 42.4 (%TS). This is in keeping with the higher VS contents found in Australian harvested pen manure compared to US feedlots. In contrast to US feedlots, most new Australian feedlots have a pen surface that was well compacted, often gravelled and levelled prior to cattle entry. Pen cleaning usually aims to leave a shallow interface layer of manure so as not to disrupt the compacted pen surface. Hence, in most Australian feedlots, the amount of soil removed during pen cleaning should be minimal. Figure 21 A, B and C - Components of manure samples A) F1 SM, B) F1 PSM and C) F2 PSM based on dry basis illustrates the ash and organic components (%TS) of pen surface manures from two feedlots (F1 PSM and F2 PSM) and one stockpile manure (F1 SM). The pie charts include the calculated ash content for all 3 manure samples and incorporate a portion of ‘unknown’ organic matter which is likely to be starch and other sugars as mentioned above.

B.FLT.0368 Final Report – Feasibility of using feedlot manure for biogas production
Page 85 of 117
C)
Figure 21 A, B and C - Components of manure samples A) F1 SM, B) F1 PSM and C) F2 PSM based on dry basis
The chemical compositions of the two pen manure samples (F1 PSM and F2 PSM) were very similar. F1 SM (stockpile manure) shows a high proportion of ash content (55%) compared to the pen surface manures, F1 PSM and F2 PSM, which were 8% and 12% respectively. Conversely the amount of organic matter constitutes the larger portion for pen surface manure samples. The biomethane potential results show a similar relationship where the high organic contents of PSM samples produce greater methane potential (See Figure 22).
2%
1% 0%
16%
7%
14% 55%
5%
Lignin(measured)
Lipid (measured)
VFA (measured)
Cellulose(measured)
Hemicellulose(measured)
4% 1% 2%
25%
23% 14%
8%
23%
Lignin(measured)
Lipid(measured)
VFA (measured)
Cellulose(measured)
5%
1% 1%
27%
18% 14%
12%
22%
Lignin (measured)
Lipid (measured)
VFA (measured)
Cellulose(measured)Hemicellulose(measured)Protein (est.)
A)
B)

B.FLT.0368 Final Report – Feasibility of using feedlot manure for biogas production
Page 86 of 117
4.1.2 Physical characteristics
Table 17 below provides data on turbidity; bulk density and settling velocities for the 5 manure samples (see section 6.1.2 for sample details).
Table 17- Physical characteristics: turbidity, bulk density and settling velocities for 5 manure samples
Manure Sample
Bulk Density (Kg/m3)
Time Turbidity (at 5% TS)
Settling velocity (at 5% TS) Fraction settled (%) m/s
F4 FM 1160 10 s 187 82.5 0.003 5 min 115 0.87 1.0 x 10⁻⁴
36 hr 48.46 0.74 2.3 x 10⁻⁷
F4 PSM 1040 10 s 2248 69.8 0.003 5 min 1905 10.8 1.0 x 10⁻⁴ 36 hr 246 4.6 2.3 x 10⁻⁷
F4 SM 1600 10 s 988 85.2 0.003 5 min 719 3.2 1.1 x 10⁻⁴ 36 hr 131 2.1 2.4 x 10⁻⁷
F5 PSM 1170 10 s 392 93.0 0.003 5 min 242 1.6 1.0 x 10⁻⁴ 36 hr 56 0.75 2.3 x 10⁻⁷
F5 SM 1720 10 s 2906 91.1 0.003 5 min 2668 2.1 1.1 x 10⁻⁴ 36 hr 679.6 3.4 2.4 x 10⁻⁷
Analysis on the settling rates of feedlot manure found that a large percentage of solids (69.8 to 93.0%) could be removed quickly with a settling velocity of >0.003m/s based on the methods used in the study. This is in contrast to Lott et al. (1994) who found that 35 to 75% of solids could be removed quickly with a settling velocity of >0.003m/s, assuming a depth of 1.8m this is a removal time of 10 minutes.
4.2 Methane yields (BMP)
Figure 22 below, details the methane production (in L methane produced per kg VS added) obtained from each manure sample at the end of anaerobic digestion.

B.FLT.0368 Final Report – Feasibility of using feedlot manure for biogas production
Page 87 of 117
Figure 22 - Methane yields from three manure types originating from three feedlots
Table 13 below, displays the biomethane potential (Bo) of all manure types for the three feedlots after 32 days of incubation.
Table 13 - Biomethane potential (BMP) of fresh (FM), pen surface (PSM), freshly scraped pen manure (FSPM), and stockpile (SM) manure from feedlot 1, 2 and 3 after 32 days incubation
Unit F1 SM F1 PSM F2 PSM F3 PSM F3 FM F3 FSPM
Total CH4 produced
(L/kg VS) 13 118 175 173 218 135
VS %TS 42.4 81.4 72.9 77.2 87.9 75.2
Total methane produced for fresh, pen surface and freshly scraped pen surface manure ranges from 118 to 218 L/kg VS, while stockpile manure produces relatively low levels of methane (13 L/kg VS). Gopalan (2013) measured BMP values of 200 L/kg VS stockpile manure (See Table 8 above) which is much higher than the 13 L/kg VS found in the current study. Given the high ash content measured in stockpile manure (55%) (Figure 23 A) it is assumed that a BMP value of 13 L/kg VS for stockpile manure would be a more realistic value and the use of stockpile manure as a feedstock for biogas production would not be economically feasible. In addition, the range of BMP values for pad manure (118-175 L/kg VS) and fresh manure (218 L/kg VS) are comparatively lower; Gopalan (2013) measured BMP values as high as 350 and 280 L/kg VS for fresh and pad manure respectively. Table 14 below, presents BMP values for pen surface manure from 3 different feedlots. Whilst it is difficult to compare the BMP values of pen surface manure given the limited information available it is noted that pad manure harvested within 6 weeks produces has a higher BMP value (173 L/ kgVS ) compared to pad manure left for over 6 months (118 L/ kgVS).
0
50
100
150
200
250
0 5 10 15 20 25 30 35
Tota
l CH
4 p
rod
uce
d (
L/kg
VS)
Time, days
F2 PSM
F1 PSM
F1 SM
F3 FM
F3 PSM
F3 FPSM-NF3 FPSM
0500
0
T…
Tim…

B.FLT.0368 Final Report – Feasibility of using feedlot manure for biogas production
Page 88 of 117
Table 14 - Comparison of feedlot pen surface manure - BMP and age of pen surface manure
F1 F2 F3
Steam flacking Yes No Yes
Manure collection date
Jan 31st 2014 Feb 5th 2014 Jun 18th 2014
Age of pen surface manure (weeks elapsed since last pen cleaning)
25 n.r. a 6 b
Rainfall events Unknown Unknown 6mm 2 days prior
BMP results (L/kg VS) 118 175 173 a not reported by feedlot manager;
b estimated by feedlot manager
Figure 23 below provides data from one feedlot for 3 manure types. The methane yields for fresh and pen surface manure were 218 L/kg VS, and 173 L/kg VS, respectively. This represents a 20% decrease in BMP between fresh manure and pen surface manure harvested at 6 weeks. Freshly scraped manure resulted in slightly lower BMP (135 L/kg VS) compared to pen surface manure.
Figure 23 - Methane yields from three manure types (fresh, pen surface and freshly scraped pen) types originating from one feedlot
4.3 Preliminary pre-treatment trials
Table 15 details the TS and VS contents of the various manure samples collected before treatment.
0
50
100
150
200
250
300
350
400
0 5 10 15 20 25 30 35
Tota
l CH
4 p
rod
uce
d (
L/kg
VS)
Time, days
Cellulose
F3 FM
F3 PSM
F3 FPSM-NF3 FSPM
0500
0
T…
Tim…

B.FLT.0368 Final Report – Feasibility of using feedlot manure for biogas production
Page 89 of 117
Table 15 - Chemical components of the fresh, pen and stockpile manure from feedlot 1, 2 and 3
Unit
F1 SM
F1 PSM
F2 PSM
F3 FM F3 PSM F3 FSPM
TS %wb 73.0 52.5 74.2 20.7 87.5 47.8
VS %TS 42.4 81.4 72.9 87.9 75.1 68.6
4.3.1 Effect of stirring on particle sizes
Pre-treatment was only performed on manure from Feedlot 3 in the preliminary trial. Due to the rainfall event (6 mm) two days before manure sampling, pen surface and freshly scraped pen manure samples had higher moisture content than pen manure samples from Feedlot 1 and 2. The stirring reduced manure particle sizes from 50-100 mm to less than 30 mm (See Photograph 50).However, this was found to be limited and large clogs (15-30 mm) could still be found at the bottom of the mixing bin.
Photograph 50 – Particle sizes of freshly scraped pen manure from feedlot 3 before (bottom) and after (top) the pre-treatment
4.3.2 Effect of pretreatment on TS and VS contents
In Trial 1, both pen surface and freshly scraped pen manure mixes had a higher TS content in the bottom layer than the mid layers, reflecting that complete mixing was not achieved inside the vessel. The differences became more obvious as the TS content increased (See Figure 24). The measured TS content of the freshly scraped pen manure mixture reflected the predicted TS for the three trials. Figure 28 also details the initial results from the FSPM mixing trial. The results show a minor increase in TS content as the theoretical TS increase rose, but the measured values were far below the expected values, demonstrating that the standard mixing procedure was inadequate to breakup and suspend PSM.

B.FLT.0368 Final Report – Feasibility of using feedlot manure for biogas production
Page 90 of 117
Figure 24 - Calculated and tested TS% (wb) of freshly scraped pen manure (FSPM) and pen surface manure (PSM) from feedlot 3 through top, middle, bottom and base layers of the pre-treatment system
The trial results of the FSPM mixing accurately reflected the calculated TS loads which were put into the bin. This is attributed to both the lower TS loading (1 - 4%), which is within the mixing capability of the stirrer and the higher moisture content. As the substrate was softer and wetter, the manure was able to be incorporated into the mixed water column a lot quicker. Further testing will need to be completed at increased TS% between the 4-8% range.
4.3.3 Effect of secondary pre-treatment on particle size
The secondary treatment option was tested on each of the substrates at one calculated TS%. The PSM was trialled at 6.1% and the FSPM was trialled again at 6.7%. A major change in the solid state and consequently the mixing of the manure was achieved with the revised technique. The most important effect of the manure rolling was to break up the hard outer crust which forms around the surface of the manure substrate. Testing found this was most relevant to the crustier pen surface manure. By breaking through this outer layer, the water jet was able to cut through the manure clods and the manure was pushed to through the 10mm holes much quicker than when the jet was applied to raw manure. The reduced thickness from the rolling allowed a uniform approach to the manure spraying which reduced the time required to disperse the particles. The oscillating circular jet was the most effective; a broader ‘single line’ spray did not have the same cutting power. At the end of the washing period only gravel and tough clods greater than 10mm remained (See Photograph 51). The wet manure that passed through the sieve resembled slurry with the consistency of fresh cattle manure (See Photograph 52).
0.0
2.0
4.0
6.0
8.0
0.0 2.0 4.0 6.0 8.0
Me
as
ure
d T
S%
Calculated TS%
Trial 1 - PSM middle
Trial 1 - PSM bottom
Trial 1 - FSPM bottom
Trial 1 - FSPM middle
Trial 3 - PSM top
Trial 3 - PSM middle
Trial 3 - PSM bottom
Trial 3 - PSM base
Trial 3 - FSPM top
Trial 3 - FSPM middle
Trial 3 - FSPM bottom
Trial 3 - FSPM base

B.FLT.0368 Final Report – Feasibility of using feedlot manure for biogas production
Page 91 of 117
Photograph 51 – Gravel and tough manure clods after cleaning
Photograph 52 – Wetter manure slurry after pressurized washing
As the revised approach to the methodology between trial 2 and 3 varied slightly the results of trial 3 were reported. The laboratory TS results from Trial 2 were similar with Trial 3 except that top layer was not sampled during trial 2. The laboratory TS results from Trial 3 are illustrated in Figure 28. The results indicate differences in TS content between the various sample layers. With the decreasing particle size, the recovery rate of input TS to recorded TS was up to 70%. Similarly to Trial 1, it is believed that the mixer may be forcing solids into the corner of the bin, which did not allow sampling.
4.4 Proposed physical design parameters of a feedlot biogas plant
The literature review provided examples of successful manure-based biogas plants operating in both Australia and the USA, mainly for dairy and pig operations. Key components of the technology already

B.FLT.0368 Final Report – Feasibility of using feedlot manure for biogas production
Page 92 of 117
exist and are proven technologies. However, only a few biogas plants based on feedlot manure exist across the world. Hence, it is necessary to identify the key features and constraints of a feedlot system that require adaption in the design of a biogas facility. This is outlined in following sections.
4.4.1 Manure harvesting
To maximise methane yield and minimise in-digester sludge accumulation, fresh manure should be skimmed frequently from the pen surface without contamination by soil and gravel. Photograph 53 documents that, with a good pen surface and utilisation of box scrapers, it is possible to only remove fresh manure from the pen surface, leaving the compacted manure interface layer intact. Photograph 54 documents manure being mounded within pens. This manure would then loaded into body trucks and taken to the biogas unit (See Photograph 55).
4.4.2 Manure screening
Freshly-scraped pen manure should be used as soon as possible to minimise methane potential loss. However, some provisions for short-term storage adjacent to the biogas facility should be made. Regardless of the quality of pen manure harvesting, the manure should be screened. Existing technology includes vibrating screens (some with multiple screen options – See Photograph 56) or rotating trommels (See Photograph 57). The final screen size should be 10 mm (See Photograph 58) to ensure that large contaminants are removed and the manure clods are broken down into small particles which will readily dissolve in the mixing tank. A percentage of the harvested manure will be rejected. This percentage will depend on the moisture content and age of the manure and the degree of contamination with rocks and gravel. The reject material would be taken to the existing manure stockpile area. The use of wet manure is not desirable as methane potential has probably already been lost and screening of wet manure is difficult. One option for screening wet manure is to use a trommel that includes sprays to wash the manure through the 10 mm screen. This technology is already used for washing vegetables such as carrots (See Photograph 59). A large trommel, such as that documented in Photograph 60, could be adapted to include internal sprays and a washed manure collection tray underneath. Alternatively, wet manure could be washed using a vibrating screen such as used in the mining industry. In both cases, wash-water would be supplied, initially from the feedlot holding pond until the mixing tank has reached operating capacity after which water would be recycled from the mixing tank over the screen until the digester influent has reached the design solids content. The feedlot holding pond would then only be required to “top up” the mixing tank on an as required basis.

B.FLT.0368 Final Report – Feasibility of using feedlot manure for biogas production
Page 93 of 117
Photograph 53 – Pen cleaning of surface material only
Photograph 54 – Manure handling within pens

B.FLT.0368 Final Report – Feasibility of using feedlot manure for biogas production
Page 94 of 117
Photograph 55 – Manure removal from pens
Photograph 56 – Three-way vibrating screen

B.FLT.0368 Final Report – Feasibility of using feedlot manure for biogas production
Page 95 of 117
Photograph 57 – Rotating Trommel
Photograph 58 – 10mm screen size

B.FLT.0368 Final Report – Feasibility of using feedlot manure for biogas production
Page 96 of 117
Photograph 59 – Carrot washer
Photograph 60 – Wet vibrating screen
4.4.3 Mixing tank
The influent to the digester should have a solids content of 4-6% total solids with the organic matter broken down into small particles, fully saturated and dissolved. The output from the screening system should be prepared in a pre-mixing tank rather than directly inserted into the digester. This project could find no evidence that higher VS contents could be found at different depths within a mixing tank. Hence, the whole tank should be actively mixed so that no residue is left when the influent is pumped to the
B.FLT.0368 Final Report – Feasibility of using feedlot manure for biogas production
Page 97 of 117
digester. Float switches can automate the pumps and mixers (See Photograph 61). The devices that keep the influent fully mixed can be either water jets or propellers (See Photograph 62). Effluent with high solids content needs to be conveyed with specially designed pumps. The best option is positive displacement pumps (See Photograph 63). If further break-down of the solids is required after the mixing tank, in-line macerators can be used (See Photograph 64).
Photograph 61 – Mixing tank with delivery of manure by conveyor
Photograph 62 - Jet and propeller mixers in mixing tank

B.FLT.0368 Final Report – Feasibility of using feedlot manure for biogas production
Page 98 of 117
Figure 25 - Five versions of in-tank mixers by GEA
Photograph 63 – Positive displacement slurry pumps

B.FLT.0368 Final Report – Feasibility of using feedlot manure for biogas production
Page 99 of 117
Photograph 64 - In-line macerator
4.4.4 Digester
It is proposed that covered anaerobic ponds (CAPs) should be used rather than large in-tank anaerobic digesters. CAPs have a lower capital cost. The larger foot print is not an issue for feedlots. CAPs are a proven technology in Australia and can be designed with a long hydraulic retention time (HRT) which caters for less-exact influent management. The technology employed to capture the biogas generated by CAPs is relatively simple. An impermeable cover extends across the surface of the pond with its edges buried in the embankment to prevent gas loss and, more importantly, air entry. CAPs are designed in much the same manner as uncovered anaerobic ponds. Current recommendations for designing a CAP are to construct a steep-sided, deep pond (e.g. 6 m) with a length to width ratio of 3:1. These ponds are designed with a hydraulic residence time of 40-50 days. Photograph 65 documents an example of a CAP at a piggery. Pond covers are constructed from 1.0-1.5 mm high quality geo-membrane cover such as low-density polyethylene (LDPE) or polypropylene (PP). High-density polyethylene (HDPE) - is also used. However, it is generally more difficult to install and there are problems associated with heat expansion.

B.FLT.0368 Final Report – Feasibility of using feedlot manure for biogas production
Page 100 of 117
Photograph 65 – Covered anaerobic pond (CAP)
4.4.5 Biogas handling and use
The handling and use of biogas produced from CAPs is an existing and proven technology. This will not be discussed further in this report.
4.4.6 Digester sludge removal
Sludge removal from CAPs presents specific difficulties as the cover cannot be removed during the operational phase. There are essentially three methods of sludge removal from CAPs. They are: 1. In-situ desludging. In this approach, the solids settle to the base of the CAP and are removed by
pumping via a pre-installed pipeline. 2. Suspension removal. In this approach, the solids are not allowed to settle. They are kept in
suspension using agitators inside the CAP. The solids are removed as part of the effluent flow out of the CAP.
3. Life-time accumulation. In this approach, solids are allowed to settle but are not removed until the operational life of the pond cover is reached and the cover is removed. In this approach, a large sludge-accumulation volume is needed to be designed as part of the internal volume of the CAP. Suspension removal requires the installation of agitators under the pond cover. This adds cost and, experience from the USA suggests that the agitators can be affected by contaminants in the feedlot manure. Life-time accumulation is not recommended as experience from the USA suggests that sludge accumulation rates can be high and thus the life-time might be quite short. For feedlot manure, regular in-situ desludging is the best option.
In-situ desludging Continuous or semi-continuous sludge draw-off is desirable for CAPs (Watson 1999). This is done by laying a network of pipes at the base of the pond and sucking the sludge out through inlets on the pipes (See Figure 26 – Watson, 1999). Photograph 66 & 67 document the installation of sludge removal pipes in a high-rate treatment pond (Goulburn Valley Water). Photograph 68 documents the ends of sludge removal pipelines extending beyond the pond covers.

B.FLT.0368 Final Report – Feasibility of using feedlot manure for biogas production
Page 101 of 117
Figure 26 - Desirable layout of anaerobic pond to facilitate desludging (Watson 1999)
Usually, conventional positive-displacement (See Photograph 63) or vacuum pumps are used to remove sludge. Air-lift pump systems have been suggested for sludge draw-off due to their minimal blockages, ability to pump high solids concentrations and to mix sludge (Watson 1999). Compressed air is injected through the air supply line to the lower part of the sludge draw-off pipe, and as the air bubbles upwards through the pipe, the liquid can be taken together with the air flow (Figure 27 - Airlift pump (Watson 1999)). However, limitations of using air-lift pump include that the specific gravity of sludge needs to be close to 1.0 and the flow rate can be limited. More importantly, for desludging covered ponds, strategically located mechanical mixers need to be used to prevent the introduction of oxygen under the gas collection cover and the generation of a potentially explosive atmosphere (Watson 1999).
Figure 27 - Airlift pump (Watson 1999)
The main problem with submerged pipes is that they are only effective for removing the sludge near the inlet holes. After a period of time, a sludge void may develop near the inlet holes and the sludge removal will become much less effective. Mechanical scrapers may be used to push the sludge closer to the pipes but this is not likely to be cost-effective or practical for feedlot applications. A few features of pond layout have been suggested to facilitate the in-situ desludging (Watson 1999). These include:
using deep ponds to increase sludge flow to draw-off pipeline
using long narrow ponds to permit draw-off from side of pond
providing two inlets to the pond, discharging towards the sides of the pond to preferentially deposit heavy sludge components closer to draw-off point
providing sludge discharge channels alongside the pond to receive removed sludge and discharge to the sludge processing area.

B.FLT.0368 Final Report – Feasibility of using feedlot manure for biogas production
Page 102 of 117
The report by Butler and Johns (2012) on the design and operation of a CAP treating red meat processing waste water illustrates a general issue with sludge removal from a covered pond. If sludge removal is frequent, the sludge is likely to be relatively low TS and be fluid so that it can easily be pumped. However, the sludge would not be completely digested thus losing methane generation potential. It is strongly recommended that frequent sludge removal occurs to avoid consolidation of sludge under the cover and loss of active volume rather than being concerned about incomplete methane production.
Photograph 66 – Installation of sludge removal pipe system
Photograph 67 – Installation of sludge removal pipe system

B.FLT.0368 Final Report – Feasibility of using feedlot manure for biogas production
Page 103 of 117
Photograph 68 – Sludge extraction pipelines (deflated pond cover)
4.4.7 Sludge and effluent dewatering
The effluent leaving the CAP, although digested, still contains some solids. This effluent, as well as the removed sludge, needs to be dewatered. The dewatered solids contain the original nutrients (N, P and K) in the pen manure and are thus a valuable resource which should be used. Feedlots are already accustomed to using dried organic materials as organic fertilisers. There are many methods available for removing solids from effluent streams. In the feedlot biogas plants visited in the USA, complex, high-cost and technically sophisticated options had been chosen. This included belt presses with polymer additives, various rotating screens, sand filters and other machinery. In Australia, feedlots are accustomed to a much simpler method of solids removal from effluent. These are sediment basins that remove solids from feedlot runoff. Similar techniques (i.e. settling basins) can be used to dewater digester effluent and sludge. A large foot print is required but this should not be an issue at a feedlot. The settling basins would be installed so that they drained into the existing feedlot holding pond. The dried sludge would be removed and handled as per existing manure handling methods. Due to the constant inflow of effluent, a system of multiple settling basins – some in use and some drying – would be required. This is a low-cost, low-technology option. There are two options for settling basins. One is short-term drying bays. The other is a Sedimentation and Evaporative Pond System (SEPS), which is used in some Australian piggeries.
4.5 Economic assessment of a feedlot biogas system
4.5.1 Proposed biogas system design and indicative cost
Current feedlot manure management in solid form offers little opportunity for current digester designs. Aside from slatted floor feedlots in the United States, there are few successful examples of biogas developments using feedlot pen manure from traditional open air earthen feedlots. The following flow chart provides some key elements of a biogas system potentially suitable for handling feedlot manure for use as a single substrate for biogas production. Central to this system is the use of a CAL which has been identified as a suitable technology for feedlots. For most large feedlots, the greatest

B.FLT.0368 Final Report – Feasibility of using feedlot manure for biogas production
Page 104 of 117
energy usage is gas to fire the boiler for the steam flaker. This is the basis of the simple economic assessment outlined below.
Figure 28 – Flow chart incorporating key elements of a proposed biogas system suitable for feedlots
A simple techno-economic feasibility for a 10,000 SCU using pen surface manure that is less than 60 days old (BMP 170 L CH4/ kg VS at a VS of 76%) shows that the methane required for steam flaking is similar to the amount of methane produced from a 42 ML covered anaerobic lagoon. The following assumptions have been made:
Grain consumption of 23,500 tonnes/year
Requires thermal energy of 285 MJ/T grain for steam flaker which is equivalent to about 6,700,00 0 MJ/yr
The equivalent methane requirements for feedlot grain processing is 195,000 m3 CH4/yr
Maximum methane production from covered anaerobic lagoon is 230,000 m3 CH4/yr A 42ML sized covered anaerobic lagoon has been estimated as a suitable maximum size to treat the amount of waste produced by a 10,000 SCU feedlot. It is important to note that this represents a maximum size to factor in sludge accumulation which can reduce the working volume of lagoons. Smaller sized lagoons (10ML to 20ML) can also be suitable if more elaborate in-situ desludging mechanisms are incorporated into the design. Broad cost examples of covered anaerobic lagoons are provided in a report commissioned by AMPC and MLA (Laginestra, 2012). The report uses costs which are based on varying sized abattoirs. In addition, sizing of lagoons, gas production and costs of covered anaerobic lagoon itself has been adopted from general industry experience and unit rate values. Based on this report the indicative cost for a 42ML lagoon is approximately $3,200, 000. This price includes generic costs of:
Anaerobic lagoon excavation, cut and fill
Lagoon liner
Covered anaerobic lagoon cover

B.FLT.0368 Final Report – Feasibility of using feedlot manure for biogas production
Page 105 of 117
Biogas flare
Scrubber
Ancillaries, pipework and installation
Contingencies, design, engineering (35%) This estimate is the cost of the covered anaerobic lagoon and assumes all machinery required for the operation of the system will require purchasing. In reality, a feedlot may have some of the required equipment including the stockpile area, rotary screen, equipment shed, etc. Additionally, while much of the machinery cost is fixed, the option to drive down the construction cost of the system is available if participating feedlots introduce various measures including, but not limited to:
Use of materials to meet the minimum safety requirements for biogas use as per the Code of Practice for on-farm biogas production and use (Piggeries) (APL 2015) (e.g. use of buried polyethylene or PVC, rather than stainless steel for biogas transfer lines); and
Self-management of the construction process.
4.5.2 Fertilizer sales
The likely impact on fertilizer sales is reported in Table 16.This table compares the income of manure sold as fertilizer with the anticipated income from selling the dried anaerobic digestate (dried sludge) and excess manure. The process of anaerobic digestion has a negligible impact on the total availability of Nitrogen, Phosphorous and Potassium available as these key elements are not affected by organic matter breakdown. The digestate material has a number of key attributes which will invariably increase the quality of fertilizer and increase the purchase price. These attribute include: the fertilizer is odourless; stable (no leaching); contains high level of organic matter; increased percentage of N, P and K/kg of fertilizer; and an increased bulk density. This means that less volume of fertilizer must be transported and less fertilizer needs to be applied to the land to achieve the same NPK application rates. Table 15 illustrates that a sale price of approximately $36/tonne of dried digestate will provide the same annual income as selling all manure as fertilizer. Realistically, a conservative price for the dried digestate is $60/t (same price as composting), which will result in a revenue increase of $33,000/year.
Table 16 – Comparative income of manure and digestate as fertilizers
Scenario Fertilizer Products
Sale Price ($/t)
Tonnage (t/yr)
Revenue ($/yr)
Existing Raw manure $ 8 8 995 $ 71 959
Total 8 995 71 959
Break Even Digestate Price
Digestate $ 36 1 388 $ 50 394
Raw Manure $ 8 2 696 $ 21 565
Total 4 083 $ 71 959
Conservative Digestate Price
Digestate $ 60 1 388 $ 83 268
Raw Manure $ 8 2 696 $ 21 565
Total 4 083 $ 104 834
Maximum Digestate Price
Digestate $ 200 1 388 $ 277 562
Raw Manure $ 8 2 696 $ 21 565
Total 4 083 $ 299 127

B.FLT.0368 Final Report – Feasibility of using feedlot manure for biogas production
Page 106 of 117
4.5.3 Emissions Reduction Fund (ERF)
Currently there is no methodology addressing the disposal of, and emissions related to feedlot manure. To achieve benefit from the ERF would need to reduce GHG emissions below the existing baseline. The existing baseline would involve harvesting and stockpiling manure until it could be used for land application. In this baseline scenario, the emissions produced would be restricted to the low penitential GHG CO2. In the proposed biogas system, the burning of CH4 to reduce CH4 impacts is not considered a reduction in GHG, as the emissions were purposefully generated above the baseline by altering the manure treatment method. Additionally, the key issue with an anaerobic digester is emission leakage. Emission leakage from anaerobic digesters results in the emission of CH4, a far more potent GHG with a CO2-equivalence of 25 (i.e 1 CH4 molecule has the same impact as 25 CO2 molecules). Hence, if emissions leakage occurred, the likelihood exists that the system would result in emissions exceeding the current baseline.
5. Conclusions and recommendations
The purpose of the project was to provide a techno-economic assessment of using feedlot manure as a substrate for biogas production. In order to do this the project undertook:
a comprehensive literature review on the application of existing anaerobic digestion technologies and current Australian feedlot manure handling practices,
measurement of biomethane potential (BMP) of feedlot manure to gain a better understanding of the true biomethane potential of this feedstock, and
a techno-economic feasibility of a proposed 10,000 SCU manure-biogas development. The literature highlights that the economic value of feedlot manure for anaerobic digestion is largely determined by the composition (quality) of the manure. Pen cleaning timing, frequency and method affects the quality of the manure removed. This wide range of VS content in material harvested from feedlot pens demonstrates the influence of pen design and management on the quality of manure removed from the pens. Data from these feedlots suggest that the material harvested contains material other than manure. This additional material (e.g. rocks and/or soil) influences the results by increasing quantity of material harvested and lowering the organic content. This is consistent with US feedlots where “feedlot soil” is harvested. This data in the literature highlights the need to be fully aware of the circumstances behind pen manure samples. The BMP laboratory experiments in this study clearly reflect this. For example, a direct comparison can be made between 3 manure types from a single feedlot. The methane yields for fresh manure and pen surface manure harvested at 6 weeks resulted in 20% reduction in BMP value. Freshly scraped manure resulted in a reduction of 38% of fresh manure BMP. This study also revealed for the first time that stockpile manure has relatively low BMP value, rendering this substrate inappropriate for use as a feedstock for biogas production. However, a full understanding of the BMP value of stockpile manure should be undertaken by analysing multiple samples at different feedlots. The differences in ultimate methane yields has been highlighted in the literature and can be due to various factors including incubation temperature, source and amount of inocula added, timing and mixing of sample, amount of dilution of the sample and incubation time. The use of specialist anaerobic digestion testing in this study provided real-time performance data at a high level of accuracy and precision and used appropriate methodology to reduce variability. Ensuring the capture of manure before significant degradation occurs and the minimisation of contamination during pen cleaning is the most effective but may not be the most viable approach given the necessity of dramatic change in feedlot manure management and increased pen maintenance costs.

B.FLT.0368 Final Report – Feasibility of using feedlot manure for biogas production
Page 107 of 117
Pen cleaning without the removal of the interface layer will reduce the amount of soil and other non-degradable materials in the harvested manure. More frequent pen cleaning may be an option. Some form of “selective” cleaning where only fresh faeces is removed would significantly improve the methane potential of the removed material but this would require a pen cleaning technology that does not currently exist. Based on the experimental work undertaken in this project and information gained on study tours, the following recommendations should be considered: 1. Feedlot manure readily degrades on the pen surface and the methane potential of the manure
decreases significantly. Hence, manure must be harvested frequently and loaded into the digester quickly.
2. Feedlot manure is often contaminated with soil, gravel and other physical contaminants. However, good pen design and careful cleaning can minimise that contamination, albeit at an increased cost.
3. Irrespective of the quality and frequency of pen cleaning, some soil, gravel and hair contamination will occur. The biogas digester must be designed to cater for frequent removal of large quantities of settled sludge (soil, gravel, hair, silica from feed).
4. Due to the degradation and loss of methane potential that has occurred during stockpiling and composting, this degraded manure cannot be economically used for biogas production. However, the manure stockpile areas are suitable for handling dewatered sludge.
5. For most large feedlots, the greatest energy usage is gas to fire the boiler for the steam flaker. Hence, biogas can be used directly as a gas rather than used for electricity generation. This reduces the cost and complexity of handling the biogas.
6. Feedlots already use large machinery for manure and feed management (front-end loaders, box scrapers, body trucks, vibrating or rotating screens). The biogas system should be designed to use existing equipment.
7. Currently, the nutrients in manure are a saleable resource at feedlots. The biogas system should ensure that key nutrients (N, P and K) can still be used as organic fertiliser.
8. As feedlots are always located on large areas of land with good separation from neighbours, land area constraints do not apply. A small foot print for the facility is unnecessary.
9. All feedlots have a holding pond which captures contaminated runoff from the pen area. This can provide a water source for the biogas plant that already contains some organic matter.
10. As energy and cattle costs can vary considerably, the capital cost of the facility must be kept as low as possible. Low-tech solutions should be considered before complex, high-technology solutions.
11. Lot feeders are experts in feeding cattle, not operating an industrial facility. The design of the biogas system should not require precision control.
Using these design considerations, a feedlot biogas system can be proposed. Due to these constraints, the type of Australian feedlot most suited to a viable biogas system would: 1. Be located in a low-rainfall and/or summer-dominant rainfall zone to maximise the availability of
dry manure. 2. Have well-design and constructed smooth pen surfaces with little gravel. 3. Have a capacity of 10,000 head or more and be run at high occupancy. 4. Have a steam flaker and boiler system to use the biogas. A simple techno-economic feasibility for a 10,000 SCU using pen surface manure that is less than 60 days old (BMP 170 L CH4/ kg VS at a VS of 76%) shows that the methane required for steam flaking is similar to the amount of methane produced from a 42 ML covered anaerobic lagoon. This study has been successful in identifying the appropriate design criteria in terms of cost and the parameters of feedlot manure that lead to highest biomethane potential. However, there are few

B.FLT.0368 Final Report – Feasibility of using feedlot manure for biogas production
Page 108 of 117
successful examples of biogas developments using feedlot pen manure. Further research is required to demonstrate the feasibility of low cost pilot scale biogas technology (such as covered anaerobic lagoons) in Australia. Key recommendations which will assist in increasing the economic feasibility of biogas centre on fundamental changes in holistic feedlot manure management practices and the adoption of alternative biogas design concepts. To enable this paradigm shift a facilitated workshop involving key stakeholders is an important next step which will assist in identifying:
Innovative and low cost biogas technology solutions which may be suitable for feedlots using manure as a single substrate.
Feedlot management options and manure harvest management techniques and the modification of existing machinery to improve the quality of the feedstock.
An investigation into the use of alternative waste streams in addition to feedlot manure (ie co-digestion) and the subsequent exploration into supply chain logistics and management (eg trucks travelling to abattoirs and returning with suitable waste to feed into the digester to increase biogas yields).
Interested feedlot operators capable of scaling up fit-for-purpose trials based on bench trials.

B.FLT.0368 Final Report – Feasibility of using feedlot manure for biogas production
Page 109 of 117
6. References
Analytical Methods Used to Predict Waste Stability. Blacksburg: Virginia Polytechnic Institute and State University. Angelidaki, I & Ahring, BK 2000, 'Methods for increasing the biogas potential from the recalcitrant organic matter contained in manure', Water Science & Technology, vol. 41, no. 3, pp. 189-194. Angelidaki, I, Alves, M, Bolzonella, D, Borzacconi, L, Campos, JL, Guwy, AJ, Kalyuzhnyi, P, Janicek, P & van Lier, JB 2009, 'Defining the biomethane potential (BMP) of solid organic wastes and energy crops: a proposed protocol for batch assays', Water Science & Technology, vol. 59, no. 5, pp. 927-934. APHA 1989, Fixed and volatile solids ignited at 550°C, 17th Edn, vol APHA 2540E, Standard Methods for the Examination of Water and Waste water, American Public Health Association New York, USA. APHA 2005, Standard methods of examination of water and wastewater. 21st Ed. American Water Works Association/American Public Works Association/Water Environment Federation, Washington DC. ASAE 2005, Manure production and characteristics, ASAE Standard, D384.2, American Society of Agricultural Engineers, St. Joseph, Michigan, USA. ASTM 2008, D 2974-07a - Standard test method for moisture, ash, and organic matter of peat and other organic soils, PA 19428-2959, ASTM International, West Conshohocken. Australian Centre for Cleaner Production. 2001. Total waste management system at Berrybank Farm Piggery, Charles I.F.E. Pty Ltd. In Best Practice Design, Technology and management. Batstone, DJ 2006, Sunshine Coast regional biosolids feasibility study: Final Report, 29 August 2006, Advanced Wastewater Management Centre, The University of Queensland, Brisbane. Batstone, DJ, Keller, M, Angelidaki, I, Kalyuzhnyi, SV, Pavlostathis, SG & Rozzi, A 2002, Anaerobic digestion model No. 1 (ADM1), IWA Taskgroup for Mathematical Modelling of Anaerobic Digestion Processes, IWA Publishing, London. Bierman, S, Erickson, GE, Klopfenstein, TJ, Stock, RA & Shain, DH 1999, 'Evaluation of nitrogen and organic matter balance in the feedlot as affected by level and source of dietary fiber', Journal of Animal Science, vol. 77, no. 7, pp. 1645-1653. Birchall, S 2010, Biogas production by covered lagoons - Performance data from Bears Lagoon Piggery, RIRDC Publication No. 10/023, Rural Industries Research and Development Corporation, Canberra, < https://rirdc.infoservices.com.au/items/10-023 >.
Biswas, R, Ahring, BK & Uellendahl, H 2012, 'Improving biogas yields using an innovative concept for conversion of the fiber fraction of manure', Water Science & Technology, vol. 66, no. 8, pp. 1751-1758.
Bridle, T 2011, Energy from feedlot wastes - Feasibility study of options, Final Report for B.FLT.0366, Meat and Livestock Australia (MLA), Sydney, NSW. Bryant, MP, Varel, VH, Frobish, RA & Isaacson, HR 1976, 'The microbiology of anaerobic degradation

B.FLT.0368 Final Report – Feasibility of using feedlot manure for biogas production
Page 110 of 117
and methanogenesis ', in Seminar on Microbial Energy Conversion EKG Goltz (ed.), Gottingen, Germany, pp. 107. Budiyono, B, Widiasa, IN, Johari, S & Sunarso, S 2014, 'Increasing Biogas Production Rate from Cattle Manure Using Rumen Fluid as Inoculums', International Journal of Science and Engineering (IJSE), vol. 6, no. 1, pp. 31-38. Carlson, JC & Mabury, SA 2006, Dissipation kinetics and mobility of chlortetracycline, tylosin, and monensin in an agricultural soil in Northumberland County, Ontario, Canada. Environmental toxicology and chemistry vol. 25, pp. 1-10. Carrère, H, Sialve, B & Bernet, N 2009, 'Improving pig manure conversion into biogas by thermal and thermo-chemical pretreatments', Bioresource technology, vol. 100, no. 15, pp. 3690-3694. CEC 2008, Australian Bioenergy Roadmap: Setting the Direction for Biomass in Stationary Energy to 2020 and Beyond, Clean Energy Council. CEC 2012, Clean Energy Australia Report 2012, Clean Energy Council. CEC 2013, Clean Energy Australia Report 2013, Clean Energy Council. Cessna, AJ, Larney, FJ, Kuchta, SL, Hao, X, Entz, T, Topp, E & McAllister, TA 2011, 'Veterinary antimicrobials in feedlot manure: dissipation during composting and effects on composting processes', Journal of environmental quality, vol. 40, no. 1, pp. 188-198. Chambers, BJ, Nicholson, FA, Solomon, DR & Unwin, RJ 1998, 'Heavy metal loadings from animal manures to agricultural land in England and Wales', in Ramiran 98, Eighth International Conference on Management Strategies for Organic Waste Use in Agriculture, Rennes, Cemagref Editions, pp. 475-483. Chen, TH, Day, DL & Steinberg, MP 1988, 'Methane production from fresh versus dry dairy manure', Biological Wastes, vol. 24, no. 4, pp. 297-306. Chen, YR 1983, 'Kinetic analysis of anaerobic digestion of pig manure and its design implications', Agricultural Wastes, vol. 8, no. 2, pp. 65-81. Chen, YR, Varel, VH & Hashimoto, AG 1980, 'Effect of temperature on methane fermentation kinetics of beef-cattle manure', Biotechnology and Bioengineering Symposium, vol. 10, pp. 325-339. Chynoweth, DP, Wilkie, AC & Owens, JM 1998, 'Anaerobic processing of piggery wastes: A review', Paper submitted to the 1998 ASAE Annual International Meeting, Orlando, Florida, 11-16 July 1998. Danish Biogas Association 2010, Digested biomass as a fertiliser, viewed 26 March 2010, < http://www.landbrugsraadet.dk/view.asp?ID=2281 >. Davidson, A, Yap, M, Ponder, S & Jeffrey, G 2013, Code of Practice for On-farm Biogas Production and Use (Piggeries) – 1st Edition, Consultation Draft, Australian Pork Ltd Project 011/1013.423, Australian Pork Limited, Barton, ACT. Davis, RJ, Watts, PJ & McGahan, EJ 2012, Quantification of feedlot manure output for Beef-Bal model upgrade, RIRDC Project No. PRJ-004377, Rural Industries Research and Development Corporation, Barton, ACT.

B.FLT.0368 Final Report – Feasibility of using feedlot manure for biogas production
Page 111 of 117
Davis, RJ, Wiedemann, SG & Watts, PJ 2009, 'Energy usage of individual activities within Australian cattle feedlots', in Agriculture Technologies in a Changing Climate: The 2009 CIGR International Sympossium of the Australian Society for Engineering in Australia (SEAg), TM Banhazi and C Saunders (eds.), Brisbane, Qld, 13-16 September 2009, pp. 532-543. Dennis, A & Burke, P 2001, ‘Dairy waste anaerobic digestion handbook’, Environmental Energy Company. Olympia WA, < www.mrec.org/pubs/dairy%20waste%20handbook.pdf >. DeVuyst, EA, Pryor, SW, Lardy, G, Eide, W & Wiederholt, R 2011, 'Cattle, ethanol, and biogas: Does closing the loop make economic sense?', Agricultural Systems. Dolliver, H, Gupta, S & Noll, S 2008, ‘Antibiotic Degradation during Manure Composting’, Journal of Environmental Quality, vol. 37, pp. 1245-1253. Donoho, A 1984, ‘Biochemical studies on the fate of monensin in animals and in the environment’, Journal of Animal Science, vol. 58, pp. 1528-1539. Dreher, TM, Mott, HV, Lupo, CD, Oswald, AS, Clay, SA & Stone, JJ 2012, 'Effects of chlortetracycline amended feed on anaerobic sequencing batch reactor performance of swine manure digestion', Bioresource Technology, vol. 125, pp. 65-74. Eghball, B, Power, JF, Gilley, JE & Doran, JW 1997, 'Nutrient, carbon, and mass loss during composting of beef cattle feedlot manure', Journal of Environmental Quality, vol. 26, no. 1, pp. 189-193. Elanco 1989, Environmental assessment for the use of Rumensin premixes in the feed of beef cattle for the prevention and control of coccidiosis. Elanco products Company, a Division of Eli Lilly and Company, Indianapolis, Indiana.
Elanco 2010, Material Safety Data Sheet for Rumensin 90 Premix. Elanco Animal Health, Available at http://www.asp-inc.com/products/documents/prodinfo/r/rumensin90msd.pdf.
Fischer, JR, Seivers, DM & Fulhage, DC 1975, 'Anaerobic digestion in swine wastes', in Energy, Agriculture and Waste Management: Proceedings of the 1975 Cornell Agricultural Waste Management Conference, WJ Jewell (ed.), Ann Arbor, Michigan, Ann Arbor Science Publishers Inc., pp. 307-316. Gartiser, S, Urich, E, Alexy, R & Kümmerer, K 2007, ‘Anaerobic inhibition and biodegradation of antibiotics in ISO test schemes’, Chemosphere, vol. 66, pp. 1839-1848. Gaudet, M, Agnew, J & Fonstad, T 2013, 'Optimizing solid state anaerobic digestion operating parameters in the canadian prairies–Bench scale study', CSBE/SCGAB AGM 2013. Geoscience Australia & ABARE 2009, 'Chapter 12 - Bioenergy ', in Australian Energy Resource Assessment, Department of Resources, Energy and Tourism, Canberra, ACT. Geoscience Australia 2010, Map of operating renewable energy generators in Australia, Department of the Environment, Water, Heritage and the Arts, Canberra, viewed 25 March 2010. GHD 2007, Assssment of methane capture and use from the intensive livestock industry, RIRDC (ed.), RIRDC Publication No 07/ Project No T4, August, Rural Industries Research and Development

B.FLT.0368 Final Report – Feasibility of using feedlot manure for biogas production
Page 112 of 117
Corporation. Gilbertson, CB, McCalla, TM, Ellis, JR, Cross, OE & Woods, WR 1971, 'Characteristics of manure accumulations removed from outdoor, unpaved, beef cattle feedlots', in Proceedings of the International Symposioum on Livestock Wastes, St. Joseph, Mich, ASAE, pp. 56-59. Gilbertson, CB, Nienaber, JA, Ellis, JR, McCalla, TM, Klopfenstein, TJ & Farlin, SD 1974, Nutrient and energy composition of beef cattle feedlot waste fractions, Research Bulletin 262, The Agricultural Experiment Station, IANR, University of Nebraska, Lincoln, Nebraska. Gopalan, P 2013, 'Low cost applications of anaerobic digestion to livestock wastes', School of Chemical Engineering, The University of Queensland. Gopalan, P, Jensen, PD, & Batstone, DJ 2013, Biochemical Methane Potential of Beef Feedlot Manure: Impact of Manure Age and Storage. Journal of environmental quality, 42, 1205-1212. Graf, W 1971, 'Hydraulics of sediment transport.' (Water Resources Publications, Littleton. Co, USA: McGraw-Hill, New York). Gunaseelan, VN, 2007, Regression models of ultimate methane yileds of fruits and vegetable solid wastes, sorghum and napiergrass on chemical composition. Bioresource Technology, 98, 1270-1277. Hanif, A, Loetscher, L, Sharvelle, S & Wasserbach, K 2013, Evaluation of a 'tricle flow leach bed reactor' for anaaerobic digestor of high solids cattle manure, < http://www.slideshare.net/LPELC/hanif-w2w13 >. Hao, X, Mir, PS, Shah, MA & Travis, GR 2005, 'Influence of canola and sunflower diet amendments on cattle feedlot manure', Journal of Environmental Quality, vol. 34, no. 4, pp. 1439-1445. Hashimoto, AG 1984, 'Methane from swine manure: effect of temperature and influent substrate concentration on kinetic parameter (K)', Agricultural Wastes, vol. 9, no. 4, pp. 299-308. Hashimoto, AG, Varel, VH & Chen, YR 1981, 'Ultimate methane yield from beef cattle manure: effect of temperature, ration constituents, antibiotics and manure age', Agricultural Wastes, vol. 3, no. 4, pp. 241-256. Herberg, R, Manthey, J, Richardson, L, Cooley, C & Donoho, A 1978, ‘Excretion and tissue distribution of [14C] monensin in cattle’, Journal of Agricultural and Food Chemistry, vol. 26, pp. 1087-1090. Hill, DT 1984, 'Methane productivity of the major animal waste types', Transactions of the ASAE, vol. 27, no. 2, pp. 530-534. Hilpert, R, Winter, J & Kandler, O 1984, ‘Agricultural feed additives and disinfectants as inhibitory factors in anaerobic digestion’, Agricultural Wastes, vol. 10, pp. 103-116. Holliday, CP, Rasmussen, TC, Miller, WP 2003, ‘Establishing the relationship between turbidity and total suspended sediment concentration. Proceedings of the 2003 Georgia Water Resources Conference. 23-24 April 2003. KJ Hatcher (Ed). The University of Georgia, Athens, Georgia. Hollmann, M, Knowlton, KF & Hanigan, MD 2008, 'Evaluation of solids, nitrogen, and phosphorus excretion models for lactating dairy cows', Journal of Dairy Science, vol. 91, no. 3, pp. 1245-1257. Iannotti, EL, Porter, JH, Fischer, JR & Sievers, DM 1979, 'Changes in swine manure during anaerobic

B.FLT.0368 Final Report – Feasibility of using feedlot manure for biogas production
Page 113 of 117
digestion', Developments in Industrial Microbiology, vol. 20, pp. 519-529. IPCC 2006, IPCC Guidelines for National Greenhouse Gas Inventories, HS Eggleston, et al. (eds.), Prepared by the National Greenhouse Gas Inventories Programme, IGES, Japan. Jensen, PD, Sullivan, T, Carney, C. and Batstone, DJ 2014, ‘Analysis of the potential to recover energy and nutrient resources from cattle slaughterhouses in Australia by employing anaerobic digestion’, Applied Energy, vol. 136, pp 23-31. Johns, M & Butler, B 2012, Demonstration of covered anaerobic pond technology, Meat & Livestock Australia Ltd Final Report Project P.PIP.0290 2011, Johns Environmental. Environmental Consultants & Services - Aspley, QLD. Karakashev, D, Batstone, DJ, Trably, E & Angelidaki, I 2006, 'Acetate oxidation is the dominant methanogenic pathway from acetate in the absence of methanosaetaceae', Applied and Environmental Microbiology, vol. 72, no. 7, pp. 5138-5141.
Khan, S, Roser, D, Davies, C, Peters, G, Stuetz, R, Tucker, R & Ashbolt, N 2008, ‘Chemical contaminants in feedlot wastes: Concentrations, effects and attenuation’, Environment International, vol. 34, pp. 839-859. Kissinger, WF, Erickson, GE & Klopfenstein, TJ 2006a, Summary of manure amounts, characteristics, and nitrogen mass balance for open feedlot pens in summer compared to winter, Nebraska Beef Report 2006, Agricultural Research Division, University of Nebraska Extension, Institute of Agriculture and Natural Resources, University of Nebraska, Lincoln, U.S.A. Kissinger, WF, Erickson, GE, Klopfenstein, TJ & Koelsch, RK 2006b, Managing phosphorus in beef feedlot operations, 2006 Nebraska Beef Report, Animal Science Department, University of Nebraska Lincoln. Kissinger, WF, Koelsch, RK, Erickson, GE & Klopfenstein, TJ 2007, 'Characteristics of manure harvested from beef cattle feedlots', Applied Engineering in Agriculture, vol. 23, no. 3, pp. 357-365. Kroeker, EJ, Schulte, DD, Sparling, AB & Lapp, HM 1979, 'Anaerobic treatment process stability', Journal of Water Pollution Control Federation, vol. 51, no. 4, pp. 718-727. Kryzanowski, T 2013, Full circle, March/April 2013, Manure Manager, < http://www.bluetoad.com/display_article.php?id=1341333 >. Kuhne, M, Ihnen, D, Moller, G & Agthe, O 2000, ‘Stability of tetracycline in water and liquid manure’, J Vet Med A Physiol Pathol Clin Med, vol. 47, pp. 379-84. Kusch, S, Oechsner, H & Jungbluth, T 2008, 'Biogas production with horse dung in solid-phase digestion systems', Bioresource technology, vol. 99, no. 5, pp. 1280-1292. Labatut, RA, Angenent, LT & Scott, NR 2011, 'Biochemical methane potential and biodegradability of complex organic substrates', Bioresource technology, vol. 102, no. 3, pp. 2255-2264. Laginestra, M 2012, Covered anaerobic lagoons, Final Report for A.ENV.0135, Australian Meat Processor Corporation (AMPC) and Meat and Livestock Australia (MLA), Sydney, NSW. Lallai, A, Mura, G & Onnis, N 2002, 'The effects of certain antibiotics on biogas production in the anaerobic digestion of pig waste slurry', Bioresource Technology, vol. 82, no. 2, pp. 205-208.

B.FLT.0368 Final Report – Feasibility of using feedlot manure for biogas production
Page 114 of 117
Lorimor, JC, Powers, W & Sutton, A 2000, Manure characteristics, Manure Management Systems Series MWPS-18, Iowa State University, Ames, Iowa. Lott, SC, Loch, RJ & Watts, PJ 1994, ‘Settling characteristics of feedlot cattle faeces and manure’, Transactions of the ASAE, vol. 37, pp. 281-285. Lucas, DM, Fontenot, JP & Webb, KEJ 1975, 'Composition and digestibility of cattle fecal waste', Journal of Animal Science, vol. 41, pp. 1480-1486. Martin, J 2008, ‘An evaluation of a covered anaerobic lagoon for flushed dairy cattle manure stabilization and biogas production’, US Environmental Protection Agency, Washington, DC. McGahan, E, Valentine, J & Kelly, A 2013, Kerwee Feedlot Biogas Feasibility Project – CSIRO Livestock Industries, FSA Consulting Report 8089, Feedlot Services Australia, Toowoomba Office, QLD. McGinn, S, Koenig, K & Coates, T 2002a, 'Effect of diet on odorant emissions from cattle manure', Canadian journal of animal science, vol. 82, no. 3, pp. 435-444. McGinn, SM, Koenig, KM & Coates, T 2002b, 'Effect of diet on odorant emissions from cattle manure', Canadian Journal of Animal Science, vol. 82, no. 3, pp. 435-444. Miller, DN 2001, 'Accumulation and consumption of odorous compounds in feedlot soils under aerobic, fermentative, and anaerobic respiratory conditions', Journal of Animal Science, vol. 79, no. 10, pp. 2503-2512. Mitchell, SM, Ullman, JL, Teel, AL, Watts, RJ & Frear, C 2013, ‘The effects of the antibiotics ampicillin, florfenicol, sulfamethazine, and tylosin on biogas production and their degradation efficiency during anaerobic digestion’, Bioresource Technology, vol. 149, pp. 244-252. Moller, HB, Sommera, SG & Ahring, BK 2004, 'Methane productivity of manure, straw and solid fractions of manure', Biomass and Bioenergy, vol. 26, no. 5, pp. 485-495. Monnet, F 2003, An introduction to anaerobic digestion of organic waste. Final report, November 2003, Remade Scotland. Morris, GR 1976, 'Anaerobic fermentation of animal wastes: a kinetic and empirical design fermentation', M.S. thesis, Cornell University. Navickas, K 2007, 'Biogas for farming, energy conservation and envioronment protection', in International symposium, Biogas, technology and environment, Faculty of Agriculture, University of Maribor, 25-29 November 2007. Nicholson, FA, Chambers, BJ, Williams, JR & Unwin, RJ 1999, 'Heavy metal contents of livestock feed and animal manures in England and Wales', Bioresource Technology, vol. 70, pp. 23-31. NIWA 2008, Covered anaerobic ponds for anaerobic digestion and biogas capture: piggeries, NIWA Information Series No. 32, New Zealand Pork, NIWA, viewed 10 June 2010, < http://www.biogas.org.nz/Publications/WhosWho/biogas-pond-booklet.pdf >. NRCS 1992, 'Chapter 4: Agricultural waste characteristics', in Part 651: Agricultural Waste Management Field Handbook, National Resources Conservation Service, Washington D.C.

B.FLT.0368 Final Report – Feasibility of using feedlot manure for biogas production
Page 115 of 117
Parker, D, Williams, D, Cole, N, Auvermann, B & Rogers, W 2002, 'Dry Nonheated Anaerobic Biogas Fermentation Using Aged Beef Cattle Manure', in ASABE Annual International Meeting / CIGR XVth World Congress, Chicago, IL, USA July 28 - July 31 2002. Pavlostathis, SG & Giraldo-Gomez, E 1991, 'Kinetics of anaearobic treatment: A critical review', Critical Reviews in Envioronmental Science and Technology, vol. 21, no. 5-6, pp. 411-490. Payne, R 1984, ‘Physical, chemical and microbiological characteristics of pig excreta’, Western Australian Department of Agriculture, South Perth. Pepple, L, Andersen, D, Burns, R & Moody, L 2010, 'Physical and chemical properties of runoff from beef feedlots in Iowa, International Symposium on Air Quality and Manure Management for Agriculture.' Dallas Texas, USA. Peters, J, Combs, S, Hoskins, B, Jarman, J, Kovar, JL, Watson, M, Wolf, A, & Wolf, N 2003, Recommended Methods of Manure Analysis (A3769), UW Extension, University of Wisconsin. Pind, PF, Angelidaki, I & Ahring, BK 2003, 'Dynamics of the anaerobic process: Effects of volatile fatty acids', Biotechnology and Bioengineering, vol. 82, no. 7, pp. 791-801. Roser, D, Tucker, R, Khan, S, Klein, M, Coleman, H, Brown, L, Caview, C, Trinh, T, Wang, S, Peters, G, Stuetz, R, Ashbolt, N, Baker, K, Burger, M & Davis, R 2011, Microbiological and chemical human health risks arising from cattle feedlot wastes: Their characterisation and management, Final Report of Meat & Livestock Australia Project FLOT.333: Managing the Contaminants in Feedlot Wastes, Meat & Livestock Australia, North Sydney. Sassman, SA & Lee, LS 2007, ‘Sorption and degradation in soils of veterinary ionophore antibiotics: monensin and lasalocid’, Environ Toxicol Chem, vol. 26, pp. 1614-21. Sell, ST, Burns, RT, Moody, LB & Raman, DR 2011, 'Comparison of methane production from bench-and sub pilot-scale anaerobic digesters', Applied Engineering in Agriculture, vol. 27, no. 5, pp. 821-825. Siegrist, J, Vogt, D, Garcia-Heras, J & Gujer, W 2002, 'Mathematical model for meso and thermophillicanaerobic seawge sludge digestion', Environmental Science and Technology, vol. 36, pp. 1113-1123. Sinclair, SE 1997, Effects of ration modification on production and characteristics of manure from feedlot cattle - (1) Phosphorus levels, Report to the Cattle and Beef Industry CRC Sub-Program 6 - Feedlot Waste Management, Queensland Department of Primary Industries, Brisbane, Qld. Skerman, A 2000, Reference manual for the establishment and operation of beef cattle feedlots in Queensland, Information Series QI99070, Queensland Cattle Feedlot Advisory Committee (FLAC), Department of Primary Industries, Toowoomba, QLD. Standards Australia 1992, Methods of testing soils for engineering purposes: Soil moisture content tests - Determination of the moisture content of a soil - Oven drying method (standard method), (AS 1289.2.1.1), Standards Australia, Sydney, NSW. Standards Australia 2003, Methods of testing soils for engineering purposes: Soil reactivity tests - Determination of the shrinkage index of a soil. Loaded shrinkage index, (AS 1289.7.1.2 -2003), Standards Australia, Sydney, NSW. Stevens, MA & Schulte, DD 1979, 'Low temperature anaerobic digestion of swine manure', Journal of the Environmental Engineering Division, vol. 105, no. 1, pp. 33-42.

B.FLT.0368 Final Report – Feasibility of using feedlot manure for biogas production
Page 116 of 117
Summers, R & Bousfield, S 1980, 'Detailed study of piggery-waste anaerobic digestion', Agricultural Wastes, vol. 2, no. 1, pp. 61-78. Svoboda, I 2003, Anaerobic digestion, storage, oligolysis, lime, heat and aerobic treatment of livestock manures, Final Report, Provision of research and design of pilot schemes to minimise livestock pollution to the water environment in Scotland, FEC Services Ltd, Kenilworth, Warwickshire. Sweeten, JM, Egg, RP & Reddell, DL 1985, 'Characteristics of cattle feedlot manure in relation to harvesting practices', in Agricultural Waste Utilisation and Management - Proceedings of the 5th International Symposium on Agricultural Wastes, Chicago, Illinois, 16-17 December American Society of Agricultural Engineers, pp. 329-337. Sweeten, JM, Parker, DB, Mitra, R & Megel, AJ 2006, 'Assessment of chemical and physical characteristics of bottom, cyclone and baghouse ashes from the combustion of manure, ASABE Paper No. 064043', Paper submitted to the ASABE Annual International Meeting, Portland, OR, 9-12 July. Symons, GE & Buswell, AM 1933, ‘The methane fermentation of carbonhydrates’, Journal of American Chemical Society, vol. 55, pp. 2028-2036. Thiele-Bruhn, S 2003, ‘Pharmaceutical antibiotic compounds in soils – a review’, Journal of Plant Nutrition and Soil Science, vol. 166, pp. 145-167. Thomsen, ST, Spliid, H & Ostergard, H 2014, ‘Statistical prediction of biomethane potentials based on the composition of lignocellulosic biomass’, Bioresour Technol, vol. 154, pp. 80-6. Triolo, JM, Sommer, SG, Møller, HB, Weisbjerg, MR & Jiang, XY 2011, 'A new algorithm to characterize biodegradability of biomass during anaerobic digestion: influence of lignin concentration on methane production potential', Bioresource technology, vol. 102, no. 20, pp. 9395-9402. Tucker, RW, Lott, SC, Watts, PJ & Jukes, PD 1991, Lot feeding in Australia - a survey of the Australian lot feeding industry, Information Series QI91019, Department of Primary Industries, Brisbane. Vahlberg, C, Nordell, E, Wiberg, L & Schnürer, A 2013, ‘Method for correction of VFA loss in determination of dry matter in biomass’, Swedish Gas Technology Centre. van Lier, JB 2008, 'High-rate anearobic wastewater treatment: diversifying from end-of-the-pipe treatment to resource-oriented conversion techniques', Water Science and Technology, vol. 57, no. 8, pp. 1137-1148. Vandevivere, P, De Baere, L & Verstraete, W 2002, 'Types of anaerobic digesters for solid wastes', in Biomethanization of the organic fraction of municipal solid wastes, J Mata-Alvarez (ed.), IWA publishing. Varel, V, Hashimoto, A 1982, ‘Methane production by fermentor cultures acclimated to waste from cattle fed monensin, lasalocid, salinomycin, or avoparcin’, Applied and Environmental Microbiology vol. 44, pp. 1415-1420. Varel, VH, Wells, JE, Berry, ED & Miller, DN 2010, 'Manure Odor Potential and Concentrations in Manure Slurries of Feedlot Steers Fed 40% Corn Wet Distillers Grains', Journal of environmental

B.FLT.0368 Final Report – Feasibility of using feedlot manure for biogas production
Page 117 of 117
quality, vol. 39, no. 4, pp. 1498-1506. Varel, VH, Wells, JE, Shelver, WL, Rice, CP, Armstrong, DL & Parker, DB 2012, ‘Effect of anaerobic digestion temperature on odour, coliforms and chlortetracycline in swine manure or monensin in cattle manure’, J Appl Microbiol, vol. 112, pp. 705-15. Vedrenne, F, Beline, F, Dabert, P & Bernet, N 2008, 'The effect of incubation conditions on the laboratory measurement of the methane producing capacity of livestock measurement wastes', Bioresource Technology, vol. 99, pp. 146-155. WACA 2002, Animal Welfare Act 2002 (Western Australia). Watts, P, Ni Cheallaigh, A, Valentine, J, Tucker, R & O’Keefe, M 2013a, Environmental Performance Review of Australian Feedlots (2012), Final Report, Project B.FLT.0468, Meat & Livestock Australia Limited (ed.), FSA Consulting, Toowoomba, QLD. Watts, PJ, Bridle, T, McGahan, EJ & Ni Cheallaigh, A 2013b, Thermal energy recovery from feedlot manure - pilot trials, Meat & Livestock Australia Limited Final Report, Project B.FLT.0368, FSA Consulting, Toowoomba, QLD. Wen, G, Chen, C, Luo, X, Wang, Y, Zhang, C & Pan, Z 2007, 'Identification and characterization of the NTPase activity of classical swine fever virus (CSFV) nonstructural protein 3 (NS3) expressed in bacteria', Archives of virology, vol. 152, no. 8, pp. 1565-73. Wu-haan, W, Burns, RT, Moody, LB, Grewell, DA & Raman, DR 2010, 'Evaluation of ultrasonic pretreatment on anaerobic digestion of different animal manures', Transactions of the ASABE, vol. 53, no. 2, pp. 577-583. Zhu, J 2010, 'Crop residues and swine manure enhance methane generation', National HogFarmer, 15 December, Penton Media, accessed 26 March 2010, < http://nationalhogfarmer.com/facilities-equipment/manure-handling/1215-mixture-enhance-methane-generation/ >.