Review Size Distribution and Trace Elements Contents of ...
16
Introduction According to current knowledge, atmospheric particu- late matter (PM) – a complex mixture of solid and liquid particles of organic and inorganic substances suspended in the air – affects more people than any other pollutant [2]. In recent years research has centered on small particles and their compounds that can be detected by new sophisticated analytical techniques [3]. While adverse effects of PM on human health are now well established and accepted [4], major uncertainties and important gaps of knowledge relat- ed to PM source-specific compositions and health effects, as well as its total impact on public health, remain [2, 5]. Large number of epidemiological studies have demonstrat- ed that exposure to PM is related to respiratory and cardio- vascular diseases. Health effects range from modest tempo- rary changes, through increased risk of symptoms requiring hospital admission and increased risk of death [6-9]. These adverse effects of PM follow both short- and long-term exposures, and moreover there is little evidence to suggest a threshold below which no adverse health effects would be anticipated [1, 2]. The main components of PM mixture are organic mat- ter, mineral dust, secondary inorganic aerosols (SIA, which include sulphates, nitrates, and ammonia) and water, as well as an unspecified part. Most current studies are focused especially on the so-called fine PM 2.5 particles (with aero- dynamic diameter smaller than 2.5 µm) and coarse PM 2.5-10 particles (in the size range between 2.5 and 10 µm). PM 2.5 is believed to be the most harmful, as when inhaled it can penetrate deep into the lungs. According to the results of the Clean Air for Europe (CAFE) research program [10], expo- sure to PM 2.5 contributes to life-span shortening of Europeans by about nine months, while the latest studies show that PM 2.5 air pollution causes around 450,000 pre- mature deaths a year in the 27 EU countries, which corre- sponds to a total of almost 4.5 million years taken away from people’s lives [11]. The atmospheric PM varies in size and composition and consists of a mixture of primary Pol. J. Environ. Stud. Vol. 22, No. 1 (2013), 25-40 Review Size Distribution and Trace Elements Contents of Coal Fly Ash from Pulverized Boilers Katarzyna Juda-Rezler, Dominik Kowalczyk* Faculty of Environmental Engineering, Warsaw University of Technology, Nowowiejska 20, 00-653 Warszawa, Poland Received: 9 September 2011 Accepted: 18 September 2012 Abstract Pulverized coal boilers, commonly used in the power and heat-generating industries, constitute one of the most important sources of fine particulate matter (PM) emitted to ambient air. The evidence on airborne PM and its public health impact is consistent in showing adverse health effects at exposures currently experi- enced by urban populations in both developed and developing countries [1]. The amount, size distribution, chemical composition, and harmfulness of coal fly ash depends on a number of factors such as coal type, com- position, preparation method, boiler type and construction, combustion conditions, and the type and efficien- cy of the applied air pollution control devices. This paper summarizes and discusses the parameters affecting size distribution and trace element contents of fly ash particles emitted from the energetic combustion of hard coal in pulverized boilers equipped with electrostatic precipitators. Keywords: coal fly ash, particulate matter, trace elements, coal combustion, pulverized boilers *e-mail: [email protected]
Transcript of Review Size Distribution and Trace Elements Contents of ...

Introduction
According to current knowledge, atmospheric particu-late matter (PM) – a complex mixture of solid and liquidparticles of organic and inorganic substances suspended inthe air – affects more people than any other pollutant [2]. Inrecent years research has centered on small particles andtheir compounds that can be detected by new sophisticatedanalytical techniques [3]. While adverse effects of PM onhuman health are now well established and accepted [4],major uncertainties and important gaps of knowledge relat-ed to PM source-specific compositions and health effects,as well as its total impact on public health, remain [2, 5].Large number of epidemiological studies have demonstrat-ed that exposure to PM is related to respiratory and cardio-vascular diseases. Health effects range from modest tempo-rary changes, through increased risk of symptoms requiringhospital admission and increased risk of death [6-9]. Theseadverse effects of PM follow both short- and long-term
exposures, and moreover there is little evidence to suggesta threshold below which no adverse health effects would beanticipated [1, 2].
The main components of PM mixture are organic mat-ter, mineral dust, secondary inorganic aerosols (SIA, whichinclude sulphates, nitrates, and ammonia) and water, as wellas an unspecified part. Most current studies are focusedespecially on the so-called fine PM2.5 particles (with aero-dynamic diameter smaller than 2.5 µm) and coarse PM2.5-10
particles (in the size range between 2.5 and 10 µm). PM2.5
is believed to be the most harmful, as when inhaled it canpenetrate deep into the lungs. According to the results of theClean Air for Europe (CAFE) research program [10], expo-sure to PM2.5 contributes to life-span shortening ofEuropeans by about nine months, while the latest studiesshow that PM2.5 air pollution causes around 450,000 pre-mature deaths a year in the 27 EU countries, which corre-sponds to a total of almost 4.5 million years taken awayfrom people’s lives [11]. The atmospheric PM varies in sizeand composition and consists of a mixture of primary
Pol. J. Environ. Stud. Vol. 22, No. 1 (2013), 25-40
ReviewSize Distribution and Trace Elements Contents
of Coal Fly Ash from Pulverized Boilers
Katarzyna Juda-Rezler, Dominik Kowalczyk*
Faculty of Environmental Engineering, Warsaw University of Technology, Nowowiejska 20, 00-653 Warszawa, Poland
Received: 9 September 2011Accepted: 18 September 2012
Abstract
Pulverized coal boilers, commonly used in the power and heat-generating industries, constitute one of
the most important sources of fine particulate matter (PM) emitted to ambient air. The evidence on airborne
PM and its public health impact is consistent in showing adverse health effects at exposures currently experi-
enced by urban populations in both developed and developing countries [1]. The amount, size distribution,
chemical composition, and harmfulness of coal fly ash depends on a number of factors such as coal type, com-
position, preparation method, boiler type and construction, combustion conditions, and the type and efficien-
cy of the applied air pollution control devices. This paper summarizes and discusses the parameters affecting
size distribution and trace element contents of fly ash particles emitted from the energetic combustion of hard
coal in pulverized boilers equipped with electrostatic precipitators.
Keywords: coal fly ash, particulate matter, trace elements, coal combustion, pulverized boilers
*e-mail: [email protected]

(emitted directly from anthropogenic and natural sources)and secondary (formed in the atmosphere from the reactionof primary pollutants) compounds. Solid fuel burning in thepower industry is an important anthropogenic source ofboth primary particulates (commonly called fly ash) andgaseous precursors of secondary particles, such as SO2 andNOx.
Currently around 40% of electricity worldwide, andaround 90% in Poland, is generated from coal [12]. Theforecasts predict that the next two decades will witness theinstallation of the same amount of power generation capac-ity as that installed over the whole 20th century [13]. For thelast decade much effort to fulfil energy demand by renew-able energy sources has been undertaken, but coal still is,and is likely to be for the foreseeable future, one of the mostimportant electricity-producing fuels [14-16]. Therefore, allby-products produced during coal combustion are of majorconcern from the perspectives of human health and theenvironment as a whole.
Coal is a sedimentary rock, composed primarily oforganic matter along with varying amounts of inorganicrock fragments and mineral matter, for example clays,shales, quartz, and calcite [17]. During high-temperaturecoal combustion and subsequent cooling of the flue gas,mineral matter undergoes chemical and structural modifi-cations such as dehydration, dehydroxylation, decomposi-tion, and the formation of new phases and vitrification [18].Particles that are captured by flue gas as it exits the furnaceare referred to as coal fly ash (CFA). CFA is a complex mix-ture with unique polycomponent, heterogeneous, and vari-able composition, containing intimately associated andfinely dispersed solid, liquid, and gaseous components [17].The overall mineralogical composition of CFA resemblesthat of siliceous rocks from which it was derived, withoxides of silicon, aluminum, iron, and calcium making upmore than 90% of most fly ash. Other major and minor ele-ments (sulfur, sodium, potassium, magnesium, titanium)make up an additional 8%, while trace elements (TEs) con-stituents account for less than 1% [19]. TEs originatingfrom coal utilization that are believed to be of main concernfrom the human health perspective include As, Cd, Cr, Hg,Mn, Ni, and Pb [20, 21]. CFA is of key meaning from theair pollution point of view, because when emitted to ambi-ent air it becomes basic primary PM.
The emission volume, size distribution, and chemicalcomposition of primary particulates emitted into the atmos-phere from the energy and transformation industries (sector01 from SNAP 97 – Selected Nomenclature for AirPollution), is influenced by a wide range of factors such as:coal type and parameters (granulation, chemical composi-tion, mode of occurrence of chemical compounds), combus-tion process parameters (temperature, oxygen concentra-tion), boiler type and construction and type and parametersof the applied air-pollution control devices (APCDs). TheAPCDs in large combustion plants (LCPs) usually consist ofhighly efficient de-dusting facilities such as electrostatic pre-cipitators (ESPs) or fabric filters (FFs) and flue gas desul-phurization (FGD) installations.
Both field and laboratory measurements as well as the-oretical calculations have led to the conclusion that prima-ry PM emitted from coal combustion is composed of threemain constituents [22]: (1) un-burnt carbon from the incomplete combustion of coal (2) non-volatile mineral elements, a portion of which may
directly escape the burning coal grain, and transfer intofly ash without phase change (solid-to-particles path)
(3) volatile mineral elements that vaporize in the flamezone and nucleate, forming an ultrafine aerosol. It con-denses in the post-flame zone when combustion gasescool rapidly, and the aerosol particles grow by coagula-tion (solid-vapor-particle path).Studies analyzing the factors affecting final emission of
CFA from electric power plants (EPPs) and thermoelectricpower plants (TPPs) have been conducted since the 1970s,with the main focus on TEs emissions due to their harmful-ness to humans. In Poland, Pacyna in his precursory work[23] as well as Mazur and Konieczyński [24] andKonieczyński et al. [25, 26] recently, studied the distribu-tion of TEs in the combustion products of coal burned inEPPs and TPPs. Pacyna and co-authors published further anumber of TEs emission inventories for both regional andglobal scales [27-29]. The European studies on the fate ofTEs in the coal-fired power stations in general have beenintensively conducted by Meij [30, 31] and Querol et al.[32, 33]. In the US, Tomeczek and Palugniok [34] studiedkinetics of mineral matter transformation during coal com-bustion, while Senior and co-authors [35-37] conductedresearch on TEs distribution during coal combustionprocesses. The influence of electrostatic precipitators onparticle size distributions was studied by Clack [38].However, the majority of current studies examining associ-ations between coal combustion and CFA/TEs emissions isconducted in China. Among others, Huang et al. [39] andXiaowei et al. [40] investigated emissions from pulverizedcoal boilers, while Zhang et al. [41] studied the emissionsof select toxic TEs from several bench-scale furnaces, andthe retention of TEs by several typical sorbents and addi-tives. Recently, Zhao et al. [42], developed the database ofChinese emission factors and compared it with widely usedU.S. EPA AP-42 database [43].
In Japan, Zhang et al. [44] investigated the influence ofcombustion temperature on the formation of submicronparticulate matter (PM1). Also in India, a study on twelveTEs emissions from coal-fired EPPs equipped with ESPswas conducted [45]. Recently, Bhangare et al. [46] ana-lyzed coal and ash samples collected from five differentTPPs across India in order to determine TEs distribution,enrichment, and partitioning behavior.
The Polish power and heat industry is almost exclu-sively based on coal combustion, with pulverized coal boil-ers and electrostatic precipitators being the most common-ly used technologies for coal burning and flue gas de-dust-ing, respectively. Therefore, understanding the behaviour ofcoal grains, CFA particles, and TEs during coal combustionand flue gas cleaning is crucial for assessing the character-istics of primary PM emitted to ambient air. The aim of this
26 Juda-Rezler K., Kowalczyk D.

paper is to compare and analyze the factors influencing sizedistribution of CFAs emitted from EPPs and TPPs and itsTEs contents. The focus is put on combustion processestypical for Polish industry.
TEs Contents and Mode of Occurrence
in Coal
Coal is a heterogeneous fuel comprising an organic part,highly calorific and mainly consisting of carbon with asmall amount of mineral inclusions, and an inorganic partmainly consisting of mineral substances. So far about 84elements have been identified in coal, including major,minor, and trace elements. TEs exist in coal in a variety ofdifferent modes of occurrence. They can be found either asmain or trace components of discrete minerals or asadsorbed elements in the inorganic fraction, while in theorganic fraction they occur as organometallic, chelate, orion-exchange compounds [47]. In bituminous coals the fol-lowing TEs are present: antimony (Sb), arsenic (As), beryl-lium (Be), cadmium (Cd), chromium (Cr), cobalt (Co), cop-per (Cu), fluorine (F), iron (Fe), lead (Pb), manganese(Mn), mercury (Hg), molybdenum (Mo), nickel (Ni), nio-bium (Nb), rubidium (Rb), selenium (Se), strontium (Sr),yttrium (Y), zinc (Zn), and zirconium (Zr), as well asradioactive elements such as radium (Ra), thallium (Th),and uranium (U). The contents of TEs in various coalsexhibit a great variation, not only in the concentrations ofdifferent elements, but also in the range – typically >100-fold – of concentration exhibited by each element [36]. Thepresent paper is focused on these TEs that are present inparent coal and its CFA in relatively large quantities (i.e As,Cr, Pb, Mn, Ni, and Zn) or that occur in smaller quantitiesbut are exceptionally harmful: Cd and Hg. Seven fromamong the abovementioned elements – As, Cd, Cr, Pb, Ni,Hg, and Mn – are among 35 air pollutants considered harm-ful to human health by WHO [20].
The comparison of selected TEs contents in differentPolish bituminous coals is presented in Table 1.
Average concentration of TEs in Polish bituminouscoals varies from a low value of around 0.1 ppm for Cd andHg to the highest value for Mn (150-180 ppm). Data from[48] and [49] presented in Table 1 are quite similar becausethey are averaged over a number of mines. However, forindividual power plants (coal mines) differences in TEscontents may be large, as it can be noticed for Miechowiceand Łagisza EPPs for Zn. Among the investigated coalsfrom the Upper Silesian Coal Basin [23, 48, 49], the onefrom the Wawel coalmine has the greatest Zn content of238 ppm, plus high contents of Mn (492 ppm) and Pb (44ppm). The highest level of Mn was found in coal from theMarcel coalmine (508 ppm), where high concentrations ofPb (47 ppm) and Zn (121 ppm) were measured. Bituminouscoal from the Rudytłowy coalmine was found to have thehighest concentration of Pb (54 ppm) and high content ofMn (321 ppm). In the Upper Silesian Basin, the largest con-centration of Ni occurs in coals from the coalminesKazimierz-Juliusz (47 ppm) and Chwałowice (39 ppm).
The largest Cr deposits were found in Krupiński coalmine(50 ppm). The average content of Cd in Polish coals is low,typically around 0.1 ppm.
For mercury, which constitutes a serious hazard tohuman health (due to its harmful impact on the central ner-vous system) more data is available. Trace amounts of Hgexist in coal in a wide range of contents, with the worldaverage of 0.1 ppm [50]. Coal combustion in EPPs is amajor stationary source of Hg emission worldwide [51].The data shows that Hg content in coals from differentcoalmines varies significantly, and that the concentration ofHg in coal burnt in Polish EPPs differs in the order of mag-nitude, from 0.013 to 0.163 ppm (Table 2). The highest con-centrations were recorded in the Lower Silesian Coal Basin,although no coal is mined there anymore. In the UpperSilesian Coal Basin the highest amount of Hg was record-ed in Brzeszcze, Jaworzno, and the Siersza coalmines, aswell as in the Halemba coalmine. In the latter, the maxi-mum content of Hg amounts to 0.758 ppm, whereas theaverage values are comparable to the results obtained inSiersza and Jaworzno. A similar average level of 0.105 ppmwas recorded in Bogdanka (Lublin Coal Basin). The aver-age Hg concentration in coals from the Katowice CoalHolding (coalmines located in the central part of the UpperSilesian Coal Basin) amounts to 0.140 ppm. The highestvalues of 0.145-0.163 ppm were recorded in the Murcki,Mysłowice, and Wujek coalmines.
With respect to TEs concentrations in Polish bitumi-nous coals, the contents of all analyzed elements fall in theworldwide concentration ranges given by Swaine [55],being for the majority of elements (with the exception of Cdand Hg) higher than the mean values of worldwide coalsreported by Ketris and Yudovich [50] (Table 3 and Fig. 2).Average concentration of Cd in Polish coals is lower thanthe world average, while for Hg average concentrationequals mean worldwide value.
Size Distribution and Trace Elements... 27
Traceelement
Contents in Polish bituminous coals [ppm]
MiechowicePower Plant [23]
ŁagiszaPowerPlant [23]
UpperSilesian
Coal Basin[48]
UpperSilesian
Coal Basin[49]
As 40.10 67.60 50.30 -
Cd - - 0.1 -
Cr - - 29.10 25.00
Hg 0.09 0.08 0.10 -
Mn - - 157.00 183.00
Ni - - 21.9 24.00
Pb 14.30 17.60 20.60 25.00
Zn 38.40 65.00 56.30 69.00
Table 1. The contents of the analyzed trace elements in Polishhard coals according to: Pacyna [23], Jezierska and Juda-Rezler[48], and Gabzdyl [49].
There is high potential of significant reduction in thecontents of TEs as early as at the stage of coal preparation,i.e. before combustion. The process of coal cleaning, fre-quently applied in coal mines as pre-combustion emissioncontrol technology, apart from increasing coal caloricity,leads to the reduction of the contents of mineral substances.Consequently, the concentration of TEs in fuel decreases aswell. The extent of possible reduction depends on the mode
of occurrence of a given element in coal, which greatlyinfluences its partitioning during coal cleaning as well as itsfate during the process of combustion [36]. In order toreduce sulphur and ash contents in coal, two major miner-als – pyrite and illite – are targeted for removal in coalcleaning processes; therefore, TEs associated with theseminerals are removed as well. Many TEs (As, Cr, Mn, Ni,Se, etc.) are typically bound to these minerals [61], but
28 Juda-Rezler K., Kowalczyk D.
Table 2. Average mercury content in hard coal from Polish mines according to: Bojakowska and Sokołowska [52], Smoliński [53],CLE Energopomiar, Wojnar and Wisz [54].
CoalmineAverage contents
of Hg [ppm]Coalmine
Average contents of Hg [ppm]
CoalmineAverage contents
of Hg [ppm]
According to [52] According to [53] According to [54]
Halemba 0.113 Wujek 0.163 1 0.064-0.100
Jaworzno 0.106 Mysłowice 0.151 2 0.097-0.141
Bogdanka (LowerSilesian Coal Basin)
0.105 Murcki 0.145 3 0.084-0.120
Brzeszcze 0.073 Staszica 0.113 4 0.053-0.092
Janina 0.066 Wesoła 0.113 5 0.100-0.105
Śląsk 0.049 Wieczorek 0.104 6 0.093-0.132
Jas-Mos 0.037 7 0.066-0.109
Marcel 0.029 8 0.054-0.124
Anna 0.020 9 0.056-0.090
Krupiński 0.013
Table 3. Comparison of trace elements contents in coal from different countries.
Country, Author, SourceThe contents of trace elements in coal [ppm]
As Cd Cr Hg Mn Ni Pb Zn
World MIN, Swaine [55] 0.50 0.10 0.50 0.02 5.00 0.50 2.00 5.00
World MAX, Swaine [55] 80.00 3.00 60.00 1.00 300.00 50.00 80.00 300.00
World average, Ketris and Yudovich [50] 8.30 0.22 16.00 0.10 71.00 13.00 7.80 23.00
China, Huang et al. [39] 0.02 26.00 0.10 109.00 16.00 15.00
China, Dai et al. [56] 3.79 0.25 15.40 0.16 13.70 15.10 41.40
USA, Dai et al. [56] 24.00 0.47 15.00 0.17 14.00 11.00 53.00
India, Srinivasa et al. [45] 41.90 4.31 21.00 0.20 98.50 16.00 29.40 30.00
India, Bhangare et al. [46] 1.14 0.27 6.77 2.31 38.40 18.32 10.42 117.15
Canada, Goodarzi [57] 2.75 0.22 22.88 0.07 10.48
Norway, Lewińska-Preis et al. [58] 0.12 1.39 16.00 1.96 2.69 4.73
United Kingdom, Spears and Tewalt [59] 31.30 0.05 14.80 0.17 30.10 40.00 23.50 8.44
Spain, Llorens et al. [60] 16.70 0.30 38.20 0.19 86.30 23.60 21.00 49.00
Poland, Pacyna [23] 53.85 0.09 15.95 51.7
Poland, Jezierska and Juda-Rezler [48] 50.30 0.10 29.10 0.10 157.00 21.90 20.60 56.30

numerous studies have shown that the presence of TEs incoal is highly heterogeneous, and can vary from the ele-ment being totally dispersed in the macerals (e.g. organicsulfur, carboxyl-bound Ca in lignite) to discrete mineraloccurrences (e.g. pyrite, FeS2, quartz, SiO2, etc.) [61-63].Knowledge of specific modes of occurrence of select TEsis still incomplete [37, 64, 65]. Moreover, this mode varieswith coal rank, depositional environment, etc. [31]. Thestudies of Finkelman [64, 66] ranked the level-of-confi-dence (from one to ten) in the assignment of the likelyoccurrence mode for selected TEs. For example, Cr contentis vastly variable, from highly organic to almost entirelyinorganic, depending on the coal. According to the one ofthe recent works of Huggins and co-workers [61] As, Cr, V,Mn, Ni, and Se are typically associated with pyrite and/orillite. In the study of Illinois coal, V and Cr were found to
be predominantly inorganically associated with illite, withminor amounts (5-15% Cr, 20-30% V) associated organi-cally in the macerals, whereas As and Se were stronglyassociated with pyrite. Arsenic association with pyrite wasalmost sole (90%), with only ~10% of As present as arsen-ate due to minor oxidation of the pyrite [61].
However, in the former x-ray absorption fine structure(XAFS) spectroscopy conducted by Huggins and co-work-ers [62, 63, 67, 68], certain lithophile trace elements (e.g.Ti, V, Cr, Zr, etc.) were found to have surprisingly highorganic affinities in some bituminous coals, typically ofhighly volatile bituminous rank. These authors also foundthat Mn, Zn, As, and Br can be widely organically associat-ed with certain coals.
In Canadian coal, As is dominated by arsenical pyriteand less toxic As+5 in arsenate forms, while Cr is present asCr+3 in association primarily with illite [69]. The recentwork of Riley and co-workers [65] reports the mode ofoccurrence of the wide range of TEs in six Australian coals.
The studies of Polish coal from the Eastern UpperSilesian Coal Basin (Table 4) show that Cd, Ni, Pb, and Znare widely associated with the mineral part of coal [24], butfor Ni the organic share (17%) is also substantial.
Due to different modes of occurrence of TEs in coal andvarious coal structures, the reduction of TEs during coalcleaning by physical separation techniques varies from 15to 80% [24, 61, 70]. In the majority of Polish coals the con-tents of sulphur significantly decreases, along with theincrease in the level of coal cleaning. This effect influencesthe behavior of some TEs, such as Hg and As, that have ahigh affinity for sulphur compounds. If most Hg in coaloccurs in connection with sulphur, a considerable amount
Size Distribution and Trace Elements... 29
Table 4. The mode of occurrence of selected trace elements inhard coal from the eastern Upper Silesian Coal Basin (based onMazur and Konieczyński) [24].
Trace element
Mode of occurrence in Polish bituminous coals
Inorganic part Organic part
[ppm] [%] [ppm] [%]
Cd 7.0 92.0 0.6 8.0
Ni 135.3 83.0 28.5 17.0
Pb 209.1 97.0 6.6 3.0
Zn 258.5 91.0 27.1 9.0
Fig. 1. Comparison of trace elements concentrations in coal from various countries.
Tra
ce e
lem
ents
con
cent
rati
on i
n co
al [
ppm
]
World (MIN ÷ MAX), Swaine [55]
China, Huang et al. [39]
USA, Dai et al. [56]
India, Bhangare et al. [46]
Norway, Lewińska-Preis et al. [58]
Spain, Llorens et al. [60]
Poland, Jezierska and Juda-Rezler [48]
World, Ketris and Yudovich [50]
China, Dai et al. [56]
India, Srinivasa et al. [45]
Canada, Goodarzi [57]
UK, Spears and Tewalt [59]
Poland, Pacyna [23]
Trace element
As Cd Cr Hg Mn Ni Pb Zn
1000,00
100,00
10,00
1,00
0,10
0,01
0,00
of it can be eliminated at the stage of coal processing. Theresults differ depending on the size of coal grains. Even 65-70% of Hg compounds in Polish coal can occur in combi-nation with sulphur – usually in pyrite. The remaining 30-35% occurs in the organic fraction. With the application ofthe flotation method in the process of cleaning, in the caseof the finest fractions, it is possible to decrease the contentof Hg to even 30-45%. Higher reduction can be obtainedwith the application of the chemical coal-cleaning process.
Mineral Matter Transformations
during Combustion
There are two main groups of mineral substances incoal [34, 71-73]:1. Extraneous minerals: particles containing over 90% by
weight of mineral substances separated from organicmatter as a result of coal fragmentation before burning,usually sized from 40 to 70 μm (organic particles aresized up to 100 μm).
2. Included mineral matter: closely linked to the organicparticles of coal, which are not separated before com-bustion. Mineral matter contents usually account forless than 10% by weight (mostly 2-4% by weight) inorganic particles. Organically-bound mineral matter orelements may be further divided into two subcategories: • included minerals,• organically-bound elements (cations).During high-temperature processes such as combustion
of coal, non-flammable mineral elements contained in rawfuel may entirely or partially: (1) remain in bottom ash (2) escape from coal grain and directly form a particle of fly
ash (3) evaporate and condense on a fly ash particle (4) be retained in precipitators
These particles of fly ash that are not collected by de-dusting and FGD installations are released into the ambientair with exhaust gases. Coal combustion products are there-fore divided into two parts: bottom ash and CFA.
The difficulties with CFA and TEs emission estima-tions are caused by the transformations that mineral sub-stances and TEs undergo during coal combustion. Theseprocesses are dependent on many factors, such as parentcoal grain size distribution, the mode of occurrence of TEsin coal, furnace type and construction, and combustionconditions, as well as the interactions of different ele-ments during and after combustion. In most cases thetransformations of TEs and mineral substances depend onthe distribution of inorganic compounds in coal. Themajority of mineral substances occur as particles sizedfrom 1 to 100 μm. A considerable amount of research hasfocused on understanding how CFA forms and on its char-acteristics [19], but these matters are not fully recognizedso far.
In the process of combustion CFA is predominantlycreated with the participation of the following mecha-nisms:(1) thermal decomposition of mineral matter(2) coalescence of mineral particles(3) direct fragmentation of mineral particles(4) evaporation and subsequent condensation of volatile
mineral elementsAs a result of the first three mechanisms fine particles
are formed, and the last mechanism leads to the formationof submicron particles [34, 40, 44]. Larger particles of flyash are of secondary importance, since they are eliminatedto a high extent in APCDs such as ESP, thanks to whichthey have small impact on the final level of TEs emissions.However, they are important in the formation of a conden-sation layer and in the reactions of TEs vapors, so theyinfluence TEs contents in CFA. Greater importance in theemission of TEs from fossil fuel burning is related to theformation of smaller particles, the sizes of which enablethem to penetrate even through precipitators of relativelyhigh efficiency.
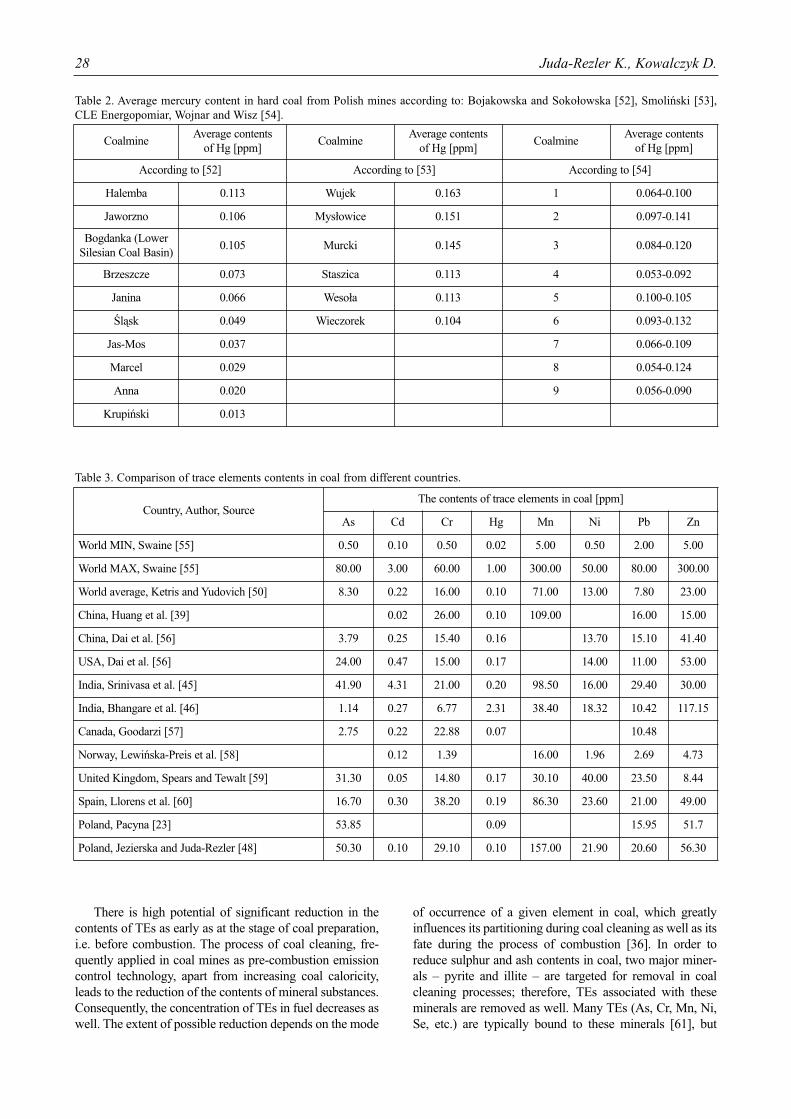
Fig. 2 presents a simplified mechanism of mineralmatter transformation in pulverized coal boilers, whenboth extraneous and organically-bound mineral sub-stances are burned. During heating, coal grains liberatevolatile substances, leaving unburned remains. They reach
30 Juda-Rezler K., Kowalczyk D.
Fig. 2. The mechanism of the transformation of mineral matter during coal combustion in pulverized coal boiler, modified afterTomeczek and Palugniok [34].
Included mineral matter
Extraneous minerals Disintegration Melting and oxidation
Solidation Heating Heating
Coalescence
Homogenous condensation
condensation Heterogenous
NaCl, KCl SiO, MgO HCl
H2O CO CO2
SO2
SO3
H2S
Organically-boundelements
N2, O2
Fly ash 0.02 – 0.2 μm
Fly ash 0.2 – 10 μm
Fly ash 10 – 90 μm
Included minerals
Pyrolysis Combustion Fragmentation
Mineral conversion inreducing atmosphere
Partiallyburned grain

much higher temperatures than mineral particles, whichcontain not more than 10% of organic matter. Ultrafinemineral fly ash particles, sized less than 0.1 µm, areformed from gradually disintegrating non-flammableremains. The decomposition of mineral matter and itssolid phase remains leads to the production of gases thatreact and condense. Condensation and mineral con-stituents fragmentation cause the forming of CFA particlessized 0.02-0.2 µm. The coalescence of small particles cre-ates particles of average size 0.2-10 µm. The largest par-ticles (10-90 µm) are generated from the disintegration ofextraneous minerals [34].
According to many studies the particle size distribution(PSD) of fly ash produced during pulverized coal combus-tion is bimodal [22, 38, 40, 42, 44]. For example, Zhao etal. [42] studied the emission factors from eight Chinesecoal-fired power plants. For all investigated boilers, theseauthors found the bimodal PSD in flue gases after fly ashcollectors (with peaks of submicron and coarse modes at0.2-0.3 and 2-3 µm, respectively). Larger particles originat-ing from extraneous minerals were concentrated to a diam-eter of around 10 µm.
However, recent experimental and modeling studiesreported an additional central particle mode between thecommonly observed two modes of fly ash PSD [71-75].According to Xu et al. [71], the ultrafine mode has a verysmall size distribution (< 0.2 or < 0.3 µm), coarse mode islarger than 3 or 5 µm, and central mode is found in the sizerange of 0.2-3 µm or 0.3-5 µm. The formation of the ultra-fine and the coarse modes are believed to be due to vapor-ization-condensation and mineral coalescence plus charfragmentation, respectively [72, 73], while central mode isattributed to heterogeneous condensation on fine residualash particles [71]. Comparison of the recent results con-cerning tri-modal distribution of CFA particles is shown inFig. 3.
The Influence of Coal Grain Size
and Combustion Conditions
on the Formation of CFA
The grain size of burned coal influences the concentra-tion and particle distribution of CFA. To study these rela-tionships Ninomiya et al. [22] conducted a laboratory-scaleexperiment with a drop-tube furnace. The results show thatwhen the diameter of coal grain decreases, fly ash concen-tration increases. When coal with grain size up to 63 µm isburned, CFA concentration is about three times higher thanin the case of coal with grain diameters between 125 and250 µm [22]. Fig. 4 shows the concentration of fly ash par-ticles as measured in flue gases after combustion of threedifferent Chinese coals with three different grain sizes each.
Size Distribution and Trace Elements... 31
Fig. 3. Comparison of different tri-modal distributions of fly ash particles from the combustion of Chinese coals [71-73] and US coalsfrom Utah, Illinois, and Powder River Basin (PRB) [75].
Fig. 4. Concentration of fly ash particles in flue gases fromburning three different Chinese coals with three different grainsizes each, based on data from [22].
Con
cent
rati
on o
f co
al f
ly a
sh, [
mg/
m3 u]
100000
10000
1000
100
10
10.01 0.1 1 10 100
Aerodynamic diameter, [μm]
Xu et al. [71]
Yu et al. [75], Utah
Yu et al. [72]
Yu et al. [75], Illinois
Zhou et al. [73]
Yu et al. [75], PRB
Con
cent
rati
on o
f fl
y as
h, [
mg/
mu3 ]
150
120
90
60
30
0125-250 63-125 <63
Grain sizes, [μm]
Wangfg YZLS Zhangji
Ultrafinemode
Central mode
Coarse mode

The research of Xiaowei et al. [40] demonstrated thatduring combustion of coal grains of 125-250 µm, the flyash PSD is bimodal with the maxima at around 4.0 µm and10.0 µm. The share of particles smaller than 0.1 µm isinsignificant. Particles sized above 1.0 μm comprise main-ly non-flammable elements. These results show that miner-al constituents are the main factor causing the formation offly ash particles during combustion of coal grains of 125-250 µm. For coal grains of 63-125 µm similar results wereobtained, while for smaller coal grains (< 63 µm) the result-ing PSD differs significantly, especially for submicron par-ticles. The bimodal distribution reaches maximum for 4.0µm and a smaller peak for 0.5 µm particles. For the creationof 4.0 µm diameter particles the transfer of minerals isimportant. In comparison with the two above-mentionedsizes, coal grains sized up to 63 µm are richer in mineralinclusions that can be easily transferred to fly ash particles.On the other hand, a significant amount of ~0.5 µm parti-cles means that other factors may also be involved in theirformation [40].
The size distribution of CFA from EPPs and TPPs is toa large extent dependent also on combustion conditions.There is significant difference in fly ash PSD depending oncombustion temperature and oxygen concentration [40,44]. Xiaowei et al. [40] showed that when the content ofoxygen amounts to 20% and the temperature rises from1375 K to 1525 K, particle concentration rises insignifi-cantly; however, when the temperature increases up to 1675K, a significant concentration increase – more than three-fold for 0.1 µm particles – is observed. There can be tworeasons for the particle concentration increase along withthe temperature. One is that higher temperature causes coalgrain decomposition, which leads to the formation of alarge number of small grains. Each fragment of the decom-posed grain may or may not contain mineral substances.The second reason is that many mineral substances, espe-cially those contained in < 10 µm particles, can separatefrom burning grains and join fly ash without phase alterna-tion (solid-to-particles path). The study of Zhang et al. [44]confirms the increased formation of submicron particleswith the increase of coal combustion temperature.
During the combustion of low-quality coal in low tem-perature, non-flammable oxides, MgO and CaO, are con-sidered to be the compounds that dominate fine fly ash par-ticles, whereas in the case of high-quality coal, SiO2 pre-vails.
The effect of the reaction temperature and the ratio ofNO2 to O2 on the formation of CFA particles with diameter< 10 µm is presented in Fig. 5. The results of the experi-ment show that when O2 concentration accounts for 50%,concentration of < 10 µm particles in flue gases is muchhigher than when it is of 20% [40, 73]. Similar results havebeen obtained by Fix et al. [74], who studied the impact ofexcess air of 5%, 20%, and 35% on fly ash PSD. Theseauthors showed that the low oxygen content is lowering thecoal grain temperature and the mineral components do notmelt and coalesce to form the larger particles; as a result,the finer sized fractions prevail [74].
Trace Elements Enrichment
It is well known that TEs undergo enrichment along thepollution stream in combustion utilities. For the EPPs andTPPs, the enrichment factor expresses the elemental behav-iour during coal combustion in the various streams of coal-fired plants [31, 45, 46]. In order to determine the concen-tration of each TE in combustion products (bottom ash, flyash), the relative enrichment factor (RE) was introduced.RE is variously defined in the literature, one example ofwhich can be the relative enrichment factor suggested byCenni et al. [76]:
(1)
...where Cif stands for trace element i concentration in flyash, and Cib for trace element i concentration in bottom ash.An advantage of this factor is that it comprises only valuesfrom an ash sample, thanks to which there are no errorsresulting from coal analysis.
The enrichment of elements in relation to their contentsin raw coal was studied by Meij [30, 31], who measuredconcentrations and distributions of TEs in coal, bottom ash,pulverized-fuel ash (ash collected in the ESPs), and fly ashin coal-fired power plants in the Netherlands. This authordeveloped a detailed classification of elements based ontheir occurrence and volatility, and defined RE as a ratio ofcombustion product concentration to fuel concentration[30]:
(2)
...where Cin denotes trace element i concentration in variouscombustion products, and Cic describes trace element i con-centration in raw coal. (Aad)c is the percentage content ofash in raw coal.
ifib
ibifCenniRE C
C)C-C(
100/ACCRE cadic
inMeij
32 Juda-Rezler K., Kowalczyk D.
Fig. 5. The effect of reaction temperature and the NO2 to O2 ratioof on the formation of < 10 µm particles, based on data from [40].
Con
cent
rati
on o
f fl
y as
h, [
mg/
mu3 ] 160
140
120
100
80
60
401200 1300 1400 1500 1600 1700
Temperature, [K]
4:1 1:1

The Meij’s classification presented in Table 5 is themost widely used classification of TEs. It was applied bye.g. Li et al. [77], Huang et al. [39], Bhangare et al. [46],Srinivasa et al. [45], and Goodarzi [57].
However, the enrichment factor defined by Meij con-siders only ash contents in raw coal, but it does notinclude its contents in fly and bottom ashes. Therefore, thefollowing improvement was proposed by Huang et al.[39]:
(3)
...where (Aad)n stands for ash concentration in various com-bustion products. The factor reflected by formula (3)describes TE enrichment in various products, normalized tothe content of ash in fuel.
The value of REi = 1 means that TEi is not enriched norimpoverished in fly ash. If REi is larger or smaller than 1,TEi is correspondingly enriched or impoverished. REHuang
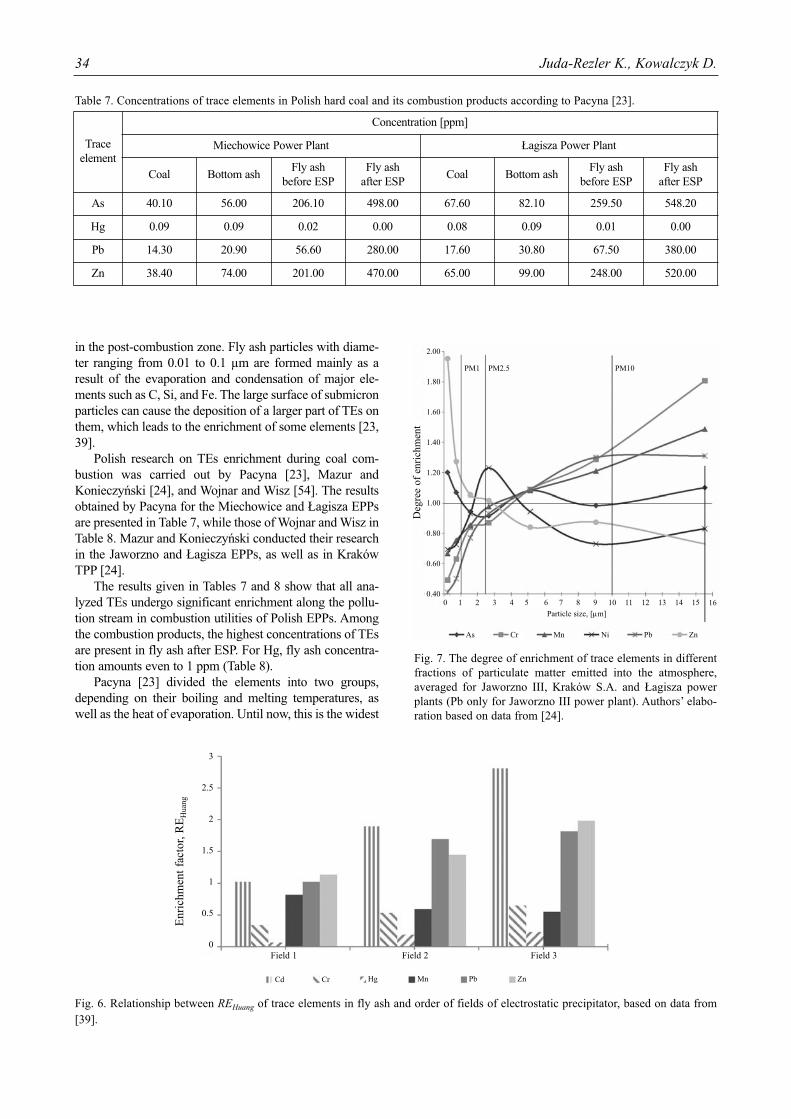
for selected trace metals are presented in Table 6 and Fig. 7.Based on data from Table 6, it can be stated that the
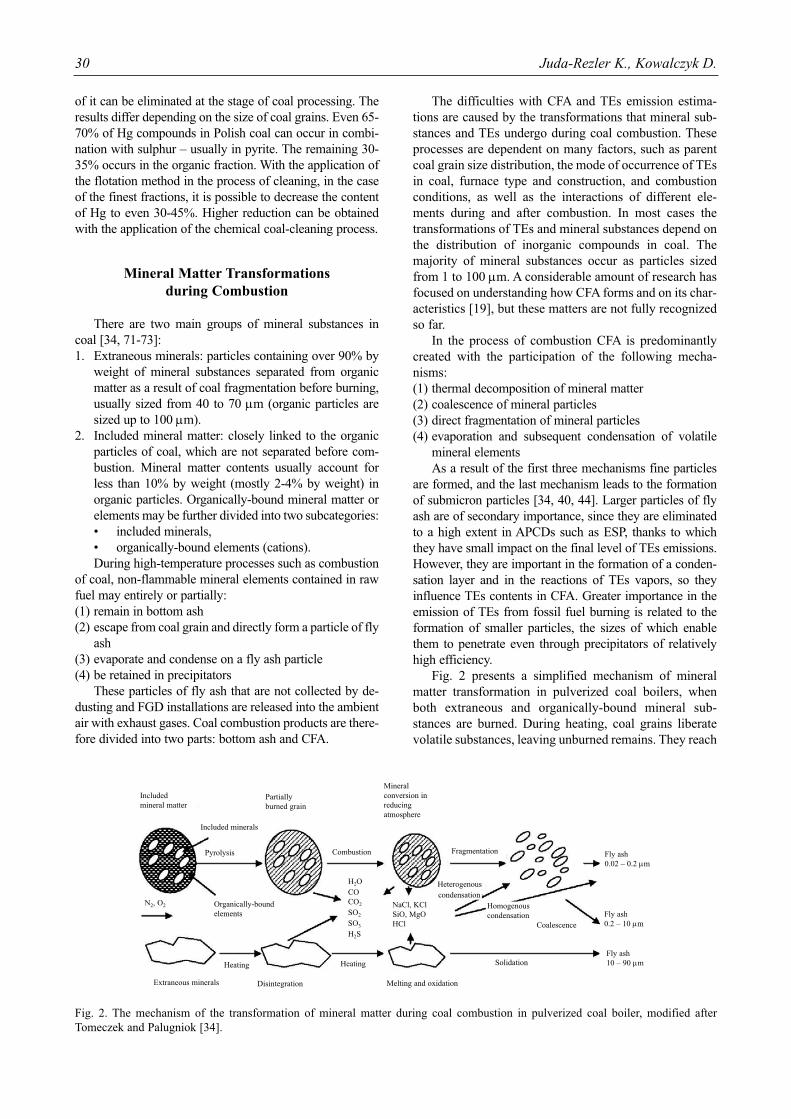
decrease in oxygen concentration (with a slight increase oftemperature) increases the content of some TEs like Cr,Mn, and Zn in the ash, and Hg in the fly ash. For Cd, Pb,and Zn, large enrichment in the last fields of ESP is seen.From Fig. 7 it can also be noticed that the majority of TEshas a tendency to be deposited on smaller particles. Thesmaller the fly ash diameter, the bigger the TE enrichment.Only Mn is characterized by an opposite trend – the small-er the fly ash diameters, the smaller the enrichment factor.Between the first and the third zone of an ESP, particlediameter decreases and fly ash surface increases. Metalsevaporate from coal during combustion and condense again
nad
cad
ic
inHuang A
ACCRE
Size Distribution and Trace Elements... 33
Table 5. Meij’s [31] classification of elements based on their behaviour during combustion in boilers and with their relative enrich-ment (RE) factors.
Class RE factor Classified elements Behavior in installation
I ~ 1 Al, Ca, Ce, Cs, Eu, Fe, Hf, K, La, Mg, Sc, Sm, Si, Sr, Th, and Ti Not volatile
II a > 4 Ba, Cr, Mn, Na, and RbVolatile in boiler, but complete condensa-
tion in ESP on the fly ash particles II b 2 < - ≥ 4 Be, Co, Cu, Ni, P, U, V, and W
II c 1.3<-<2 As, Cd, Ge, Mo, Pb, Sb, Tl, and Zn
III << 1 B, Br, C, Cl, F, Hg, I, N, S, and SeVery volatile: some to hardly any conden-
sation on fly ash particles in ESP
Table 6. Enrichment factors of trace elements as obtained by Huang et al. [39] (REHuang) for different conditions of combustion in apulverized coal boiler with three-field electrostatic precipitator.
Sample origin
Samplenumber
Furnace tem-perature [K]
Excess airfactor [-]
Relative enrichment factor REHuang [-]
Cd Cr Hg Mn Pb Zn
Bottom ash(REb)
01-01 1417 1.34 1.317 0.656* 0 1.024 0.170 0.388
02-01 1437 1.37 0.730 0.519 0 0.942 0.351 0.524
03-01 1412 1.47 1.591 0.584 0 0.883 0.347 0.888
04-01 1363 1.48 0.931 0.564 0 0.831 0.470 0.525
05-01 1306 1.47 1.048 0.578 0 0.820 0.393 0.489
Fly ash(REf)
01-02 1417 1.34 0.818 0.336 0.363 0.764 1.022 0.921
02-02 1437 1.37 0.900 0.333 0.306 0.807 1.190 1.108
03-02 1412 1.47 1.076 0.394 0.263 0.849 0.918 1.184
04-02 1363 1.48 1.090 0.354 0.199 0.862 1.107 1.181
05-02 1306 1.47 1.014 0.299 0.127 0.850 1.141 1.014
Fields 1 (REf) 01-03 1390 1.49 1.024 0.341 0.068 0.821 1.024 1.138
Fields 2 (REf) 02-03 1.895 0.534 0.190 0.596 1.692 1.444
Fields 3 (REf) 03-03 2.807 0.650 0.232 0.552 1.818 1.984
* Minimum and maximum values are in bold
in the post-combustion zone. Fly ash particles with diame-ter ranging from 0.01 to 0.1 µm are formed mainly as aresult of the evaporation and condensation of major ele-ments such as C, Si, and Fe. The large surface of submicronparticles can cause the deposition of a larger part of TEs onthem, which leads to the enrichment of some elements [23,39].
Polish research on TEs enrichment during coal com-bustion was carried out by Pacyna [23], Mazur andKonieczyński [24], and Wojnar and Wisz [54]. The resultsobtained by Pacyna for the Miechowice and Łagisza EPPsare presented in Table 7, while those of Wojnar and Wisz inTable 8. Mazur and Konieczyński conducted their researchin the Jaworzno and Łagisza EPPs, as well as in KrakówTPP [24].
The results given in Tables 7 and 8 show that all ana-lyzed TEs undergo significant enrichment along the pollu-tion stream in combustion utilities of Polish EPPs. Amongthe combustion products, the highest concentrations of TEsare present in fly ash after ESP. For Hg, fly ash concentra-tion amounts even to 1 ppm (Table 8).
Pacyna [23] divided the elements into two groups,depending on their boiling and melting temperatures, aswell as the heat of evaporation. Until now, this is the widest
34 Juda-Rezler K., Kowalczyk D.
Fig. 6. Relationship between REHuang of trace elements in fly ash and order of fields of electrostatic precipitator, based on data from[39].
Fig. 7. The degree of enrichment of trace elements in differentfractions of particulate matter emitted into the atmosphere,averaged for Jaworzno III, Kraków S.A. and Łagisza powerplants (Pb only for Jaworzno III power plant). Authors’ elabo-ration based on data from [24].
Table 7. Concentrations of trace elements in Polish hard coal and its combustion products according to Pacyna [23].
Traceelement
Concentration [ppm]
Miechowice Power Plant Łagisza Power Plant
Coal Bottom ashFly ash
before ESPFly ash
after ESPCoal Bottom ash
Fly ashbefore ESP
Fly ash after ESP
As 40.10 56.00 206.10 498.00 67.60 82.10 259.50 548.20
Hg 0.09 0.09 0.02 0.00 0.08 0.09 0.01 0.00
Pb 14.30 20.90 56.60 280.00 17.60 30.80 67.50 380.00
Zn 38.40 74.00 201.00 470.00 65.00 99.00 248.00 520.00
Enr
ichm
ent
fact
or, R
EH
uang
3
2.5
2
1.5
1
0.5
0Field 1 Field 2 Field 3
Cd Cr Hg Mn Pb Zn
Deg
ree
of e
nric
hmen
t
2.00
1.80
1.60
1.40
1.20
1.00
0.80
0.60
0.400 1 2 3 4 5 6 7 8 9 10 11 12 13 14 15 16
Particle size, [μm]
As Cr Mn Ni Pb Zn
PM1 PM2.5 PM10
TEs classification reported in Poland. This author conclud-ed that [23]: (1) the more volatile the metal, the better it enriches(2) low-volatile metals are subject to little enrichment com-
pared to highly volatile ones (3) the more non-metallic properties a metal has, the greater
its enrichment along the pollutant stream (due to theionic potential of non-metallic TEs)
(4) the metals from the low volatile group (Na, Fe, Ca) areabsorbed mainly by particles containing metals fromthe highly volatile group (As, Zn, Pb, Mo, Sb, Cu)
(5) the most volatile metals (like Hg and Se) partially pen-etrate electrostatic precipitators in the gaseous state
While in the case of most TEs contained in coal theprocess of evaporation plays a significant role, for Hg theprocesses that have lead to condensation are more impor-tant. In combustion conditions Hg acquires a totallygaseous state: Hg0. The oxidation of elemental Hg in thegaseous state begins at a temperature of around 350 K.According to the measurements of Hg emissions from dif-ferent boilers, 5-95% of gaseous Hg can occur in the oxi-dized form of Hg+ [31].
Several authors have further studied the partitioning ofTEs between different combustion products and classifiedthese elements into three main groups [23, 31, 32, 39, 45,46]: (1) very volatile TEs that remain in gaseous phase through
the entire process (Hg is classified to this group by themajority of authors)
(2) partially volatile TEs that are emitted mostly in fly ashwhile flue gas cools down
(3) hardly volatile TEs that are equally distributed betweenbottom ash and fly ashHowever, the classification criterion applied in these
studies was not entirely the same, have nor all the elementsbeen considered. Moreover, country-specific coal proper-ties, as well as power plant characteristics, influence theresults. For example, Pacyna [23] classified As and Zn(which correspond to [24] and [46]), as well as Pb and Cu(which is contradictory to both [24] and [46]) to group 2;while Mg (which is inconsistent with [46]) to group 3.Highly toxic elements, Cd and Cr, were not analyzed byPacyna [23], but in other studies Cd was found to bevolatile [39] or semi-volatile [46]. Cr is the most difficult toclassify, as its mode of occurrence in coal is known with theleast confidence [78]; as it was already discussed, it may beassociated with both organic and mineral parts of coal.Although some authors classified Cr to group 3 [46], the
Size Distribution and Trace Elements... 35
Table 8. Mercury concentrations in Polish hard coal and itscombustion products based on measurements of CLEEnergopomiar, according to Wojnar and Wisz [54].
Object
Concentration of Hg [ppm]
CoalBottom ash (dry mass)
Fly ash (dry mass)
1 0.064-0.100 0.009-0.016 0.126-0.265
2 0.097-0.141 0.006-0.010 0.445-1.000
3 0.084-0.120 0.002-0.005 0.372-0.468
4 0.053-0.092 0.002-0.011 0.187-0.476
5 0.100-0.105 0.004-0.005 0.374-0.486
6 0.093-0.132 0.002-0.005 0.224-0.229
7 0.066-0.109 0.005-0.017 0.318-0.554
8 0.054-0.124 0.004-0.011 0.229-0.539
9 0.056-0.090 0.013-0.030 0.378-0.710
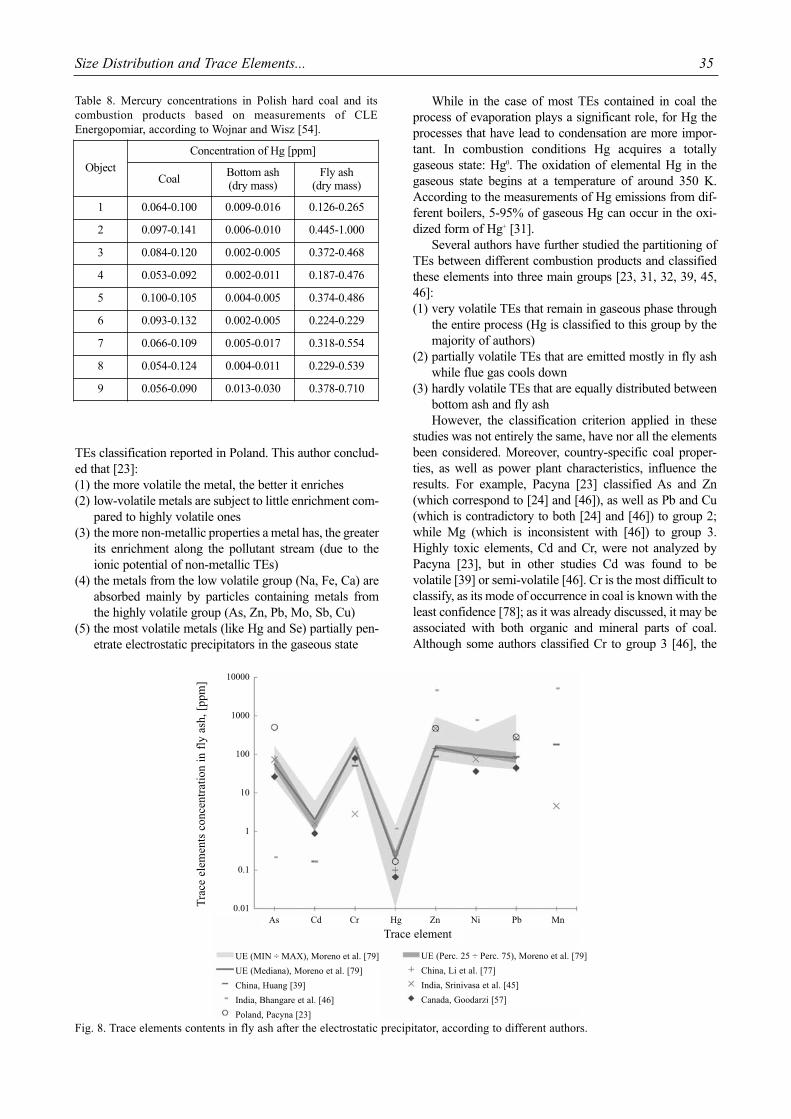
Fig. 8. Trace elements contents in fly ash after the electrostatic precipitator, according to different authors.
Tra
ce e
lem
ents
con
cent
rati
on i
n fl
y as
h, [
ppm
] 10000
1000
100
10
1
0.1
0.01As Cd Cr Hg Zn Ni Pb Mn
Trace element
UE (MIN ÷ MAX), Moreno et al. [79]
UE (Mediana), Moreno et al. [79]
China, Huang [39]
India, Bhangare et al. [46]
Poland, Pacyna [23]
UE (Perc. 25 ÷ Perc. 75), Moreno et al. [79]
China, Li et al. [77]
India, Srinivasa et al. [45]
Canada, Goodarzi [57]

more adequate solution was proposed by Huang et al. [39],who proposed classifying Cr to group 3, but only if most ofit in coal is associated with minerals. In the case when mostCr is associated with organics, it should constitute a specialgroup. In addition, TEs associated with sulphide mineralsand organic matter were found to be more volatile com-pared to those in different chemical forms, like oxides [46].
Mazur and Konieczyński examined TEs enrichment inselected particle fractions f, which is reflected by equation4 [24]:
(4)
...where Swf stands for the degree of TE enrichment in par-ticle fraction f, Cf for TE concentration in particle fractionf, µg/g, and Csr for average weighted concentration withweights reflecting mass percent share of individual frac-tions in the emitted fly ash μg/g. Herein we averaged Swf
calculated by Mazur and Konieczyński [24] for differentPolish plants in order to obtain the pattern of enrichmentof selected TEs in different fractions of emitted fly ash(Fig. 7).
From the results presented in Fig. 7 it can be concludedthat As and Zn are enriched in the emitted submicron par-ticulates, Ni in the fine ones, while Cr, Mn, and Pb in thecoarse and bigger particulates. Concerning Mn, theseresults correspond to Huang et al. [39] and to Bhangare etal. [46].
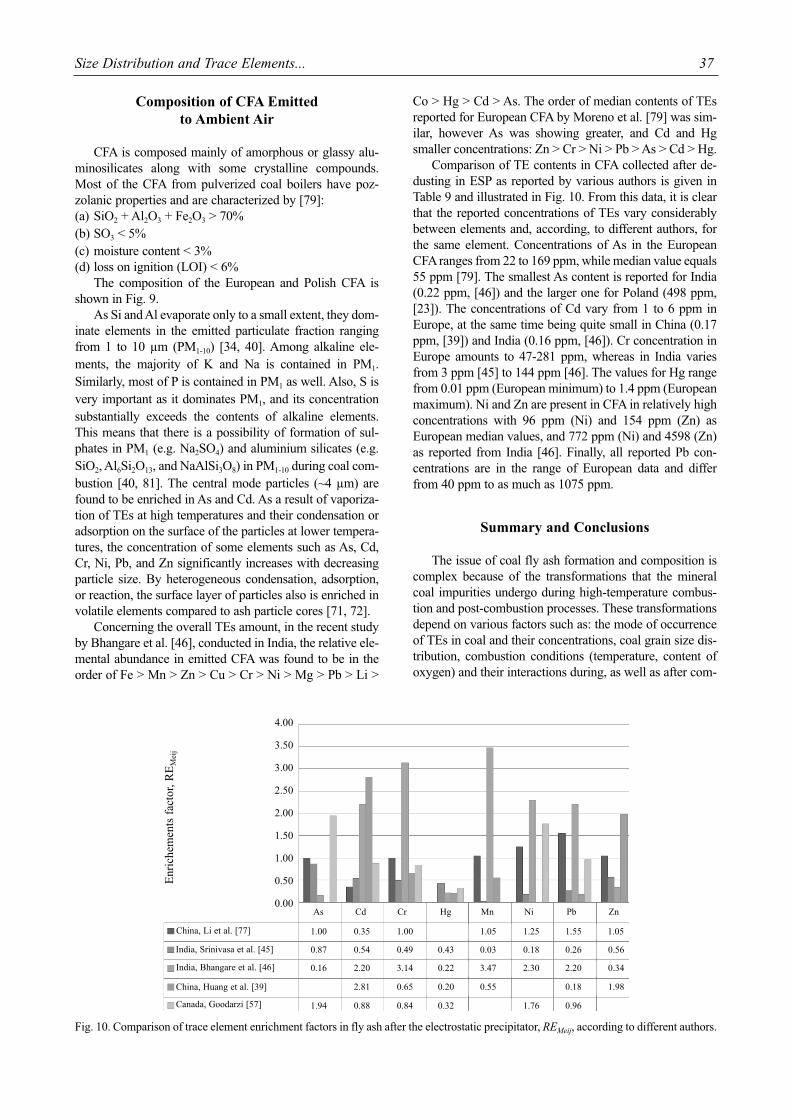
Finally, it should be pointed out that the discrepanciesin the classification of TEs described above are also pre-sent in the degree of enrichment assigned to them by dif-ferent authors. For example, the majority of authors agreethat Cd undergoes high enrichment in CFA [31, 32, 38, 45,46], while Na is not enriched [23, 31, 32]. In the case ofAs and Pb, the results are dispersed; some authors report
high As [23, 31, 32] and Pb [23, 31, 32, 39, 46] enrich-ment, while others did not find it for As [24, 46] nor Pb[24, 45]. In addition, the enrichment of As was found toincrease highly along with combustion temperature [35,36]. Comparison of RE factors obtained by variousauthors is shown in Fig 8.
sr
ffSw
CC
36 Juda-Rezler K., Kowalczyk D.
Fig. 9. The mineralogical and chemical composition of fly ashfrom coal combustion in energy and transformation industries.Data for Europe averaged for 23 sources by Moreno et al. [79],Polish sources based on Galos and Uliasz-Bocheńczyk [80](missing components for Polish power plants included in theitem – the rest).
Table 9. Trace elements contents in fly ash after the electrostatic precipitator according to different authors.
Country, Author, sourceTrace elements contents in fly ash after the electrostatic precipitator [ppm]
As Cd Cr Hg Mn Ni Pb Zn
Europe, MIN, Moreno et al. [79] 22.00 1.00 47.00 0.01 49.00 40.00 70
Europe, Perc.25, Moreno et al. [79] 40.00 1.00 137.00 0.20 87.00 59.00 123
Europe, Median, Moreno et al. [79] 55.00 2.00 148.00 0.20 96.00 80.00 154
Europe, Perc.75, Moreno et al. [79] 97.00 2.00 172.00 0.30 144.00 109.00 175
Europe, MAX, Moreno et al. [79] 162.00 6.00 281.00 1.40 377.00 1075.00 924
China, Li et al. [77] 27.33 71.33 0.10 41.50 140
China, Huang et al. [39] 0.17 50.00 0.07 178 86.00 88
India, Srinivasa et al. [45] 72.30 1.57 2.80 0.29 4 73.90 266.10 465
India, Bhangare et al. [46] 0.22 0.16 143.86 1.18 5116 771.82 238.93 4598
Canada, Goodarzi [57] 25.81 0.87 78.34 0.07 35.68 44.28
Poland, Pacyna [23] 498.00 0.17 280.00 470
Sha
re, [
%]
100%
90%
80%
70%
60%
50%
40%
30%
20%
10%
0%EU TPP EPP EPP EPP TPP
Siekierki Rybnik Opole Łaziska Wrocław
SiO2
C
SO3
N
Rest
AI2O3
K2O
P2O5
TEs
Fe2O3
MgO
Na2O
Moisture
CaO
TiO2
MnO
Loss on ignition
Composition of CFA Emitted
to Ambient Air
CFA is composed mainly of amorphous or glassy alu-minosilicates along with some crystalline compounds.Most of the CFA from pulverized coal boilers have poz-zolanic properties and are characterized by [79]: (a) SiO2 + Al2O3 + Fe2O3 > 70%(b) SO3 < 5%(c) moisture content < 3% (d) loss on ignition (LOI) < 6%
The composition of the European and Polish CFA isshown in Fig. 9.
As Si and Al evaporate only to a small extent, they dom-inate elements in the emitted particulate fraction rangingfrom 1 to 10 µm (PM1-10) [34, 40]. Among alkaline ele-ments, the majority of K and Na is contained in PM1.Similarly, most of P is contained in PM1 as well. Also, S isvery important as it dominates PM1, and its concentrationsubstantially exceeds the contents of alkaline elements.This means that there is a possibility of formation of sul-phates in PM1 (e.g. Na2SO4) and aluminium silicates (e.g.SiO2, Al6Si2O13, and NaAlSi3O8) in PM1-10 during coal com-bustion [40, 81]. The central mode particles (~4 µm) arefound to be enriched in As and Cd. As a result of vaporiza-tion of TEs at high temperatures and their condensation oradsorption on the surface of the particles at lower tempera-tures, the concentration of some elements such as As, Cd,Cr, Ni, Pb, and Zn significantly increases with decreasingparticle size. By heterogeneous condensation, adsorption,or reaction, the surface layer of particles also is enriched involatile elements compared to ash particle cores [71, 72].
Concerning the overall TEs amount, in the recent studyby Bhangare et al. [46], conducted in India, the relative ele-mental abundance in emitted CFA was found to be in theorder of Fe > Mn > Zn > Cu > Cr > Ni > Mg > Pb > Li >
Co > Hg > Cd > As. The order of median contents of TEsreported for European CFA by Moreno et al. [79] was sim-ilar, however As was showing greater, and Cd and Hgsmaller concentrations: Zn > Cr > Ni > Pb > As > Cd > Hg.
Comparison of TE contents in CFA collected after de-dusting in ESP as reported by various authors is given inTable 9 and illustrated in Fig. 10. From this data, it is clearthat the reported concentrations of TEs vary considerablybetween elements and, according, to different authors, forthe same element. Concentrations of As in the EuropeanCFA ranges from 22 to 169 ppm, while median value equals55 ppm [79]. The smallest As content is reported for India(0.22 ppm, [46]) and the larger one for Poland (498 ppm,[23]). The concentrations of Cd vary from 1 to 6 ppm inEurope, at the same time being quite small in China (0.17ppm, [39]) and India (0.16 ppm, [46]). Cr concentration inEurope amounts to 47-281 ppm, whereas in India variesfrom 3 ppm [45] to 144 ppm [46]. The values for Hg rangefrom 0.01 ppm (European minimum) to 1.4 ppm (Europeanmaximum). Ni and Zn are present in CFA in relatively highconcentrations with 96 ppm (Ni) and 154 ppm (Zn) asEuropean median values, and 772 ppm (Ni) and 4598 (Zn)as reported from India [46]. Finally, all reported Pb con-centrations are in the range of European data and differfrom 40 ppm to as much as 1075 ppm.
Summary and Conclusions
The issue of coal fly ash formation and composition iscomplex because of the transformations that the mineralcoal impurities undergo during high-temperature combus-tion and post-combustion processes. These transformationsdepend on various factors such as: the mode of occurrenceof TEs in coal and their concentrations, coal grain size dis-tribution, combustion conditions (temperature, content ofoxygen) and their interactions during, as well as after com-
Size Distribution and Trace Elements... 37
Fig. 10. Comparison of trace element enrichment factors in fly ash after the electrostatic precipitator, REMeij, according to different authors.
Enr
iche
men
ts f
acto
r, R
EM
eij
4.00
3.50
3.00
2.50
2.00
1.50
1.00
0.50
0.00
China, Li et al. [77]
India, Srinivasa et al. [45]
India, Bhangare et al. [46]
China, Huang et al. [39]
Canada, Goodarzi [57]
As Cd Cr Hg Mn Ni Pb Zn
1.00 0.35 1.00
0.43
1.05 1.25 1.55 1.05
0.56
0.34
1.98
0.26
2.20
0.18
0.96
0.18
2.30
1.76
0.03
3.47
0.55
0.22
0.20
0.49
3.14
0.65
0.84 0.32
0.54
2.20
2.81
0.88
0.87
0.16
1.94

bustion. In this paper we compared and analyzed the exper-imental data concerning TEs emissions from bituminouscoal combustion in pulverized coal boilers for heat andelectricity production purposes.
The results show that the particulate size distribution ofCFA is bi- or tri-modal and influenced primarily by the tem-perature of combustion. High temperature causes moreultrafine (with diameter < 0.1 µm) and medium (with diam-eter < 5 µm) particles to be formed, and the excess air deter-mines which fraction prevails. When the concentration ofoxygen is high, medium fraction dominates. The majorityof TEs have a tendency to deposit on smaller particles.Therefore, the smaller the diameter of fly ash, the higher theenrichment of trace elements. Volatile metals having non-metallic properties – As, Cu, Mo, Pb, Sb, and Zn – are usu-ally more enriched along the pollution stream.
Based on the comparative analysis of the results obtainedby different researchers, we can determine three groups ofelements. The first group comprises Cr, Mn, and Pb, themajority of which is contained in the coarse fraction of emit-ted fly ash (PM2.5-10) and larger. The second group includesAs and Zn, which are contained mainly in submicron PM1
particles and even ultrafine PM0.1 ones due to fly ash frag-mentation. The third group contains Ni, the highest concen-trations of which are observed in particles with diameters of2.5 µm and 5 µm. Additionally, Hg is mainly present in thegaseous part of exhaust gases as a result of high combustiontemperature. When the excess air factor increases, theincrease in the enrichment factor of Cd, Cr, Mn, and Zn inCFA can be noticed, while the enrichment of Hg decreases.
Relatively high concentrations of Cr, Ni, Pb, and As inthe European CFA emitted to ambient air from power plantsare of great concern because of the underlying health risksof these trace elements. In addition, the elements enrichedwithin very fine and ultrafine fractions of CFA are able topenetrate lungs and get into the blood circulation system,posing a serious threat to human health. We showed that Asis typically accumulated in these fractions, which is espe-cially dangerous, as this TE has been classified by theWHO as carcinogenic and is also known to cause chronicdiseases and damage to the digestive system, as well asanaemia [20, 82]. Moreover, in the recent study of Juda-Rezler et al. [83], As was found to be a marker of industri-al sources of PM.
Except for the above findings, it should be highlightedthat our review of the literature clearly demonstrates thatalthough the formation of the CFA, its PSD, and composi-tion is fairly well understood, its dependence on the type ofcoal burned, combustion conditions, and the applied fluegas cleaning technology is so large that research should beundertaken for each specific coal rank, its depositionalenvironment, and combustion facility.
Finally, it should be also pointed out that coal combus-tion for power and heat generation is a main source of Hgemissions in Poland (56% of total Hg emission) and a sig-nificant source of Ni emissions (20% of total Ni emissions)[84]. For other TEs analyzed herein, the combustionprocesses in industry (for As and Pb); in residential sector
(for Cd, Cr and Ni) or in both industry and residential sec-tors (Zn), dominate in total country emissions. Therefore, itseems essential to carry out research on the impact of coalparameters and conditions of combustion process on thevolume, size, distribution and composition of CFA emittedfrom different sectors of the national economy. The resultsof such research would enable the application of the bestsolutions in order to reduce exposure of the population tothe negative impacts of particulate matter and toxic traceelements therein.
Acknowledgements
This work was supported by the Polish Ministry ofScience and Higher Education under project No. N N523616139.
References
1. WHO, 2006. Air quality guidelines. Global update 2005.Particulate matter, ozone, nitrogen dioxide and sulfur diox-ide, WHO Regional Office for Europe, Copenhagen, 2006.
2. WHO, 2007. Health relevance of particulate matter fromvarious sources. WHO Regional Office for Europe,Copenhagen, 2007.
3. FENGER J. Air pollution in the last 50 years – From local toglobal. Atmos. Environ. 43, 13, 2009.
4. HARRISON R.M., STEDMAN J., DERWENT D. NewDirections: Why are PM10 concentrations in Europe notfalling? Atmos. Environ. 42, (3), 603, 2008.
5. HITZENBERGER R, TURSIC J. (Eds), Particulate Matter– Properties Related to Health Effects, Final ScientificReport of COST Action 633, 2009. available at:http://www2.dmu.dk/atmosphericenvironment/COST633/Downloads/Final_report_part_2_May2009.pdf
6. POPE C.A.III, BURNETT R.T., THUN M.J., CALLE E.E.,KREWSKI D., ITO K., THURSTON G.D. Lung cancer,cardiopulmonary mortality and long-term exposure to fineparticulate air pollution. J. Am. Med. Assoc. 287, 1132,2002.
7. BRUNEKREEF B., FORSBERG B. Epidemiological evi-dence of effects of coarse airborne particles on health. Eur.Respiro. J. 26, 309, 2005.
8. BOLDO E., MEDINA S., LETERTRE A., HURLEY F.,MUCKE H-G., BALLESTER F., AGUILERA I., EIL-STEIN D. APHEIS: Health impact assessment of long-termexposure to PM2.5 in 23 European cities. Environ.Epidemiol. 21, (6), 449, 2006.
9. BROOK R. D., RAJAGOPALAN S., POPE C. A., 3RD,BROOK J. R., BHATNAGAR A., DIEZ-ROUX A. V.,HOLGUIN F., HONG Y., LUEPKER R. V., MITTLEMANM. A., PETERS A., SISCOVICK D., SMITH S. C., JR.,WHITSEL L., KAUFMAN J. D. Particulate matter air pol-lution and cardiovascular disease: An update to the scientif-ic statement from the American Heart Association.Circulation. 121, 2331, 2010.
10. Clean Air for Europe (CAFE) (COM(2001)245), 2001.11. DE LEEUW F., HORÁLEK J. Assessment of the health
impacts of exposure to PM2.5 at a European level. TheEuropean Topic Centre on Air and Climate Change,ETC/ACC Technical Paper 2009/1, Bilthoven 2009.
38 Juda-Rezler K., Kowalczyk D.

12. BP, 2011. BP Statistical Review of World Energy. BP, June2011.
13. BLISSETT R.S., ROWSON N.A. A review of the multi-component utilisation of coal fly ash. Fuel. 97, 1, 2012.
14. LIOR N. Sustainable energy development: the present(2009) situation and possible paths to the future. Energy. 35,(10), 3976, 2010.
15. IZQUIERDO M., QUEROL X. Leaching behaviour of ele-ments from coal combustion fly ash: An overview. Int. J.Coal Geol. 94, 54, 2012.
16. WAGNER N.J., TLOTLENG M.T. Distribution of selectedtrace elements in density fractionated Waterberg coals fromSouth Africa. Int. J. Coal Geol. 94, 225, 2012.
17. VASSILEV S.V., VASSILEVA C.G. Methods for character-ization of composition of fly ashes from coal-fired powerstations: a critical overview. Ener. Fuel. 19, (3), 1084, 2005.
18. RODRIGUES S., MARQUES M., WARD C.R., SUÁREZ-RUIZ I., FLORES D. Mineral transformations during hightemperature treatment of anthracite. Int. J. Coal Geol, 94,191, 2012.
19. EPRI, 2010. Comparison of Coal Combustion Products toOther Common Materials: Chemical Characteristics.Electric Power Research Institute, Palo Alto, 2010.
20. WHO, 2000. Air Quality Guidelines for Europe. Second edi-tion. WHO Regional Office for Europe, Copenhagen 2000.
21. WHO, 2007. Health risks of heavy metals from long-rangetransboundary air pollution. WHO Regional Office forEurope, Copenhagen 2007.
22. NINOMIYA Y., ZHANG L., SATO A., DONG Z. Influenceof coal particle size on particulate matter emission and itschemical species produced during coal combustion. Fuel.Process. Technol. 85, 1065, 2004.
23. PACYNA J. Coal-fired power plants as a source of environ-mental contamination by trace metals and radionuclides.Habituation thesis. Technical University of Wroclaw.Wrocław 1980 [In Polish].
24. MAZUR J., KONIECZYŃSKI J. Distribution of trace ele-ments in granulometric fractions of fly-ash emitted frompower stations. Monograph No. 64. Silesian University ofTechnology. Gliwice 2004 [In Polish].
25. STEC K., KONIECZYŃSKI J. Emissions of hazardous traceelements from various boilers burning coal. In: Air Protectionin Theory and Practice, Volume 1, edited by: KonieczyńskiJ., Institute of Environmental Engineering, Polish Academyof Sciences, Zabrze, pp. 163-175, 2010 [In Polish].
26. KONIECZYŃSKI J. (Eds.): Properties of respirable dustemitted from the selected installation. Institute ofEnvironmental Engineering, Polish Academy of Sciences,Papers and Studies, No. 79, Zabrze, 2010 [In Polish].
27. PACYNA J. M., PACYNA E. G., AAS W. Changes of emis-sions and atmospheric deposition of mercury, lead, and cad-mium in. Europe. Atmos. Environ. 43, 117, 2009.
28. PACYNA J. M., PACYNA E. G. An assessment of globaland regional emissions of trace metals to the atmospherefrom anthropogenic sources worldwide. Environ. Rev. 9,(4), 269, 2001.
29. KAKAREKA S., GROMOV S., PACYNA J.,KUKHARCHYK T. Estimation of heavy metal emissionfluxes on the territory of the NIS. Atmos. Environ. 38, 7101,2004.
30. MEIJ R. Trace Element Behavior in Coal-Fired PowerPlants. Fuel. Process. Technol. 39, 199, 1994.
31. MEIJ R., WINKEL H. The emissions of heavy metals andpersistent organic pollutants from modern coal-fired powerstations. Atmos. Environ. 41, 9262, 2007.
32. QUEROL X., FERNÁNDEZ-TURIEL JL., LÓPEZ-SOLER A. Trace elements in coal and their behaviour dur-ing combustion in a large power station. Fuel. 74, 331, 1995.
33. MORENO T., ALASTUEY A., QUEROL X., FONT O.GIBBONS W. The identification of metallic elements in air-borne particulate matter derived from fossil fuels atPuertollano, Spain. Int. J. Coal Geol. 71, 122, 2007.
34. TOMECZEK J., PALUGNIOK H. Kinetics of mineral mattertransformation during coal combustion. Fuel. 81, 1251, 2002.
35. SAROFIM A.F., SENIOR C.L., HELBLE J.J. Emissions ofMercury, trace elements, and fine particles from stationarycombustion sources. Fuel. Process. Technol. 65-66, 263, 2000.
36. SENIOR C. L., ZENG T., CHE J., AMES M. R., SAROFIMA. F., OLMEZ I., HUGGINS F. E., SHAH N., HUFFMANG. P., KOLKER A., MROCZKOWSKI S., PALMER C.,FINKELMAN R. Distribution of trace elements in selectedpulverized coals as a function of particle size and density.Fuel. Process. Technol. 63, (2-3), 215, 2000.
37. SENIOR C.L., BOOL L.E., SRINIVASACHAR S., PEASEB.R., PORLE K. Pilot scale study of trace element vapor-ization and condensation during combustion of a pulverizedsub-bituminous coal. Fuel Process. Technol. 63, (2-3), 149,2000.
38. CLACK H.L. Bimodal fly ash size distributions and theirinfluence on gas-particle mass transfer during electrostaticprecipitation. Fuel. Process. Technol. 87, 987, 2006.
39. HUANG Y., BAOSHENG J., ZHONG Z., XIAO R., TANGZ., REN R. Trace elements (Mn, Cr, Pb, Se, Zn, Cd and Hg)in emissions from a pulverized coal boiler. Fuel. Process.Technol. 86, 23, 2004.
40. XIAOWEI L., MINGHOU X., DUNXI Y., XIANGPENGG., QIAN C., WEI H. Influence of mineral transformationon emission of particulate matters during coal combustion.Front. Environ. Sci. Eng. Chin. 1, 213, 2007.
41. ZHANG J., ZHAO Y., DING F. ZENG H., CHUGUANG Z.Preliminary study of trace element emissions and controlduring coal combustion. Front. Energy Power Eng. China, 1,(3), 273, 2007.
42. ZHAO Y., WANG S. X., NIELSEN C. P., LI X. H., HAO J.M. Establishment of a database of emission factors foratmospheric pollutants from Chinese coal-fired powerplants, Atmos. Environ. 44, (12), 1515, 2010.
43. US EPA, 1995. AP 42, Compilation of Air PollutantEmission Factors – US Environmental Protection Agency,Research Triangle Park. 1995.
44. ZHANG L., NINOMIYA Y., YAMASHITA T. Formation ofsubmicron particulate matter (PM1) during coal combustionand influence of reaction temperature. Fuel. 85, (10-11),1446, 2006.
45. SRINIVASA REDDY M., BASHA S., JOSHI H.V., JHA B.Evaluation of the emission characteristics of trace metalsfrom coal and oil fired power plants and their fate duringcombustion. J. Hazard. Mater. 123, (1-3), 242, 2005.
46. BHANGARE R.C., AJMAL P.Y., SAHU S.K., PANDITG.G., PURANIK V.D. Distribution of trace elements in coaland combustion residues from five thermal power plants inIndia. Int. J. Coal Geol. 86, 349, 2011.
47. MRINAL K. B., PROBHAT K., GOBIN C. B. Distribution,nature of organic/mineral bound elements in Assam coals.Fuel. 82, (14), 1783. 2003.
48. JEZIERSKA D., JUDA-REZLER K. Evaluation of the par-ticipation of power sector in Poland in the emissions ofheavy metals. Scientific Papers of the Warsaw University ofTechnology. Environmental Engineering. WarsawUniversity of Technology. 26, 173, 1998 [In Polish].
Size Distribution and Trace Elements... 39

49. GABZDYL W. Geology of coal deposits: deposits of theworld. Polish Agency for Ecological, Warsaw 1994 [InPolish].
50. KETRIS M. P., YUDOVICH Y. E. Estimations of clarkesfor carbonaceous biolithes: World averages for trace elementcontents in black shales and coals. Int. J. Coal Geol. 78, (2),135, 2009.
51. LUO G., YAO H., XU M., GUPTA R., XU Z. Identifyingmodes of occurrence of mercury in coal by temperature pro-grammed pyrolysis. Proc. Combust. Inst. 33, 2763, 2011.
52. BOJAKOWSKA I., SOKOŁOWSKA G. Mercury in fuelsmined in Poland as a potential source of environmental pol-lution. State Geological Institute Bulletin. 394, 5, 2001 [InPolish].
53. SMOLIŃSKI A. Energy use of coal source of Mercuryemissions - a comparison of the contents of this element incoal. Protection of air and waste problems. 2, (238), 45,2007 [In Polish].
54. WOJNAR K., WISZ J. Mercury in the Polish energy sector.Energy. 2006 [In Polish].
55. SWAINE D. J. Why trace elements are important. Fuel.Process. Technol. 65-66, 21, 2000.
56. DAI S., REN D., CHOU C., FINKELMAN R. B.,SEREDIN V.V., ZHOU Y. Geochemistry of trace elementsin Chinese coals: A review of abundances, genetic types,impacts on human health, and industrial utilization. Int. J.Coal Geol, 2011.
57. GOODARZI F. Characteristics and composition of fly ashfrom Canadian coal-fired power plants. Fuel. 85, (10-11),1418, 2006.
58. LEWIŃSKA-PREIS L., FABIAŃSKA M. J., ĆMIEL S.,KITA A. Geochemical distribution of trace elements inKaffioyra and Longyearbyen coals, Spitsbergen, Norway.Int. J. Coal Geol. 80, (3-4), 211, 2009.
59. SPEARS D.A., TEWALT S.J. The geochemistry of environ-mentally important trace elements in UK coals, with specialreference to the Parkgate coal in the Yorkshire-Nottinghamshire Coalfield, UK. Int. J. Coal Geol. 80, (3-4),157, 2009.
60. LLORENS J.F., FERNÁNDEZ-TURIEL J.L., QUEROL X.The fate of trace elements in a large coal-fired power plant.Environ. Geol, 40, (4-5), 2001.
61. HUGGINS F.E., SEIDU L.B.A., SHAH N., HUFFMANG.P., HONAKER R.Q., KYGER J.R., HIGGINS B.L.,ROBERTSON J.D., SEEHRA S. PAL, M.S. Elementalmodes of occurrence in an Illinois #6 coal and fractions pre-pared by physical separation techniques at a coal preparationplant. Int. J. Coal Geol. 78, (1), 65, 2009.
62. HUGGINS F.E., HUFFMAN G.P. Modes of occurrence oftrace elements in coal from XAFS spectroscopy. Int. J. CoalGeol. 32, 31, 1996.
63. HUGGINS F.E., HUFFMAN G.P. How do lithophile ele-ments occur in organic association in bituminous coals? Int.J. Coal Geol. 58, (3), 193, 2004.
64. FINKELMAN R.B. Modes of occurrence of environmental-ly-sensitive trace elements in coal, Chapter 3 D.J. Swaine, F.Goodarzi (Eds.), Environmental Aspects of Trace Elementsin Coal. Kluwer, Dordrecht: The Netherlands. 312, 24, 1995.
65. RILEY K.W., FRENCH D.H., FARRELL O.P., WOODR.A., HUGGINS F.E. Modes of occurrence of trace andminor elements in some Australian coals. Int. J. Coal Geol.94, 214, 2012.
66. FINKELMAN R. B. Modes of occurrence of potentiallyhazardous elements in coal: levels of confidence. Fuel.Process. Technol. 39, (1-3), 21, 1994.
67. HUGGINS, F.E., ZHAO, J., SHAH, N., HUFFMAN, G.P.Modes of occurrence of trace elements in coal from XAFSspectroscopy. Preprints, Am. Chem. Sot. Div. Fuel Chem. 39
(2), 504, 1994.68. HUGGINS F. E., HUFFMAN G.P. Comment on and adden-
da to “Arsenic in coal: A review” by Yudovich and Ketris.Int. J. Coal Geol. 66, (1-2), 148, 2006.
69. GOODARZI F., HUGGINS F.E., SANEI H. Assessment ofelements, speciation of As, Cr, Ni and emitted Hg for aCanadian power plant burning bituminous coal. Int. J. CoalGeol. 74, (1), 1, 2008.
70. WEN-FENG W., YONG Q., JUN-YI W., JIAN L.Partitioning of hazardous trace elements during coal prepara-tion. Procedia Earth and Planetary Science. 1, (1), 838, 2009.
71. XU M., YU D., YAO H., LIU X., QIAO Y. Coal combus-tion-generated aerosols: Formation and properties. P.Combust. Inst. 33, (1), 1681, 2011.
72. YU D., XU M., YAO H., LIU X., ZHOU K., LI L., WEN C.Mechanisms of the central mode particle formation during pul-verized coal combustion. P. Combust. Inst. 32, (2), 2075, 2009.
73. ZHOU K., XU M., YU D., WEN C., ZHAN Z., YAO H. Theeffects of coal blending on the formation and properties ofparticulate matter during combustion. Chinese. Sci. Bull. 55,(30), 3448, 2010.
74. FIX G., SEAMES W.S., MANN M.D., BENSON S.A.,MILLER D.J. The effect of oxygen-to-fuel stoichiometry oncoal ash fine-fragmentation mode formation mechanisms.Fuel. Process. Technol. 4, (92), 793, 2011.
75. YU D., MORRIS W. J., ERICKSON R., WENDT J. O.L.,FRY A., SENIOR C. L. Ash and deposit formation fromoxy-coal combustion in a 100 kW test furnace. Int. J.Greenh. Gas Con. 5, (1), S159, 2011.
76. CENNI R., FRANDSEN F., GERHARDT T., SPLI-ETHOFF H., HEIN K.R.G. Study on trace metal partition-ing in pulverized combustion of bituminous coal and drysewage sludge. Waste Manage. 18, 433, 1998.
77. LI J., ZHUANG X., QUEROL X., FONT O., MORENO N.,ZHOU J. Environmental geochemistry of the feed coals andtheir combustion by-products from two coal-fired power plantsin Xinjiang Province. Northwest China. Fuel. 95, 446, 2012.
78. HUGGINS F. E., SHAH N., HUFFMAN G. P., KOLKERA., CROWLEY S., PALMER C. A., FINKELMAN R. B.Mode of occurrence of chromium in four US coals. Fuel.Process. Technol. 63, (2-3), 79, 2000.
79. MORENO N., QUEROL X., ANDRÉS J.M., STANTONK., TOWLER M., NUGTEREN H., JANSSEN-JURKOVICOVÁ M., JONES R. Physico-chemical charac-teristics of European pulverized coal combustion fly ashes.Fuel. 84, (11), 1351, 2005.
80. GALOS K., ULIASZ-BOCHEŃCZYK A. Sources andoperation of fly ash from combustion of coal in Poland.Mineral Economy. 21, (1), 23, 2005 [In Polish].
81. KAUPPINEN E.I., PAKKANEN T.A. Coal combustionaerosols: a field study. Environ. Sci. Technol. 24, 1811, 1990.
82. KABATA-PENDIAS A., PENDIAS H. Biogeochemistry oftrace elements. Polish Scientific Publishers PWN. Warsaw1999 [In Polish].
83. JUDA-REZLER K., REIZER M., OUDINET J.-P.Determination and analysis of PM10 source apportionmentduring episodes of air pollution in Central Eastern Europeanurban areas: The case of wintertime 2006. Atmos. Environ.,45, (36), 6557, 2011.
84. KCIE, 2008. Inventory of air emissions of SO2, NOx, CO,NH3, dust, heavy metals, POPs and NMVOC in Poland for2008.
40 Juda-Rezler K., Kowalczyk D.