Review of tropical reservoirs and their fisheries
165
Transcript of Review of tropical reservoirs and their fisheries


Cover photograph:Akosombo Dam, Lake Volta, Ghana.Courtesy: Joe Lapp (www.lappjoe.com).
Photo_Credit.indd 1 29/12/2011 16:12:34

Edited by
P.A.M. van Zwieten Aquaculture and Fisheries GroupWageningen UniversityThe Netherlands
C. Béné Policy, Economics and Social ScienceThe WorldFish Center Penang, Malaysia
J. Kolding Department of BiologyUniversity of BergenHigh Technology CentreBergen, Norway
R. BrummettAgriculture and Rural DevelopmentWorld BankWashington, DC, United States of America
and
J. Valbo-JørgensenFisheries and Aquaculture Resources Use and Conservation DivisionFood and Agriculture Organization of the United NationsRome, Italy
FOOD AND AGRICULTURE ORGANIZATION OF THE UNITED NATIONSRome, 2011
FAOFISHERIES ANDAQUACULTURE
TECHNICAL PAPER
557
Book 1.indb 1 12/29/11 1:16 PM

Book 1.indb 2 12/29/11 1:16 PM

iii
Preparation of this document
This document is based on a report prepared as part of the project “Improved Fisheries Productivity and Management in Tropical Reservoirs,” funded by the CGIAR Challenge Program on Water and Food (www.waterandfood.org) and managed by the WorldFish Center.The project benefited from an international collaboration between the Central Inland Fisheries Research Institute (India), the Lake Nasser Development Authority (Egypt), the National Institute of Oceanography and Fisheries (Egypt), the University of Bergen (Norway), the Water Research Institute (Ghana) and the WorldFish Center.
The present document draws upon three individual desk-based reviews that cover the Indo-Gangetic Basin reservoirs, Lake Nasser and Lake Volta. These individual reviews were prepared by the partners of the project, with major contributions from E.K. Abban, H. Adam, K. Agboga, H.R. Dankwa, O. Habib, P. Katiha, I. Omar, M. Sherata, H.A.R. Soliman, K.K. Vass and M. Zaki.
The final document was peer reviewed by Dr Robin L. Welcomme, who provided valuable suggestions and advice.
van Zwieten, P.A.M.; Béné, C.; Kolding, J.; Brummett, R.; Valbo-Jørgensen, J., eds. Review of tropical reservoirs and their fisheries – The cases of Lake Nasser, Lake Volta and Indo-Gangetic Basin reservoirs.FAO Fisheries and Aquaculture Technical Paper. No. 557. Rome, FAO. 2011. 148 pp.
Book 1.indb 3 12/29/11 1:16 PM

iv
Abstract
Freshwaters contribute 15 percent of the world’s reported fish catch, or about 10.1 million tonnes in 2006, most of which comes from tropical systems. The true contribution of tropical inland fisheries is likely to be higher, as less than half of the inland capture production is actually reported. While reservoir fisheries are already an essential component of this production, the potential of most of them may even exceed their current catch levels. Opportunities exist to increase productivity, provided that environmentally and socially sustainable management systems can be adopted. To realize this untapped potential, it is necessary to improve understanding of the processes influencing reservoir productivity in such a way as to involve both biological principles and stakeholder participation, as each reservoir has different properties and different research and management institutions.
Seen in isolation, catch and productivity data of individual reservoirs may be difficult to interpret. The present technical paper attempts to address this issue by reviewing the knowledge accumulated in reservoirs in some very different tropical river basins: the Indus and Ganges/Brahmaputra Basin in India, the Nile River Basin in Eastern Africa and the Volta River Basin in West Africa. In particular, it focuses on many of the reservoirs of northern India and Pakistan in the Indus and Ganges systems, Lake Nasser in the Nile River and Lake Volta in the Volta River.
Information collated from grey and published literature on the three basins is synthesized and standardized with reference to wider knowledge and up-to-date information on tropical reservoir fisheries. A considerable quantity of data and information were collected on many aspects of the systems of the three reservoirs, including hydrological, biophysical and limnological features, primary production, and fish and fisheries data. This information was condensed and synthesized with the aim of providing a baseline against which the ecological changes that have taken place since impoundment can be described and analysed. Efforts are made to explain changes in fish catch in relation to climatic variations, ecological succession and fishing effort. The review shows that biological data and information are generally available.
However, as is also common elsewhere, all three cases suffer from the general tendency to isolate and compartmentalize research into separate disciplines. Usually, there is very limited cross-disciplinary flow of information or recognition of how results of various disciplines can contribute to a more comprehensive understanding of the behaviour of fish populations, human communities and ecosystems and the productive activities that depend on them. This uniform tendency severely hampered the identification of relevant management actions.
A more pragmatic and holistic understanding of reservoir ecosystems is needed in order to guide the choice of indicators and the development of monitoring systems that can inform management of changes in reservoir productivity and, hence, the potential catch. The next step would be to devise a hierarchy of indicators describing the different ecological and economic processes influencing fisheries catches and to organize monitoring systems around those indicators. Only by combining information across sectoral disciplines will it be possible to reach a better understanding of the processes that drive fish stocks, fisheries and reservoir productivity.
Book 1.indb 4 12/29/11 1:16 PM

v
Contents
Preparation of this document AbstractAcknowledgementsAbbreviations and acronyms
1. GENERAL INTRODUCTION
2. RESERVOIRS IN THE INDO-GANGETIC BASIN OF INDIA 2.1 Introduction 2.2 Description of the area
2.2.1 Geography 2.2.2 Main rivers in the Indo-Gangetic Basin 2.2.3 Climate 2.2.4 Soils 2.2.5 Land use and water extraction 2.2.6 Demography and labour 2.3 Fishery resources and production systems 2.3.1 Rivers 2.3.2 Floodplain wetlands 2.3.3 Estuaries 2.3.4 Reservoirs 2.3.5 Aquaculture 2.4 Morphometric, edaphic, climatic and hydrological features of IGB reservoirs 2.5 Chemical and biological features of IGB reservoirs 2.6 Fish and fisheries in reservoirs 2.6.1 Fish production 2.6.2 Fishing practices 2.6.3 Fishing effort 2.7 Management practices 2.7.1 Stocking and technical management 2.7.2 Socio-economic and institutional settings 2.8 Proposed action plan References
3. LAKE NASSER, EGYPT 3.1 Introduction to the Lake Nasser review 3.2 Physical features 3.2.1 Geographical location 3.2.2 Sedimentation 3.2.3 Physical features of the reservoir 3.2.4 Bottom substrate 3.2.5 Meteorology and evaporation 3.2.6 Water temperature and thermal stratitication
iiiiv
xiixiii
1
5 5667788999
1011 111313
16 18 182525282832 34 34
39 39 4040 40 42434344
Book 1.indb 5 12/29/11 1:16 PM

vi
3.2.7 Transparency 3.3 Hydrological features 3.3.1 Water balance in the basin 3.3.2 Water levels: seasonal variability of the water mass 3.4 Limnological characteristics and primary production 3.4.1 Oxygen 3.4.2 Chemical oxygen demand 3.4.3 Specific conductivity 3.4.4 Acidity (pH) values 3.4.5 Nitrogen 3.4.6 Phosphorus 3.4.7 Dissolved phosphorus balance 3.4.8 Organic matter and silicate 3.4.9 Phytoplankton abundance, chlorophyll a 3.4.10 Primary production 3.4.11 Zooplankton 3.4.12 Bottom fauna 3.4.13 Macrophytes 3.5 The Lake Nasser fisheries 3.5.1 Fish species composition 3.5.2 Developments in catch and fishing effort 3.5.3 Fishery biology 3.6 Stocking and introductions 3.7 Socio-economic aspects of Lake Nasser fisheries 3.7.1 Fishing exploitation rights in the reservoir zones 3.7.2 Fish marketing 3.7.3 Potential of Aswan fish marketing 3.7.4 Fishing labour force on Lake Nasser 3.7.5 Fisheries regulations and development 3.7.6 Impediments to developing Lake Nasser fisheries 3.8 Future development of Lake Nasser fisheries 3.8.1 Development aims 3.8.2 Promoting fisheries development 3.8.3 Development initiatives 3.8.4 Identified information gaps and recommendations References
4. LAKE VOLTA, GHANA 4.1 Introduction to the Lake Volta review 4.2 Physical features: geography, water, climate, soils 4.3 Water level and reservoir area 4.4 Physicochmical and limnological features of reservoir productivity 4.4.1 Water quality 4.4.2 Phytoplankton, zooplankton and primary productivity 4.5 Fish and fisheries of Lake Volta 4.5.1 Estimates of catch 4.5.2 Fish species and trophic categories 4.5.3 Fishing effort: techniques, catch rates and developments 4.5.4 Fishing effort: trophic signature, habitat use, length and resilience of the catch by gear
444545484949505050515252535355585858595959667071717272737373747475767778
85 85878891919394949595
102
Book 1.indb 6 12/29/11 1:16 PM

vii
4.5.5 Developments in total landings and total catch 4.5.6 Developments in composition of landings 4.5.7 Effect of water level on fish production 4.6 External factors affecting Lake Volta fishery productivity 4.6.1 Demography and sociocultural transformation 4.6.2 Urbanization and tourism 4.6.3 Industrialization 4.6.4 Lake transport 4.6.5 Forestry and reforestation 4.6.6 Agricultural practices 4.7 Concluding remarks References
5. GENERAL DISCUSSION 5.1 Is fishing effort driving catch rates or are catch rates driving fishing effort? 5.2 Productivity of reservoirs 5.3 Towards indicator-based management References
APPENDIX 1. Lake Nasser: additional tables
APPENDIX 2. Lake Volta: additional tables and information
107109111118118119119120120120121122
127127130132134
137
141
Book 1.indb 7 12/29/11 1:16 PM

viii
Tables
1 Size and composition of the agricultural labour force in Indo-Gangetic countries 92 River stretches in Indo-Gangetic Basin states in India 103 Potential for enhancing fish production in floodplain wetlands of Indo-Gangetic India 114 Major estuaries of the Indo-Gangetic Basin in India 115 Distribution of reservoirs larger than 10 ha in the Indo-Gangetic Basin by state and area 126 Aquaculture area and production in the Indo-Gangetic Basin in India, by state and area 137 Morphometric and hydrological features of Indo-Gangetic Basin reservoirs 148 Major fish species found in reservoirs of the Indo-Gangetic Basin 199 Fish yield in reservoirs of Indo-Gangetic Basin states in India, by reservoir size 2010 Fish production potential based on morpho-edaphic characteristics and actual catch in Indo-Gangetic Basin reservoirs 2011 Fishery description, productivity, and management in selected reservurs in the Indo-Gangetic Basin 2912 Ranges of pH values along the main channel of Lake Nasser, 1987–1992 5113 Long-term changes in freshwater macrophyte species in Lake Nasser 5814 Main fish families (15) and species (52) in Lake Nasser 5915 Average catch of fish with different feeding habits in three successive periods 6716 Food categories of major fish species in Lake Nasser 6717 Life history parameters of five economically important fish species of Lake Nasser 6818 Estimates of maximum sustainable yield (MSY) and FMSY of various species of Lake Nasser 6919 Lake Nasser zones with exploitation rights granted to companies and cooperatives 7220 Physicochemical data at Ajena, near Akosombo Dam of Lake Volta, 1989 9221 Mean values of limnochemical parameters, Yeji sector of Lake Volta (VII), February 1995-January 1996 9222 Fish species and families of Lake Volta 9723 Seasonality in gear use on Lake Volta 9924 Estimated fishing effort on Lake Volta since 1970, whole reservoir (total) and stratum VII 10025 Estimate of gear numbers on Lake Volta from the frame survey, 1998 10026 Some characteristics of the Lake Volta fishery by stratum, based on the frame survey, 1998 10027 Catch data for selected fishing methods in northern Lake Volta (stratum VII), 1992–93 10128 Regression of annual change in landings in kilogram with changing water level, by species 116
Book 1.indb 8 12/29/11 1:16 PM

ix
Figures
1 The Indus and Ganges Basins 62 Distribution of reservoirs in all size categories in India 123 Basic sediment characteristics in reservoirs of the Indo-Gangetic Basin in India 154 Relation between fish productivity and the relative lake-level fluctuation index 155 Physicochemical characteristics of water in reservoirs of the Indo-Gangetic Basin in India 176 Basic nutrients in the Indo-Gangetic reservoirs of India 177 Gross primary production in IGB reservoirs and zooplankton and phytoplankton densities, as recorded in some Indo-Gangetic Basin reservoirs 188 Fish production in Indo-Gangetic Basin states 199 Plot of yield on surface area for reservoirs for Indo-Gangetic Basin states in India 2110 Plot of fish productivity on surface area for reservoirs for Indo-Gangetic Basin states in India 2211 Distribution of estimated productivity in 98 Indo-Gangetic reservoirs in India 2312 Standardized catches from the Indo-Gangetic Basin reservoirs in selected states, showing the geometric mean and 95 percent confidence limits 2313 Standardized catch of main species from 67 reservoirs of the Indo-Gangetic Basin, showing the geometric mean standardized yield and 95 percent confidence limits 2414 Standardized catch of main species in 67 reservoirs by state, showing the geometric mean standardized yield and 95 percent confidence limits 2415 Number and densities of fishers relative to surface area at full storage level of 67 reservoirs in selected Indo-Gangetic Basin states 2616 Density of fishers in relation to yield per area or productivity in Indo-Gangetic Basin reservoirs 2617 Standardized yield and standardized yield per fisher 2718 Number of stocked fingerlings related to surface area 2819 Standardized stocking rate (number of fingerlings) by state and by species in 245 reservoirs, showing geometric mean and 95 percent confidence interval 3120 Standardized stocking rate in 245 reservoirs by species category and state, showing geometric mean and 95 percent confidence interval 3221 Extent of Lake Nasser at minimum and maximum flood levels, main fishing areas and Khors 4322 Maximum and average air temperature over Lake Nasser and average surface water temeprature 4423 The Nile Basin, showing rivers, lakes and dams 4624 Elevation cross-section of the Nile Basin 46
Book 1.indb 9 12/29/11 1:16 PM

x
25 Average discharge of the main tributaries of the Nile entering Lake Nasser 4726 Developments in live storage of Lake Nasser 4827 Annual maximum and minimum water level in Lake Nasser, and the dead, live and flood-control water levels 4928 Water temperature and oxygen saturation of Lake Nasser and Lake Nubia in 1974 4929 Depth of oxygenated and unoxygenated layers along the main channel of the Aswan High Dam Reservoir 5030 Seasonal local variations in nitrate-nitrogen concentration in Lake Nasser from spring 1982 to winter 1983/84 5131 Phosphorus mass balance for Lakes Nasser and Nubia 5332 Seasonal variation in the major phytoplankton groups at various sites in Lake Nasser 5433 Seasonal variation in mean chlorophyll a concentration in the euphotic zone at various sites in Lake Nasser 5534 Relationship between chlorophyll a concentration and Secchi disc depth 5635 Seasonal variation in gross primary production, net primary production and phytoplankton respiration at various sites in Lake Nasser 5636 Ranges in primary productivity in Lake Nasser 5737 Variations of zooplankton numbers recorded in Lake Nasser, 1970–2005 5738 Officially recorded annual fish catch in Lake Nasser, 1966–2004 6039 Proportion by main categories of officially recorded annual fish catch in Lake Nasser, 1966–2004 6140 Annual recorded catch by species category from Lake Nasser, 1966–2004 6241 Annual variation in number of boats and fishers in Lake Nasser and numbers of fishers per boat 6342 Developments in officially recorded annual landings per boat and per fisher in Lake Nasser 6443 Relationship between detrended mean water level and detrended officially reported tilapia landings two years later 6544 Relationship between total fish production and calculated mean length of shoreline of Lake Nasser 6645 Relationship between female gonad index of Oreochromis niloticus (top) and Sarotherodon galilaeus (bottom) and monthly tilapia yield of Lake Nasser in different years 7046 The Volta Basin, showing political boundaries and important tributaries 8647 Fish landings in Ghana by origin, 1950–2006 8648 Reservoir levels at Akosombo 8849 Seasonal variation in water level in Lake Volta, 1966–2006 8950 Inundation index of Lake Volta 9151 Lake Volta, indicating the eight strata for collecting fishery statistics 9552 Maximum observed total length and trophic level of species of Lake Volta 9853 Range and mean catch per canoe per day at Jaklai (central stratum VII), June 1991–December 1995 10154 The trophic level at which a fishery intervenes 102
Book 1.indb 10 12/29/11 1:16 PM

xi
55 Trophic signature of fishing gear and maximum length of species 10456 Relative length-to-frequency distribution in the catch of dominant gear used in the Lake Volta fishery at Dzemeni, Kpando area 10557 Proportional length frequency distribution of five cichlid species in the catch of an acadja in the Dzemeni area of Lake Volta 10658 Mean habitat left and mean resilience of the catch of 21 types of gear operated in Lake Volta 10759 Estimates of total catch from Lake Volta 10860 Total weight of fish landed from Lake Volta, by stratum, in 2000 10861 Relative changes in catch composition from Lake Volta at Dzemeni and Kpando markets (southern section of the reservoir), 1989–2006 10962 Relative changes in catch composition from Lake Volta at Yeji market (northern section of the reservoir), 1990–2006 11063 Trends in log10-transformed landings (kilograms dry weight) by species group at Dzemeni and Kpando markets between 1989 and 2008 11164 Trends in log10-transformed landings (kilograms dry weight) by species group at Yeji market between 1989 and 2008 11265 Mean trophic levels of landings and the FiB index 11366 Reservoir water levels and commercial catches in stratum VII, July 1989–December 1991 11567 Catch rates and effort density in 15 African lakes and reservoirs 12568 Comparison of productivity of selected lakes and reservoirs 131
Plates
1 Numerous dentritic inlets known as khors greatly enhance the perimeter of the reservoir and are an important feature of Lake Nasser 412 The photograph shows the two dams on the Nile at Adwan: Aswan High Dam, a rock-fill dam completed in 1970, and Aswan Low Dam constructed in 1902 413 Lake Nasser and New Valley development in the Tushka Depression. Photo STS087-758-086 is an oblique view of most of Lake Nasser in November 1997. Water from Lake Nasser eventually may spill over into the lowlands to the west of the reservoir. Photos NM22-705-079 and NM23-703-232 compare water levels in the same section of central Lake Nasser in August 1996 and March 1997 42
Book 1.indb 11 12/29/11 1:16 PM

xii
Acknowledgements
This document is a result of work undertaken by the project “Improved Fisheries Productivity and Management in Tropical Reservoirs”, funded by the CGIAR Challenge Program on Water and Food. Additional support from the WorldFish Center is gratefully acknowledged.
Mr Fabio Carocci, Ms Sylviane Borghesi and Mr Gertjan de Graaf of the FAO Fisheries and Aquaculture Department are thanked for their help in preparing specific graphics (Figures 1, 2, 52, 54 and Plates 1 and 2). Mr Pierre Dubeau prepared Figures 22 and 24 and Ms Jody Russell assisted with obtaining the original high-resolution photographs used for preparing Plate 2. Hatfield Consultants Ltd. provided the original high-resolution version of Figure 25. Mr Jeremy David edited the document.
Book 1.indb 12 12/29/11 1:16 PM

xiii
Abbreviations and acronyms
BOD biochemical oxygen demandC carbonCaCO3 calcium carbonateCIFRI Central Inland Fisheries Research Institutecm centimetreCOD chemical oxygen demandCPUE catch per unit effortCV coefficient of variationDO dissolved oxygenFFDA Fish Farmers Development AgencyFiB fishing in balance (index)g gramha hectareIDAF Integrated Development of Artisanal Fisheries (Project)IGB Indo-Gangetic BasinIMC Indian major carpsK potassiumkg kilogramkm kilometreLNDA Lake Nasser Development Authoritym metremasl metres above sea levelMEI morpho-edaphic indexmg milligrammm millimetreMSY maximum sustainable yieldN nitrogenNIOF National Institute of Oceanography and Fisheries P phosphoruspH the negative logarithm (base 10) of the molar concentration of dissolved
hydronium ions (used to indicate acidity or alkalinity)ppm parts per millionRLLF relative lake-level fluctuationSTEPRI Science and Technology Policy Research InstituteTDS total dissolved solidsTL trophic levelUNDP United Nations Development ProgrammeVLRDP Volta Lake Basin Research and Development ProjectVRA Volta River AuthorityWRI Water Research Instituteμg microgramμS microsiemens
Book 1.indb 13 12/29/11 1:16 PM

Book 1.indb 14 12/29/11 1:16 PM

1. General introduction
Tropical freshwaters contribute 15 percent of the world’s reported capture fishery production from only 0.2 percent of the global aquatic surface area. The relative contribution may be even higher, as less than half of the inland capture production is officially reported (Kolding and van Zwieten, 2006). Most of the small-scale fishers in the world work in inland fisheries (BNP, 2009). Reservoirs are an essential component of most irrigation systems worldwide and, together with those built for flood control and power generation, retain large volumes of water. The total global reservoir area is unknown, but in 2000 the World Commission on Dams counted about 48 000 large dams, 46 percent of them in China, 19 percent in the rest of Asia, 3 percent in Africa (60 percent of which are in South Africa and Zimbabwe), and 2 percent in South America. The 60 000 largest reservoirs in the world – those with a volume of 10 million m3 or more – are estimated to cover a surface area of 400 000 km2 and together hold 6 500 km3 of water (Kolding and van Zwieten, 2006). In addition to their roles in power generation and provision of water for agriculture, industry and homes, most of these reservoirs also play an important role in fish production and contribute significantly to the livelihoods of the communities along their shores. There is increasing recognition that the potential of most reservoir fisheries may greatly exceed current use. Considerable opportunities exist for increasing productivity, provided that environmentally and socially acceptable and sustainable management systems can be adopted.
Reservoirs are created by human activity and therefore host semi-natural ecosystems that can be manipulated in various ways. The productivity of reservoir fisheries can be increased by using a number of approaches that combine better harvesting strategies, fertilization, carefully adapted stock enhancement and aquaculture (Petr, 1994, 1998; Kolding and van Zwieten, 2006). An improved understanding of both biological principles and stakeholder participation is necessary to realize this untapped potential. The natural biophysical constraints of reservoirs define their ecological production processes, and their socio-economic settings shape the possibilities for human enhancement of production. By synthesizing these mechanisms into general principles and predictive indicators, it should be possible to provide various options and scenarios for improved productivity that can be adapted to local cultural and institutional settings.
Different reservoirs have different properties and separate institutions conducting research and management. Seen in isolation, these differences mean that the productivity data of each of these reservoirs may be difficult to interpret and difficult to place in a global context. It may be possible to reveal cross-regional information that otherwise would not be seen – such as where one river basin is fundamentally different from others – by examining the various attributes using a standardized approach. From a comparative angle, it may even be possible to understand why reservoirs from the same area may have different productivity levels.
The present review examines three very different river basins and was undertaken as part of the Improved Fisheries Productivity and Management in Tropical Reservoirs project funded by the CGIAR Challenge Program on Water and Food (www.waterandfood.org). The project focuses on reservoirs in the benchmark basins of the Indus and Ganges Rivers in India and the Nile and Volta Rivers in Africa. In the latter two basins, the project worked essentially on Lake Nasser and Lake Volta. The general objective of the project was to explore and test opportunities for increasing
1
Book 1.indb 1 12/29/11 1:16 PM

Review of tropical reservoirs and their fisheries2
the productivity of these reservoirs with a combination of improved understanding of reservoir environment, introducing better harvesting strategies and adopting carefully selected stock enhancement strategies and/or aquaculture approaches.
Three individual desk reviews were initially prepared covering the Indo-Gangetic Basin (IGB) reservoirs (CIFRI, 2006), Lake Nasser (NIOF-LNDA, 2005) and Lake Volta (WRI, 2006). Each review included in-depth inventories of the history, resources and environments and information on: the geographical, physical, hydrological and chemical features of the basin; limnological characteristics; past, present and potential fishery production; and the socio-economic setting. They also identify gaps in information and provide recommendations for future work.
The primary intention of the present document is to synthesize and standardize the information collated in the three desk reviews with the objective of evaluating the information and summarizing it with reference to general literature and up-to-date knowledge on tropical reservoir fisheries in developing countries (Petr, 1978, 1994; Sugunan, 1995; Kolding, Musando and Songore, 2003; Kolding and van Zwieten, 2006). The three case studies represent quite different scenarios of reservoir fisheries in terms of management and fishing operations, and these differences are analysed and discussed to draw conclusions of general value.
Data and information were collected through individual desk reviews on many aspects of the ecosystems. This information has been condensed in this technical paper with the objective of providing a baseline information framework to assist in describing and analysing the ecological changes that took place after the impoundment of the rivers. The ultimate objective is to explain changes in fish productivity from both bottom-up and top-down processes, i.e. in relation to variations in climate, ecological succession and fishing effort. The information generated by the various sections in the background reviews has been integrated into a consistent framework, which may be useful for management purposes and to assist in adaptive learning. The general principle driving this framework is that: (i) data and information need to be made available in a historical context; and (ii) data from different studies and disciplines need to be organized in time series and preferably visualized in graphical form.
All three reviews show that, while biological data and information are generally available, there has not been sufficient emphasis on synthesizing this information and making it meaningful for management purposes. As a result, large amounts of research data and information have been collected from different sources but have rarely been integrated for systemic understanding. Outputs have only been translated into proposed management actions to a limited degree. The three reviews suffered from the general tendency to isolate and compartmentalize research into separate disciplines, with very limited cross-disciplinary flow of information or recognition as to how the results of various disciplines can be combined into a more comprehensive understanding of the behaviour of populations, communities and ecosystems and the productive activities that depend on them. This tendency severely hampered the analysis presented in this review.
A pragmatic and holistic understanding of reservoir ecosystems is needed in order to guide the choice of indicators and the development of monitoring systems that can inform management. This technical paper presents a basic description and analysis of the main processes taking place in different reservoir environments. The next step would be to devise a hierarchy of indicators describing the different processes taking place. Only when these are seen in combination across sectoral disciplines will it be possible to reach a better understanding of the processes that drive fish stocks, fisheries and reservoir productivity.
Book 1.indb 2 12/29/11 1:16 PM

General introduction 3
REFERENCESBNP. 2009. Big Number Program. Intermediate report. Rome, FAO; and Penang,
Malaysia, WorldFish Center. 62 pp.Central Inland Fisheries Research Institute (CIFRI). 2006. Inventory of reservoirs
in the Indian Indo-Gangetic Basin. Project report for the Challenge Programme CP34. Improved fisheries productivity and management in tropical reservoirs. Barrackpore, India. 33 pp.
Kolding, J. & van Zwieten, P.A.M. 2006. Improving productivity in tropical lakes and reservoirs. Challenge Program on Water and Food Aquatic Ecosystems and Fisheries Review Series 1, Theme 3 of CPWF. Cairo, WorldFish Center. 139 pp.
Kolding, J., Musando, B. & Songore, N. 2003. Inshore fisheries and fish population changes in Lake Kariba. In E. Jul-Larsen, J. Kolding, J.R. Nielsen, R. Overa & P.A.M. van Zwieten, eds. 2003. Management, co-management or no management? Major dilemmas in southern African freshwater fisheries. Part 2: Case studies, pp. 67–99. FAO Fisheries Technical Paper No. 426/2. Rome, FAO. 271 pp.
National Institute of Oceanography and Fisheries and Lake Nasser Development Authority (NIOF-LNDA). 2005. Inventory and background analysis of the Lake Nasser. Final report for the Project: Improved fisheries productivity and management in tropical reservoirs, CP-PN34: Challenge Program on Water and Food. Alexandria and Aswan, Egypt. 128 pp.
Petr, T. 1978. Tropical man-made lakes: their ecological impact. Archiv fuer Hydrobiologie, 81(3): 368–385.
Petr, T. 1994. Intensification of reservoir fisheries in tropical and subtropical countries. Internationale Revue gesamten Hydrobiologie, 79: 131–138.
Petr, T., ed. 1998. Inland fishery enhancements. Papers presented at the FAO/DFID Expert Consultation on Inland Fishery Enhancements, Dhaka, Bangladesh, 7–11 April 1997. FAO Fisheries Technical Paper No. 374. Rome, FAO. 463 pp.
Sugunan, V.V. 1995. Reservoir fisheries in India. FAO Fisheries Technical Paper No. 345. Rome, FAO. 126 pp.
Water Research Institute (WRI). 2006. Review of the Lake Volta fisheries. Final report for the Project: Improved fisheries productivity and management in tropical reservoirs, CP-PN34: Challenge Program on Water and Food. Achimota, Ghana. 47 pp.
Book 1.indb 3 12/29/11 1:16 PM

Book 1.indb 4 12/29/11 1:16 PM

2. Reservoirs in the Indo-Gangetic Basin of India
2.1 INTRODUCTIONReservoirs abound in the countries of which the Indus and Ganges Basins form part: Afghanistan, Bangladesh, China, India, Nepal and Pakistan. The Indo-Gangetic reservoirs of India, the focus of this review, alone have an area of 1.16 million ha, which is 36.8 percent of the total reservoir area of India (Sugunan, 1995). Fish productivity is generally considered to depend on morphometric, edaphic and climatic factors, with an emphasis on nutrient availability and primary productivity; oligotrophy is seen as something to be corrected. However, this static approach to reservoir productivity neglects the carrying capacity influenced by changes in water level, other aspects of seasonality, and fishing pressure.
In general, the Indian reservoirs in the IGB for which data are available have extremely low yields in comparison with reservoirs elsewhere in the world (Bandu Amarasinghe and Vijverberg, 2002; De Silva, 2001). The low reservoir productivity has largely been blamed on intense fishing pressure and poor management, but may also reflect the failure of riverine fish communities to adapt to impoundment (Fernando and Holcik, 1991). Two possibilities exist to improve productivity: (i) introducing new species that are adapted to lake conditions; or (ii) stocking. Almost all reservoirs in India are managed by stocking to some degree. Variations in stocking patterns, densities, age at first stocking, species stocked, return rates on stocked material and cost-effectiveness should be included as factors to explain apparent low yield. A more comprehensive understanding of the dynamics of reservoir productivity would entail developing a time series of indicators of system drivers (e.g. water levels or eutrophication), the state of stocks (e.g. production characteristics of stocks including enhancement through stocking), and the fishing pressure (e.g. catch and fishing effort statistics) in relation
5
Courtesy: CIFRI.
Book 1.indb 5 12/29/11 1:16 PM

Review of tropical reservoirs and their fisheries6
to the stocking regimes in order to evaluate their effectiveness (Jul-Larsen et al., 2003; Kolding and van Zwieten, 2006).
There are insufficient data to carry out such a full analysis here, as only limited data and information are available on stocking in India. In the following sections, the data that are available are reviewed and discussed. An important data source is Sugunan (1995). An additional data set comprising often incomplete information on catch, stocking (including species composition) and fishing methods and social information has recently become available on 691 reservoirs in Bihar (18 reservoirs), Haryana (23), Himachal Pradesh (5), Jammu and Kashmir (2), Jharkhand (141), Madhya Pradesh (50), Punjab (13), Rajasthan (398), Uttar Pradesh (33) and West Bengal (8). This data set forms the basis of the discussion in Section 2.5, including quantitative information on stocking practices in relation to production (CIFRI, 2005a).
Before this discussion, Section 2.2 outlines the general physical and demographic geography of the Indian part of the IGB. Section 2.3 then describes the various fish production systems. Physicochemical and productivity constraints are described in Section 2.4.
Following the discussion in Section 2.5, Section 2.6 describes fish and fishery production characteristics. Management and socio-economic arrangements are described in Section 2.7, followed by some recommendations in Section 2.8.
2.2 DESCRIPTION OF THE AREA2.2.1 GeographyThe IGB refers to the Indus and Ganges Basins (Figure 1). The Indus Basin covers an area of 1 165 500 km2 in Afghanistan, Tibet Autonomous Region of China, India and Pakistan. The drainage area in India is 321 289 km2 – in the States of Jammu and Kashmir (193 762 km2); Himachal Pradesh (51 356 km2); Punjab (50 304 km2); Rajasthan (15 814 km2); Haryana (9 939 km2); and the Union Territory of Chandigarh (114 km2). The Ganges Basin lies in Bangladesh, China, India and Nepal and has a total area of 1 086 000 km2.
The IGB falls into three physiographic regions: mountain areas, plains and deltas. The mountain areas consist of the southern slopes of the Hindu Kush and the Himalayas. The upper part of the Indus Basin in Jammu and Kashmir and Himachal Pradesh is mostly mountain ranges and narrow valleys. The Indo-Gangetic Plains are fairly uniform, with elevations of 150 m on the Ganges Plain and 300 m on the Punjab Plain, although local geomorphologic variations are significant. The delta regions consist of the Indus Delta in Pakistan and the Ganga–Brahmaputra–Meghna Delta area in Bangladesh and India.
FIGURE 1The Indus and Ganges Basins
Meg
hna
Brahmaputra
Ramganga
Ken
Tons
I n d u s
G a n g e s
Son
Indus
Indus
Su
tlej
Beas
Ganga
Gan
ga
Ghaghara
Ravi
Gandak
Yamuna
Ganga
Gomati Kosi
Mah
anan
da
Cham
bal
.Farakka barrage
.Trimmu barrage
.Marala barrage
Jhelu
m
Chena
b
Kabul
FAO, 2011
Source: FAO 2011.
Book 1.indb 6 12/29/11 1:16 PM

Reservoirs in the Indo-Gangetic Basin of India 7
2.2.2 Main rivers in the Indo-Gangetic BasinThe Indus River originates in Tibet Autonomous Region of China at 5 182 m above sea level and flows for 2 880 km to the Arabian Sea. The length of the river in India is 1 114 km. The upper Indus catchment contains some of the largest glaciers in the world outside the polar regions. The glacial area of the upper Indus catchment is about 2 250 km2 and provides most of the river flow in summer. The Kabul River, which is mainly snowfed, originates at the Unai Pass of the southern Hindu Kush at 3 000 m. It drains eastern Afghanistan and then enters Pakistan just north of the Khyber Pass. The Jhelum River rises in Kashmir at a much lower elevation than the source of the Indus River and falls much less rapidly than the Indus River after entering Pakistani territory. The Chenab River originates in Himachal Pradesh in India at 4 900 m. It flows through Jammu in the Indian part of Kashmir and enters Pakistani territory upstream of the Marala Barrage. The Jhelum River joins the Chenab River at the Trimmu Barrage.
The Ganga River (known as the Ganga-Padma River in Bangladesh) begins in the central Himalayas and flows 2 500 km to the Bay of Bengal. The Ganges Basin has a plain 200–300 km wide, which is bordered by mountains and highlands on three sides. Many tributaries and distributaries join and flow from the Ganga to drain the northern part of India and most of Bangladesh. The largest tributaries of the Ganga are the Ghaghara and Yamuna Rivers. Other important rivers that merge with the Ganga River are: the Son River, which originates in the hills of Madhya Pradesh; the Gomati River, which flows past Lucknow; and the Chambal River. The Yamuna River flows to the west and south of the Ganges River and joins it almost halfway along its course. The Yamuna River receives a number of central Indian rivers. To the north of the Ganga, the large tributaries are the Ramganga, Gomati, Ghaghara, Gandak, Kosi and Mahananda Rivers. Beyond the Mahananda River, the Ganga River enters its own delta, formed by its distributaries, and then merges into the combined delta of the Ganga, Brahmaputra and Meghna Rivers.
2.2.3 Climate Annual rainfall in the Indo-Gangetic Plains varies from less than 400 mm in western Pakistan to over 1 600 mm in eastern India and in Bangladesh (White and Rodriguez-Aguilar, 2001). The plains in the middle Ganges Basin receive 800–1 200 mm/year of rain, and those in the upper Ganges Basin as well as the Indus Valley receive 400–800 mm/year. Annual rainfall is less than 500 mm in western Rajasthan and adjoining parts of Haryana and Punjab, while the annual rainfall in Bangladesh ranges from 1 500 to 4 000 mm. The monsoon brings wet summers but very little rain the rest of the year. Heavy monsoon showers begin in the south of India and part of southeast Bangladesh at the beginning of June and gradually spread inland. In about ten days, the whole lower Ganges Basin receives heavy showers. In the middle Ganges Basin, the onset of the summer monsoon is in the middle of June, while in the upper Ganges Basin and the Indus Valley heavy rains begin towards the end of June.
In the lower Ganges Basin, three seasons generally are recognized: monsoon (June–October), winter (November–February) and summer (March–May). While the monsoon months are remarkably wet, the winter months are very dry. Rainfall in these four months averages only about 100 mm. Winter rain in the Ganges Basin is due to the retreat of the southwest monsoon, which is gradual in the upper basin and Indus Valley. By early September, the monsoon season is over in the Delhi area of the upper Ganges Basin and by late September it is over even in Patna, in the middle basin. While the last of the southwest (summer) monsoon is still bringing showers to the lower basin, the drier northeast (winter) monsoons begin to blow in the upper basin and Indus Valley. By the middle of October, the lower basin is subject to dry continental air and the summer monsoon rains have ceased.
The Ganges–Brahmaputra Delta has a typical monsoon climate, warm and dry from March to May, rainy from June to October, and cool from November to February. The
Book 1.indb 7 12/29/11 1:16 PM

Review of tropical reservoirs and their fisheries8
mean annual rainfall is 2 000 mm, of which about 70 percent occurs in the monsoon season. Rainfall generally varies from northwest to southeast, increasing from a mean annual rainfall of 1 500 mm in the northeast to 2 900 mm in the southeastern corner (Anon., 2004). Potential evapotranspiration rates are about 1 500 mm, exceeding the rainfall rates from November to May. The relative humidity is high, varying from 70 percent in March to 89 percent in July. The area experiences moderate to long periods of sunshine, commonly exceeding 8.5 hours/day outside the monsoon season. The mean annual temperature is 26 °C with peaks of more than 30 °C in May. Winter temperatures can fall to 10 °C in January. The southern region of the area, and in particular the southeastern coastline, is vulnerable to cyclones in the monsoon season. Storm surges can dramatically raise the water level by up to 4 m above tidal and seasonal levels. The southwest coastline is protected to some extent by the dampening effects of the Sundarbans wetlands.
2.2.4 SoilsThe Indo-Gangetic alluvial plains are considered among the world’s most extensive fluvial plains. They came into existence with the collision of Indian and Eurasian tectonic plates during the middle Miocene (Anon., 2004). The basin is still tectonically active.
The major source of sediment is the large river system of the Indo-Gangetic Plains. These plains extend over an area 1 600 km long and 320 km wide, including the arid and semi-arid environment in Rajasthan and Punjab, and humid and peri-humid deltaic plains in Bengal. The alluvium varies in texture from sandy to clayey, calcareous to non-calcareous, and acidic to alkaline. In Bangladesh, most of the area is covered by alluvial soils, followed by black soils, peat and marshy soils. Only a few pockets of sulphate acid soils are seen near the mouth of the Ganga River (Anon., 2004).
Most of the Indian area of the IGB is poor in available nitrogen (N) (Anon., 2004). Parts of Punjab, Haryana and Uttar Pradesh are in the medium range. Only a small area of Himachal Pradesh has high levels of available N. Available phosphorus (P) is medium in most districts. High P soils are rare in the Indian portion of the IGB. Available potassium (K) in most districts ranges between high and medium levels. Recent alluvial zones are low in available K.
The Indo-Gangetic Plains are undergoing a gradual transition in climate, physiography, natural vegetation and cropping systems. Land use in this region has undergone a remarkable change in the past 40–50 years. Grazing land has reduced as land has been used for other uses, in particular agriculture. As a result, the availability of manure for maintaining soil health, especially soil organic matter, has diminished. Biological activity has gradually been impaired to the extent of reducing the efficiency of applied inputs. Soil carbonate carbon in the soils of the Indo-Gangetic Plains is 0.13 and 4.61 petagrams (109 t) in the upper layers 30 cm and 150 cm deep, respectively (Anon., 2004).
2.2.5 Land use and water extractionA study covering 133 021 million ha, or 63 percent of the IGB, found that 46.6 percent of the area is cultivated, of which 24.9 percent (33.08 million ha) is irrigated – 26.6 percent by canals and the remainder with groundwater – indicating the large volume of water extraction from the rivers for food production (Thenkabail, Schull and Turra, 2005). Some 3.05 million ha of wetlands in the Himalayas (32.5 percent) and the plains (67.5 percent) are used for flooded irrigation, and 0.67 million ha of floodplains in the plains are classified as grass and shrubs. The total area covered by rivers, lakes, marshes, estuaries and other wetlands is 1.34 million ha (1 percent). Of the 1.15 million ha of other wetlands, only 7.6 percent is considered to have natural vegetation. The remainder is used for agriculture.
Water withdrawal poses a serious threat to the IGB in India. Barrages control all of the tributaries to the Ganga River and divert about 60 percent of river flow to large
Book 1.indb 8 12/29/11 1:16 PM

Reservoirs in the Indo-Gangetic Basin of India 9
irrigation works (Gopal, 2004; Shah et al., 2009). The flow of the Ganga River into Bangladesh has more than 30 upstream water diversions. From the largest, the Farraka Barrage, 18 km from the border with Bangladesh, the average monthly discharge of the Ganga River is 316 m3/s. The Indus River is sensitive to climate change, as Himalayan glaciers provide 70–80 percent of its water, the highest proportion of any river in Asia and double the proportion that glaciers provide to the Ganges River (30–40 percent). The Indus Basin is already suffering from severe water scarcity owing to overextraction for agriculture causing saltwater intrusion in the delta. Damming and water extraction have severe consequences for riverine biodiversity (Dudgeon, 2000).
2.2.6 Demography and labourOf the four riparian countries (excluding Afghanistan), India has by far the largest population, followed by Pakistan, Bangladesh and Nepal (Table 1). Bangladesh has the highest population density (1 024 people/km2), followed by India (347), Pakistan (183) and Nepal (165). Pakistan has the fastest growing population in the basin, with an annual rate of 2.4 percent, followed by Nepal (2.3 percent), Bangladesh (1.7 percent) and India (1.5 percent). In all four countries, rural populations are growing more slowly than national populations, which points to a population explosion in urban areas, particularly in large metropolitan centres.
The populations of the basin countries are largely rural: Nepal (88 percent), Bangladesh (74 percent), India (72 percent), and Pakistan (65 percent). Pakistan and Nepal have the largest percentage of population aged 0–14 years (41 percent) and India has the lowest (33 percent). The major portion of the population falls into the working age bracket of 15–64 years in all countries – highest in India (62 percent) and lowest in Nepal and Pakistan (55 percent). High population growth rates in all countries remain a challenge to food security and poverty alleviation. Limited information is available on the number of people who depend on fishing in the rivers and reservoirs of the IGB (Anon., 2006). Estimates indicate that about 300 000 people are engaged in fisheries and associated activities in the IGB.
TABLE 1
Size and composition of the agricultural labour force in Indo-Gangetic countriesTotal
population (2001)
Labour force Employed in agriculture1 Employment in agricultureTotal (2001) Average annual
growth rate (1980–1999)
Male Female
(million) (million) (%) (% of male employment)
(% of female employment)
(% of total employment)1
Bangladesh 133.35 70.79 2.6 52.1 48.1 63.2
India 1 032.40 460.53 2.0 na na 66.2
Nepal 23.59 10.98 2.3 na na 78.5
Pakistan 141.45 53.48 2.8 41.0 66.3 47.3
na = not available.1 Latest year available.Sources: World Bank, 2000; World Bank, 2001, 2003.
2.3 FISHERY RESOURCES AND PRODUCTION SYSTEMS2.3.1 RiversThe Indus and Ganga Rivers (Table 2) originate in the Himalayas to traverse the great alluvial Indo-Gangetic Plains. They are snowfed and rainfed rivers that are characterized by complicated flood regimes and seasonal variations in volume of flow (Sinha and Katiha, 2002).
Book 1.indb 9 12/29/11 1:16 PM

Review of tropical reservoirs and their fisheries10
The Ganga River system has a combined length of 12 500 km and a catchment area of 97.6 million ha. Its tributary rivers are spread over most of the north Indian states (except the hill states) to extend up to West Bengal through Bihar.
Commercial fishing is virtually absent in the upland waters of the Ganga River system, mostly because of inaccessibility. The stretch of the Ganga River from Haridwar to Lalgola is recognized as one of the richest capture fisheries in India, producing highly prized major carps, hilsa (Tenualosa ilisha) and catfishes. Mid-September to June are peak months for fishing.
The main stem of the Indus River and its tributaries in the States of Kashmir, Himachal Pradesh and Punjab also support important fisheries. In the upper river, the fishery targets mainly mahseer (Tor spp.), snow trout (Schizothorax spp.), other cyprinids and exotic trouts. In the lower reaches, the Beas and Sutlej Rivers contain commercially exploitable stocks of indigenous carps and catfishes.
TABLE 2River stretches in Indo-Gangetic Basin states in India
River system Main rivers Approximate length (km) States
Ganges Ganga 2 525 Uttar Pradesh, Bihar, Jharkhand, West Bengal
Ramganga 569 Uttar Pradesh
Gomati 940 Uttar Pradesh
Gharghara 1 080 Uttar Pradesh, Bihar
Gandak 300 Bihar
Kosi 492 Bihar
Yamuna 1 376 Punjab, Haryana, Delhi, Uttar Pradesh
Chambal 1 080 Madhya Pradesh, Uttar Pradesh, Rajasthan
Tons 264 Uttar Pradesh
Son 784 Uttar Pradesh
Ken 360 Madhya Pradesh
Indus Jhelum 400 Jammu and Kashmir
Chenab 330 Jammu and Kashmir, Himachal Pradesh
Beas 460 Himachal Pradesh, Punjab
Sutlej 1 370 Himachal Pradesh, Punjab
Ravi 720 Jammu and Kashmir, Himachal Pradesh, Punjab
Source: DAHDF, 2005.
2.3.2 Floodplain wetlandsThe Indo-Gangetic river systems, particularly those in Uttar Pradesh, Bihar and West Bengal, have extensive floodplains punctuated with oxbow lakes, known locally as mauns, beels, chaurs and jheels. These are shallow, nutrient-rich waterbodies formed by changes in the course of the river. Some of these retain connection with the main river, at least in wet seasons (Sinha, 1997). Many of these waterbodies in West Bengal and Assam are adapted as stocked fisheries and have significant potential for further development (Table 3). In addition to food fish, the rivers produce a wide variety of ornamental fish species. The Himalayan region also offers opportunities for developing sport fishing. Some waterbodies in the basin are ecologically sensitive and recognized as internationally important under the Ramsar Convention, but continue to function as capture fisheries.
The annual fish yield in floodplains may vary from 50 to 400 kg/ha (CIFRI, 2005b). Most of the rural population fish either full-time professionally, seasonally or for subsistence. For full-time fishers, conflict over water resources can be intense during the dry season, when water is required for irrigation. Flood control, drainage and irrigation schemes may obstruct the lateral migration of rheophilic species and the passive drift of larvae from the main channel to modified floodplains. The decrease in flow has reduced the available major carp habitats in the Ganges Basin in Bangladesh (Ali, 1991). The lower water flow, especially during the dry season and in hill regions such as the Barind Tract, causes drought and the drying of ponds as groundwater levels drop. Modifications
Book 1.indb 10 12/29/11 1:16 PM

Reservoirs in the Indo-Gangetic Basin of India 11
to hydrological regimes, damming and extreme water extraction for irrigation cause reductions in catch per unit area and in fish biodiversity. Both habitat restoration and fish enhancement are important to sustain these floodplain fisheries (Craig et al., 2004).
TABLE 3Potential for enhancing fish production in floodplain wetlands of Indo-Gangetic India
Region AreaYield
Existing Potential Potential increase in yield
(’000 ha) (’000 tonnes) (%)
West Bengal 42.5 9.56 53.15 456
Bihar 40.0 4.80 30.00 525
Uttar Pradesh 152.0 22.80 114.00 400
Total Indo-Gangetic Basin 234.5 37.16 197.15 431
Total India 353.7 50.65 307.93 508
Source: CIFRI, 2005b (modified).
2.3.3 EstuariesThe IGB open estuarine system includes the Hoogly–Matlah estuarine system in the vicinity of Kolkata in India (Table 4). Annual landings from Gangetic Sundarbans of the Hoogly–Matlah estuaries have exceeded 10 000 tonnes, with an average yield that varies between 45 and 75 kg/ha. Some of the most common fishes in Indian mangrove waters are species of Liza, Mugil, Lates, Polynemus, Sciaena, Setipinna, Pangasius, Tenualosa (Hilsa ilisha) and Atroplus. The hilsa fishery in Bangladesh is of great importance, accounting for 20 percent of national fish production (Blaber et al., 1998). The construction of the Farakka Barrage in 1975 to divert water from the Ganges River to the Hoogly Canal had a positive impact on the estuarine fisheries of the Hoogly–Matlah system (see Table 4). However, the barrage is perceived to have had a severely negative impact on the hilsa fishery in the Bangladeshi part of the Ganga River, although the data to support this claim are weak (Payne et al., 2004). The estuary is also recognized as an excellent source of naturally occurring fish and prawn seed. The Hoogly–Matlah system is under threat from pollution because of its proximity to a major urban and industrial centre.
TABLE 4Major estuaries of the Indo-Gangetic Basin in India
Estuarine system Estimated area Yield
(ha) (tonnes)
Hoogly–Matlah estuarine system 234 000 20 0001
72 0982
Wetlands of West Bengal
Freshwater na 10–14
Saline 33 000 ≈37 500
Mangroves 356 500 na
1 Before the Farakka Barrage project.2 After the Farakka Barrage project.na = not available.Sources: Sinha, 1997 (modified); Jha et al., 2008.
2.3.4 ReservoirsThe Government of India has defined reservoirs as “man-made impoundments (of more than 10 ha) created by the obstruction of the surface flow by dams of any description on a river, stream or any water course” (Sugunan, 1995). In the IGB, the States of Madhya Pradesh and Uttar Pradesh have the largest area of reservoirs (Figure 2).
For the purpose of fishery management, reservoirs are classified as small (< 1 000 ha), medium (1 000–5 000 ha) and large (> 5 000 ha), although different states provide
Book 1.indb 11 12/29/11 1:16 PM

Review of tropical reservoirs and their fisheries12
slightly different classifications. Their area is estimated at 1 485 557 ha for small, 527 541 ha for medium and 1 140 268 ha for large reservoirs (Sugunan, 1995). The IGB has 1.16 million ha of reservoirs, or 36.8 percent of the total reservoir area of India (Table 5). Small reservoirs account for the largest area (40.6 percent), followed by large (33.0 percent) and medium (26.4 percent) reservoirs. The largest number of reservoirs are small (> 566) followed by medium (> 80) and large (26) reservoirs. Most of the small reservoirs are less than 500 ha, while many of the reservoirs in the medium category measure 1 000–2 000 ha. Although these reservoirs were built primarily for irrigation, soil conservation, flood control, domestic water supply and electricity generation, they also form important inland fisheries with substantial potential to increase output through improved management.
FIGURE 2Distribution of reservoirs in all size categories in India
Source: Modified from Sugunan (1995). Note: The Northeast corresponds to the states: Arunachal Pradesh, Assam, Nagaland, Meghalaya, Manipur,Tripura and Mizoram.
TABLE 5Distribution of reservoirs larger than 10 ha in the Indo-Gangetic Basin in India by state and area
Region Reservoir area
Small Medium Large Total
Area % of area in India
Area % of area in India
Area % of area in India
Area % of area in India
(ha) (%) (ha) (%) (ha) (%) (ha) (%)
Jammu and Kashmir na na 1 000 0.19 8 700 0.76 9 700 0.31
Himachal Pradesh 200 0.01 na na 41 364 3.63 41 564 1.32
Haryana 837 0.06 na na na na 837 0.03
Punjab and Chandigarh 832 0.06 3 535 0.67 na na 4 367 0.14
Rajasthan 54 231 3.65 49 827 9.45 49 386 4.33 153 444 4.87
Uttar Pradesh 218 651 14.72 44 993 8.53 71 196 6.24 334 840 10.62
Madhya Pradesh 172 575 11.62 169 502 32.13 118 307 10.38 460 384 14.60
Bihar 12 461 0.84 12 523 2.37 71 711 6.29 96 695 3.07
Jharkhand 10 444 0.70 11 958 2.27 5 957 0.52 28 359 0.90
West Bengal 451 0.03 13 148 2.49 15 600 1.37 29 199 0.93
Total IGB states 470 682 31.68 306 486 58.10 382 221 33.52 1 159 389 36.77
Total India 1 485 557 527 541 1 140 268 3 153 366
Note: IGB = Indo-Gangetic Basin.na = not available.Sources: DAHDF (2005) and the Department of Fisheries of Jammu and Kashmir, Himachal Pradesh, Haryana, Punjab and Chandigarh, Rajasthan, Uttar Pradesh, Madhya Pradesh, Bihar, Jharkhand and West Bengal.
I n d u s
G a n g e s
(30(8 906
(4 679(2 937
(1 442
(7 11 (32 (6
(125(423 (66
(4
(3
-198 198-273 750
-458 507
-437 291
-358 740
-29 635
-41 564
-282
-334 840-153 444
-96 695
-15 732-460 384-286 230
Kerala
Tamil Nadu
Karnataka
Andhra Pradesh
Maharashtra
Orissa
Gujarat Madhya Pradesh
West Bengal
Bihar
RajasthanUttar Pradesh
Haryana
Himachal Pradesh
Northeast
(6
-8 074
Numberof units
Area (ha)FAO, 2011
Book 1.indb 12 12/29/11 1:16 PM

Reservoirs in the Indo-Gangetic Basin of India 13
2.3.5 AquacultureInland aquaculture is distributed over almost all Indian states and in the IGB in particular (Table 6). Aquaculture ponds cover more than 0.86 million ha and are mostly concentrated in West Bengal (278 000 ha), Rajasthan (180 000 ha) and Uttar Pradesh (162 000 ha). States in the IGB account for more than 30 percent of aquaculture area in the country. The highest annual productivity is in Punjab, at 4 085 kg/ha, followed by Haryana at 3 501 kg/ha. The annual national productivity average in ponds supported by the Fish Farmers Development Agency (FFDA) – a government body set up to advance the use of improved aquaculture technology – increased from 50 kg/ha in 1974–75 to about 2 389 kg/ha in the 1990s, which is above the national average of 2 135 kg/ha (Anon., 1996).
TABLE 6Aquaculture area and production in the Indo-Gangetic Basin in India, by state and area
Region Total area Area covered by FFDA Area covered by FFDA
Production by area covered by FFDA
Annual yield
(’000 ha) (’000 ha) (%) (tonnes) (kg/ha)
Bihar 95 22.31 23.48 47 527 2 130
Haryana 100 18.57 18.57 65 005 3 501
Himachal Pradesh 1 0.26 26.00 658 2 502
Jammu and Kashmir 17 1.56 9.18 2 022 1 300
Madhya Pradesh 119 54.96 46.18 86 292 1 570
Punjab 70 12.15 7.357 49 628 4 085
Rajasthan 180 4.17 2.32 7 211 1 730
Uttar Pradesh 162 69.21 42.72 138 410 2 000
West Bengal 276 98.78 35.79 296 349 3 000
Total for IGB states 867 321.81 37.12 768 800 2 389
Percentage of India total 30.40 75.67 84.67
Total India 2 852 425.26 14.91 908 023 2 135
Notes: FFDA = Fish Farmers Development Agency; IGB = Indo-Gangetic Basin.Source: DAHDF, 2005.
2.4 MORPHOMETRIC, EDAPHIC, CLIMATIC AND HYDROLOGICAL FEATURES OF IGB RESERVOIRSLarge reservoirs in India are estimated to have an annual production potential of 65–190 kg/ha, medium-sized reservoirs 145–215 kg/ha and small reservoirs 285–545 kg/ha based on hydrochemical factors and primary productivity (Sugunan, 1995). Factors that constrain productivity in reservoirs can be summed up as morphometric (area, depth and shoreline), edaphic and climatic. These factors affect energy and nutrient dynamics and biotic interactions. A number of morphometric indices – the shoreline development index, volume development index (mean depth over maximum depth), catchment-to-reservoir area ratio, flushing rate (Sugunan, 2000) and relative lake-level fluctuation (RLLF)1 (Jul-Larsen et al., 2003) – have been proposed to relate productivity to these constraints. However, limited information is available at present for most of the IGB, and more reliable estimates of reservoir productivity are thus difficult to obtain.
Mean depth (volume over area) (Table 7) is indicative of the extent of the euphotic littoral zone (Rawson, 1952; Hayes, 1957). Bottom water in reservoirs more than 18 m deep sometimes serves as a nutrient sink (Rawson, 1955), as seen in some deep reservoirs of India. Hydel reservoirs on mountain slopes with steep basin walls are considered biological deserts. Nevertheless, deep reservoirs such as Bargi (14 m) in Madhya Pradesh, Chamera (43.5 m) and Govindsagar (55 m) in Himachal Pradesh, Rihand (22.8 m) in Uttar Pradesh and Badua (14.5 m) in Bihar are relatively productive
1 A drawdown ratio, defined as the area of maximum extent over the area at minimum extent (information that exists for many reservoirs), would probably serve the same purpose. This requires further examination.
Book 1.indb 13 12/29/11 1:16 PM

Review of tropical reservoirs and their fisheries14
owing to other favourable factors (Das, 2001). Most small or medium-sized IGB reservoirs have low mean depths of 4–7 m and are thus expected to have higher potential for fish production.
TABLE 7 Morphometric and hydrological features of Indo-Gangetic Basin reservoirsIndo-Gangetic Basin
statesReservoir
areaNumber Mean
depthElevation Catchment
areaVolume
development index
Total inflow
(ha) (m) (m) (km2) (billion m3)
Jammu and Kashmir na na 25 na na na na
Himachal Pradesh 900–15 000 3 20–55 440–899.2 4 725–56 980 na na
Punjab 46–280 na 4–10 na 6.1–56.1 na na
Haryana na 4 3.4–5.0 na 11.4–11.9 na na
Rajasthan 165–1 554 423 1.7–7.7 na 35–27 840 na na
Uttar Pradesh 17.5–30 149 66 3–22.8 119–268 32.4–13 344 na na
Madhya Pradesh 77–66 000 32 3.4–14.0 348.7–488.3 8.3–23 025 0.5–1.7 27.7–7 800
Bihar and Jharkhand 21–3 733 125+ 5.2–14.6 na 29–6 120 0.7–1.4 na
West Bengal na 6 3.2–11.0 na na na na
na = not available.Sources: CIFRI, 1981, 2003a, 2003b, 2004a, 2004b, 2004c, 2004d and 2007; Sugunan, 1995.
The shore development index indicates the shoreline’s degree of irregularity (Das, 2001). High values in this index indicate higher productivity. Reservoirs with dendritic shorelines offer many sheltered bays and coves and are likely to be relatively productive because of their extensive littoral areas. The shoreline development indexes of the Tilaiya (9.12) and Konar (8.78) reservoirs are moderate and accompanied by moderate-to-rich planktonic communities.
The volume development index (Table 7) denotes the depth of the reservoir in relation to the nature of the reservoir wall (Hutchinson, 1957). If the value is > 1, the reservoir is cup-shaped with less littoral area, and a value < 1 means the reservoir is saucer shaped and more productive. The volume development indices of many of the small and medium-sized reservoirs of Bihar, Jharkhand, Madhya Pradesh, Punjab, Rajasthan and Uttar Pradesh are less than one and so predict moderate productivity.
Edaphic factors are dynamically linked to soil condition, land-use patterns and precipitation in the catchment. The Indus Basin is less fertile than the Ganges Basin. The Ganges Basin is covered mostly with intensely cultivated agricultural lands under moderate-to-high rainfall of 250–4 000 mm. In contrast, the upper Indus Basin is a glacial landscape with comparatively little rainfall of 100–750 mm.
The dominant soils in the Ganges Basin have high K content and moderate N and P content, while Indus Basin soils are generally poorer, with low-to-moderate N and P content in Punjab, Haryana and Himachal Pradesh (Figure 3). The soils in the IGB are mostly neutral to moderately alkaline, although moderately acidic soil is observed around some of reservoirs in Bihar and Jharkhand (Figure 3), probably related to the forest cover. Specific conductivity in IGB reservoir soils is moderate.
The fertility of soils throughout the IGB is generally correlated with the increasing application of inorganic fertilizers in agriculture. In Indian reservoirs, the quality of water in reservoirs is closely correlated to the catchment area (Natarajan, 1976).
Flushing rate (inflow over storage capacity) regulates both the degree and regime of nutrient loading (Vollenweider, 1969). High flushing rates preclude fertilization as a management strategy, as nutrient inputs are rapidly removed downstream. Flushing rates are high in the reservoirs of Bihar, Himachal Pradesh, Jharkhand and West Bengal; moderate in Madhya Pradesh; and low in Rajasthan. Relative change in water level over the year may be more important in determining fertility than the total amount of water received. The RLLF index relates the change in water level with the mean depth (Jul-Larsen et al., 2003; Kolding and van Zwieten, 2006). In the analysis of IGB
Book 1.indb 14 12/29/11 1:16 PM

Reservoirs in the Indo-Gangetic Basin of India 15
5
5,5
6
6,5
7
7,5
8
Him
acha
lPr
ades
h
Punj
ab
Hary
ana
Rajas
than
Utta
rPr
ades
h
Madh
yaPr
ades
h
Biha
r &Jh
arkh
and
Wes
tBe
ngal
00,5
11,5
22,5
33,5
Him
acha
lPr
ades
h
Punj
ab
Hary
ana
Rajas
than
Utta
rPr
ades
h
Madh
yaPr
ades
h
Biha
r &Jh
arkh
and
Wes
tBe
ngal
0
200
400
600
800
1000
1200
Him
acha
lPr
ades
h
Punj
ab
Hary
ana
Rajas
than
Utta
rPr
ades
h
Madh
yaPr
ades
h
Biha
r &Jh
arkh
and
Wes
tBe
ngal
0
20
40
60
80
100
Him
acha
lPr
ades
h
Punj
ab
Hary
ana
Rajas
than
Utta
rPr
ades
h
Madh
yaPr
ades
h
Biha
r &Jh
arkh
and
Wes
tBe
ngal
Soil pH Available soil N (mg/100 g)
Soil organic C (%) Available soil P (mg/100 g)
So
il P
hO
rg C
(%
)
N (
mg
/10
0 g
)P
(m
g/1
00
g)
0 100 200 300 400 500
RLLF
0
20
40
60
80
Fis
h P
rodu
ctiv
ity (
kg/h
a)
HimachalPradesh
MadhyaPradesh
UttarPradesh
Gulariya
Rihand
Pong
Gobindsagar
y = 0.13x+16.48
r2 = 0.26, p=0.02
reservoirs, however, the significant relation between RLLF and fish productivity depends entirely on the outlier of the Gulariya reservoir (Figure 4). This is a small reservoir in Uttar Pradesh that covers 300 ha when full, shrinking to 6.7 ha during the summer and drying completely in extreme summers.
FIGURE 3Basic sediment characteristics in reservoirs of the Indo-Gangetic Basin in India
FIGURE 4Relation between fish productivity and the relative lake-level fluctuation index
Sources: CIFRI, 1981, 2003a, 2003b, 2004a, 2004b, 2004c, 2004d and 2007; Sugunan, 1995.
Note: RLLF = % average annual drawdown over mean depth in 21 reservoirs in the Indo-Gangetic Basin.Sources: CIFRI, 2003a, 2003b and 2007; Sugunan, 1995.
Book 1.indb 15 12/29/11 1:16 PM

Review of tropical reservoirs and their fisheries16
Water transparency is affected by the monsoon when the higher inflows are loaded with dissolved and suspended organic and inorganic matter. In Madhya Pradesh, in particular, turbidity is generally high and can strongly affect the composition of algal communities, depending on the strength of the monsoon (Ramakrishniah and Sarkar, 1982). In contrast, reservoirs in rocky and gravelly catchments such as those in Himachal Pradesh, Jammu and Kashmir, and Jharkhand are more stable and transparent, although Secchi disc depth rarely reaches more than 2 m (Unni, 1985).
Seasonal variation of water temperature in IGB reservoirs ranges from 2–4 °C during the post-monsoon and pre-monsoon seasons, and diurnal variation is 10–12 °C (Das, 2001). In the western, central and eastern parts of the IGB, the temperature difference between the top and bottom of reservoirs averages 1–2 °C, with little or no stable thermal stratification, even in deeper reservoirs such as Bargi reservoir, which has a maximum depth of 59 m. However, thermal stratification does occur in some northern Indian reservoirs. Getalsund reservoir in Bihar has a thermocline between 7 m (25.3 °C) and 12 m (20.8 °C) with a stable hypolimnion below 12 m (Pal, 1979). Konar reservoir has a metalimnion at 3–9 m depth, with a temperature drop of 0.7–1.1 °C/m (Sarkar, 1979). Rihand reservoir has a metalimnion at 4–13 m depth, with a temperature difference of 8.5–10 °C in May (Desai and Singh, 1979). A very strong and well-defined thermocline has been observed in Govindsagar reservoir (Sarkar, Govind and Natarajan, 1977). Transient thermal stratification as a result of low wind speed with a fall in metalimnion temperature of less than 1 °C has been reported for the upper peninsular reservoirs of south Bihar, Gujarat and Madhya Pradesh and is a phenomenon that has been observed in many tropical lakes (Lewis, 1973; Taylor and Gebre-Mariam, 1989). Thermal stratification and the presence of an oxycline are both related to reservoir fertility, with more productive reservoirs showing sharper oxygen depletion in the tropholytic zone. In less productive water, as in Konar, Tilaiya and Rihand reservoirs, the oxygen curve is orthograde.
2.5 CHEMICAL AND BIOLOGICAL FEATURES OF IGB RESERVOIRSIn most reservoirs in IGB states, conductivity ranges from 100 to 300 μS/cm, with some higher values in reservoirs in Rajasthan and Haryana. The average chloride content in IGB reservoirs is in the range of 7–30 mg/litre, the normal range of freshwater, with higher values sometimes recorded during pre-monsoon months in some reservoirs of Haryana and Rajasthan. Most of the reservoirs have moderate total alkalinity in the range of 40–205 mg/litre, again reflecting the moderate primary productivity of these reservoirs (Figure 5). The low values of total alkalinity in Bihar and Jharkhand reservoirs are due to acidic, lateritic soils in dry forest areas. In general, total alkalinity is higher during pre-monsoon periods, with a substantial decrease with dilution in the following monsoon period. Some reservoirs in Bihar, Jharkhand and Madhya Pradesh have low total hardness of 23–68 mg/litre, but all are still in the range of calcium and magnesium concentrations required for productive waters (> 20 mg/litre).
In Indian reservoirs, available N (in the form of nitrate and nitrogen dioxide) and P are very low (Figure 6), except during the period around the monsoons, when high temperatures increase the rate of microbial decomposition and runoff from agricultural land increases sediment and nutrient loading. During most of the year, available phosphate rarely exceeds 0.1 mg/litre. In general, silicate content is moderate in most of the reservoirs of the IGB (Figure 6), although some reservoirs in Jharkhand and Rajasthan show higher values (Das, 2001).
Gross primary productivity is shown in Figure 7. In most IGB reservoirs, green and blue-green algae, most notably Microcystis, form the bulk of phytoplankton communities, followed by diatoms (CIFRI, 2007; Sugunan, 1995). In Gobindsagar, which is a productive reservoir, Ceratium sp. is dominant over Microcystis. Reservoirs in Rajasthan, with scanty rainfall and poor flushing, favour macrophytes, and no
Book 1.indb 16 12/29/11 1:16 PM

Reservoirs in the Indo-Gangetic Basin of India 17
blooms of Microcystis are recorded. Plankton usually exhibits two peaks in a year, a distinct winter pulse attributed to higher nutrient-rich monsoon inflow and a summer pulse of lower magnitude. Copepods are important elements of the zooplankton followed by cladocerans, rotifers and protozoans (CIFRI, 2007; Sugunan, 1995).
FIGURE 5Physicochemical characteristics of water in reservoirs of the Indo-Gangetic Basin in India
Sources: CIFRI, 1981, 2003a, 2003b, 2004a, 2004b, 2004c, 2004d and 2007; Sugunan, 1995.
FIGURE 6Basic nutrients in the Indo-Gangetic reservoirs of India
Sources: CIFRI, 1981, 2003a, 2003b, 2004a, 2004b, 2004c, 2004d and 2007; Sugunan, 1995.
0
0,5
1
1,5
2
2,5
3
3,5
4
Jam
mu
&K
ashm
ir
Him
acha
lP
rade
sh
Pun
jab
Har
yana
Raj
asth
an
Utta
r P
rade
sh
Mad
hya
Pra
desh
Bih
ar &
Jhar
khan
d
Wes
t Ben
gal
0
50
100
150
200
250
300
Jam
mu
&K
ashm
ir
Him
acha
lP
rade
sh
Pun
jab
Har
yana
Raj
asth
an
Utta
rP
rade
sh
Mad
hya
Pra
desh
Bih
ar &
Jhar
khan
d
Wes
t Ben
gal
0
200
400
600
800
1000
1200
Jam
mu
&K
ashm
ir
Him
acha
lP
rade
sh
Pun
jab
Har
yana
Raj
asth
an
Utta
r P
rade
sh
Mad
hya
Pra
desh
Bih
ar &
Jhar
khan
d
Wes
t Ben
gal
0
20
40
60
80
100Ja
mm
u &
Kas
hmir
Him
acha
lP
rade
sh
Pun
jab
Har
yana
Raj
asth
an
Utta
rP
rade
sh
Mad
hya
Pra
desh
Bih
ar &
Jhar
khan
d
Wes
t Ben
gal
Transparency Specific conducivity
Alkalinity Chloride
Se
cch
i dis
c d
ep
th (
m)
Alk
alin
ity
(pp
m)
μS/c
mC
I (p
pm
)
Nitrate in IG Basin states
0
100
200
300
400
500
600
Him
acha
lP
rade
sh
Pun
jab
Har
yana
Raj
asth
an
Utta
r P
rade
sh
Mad
hya
Pra
desh
Bih
ar &
Jhar
khan
d
Wes
t Ben
gal
Nit
rate
N (
pp
b)
0
100
200
300
400
500
600
700
Him
acha
lP
rade
sh
Pun
jab
Har
yana
Raj
asth
an
Utta
r P
rade
sh
Mad
hya
Pra
desh
Bih
ar &
Jhar
khan
d
Wes
t Ben
gal
Ph
osp
hat
e-P
(p
pb
)
0
5
10
15
20
25
30
35
Him
acha
lP
rade
sh
Pun
jab
Har
yana
Raj
asth
an
Utta
r P
rade
sh
Mad
hya
Pra
desh
Bih
ar &
Jhar
khan
d
Si (
pp
m)
Wes
t Ben
gal
Nitrate
Phosphate Silicate
Book 1.indb 17 12/29/11 1:16 PM

Review of tropical reservoirs and their fisheries18
FIGURE 7Gross primary production in IGB reservoirs and zooplankton and phytoplankton densities,
as recorded in some Indo-Gangetic Basin reservoirs
2.6 FISH AND FISHERIES IN RESERVOIRS 2.6.1 Fish productionFish production in IGB reservoirs is dominated by about 30 species (Table 8). In the upper part of the basin, these include mahseers (Tor spp.), snow trouts (Schizothorax spp.) and other cyprinids. In the middle and lower reaches, major carps such as Catla catla and Labeo species predominate.
100
1 000
10 000
100 000
Him
acha
lP
rade
sh
Pun
jab
Har
yana
Raj
asth
an
Utta
r P
rade
sh
Mad
hya
Pra
desh
Bih
ar &
Jhar
khan
d
Wes
t Ben
gal
Gross primary productivity
Da
ily g
ross
pri
ma
ry p
rod
uct
ivit
y (m
g C
/m3)
100
1 000
10 000
Him
acha
lP
rade
sh
Pun
jab
Har
yana
Raj
asth
an
Utta
r P
rade
sh
Mad
hya
Pra
desh
Bih
ar &
Jhar
khan
d
Wes
t Ben
gal
Plankton densities
Pla
nkt
on
de
nsi
ty u
/lit
re
Sources: CIFRI, 1981, 2003a, 2003b, 2004a, 2004b, 2004c, 2004d and 2007.
Book 1.indb 18 12/29/11 1:16 PM

Reservoirs in the Indo-Gangetic Basin of India 19
TABLE 8Major fish species found in reservoirs of the Indo-Gangetic Basin
System Ganges (reservoirs) Indus (Gobindsagar reservoir)
Reaches Upper Middle/Lower Upper Middle/Lower
Species Mahseers:Tor putitoraTor tor
Snow trout:Schizothorax plagiostomus
Medium carps:Labeo deroLabeo pangusia
Goonch:Bagarius bagarius
Major carps: Catla catlaLabeo rohitaCirrhinus cirrhosusLabeo calbasu
Minor carps:Labeo goniusLabeo bataLabeo bogaLabeo boggutPuntius sarana Chagunius chagunio
Catfishes:Wallago attuSilonia silondiaPangasius pangasiusRita ritaAorichthys aorAorichthys seenghala Smaller catfishes:Clupisoma garuaEutropiichthys vachaMystus cavasiusOmpok bimaculatus
Mahseers:Tor putitora
Snow trout:Schizothorax plagiostomus
Major carps: Crossocheilus latiusLabeo calbasu
Medium carps:Labeo deroLabeo bata
Snakeheads:Channa maruliusChanna striatusChanna punctatus
Catfishes:Aorichthys seenghala Wallago attu
Others:Heteropneustes fossilisNemacheilus sp.Mastacembelus armatusGlyptothorax sp.
SalmonidsSalmo trutta
Snow trout:Schizothorax plagiostomus
Major carps: Crossocheilus latiusCyprinus carpio var. specularisCatla catlaLabeo rohitaLabeo calbasu Cirrhinus cirrhosusHypophthalmichthys molitrix
Medium carps:Labeo deroLabeo dyocheilusLabeo bata
Catfishes:Aorichthys seenghala
Smaller catfishes:Clupisoma montanaMystus bleekeri
Others:Garra gotylaMastacembelus armatus
Source: Sugunan, 1995.
Over the 13 years from 1990 to 2003, freshwater fish production in Indian states located in the IGB increased from 0.92 million tonnes to 2.08 million tonnes (Figure 8). The share of the IGB in total fish production in India increased from 24 percent in 1990 to 33 percent in 2003. West Bengal produces over 56 percent of fish production in the basin, followed by Bihar with 13 percent, Uttar Pradesh 12 percent, Madhya Pradesh 7 percent and other states combined 12 percent. The highest percentage growth in fish production was recorded in Punjab, where it reached 83 000 tonnes in 2003, up from 11 000 tonnes in 1990 (DAHDF, 2005).
FIGURE 8Fish production in Indo-Gangetic Basin states
Source: DAHDF, 2005.
Haryana Punjab Rajastan Uttar Pradesh0
100 000
200 000
300 000
400 000
500 000
Fish
pro
duct
ion
(103
tonn
es)
N = 8
N = 14
N = 200
N = 23
Book 1.indb 19 12/29/11 1:16 PM

Review of tropical reservoirs and their fisheries20
The average yield of IGB reservoirs is 18 kg/ha (Sinha and Katiha, 2002) (Table 9). Small reservoirs produce 30 kg/ha, medium-sized 13 kg/ha and large 9 kg/ha. In the case of small reservoirs, notable yields are achieved in Madhya Pradesh (47 kg/ha) and Rajasthan (46 kg/ha). The productivity of medium-sized reservoirs is comparatively high in Rajasthan at 24 kg/ha. Comparatively high fish yields from large reservoirs are achieved in Madhya Pradesh (40 kg/ha) and Himachal Pradesh (36 kg/ha) (Sinha and Katiha, 2002) (Tables 9 and 10).
Catch per unit area generally decreases significantly with increased reservoir area (Figures 9 and 10). For comparisons, therefore, it is necessary to standardize the area based on log-log regressions of yield and reservoir area to correct for reservoir size (Kolding and van Zwieten, 2006; van Densen et al., 1999). From this, a hypothetical 1 000 ha reservoir would yield an extremely low 0.56 kg/ha in Bihar and 14.8 kg/ha in the three Pradesh states (Figure 10, top). All reservoirs gave an annual yield of 36 kg/ha (Figure 10, bottom) (CIFRI, 2006a). By comparison, hypothetical 1 000 ha lakes in the Philippines gave an annual yield of 365 kg/ha, Sri Lankan reservoirs 239 kg/ha, Chinese reservoirs 79 kg/ha, Thai reservoirs 74 kg/ha and Indonesian reservoirs 65 kg/ha (van Densen et al., 1999). Similar regressions for Latin American reservoirs gave annual yields in Cuba of 144 kg/ha and in Mexico of 234 kg/ha; while a hypothetical African lake of 1 000 ha would produce 316 kg/ha.
TABLE 9Fish yield in reservoirs of Indo-Gangetic Basin states in India, by reservoir size
Region
Yield (kg/ha)
Small Medium Large Average
Madhya Pradesh 47.26 12.02 14.53 13.68
Bihar 3.91 1.90 0.11 0.05
Uttar Pradesh 14.60 7.17 1.07 4.68
Rajasthan 46.43 24.47 5.30 24.89
Himachal Pradesh na na 35.55 35.55
Total for IGB states 29.75 12.80 9.23 18.32
Total for India 49.90 12.30 11.43 20.13
na = not available.Source: Sinha and Katiha, 2002 (modified).
TABLE 10Fish production potential based on morpho-edaphic characteristics and actual catch in Indo-Gangetic Basin reservoirs
Indo-Gangetic Basin states Annual fish production potential Annual catch
(kg/ha)
Jammu and Kashmir 60 15–25
Himachal Pradesh 56 25
Punjab 57–100 14–70
Haryana 153–360 80–100
Rajasthan 178–478 41–365
Uttar Pradesh 85–127 5–14
Madhya Pradesh 70–545 18–63
Bihar and Jharkhand 80–325 2–8
West Bengal 75–300 15–60
Sources: Sugunan, 1995; CIFRI, 1981, 2003a, 2003b, 2004a, 2004b, 2004c, 2004d and 2007.
Book 1.indb 20 12/29/11 1:16 PM

Reservoirs in the Indo-Gangetic Basin of India 21
FIGURE 9Plot of yield on surface area for reservoirs for Indo-Gangetic Basin states in India
Notes: Top graph: Madhya Pradesh (27 reservoirs), Rajasthan (20), Uttar Pradesh (4), Himachal Pradesh (2) and Bihar (33). Bottom graph: Jammu and Kashmir (2), Himachal Pradesh (2), Punjab (8), Haryana (6), Rajasthan (279) and Uttar Pradesh (23). All regressions are according to the following: log10 Yij = log10 a + b.10log Si + ij, where Yij = total yield in kilograms, Si = area in hectares, ij = residual error, log a = intercept and b = slope, r2 = proportion of explained variation, ***=p<0.001, SE = standard error. Rajasthan data from Sugunan (1995) were not used in the regression as they appear to be calculated through a model.Sources: Sugunan, 1995; CIFRI, 2006b.
Although the arithmetic mean productivity of the 98 IGB reservoirs for which catch data were available for this review is relatively high at 66.5 kg/ha (Figure 11), the distribution is highly skewed, so a better descriptor of actual catch would be the median of 4.2 kg/ha or the geometric mean of 5.2 kg/ha. Even compared with the 20 kg/ha
average yield of Indian reservoirs (Table 9), this productivity seems far below potential. Even a moderate increase of 100 kg/ha for small reservoirs and 50 kg/ha for medium-sized and large ones would provide an additional 170 000 tonnes of fish (Sugunan, 1995). The low productivity of Indian reservoirs is thought to be caused mainly by a management system that fails to consider reservoir ecology and trophic dynamics. It also results from inadequate stocking, badly selected species for stocking (Jayasinghe, Amarasinghe and De Silva, 2006), stocking material below a reasonable length and “irrational” exploitation. A subset of 67 reservoirs for which the catch, fishing effort, area and species composition of the catch are known, was used for subsequent analysis
10 0 10 1 10 2 10 3 10 4 10 5 10 6 10 7
Surface area (ha)
10 0
10 1
10 2
10 3
10 4
10 5
10 6
10 7
10 8
Tot
al y
ield
(kg
)
Bihar HimachalPradesh
UttarPradesh
Rajasthan MadhyaPradesh
State log a (SE) b (SE) r²
1 Bihar 1.16 (0.34) 0.53 (0.13) 0.35***
2 M.H.U Pradesh 1.59 (0.60) 0.86 (0.17) 0.44***
Total 0.81 (0.36) 0.98 (0.12) 0.53***
1
2
10 0 10 1 10 2 10 3 10 4 10 5
Surface area at full storage level (ha)
10 1
10 2
10 3
10 4
10 5
10 6
10 7
Tot
al y
ield
(kg
)
Jammu &Kashmir
HimachalPradesh
PunjabPradesh
Haryana Rajasthan UttarPradesh
State loga(SE) b(SE) r²
All Lakes 3.12 (0.13) 0.48 (0.05) 0.2***
Book 1.indb 21 12/29/11 1:16 PM

Review of tropical reservoirs and their fisheries22
(CIFRI, 2006b). The median depth of these reservoirs was 5 m. Three reservoirs had a mean depth greater than 100 m, and 90 percent had a mean depth of less than 15 m.
FIGURE 10Plot of fish productivity on surface area for reservoirs for Indo-Gangetic Basin states in India
Notes: Madhya Pradesh (27 reservoirs), Rajasthan (20), Uttar Pradesh (4), Himachal Pradesh (2) and Bihar (33), and (bottom) Jammu and Kashmir (2), Himachal Pradesh (2), Punjab (8), Haryana (6), Rajasthan (279) and Uttar Pradesh (23). Regressions are according to: 10log FPij= 10log a + b 10log Si + ij , where FPij = fish productivity (kg/ha), Sj= area (ha), log a = intercept and b = slope, ij = residual error. SE = the standard error, r2 = proportion of explained variation, ***=p<0.001. No regression was made for the reservoirs in Rajasthan as the data appear to be calculated through a model and not based in observations. The Gandisaghar reservoir and the reservoirs in Himachal Pradesh were excluded from the regression.Sources: Sugunan, 1995; CIFRI, 2006b.
10 1 10 2 10 3 10 4 10 5
Surface area (ha)
10 -1
10 0
10 1
10 2
10 3
Fis
h pr
oduc
tivity
(kg
/ha)
Bihar HimachalPradesh
Rajasthan UttarPradesh
MadhyaPradesh
Gandisaghreservoir
1
2
State loga (SE) b (SE) r²
1 Bihar 1.16 (0.34) -0.47 (0.13) 0.30***
2M.U. Pradesh 1.52 (0.62) -0.44 (0.19) 0.17*
Book 1.indb 22 12/29/11 1:16 PM

Reservoirs in the Indo-Gangetic Basin of India 23
FIGURE 11Distribution of estimated productivity in 98 Indo-Gangetic reservoirs in India
Note: Average = arithmetic mean. Source: Sugunan, 1995.
Total production and production by species in reservoirs can be compared directly by standardizing them by surface area. Regression analysis of the log10 transformed total yield against the log10 transformed surface area was significant (p < 0.001, n = 67, r2 = 0.17) and gave as intercept a = 3.38 and a slope of b = 0.411. The total catch was standardized to surface area as follows:
where Cst = standardized yield, C = actual yield, = the average area of 67 IGB reservoirs at full storage level of 1 296 ha, area = the actual area of the reservoir at full storage level, and b as calculated. In this way, the standardized yield is independent of the surface area of the reservoir.
Average standardized yields from reservoirs in Haryana, Punjab and Uttar Pradesh were all lower than average, although with a wide range in yields in Haryana and Punjab. Only the yields from Uttar Pradesh reservoirs, at 7 261 kg, were both low and less variable. Standardized yields from reservoirs in Rajasthan averaged 164 865 kg, which was significantly higher than the overall mean yield (Figure 12).
FIGURE 12Standardized catches from the Indo-Gangetic Basin reservoirs in selected states,
showing the geometric mean and 95 percent confidence limits.
Notes: N = number of reservoirs included in the analysis. The horizontal line is the geometric mean catch over all reservoirs (25 491 kg).
1 2 3 4 5 6 7 8 9 10 11 12 13 14 15 16 17 18 19 20 25 30 35 40 45 50 55 60 65 70 75 80 85 90 95100
Productivity range (kg/ha)
0
2
4
6
8
10
12
14F
requ
ency
Bihar
MadhyaPradesh
Rajasthan
UttarPradesh
HimachalPradesh
AverageMedian
GeometricMean
Book 1.indb 23 12/29/11 1:16 PM

Review of tropical reservoirs and their fisheries24
With a standardized average yield of 52 tonnes, Indian major carps generate the highest yield and are caught in almost all reservoirs. In half of the reservoirs, about 28 tonnes of catfishes and 11 tonnes of other species (minor carps and minnows) are caught annually. Exotics are caught in eight reservoirs, averaging 31 tonnes and an average of 26 tonnes of Cyprinus carpio are caught in 12 reservoirs (Figure 13). Indian major carps are the most important species in Haryana, Punjab, Rajasthan and Uttar Pradesh. Catfishes are important in Himachal Pradesh, Rajasthan and Uttar Pradesh. In the few reservoirs in Himachal Pradesh and Jammu and Kashmir included in the data set, exotics are an important part of the catch (Figure 14).
FIGURE 13Standardized catch of main species from 67 reservoirs of the Indo-Gangetic Basin,
showing the geometric mean standardized yield and the 95 percent confidence limits
Note: CC = Cyprinus carpio, CF = catfishes, EXO = exotic, IMC = Indian major carps, N = number of reservoirs, OTH = other (not including mahseer).
FIGURE 14Standardized catch of main species in 67 reservoirs by state,
showing the geometric mean standardized yield and the 95 percent confidence limits
Note: CC = Cyprinus carpio, CF = catfishes, EXO = exotic, IMC = Indian major carps, N = number of reservoirs, OTH = other (not including mahseer).
Book 1.indb 24 12/29/11 1:16 PM

Reservoirs in the Indo-Gangetic Basin of India 25
2.6.2 Fishing practicesReservoirs are mostly fished with nylon twine gillnets, installed at or near the surface because the use of bottom-set nets is constrained by large numbers of submerged trees and other obstacles. The standard gillnet is 40–300 mm stretched mesh, 50 m long and 2 m deep with a head rope, floats and foot rope, with or without sinkers. The most common type is the Rangoon net, an entangling gillnet operated without a foot rope. Another entangling net used in reservoirs is uduvalai, which has a reduced fishing height and is usually operated in shallow marginal areas to catch small fish. Drag nets (beach seines or mahajal in Uttar Pradesh and Madhya Pradesh) are used in many reservoirs. Other fishing gear include cast nets, scoop nets, longlines, handlines, pole and line and traps, but the catch from them is insignificant compared with that of gillnets and seines. Information on fishing methods was available for 414 of the 609 reservoirs for which data were available in Haryana (23), Himachal Pradesh (5), Jammu and Kashmir (2), Punjab (13), Rajasthan (400) and Uttar Pradesh (166). Of these, 96 percent were fished with drag nets, 92 percent with gillnets, 89 percent with cast nets, 53 percent with hooks and hook and line, and 2 percent with traps.
In most Indian reservoirs, fishing is not very remunerative and no boats are used – the fishers depending entirely on makeshift rafts fabricated out of old tyres, logs, used cans and anything else that floats. Flat-bottomed, locally made boats ranging in length from 3 to 7 m are used in Kyrdemkulai, Hirakud, Malampuzha, Gobindsagar, Gandhisagar and Rihand reservoirs. A flat-bottomed plank canoe 2–3 m in length is the most popular fishing craft at Gandhisagar. At the same reservoir, repatriates from Bangladesh use a Bengal-type dinghy, which is 5–7 m in length and can be rigged with sails. Reservoir fishers, in general, are too poor to invest in boats, and what boats there are have in many cases been purchased with subsidies from the government or funding agencies. Mechanized boats are not used in reservoir fishing to any appreciable extent.
2.6.3 Fishing effortLimited information is available on fishing effort in IGB reservoirs, whether expressed as numbers of fishers, boats or gear. Effort is often regulated through licensing, royalties or crop-sharing systems but differs from state to state and includes open-access systems as well. A data-collection methodology to obtain catch statistics through a stratified random system was developed and implemented for the whole of India in the period 1971–1985, but has been discontinued in many states. Some data are available for some reservoirs (Figure 15), but they do not include changes in fishing effort over time, precluding analysis of the impacts of fishing effort on fish communities or of the dynamics of fishing effort in relation to changes in reservoir productivity.
Fisher density decreases as reservoir area increases (Figure 15). As the level of fishing technology is generally low fishers may keep to the shore and avoid deeper areas. The focus on benthic cyprinid species would result in such fishing patterns, in which case shoreline length would be a better indicator of fisher density.
Yield per hectare increases with the density of fishers (Figure 16). However, the marginal returns per fisher fall at higher total yields owing to the increase in fisher density.
Yield is expected to maximize with increased fishing effort. However, no time series of yield and effort is available. As a proxy, the standardized yield (i.e. any relation that does not involve reservoir area) over 67 reservoirs was used and related to the number of fishers per reservoir. Again, no relation between yield and effort was found (Figure 17). Catch rates decrease with increasing effort by almost the inverse of the fishing effort. Catch rates for reservoirs with up to 100 fishers range from 100 kg to 25 tonnes/year, with a median of 2.5 tonnes/year. This is very low in comparison with almost any other freshwater fishery in the world. Reservoirs with more than 100 fishers have a median average catch rate of 0.43 tonnes/year per fisher, or about 1.5 kg/day for 250 fishing days.
Book 1.indb 25 12/29/11 1:16 PM

Review of tropical reservoirs and their fisheries26
Although the data should be treated with caution because it is not clear how reliable they are, this suggests that effort is determined by factors other than total yield, area and reservoir productivity. It could also mean that catch rates are not a driving factor in the distribution of fishing effort. Further, no redistribution of fishing effort to reservoirs with higher productivity seems to take place.
FIGURE 15Number and densities of fishers relative to surface area at full storage level
of 67 reservoirs in selected Indo-Gangetic Basin states
Notes: No significant relation was found between the two variables. The horizontal line is the geometric mean of all fishers over 67 reservoirs (42). The arithmetic mean = 152 fishers. The regression line is log10 DFij = log10 a + b. log10 Si + ij, where DFij = density of fishers, Si = area, log a =
intercept and b = slope. The result is transformed to its corresponding power function, r2 = proportion of explained variation, p < 0.001.
FIGURE 16Density of fishers in relation to yield per area or productivity in 84 Indo-Gangetic Basin
reservoirs
Source: CIFRI, 2006a.
0.001 0.01 0.1 1 10
Density fishers (no./ha)
0.1
1
10
100
1 000
10 000
Cat
ch (
kg/h
a)
Jammuh &Kashmir
HimachalPradesh
Punjab
Haryana
Rajasthan
UttarPradesh
MadyaPradesh
y = 163.9*x 0.49
r2 = 0.21
10 100 1000 10000 100000
Surface area at full storage level (ha)
1
10
100
1 000
10 000
No.
of fi
sher
s
Jammu &Kashmir
HimachalPradesh
Punjab
Haryana
Rajasthan
UttarPradesh
10 100 1000 10000 100000
Surface area at full storage level (ha)
0.0001
0.001
0.01
0.1
1
10
No.
of fi
sher
s/ha
Jammu &Kashmir
HimachalPradesh
Punjab
Haryana
Rajasthan
UttarPradesh
y = 10.64*x -0.74
r2 = 0.49
Book 1.indb 26 12/29/11 1:16 PM

Reservoirs in the Indo-Gangetic Basin of India 27
A possible explanation for the extremely low production per unit area is overexploitation resulting from high effort relative to the production potential of IGB reservoirs. No information was available on this. Outside the IGB states, for example, in Ukai reservoir which has an area of 36 525 ha, 306 boats with 3 400 gillnets, each measuring 50 m, operated from 1982/83 to 1985/86. In a fishing year of 260 days, 1 836 fishers netted 174 tonnes of fish, or less than 0.1 tonnes per fisher per year. This amounts to 400 g of fish per fisher per day. The 520 fishers at Nagarjunasagar reservoir were slightly better off, as they shared a catch of 170 tonnes, or 0.3 tonnes per fisher per year. In lower Aliyar, 17 tonnes of fish were harvested by 14 fishers, which amounted to about 1.2 tonnes per fisher per year. After meeting the royalty obligations of the fishing permit, each fisher could take home only Rs1 000–1 400 (US$20–30) per year. In contrast, the 80 fishers at Bhavanisagar reservoir shared 150–300 tonnes of fish, or 2–4 tonnes per fisher per year, earning each fisher an annual income of Rs8 175 (about US$1 600) (Paul and Sugunan, 1983).
FIGURE 17Standardized yield and standardized yield per fisher
Notes: Weight corrected for lake area; mean = 24 700 kg.
Book 1.indb 27 12/29/11 1:16 PM

Review of tropical reservoirs and their fisheries28
2.7 MANAGEMENT PRACTICES 2.7.1 Stocking and technical managementVarious fisheries management measures are implemented in the numerous reservoirs of the country, including the selection of species for stocking, stocking rate and the introduction of exotic species. The Indian major carps Catla catla, Labeo rohita and Cirrhinus cirrhosus are stocked at a rate of 300–1 000 fish of length 100–120 mm per hectare. The growing period in the reservoir varies according to the recapture rate of stocked fish. Stocking increases the fish yield in reservoirs by many times. Feeding and fertilization are not practised in any reservoir.
In the Ganges system, the formation of reservoirs has adversely affected indigenous stocks of the mahseers, snow trouts, Labeo dero and L. dyocheilus in Himalayan streams. In some instances, mahseer and snow trout breeding and nursery habitats are protected. Sugunan (1995) assessed the impact of stocking on fish production and indigenous fauna diversity. Table 11 summarizes aspects of reservoir fisheries and management for a selection of those important reservoirs. The stocking rate increases proportionately with the reservoir surface area in Rajasthan and Uttar Pradesh, but no relation was found in Haryana, and stocking rates appear to decrease with increasing reservoir area in Haryana. In Rajasthan and Uttar Pradesh, stocking rates also increase with the square root of the reservoir area, indicating that smaller reservoirs have relatively higher stocking rates per unit area (Figure 18).
FIGURE 18Number of stocked fingerlings related to surface area
Note: Significant correlation in Rajasthan (unbroken line, p < 0.001) and Uttar Pradesh (p < 0.01) (broken line).
Fisheries were developed in most reservoirs only after construction and there were no provisions for facilitating fisheries or management during their planning. Even simple measures such as removing trees and other obstacles were generally not implemented (Katiha, 1994). An important constraint on reservoir productivity is the absence of fish species that are adapted to the reservoir environment. The fish naturally present when a dam is built, being primarily riverine species, may not be able to adapt very well to the highly variable water levels, the often stratified temperature and oxygen regimes and the generally lacustrine food webs of reservoir environments (Fernando and Holcik, 1991). Therefore, largely for economic and consumer-preference reasons, Indian reservoirs have been stocked with valuable Indo-Gangetic carps for many
10 0 10 1 10 2 10 3 10 4 10 5
Surface area at full storage level (ha)
10 3
10 4
10 5
10 6
10 7
Tot
al s
tock
ed fi
nger
lings
(no
.)
Punjab
Haryana
Rajasthan
UttarPradesh
Book 1.indb 28 12/29/11 1:16 PM

Reservoirs in the Indo-Gangetic Basin of India 29
TAB
LE 1
1Fi
sher
y d
escr
ipti
on
, pro
du
ctiv
ity,
an
d m
anag
emen
t in
sel
ecte
d r
eser
voir
s in
th
e In
do
-Gan
get
ic B
asin
St
ate
Res
ervo
irA
rea
(ha)
Spec
ies
(% in
cat
ch)
Pro
du
ctiv
ity
Man
agem
ent
Ref
eren
ce
Jam
mu
and
Kas
hmir
Sala
l1
000
Tor
putit
ora,
Sch
izot
hora
x sp
., C
yprin
us c
arpi
o, C
ross
oche
ilus
sp.,
Labe
o sp
p.,
Mys
tus
spp.
, N
emac
heilu
s sp
., G
lypt
otho
rax
sp.
Stoc
king
of
T. p
utito
ra f
inge
rling
sA
ngch
ook
and
Dog
ra,
2006
Ranj
it Sa
gar
8 70
0T.
put
itora
(40
%),
C. c
arpi
o (3
5%),
Labe
o sp
p. (
19%
), m
isce
llane
ous
(6%
)
Stoc
king
of
IMC
Ang
choo
k an
d D
ogra
, 20
06
Him
acha
l Pra
desh
Gob
inds
agar
16 8
67H
ypop
htha
lmic
hthy
s m
olitr
ix (8
0%)
17 k
g/ha
(19
75),
96.4
kg/
ha (
1992
/93)
Cag
e re
arin
g of
see
d an
d st
ocki
ng o
f IM
CSu
guna
n, 1
995
Pong
24 6
29A
oric
hthy
s se
engh
ala
(275
ton
nes,
57
% o
f ca
tch
in 2
000)
, Lab
eo r
ohita
, La
beo
calb
asu ,
T. p
utito
ra, C
. car
pio
53 k
g/ha
(19
87)
Stoc
king
of
com
mon
car
p an
d IM
CC
IFRI
, 20
07
Cha
mer
a90
0C
. car
pio,
T. p
utito
ra24
.7 k
g/ha
(19
94)
Intr
oduc
tion
of c
omm
on c
arp
&
mah
seer
, pr
otec
tion
of b
reed
ing
grou
nds,
ban
on
broo
d an
d ju
veni
le
fishi
ng,
proh
ibiti
on o
f sm
all-m
esh
nets
CIF
RI,
2003
b
Pand
oh20
0Sa
lmo
trut
ta f
ario
, Lab
eo d
ero,
La
beo
dyoc
heilu
s , T
. put
itora
Stoc
king
of
com
mon
car
pSu
guna
n, 1
995
Punj
abSe
vera
l res
ervo
irsC
. car
pio,
Cte
noph
aryn
godo
n id
ella
, L.
roh
ita, C
irrhi
nus
cirr
hosu
s, L
abeo
ca
lbas
u , S
chiz
otho
rax
plag
iost
omus
, H
. mol
itrix
, T. p
utito
ra, L
. der
o,
Labe
o ba
ta, C
lupi
som
a ga
rua
and
Punt
ius
spp.
10–7
0 kg
/ha
CIF
RI,
2004
c
Raja
stha
nSe
vera
l res
ervo
irs40
7–3
618
Maj
or c
arps
, m
inor
car
ps,
catf
ishe
s7.
0–46
.9 t
onne
s/ye
ar (
14.9
–172
.3 k
g/ha
) in
199
7–20
02En
hanc
emen
t th
roug
h st
ocki
ngC
IFRI
, 20
01 a
nd 2
004d
Ram
garg
h1
260
C. c
irrho
sus
(33%
), C
atla
cat
la
(15%
), L.
roh
ita (
14%
), pl
us
Not
opte
rus
noto
pter
us, L
. bat
a,
Punt
ius
sara
na
18–1
41 (
aver
age
77.8
) kg
/ha
in
1969
–198
5St
ocki
ng o
f IM
CJh
ingr
an,
1989
Jais
aman
d7
286
L. r
ohita
, C
. cirr
hosu
s, A
. see
ngha
la,
Labe
o fim
bria
tus
47.2
–88.
8 kg
/ha
in 1
970–
72In
tens
ive
stoc
king
of
IMC
to
brin
g do
wn
tilap
ia p
opul
atio
nJh
ingr
an,
1989
Utt
ar P
rade
shRi
hand
46 5
38C
. cat
la (
73–9
9% in
197
1–19
8025
–329
ton
nes/
year
, m
axim
um 1
1 kg
/ha,
po
tent
ial o
f 40
kg/
ha
Stoc
king
of
IMC
(ca
tla,
rohu
& m
rigal
) fo
r st
ock
dive
rsifi
catio
n. R
egul
ar
mon
itorin
g of
fis
h yi
eld
& f
ishi
ng e
ffor
t.
Mes
h re
gula
tion
and
clos
ed f
ishi
ng
seas
on
CIF
RI,
1981
, Su
guna
n, 1
995
No
te: I
MC
= In
dia
n m
ajo
r ca
rps
(Cat
la c
atla
, Lab
eo r
oh
ita,
Cir
rhin
us
cirr
ho
sus a
nd
Lab
eo c
alb
asu
); lo
cal m
ajo
r =
larg
e ca
tfis
h; l
oca
l min
or
= s
mal
l car
ps
and
sm
all c
atfi
sh.
Book 1.indb 29 12/29/11 1:16 PM

Review of tropical reservoirs and their fisheries30
Stat
eR
eser
voir
Are
a (h
a)Sp
ecie
s (%
in c
atch
)Pr
od
uct
ivit
yM
anag
emen
tR
efer
ence
Gul
ariy
a 30
0C
. cat
la, L
. roh
ita, C
. cirr
hosu
s,
L. c
alba
su,
min
or c
arps
, ca
tfis
hes
22 t
onne
s (1
50 k
g/ha
), po
tent
ial 2
34 k
g/ha
Regu
lar
stoc
king
of
IMC
Sugu
nan,
199
5
Bach
hra
140
Car
ps,
catf
ishe
s, m
inno
ws
10 t
onne
s/ye
ar (
139
kg/h
a),
pote
ntia
l of
240
kg/h
aC
ontr
act
com
mer
cial
fis
hing
thr
ough
au
ctio
n Su
guna
n, 1
995
Bagh
la25
0C
arps
, ca
tfis
hes,
min
now
s7
tonn
es/y
ear
(106
kg/
ha),
pote
ntia
l of
210
kg/h
aC
ontr
act
com
mer
cial
fis
hing
thr
ough
au
ctio
nSu
guna
n, 1
995
Pahu
j51
8IM
C,
loca
l maj
or,
loca
l min
or,
min
now
s64
ton
nes/
year
or
123
kg/h
a,
pote
ntia
l of
300
kg/h
aSt
ocki
ng o
f IM
C a
nd c
ontin
uous
fo
llow
up
of f
ishe
ry e
nhan
cem
ents
and
in
stitu
tiona
l int
erve
ntio
ns
Kat
iha
et a
l., 2
007
Utt
aran
chal
Baig
ul2
995
Gud
usia
cha
pra,
Lab
eo g
oniu
s,
catf
ishe
s, m
inor
car
ps,
(lim
ited
amou
nt o
f m
ajor
car
ps)
20 k
g/ha
Stoc
king
of
IMC
Cha
uhan
, 20
07
Mad
hya
Prad
esh
Gan
dhis
agar
66 0
00C
. cat
la (6
0–70
%),
L. r
ohita
, C
. cirr
hosu
s1
676–
3 42
4 to
nnes
/yea
r (2
6–52
kg/
ha)
Stoc
king
of
IMC
with
gre
ater
em
phas
is
on C
atla
. M
esh
regu
latio
n an
d st
rict
obse
rvan
ce o
f cl
osed
sea
son
Kar
tha
and
Rao,
199
3
Hal
ali
7 71
2Lo
cal m
inor
(36
.3%
), lo
cal m
ajor
(3
0.9%
), IM
C (
17.3
%):
C. c
atla
(9
.0%
), L.
roh
ita (
6.4%
), C
. cirr
hosu
s (1
.9%
), m
inno
ws
(15.
5%)
73.5
–350
.7 t
onne
s (1
5–73
kg/
ha)
aver
age
193.
8 to
nnes
(40
kg/
ha)
in
1990
–200
1
Con
trac
t an
d de
part
men
tal f
ishi
ng,
stoc
king
of
IMC
CIF
RI,
2003
a
Ker
wa
482
IMC
, m
ediu
m-s
ized
car
ps,
smal
l ca
tfis
hes,
min
now
s, T
or s
pp.
31–7
2 kg
/ha,
pot
entia
l of
545
kg/h
aSt
ocki
ng a
nd c
ultu
re o
f m
ahse
ers
CIF
RI,
2003
a
Gob
indg
arh
307
90%
of
catc
h is
C. c
atla
, L. r
ohita
, C
. cirr
hosu
s , T
or t
or0.
4–26
.4 k
g/ha
(av
erag
e 15
.9 k
g/ha
)St
ocki
ng o
f IM
CSr
ivas
tava
et
al.,
1985
; Su
guna
n,
1995
Kul
garh
i19
3C
. cat
la (
75.6
%),
C. c
irrho
sus
(11.
5%),
L. r
ohita
(8.
3%),
carp
hy
brid
s (2
.5%
)
7.4
kg/h
aSt
ocki
ng o
f si
lver
car
p ( H
. mol
itrix
)D
wiv
edi,
Kar
amch
anda
ni &
Jos
hi,
1986
Dah
od46
0IM
C,
loca
l maj
or,
loca
l min
or,
min
now
s25
ton
nes/
year
or
65 k
g/ha
, po
tent
ial
of 2
85 k
g/ha
Stoc
king
of
gras
s ca
rp
( Cte
noph
aryn
godo
n id
ella
) and
IMC
and
re
gula
r m
onito
ring
and
impr
ovem
ent
of
fishe
ry e
nhan
cem
ents
and
inst
itutio
nal
inte
rven
tions
Vas
s et
al.,
200
8
No
te: I
MC
= In
dia
n m
ajo
r ca
rps
(Cat
la c
atla
, Lab
eo r
oh
ita,
Cir
rhin
us
cirr
ho
sus a
nd
Lab
eo c
alb
asu
); lo
cal m
ajo
r =
larg
e ca
tfis
h; l
oca
l min
or
= s
mal
l car
ps
and
sm
all c
atfi
sh.
TAB
LE 1
1 (c
on
t.)
Book 1.indb 30 12/29/11 1:16 PM

Reservoirs in the Indo-Gangetic Basin of India 31
decades, and fish production from the reservoirs depends heavily on various types of enhancement.
Stocking rates had a significant positive relation to surface area, so these were standardized according to the same equation as for yields (see p. 23). In this case, a = 4.11 and b = 0.58 (r2 = 0.35, p < 0.001) and average area = 1 296 ha to enable direct comparison of stocking rates by species and between states. Stocking rates of all species are about 2 900 000 fingerlings per species, but higher in Uttar Pradesh than in the other states for which information was available (Figures 19 and 20). In Haryana, the geometric mean stocking rate was one-tenth as high. Indian major carps are stocked in 60 percent of the reservoirs examined, with the highest geometric mean stocking rate of about 3 000 000 fingerlings. Common management measures employed elsewhere in the world, such as control of effort, gear restrictions and protected areas, are not commonly seen as options for improving productivity. Indian IGB experience to date suggests that large and medium-sized reservoirs are most productively managed only through stocking and regulating capture fisheries, while production from small reservoirs is easier to maximize through aquaculture (e.g. cages).
FIGURE 19Standardized stocking rate (number of fingerlings) by state and by species in 245 reservoirs,
showing geometric mean and 95 percent confidence interval
Note: EXO = exotics, CC = common carp, GC = grass carp, IMC = Indian major carps, ROH = Labeo rohita, KAT = Catla catla, MRL = C. cirrhosus, N = number of occurrences.
Book 1.indb 31 12/29/11 1:16 PM

Review of tropical reservoirs and their fisheries32
FIGURE 20Standardized stocking rate in 245 reservoirs by species category and state,
showing geometric mean and 95 percent confidence interval
Note: EXO = exotics, CC = common carp, GC = grass carp, IMC = Indian major carps, ROH = Labeo rohita, KAT = Catla catla, MRI = Cirrhinus cirrhosus, N = number of occurrences.
There is a need to dovetail the twin objectives of conservation and yield optimization over the short term in reservoir fishery management. While fishers and fish merchants strive to increase production for economic gain, it is the responsibility of the State to ensure that economic expediency does not cause ecological collapse or loss of important biodiversity (Sugunan, 1995). Managing reservoirs for what are virtually open-access fisheries may be counterproductive from conservation and yield optimization points of view, but this often serves to support the safety net function of small-scale fisheries.
2.7.2 Socio-economic and institutional settings With very few exceptions, reservoirs in India are public waterbodies owned by government departments, such as those responsible for irrigation and power generation. There is a great deal of variation in the management practices followed by different states, ranging from outright auctioning of licences to almost free fishing. In many cases, the management of fisheries is transferred to the state fisheries department, either by paying a nominal royalty (e.g. Rihand in Uttar Pradesh and Kansbati in West Bengal) or freely (Gobindsagar and Pong Dam in Himachal Pradesh) (Sinha and Katiha, 2002). In some cases, fishing rights are further transferred to another government entity, cooperative or private agency. In particular, public companies have been promoted by many of the states and styled as fishery-development corporations, but these have not functioned effectively (Sugunan, 1995). In some states, such as Madhya Pradesh and Himachal Pradesh, fishery development corporations act as overseeing bodies for the numerous cooperative societies that work in reservoirs and undertake marketing functions to ensure that fishers receive the right price for their catch, often with mixed results. Cooperative societies and state-level fishery-development corporations are also involved in fishing and marketing operations. The nature of their involvement and their role in fishery and market interventions often varies from one reservoir to another within the same state.
Book 1.indb 32 12/29/11 1:16 PM

Reservoirs in the Indo-Gangetic Basin of India 33
Reservoir fishers are among the weakest groups in Indian society and are heavily assisted by the government (Sugunan, 1995). Normally, fisheries departments stock reservoirs free of charge and offer a number of loans and subsidies to fishers for procuring nets and boats. The value of subsidies and the nature and terms of the loans vary from state to state. However, the general intent of the policy is to make fishing virtually open access and to use fisheries to achieve broader social welfare objectives, sometimes to the detriment of the fishery (Katiha, 2002). Free licences are issued to fishers in a number of large reservoirs, although the local assistant director or deputy director determines the number of fishers, sets mesh regulations and controls seasonal closures. In most cases, the department exerts its control over exploitation largely through its role in marketing.
The commercial exploitation systems operated by the different states usually adopt one of the four following options: (i) departmental fishing; (ii) lease by auction; (iii) issuance of licences for fishing; or (iv) royalties or sharecropping. Direct departmental fishing is generally uneconomical and practised in very few reservoirs, except for experimental or exploratory purposes. Among the most important institutional arrangements for exploiting fisheries in reservoirs are various leasing systems based on trends in fish production, income and expenditure of the department, fishers’ socio-economic conditions, government policy towards cooperatives and, especially, the status of states’ fishery resources. In Madhya Pradesh, Rajasthan and Uttar Pradesh, small reservoirs are leased on an annual basis. In Rajasthan and Uttar Pradesh, small reservoirs are leased every year, medium-sized reservoirs for three years, large reservoirs for five years, and very large reservoirs (> 1 000 ha) for ten years. In Madhya Pradesh, reservoirs smaller than 100 ha are under the management of the local administrative authority (gram panchayat); those with areas of 100–1 000 ha are under the Department of Fisheries and those larger than 1 000 ha are under the State Fisheries Corporation.
In general, reservoirs entrusted to state agencies for monitoring and stocking consistently maintain higher yields than those under private control. Fishery cooperatives have been successful when they have engaged expertise to help manage stocking and harvesting. Institutional weaknesses are largely responsible for the lack of reliable fish catch statistics or yield estimates upon which improved reservoir management systems could be based. These weaknesses are, in particular:
capacity in data collection or management;
of illegal and often unscrupulous money lenders;
In India, reservoir fisheries are basically managed following the logic of common property. As in rivers, lakes and seas, biological wealth is considered nature’s endowment and the State’s intervention in developmental activities should benefit, first and foremost, the poor fishers who toil there. Investments in developing reservoir fisheries are viewed in light of the social benefits that accrue to low-income communities in the form of rehabilitating displaced populations, improving the living conditions of fishers and providing jobs. Although it is possible to link reservoir fishery development with poverty alleviation programmes, limited opportunities exist for creating additional alternative employment around most Indian reservoirs (Paul and Sugunan, 1990) and the progress made so far in this direction is not encouraging.
Book 1.indb 33 12/29/11 1:16 PM

Review of tropical reservoirs and their fisheries34
2.8 PROPOSED ACTION PLAN Measures suggested for increasing the yield and area of reservoirs under fisheries management are as follows:
livestock, fisheries, electricity, aesthetics) is much higher than the monetary value of its tangible products, reservoir projects should be evaluated through social and cost–benefit analysis instead of simple economic analysis. An appraisal of, and rationalization programme for, the present plethora of state policies concerning ownership, fishing rights, fisheries management, leasing, etc., suggests that it would be an improvement to optimize reservoir fisheries in light of the multistakeholder nature of these assets.
and enhancement measures, as well as infrastructure support to provide the needed quality and quantity of fish seed. Appropriately trained and supported technical assistance is a key aspect of this.
to assist in evaluating the effectiveness of measures, including stocking and other enhancement practices.
when planning proposed reservoirs.
REFERENCESAli, M.Y. 1991. Towards sustainable development of fisheries of Bangladesh. Workshop
paper on national conservation strategy for Bangladesh. Bangladesh Agricultural Research Council. 90 pp.
Angchook, T. & Dogra, R.K. 2006. Status of reservoir fisheries in Jammu and Kashmir state. Presentation at the Indo-Gangetic Basin-level workshop of the Challenge Program on Water and Food project: Improved Fisheries Productivity and Management in Tropical Reservoirs in New Delhi (26 December 2006). 12 pp.
Anon. 1996. Ninth Five Year Plan for Fisheries report of the working group. Planning Commission, New Delhi. 217 pp.
Anon. 2004 (unpublished). The base paper for Indo-Gangetic Basin of Indo-Gangetic Basin Coordinator in the Challenge Program on Water and Food. Patna, India, Indian Council of Agricultural Research, Complex for Eastern Region. 46 pp.
Anon. 2006. Eleventh Five Year Plan for Fisheries report of the working group. New Delhi, Planning Commission. 241 pp.
Bandu Amarasinghe, P. & Vijverberg, J. 2002. Primary production in a tropical reservoir in Sri Lanka. Hydrobiologia, 487: 85–93.
Blaber, S.J.M., Mazid, M.A., Milton, D.A., Salini, J.P. & Rawlinson, N.J.F. 1998. The BFRI-CSIRO collaborative research project on hilsa in Bangladesh: a progress report (1996–1997). In M.A. Mazid & S.J.M. Blaber, eds. Hilsa fisheries research in Bangladesh. Bangladesh Fisheries Research Institute Proceedings 6: 43–53.
Central Inland Fisheries Research Institute (CIFRI). 1981. Final report on ecology and fisheries of Rihand reservoir from 1971–72 to 1980–81. Barrackpore, India. 19 pp.
Central Inland Fisheries Research Institute (CIFRI). 2003a. Ecology and fisheries of selected reservoirs of Madhya Pradesh, by N.P. Shrivastava & A.K. Das. Bulletin No. 118. Barrackpore, India. 58 pp.
Central Inland Fisheries Research Institute (CIFRI). 2003b. Ecology-based fisheries management in Chamera reservoir (Himachal Pradesh), by D.K. Kaushal & V.K. Sharma. Bulletin No. 124. Barrackpore, India. 11 pp.
Book 1.indb 34 12/29/11 1:16 PM

Reservoirs in the Indo-Gangetic Basin of India 35
Central Inland Fisheries Research Institute (CIFRI). 2004a. Ecology and fisheries of Ravisankar Sagar reservoir, by V.R. Desai & N.P. Shrivastava. Bulletin No. 126. Barrackpore, India. 37 pp.
Central Inland Fisheries Research Institute (CIFRI). 2004b. Ecology-based fisheries management in small reservoirs of Haryana, by V.K. Sharma & D.K. Kaushal, Bulletin No. 136. Barrackpore, India. 2 pp.
Central Inland Fisheries Research Institute (CIFRI). 2004c. Ecology-based fisheries management in small reservoirs of Punjab, by D.K. Kaushal & V.K. Sharma. Bulletin No. 137. Barrackpore, India. 24 pp.
Central Inland Fisheries Research Institute (CIFRI). 2004d. Ecology and fisheries of selected reservoirs of southern Rajasthan, by V.K. Sharma & D.K. Kaushal. Bulletin No. 138. Barrackpore, India. 39 pp.
Central Inland Fisheries Research Institute (CIFRI). 2005a. Inventory of reservoirs in the Indo-Gangetic Basin. Initial report for the Project: Improved fisheries productivity and management in tropical reservoirs, CP-PN34: Challenge Program on Water and Food. Barrackpore, India. 34 pp.
Central Inland Fisheries Research Institute (CIFRI). 2005b. About CIFRI. Presentation by K.K. Vass during visit by Minister of Agriculture. Barrackpore, India. 3 pp.
Central Inland Fisheries Research Institute (CIFRI). 2006a (unpublished). Dataset for socio-institutional aspects of reservoirs in Indo-Gangetic Basin, by P.K. Katiha, K.K. Vass, S. Sarkar & A Saxena. Barrackpore, India. 15 pp.
Central Inland Fisheries Research Institute (CIFRI). 2006b (unpublished). Inventory of reservoirs in Indian Indo-Gangetic Basin, by P.K. Katiha, K.K. Vass, S. Sarkar & A. Saxena. Barrackpore, India. 12 pp.
Central Inland Fisheries Research Institute (CIFRI). 2007. Ecology and fisheries of Pong reservoir Himachal Pradesh, by V.K. Sharma. Bulletin No. 148. Barrackpore, India. 57 pp.
Chauhan, R.S. 2007. Present status and future perspective of reservoir fisheries in Uttarakhand. Presentation at Indo-Gangetic Basin-level workshop of the Challenge Program on Water and Food project Improved Fisheries Productivity and Management in Tropical Reservoirs in New Delhi (6 December 2007). 7 pp.
Craig, J.F., Halls, A.S., Barr, J. & Bean, C.W. 2004. The Bangladesh floodplain fisheries. Fisheries Research, 66(2–3): 271–286.
Das, A.K. 2001. Abiotic features in reservoir fisheries. In: Proceedings of a national agricultural technology project workshop Fisheries Management in Lentic Water Systems: Stocking of Reservoirs with Fish Seed (29–31 January 2001), pp. 15–72. Barrackpore, India, Central Inland Fisheries Research Institute.
Department of Animal Husbandry, Dairying and Fisheries (DAHDF). 2005. Handbook on fisheries statistics 2004. New Delhi. 166 pp.
Desai, V.R. & Singh, R.K. 1979. Occurrence of thermocline in Rihand reservoir of Uttar Pradesh and its depth criterion in relation to reservoir level. Journal of the Inland Fisheries Society of India, 11(2): 69–72.
De Silva, S.S. 2001. Reservoir fisheries: Broad strategies for enhancing yields. In S.S. De Silva, ed. Reservoir and culture-based fisheries: biology and management. Proceedings of an international workshop in Bangkok (15–18 February 2000), pp. 7–15. Australian Centre for International Agricultural Research Proceedings No. 98.
Dudgeon, D. 2000. Large-scale hydrological changes in tropical Asia: prospects for riverine biodiversity. BioScience, 50: 793–806.
Book 1.indb 35 12/29/11 1:16 PM

Review of tropical reservoirs and their fisheries36
Dwivedi, R.K., Karamchandani, S.J. & Joshi, H.C. 1986. Limnology and productivity of Kulgarhi reservoir, M.P. Journal of the Inland Fisheries Society of India, 18(2): 65–70.
Fernando, C.H. & Holcik, J. 1991. Fish in reservoirs. International Review of Hydrobiology, 76: 149–167.
Gopal, B. 2004. State of degradation and approaches to restoration of floodplain rivers in India. In R. Welcomme & T. Petr, eds. Proceedings of the Second International Symposium on the Management of Large Rivers for Fisheries. Volume II. RAP Publication 2004/17, pp. 1–14. Bangkok, FAO Regional Office for Asia and the Pacific. 316 pp.
Hayes, F.R. 1957. On the variation in bottom fauna and fish yield in relation to trophic level and lake dimensions. Journal of the Fisheries Research Board of Canada, 14: 1–32.
Hutchinson, G.E. 1957. A treatise on limnology, Vol I: Geography, physics and chemistry. New York, USA, John Wiley and Sons. 1015 pp.
Jayasinghe, U.A.D., Amarasinghe, U.S. & De Silva, S.S. 2006. Culture-based fisheries in non-perennial reservoirs of Sri Lanka: Influence of reservoir morphometry and stocking density on yield. Fisheries Management and Ecology, 13: 157–164.
Jha, B.C., Nath, D., Shrivastava, N.P. & Satpathy, B.B. 2008. Estuarine fisheries management: options and strategies. Policy paper No. 3. Barrackpore, India, Central Inland Fisheries Research Institute. pp. 1–24.
Jhingran, A.G. 1989. Limnology and production biology of two man-made lakes in Rajasthan (India) with management strategies for their fish yield optimization. Final report of IDA project Fisheries Management in Rajasthan. Barrackpore, India, Central Inland Fisheries Research Institute.
Jul-Larsen, E., Kolding, J., Overa, R., Nielsen, J.R. & van Zwieten, P. 2003. Management, co-management or no management? Major dilemmas in southern African freshwater fisheries. 1. Synthesis report. FAO fisheries technical paper No. 426/1. Rome, FAO. 127 pp.
Kartha, K.N. & Rao, K.S. 1993. A study on the piscifauna of Gandhisagar reservoir with particular reference to the abundance of commercial varieties of fish. Fishery Technology, 30: 11–14.
Katiha, P.K. 1994. Natural resource management: a case study of reservoir fisheries in Himachal Pradesh. Dr YS Parmar University of Horticulture and Forestry. (PhD thesis)
Katiha, P.K. 2002. Institutional arrangements for culture-based fisheries management. In V.V. Sugunan, B.V. Jha & M.K. Das, eds. Culture-based fisheries for inland fisheries development, pp. 165–174. Bulletin No. 113. Barrackpore, India, Central Inland Capture Fisheries Research Institute.
Katiha, P.K., Vass, K.K., Shrivastava, N.P., Sharma, V.K. & Sarkar, S. 2007. Inventory of reservoirs in Indian Indo-Gangetic Basin for fishery enhancements. Presented at 12th World Lake Conference (28 October – 3 November 2007). 226 pp.
Kolding, J. & van Zwieten, P. 2006. Improving productivity in tropical lakes and reservoirs. Challenge Program on Water and Food review series on aquatic ecosystems and fisheries, theme 3. Cairo, WorldFish Center. 139 pp.
Lewis, W.M. Jr. 1973. The thermal regime of Lake Lanao (Philippines) and its theoretical implications for tropical lakes. Limnology Oceanography, 18: 200–217.
Book 1.indb 36 12/29/11 1:16 PM

Reservoirs in the Indo-Gangetic Basin of India 37
Natarajan, A.V. 1976. Ecology and state of fishery development in some of the man-made reservoirs of India. In: Proceedings of the Indo-Pacific Fisheries Council symposium on the development and utilization of inland fishery resources in Colombo (27–29 October 1976). Indo-Pacific Fisheries Council. 15 pp.
Pal, J.N. 1979. Physico-chemical features of Getalsud reservoir. In A.V. Natarajan, ed. Proceedings of the Summer Institute on Capture and Culture Fisheries of the Man-made Lakes in India (7 July –6 August 1979), pp. 125–136. Barrackpore, India, Central Inland Fisheries Research, Institute.
Paul, S. & Sugunan, V.V. 1983. Fishing in reservoirs: certain economic considerations. In: Proceedings of the seventh workshop on Ecology and Fisheries of Freshwater reservoirs (9–10 March 1983), pp. 29–32. Barrackpore, India, Central Inland Fisheries Research Institute.
Paul, S. & Sugunan, V.V. 1990. Development of reservoir fisheries, areas of hopes and despair. In A.G. Jhingran & V.K. Unnithan, eds. Reservoir fisheries in India. Proceedings of the national workshop on reservoir fisheries (3–4 January 1990), pp. 29–32. Special publication 3. Mangalore, India, Asian Fisheries Society Indian Branch.
Payne, A. I., Sinha, R., Singh, H.R. & Huq, S. 2004. A review of the Ganges basin: Its fish and fisheries. In R.J. Welcomme & T. Petr, eds. Proceedings of the Second International Symposium on the Management of Large Rivers for Fisheries, pp. 229–251. Vol. I, RAP publication 2004/17. Bangkok, FAO Regional Office for Asia and the Pacific. 316 pp.
Ramakrishniah, M. & Sarkar, S.K. 1982. Plankton productivity in relation to certain hydrological factors in Konar reservoir (Bihar). Journal of the Inland Fisheries Society of India, 14(1): 58–68.
Rawson, D.S. 1952. Mean depth and the fish production of large lakes. Ecology, 33(4): 513–521.
Rawson, D.S. 1955. Morphometry as a dominant factor in the productivity of large lakes. Verhandlungen der Internationalen Vereinigung fur Theoretische und Angewandte Limnologie, 12: 164–175.
Sarkar, S.K. 1979. Hydrological features of Konar and Tilaiya reservoirs with highlights on limno-chemical implications of thermal and chemical stratification. In A.V. Natarajan, ed. Proceedings of the Summer Institute on Capture and Culture Fisheries of the Man-made Lakes in India (7 July – 6 August 1979), pp. 68–87. Barrackpore, India, Central Inland Capture Fisheries Research Institute.
Sarkar, S.K., Govind, B.V. & Natarajan, A.V. 1977. A note on some distinctive limnological features of Gobindsagar reservoir. Indian Journal of Animal Sciences, 47(7): 435–439.
Shah, T.U.I., Hassan, M., Khattak, M.Z., Banerjee, P.S., Singh, O.P. & Rehman, S.U. 2009. Is irrigation water free? A reality check in the Indo-Gangetic Basin. World Development, 37: 422–434.
Sinha, M. 1997. Inland fisheries resources of India and their utilisation. In V.V. Sugunan & M. Sinha, eds. Fisheries enhancement of small reservoirs and floodplain lakes in India, pp. 67–174. Bulletin No. 75. Barrackpore, India, Central Inland Capture Fisheries Research Institute.
Sinha, M. & Katiha, P.K. 2002. Management of inland fisheries resources under different property regimes. In D.K. Marothia. Institutionalizing common pool resources, pp. 437–460. New Delhi, Concept Publishing Company.
Srivastava, U.K., Desai, D.K., Gupta, V.K., Rao, S.S., Gupta, G.S., Raghavacharya, M. & Vatsala, S. 1985. Inland fish marketing in India Reservoir Fisheries, 4 (A&B). New Delhi, Concept Publishing Company. (A) 403 pp. (B) 1184 pp.
Book 1.indb 37 12/29/11 1:16 PM

Review of tropical reservoirs and their fisheries38
Sugunan, V.V. 1995. Reservoir fisheries in India. FAO Fisheries Technical Paper No. 345. Rome, FAO. 423 pp.
Sugunan, V.V. 2000. Ecology and fishery management of reservoirs in India. Hydrobiologia, 430: 121–147.
Taylor, W.D. & Gebre-Mariam, Z. 1989. Size structure and productivity of the plankton community of an Ethiopian rift valley lake. Freshwater Biology, 21: 353–363.
Thenkabail, P.S., Schull, M. & Turra, H. 2005. Ganges and Indus river basin land use/land cover (LULC) and irrigated area mapping using continuous streams of MODIS data. Remote Sensing of Environment, 95: 317–341.
Unni, K.S. 1985. Comparative limnology of several reservoirs in central India. Internationale Revue gesamten Hydrobiologie, 70(6): 845–856.
van Densen, W.L.T., Kechik, I.B.A., Baluyut, E.A., Chookajorn, T., Moreau, J., Sarnita, A.S. & Yap, S.Y. 1999. Fish production, catch composition and changes in the freshwater fish communities in ASEAN lakes and reservoirs. In W.L.T. van Densen & M.J. Morris, eds. Fish and fisheries of lakes and reservoirs in Southeast Asia and Africa, pp. 229–244. Otley, UK, Westbury Academic & Scientific Publishing.
Vass, K.K., Katiha, P.K., Shrivastava, N.P., Sharma, V.K. & Das, A.K. 2008. Enhancement interventions and institutional arrangements to improve productivity of Indian reservoirs. Presented at VI IWMI-TATA Annual Partners’ Meet, March 8–10 2007 at IRM, Anand. p. 23.
Vollenweider, R.A. 1969. A manual on methods for measuring primary productivity in aquatic environments. IBP Handbook No. 12. Oxford, UK, Blackwell Scientific Publishers. 213 pp.
White, J. W., and A. Rodriguez-Aguilar. 2001. An agroclimatological characterization of the Indo-Gangetic Plains. Journal of Crop Production, 3: 53-65.
World Bank. 2000. World Development Report 2000/2001: Attacking Poverty. New York, USA, Oxford University Press. pp. 45–57.
World Bank. 2001. World development indicators. http://data.worldbank.org/indicator World Bank. 2003. World development indicators. http://data.worldbank.org/indicator
Book 1.indb 38 12/29/11 1:16 PM

39
3. Lake Nasser, Egypt
3.1 INTRODUCTION TO THE LAKE NASSER REVIEWAlthough Lake Nasser reservoir in Egypt is the main focus of this review, the first few sections include information on the Nile Basin’s geographic, physical, hydrological and chemical features and limnological characteristics, and discuss present and potential fishery production including aquaculture. The review also discusses the socio-economic setting of the use of the reservoir, identifies gaps in information and provides recommendations for future work. The inventory data contained in this report were collected from primary literature, working reports of the Fishery Management Center and the Lake Nasser Development Authority (LNDA), as well as from government agencies and local fishery cooperatives.2 The section on primary production is based on Teodoru, Wüest and Wehrli (2006).
2 Cross-checking information made available in an earlier draft was possible only to a limited extent, as many of the data and literature used were not available to the editors. The reader is referred to various authors of the references cited for further information.
Book 1.indb 39 12/29/11 1:16 PM

Review of tropical reservoirs and their fisheries40
3.2 PHYSICAL FEATURES3.2.1 Geographical locationThe Aswan High Dam Reservoir is the second-largest artificial lake in Africa (Plate 1). Construction of the High Dam at Aswan began in 1959 and was finally completed in 1970. Aswan is a settlement on the first cataract of the Nile River in Egypt. Two dams straddle the river at this point: the newer Aswan High Dam and the older Aswan Low Dam (Plate 2). The Aswan High Dam was built nearly 9 km south (i.e. upstream) of the old dam. The High Dam is a rock-fill dam made of granite and sand, with a vertical cut-off wall consisting of impermeable clay. It is 3 600 m long, 980 m wide at the base, 40 m wide at the crest and 111 m tall. It contains 43 million m3 of material. At maximum flow, 11 000 m3 of water can pass through the dam every second.
The reservoir behind the High Dam is about 500 km long and 35 km wide at its widest point, near the Tropic of Cancer. It covers a surface area of 5 237 km2 at 182 m water level and has a storage capacity of some 150–165 km3 of water (Latif, 1979; El-Gohary, 1989). The reservoir is partitioned into Lake Nasser in Egypt (about 300 km long) and Lake Nubia (196 km long) to the south in the Sudan. It is confined between latitudes 23°58’N at the High Dam and 20°27’N at the Dal Cataract in the Sudan and between longitudes 30°07’E and 33°15’E. The reservoir is usually divided into three regions: (i) the riverine southern part; (ii) the lacustrine northern part; and (iii) a region in between that has riverine conditions during the flood season and lacustrine characteristics in the remainder of the year (Latif, 1977).
The presence of numerous dendritic inlets, or side extensions of the reservoir, known as khors, is an important feature of Lake Nasser. These are also important fishing areas (Plate 1). There are 85 khors, 48 of which are located on the eastern side of the reservoir. Khors that have perimeters of more than 100 km at a water level of 180 m are: Khor Kalabsha, Wadi El-Allaqi, Kurkur, Korosko, Khor El-Birba (El-Ramla), Rahma, Dihmit, Shaturma, Wadi Abyad, Mariya, Masmas, Tushka and Khor Or (Latif, 1974a). The existence of the khors greatly increases the length of the shore, which is estimated at 8 700 km. The Tushka Canal links the reservoir to the Tushka Depression (Plates 2 and 3). Floodwaters entered the depression in 1998 for the first time and filled it in 2000, greatly expanding the original reservoir by 25–30 percent and adding new fishing grounds.
3.2.2 SedimentationLake Nasser is now steadily filling with about 100 million tonnes of sediment each year that formerly reached the Nile Delta flowing into the Mediterranean Sea. The current locus of deposition is far upstream of the High Dam and does not immediately threaten the operation of the power station. However, the reservoir will be filled within less than a millennium to the point that it may no longer be useful for storing irrigation water. Estimates suggest that almost half of the current value of irrigation water storage of Lake Nasser will have been lost within about 600 years. The sediment quantities are so huge that removal is not feasible with current technology. The largest sediment-dredging operations to maintain harbours, such as New York City harbour, are one or two orders of magnitude smaller than would be required to remove the annual influx of sediment into Lake Nasser. At present, there appears to be no plausible solution to this problem.
Book 1.indb 40 12/29/11 1:16 PM

Lake Nasser, Egypt 41
Notes: Top: dry season, note the presence of a floodplain, Botton: flood season. Source: Courtesy of Earth Sciences and Image Analysis Laboratory, NASA Johnson Space Center.
PLATE 1Numerous dendritic inlets known as khors greatly enhance the perimeter of
the reservoir and are an important feature of Lake Nasser
PLATE 2The photograph shows the two dams on the Nile at Aswan: Aswan High Dam,
a rock-fill dam completed in 1970, and Aswan Low Dam constructed in 1902
Source: Courtesy of Earth Sciences and Image Analysis Laboratory, NASA Johnson Space Center, image modified from ESC_large_ISS022_ISS022-E-92674.
Book 1.indb 41 12/29/11 1:16 PM

Review of tropical reservoirs and their fisheries42
870 km2
August 1996NM22-705-079
March 1997NM23-703-232
970 km2
256 km2
December 1998STS088-719-002
STS087-758-086 November 1997
PLATE 3Lake Nasser and New Valley development in the Tushka Depression. Photo STS087-758-086 is an oblique view of most of Lake Nasser in November 1997. Water from Lake Nasser eventually may
spill over into the lowlands to the west of the reservoir. Photos NM22-705-079 and NM23-703-232 compare water levels in the same section of central Lake Nasser in August 1996 and March 1997
Source: Courtesy of Earth Sciences and Image Analysis Laboratory, NASA Johnson Space Center.
3.2.3 Physical features of the reservoirLake Nasser has a gross capacity of 169 km3 of water. It reached its operating level of 175 m above mean sea level in 1975, storing 121.3 km3 of water, of which 31.6 km3 is dead storage. The depth of the reservoir varies from 112 m at Aswan High Dam to 45 m at Arkeen in the south, the deepest part is the ancient river bed. The mean depth of this central part gradually increases from 10 m at the southern end to 70 m in the north. Water flows at 100–150 cm/s at the southern, Nubian end of the reservoir, gradually reducing its speed within a few kilometres to 10–20 cm/s and, upon reaching Lake Nasser, 0–3 cm/s. After the rise in reservoir level around 1997, the New Valley Project was implemented, tapping Lake Nasser from the west and transporting water into a formerly barren wadi known as the Tushka Depression (not visible before June 1998). (Figure 21 shows reservoir area at minimum and maximum water levels).
Book 1.indb 42 12/29/11 1:16 PM

Lake Nasser, Egypt 43
16
17
18
19
4140 39
38
37
36
3534
33
3231
30
29
28
27
26
25
24
23
22
21
20
1
23
4
5
6
7
9
8
1514
13 12
1110
El-Madiq
Khor El RamlaDihmit (West)Khor KalabshaMirwawGarf HusseinKushtamnoEl-DakaKourtaSayalaEl-SobouiEl-MalkiThomasAfiaEnaeba MasmasKhor Tushka (West)ForkondiAbu Simbel (West)Sallano
1.2.3.4.5.6.7.8.9.10.11.12.13.14.15.16.17.18.19.
West20.21.22.23.24.25.26.27.28.29.30.31.32.33.34.35.36.37.38.39.40.41.
Khor ManamDihmit (East)AmberkabKhor RahmaKhor GhazalKhor Wadi AbyadKhor MariyaKhor El-AllaqiEl-MehrrakaKhor El-SabakhaKhor Wadi El-ArabKhor SingariKhor KoroskoAbu HandalEl-DiwanEl-DerrGenina Tushka (East)ArminaAbu Simbel (East)Khor OrKhor Adindan
East
LAKE NASSER
0 3015 Km
±
Notes: The light blue colour shows the extent of the reservoir in March 1988, the lowest water level on record was reached that year in July at 150.6 m above sea level. Dark blue represents the area flooded in November 1998 when the highest water level of 181.3 m (above sea level) was reached. Source: Created based on images provided by the Unites States Geological Survey (www.usgs.gov/).
FIGURE 21Extent of Lake Nasser at minimum and maximum flood levels, main fishing areas and khors
3.2.4 Bottom substrateThe bottom sediments of Lake Nasser are mainly silty clay and clayey silt, while the eastern and western sides are sandier. The highest percentage of mud was recorded in the main channel in the south near Tushka, Abu Simbel and Adindan (Fishar, 1995). Entz and Latif (1974) related the darkest-coloured sediments to relatively old deposits and the anoxic conditions during the summer stagnant period, which lasts longest near the High Dam and shortens in duration towards the south. The light colour, on the other hand, was attributed to freshly sedimented silt with little organic matter. Heavier and coarser parts of the suspended material are deposited in Lake Nubia, especially at its entrance, while the finer fractions settle in the Egyptian part of the reservoir (Higazy, Elewa and El-Rahman, 1986).
3.2.5 Meteorology and evaporationThe climate of the reservoir region is classified as subtropical, hot, very dry desert. From mid-October to April, evenings can be cold and night-time temperatures may drop to 8 °C. Day-time temperatures from April to June are similar to a warm summer in Europe. From June to September, the weather is dry and hot, with midday temperatures of 30–35 °C. The hottest months are August and September, when the temperature can surpass 40 °C. On the reservoir, the temperature is always a few degrees lower owing to the cooling effect of the large body of water (Figure 22) (El-Bakry, 1993; Abd Ellah, 1995, 2004a). Prevailing winds are northerly all year, strongest in autumn and winter. Recorded wind speeds vary between 2.7–4.7 m/s. The average wind speed in the southern part is 2 percent slower than in the north (El-Bakry, 1993).
The high humidity in the southern part of the reservoir is attributed to its exposure to northerly winds having passed over the water surface. Humidity over the reservoir increases to 50 percent during the cold season in December and decreases to 27 percent
Book 1.indb 43 12/29/11 1:16 PM

Review of tropical reservoirs and their fisheries44
Jan Feb Mar Apr May Jun Jul Aug Sep Oct Nov Dec0
10
20
30
40
50
Tem
pera
ture
(o C
)
Maximum airtemperature (oC)
Average airtemperature (oC)
Surface watertemperature (oC)
in July during the warm season (El-Bakry, 1993; Abd Ellah, 1995). Considerable amounts of water are lost to evaporation, which averages about 7.3 mm/day (2.7 m/year), removing 9.115 km3 of water per year, or 12 percent of the reservoir volume (Abd Ellah, 1995). The average rate of evaporation in the northern part of the reservoir is higher than in the south (Omer and El-Bakry, 1970; El-Shahawy, 1975; El-Bakry and Metwally, 1982; El-Bakry, 1993; Abd Ellah, 1995).
FIGURE 22Maximum and average air temperature over Lake Nasser and
average surface water temperature
3.2.6 Water temperature and thermal stratificationIn summer, the surface water temperature of Lake Nasser increases, often reaching 28–31 °C. During this period, differences in temperature between surface and bottom water can reach 18 °C (Latif, 1977). Thermal stratification is maximal, with the temperature difference between surface and near bottom water (Ts–Tb) ranging between 8.7 °C and 17.6 °C (average 11.9 °C). In autumn and winter, stratification breaks down as the air temperature drops and warmer floodwaters arrive from the highlands of Ethiopia (Elewa, 1987; El-Shahawy, 1975, Abd Ellah, 2004a). Ts–Tb ranges between 0.38–2.94 °C, with an average of 1.7 °C. In autumn, Ts–Tb values vary between 3.3 °C and 10.2 °C (average 7.3 °C) (Belal, 1992). Surface water temperature in the southern section of the reservoir is higher than in the northern section (El-Bakry, 1993). Seasonal averages ranged from 14.1 °C in February to 21.1 °C in August (Saad and Goma, 1994; Abd Ellah, 2004a).
3.2.7 TransparencyThe transparency of the Lake Nasser is affected by three important factors: (i) inflowing turbid water of the Nile River; (ii) development of phytoplankton; and (iii) vertical water movement caused by wind. The inflowing water of the Nile River is very turbid, especially during the flood period, and its rich load of suspended inorganic and organic matter is brownish-grey. On the arrival of the flood into the reservoir, the Secchi disc depth diminishes within a few hours from 70–140 cm to 20–30 cm or even to 5–10 cm. The border zone between turbid floodwater and old reservoir water is sometimes very sharp.
Book 1.indb 44 12/29/11 1:16 PM

Lake Nasser, Egypt 45
As the flood progresses, continuous sedimentation takes place within the reservoir, accompanied by gradually reduced turbidity. Ultimately, the visible borderline between floodwater and old reservoir water disappears. In areas where sedimentation is already completed, there is permanent high Secchi disc depth in deeper waters of about 300–600 cm. In these areas, the transparency of the epilimnion is controlled mainly by phytoplankton. From December to February, Secchi disc depth ranges between 200 and 400 cm. As soon as algal development starts, usually in March or April, the Secchi disc depth reduces to 80–130 cm, or even as low as 50–70 cm in dense algal blooms.
3.3 HYDROLOGICAL FEATURES3.3.1 Water balance in the basinThe Aswan natural inflow is an estimated figure for the inflow that would arrive at Aswan were no water to be extracted in the Sudan. According to the 1959 treaty between the Sudan and Egypt, the average Aswan natural flow is 84 km3/year, of which 18.5 km3 is allocated to the Sudan and 55.5 km3 to Egypt. Some 10 km3 is assumed to be lost to evaporation. Water released from Lake Nasser is Egypt’s annual share of the Nile River discharge as agreed by international conventions. Additional volume may be released for safety reasons, if the water level in the reservoir becomes very high (Latif, 1984a).
The White Nile River, flowing from Lake Victoria to its confluence with the Blue Nile River at Khartoum, is 3 700 km long (Figures 23 and 24). It supplies some 15 percent of the total volume entering Lake Nasser. Lake Victoria is the first natural lake in the Nile system. Rainfall on the lake is almost balanced by surface evaporation, and the outflow of 23 billion m3 from the lake is mostly from the rivers in its catchment area. Leaving Lake Victoria, the river is also known as the Victoria Nile River. It flows for approximately 500 km, through Lake Kyoga, until it reaches Lake Albert. From Lake Albert, the river is known as the Albert Nile River. It then flows into South Sudan, where it becomes known as the Bahr al Jabal. Throughout this stretch, the White Nile River is a wide, placid stream, often with a narrow fringe of swamps and it loses considerable amounts of water through evaporation and seepage. At the confluence at Lake No with the Bahr el Ghazal, 720 km long, the river becomes known as the Bahr al Abyad, or the White Nile River proper, from the clay suspended in its waters. After 970 km, it joins the Blue Nile River at Khartoum.
The White Nile River provides a regular supply of water to the Nile River throughout the year (Figure 25). More than 80 percent of the inflow comes from the White Nile River during April and May, when the mainstream is at its lowest level. The White Nile River obtains its water equally from the rainfall on the East African Plateau in the previous summer and drainage from southwestern Ethiopia through the Sobat River (consisting of the tributaries the Baro and Pibor Rivers), which enters the mainstream below As-Sudd. The annual flood of the Sobat River is responsible for variations in the level of the White Nile River. Rains swell its upper course at the beginning of April, inundating the 320 km of plains through which the river passes and delay the arrival of the rainwater at its lower reaches until November–December. Relatively small amounts of silt carried by the flood from the Sobat River reach the White Nile River.
Meanwhile, the Blue Nile River, or Bahr al Azraq, springs from Lake Tana in the Ethiopian highlands and flows 1 400–1 600 km to Khartoum, where it joins the White Nile River to form the Nile River (Figure 24). The Blue Nile River plays the major role in the floods of Egypt. In the Sudan, it meets two tributaries – the Ar-Rahad and the Ad-Dindar – both of which also originate in Ethiopia. The flood of the Blue Nile River causes the first floodwaters to reach the central part of the Sudan in May, reaching the maximum in August, after which the level falls again. The rise in water level at Khartoum averages more than 6 m. When the Blue Nile River is in flood, it holds back the water of the White Nile River, turning it into an extensive lake.
Book 1.indb 45 12/29/11 1:16 PM

Review of tropical reservoirs and their fisheries46
FIGURE 23
The Nile Basin, showing rivers, lakes and dams
Source: Courtesy Mr Pierre Dubeau.
FIGURE 24Elevation cross-section of the Nile Basin
Source: Adapted from the Nile River Awareness Kit, courtesy Hatfield Consultants Ltd.
Book 1.indb 46 12/29/11 1:16 PM

Lake Nasser, Egypt 47
The Atbara River joins the Nile River 300 km below Khartoum and is the last major tributary of the Nile River. It originates in Ethiopia north of Lake Tana and is 800 km long. The Atbara River draws its floodwater from rain on the northern part of the Ethiopian Plateau, but it shrinks to a series of pools in the dry season. The Nile River then reaches Lake Nasser, 270 km from the border between the Sudan and Egypt.
The peak of the flood does not enter Lake Nasser until late July or August, when the average daily inflow from the Nile River rises to 7.7 km3. Of this, 64 percent is from the Blue Nile River, 21 percent from the Atbara and Sobat Rivers and 15 percent from the White Nile River (Figure 26). The White Nile River provides a steady stream all year, hence its crucial importance. In early May, the inflow into Lake Nasser drops to a minimum and the total discharge of 0.5 km3/day comes mainly from the White Nile River. On average, about 85 percent of the water in Lake Nasser comes from the Ethiopian Plateau. The rest is contributed by the East African Plateau and its system of lakes.
Most water balance studies of the Nile River have analysed flows at Aswan. However, flow records over the past two decades have demonstrated the importance of the different rainfall regimes over the catchments of the Blue Nile and White Nile Rivers. Flows in the White Nile River between 1962 and 1985 have increased by 32 percent, or 8 km3, above the 1912–1961 mean. This occurred as flows in the Blue Nile River decreased by 9 km3 in the period 1965–1986, or 16 percent below their 1912–1964 mean. Although it could be inferred that the two rainfall regimes are negatively correlated, past records show that the relationship between annual inflow to Lake Victoria and recorded flows in the Blue Nile River at Khartoum is random (MacDonald and Partners, 1988). A main feature of the Nile flow series, apart from the high flow period at the end of the last century, is the steep fall in discharge since the mid-1960s. This fall is more pronounced and persistent than any previous low-flow period. An analysis of the long-term records of water levels measured with the Roda Island “Nilometer” indicates that during the past two centuries the variability of the annual flood far exceeded that of other periods since records began in AD 622.
FIGURE 25Average discharge of the main tributaries of the Nile entering Lake Nasser
Source: Drawn based on data available at www.grdc.sr.unh.edu/
Book 1.indb 47 12/29/11 1:16 PM

Review of tropical reservoirs and their fisheries48
110 -
100 -
90 -
80 -
70 -
60 -
50 -
40 -
30 -
20 -
10 -
0 -
Live
sto
rage
(km
3 )
1968
19
69
1970
19
71
1972
19
73
1974
19
75
1976
19
77
1978
19
79
1980
19
81
1982
19
83
1984
19
85
1986
19
87
1988
19
89
1990
19
91
1992
19
93
years
The Lake Nasser and Nubia reservoir is so huge that it permits storage of several years of average flow of the Nile (Figure 26), completely eliminating the natural cycle of annual flooding in Egypt. To a large extent, Egypt has been unscathed by droughts owing to large overyear storage in Lake Nasser. However, other factors have contributed to reducing the impact of drought. One of these is the exceptionally high water level in Lake Victoria, which has helped maintain higher flows in the White Nile River. The higher levels result from very heavy rainfall in Kenya and Uganda between 1961 and 1963 and above average rainfall since. The higher flows of the White Nile River have helped to compensate for lower discharges from the Blue Nile River, which have been more adversely affected by the Sahelian drought.
FIGURE 26Developments in live storage of Lake Nasser
Source: Evans, 1996.
3.3.2 Water levels: seasonal variability of the water massWater levels are distinguished in three categories (Figure 27):
required for operating the hydroelectric power station of the High Dam.
During the first 11 years after the damming of the river, the water level increased continuously, ranging from a minimum 105.44 m to 126.80 m, with extreme values in 1964. During the period 1975–1981, the maximum water level generally ranged between 165.6 and 175.7 m (Appendix 1, Table A1.1). From 1982 to 1987, the water level fell, reaching 158.5 m in 1987. After that, the water level rose again and reached 170.8 m in 1992 (Abd Ellah, 1995). Water levels are generally high in autumn and winter and lowest in summer.
Book 1.indb 48 12/29/11 1:16 PM

Lake Nasser, Egypt 49
1965 1970 1975 1980 1985 1990 1995 2000 2005
Year
110
120
130
140
150
160
170
180
190W
ater
leve
l (m
AM
SL)
MaximumMinimumLong-term mean
Dead water level
Life water level
Flood control water level
FIGURE 27Annual maximum and minimum water level in Lake Nasser, and the dead,
live and flood-control water levels
3.4 LIMNOLOGICAL CHARACTERISTICS AND PRIMARY PRODUCTION3.4.1 OxygenThe water column is completely oxygenated during winter and spring when dissolved oxygen concentrations are about 18–19 mg O2/litre, or 110–160 percent of saturation (Ali, 1992), caused by a high rate of photosynthesis and a lack of stratification (Entz, 1970). Oxygen concentration is higher in the main channel than in the khors (El-Darwish, 1977). During thermal stratification in the summer, the oxygen concentration of the reservoir’s upper layer ranges from 6.0 to 11.2 mg O2/litre with a maximum difference between the surface and bottom water of 4–7 mg O2/litre. The depth of the oxygenated epilimnion becomes greater southwards. The southern part,
18
20
22
24
26
28
30
32
3 45 100 135 200 250 292 308 348 355 358 359
Tem
pe
ratu
re (
°C)
Distance from High Dam (km)
surface
10m
20m
30m
40m
020406080
100120140160
3 45 100 135 200 250 292 308 348 355 358 359
Oxy
ge
n s
atu
rati
on
(%
)
Distance from High Dam (km)
surface
10m
20m
Source: Elewa, 1980.
FIGURE 28Water temperature and oxygen saturation of Lake Nasser and Lake Nubia in 1974
Book 1.indb 49 12/29/11 1:16 PM

Review of tropical reservoirs and their fisheries50
0102030405060708090
3 45 100 135 200 250 292 308 348 355 358 359
0102030405060708090
3 45 100 135 200 250 292 308 348 355 358 359
bottom
bottom
Oxygenated layer
Oxygenated layer
Unoxygenated layer
Unoxygenated layer
July 1974
July 1979
Distance from High Dam (km)
Distance from High Dam (km)
Dep
th (m
)D
epth
(m)
only 20 m deep, is completely oxygenated from the surface to the bottom (Figures 28and 29) (Elewa, 1980; Latif, 1984a; Nour El-Din, 1985). The breakdown of thermal and oxygen stratification starts in the south with the incoming floodwater and extends to the northern region with the cooling of the water.
3.4.2 Chemical oxygen demandChemical oxygen demand (COD) only fluctuates slightly by season and locality. Moreover, the reservoir water is characterized by low demand values because of a lack of organic matter. In the main channel of Lake Nasser, values fluctuate from 0.4–4.91 mg/litre and in the main khors from 0.1–7.8 mg/litre (Anon., 1996).
3.4.3 Specific conductivityIn general, conductivity in Lake Nasser does not reach high levels because of the continuous circulation of water (Abd Ellah, Belal and Maiyza, 2000, Abd Ellah, 2004b). To a certain extent, variations in conductivity in Lake Nasser follow the movement of masses of floodwater. The highest conductivity values have been recorded in summer, before the flood period, and the lowest at the end of the flood season, because of the low conductivity of water from the Blue Nile River (Entz, 1974; El-Shahawy, 1975; Elewa, 1980; Fishar, 1995). Measurements of electrical conductivity range between 158–300 μS/cm, with higher values near the bottom during floods and the summer (Nour El-Din, 1985; Abd Ellah, 2004b).
3.4.4 Acidity (pH) valuesThe pH of Lake Nasser water tends to be slightly alkaline (Table 12). The reservoir water is more alkaline in winter than in summer and autumn. The pH values increase from the southern to the northern part of the reservoir (Elewa and Latif, 1988; Mohamed, 2000; Abd Ellah, 2004b) and increase from the surface to the bottom (Elewa, 1976). The pH of the reservoir water lies within the optimal range for most freshwater fish species (Latif, 1981).
FIGURE 29Depth of oxygenated and unoxygenated layers along the main channel
of the Aswan High Dam Reservoir
Source: Elewa, 1980.
Book 1.indb 50 12/29/11 1:16 PM

Lake Nasser, Egypt 51
TABLE 12Ranges of pH values along the main channel of Lake Nasser, 1987–1992
Year 1987 1988 1989 1990 1991 1992
pH range 6.8–8.9 7.4–9.2 7.1–9.1 7.2–8.9 7.57–8.9 7.1–8.9
Sources: Abdel-Rahman and Goma, 1995a, 1995b, 1995c.
3.4.5 NitrogenData on carbon and nutrient cycles in the reservoir are quite inconsistent and cover only short temporal and spatial scales. Nutrient concentrations are reported to be higher in the southern part of the reservoir. Ahmed et al. (1989) found a general decrease in nitrate-nitrogen (NO3-N) concentration towards the dam when studying Lake Nasser between 1982 and 1994 (Figure 30). Exceptions to this trend were recorded during the summers of 1982/83, when high values of up to 400 μg NO3
- / litre were measured 100 km south of the dam. On the south–north transect, the average concentrations were 61, 136, 284 and 289 μg NO3
- / litre in spring, summer, autumn and winter of 1982, respectively, while 261 and 286 μg NO3
- / litre were recorded during the summer and winter of 1983, respectively. The vertical distribution at a sampling site 10 km in front of the dam showed low N concentrations in early spring and late summer. The lowest values of 2 μg N/litre and 8 μg N/litre were observed in September 1982 in the surface layers (Ahmed et al., 1989). The reduction in N concentrations in the trophogenic zone down to 8 m in August and September 1982 was attributed to relatively high rates of phytoplankton growth (Ahmed et al., 1989; Mohammed, Ahmed and El-Otify, 1989).
FIGURE 30Seasonal local variations in nitrate-nitrogen concentration in Lake Nasser from spring 1982 to
winter 1983/84
Source: Modified from Ahmed et al. 1989.
Mohamed, Ahmed and El-Otify (1989) found a close correlation between nitrate concentration and chlorophyll, and they suggested that low N concentrations limited
Book 1.indb 51 12/29/11 1:16 PM

Review of tropical reservoirs and their fisheries52
primary production for at least some algal genera or species. A drop in N concentrations to 20 μg N/litre, limiting the growth of algal species, was also reported in the Blue Nile River during the maximum growth period of the diatom Melosira (Rzoska and Talling, 1966). Measurements made in February 1970 in Lake Nasser close to the Aswan High Dam showed irregular variations in nitrate concentrations from the surface to the bottom, ranging from a minimum of 280 μg N/litre at 20 m in depth to a maximum of 950 μg N/litre at 10 m (Saad, 1980). Small amounts of nitrite were detected in Lake Nasser, with the vertical distribution fluctuating between a minimum of 20 μg N/litre at 50 m depth and a maximum of 42 μg NO2
- / litre at 30 m (Saad, 1980). Average concentrations over the entire water column were 670 μg N/litre for nitrate and 30 μg N/litre for nitrite.
The quality of data available only allows for the calculation of tentative scenarios of N uptake and release. If it is assumed that the decrease from 500 to about 60 μg N/litre observed during the winters of 1982/83 and 1983/84 in the south–north transect of Lake Nasser from 245 km to 10 km was due to N uptake, mainly by phytoplankton and macrophytes, then annual biological N consumption in Lake Nasser would be about 71 000 tonnes N/year. With a molar ratio of 106 C: 16 N, the equivalent annual primary production rate required to fix 71 000 tonnes N/year is 67 g C/m2. This rate is found to be much lower than a minimum of 270 g C/m2 that
characterizes eutrophic systems. Also, if the higher concentrations along the flow path of about 440 μg N/litre in the summer of 1982 and 220 μg N/litre a year later were due to the mineralization of the organic matter, an average mineralization flux of 50 000 tonnes N/year, or 70 percent of total N consumption, should be observed. In summary, the observed N dynamics indicate rather low primary production.
3.4.6 PhosphorusIn general, phosphate (P) concentrations are described as being variable in space and time, with higher concentrations of 120–160 μg P/litre reported in the southern part of the reservoir (Lake Nubia in the Sudan) and lower (30–160 μg P/litre) in the northern part of Lake Nasser (Rashid, 1995). The values are highest in August and November and lowest in February and increase with depth. In February 1970, measurements in Lake Nasser at a site close to the Aswan High Dam showed PO4 values fluctuating between a minimum of 10 μg P/litre at 50 m depth and a maximum of 90 μg P/litre at 10 m (Saad, 1980). Total P profiles also showed considerable irregular variations between 60 μg P/litre and 175 μg P/litre. In general, the values of reactive phosphate found in most Lake Nasser water samples were much lower than those of non-reactive phosphate, illustrating the mineral origin of total P. The high concentration of reactive phosphate was therefore attributed to the decomposition of organic matter and the release of absorbed phosphate. The average concentration of the reactive phosphate of 35 μg P/litre was about 2.5 times lower than total P (Kinawy, 1974).
3.4.7 Dissolved phosphorus balanceThe literature offers no data on nutrient inflow into the reservoir. The P concentration can be roughly estimated from a mass balance calculation. Considering that, for an annual estimation, the reservoir is a conservative system where inputs must be balanced by net sedimentation and the output for a annual primary production rate of 370 g C/m2 or an equivalent P flux of almost 9 g P/m2, P uptake would be 54 × 109 g P/year. If it is assumed that 20 percent of the P uptake or 10.8 × 10⁹ g P/year
is deposited in the reservoir sediment, and half is retained and the other half is released back into the water column, then net sedimentary P retention is 5.4 × 10⁹ g P/year.
Prior to the construction of the Aswan High Dam, the Nile River flood delivered to the Mediterranean coast about 7.2–11.2 × 10³ tonnes/year of biologically available P (3.2 × 10³ tonnes in dissolved form and 4–8 × 10³ tonnes as sediment) and 6.7 × 10³ tonnes of inorganic N (Nixon, 2003). Low discharges after dam construction,
Book 1.indb 52 12/29/11 1:16 PM

Lake Nasser, Egypt 53
resulting from high nutrient retention in an extremely productive reservoir behind the dam, were estimated to be 0.03 × 10³ tonnes P/year and 0.2 × 10³ tonnes N/year. Therefore, up to 3.2 × 10³ tonnes P/year can be considered to represent the net P retention in the sediment of the reservoir. This value is comparable with retention of 5.4 × 10⁹ g P/year estimated above.
The outflow P concentration can be calculated from the average value reported for the small lake downstream from the Aswan High Dam of 39 μg P/litre. If the annual water discharge at the Aswan High Dam is 84 km3/year, the output load would be 3.3 × 10⁹ g P/year. However, the output load can be actually much higher. The mass balance can be approximated with the equation: Pinput – Pnet retention – Poutput = 0. If all parameters are considered in the equation, the balance indicates an input load of 6.5 × 10⁹ g P/year. For an inflow of 84 km3/year, the incoming P concentration would be ~77 μg P/litre (Figure 31).
FIGURE 31Phosphorus mass balance for Lakes Nasser and Nubia
Source: Teodoru, Wüest and Wehrli, 2006.
3.4.8 Organic matter and silicate The upper 40 m of the water column are characterized by a general concentration of silicon dioxide (SiO2) of 11.5 mg per litre, increasing to 13 mg SiO2/litre at 50 m and decreasing to a minimum of 10.2 mg SiO2/litre at 60 m. The values at 70 and 80 m were 12.3 and 11.5 mg SiO2/litre, respectively. The vertical distribution of silicate was thought to be influenced by the physicochemical conditions of the reservoir rather than by diatom consumption (Saad, 1980). Dissolved organic matter content in Lake Nasser was found to increase from a minimum of 1.56 mg/litre at the surface to a maximum of 10.6 mg/litre at 30 m depth, attributed mainly to the decomposition of the phytoplankton in the water column. In general, a constant concentration of about 8 mg/litre is measured below 40 m. It should be noted, however, that the irregular trend in the vertical distribution of nutrients in February was due to the absence of clear thermal stratification as a result of cooling-induced mixing of reservoir water during winter.
3.4.9 Phytoplankton abundance, chlorophyll aThe phytoplankton community is composed of cyanophytes (blue-green algae, 12 spp.), diatoms (14 spp.), chlorophytes (green algae, 24 spp.) and dinoflagellates (3 spp.) (Habib, 2000). Blue-green algae dominated the community as a percentage of the total number of algae in samples during spring and summer. Diatoms dominated the community only once in winter. Noticeable peaks of green algae have been recorded in spring and summer at various places in the reservoir. There were very few dinoflagellates except for some peaks in late winter and spring. Various studies on the spatial distribution of phytoplankton found that cyanophytes generally dominate in the northern part of the reservoir, ranging from 22–96 percent in different surveys, with
Book 1.indb 53 12/29/11 1:16 PM

Review of tropical reservoirs and their fisheries54
peaks in autumn and lows in winter, while in the southern part of the reservoir there are periods when diatoms dominate (Latif, 1984b; Gaber, 1982; Abdel-Monem, 1995; Habib, 2000). Chlorophytes are concentrated in the northern parts of the reservoir, but generally constitute less than 21 percent of the community total composition, with a minimum of 2 percent (Figure 32).
Phytoplankton recorded in Lake Nasser in the period 1981–1993 included 135 species belonging to five classes: 54 spp. of chlorophytes, 34 spp. of cyanophytes, 33 spp. of bacilariophytes, 13 spp. of dinophytes and one species of euglenophytes. Comparison with the results obtained by Abdel-Monem (1995) and those of previous investigators leads to the conclusion that, of the 135 recorded species, 51 were new invaders and 52 species have completely disappeared since the reservoir was created. In addition, a further 32 species were recorded by various investigators during the same period.
The amount of chlorophyll a in water is an index of phytoplankton productivity and has been used to estimate primary productivity. The southern region of Lake Nasser has higher mean annual values of chlorophyll a than the northern region. Fead (1980) recorded the highest values of chlorophyll a at Abu Simbel directly preceding the annual flood.
Seasonal changes in chlorophyll a are observed, with chlorophyll concentrations homogeneous over the depth of the reservoir during the winter from November to February, coinciding with low water temperatures (Figure 33).
FIGURE 32Seasonal variation in the major phytoplankton groups at various sites in Lake Nasser
Source: Habib, 2000.
Chlorophyll a concentrations are stratified from April through September, coinciding with a clear thermocline observed from March to October. Thus, the highest production was obtained at 2 m depth and gradually decreased with depth. Low values of chlorophyll a were recorded in deep layers up to 30 m as light faded. Observed maximum concentrations of chlorophyll a were 24 mg/m3 at the surface in January 1984 at Korsoko and 27.2 mg/m3 at 10 m in January 1993 (Latif, 1974a; Fead, 1980; Habib and Aruga, 1988; Mohamed, 1993a). The distribution of chlorophyll a at 13 stations inside and outside Khor El-Ramla of the High Dam Lake in Egypt, monitored from 1982 to 1985, generally followed the same mixing patterns as the
Book 1.indb 54 12/29/11 1:16 PM

Lake Nasser, Egypt 55
main reservoir, but maximum concentrations were much higher at 57.6 mg/m3 at 2 m in November 1984 and an extreme value of 106.8 mg/m3 at 4 m in April 1984 at one station (Habib, Ioriya and Aruga, 1987). Chlorophyll a concentrations and Secchi disc depth are inversely correlated (Figure 34); transparency in Lake Nasser is determined by inputs of allochthonous silts of riverine origin and autochthonous suspended matter. Chlorophyll a concentrations in the main channel have not changed over time.
FIGURE 33Seasonal variation in mean chlorophyll a concentration in the euphotic zone
at various sites in Lake Nasser
Source: Habib and Aruga, 1988.
In sluggish areas of Lake Nasser, cyanophytes can cause floating crusts and sumps, where plants die quickly and disintegrate in the intense sunlight. This causes depletion of oxygen below the concentration required by fish and other aquatic animals. Mohamed (1993b) recorded the occurrence of algal blooms in Lake Nasser eight times during six years from 1987 to 1992 and pointed out that they occurred only in very limited areas of the southern part of the reservoir. Cyanophytes dominated in all samples of blooms, with Microcystis aeruginosa as the dominant species.
Previously, M. aeruginosa water blooms occurred annually for several months before the flood period, but now may occur intermittently all year round (Mohamed and Loriya, 1998). Recently, algal blooms have been recorded in the central part of the reservoir. Occasionally, they have occurred at Korosko in the northern area.
3.4.10 Primary production Primary productivity can be calculated using information on phytoplankton photosynthesis and respiration and the diurnal and seasonal changes in light conditions (Aruga and Monsi, 1963) (Figure 35). Large geomorphological and hydrodynamic differences in the extent of thermal stratification and the depth of the photic zone were considered the main reasons for different ecosystem characteristics between the main channel of Lake Nasser and the khors (Abu-Zeid, 1987). Primary production was estimated at various stations over the years in Lake Nasser (Figure 36). Although it is not always clear from the literature whether the measurements were made at the same stations and depths and using the same methodology, the ranges show the same order of magnitude over the years: the lowest hourly values recorded were 2.4 mg C/m3 and the highest 247.5 mg C/m3.
Book 1.indb 55 12/29/11 1:16 PM

Review of tropical reservoirs and their fisheries56
FIGURE 34Relationship between chlorophyll a concentration and Secchi disc depth
Source: Mohamed, 2000.
FIGURE 35Seasonal variation in gross primary production, net primary production
and phytoplankton respiration at various sites in Lake Nasser
Note: Closed circles = gross primary production; open circles = net primary production; and squares = phytoplankton respiration.
In general, daily rates of biological production in the reservoir were estimated as high as 8–15 g C/m2 from diurnal changes in open water measurements in some side bays (Abu-Zeid, 1987). Similarly high daily rates of gross primary production of 5.23–13.2 g C/m2 were measured in March 1970, while higher rates of 10.7–16.4 g C/m2 were recorded in 1979 when the biologically active zone of the reservoir extended down to about 4 m (Latif, 1984a). However, doubts may be raised regarding the validity of some of these measurements, as a daily average of 10 g C/m2, or 3 650 g C/m2 in a year, is extremely high, beyond the highest values measured in eutrophic lakes (Downing, Plante and Lalonde, 1990). The measurements may represent primary production in some of the khors.
Book 1.indb 56 12/29/11 1:16 PM

Lake Nasser, Egypt 57
Some assumptions need to be made to estimate a realistic rate of primary production for the entire reservoir. The primary production corresponding to an average P concentration of 50 μg P/litre typically varies between 150 and 250 g C/m2 per year. It can be considered that the reservoir consists of 5 percent khors (300 km2) where production reaches high annual rates up to 3 600 g C/m2, and the remaining 95 percent is the main channel (5 700 km2), with an average annual production of 200 g C/m2. According to this scenario, a weighted average annual primary production of 370 g C/m2 can be calculated. As this figure should be understood as highly uncertain, calculating annual primary production for Lake Nasser to vary between 200 and 400 g C/m2 may be a better estimate.
FIGURE 36
Ranges in primary productivity in Lake Nasser
Sources: Samaan, 1971; Abdel-Monem, 1995; Anon., 1996; SECSF, 1996; Habib, 2000.
Abdel-Monem (1995) contends that the gradual eutrophication of Lake Nasser may be a result of continuous sedimentation of organic matter that accumulates annually with floodwater rich in nutrients. This would be expressed as a gradual increase in primary productivity, but the data show no strong evidence to that effect (Figure 37). Abdel-Monem (1995) also suggested that primary productivity in the reservoir was characterized by its high value in the epilimnetic water (3 m) compared with hypolimnion water (15 m), except in summer when the situation was reversed. This is mainly owing to the faster sinking rate of phytoplankton cells as water becomes less dense at high summer temperatures.
0
10
20
30
40
50
60
70
80
90
1970 1980 1990 2000 2010
No
. org
an
ism
s x
10
3/m
3
FIGURE 37Variations of zooplankton numbers recorded in Lake Nasser, 1970–2005
Book 1.indb 57 12/29/11 1:16 PM

Review of tropical reservoirs and their fisheries58
3.4.11 ZooplanktonIn the period 1987–88, the zooplankton community was composed in order of abundance of: copepods (3 spp.), cladocerans (9 spp.) and rotifers (17 spp.). The relative proportion of copepods decreases towards the south from about 90 percent to 60 percent, replaced by cladocerans and to a lesser extent rotifers. The seasonal changes in zooplankton coincide with those of the phytoplankton (as chlorophyll a) in Lake Nasser (Habib, 1997) and are concurrent with transparency. Zooplankton of the main channel of Lake Nasser and its khors were studied in the early 1970s by many investigators. Samaan (1971) reported 15 species (9 Crustacea and 6 Rotifera); Rzoska (1976) recorded 13 species (mainly Crustacea); and Samaan and Gaber (1976) recorded 15 species (9 Crustacea and 6 Rotifera). Studies conducted since 1971 have shown that the standing stock of zooplankton increased during the first 10–15 years after damming and has since stabilized (Figure 37) (Samaan, 1971; Gaber, 1981; Zaghloul, 1985; Habib, 2000; El-Shabrawy and Dumont, 2003; Mageed and Heikal, 2005).
3.4.12 Bottom faunaFifty-nine species of benthic invertebrates have been recorded from Lake Nasser by various investigators. These belong to five phyla: Cnidaria (Coelenterata) (one class, one sp.), Bryozoa (one class, one sp.), Arthropoda (two classes, 33 spp.), Annelida (two classes, 5 spp.) and Mollusca (two classes, 19 spp.), in addition to larvae, pupae, nymphs and adult insects. The major components of the benthic fauna in Lake Nasser were the oligochaetes, while those of Lake Nubia were mainly molluscs (Latif, 1979). Iskaros (1993) recorded in Khor Kalabsha 27 species in the three phyla (by relative abundance): Arthropoda (85.1 percent), Mollusca (11.1 percent) and Annelida (3.8 percent).
3.4.13 MacrophytesMajor changes have occurred in the aquatic macrophytes in Lake Nasser following the completion of the Aswan High Dam (Table 13). In the 1960s, 1970s and 1980s, 12 euhydrophyte species were recorded in Lake Nasser waters, of which seven appear to be new to the region (Springuel and Murphy, 1990). Changes in aquatic macrophytes were related to dynamic changes in Lake Nasser hydrology: (i) from lotic to lentic waters; and (ii) the continuously changing physicochemical and soil characteristics of the reservoir (Ali, 2000). Recent changes in submerged macrophyte communities in Lake Nasser appear to be related to physical factors (e.g. water-level fluctuations and human activities).
TABLE 13Long-term changes in freshwater macrophyte species in Lake Nasser
Species 1962–1964 1966–1967 1978–1986 1988–1990 1993–1994
Alsima gramineum +
Damasonium alisma var. copactum +
Potamogeton perfoliatus +
P. crispus + + +
P. pectinatus + + +
Zannichellia palustris + + + +
Vallisneria spiralis + + +
P. trichoides +
P. schweinfurthii1 + + +
Najas horrida2 + + +
N. marina subsp. armata + + +
Nitella hyaline3 +
Myriophyllum spicatum +
Ceratophyllum demersum +
1 This species was misidentified as Potamogeton nodosus.2 This species was misidentified as Najas pectinatis (Ali, 1987).3 This species was misidentified as Chara sp. in Springuel and Murphy (1990).Sources: Boulos, 1967; El-Hadidi, 1968; El-Hadidi and Ghabbour, 1968; Abdalla and Sa’ad, 1972; Ghabbour, 1972; Ahti, Hamet-Ahti and Pettersson, 1973; Ali, 1987, 1992; Springuel and Murphy, 1990; and authors’ records.
Book 1.indb 58 12/29/11 1:16 PM

Lake Nasser, Egypt 59
3.5 THE LAKE NASSER FISHERIES3.5.1 Fish species compositionThe known Lake Nasser fish community consists of 52 species in 15 families (Table 14).
TABLE 14Main fish families (15) and species (52) in Lake Nasser
Family Species
Cichlidae Tilapia zillii, Oreochromis aureus, Sarotherodon galilaeus, Oreochromis niloticus
Latidae Lates niloticus
Alestidae Alestes nurse, Alestes baremose, Alestes dentex, Hydrocynus forskalii, Hydrocynus lineatus, Hydrocynus brevis
Cyprinidae Barbus bynni, Labeo niloticus, Labeo coubie, Labeo horie, Labeo forskalii, Chelaethiops bibie, Barilius niloticus, Barilius loati, Discognathus vinciguerrae, Barbus werneri, Barbus prince, Barbus neglectus Barbus anema
Bagridae
Claroteidae
Bagrus bayad, Bagrus docmac,
Chrysichthys auratus, Chryischthys ruepelli, Clarotes laticeps, Auchenoglanis biscutatus, Auchenoglanis occidentalis
Clariidae Heterobranchus bidorsalis, Clarias gariepinus
Schilbeidae Schilbe mystus, Schilbe uranoscopus
Mochokidae Synodontis schall, Synodontis serratus, Synodontis batensoda, Synodontis membranaceous, Mochocus niloticus, Chiloglanis niloticus
Mormyridae Mormyrops anguilloides, Mormyrus kannume, Mormyrus caschive, Petrocephalus bane, Hyperopisus bebe, Marcusenius isidori, Gnathonemnus cyprinoides
Citharinidae Distichodontidae
Citharinus citharus, Citharinus latus,
Distichodus niloticus
Tetraodontidae Tetraodon lineatus
Protopteridae Protopterus aethiopicus
Polypteridae Polypterus bichir
Gymnarchidae Gymnarchus niloticus
Malapteruridae Malapterurus electricus
3.5.2 Developments in catch and fishing effortThe multispecies fishery of Lake Nasser is dominated by two tilapiine species: Sarotherodon galilaeus and Oreochromis niloticus. Since 2000, Tilapia zillii and Oreochromis aureus have appeared in the catch as well. The former contributes about 2 percent of the total catch. Following the two tilapiines in abundance, Lates niloticus, Labeo spp., Bagrus spp. and Synodontis spp. are marketed as fresh fish. Hydrocynus forskahlii, Alestes spp. and Schilbe mystus are salted (Latif, 1974a, 1974b and 1977). Sarotherodon galilaeus, Lates niloticus, Hydrocynus forskahlii and Mormyrus spp. are more dominant in the northern third of the reservoir than elsewhere in the reservoir. Oreochromis niloticus is, on the contrary, much more abundant in the middle third. Alestes baremoze and A. dentex are concentrated mainly in the southern third, where cyprinids are more abundant (Latif, 1979).
Catch is collected by about 200 carrier boats from various areas around the reservoir.3 All of the collected fish, fresh and salted, are landed at three official landing sites – the fishing harbours of Aswan, Garf Hussein and Abu Simbel – where the fish are sorted. Catches levels are determined by total enumeration. With the gradual increase in the area of the reservoir since the early years of impoundment, fish landings from Lake Nasser increased from 751 tonnes in 1966 to a peak of 34 200 tonnes in 1981.
3 The following analysis is based on official landings statistics, which are suspected to be significantly underestimated by about 50 percent. Fish smuggling started in about 1995 or 1996, leading to an underestimate of about 30 percent, reaching about 90 percent in 2000. After 14 June of 2001, when free marketing and pricing were applied for the first time, smuggling decreased to an estimated 25 percent. Around 2003, smuggling increased once again, associated with the division of the fishery resources of the reservoir between investment companies and fishery cooperative associations (O. Anwar, personal communication, 2009).
Book 1.indb 59 12/29/11 1:16 PM

Review of tropical reservoirs and their fisheries60
1965 1970 1975 1980 1985 1990 1995 20000
10 000
20 000
30 000
40 000La
ndin
gs (
tonn
es)
Nile perch
Bagrus
Labeo
"Salted"H. forskalii, Alestes, Schilbe
r2 = 0.47, p<0.001 Tilapia
Since then, recorded landings have shown large fluctuations, but a decreasing trend of approximately 700 tonnes/year to 12 500 tonnes in 2005 (Figure 38). The decrease in recorded fish output from Lake Nasser is at least partly related to the imposition by the authorities of a fixed price for fresh fish, which spurred the development of a large black market for fresh fish. As a result, fish is smuggled outside the regular fish-marketing system and falls outside the official landing statistics. The sharp drop in the estimated fish landings in about 2000 is attributed mainly to this black market. Moreover, consumption by fishers, avoidance of taxation, poaching and discards owing to spoilage or catch below minimum legal size mean that a large proportion of the catch was not recorded as landings. Khalifa, Agaypi and Adam (2000) estimated that recorded harbour landings were about 50 percent of the total catch. There is, however, no exact information on changes in this proportion over time as a result of changed policies or market arrangements.
CatchThe reported annual fish catches from Lake Nasser from 1966 to 2004 are shown in Figure 38 (the complete dataset is provided in Table A1.2 and the composition by species in Table A1.3).
Fresh fish – tilapia (bolti) and Nile perch (samoos) – are recorded separately. Minor species, which have about the same value when marketed fresh, tend to be combined under others. Accordingly, the nominal catch statistics do not reflect the composition of the landings accurately (Khalifa, Agaypi and Adam, 2000). Tilapias have always formed the bulk of the catch, comprising as much as 81 percent of the catch in 2002, followed by Nile perch (11 percent) and salted fish (8 percent). The proportion of cyprinids and catfishes decreased rapidly in the first decade after impoundment but has increased in recent years. At the start of the fishery, 50 percent of the fish was sold salted. This proportion gradually decreased to 4 percent, but recently the proportion of salted fish rose again to about 50 percent (Figure 39) (Bishai, Abdel Malek and Khalil, 2000).
Source: LNDA, Aswan.
FIGURE 38Officially recorded annual fish catch in Lake Nasser, 1966–2004
Book 1.indb 60 12/29/11 1:16 PM

Lake Nasser, Egypt 61
1965 1970 1975 1980 1985 1990 1995 20000
20
40
60
80
100
Pro
port
ion
of la
ndin
gs (
%)
Nile perch
Bagrus
Labeo
"Salted"H. forskalii, Alestes, Schilbe
Tilapia
FIGURE 39Proportion by main categories of officially recorded annual fish catch in Lake Nasser,
1966–2004
Source: LNDA, Aswan.
Development and trends in landings of different categories of speciesAn analysis of trends in landings is delicate if, as estimated, about 50 percent of the total landings are at present unrecorded. For the observed quantities, the trends are as follows. Oreochromis niloticus and Sarotherodon galilaeus landings increased from 278 tonnes in 1966 to a maximum of 30 529 tonnes in 1981. Subsequently, the tilapiine catch decreased to about 13 000 tonnes in 1989. This decrease was thought to be mainly due to the decline in the water level during the drought from 1984 to 1988, which shortened the shoreline, increased its slope and thereby shrank the fishing grounds. However, tilapiine landings increased again to 29 389 tonnes in 1991, but subsequently fell to only 8 281 tonnes in 2000 (Figure 40). This does not follow the expected trend of water levels and fish catches rising in tandem. Once again, part of this unexpected result could be attributed to the increased selling of tilapia on the black market.
Lates niloticus data show that the recorded catch increased from 6 tonnes in 1966 to 563 tonnes in 1977, after which the catch fluctuated greatly between approximately 200 and 900 tonnes. The large landings of 2001 to 2003 are associated with the free pricing policy from 14 June 2001 onwards. The Bagrus spp. catch increased from 25 tonnes in 1966 to 258 tonnes in 1972, after which the catch of this species decreased to zero from 1989 onwards. The catch of Labeo species increased rapidly from 133 tonnes in 1966 to a maximum of 933 tonnes in 1969. Then the catch dropped to low levels in 1975 and 1976, after which landings fluctuated between 4 and 444 tonnes. No records were obtained between 1992 and 1996. In 2000, a remarkable but unexplained surge in landings to 870 tonnes was recorded. The annual catch of salted fish, consisting mainly of Hydrocynus forskalii, increased gradually from 313 tonnes in 1966 to 6 297 tonnes in 1977, followed by a sharp decrease to 961 tonnes in 1986. From 1987 to 1994, the catch was about 1 500 tonnes annually. After 1995, the catch increased to between 3 500 and 4 500 tonnes annually.
Book 1.indb 61 12/29/11 1:16 PM

Review of tropical reservoirs and their fisheries62
0
10 000
20 000
30 000
40 000
130
140
150
160
170
180
mas
l
Tilapia spp.
500
1 000
1 500
2 000
Ton
nes
180
140
150
160
170
180Lates niloticus
100
200
300
400
130
140
150
160
170
180Bagrus spp.
1965 1970 1975 1980 1985 1990 1995 2000 20050
500
1 000
1 500
130
140
150
160
170
Labeo spp.
1965 1970 1975 1980 1985 1990 1995 2000 20050
2 000
4 000
6 000
8 000
130
140
150
160
170
180Salted
Ton
nes
Ton
nes
Ton
nes
Ton
nes
2 000
mas
l
mas
lm
asl
mas
l
FIGURE 40Annual recorded catch by species category from Lake Nasser, 1966–2004
Note: Superimposed on graphs the mean annual water level in metres above sea level since 1965.Source: LNDA, Aswan.
Fishing effortAccording to the LNDA, at Aswan in 2002, 4 103 fishers operated 2 703 registered fishing boats on Lake Nasser.4 Although, the number of boats has increased in the past decade, the number of fishers reached its maximum in 1975, decreased rapidly to about 3 000 in 1981 and subsequently increased slowly. The number of fishers per boat decreased from about three in 1980 to a little more than one since 2000 (Figure 41), which is surprising considering the labour needed to operate the vessels typically in use on Lake Nasser. It suggests that either the number of inactive boats is not recorded or the definition of fishers and assistants has changed over time. The boats are made of wood or steel and some are motorized.
Five fishing methods are commonly used in Lake Nasser fisheries: trammel net, bottom gillnet, floating gillnet, beach seine net and longline (Entz and Latif, 1974; Khalifa, Agaypi and Adam, 2000). In the northern part of the reservoir, fishing is mostly carried out using trammel nets, while in the southern part fishing with top-set gillnets predominates.
(1) Top-set gillnets (sakarota). The stretched mesh size varies from 3 to 7 cm. The net length varies from 20 to 50 m and floating depth from 1.5 to 2 m below the surface. A number of nets, typically 20–40, are strung together to form one long net. The net is used for fishing raya (Alestes spp.) and kalb el samak (Hydrocynus spp.). This type of fishing is done every night and the catch is gutted and salted.
4 Other data used are 2 662 boats and 3 906 fishers, according to a survey in 2002 (O. Anwar, personal communication).
Book 1.indb 62 12/29/11 1:16 PM

Lake Nasser, Egypt 63
1965 1970 1975 1980 1985 1990 1995 2000 20050
1 000
2 000
3 000
4 000
5 000
6 000
7 000
8 000
Boa
ts o
r fis
hers
(no
.)
0
1
2
3
4
5
6
7
8
9
10
No.
fish
ers/
boat
No. boats No. fishers No. fishers/boat
(2) Midwater or bottom-set gillnets (kobok). The stretched mesh size of this type of net ranges from 10 to 20 cm. Nets are 10–20 m in length but can be as short as 4 m. Up to 20 nets are joined together and the nets may operate at a depth of up to 10 m. They are usually set in khors but sometimes in open waters. The fish caught by these nets are usually Lates niloticus (samoos), Oreochromis niloticus and Sarotherodon galilaeus (bolti), Labeo spp. (lebeis), Bagrus spp. (bayad), Barbus bynni (benny) and Clarias spp. (karmout). Most of these fish are sold fresh. The nets are raised every night or every second night.
(3) Trammel nets (duk). The net length ranges from 10 to 20 m and the operating depth is about 1.5 m in shallow areas and about 3 m in deeper areas. The two outer panels of the net have a stretched mesh size of 20–40 cm with an inner panel of stretched mesh size 8–12 cm. The trammel net is piled up at the rear of the boat and easily handled by a single fisher, while another crew member rows the boat. The net is cast and set off against the rocky faces of the shoreline a few metres away from the shore. The boat then moves in between the shore and the net. One of the fishers hits the surface of the water using a pole (so-called beat fishing) and drums on the deck with his feet, driving fish into the net. Landings consist mainly of bolti (tilapiine species), samoos (Lates niloticus), bayad (Bagrus bayad) and karmout (Clarias spp.). This type of fishing starts after dark and continues until just before dawn. It is confined to shallow water with a depth ranging from 1 to 2.5 m. The trammel net fishery is the main supplier of fresh fish.
(4) Beach seines (gorrafa). This net is used for daytime fishing and lands mainly tilapiine species (bolti).
(5) Longlines. Longline fishing is little practised, but is more common in the southern than in the northern part of the reservoir. It is used in deep waters to catch samoos and bayad with bolti and lebeis (Labeo spp.) fry and fingerlings as bait.
No information is available on changes in numbers of gear, gear use, mesh sizes or effort allocation.
FIGURE 41Annual variation in number of boats and fishers in Lake Nasser
and numbers of fishers per boat
Source: Fishery Management Center, LNDA, Aswan.
Book 1.indb 63 12/29/11 1:16 PM

Review of tropical reservoirs and their fisheries64
1965 1970 1975 1980 1985 1990 1995 2000 20050
2
4
6
8
10
Land
ings
per
fish
er (
tonn
es)
1965 1970 1975 1980 1985 1990 1995 2000 20050
5
10
15
20
25
Land
ings
per
boa
t (to
nnes
)
Nile perch
Bagrus
Labeo
Salted
Tilapia
FIGURE 42Developments in officially recorded annual landings per boat and per fisher in Lake Nasser
Reported catch rates decreased between 1979 and 2004 from about 20 tonnes per boat to 5 tonnes (a decrease of 0.75 tonnes/year) and from about 8 to 4 tonnes per fisher (a decrease of 0.2 tonnes/year) (Figure 42). The annual catch rate of 4 tonnes/fisher is close to the annual average catch of 3 tonnes that is observed across African freshwater fisheries (Kolding et al., 2008; Jul-Larsen et al., 2003). Examination of Lake Nasser fish production and output efficiency has shown that fish production in 2001–04 indicates an annual average yield of about 15.3 kg per feddan (1 feddan = 4 200 m2), or 36.4 kg/ha. This is 29–43 percent of the potential annual yield of 84–125 kg/ha, given an annual primary production of 200–400 g C/m2 (see above). This is an extremely low level of catch compared with lakes and reservoirs elsewhere in the world (see discussion in Chapter 5). It is also low compared with theoretical values calculated from primary production. According to Downing, Plante and Lalonde (1990), the relationship log10 (FP) = 0.6 + 0.575log10 (PP), where FP is fish production and PP is primary production, indicates that primary production levels in the reservoir would translate to an annual fish production of 84–125 kg/ha. On the other hand, if one assumes that the reported landings represent only 50 percent of the total landings, the production of 73 kg/ha is comparable with low-productivity reservoirs in China (79 kg/ha), Thailand (74 kg/ha) and Indonesia (64 kg/ha). The mean annual production from a range of 19 African lakes and reservoirs is 316 kg/ha (Kolding and van Zwieten, 2006).
Effect of water level, reservoir area and shoreline length on fish productionTotal tilapia landings increased to 10 582 tonnes from 1966 to 1976, concomitant with the filling of the reservoir and the increase in the number of fishing boats. In the next five years to 1981, landings increased to 30 529 tonnes, the mean water level was kept at about 174 m and fishing effort was constant at 1 600 fishing boats. Thus, the water level was relatively high and considered suitable for tilapia reproduction. The high production could also result from the general fact that reservoirs have high production rates shortly after inundation (Kolding and van Zwieten, 2006). The catch decreased by about 60 percent to 13 000 tonnes from 1982 to 1989 and this period included an extended drought that saw mean water levels fall from 171 m to 160 m. Landings of tilapia increased again to about 29 000 tonnes with rising water levels in 1991. Since then, the water level has remained more or less stable at about 174 m, but in 2004 reported tilapia landings fell to 6 300 tonnes, suggesting underreporting.
Based on these observations, and as the tilapiines O. niloticus and S. galilaeus (contributing about 85 percent of the catch) inhabit shallow inshore areas that are profoundly affected by reservoir levels, a relationship can be expected between the total annual fish production and reservoir water level, particularly considering the large interannual fluctuations of 19 m between 1971 and 1996 and seasonal fluctuations of approximately 8 m. Water level, reservoir surface area and/or shoreline length can
Book 1.indb 64 12/29/11 1:16 PM

Lake Nasser, Egypt 65
0201001-
Annual change in mean water level (m)
-20 000
-10 000
0
10 000
20 000
Ann
ual c
hang
e in
tila
pia
land
ings
2 y
ears
late
r (k
g)
y = 703.2x-330.5r2 = 0.19p<0.05
be used as proxies for the level of inundation of essential fish habitat and reservoir productivity. For this review, only mean water levels are available. As the effect of water-level changes operates simultaneously with changes in fishing effort, it is important to attempt to separate the two through, for example, multivariate statistical methods. To do so, catch rates by species (or total average annual catch rates) would need to be independently estimated from landings of individual fishers. However, this information is not available. Therefore, the following analysis uses the annual change in total landings and the annual change in average catch per fisher and per boat of tilapiines, and relates these – with appropriate time lags to account for the response time of recruitment into the fishery – to annual changes in mean water level. Alternatively, annual absolute fluctuations in water level (i.e. maximum minus previous minimum water level) could be used.
Trends in both water levels and total annual catch (kilograms) or catch rates (kilograms per fisher or per boat) can form spurious correlations if there are long-term trends in both variables. Therefore, trends are removed from the time series by differencing, so increases or decreases around the trends (anomalies) in both the water level and the catch time series can be related. A significant relation that explained about 19 percent of the variation in anomalies was found between changes in water level and changes in total catch of tilapias with a lag of two years, meaning that the amplitude of annual change in water level appears to affect significantly the catch of tilapia two years later, as has also been described for Lake Kariba by Karenge and Kolding (1995). No significant relationships were found between annual change in water level and annual changes in catch rate, expressed either as kilograms per boat or as kilograms per fisher, at lags of between one and four years. An important caveat needs to be reiterated in relation to this analysis: the illegal unreported catches are assumed to be constant at about 50 percent, but more likely developed gradually from around the time that prices started to become fixed on the reservoir (see the section below on socio-economic issues and footnote 3). Despite the bias, the expected relation between change in water level and change in tilapia catches is seen (Figure 43), but the extremely low proportion of explained variation (r2 = 0.19) points to the high uncertainty of the observation.
FIGURE 43Relationship between detrended mean water level and
detrended officially reported tilapia landings two years later
Note: The regression shows a significant positive relation between the annual change in mean water level and the annual change in landings of tilapia two years later (filled circles). Data on tilapia landings during the filling phase of the reservoir, 1965–1975 (open circles), and during a period of particularly poor reporting of landings, 1995–2001 (crosses), were excluded from the analysis.
Book 1.indb 65 12/29/11 1:16 PM

Review of tropical reservoirs and their fisheries66
2 000
3 000
4 000
5 000
6 000
7 000
8 000
9 000
10 000
0
5 000
10 000
15 000
20 000
25 000
30 000
35 000
40 000
1964 1967 1970 1973 1976 1979 1982 1985 1988 1991 1994
Sh
ore
len
tgh
(km
)
Tota
l lan
din
gs
(to
nn
es)
Total fish produc�on
Calculated shore length
Littoral areas provide tilapia with suitable breeding and nursery grounds. The length of the shoreline and its slope are important factors for the development of periphyton and littoral fauna, the main food of tilapia species. Accordingly, it is expected that the total fish catch, particularly of tilapiines, should increase greatly with a longer shoreline. The mean length of the shoreline of Lake Nasser between 1966 and 1996 is calculated using the mean water level in different years. As a result of the continuous increase in the mean water level between 1991 and 1999, the shoreline length of Lake Nasser extended from 2 539 km in 1966 to 6 438 km in 1978 and from 4 702 km in 1991 to 7 482 km in 1999. Yamaguchi et al. (1996) found that total fish production in Lake Nasser is positively affected by a longer shoreline or negatively affected by a shorter shoreline with a lag of three years. Their analysis by visual inspection (Figure 44) is not convincing, as there is no increase in shoreline length to account for the pronounced second peak in fish production.
FIGURE 44Relationship between total fish production and calculated mean length
of shoreline of Lake Nasser
Source: Yamaguchi et al., 1996.
3.5.3 Fishery biologySince the 1970s, Lake Nasser fishery research has focused largely on general studies of fish biology. Stock assessments have rarely been conducted and results are considered too unreliable for management decisions. Many of the studies carried out on Lake Nasser have had limited impact on fishery policy and development. In fact, complementary to short-term studies, long-term monitoring programmes should be carried out on Lake Nasser. They should include, among other things, a good system of recording catch and effort in order to obtain time series of spatially defined catch rates and fishing effort, which would support short- and long-term decisions on fishery management and evaluation of the measures taken.
Food and feeding habits In the early stages of the fishery, the fish landed were predominantly high-trophic-level piscivores and benthivores, but later changed to low-trophic-level planktivores (Tables 15 and 16) (Mekkawy, 1998; Bishai, Abdel Malek and Khalil, 2000). A fishery based on herbivorous fish is more productive than one based mainly on predators. It is not clear from this analysis whether the changes are caused by greater abundance of cichlid species or by a change in targeted species and/or consumers’ preferences.
Book 1.indb 66 12/29/11 1:16 PM

Lake Nasser, Egypt 67
TABLE 15Average catch of fish with different feeding habits in three successive periods
Years
Feeding habit
Periphyton-plankton feeders1 Carnivorous, zooplankton and insect feeders2 Omnivorous3
(% by weight)
1966–1972 39.92 42.04 18.04
1973–1978 66.27 32.96 0.77
1979–1996 88.27 10.76 0.97
1 Sarotherodon galilaeus and Oreochromis niloticus.2 Hydrocynus forskahlii, Lates niloticus, Bagrus bajad, B. docmak, Heterobranchus spp., Alestes dentex and A. baremoze.3 Labeo spp., Barbus spp., synodontids, schilbeids and mormyrids.Source: Bishai, Abdel Malek and Khalil, 2000.
TABLE 16Food categories of major fish species in Lake Nasser
Phytoplanktivores Zooplanktivores Benthivores Piscivores
Peri-phyton Diatoms
FilamentousAlgae
Zooplankton Molluscs
Nematodes/annelids
Insect larvae Shrimp Crab Fish
Lates niloticus x x x x
Bagrus docmac x x x x
Hydrocynus forskahlii x x x
Synodontis spp. x x x
Schilbe mystus x x x x
Mormyridae x x
Labeo spp. x x x
Alestes nurse, A. baremoze x
Oreochromis niloticus, Sarotherodon galilaeus x
Chrysichthys auratus, Chrysichthys rueppelli x x x x x
Sources: Latif and Khallaf, 1996; Entz and Latif, 1974; Tharwat et al., 1994; Latif, 1979.
Spawning period and closed seasonFishing in Lake Nasser is prohibited from 15 April to 15 May, probably based on an analysis of maturity stages of the main species in the catch, O. niloticus and S. galilaeus (Figure 45 broken lines). Although both species reproduce year round, their main spawning period is during the first half of the year. Based on these observations, Mekkawy (1998) even suggested that a closed fishing period should be extended to six months, from January to June. However, this suggestion is impractical and without support from any observation or analysis showing that there is a recruitment problem with the two species. No evaluation has been carried out on how effectively the current closed period of one month protects the reproductive capacity of the two species.
Life history parameters and stock assessment resultsFish stock assessment provides advice on the optimal levels at which fish species should be exploited. The limiting reference point, maximum sustainable yield (MSY), is often given as the level of effort that should not be exceeded in a healthy fishery. Another indicator that is often used is the exploitation rate (E) (E = F/Z where F = the fishing mortality rate and Z = total mortality rate), E ≤ 0.5 is often considered the exploitation level needed for the maintenance of a healthy fishery. Estimates of MSY and E were made by Khalifa, Agaypi and Adam (2000) for Oreochromis niloticus and Sarotherodon galilaeus. They concluded that the stocks of both were overexploited, as E was about 0.8 for the two species (Table 17). The long-term effects of reducing fishing mortality by 10 percent would increase the catch of O. niloticus by about 65 percent and that of S. galilaeus by 7 percent.
Book 1.indb 67 12/29/11 1:16 PM

Review of tropical reservoirs and their fisheries68
TAB
LE 1
7Li
fe h
isto
ry p
aram
eter
s o
f fi
ve e
con
om
ical
ly im
po
rtan
t fi
sh s
pec
ies
of
Lake
Nas
ser
Spec
ies
Ref
eren
ceL ∞ (cm
)
Kt o
(yea
rs)
ZM
FT c
/Lc
(yea
rs/c
m)
L c (cm
)
E =
F/Z
Phi p
rim
eR
efer
ence
Phi p
rim
eR
esili
ence
Pop
ula
tio
n
do
ub
ling
tim
e (y
ears
)
Vu
lner
abili
ty t
o e
xtin
ctio
n
L. n
ilotic
us1
180
0.06
90.
790.
350.
170.
180.
7418
0.5
3.35
33.
76M
ediu
m5.
4Ve
ry h
igh
(67.
8)
T. z
illi
126
.49
0.32
52.
346
1.37
0.79
0.58
1.47
17.6
0.4
2.36
32.
74M
ediu
m1.
6Lo
w,
mod
erat
e (3
0.61
)
A. d
ente
x1
40.0
220.
322
1.20
50.
80.
70.
11.
3520
.30.
12.
713
2.68
Med
ium
2.68
Mod
erat
e(36
.63)
O. n
ilotic
us
O. n
ilotic
us
1 2
50.3
9
54.7
3
0.16
0.27
2.56
9
-0.7
45
0.73
1.21
0.42
0.24
0.31
0.97
0.9 na
21.4
5 19
0.4
0.8
2.61
2.91
3 3
3.06
2.66
Med
ium
Med
ium
1.6
1.6
Mod
erat
e (3
5.42
)
Low
, m
oder
ate
(30.
24)
S. g
alila
eus
S. g
alila
eus
1 2
42.7
5
37.8
0.12
0.29
4
4.17
-1.1
87
0.83
1.97
0.36
0.34
0.47
1.63
0.8 na
19 17
0.6
0.8
2.34
2.62
No
te: R
efer
ence
s: 1
: Ad
am, 2
004;
2: K
hal
ifa,
Ag
ayp
i, A
dam
200
0; 3
: ww
w.F
ish
bas
e.o
rgL ∞
= a
sym
pto
tic
bo
dy
len
gth
; K =
vo
n B
erta
lan
ffy'
s g
row
th c
oef
fici
ent;
t0
= a
ge
at w
hic
h le
ng
th is
th
eore
tica
lly z
ero
; E =
exp
loit
atio
n r
ate;
Z =
to
tal m
ort
alit
y =
F (
fish
ing
mo
rtal
ity)
+ M
(n
atu
ral m
ort
alit
y);
Tc =
ag
e at
fir
st c
aptu
re; L
c =
len
gth
at
firs
t ca
ptu
re; V
uln
erab
ility
to
ext
inct
ion
is a
fig
ure
bet
wee
n 1
an
d 1
00 a
s d
efin
ed b
y C
heu
ng
, Pit
cher
, an
d P
auly
, 200
5; n
a =
no
t av
aila
ble
.
Book 1.indb 68 12/29/11 1:16 PM

Lake Nasser, Egypt 69
TAB
LE 1
8Es
tim
ates
of
max
imu
m s
ust
ain
able
yie
ld (
MSY
) an
d F
MSY
of
vari
ou
s sp
ecie
s o
f La
ke N
asse
r1
Au
tho
rA
dam
(2
004)
Pitc
her
(1
998)
Mek
kaw
y (1
998)
Mek
kaw
y (1
998)
Mek
kaw
y (1
998)
Mek
kaw
y (1
998)
Mek
kaw
y (1
998)
Mek
kaw
y (1
998)
Mek
kaw
y (1
998)
Mek
kaw
y (1
998)
Mek
kaw
y (1
998)
Mek
kaw
y (1
998)
Mek
kaw
y (1
998)
Mek
kaw
y (1
998)
Mek
kaw
y 19
98
Mo
del
use
dTh
om
pso
n
and
Bel
lSc
hae
ffer
Sch
aeff
erH
yper
bo
licSc
hae
ffer
Sch
aeff
erG
rah
am?
Sch
aeff
erG
ener
aliz
ed s
tock
pro
du
ctio
n m
od
elTh
om
pso
n
and
Bel
l
Asy
mp
toti
cG
om
per
tzLo
gis
tic
Year
s o
f d
ata
use
d?
??
?19
88–1
994
?19
73–1
992
1981
–198
9?
?19
66–1
992
1966
–199
219
66–1
992
?
MSY
MSY
MSY
F MSY
MSY
MSY
MSY
MSY
F MSY
MSY
MSY
MSY
MSY
MSY
MSY
Late
s ni
lotic
us2
217.
21
490
1 06
1
Ale
stes
den
tex
4 38
4.6
O. n
ilotic
us21
589
.332
342
9 03
726
863
25 3
3715
614
15 3
4830
128
S. g
alila
eus
24 2
09.7
23 5
939
037
27 2
4432
970
16 5
4213
658
17 6
92
Hyd
rocy
nus
spp.
3 36
42
636
Labe
o sp
.64
164
1
Bagr
us s
p.10
999
1
Cla
rias
sp.
107
1 00
9
Tota
l tila
piin
e53
755
54 1
0758
307
32 1
5629
006
47 8
20
Oth
ers
3 73
8
Tota
l52
400
.880
000
61 6
4659
742
55 6
1761
645
57 4
931
313
57 8
6962
360
Hig
hest
cat
ch r
ecor
ded
34 2
0634
206
34 2
0634
206
34 2
0634
206
34 2
0634
206
30 5
2930
529
30 5
2930
529
30 5
29
Tota
l cat
ch (
year
of
publ
icat
ion)
12 4
3519
203
19 2
0319
203
19 2
0319
203
19 2
0319
203
14 1
9514
195
14 1
9514
195
14 1
95
Tota
l cat
ch x
224
870
38 4
0638
406
38 4
0638
406
38 4
0638
406
38 4
0628
390
28 3
9028
390
28 3
9028
390
% M
SY47
4862
6469
6267
6652
4988
9859
Hig
hest
eff
ort
reco
rded
2 98
22
982
Tota
l eff
ort
(yea
r of
pu
blic
atio
n)2
945
2 94
5
% F
MSY
3322
4
1 Th
e p
rop
ort
ion
of
catc
h o
ver
MSY
is c
alcu
late
d u
sin
g t
he
tota
l lan
din
gs
esti
mat
e in
th
e ye
ar o
f p
ub
licat
ion
of
the
MSY
est
imat
e m
ult
iplie
d b
y tw
o t
o t
ake
into
acc
ou
nt
un
reco
rded
cat
ches
.
Book 1.indb 69 12/29/11 1:16 PM

Review of tropical reservoirs and their fisheries70
FIGURE 45Relationship between female gonad index of Oreochromis niloticus (top) and Sarotherodon
galilaeus (bottom) and monthly tilapia yield of Lake Nasser in different years
Notes: Gonad index 1 based on Latif and Rashid (1972), gonad index 2 based on Abdel-Azim (1974), Ahmad (1994) and Adam (1994).Source: Redrawn from Mekkawy (1998).
However, not all assessments of the state of various species in the reservoir confirm this conclusion. In all these cases, exploitation rates were at or below 0.6 for any species examined (Table 17). With the assumption that only 50 percent of the landings were recorded, catches also appeared to be consistently at between 40 and 60 percent of MSY, with the exception of two analyses that indicated catches were at 88 percent or 98 percent of MSY (Tables 17 and 18). These analyses seem to have been carried out with the classic steady-state formulations of the biomass-dynamic and yield-per-recruit models. It is known that biomass-dynamic models for MSY largely follow observed catches with continuously increasing effort series, while yield-per-recruit models do not give an actual estimate of MSY. It is recommended that time series formulations of the biomass-dynamic models be used, which take into account annual changes in relative biomass. Moreover, none of the analyses took into account the impacts of fluctuating reservoir levels or long-term changes in productivity resulting from continuing sediment loading and associated potential changes in carrying capacity.
3.6 STOCKING AND INTRODUCTIONSTilapiine species do not migrate far from their original habitat. Hence, the fingerlings of Oreochromis niloticus released into khors grow to marketable size after 1.5 years within
Book 1.indb 70 12/29/11 1:16 PM

Lake Nasser, Egypt 71
these areas. Although stocking khors is considered an effective method to increase fish stocks, no evaluations have been made to assess how effectively this method increases yields (see Béné et al., 2009). Oreochromis niloticus seed production is carried out by the Fishery Management Center in Aswan (Abdel-Shaheed and Shenouda, 1993).
The possibility of increasing fish production in the reservoir by introducing new commercial fish species was examined in relation to the insufficiently utilized open-water, pelagic area. Introductions of the freshwater herring (Limnothrissa miodon) from Lake Tanganyika, silver carp (Hypophthalmichthys molitrix), bighead carp (Hypophthalmichthys nobilis) and Labeo spp. were suggested in 1983, as these were thought to be suitable for the open-water area in the reservoir. However, it was feared that freshwater herring fry might inhabit the coastal zone and compete with O. niloticus for zooplankton and space, although there was no evidence of this in the literature. Only silver carp was further investigated for introduction. Silver carp was originally transported from Hungary in 1982 to the Fuwwa Hatchery in the Nile Delta. Artificial propagation for acclimatization and mass production of fingerlings was carried out at the Fishery Management Center in Aswan. However, no stocking of the reservoir was done, although silver carp was reared in net cages without artificial feeding (Abdel Shaheed and Shenouda, 1993).
Experiments on the induced spawning and rearing of fry of Labeo spp., Barbus bynni and Nile perch (Lates niloticus) were also carried out by the Fishery Management Center in Aswan to give priority to local species for artificial propagation. Restocking Barbus bynni by artificial propagation and release of the reared fingerlings into the reservoir and khors was thought to be essential to increase fish resources. Studies on the timing of artificial propagation and techniques for mass producing fingerlings have been undertaken (Abdel-Shaheed, Shenouda and Ahmed, 1993). Attempts to induce artificial spawning in Labeo niloticus and Labeo coubie were undertaken but were unsuccessful (Abdel-Shaheed, 1996; Shenouda and Naguib, 1993). Further studies on artificial spawning are needed for the three species. Introductions of grey mullet (Mugil cephalus) were attempted in 1982 and 1986 in Lake Nasser’s Khor El-Ramla. The growth performance was high, but the experiment was not completed. A third trial in 1988 included Liza ramada. Some fish escaped the trial ponds and were caught by commercial fishers, but no viable populations seem to have become established.
3.7 SOCIO-ECONOMIC ASPECTS OF LAKE NASSER FISHERIESThe Lake Nasser fisheries include all sectors of fish output, such as management, production, processing, marketing and manufacturing. The production system includes several thousand fish producers and a few thousand fishing boats with gear. Similarly, the marketing system includes hundreds of fish marketing intermediaries or agencies that own cold stores, trucks and processing plants. Coordinators and managers include governmental institutions and cooperative associations.
3.7.1 Fishing exploitation rights in the reservoir zonesLake Nasser is divided into five zones with exploitation rights granted to specific companies and cooperatives (Table 19). Since 2002, the LNDA has redivided the fishery resources of the reservoir among five cooperative associations, as the “group of fish cooperatives sector”, and six investment companies, as the “group of fishing investors” (the Egyptian Fish Marketing Company, HU Group Company, Misr-Kuwait Company, Misr-Aswan Company for Fishing and Fish Processing, Investor Association and Small Manufacturing and Grand Lake Company). The fish cooperative sector was given fishing rights to exploit lakeshore fish in an area occupying about 60 percent of the total reservoir surface, while the investment companies received fishing rights to exploit the rest of the reservoir, of which 34 percent is deep water fisheries and the remaining 6 percent enclosures (Béné, Bandi and Durville, 2008).
Book 1.indb 71 12/29/11 1:16 PM

Review of tropical reservoirs and their fisheries72
The cooperatives allocate to members their offshore fisheries and production on a timed basis to manage the exploitation rights as an economic unit (one of the terms of cooperative membership is to own fishing boats and gears).
TABLE 19Lake Nasser zones with exploitation rights granted to companies and cooperatives
Zone Location Shoreline (km) Exploitation rights
1 High Dam to Dahmeet 187 Misr-Aswan Company for Fishing and Fish Processing
2 Dahmeet to Mirwaw 300 Aswan Sons Cooperative
3 Mirwaw to Ebreem 800 Cooperative Association of Aswan Fishers (known as the mother cooperative)
4 Ebreem to the Egyptian border 370 Nubian Cooperative Association for Fishing
5 Khor Or on the east side of the reservoir to the Egyptian border 66 El Takamol Cooperative for Fishing
3.7.2 Fish marketingThe Aswan harbour engages in three marketing activities: concentration, dispersion and equalization.
Concentration encompasses the daily collection of fish harvested by fishers spread along the shores of the reservoir, channelling them to Aswan, Garf Hussein and Abu Simbel harbours or to the fish wholesale market. Fish output from Lake Nasser is transported to markets through carrier boats with capacities ranging from 2 to 20 tonnes and refrigerated trucks. Preservation starts on the reservoir by cooling with crushed ice in insulated boxes of 10–30 kg capacity. The boxes are stored in refrigerating stores belonging to two companies: Misr-Aswan Company for Fishing and Fish Processing and the Egyptian Company for Fish Marketing. Large tilapia and Nile perch are filleted, while small ones are cooled and transported to markets in Egypt. One hundred and ninety-five fish carriers operated on Lake Nasser in 2007, of which 6 belonged to the Misr-Aswan Company for Fishing and Fish Processing (zone 1), 29 to Aswan Sons Cooperative (zone 2), 117 to the Mother Cooperative (zone 3), 41 to the Nubian Cooperative (zone 4), and 2 to the El Takamol Cooperative (zone 5).
Dispersion refers to taking fish from the wholesale market and distributing it through retailers to consumers. The Egyptian Fish Marketing Company and Misr-Aswan Company for Fishing and Fish Processing are the most important fish wholesale agencies for Aswan fish. They own processing plants, cold stores, trucks and even several retail shops in Cairo and Alexandria. In addition to providing marketing services, they produce tilapia and Nile perch fillets.
Balancing or equalizing refers to adjusting fish flows in response to changing fish supply and demand. The wholesale fish market at either Aswan, Garf Hussein or Abu Simbel harbours or Cairo’s El-Obour fish market receive fluctuating supplies from Lake Nasser fish producers and release them as required to meet the changing needs and demands of fish consumers. In the period 1979–2009, this system was heavily influenced by government intervention, as ministerial decrees from the Ministry of Supply determined Lake Nasser fish prices both for producers and consumers, while all other Egyptian lakes remained without any government control and their fish was sold at free-market prices. Lake Nasser prices were always lower than free-market prices. They remained constant for periods of 1–4 years, and over the 23 years prices changed only 11 times (Appendix 1, Table A1.4).
3.7.3 Potential of Aswan fish marketingLake Nasser fisheries provide a living for about 7 000 fishers, 4 000 of whom fish illegally without a licence. However, the reservoir is situated in an isolated region of southern Egypt with very long distances to the nearest population centre at Aswan.
Book 1.indb 72 12/29/11 1:16 PM

Lake Nasser, Egypt 73
In addition, the extremely hot summers and the hazards to life and health from scorpions and snakes hinder effective marketing. The Aswan fish market may expand by developing alternative fish products such as whole fish, dressed fish, fish steaks, fish fillets, fried fish, grilled fish and different forms of salted and smoked fish. Introducing these alternatives could improve the economic sustainability of fishery resources and increase rural employment and income.
3.7.4 Fishing labour force on Lake NasserLake Nasser fishers can be classified into two groups: owners of fishing boats and gear, and hired labour. Owners of fishing boats and gear are the membership of fishers’ cooperative associations. They have the resource rights in all the fishing areas of the reservoir as a result of the cooperative terms of membership. Hired labour describes most of the community and includes the poorest fishers. Fishing is paid through monetary wages or more frequently with a percentage of the catch in a sharecropping system (Finegold et al., 2011). Most hired labourers come from such governorates as Qena, Suhag, Fayum and Aswan and cities around other water bodies, such as Quaron, Brollos and Edko. They work and live away from their families at the fishing bases for six to seven months a year.
3.7.5 Fisheries regulations and developmentThe LNDA is responsible for managing and developing reservoir fisheries. Several procedures and regulations are applied to maximize fish production and utilize high reservoir productivity:
Oreochromis niloticus L. spawning, has been established to maintain the stocks.
immature fish weighing less than 500 g.
experimenting with aquaculture techniques and fish farming, including the propagation of native species. The potential for introducing new species into the reservoir for net cage culture has been tested. Fish farming in khors and enclosures has been carried out to increase fish production, but the results are inconclusive. Fishmeal is produced from fish carcasses and fish waste and used in animal feeds. A fish feed factory has been constructed to provide feed to LNDA hatcheries.
centres at Aswan, Garf Hussein and Abu Simbel for fish carrier boats. Carrier vessels have been designed and constructed to transport fish and to keep it fresh.
3.7.6 Impediments to developing Lake Nasser fisheriesImpediments to developing Lake Nasser fisheries exist regarding coordination and management, fish production and fish marketing.
Impediments in coordination and management The LNDA has paid considerable attention to establishing the necessary fisheries infrastructure, including: three fishing harbours at Aswan, Abu Simbel and Garf Hussein; three fish hatcheries at Sahary, Garf Hussein and Abu Simbel; two ice factories and freezers at Aswan and Abu Simbel; an ice factory and a fish feed factory at Sahary; a fish research station at Abu Simbel; a floating dock for repairing fishing boats; a fish nursery and fish ponds; and a fisheries research vessel. The most
Book 1.indb 73 12/29/11 1:16 PM

Review of tropical reservoirs and their fisheries74
important impediments to the functioning of the authority are as follows:
aspects of the reservoir, creating issues of coherency in decision-making.
main sector in the reservoir economy, is heterogeneous, including members with no experience in fish production.
length of its shoreline.
Impediments in fish production The most significant barriers affecting fish production in the reservoir are:
Impediments in fish marketing The most significant impediments in fresh fish marketing are:
Table A1.5);
of several members affiliated with different administrative offices, causing bureaucratic complexity;
All these impediments are related to the fixed-price system.The problem of fish smuggled from Lake Nasser outside the official fish-
marketing system was particularly bad during the final years of the fish price-fixing policy and fishery conservation laws (Béné, Bandi and Durville, 2008). According to ministerial decree No. 621, issued in 1981 by the Ministry of Supply, fish producers at Lake Nasser were obliged to sell their fish at fixed prices. From 1979 to 2001, these prices were always lower than the free-market prices for similar fish produced from other lakes. After the liberalization of Lake Nasser fish prices, they jumped by 49 percent, from EGP260 per tonne in 2001 to about EGP387.5 per tonne in 2002, and have continued to rise. Faced with these “adjustments” and fearing some impacts on the consumers, the government reintroduced a fixed-price mechanism until 2009.
The fisheries of Lake Nasser can exceed their current value provided that an environmentally and socially sustainable system is developed. The productivity of Lake Nasser could be increased by reducing management and exploitation impediments and by increasing the value of existing production by improving processing and marketing. Moreover, the idea has yet to be explored that Lake Nasser has substantial potential for fishery enhancement using a range of techniques, such as cove culture. New warm-water aquaculture techniques such as producing bait fish in ponds, aquarium fish production and crayfish production could also be explored.
3.8 FUTURE DEVELOPMENT OF LAKE NASSER FISHERIES3.8.1 Development aimsImportant national economic development aims in Egypt are to:
families;
Book 1.indb 74 12/29/11 1:16 PM

Lake Nasser, Egypt 75
reservoir.Reservoir fisheries are thought to present a relatively low-risk investment, and
investors are encouraged to initiate programmes to develop Lake Nasser fisheries. The development process is directed to four main elements: (i) increasing income through increased fish production; (ii) increasing employment; (iii) developing fishers’ capacity, including the skills to use modern fishing gear and technologies; and (iv) modifying laws and regulations to remove obstacles facing fishery development projects on the reservoir. All these development priorities assume that Lake Nasser is underexploited. Whether this is the case can be verified by studying trends in the size of fish caught or mesh sizes used, according to the processes of the fishing-down theory (Welcomme, 1999; see also Chapter 4 on Lake Volta). The fact that the best correlations between catch and reservoir level are with flood conditions two years previously (Figure 45) leads to the conclusion that the reservoir is not very heavily fished, as many overexploited inland fisheries harvest fish less than one year old. In those cases, the best correlations are with the same hydrological year. Similarly, the actual fish production of the reservoir, assuming 50 percent underreporting, is still near or below the potential productivity based on estimates of primary production.
3.8.2 Promoting fisheries developmentAny development promoting fisheries in the reservoir should take economic, social, environmental and managerial activities into account. These are mentioned below without elaboration or prioritization. It should be noted that many of these activities can conflict with one another or may not even be feasible (e.g. removing annual silt deposits on the reservoir bottom).
Economic activities include:
khors;
improve the use of Abu Simbel harbour;
Nasser fish;
of production elements.Social activities include:
reservoir;
societies;
fisheries.Environmental activities include:
floating hotels;
Book 1.indb 75 12/29/11 1:16 PM
Review of tropical reservoirs and their fisheries76
in agriculture.Managerial activities include:
coordination between the various entities involved in the management of the reservoir;
fishing;
fisheries;
fishing methods that violate these laws and regulations;
the Nile islands and El-Qanater El-Khairia Barrage.
3.8.3 Development initiativesIn recent years, the LNDA has undertaken several initiatives to support and enhance the development of reservoir fisheries, such as setting up three hatcheries with total annual capacity of 50 million fry. Other hatcheries are planned to raise capacity to about 150 million fry. Several breeding ponds have been constructed to aid in stocking the reservoir. However, no studies have investigated the need for stocking or the actual enhancement effect of the present stocking regime.
In addition, three fishing ports have been established in the northern, middle and southern reaches of the reservoir and other fish-landing centres are planned; a fish-feed production plant has been established; and roads and marketing facilities are being set up. Last, the authority conducts occasional skills training for fishers.
3.8.4 Identified information gaps and recommendationsWhile this desk review is comprehensive in its descriptions of various ecosystems, it is limited in its analysis of the current status of the stocks. Based on the modelling information summarized in Section 3.5.3 (Table 18) and other indicators (such as the relationship between catch and water level, and actual fishery productivity and potential productivity based on primary production), it would seem that the problems with regard to exploitation levels are relatively minor and that the reservoir is apparently only moderately exploited. However, as the information available does not allow determination of what data were used in the stock assessment models, this conclusion remains tentative.
It is also important to recognize that the modelling results cannot explain the observed decline in landings and catch rates other than by postulating underreporting. The only information available on the amount of underreported catch suggests that it is of the same magnitude as the reported catches over the whole period examined. If this is indeed the case, then the conclusion should be that catch and catch rates are declining, which is contrary to the conclusions of the models and to the other information available. There is also the possibility that the level of underreporting has changed with, for example, changed policies regarding price setting, and consequently that the accuracy of the landings estimates has also changed over time. It is most likely that underreporting and smuggling developed gradually over time, as smuggling requires a logistical network that needs careful planning. Hence, the major gap in information seems to be the lack of consensus on the actual status of the fishery: Is it indeed moderately exploited, as the models suggest? Or is it overexploited, as the landing data suggest? Is there room for expansion?
Book 1.indb 76 12/29/11 1:16 PM

Lake Nasser, Egypt 77
Furthermore, the relative impacts of different drivers and pressures on the state of the stocks are unclear. What is the role of fluctuating and changing climate as indicated by water levels and shore inundation? How do continued sedimentation, the expansion of the reservoir and changes in the relative contribution of flows from the major tributaries of the Nile affect productivity? The lack of such information implies that fishery-management regulations and development initiatives cannot be evaluated with regard to their effective impacts. Actual problems related to stock status and the impacts of fishing cannot be fully addressed, quantified goals cannot be set and measures cannot be precisely evaluated.
This review, together with earlier studies of Lake Nasser carried out in the 1980s and 1990s (such as those of El-Zarka [1985] and Craig [2000]), clearly indicate the need to focus future work on directed monitoring efforts and specific problem-oriented studies, as follows:
perhaps with a sampling system at landing sites instead of total enumeration at major ports.
simple drivers as seasonal and annual variation in water levels and associated parameters, such as reservoir area and area of inundation. Then review more complex relations regarding, e.g. sedimentation rates and the influence of flows of different tributaries on primary productivity changes, etc.
catch and the catch per unit effort (CPUE) for the different regions of the reservoir.
water areas, to obtain biomass estimates and review the need, methodology and costs of possible new surveys against the value of information obtained. Establish indicators.
to determine the current potential of reservoir fisheries and the sustainable exploitation of its resources in relation to fishing effort, including the efficiency of the various fishing gears and methods, as well as natural drivers.
reproduction) of important fish species in the reservoir and carry out research to obtain such parameters for species other than tilapia to use in model assessments and as indicators for monitoring.
and dominant fish species to carry out ecosystem modelling assessments.
basin under different meteorological and water-level conditions to obtain insights into impacts on fish stocks.
of fish of high economic value.
including biological, social, economic and policy indicators and reference levels.
currently applied in the reservoir, including fishing laws and regulations, and consider the need for their critical review and updating.
Book 1.indb 77 12/29/11 1:16 PM

Review of tropical reservoirs and their fisheries78
REFERENCESAbdalla, M.S. & Sa’ad, F.M. 1972. Taxonomical studies on the flora of Egypt. III.
Comparative studies in the natural flora of Egyptian Nubia. Egyptian Journal of Botany, 15(2): 265–281.
Abd Ellah, R.G. 1995. Heat, salt and water budget of Lake Nasser. Assiut University. (MSc thesis)
Abd Ellah, R.G. 2004a. Temperature distributions in Lake Nasser water, Egypt. Aswan Science and Technology Bulletin, 22: 57–66.
Abd Ellah, R.G. 2004b. Effect of water inflow on some physico-chemical characteristics in Lake Nasser water, Egypt. Aswan Science and Technology Bulletin, 22: 47–56.
Abd Ellah, R.G., Belal, A.E. & Maiyza, I.A. 2000. Seasonal vertical variation in water temperature and total dissolved solids. In J.F. Craig, ed. Sustainable fish production in Lake Nasser: ecological basis and management policy, pp 29–31. ICLARM Conference Proceedings 61.
Abdel-Monem, A.M.A. 1995. Spatial distribution of phytoplankton and primary productivity in Lake Nasser. Ain Sham University. (PhD thesis)
Abdel-Rahman, A. & Goma, R.H. 1995a. Monthly variation of water temperature, dissolved oxygen, pH and transparency in the High Dam Lake in 1988. Working report of the Fishery Management Center, LNDA, Aswan 4: 187–203.
Abdel-Rahman, A. & Goma, R.H. 1995b. Monthly variation of water temperature, dissolved oxygen, pH and transparency in the High Dam Lake in 1989. Working report of the Fishery Management Center, LNDA, Aswan 4: 207–228.
Abdel-Rahman, A. & Goma, R.H. 1995c. Monthly variation of water temperature, dissolved oxygen, pH and transparency in the High Dam Lake in 1990. Working report of the Fishery Management Center, LNDA, Aswan 4: 231–254.
Abdel-Shaheed, M.N. 1996. An experiment on induced spawning of Labeo species with pituitary gland injection. Working report of the Fishery Management Center, LNDA, Aswan 5: 115–120.
Abdel-Shaheed, M.N. & Shenouda, B.Z. 1993. Preliminary study of rearing of Barbus bynni fry in concrete ponds. Working report of the Fishery Management Center, High Dam Lake Development Authority, Aswan 3: 333–342.
Abdel-Shaheed, M.N., Shenouda, B.Z. & Ahmed, R.S. 1993. Seasonal change of maturation of Benni, Barbus bynni. Working report of the Fishery Management Center, LNDA, Aswan 2: 233–236.
Abu Zeid, M. 1987. Environmental impact assessment for the Aswan High Dam. Water Research Center, Ministry of Irrigation. In A. Biswas & Q. Geping, eds. Environmental impact assessment for developing countries, pp. 168–190. London, Tycooly International Publishing.
Adam, E.A. 2004. Stock assessment of some important commercial fish species of Lake Nasser, Egypt. Assiut University. (PhD thesis)
Ahmed, A.M., Ahmed, M.A., Ahmed, M. & El-Otify, A.M. 1989. Field and Laboratory Studies on Nile Phytoplankton in Egypt. IV. Phytoplankton of Aswan High Dam Lake (Lake Nasser) Internationale Revue der gesamten Hydrobiologie und Hydrographie, 74(5): 549–578.
Ahti, T., Hamet-Ahti, L. & Pettersson, B. 1973. Flora of the inundated Wadi Halfa reach of the Nile, Sudanese Nubia, with notes on adjacent areas. Annales Botanici Fennici, 10: 131–162.
Ali, M.M. 1987. Studies on the shoreline vegetation of Aswan High Dam Lake (Lake Nasser) and impact of the lake on the desert. Assiut University. (MSc thesis)
Book 1.indb 78 12/29/11 1:16 PM

Lake Nasser, Egypt 79
Ali, M.M. 1992. Ecological studies on fresh water macrophytes in regulated waterbodies in Egypt and UK. Assiut University. (PhD thesis)
Ali, M.M. 2000. Aquatic macrophytes in Egyptian Nubia pre- and post-formation of Lake Nasser. In J.F. Craig, ed. Sustainable fish production in Lake Nasser: ecological basis and management policy, pp. 61–65. ICLARM Conference Proceedings 61.
Anon. 1996. Studies on the ecology of water, sediment and fisheries of Lake Nasser (in Arabic). First Report. NIOF & HDLDA. 165 pp.
Aruga, Y. & Monsi, M. 1963. Chlorophyll a amount as an indicator of matter productivity in biocommunities. Plant and Cell Physiology, 4: 29–39.
Belal, A.E. 1992. Final report on Wadi Allaqi eco-development project: sustainable development: an experiment in Wadi Allaqi, Aswan High Dam Lake region. Egypt project number: FP/9101-88-91. 78 pp.
Béné, C., Bandi, B. & Durville, F. 2008. Liberalization reform, ‘neo-centralism’ and black market: insight into the political economy of Lake Nasser fishery development. Water Alternative, 1(2): 219–235.
Béné, C., Abban, E.K., Abdel-Rahman, S.H., Ayyappan, S., Brummett, R., Dankwa, H.R., Das, A.K., Habib, O.A., Katiha, P.K., Kolding, J., Obirih-Opareh, N., Ofori, J.K., Shehata, M., Shrivastava, N.P. & Vass, K.K. 2009. Improved fisheries productivity and management in tropical reservoirs. Final report of the Project CP34, Challenge Programme on Food and Water and WorldFish Center. 117 pp.
Bishai, H.M., Abdel Malek, S.A. & Khalil, M.T. 2000. Lake Nasser. National Biodiversity Unit. No. 11. Egyptian Environmental Affairs Agency (EEAA production). 577 pp.
Boulos, L. 1967. Flora of the Nile region in Egyptian Nubia. Feddes Repertorium, 73: 184–215.
Cheung, W.W.L., Pitcher, T.J. & Pauly, P. 2005. A fuzzy logic expert system to estimate intrinsic extinction vulnerabilities of marine fishes to fishing. Biological Conservation, 124:97-111.
Craig, J.F. 2000. Sustainable fish production in Lake Nasser: ecological basis and management policy. ICLARM Conference Proceedings 61. Penang, Malaysia. 184 pp.
Downing, J.A., Plante, C. & Lalonde, S. 1990. Fish production correlated with primary productivity, not the morphoedaphic index. Canadian Journal of Fisheries and Aquatic Sciences, 47(10): 1929–1936.
El-Bakry, M.M. 1993. Hydro-meteorological measurements over the lake of Aswan High Dam and evaporation estimate. Nile 2002 Conference at Aswan, 1–6 February. 3(2): 1–21.
El-Bakry, M.M. & Matwally, M. 1982. Relations between parameters measured over land and lake stations at Aswan. Meteorological Research Bulletin, 14: 61–74.
El-Darwish, A.A. 1977. Studies related to the High Aswan Dam and Lake Nasser. Prepared for Lake Nasser policy committee of the Academy of Science, Research and Technology. Cairo. 37 pp.
Elewa, A.A. 1976. Chemical analysis for Lake Nasser. Al-Azhar University. (MSc thesis)
Elewa, A.A. 1980. Studies on the distribution of some elements in water and sediments in the Aswan High Dam Reservoir. Al-Azhar University. (PhD thesis)
Elewa, A.A. 1987. Physical and chemical studies on some khors of Lake Nasser. Egyptian Journal of Geology, 31(1–2): 253–265.
Book 1.indb 79 12/29/11 1:16 PM

Review of tropical reservoirs and their fisheries80
Elewa, A.A. & Latif, A.F.A. 1988. Effect of physicochemical conditions on the deposition of some elements of Aswan High Dam Reservoir water. Bulletin of the National Institute of Oceanography and Fisheries, 14(3): 189–212.
El-Gohary, F.A. 1989. Egypt and the River Nile: protection of the environment of the River Nile Basin. In F. Hassan, ed. Proceedings of a regional symposium in Cairo, pp 56–74. The Scientific Association of Arab Women in Egypt.
El-Hadidi, M.N. 1968. Vallisenria L. in Egypt. Candollea, 23: 51–58.El-Hadidi, M.N. & Ghabbour, S.I. 1968. A floristic study of the Nile valley at Aswan.
Revue de Zoologie et de Botanique Africaines, 78: 3–4.El-Shabrawy, G.M. & Dumont, H.J. 2003. Spatial and seasonal variation of
the zooplankton in the coastal zone and main khors of Lake Nasser (Egypt). Hydrobiologia, 491: 119–132.
El-Shahawy, M.A. 1975. Studies on the physical properties of Lake Nasser. Cairo University. (MSc thesis)
El-Zarka, S.E. 1985. Research in fisheries. Annex VI. In FAO. A review of the organization of agricultural and fisheries research, technology and development in Egypt, pp. 1–65. Rome, FAO.
Entz, B. 1970. Comparison of the physical and chemical environments of Volta Lake and Lake Nasser. In: Proceedings of the JBP-UNESCO symposium on productivity problems of freshwaters in Kasimierz Dolny, Poland, 6–12 May, pp. 883–891.
Entz, B. 1974. Limnology. In B.G.A. Entz & A.F.A. Latif, eds. Report on survey to Lake Nasser and Lake Nubia (1972–1973), pp. 4–63. Working Paper No. 6. Aswan, Egypt, LNDA.
Entz, B.A.G. & Latif, A.F. 1974. Report on survey to Lake Nasser and Nubia, 1972–1973. Working Paper No. 6. Aswan, Egypt, LNDA, 137 pp.
Evans, T.E. 1996. The effects of changes in the world hydrological cycle on availability of water resources. In F. Bazzaz & W. Sombroek, eds. Global climate change and agricultural production: direct and indirect effects of changing hydrological soil and plant physiological processes pp. 15–48. Rome, FAO; and Chichester, UK, John Wiley.
Fead, E.M. 1980. Primary production of Lake Nasser. Michigan University. (Thesis)Finegold, C., Béné, C., Shehata, M. & Anwar, O. (2011). Productivity, capital
mobilization and moral hazard contracts: Lake Nasser, Egypt. Journal of Social and Development Sciences, 1(5): 183-193.
Fishar, M.R.A. 1995. Studies on bottom fauna in Lake Nasser, Egypt. Suez Canal University. (PhD thesis)
Gaber, M.A. 1981. Report on zooplankton investigations in Lake Nasser (during August and September). Aswan Regional Planning, Water Resources Department. 60 pp.
Gaber, M.A. 1982. Report on phytoplankton investigations in Lake Nasser during October 1979. Aswan Regional Planning, Water Resources Department. 56 pp.
Ghabbour, S.I. 1972. Flora of the Nile region at the Dongola reach, Sudanese Nubia. Revue de Zoologie et de Botanique Africaines, 85(1–2): 1–29.
Habib, O.A. 1997. Limnological studies on Nasser Lake, Egypt, with special reference to phytoplankton and zooplankton. Tokyo University of Fisheries. (PhD thesis)
Habib, O.A. 2000. Zooplankton distribution, In J.F. Craig, ed. Sustainable fish production in Lake Nasser: ecological basis and management policy, pp. 67–74. ICLARM Conference Proceedings 61.
Book 1.indb 80 12/29/11 1:16 PM

Lake Nasser, Egypt 81
Habib, O.A. & Aruga, Y. 1988. Changes of the distribution of phytoplankton chlorophyll a in the main channel of the High Dam Lake, Egypt. Journal of the Tokyo University of Fisheries, 75: 343–352.
Habib, O.A., Ioriya, T. & Aruga, Y. 1987. The distribution of chlorophyll a as index of primary productivity of phytoplankton in Khor El-Ramla of the High Dam Lake, Egypt. Journal of the Tokyo University of Fisheries, 74: 145–157.
Higazy, M., Elewa, A.A. & El-Rahman, M. 1986. Environmental influence on the clay mineral formation and deposition in Lake Nasser, Egypt. Journal of Geology, 30(1-2): 131–140.
Hurst, H. E. 1952 (1957 2nd enlarged edition). The Nile. London, Constable. 331 pp.Iskaros, I.A. 1993. Ecological studies on the distribution of zooplankton and benthic
fauna in Khor Kalabsha in Lake Nasser. Mansura University. (PhD thesis)Jul-Larsen, E.J., Kolding, J., Overa, R., Nielsen, J.R. & van Zwieten, P. 2003.
Management, co-management or no management? Major dilemmas in the sustainable utilisation of southern African freshwater fisheries. FAO Fisheries Technical Paper No. 426/1. Rome, FAO. 127 pp.
Karenge, L.P. & Kolding, J. 1995. On the relationship between hydrology and fisheries in Lake Kariba, central Africa. Fisheries Research, 22: 205–226.
Khalifa, U.S.A., Agaypi, M.Z. & Adam, H.A. 2000. Population dynamics of Oreochromus niloticus L. and Sarotherodon galillus Art. In J.F. Craig, ed. Sustainable fish production in Lake Nasser: ecological basis and management policy, pp. 87–90. ICLARM Conference Proceedings 61.
Kinawy, S.M.A. 1974. Hydrography and nutrient salts in the water of Lake Edku, Egypt. Alexandria University. (MSc thesis)
Kolding, J. & van Zwieten, P. 2006. Improving productivity in tropical lakes and reservoirs. Challenge Program on Water and Food, Aquatic ecosystems and fisheries review series 1, Theme 3 of CPWF. Cairo, WorldFish Center. 139 pp.
Kolding, J., van Zwieten, P., Mkumbo, O., Silsbe, G. & Hecky, R. 2008. Are the Lake Victoria fisheries threatened by exploitation or eutrophication? Towards an ecosystem based approach to management. In G. Bianchi & H.R. Skjoldal, eds. The ecosystem approach to fisheries. Wallingford, UK, CAB International. 363 pp.
Latif, A.F.A. 1974a. Fisheries of Lake Nasser. Egypt, Aswan Regional Planning. 12 pp.
Latif, A.F.A. 1974b. Fisheries of Lake Nasser and Lake Nubia. In B.G.A. Entz & A.F.A. Latif, eds. Report on survey to Lake Nasser and Lake Nubia (1972–1973), pp. 64–137. Working Paper No. 6. Aswan, LNDA.
Latif, A.F.A. 1977. Reports on surveys of Lake Nasser. Lake Nasser and River Nile project. Academy of Scientific Research and Technology, 286 pp.
Latif, A.F.A. 1979. Effect of impoundment on Nile biota in Lake Nasser. In: Proceedings of the international symposium Environmental Effects of Hydraulic Engineering Works, pp. 435–445. Knoxville, USA, Tennessee Valley Authority.
Latif, A.F. 1981. Management of fish resources of Aswan High Dam Reservoir. In: First thematic conference of the international symposium on remote sensing of the environment, pp. 615–618. Cairo.
Latif, A.F.A. 1984a. Lake Nasser: the new man-made lake in Egypt (with reference to Lake Nubia). In F.B. Taub, ed. Lakes and reservoirs, pp. 385–410. Amsterdam, Netherlands, Elsevier Science Publishers.
Book 1.indb 81 12/29/11 1:16 PM

Review of tropical reservoirs and their fisheries82
Latif, A.F.A. 1984b. Lake Nasser. In J.M. Kapetsky & T. Petr, eds. Status of African reservoir fisheries, pp. 193–246. Committee for Inland Fisheries of Africa Technical Paper No. 176.
Latif, A.F.A., El-Etreby, S.G., Abdel-Azim, M.E. & Shereie, H.A.S. 1979. Reservoir fisheries and fishery resources. Report of the River Nile and Lake Nasser Project, December. Cairo, Academy of Scientific Research and Technology.
Latif, A.F.A. & Khallaf, E.A. 1996. Ecological distribution, feeding and growth of Schilbe mystus in Lake Nasser during the period 1972–1974. Journal of the Egyptian German Society of Zoology, 20(b): 187–221.
Latif, A.F.A. & Rashid, M.M. 1972. Studies on Tilapia nilotica from Lake Nasser. I. Macroscopic characters of gonads. Bulletin of the Istitute of Oceanography and Fisheries UAR, 2:215–238.
MacDonald, Sir M. & Partners. 1988. Rehabilitation and improvement of water delivery systems in Old Lands, Egypt. Annex A: Water Resources. IBRD/UNDP Project No. EGY/85/012. Washington, DC.
Mageed, A.A. & Heikal, M.T. 2005. Water quality and zooplankton dynamics in Lake Nasser, Egypt. Egyptian Journal of Aquatic Biology and Fishery, 9(3): 1–24.
Mekkawy, I.A.A. 1998. Fish stock assessment of Lake Nasser, Egypt, with emphasis on the fisheries of Oreochromis niloticus and Sarotherodon galilaeus. Journal of the Egyptian German Society of Zoology, 35(b): 283–404.
Mohamed, A.A. 2000. Seasonal variations in mean air and water temperature, transparency, pH and dissolved oxygen along the main channel. Sustainable fish production in Lake Nasser. In J.F. Craig, ed. Ecological basis and management policy, pp. 25–27. ICLARM Conference Proceedings 6.
Mohamed, A.A., Ahmed, A.M. & El-Otify, A.M. 1989. Field and laboratory studies on Nile phytoplankton in Egypt. IV. Phytoplankton of Aswan High Dam Lake (Lake Nasser). Internationale Revue der gesamten Hydrobiologie und Hydrographie, 74: 549–578.
Mohamed, I.O. 1993a. Vertical distribution of chlorophyll a concentration, water temperature and transparency in the main channel of the High Dam Lake in 1989. Working report of the Fishery Management Center, High Dam Lake Development Authority, Aswan 3: 209–227.
Mohamed, I.O. 1993b. Seasonal variations of chlorophyll a in the main channel of the High Dam Lake in 1986–1987. Working report of the Fishery Management Center, High Dam Lake Development Authority, Aswan 2: 133–154.
Mohamed, I.O. & Loriya, T. 1998. Microcystis aeurginosa water blooms in Lake Nasser. ICLARM Symposium on the Ecological Basis and Management Policy for Sustainable Fish Production in Lake Nasser, 20–23 June 1998, Aswan, 1: 251–253.
Nixon, S.W. 2003. Replacing the Nile: Are anthropogenic nutrients providing the fertility once brought to the Mediterranean by a great river? Ambio, 32: 30–39.
Nour El-Din, S.M. 1985. Study of the physico-chemical changes in the waters of the High Dam lake. Assiut University. (MSc thesis)
Omer, M.A. & El-Bakry, M.M. 1970. Estimation of evaporation from Lake Nasser. Meteorological Research Bulletin, 2: 1–27.
Pitcher, T. 1998. The law of ma’at, modelling and Lake Nasser. Fishbytes, 4(5): September/October.
Rashid, M.M. 1995. Some additional information on limnology and fisheries of Lakes Nasser (Egypt) and Nubia (Sudan). Committee for Inland Fisheries of Africa Technical Paper No. 30. Rome, FAO. 134 pp.
Book 1.indb 82 12/29/11 1:16 PM

Lake Nasser, Egypt 83
Rzoska, J. 1976. Zooplankton of the Nile System. In J. Rzoska, ed. The Nile: biology of an ancient river, pp. 333–343. The Hague, Dr. W. Junk, b.v. Publishers.
Rzoska, J. & Talling, J.F. 1966. The development of plankton in relation to hydrological regime in the Blue Nile. Journal of Animal Ecology, 55: 637–662.
Saad, M.A.H. 1980. A limnological study on Lake Nasser and the Nile in Egypt. Water Supply and Management, 4: 81–92.
Saad, M.A. & Goma, R.H. 1994. Effects of the High Dam and Aswan Cataract on the chemical composition of the Nile waters. 1. Major anions. Verhandlungen der Internationalen Vereinigung fur Theoretische und Angewandte Limnologie, 25: 1812–1815.
Samaan, A.A. 1971. Report on trips to Lake Nasser to investigate its primary productivity during March 1971. Aswan, Rep LUNDC. 11 pp.
Samaan, A.A & Gaber, M.A. 1976. Report on plankton investigation in Lake Nasser during March and August, 1976. In A.F.A. Latif, ed. Reports on surveys to Lake Nasser and River Nile Project. Cairo, Academy of Scientific Research and Technology. 13 pp.
SECSF. 1996. Studies of the environmental characteristics, sediments and fisheries of Lake Nasser. 1st annual report of National Institute of Oceanography and Fisheries (in Arabic) to the general authority for development of High Dam Lake, Aswan. 165 pp.
Shenouda, B.Z. & Naguib, M. 1993. Net cage culture of silver carp Hypophthalmichthys molitrix in the High Dam Lake without artificial feeds in 1991. Working report of the Fisheries Management Centre, High Dam Lake Development Authority, Aswan, 2: 229–231.
Springuel, I.V. & Murphy, K.J. 1990. Euhydrophytes of Egyptian Nubia. Aquatic Botany, 37: 17–25.
Teodoru, C., Wüest, A. & Wehrli, B. 2006. Independent review of the environmental impact assessment for the Merowe Dam Project (Nile River, Sudan). Switzerland, Eawag Kastanienbaum. 62 pp.
Tharwat, S., Abbass, F., Rashid, M. & Mokhtar, M. 1994. Food and feeding habits of two Chrysichthys spp. (F. bagridae) from Aswan Reservoir. Journal of the Egyptian German Society of Zoology, l3B: 147–167.
Welcomme, R.L. 1999. A review of a model for qualitative evaluation of exploitation levels in multi-species fisheries. Fisheries Ecology and Management, 6: 1–20.
Yamaguchi, Y., Hirayama, N., Yamada, S., Koike, A. & Zaki, M. 1996. Regression model for predicting a catch from water level of High Dam Lake in Egypt. Working report of the Fisheries Management Centre, High Dam Lake Development Authority, Aswan, 5: 121–132.
Zaghloul, F.A. 1985. Seasonal variations of plankton in Lake Nasser. Suez Canal University. (PhD thesis).
Book 1.indb 83 12/29/11 1:16 PM

Book 1.indb 84 12/29/11 1:16 PM

85
4. Lake Volta, Ghana
4.1 INTRODUCTION TO THE LAKE VOLTA REVIEWThe completion of the Akosombo Dam on the Volta River in 1964 resulted in the creation of an immense reservoir (Lake Volta) with a length of 520 km and covering about 8 500 km2, or 3.2 percent of Ghana’s total land area (Figure 46). The reservoir stores about 149 billion m3 (149 km3) of water. Although Lake Volta itself lies entirely in Ghana, the Volta River system is shared by six West African countries: Benin, Burkina Faso, Côte d’Ivoire, Ghana, Mali and Togo. The main aim of constructing the dam was to produce electricity, but the reservoir’s fisheries were soon recognized to be of significant socio-economic importance to Ghana. A large fishery developed, upon which some 300 000 fisherfolk depend for their livelihood (Braimah, 2003). According to FAO statistics, inland capture fisheries contributed 27 percent of total Ghanaian fish production in 2009 (FAO FishStat Plus). It is estimated that the reservoir provides 90 percent of national freshwater fish production (Abban, 1999). The reservoir also facilitates the transportation of goods and passengers and the provision of services, linking different parts of the country.
Because of the important contributions of the fishery to socio-economic development in Ghana, the Government of Ghana has undertaken efforts to sustain and enhance fish production from Lake Volta. Notable among these were the establishment of Volta Lake Research and Development Project in the 1960s and its related research projects through the 1960s, 1970s and 1980s, followed by the institution of the United Nations Development Programme (UNDP) project Integrated Development of Artisanal Fisheries (IDAF) from about 1989 to the late 1990s. A major objective of both projects was to establish community fishery centres. The Volta Lake Research and Development Project established the first of these at Kpando, and the IDAF completed
Courtesy: CSIR Water Research Institute, Ghana.
Book 1.indb 85 12/29/11 1:16 PM

Review of tropical reservoirs and their fisheries86
about 90 percent of the second at Yeji. The community fishery centres were meant to facilitate fish processing and trade by providing various facilities to operators and supporting the collection of fishery data, including information on commercial fish species in segments of the reservoir.
FIGURE 46The Volta Basin, showing political boundaries and important tributaries
Source: Andah and Gichucki, 2003.
FIGURE 47Fish landings in Ghana by origin, 1950–2006
Source: FAO statistics.
1950 1955 1960 1965 1970 1975 1980 1985 1990 1995 2000 2005
Year
0
100 000
200 000
300 000
400 000
500 000
600 000
Land
ings
(to
nnes
)
0
10
20
30
40
50
Freshwater landings
Marine landings
Proportion of landingsfrom freshwater
Pro
port
ion
of la
ndin
gs fr
om fr
eshw
ater
(%
)
Book 1.indb 86 12/29/11 1:16 PM

Lake Volta, Ghana 87
The landings of freshwater fish in Ghana were officially estimated to be 75 000 tonnes in 2006 and formed 20 percent of the total fish landings from the country (Figure 47). The estimated landings for Lake Volta are probably greatly underestimated. De Graaf and Ofori-Danson (1997) estimated the catch to be between 150 000 and 200 000 tonnes/year (180–240 kg/ha). Other, unpublished, catch estimates based on reservoir-wide catch-assessment surveys and frame surveys proposed that the reservoir produced 217 000–251 000 tonnes in 2000 (Braimah, 2000, 2001, 2003 in Béné, 2007; see discussion in Chapter 5).
4.2 PHYSICAL FEATURES: GEOGRAPHY, WATER, CLIMATE, SOILSThe Volta River Basin occupies 417 382 km2 in six countries (Figure 46). The basin drains 70 percent of Ghana, which occupies 42 percent of the basin. Basin elevations range from sea level to 920 m above sea level, with a mean elevation of 257 m and correspondingly low channel grades. The lower Volta River is fed by three major tributaries. To the west, the Black Volta River, or Nakambe River, drains 147 000 km2, mostly of western Burkina Faso with small areas of Mali and Côte d’Ivoire. The White Volta River, or Nazinon River, drains 10 000 km2 including much of northern and central Ghana and Burkina Faso. To the east, the Oti River drains 72 000 km2 of northwestern Benin and Togo. The three tributaries join in northern Ghana to form Lake Volta.
The basin is primarily underlain by a Voltarian formation consisting of sandstone, shales and mudstones. Another formation is Precambrian, classified into Birimain, Buem and Tarkwaian rocks (Dickson and Benneh, 1977). Parts of the Afram, Pru and Tain sub-basins to the west of Lake Volta are characterized by semi-deciduous forest, while the remainder of the basin supports interior savannah and woodland. The soils of the semi-deciduous forest area are forest ochrosols, which are alkaline and well drained. The soils are groundwater laterites and savannah ochrosols in the savannah and woodland.
The Volta Basin has at least four climatic zones, from lowland rainforest in the south, where annual precipitation can exceed 2 000 mm, to Sahel-Sudan in the north, where average rainfall is well below 1 000 mm per year and potential evaporation is considerably higher. Basin-wide, rainfall averaged 1 025 mm per year from 1936 to 1963, of which roughly 9 percent becomes river discharge as measured by Akosombo Dam outflows. Climatic patterns are strongly influenced by the movement of the intertropical convergence zone, which generates unimodal as well as bimodal rainy seasons. The north has only one wet season, from May to November, with peak rainfall occurring in September. In the south, there are two rainy seasons, with peaks in June–July and September–October. Mean annual temperatures approach 30 °C, and humidity varies between 90 percent in coastal areas to below 20 percent in the north during the harmattan (northeasterly winds). The harmattan, typically occurring from December to February, brings hot, rainless conditions and haze originating in the Sahara. In January or early February, Lake Volta lies wholly within harmattan-affected areas, with dry, warm days and cool nights. In June and July, easterly winds predominate over the reservoir, bringing squally thunderstorms and heavy precipitation. By August, the whole reservoir comes under the influence of the moist southwesterly to southeasterly monsoon, with prolonged light rain. The very cold harmattan winds in the dry season in January and the heavy rains together with the southwesterly monsoon from June to September cause lower water temperatures and mixing of the waters (Ewer, 1966; Biswas, 1969; Viner, 1969). Reservoir stratification takes place from April to June.
Small changes in precipitation in the basin bring proportionately large changes in runoff. Volta Basin runoff, therefore, exhibits higher temporal variability than does basin rainfall. After 340 km3 is precipitated (or 85 percent of the average annual rainfall), roughly half of the precipitation volume becomes discharge. Mean basin yield
Book 1.indb 87 12/29/11 1:16 PM

Review of tropical reservoirs and their fisheries88
was about 35 km3/year in 1936–1963, prior to the closing of the Akosombo Dam, and 31 km3/year in 1967–1998.
Climatologists in Ghana and the Institute for Meteorology and Climate Research – Atmospheric Environmental Research in Garmisch-Partenkirchen, Germany, are investigating probable delays in the onset of the rainy season over the past several decades, which have been widely reported by farmers in the basin. This is an issue of great concern given the likelihood of altered rainfall patterns as a consequence of changes in global air circulation (Kunstmann and Jung, 2004).
4.3 WATER LEVEL AND RESERVOIR AREA Lake Volta is fed by numerous tributary rivers to the Volta River, all of them rainfed. Thus, the volume of water in the reservoir and the area shrinks during the dry season and swells during the rainy season. After the closure of the dam in 1964, the reservoir filled in about three years and reached its maximum recorded level of 85 m above sea level in 1976 (Figure 48). After 1976, the water level started to drop, reaching its lowest limit of 72 m in 1984 after the severe drought in 1983. Water levels started to rise again, regaining maximum levels in 1989 and 1992 and subsequently dropping. Over the whole period from 1966 to 2006, water levels have steadily decreased by an average of about 15 cm per year, but with distinct periods of lows and highs; from 1967 to 1981 the reservoir level was on average 81 m, or 5 m higher than in the subsequent period to 2006.
FIGURE 48Reservoir levels at Akosombo
Note: The graph show monthly average water levels (masl) relative to the long-term mean of 78 m since November 1965 (main graph line with markers) and monthly average absolute water levels since the closing of the dam in January 1964 (inset). Also shown is the trend line for 1964–2005, indicating that average reservoir levels are now 5 m lower than in the 1970s. The average level between 1967 and 1981 was 81 m, dropping to an average of 76 m from 1982 to 2006.Source: Based on data from the Volta River Authority.
There is a large inflow of water into the reservoir in August and it attains its highest level in August–September. Spillage is always carried out in September. The water level starts falling in October–November, with the onset of the harmattan in the catchment area, and generally reaches its lowest level in May–July. The difference in seasonal
J65 66 67 68 69
J70 71 72 73 74
J75 76 77 78 79
J80 81 82 83 84
J85 86 87 88 89
J90 91 92 93 94
J95 96 97 98 99
J00 01 02 03 04
J05
-7
-6
-5
-4
-3
-2
-1
0
1
2
3
4
5
6
7
Mon
thly
rel
ativ
e re
serv
oir
leve
l at A
koso
mbo
(m
)
0
10
20
30
40
50
60
70
80
90
20.12.62 11.6.68 2.12.73 25.5.79 14.11.84 7.5.90 28.10.95 19.4.01 10.10.06
Book 1.indb 88 12/29/11 1:16 PM

Lake Volta, Ghana 89
minimum and maximum levels per year is high, varying between 1.5 m in 1972 and 7.8 m in 1989, with an average of 3.7 m since 1967. Decadal seasonal variation in rising water levels has increased from 2.6 m (ten-year moving average 1969–1978) to 4.6 m (1987–1996) and has recently been 4.1 m (1997–2006). The ten-year moving average of receding levels ranged from 2.4 m to 3.7 m in the first two decades, rose to 4.9 m in the 1980s and has recently been 4.2 m (Figure 49). Thus, seasonal variation has increased since the early 1980s as the average water level has dropped.
Large parts of the reservoir area can be characterized as lacustrine with a strong riverine influence. This is particularly the case in the northern areas where confluence takes place. In fact, in these areas, receding water exposes the original riverbanks, allowing the original river bed to be recognized. This is a slow process that starts at the upper end of the reservoir above the confluence of the White Volta and Black Volta Rivers, moving gradually southwards with falling water levels. The inundated riverbanks, which are several times the size of the original river in surface area, show all the characteristics of a floodplain, and the area involved depends on the annual and decadal reservoir fluctuations.
FIGURE 49Seasonal variation in water level in Lake Volta, 1966–2006
Note: For both the inundation (top) and recession (bottom) series, a ten-year moving average is shown at year 5 (e.g. the point 1970 shows the average seasonal variation between 1966 and 1975). By multiplying the annual change in water level by 320 km2, one can obtain an estimate of the area that is inundated or becomes available during a flood cycle.Source: Based on data from the Volta River Authority.
Most publications give Lake Volta’s area at about 8 500 km2. However, the reservoir is situated in areas with relatively low differences in elevation, such that the large overall variations of 13 m and seasonally of 1.5–8 m can cause the area of inundation to
1965 1970 1975 1980 1985 1990 1995 2000 2005
0
1
2
3
4
5
6
7
8Ann
ual m
ax (
prev
ious
yea
r) -
min
res
ervo
ir le
vel (
m)
Annual variation in reservoir level (m) 10-year moving average
Receding waters
0
1
2
3
4
5
6
7
8
Ann
ual m
ax -
min
res
ervo
ir le
vel (
m)
Inundating floods
Book 1.indb 89 12/29/11 1:16 PM

Review of tropical reservoirs and their fisheries90
be highly variable. Indeed, elevation models of the topography of the area (Tanaka et al., 2002) have yielded estimated areas of 9 970 km2 at the maximum level of 84 m and of 4 450 km2 at 76.2 m in February 1995, when the lowest recorded level of 71.8 m was reached, for a difference of 5 520 km2, or approximately 700 km2 per vertical metre. This estimate seems to be too high, and it is not clear from the report whether groundtruthing took place. Vanderpuye (1984) reported a time series of reservoir levels, reservoir volumes and reservoir areas from 1971 to 1982, with water levels between 75.5 and 84.1 m. Reservoir area and level are correlated whereby a change of 1 m in water level brings a change of 320 km2 in reservoir area, or about half of the Tanaka et al. (2002) report. Vanderpuye (1984) claims that a drop of about 3.4 m renders at least 800 km2 of land in the ecotone available for agriculture. However, his time series over the 11 years examined shows a median of 690 km2 and a range of 61–1 620 km2 of land becoming available after recession. Vanderpuye’s estimates are used in further discussion on the impacts of change and variability in water level.
Assuming that the linear relation found by Vanderpuye (1984) of 320 km2 in area per metre change in water level still holds over the time series between 1965 and 2006 (minimum 71.9 m, maximum 84.2 m) the median land area becoming available after the waters have receded is 640 km2 (maximum 1 860 km2 , minimum 115 km2). Conversely, in the same period, a median of 610 km2 of land was inundated by rising waters (maximum 1 420 km2, minimum 270 km2). These figures indicate a huge impact on the shape and productivity of the reservoir resulting from variability in the annual flood pulse. Although the flood pulse concept was developed for rivers (Junk, Bayley and Sparks, 1989), it can also be applied to river-driven reservoirs like Lake Volta. Land becomes available each year over a period of eight to nine months between October–November and June–July. Inundation again takes place in the subsequent three to four months. Productivity estimates of the reservoir need to take account of this highly pulsating ecotone, as the floodplains that are exposed when water recedes are used for agriculture and animal grazing. No data are available, but it can be expected that many agricultural effects, such as treading by cattle and deposition of cow dung, will stimulate the release of nutrients during subsequent inundations.
The proportion of land inundated after a recession can serve as an index of the strength of the flood pulse and be indicative of peaks and troughs in reservoir productivity. Assuming again the linear relation by Vanderpuye (1984), a simple index is:
Inundation index (Ii) = inundated area in yeart × 100/receded area in yeart As not enough information is available on the actual area of land inundated
by the flood or made available during recession, the increase in water level (m)/decrease in water level in the previous period (m), or inundation index (Ii) can be used as a proxy (Figure 50). In 1965–1970, during the filling phase of the reservoir, Ii was > 100 percent (the area of land inundated exceeded the area uncovered in the previous recession), which was higher than in other periods. Since 1970, 35 percent of the years have had an Ii > 100 percent, so once every two to three years more than 100 percent of the land that dried out during the previous recession again became flooded. In the six years since 2000, this happened twice. Peaks in the inundation index, and in particular extreme peaks as in 1999 and 2003, can be expected to bring important pulses of productivity and may be indicative of fish recruitment peaks. In the next section, it will be shown that the riverine waters causing the flood pulse are poor in nutrients. The high productivity of the reservoir can be attributed to the annual flooding of large tracts of land, as the riverine and reservoir waters are relatively low in nutrient concentrations (see below). The large annual variations in flooding, including years in which no recession takes place, suggest that the annual production of fish may vary accordingly.
Book 1.indb 90 12/29/11 1:16 PM

Lake Volta, Ghana 91
FIGURE 50Inundation index of Lake Volta
Note: The inundation index is calculated as the rise in water level (m) in yeart divided by the fall in water level between yeart-1 and yeart (as in Figure 49) times 100. Ii > 100% represents a net increase in inundated area of land. A more realistic index would be defined if the actual area of inundation and recession were known for each metre of rise and fall between the lowest and highest water levels recorded.Source: Based on data from the Volta River Authority.
4.4 PHYSICOCHEMICAL AND LIMNOLOGICAL FEATURES OF RESERVOIR PRODUCTIVITY4.4.1 Water quality Generally, the nutrient level of the reservoir is very low. This is attributed to a catchment area that is poor in nutrients and the low solubility of the Precambrian granites in the upper catchment area (Antwi, 1990). Only traces of phosphate, nitrate, nitrite, ammonia and sulphate have been recorded in the upper 40 m of the reservoir, while measurable quantities of these ions were recorded in the bottom waters. Physicochemical data collected by Antwi (1990) at Ajena in 1989, 25 years after the closure of the dam, are summarized in Table 20. The observations are comparable with those of earlier research by Biswas (1966a) and Obeng-Asamoah (1984). A study by Ofori-Danson and Ntow (2005) in the Yeji sector, or stratum VII (Figure 51), concluded that, as in Lake Volta’s early life, the water is oligotrophic, with low concentrations of nitrates, ranging from 0.51–0.82 mg/litre, nitrites (0.02–0.05 mg/litre) and phosphates (0.34–0.41 mg/litre) (Table 21). Sodium (Na+) was the dominant ion, with a mean concentration of 12.1 mg/litre. Generally, the ionic dominance pattern recorded was calcium (Ca+) > sodium > potassium (K+) > chlorine (Cl-) > magnesium (Mg2+). Obeng-Asamoah (1984) noted that the pH of the surface water was about 7.0, declining with depth to 6.5 in the anoxic water near the bottom of the reservoir. Total alkalinity increased during the filling and post-impoundment phases (Biswas, 1966b) and total alkalinity of 41 mg calcium carbonate (CaCO3)/litre was observed in 1989. Tables 20 and 21 indicate that differences exist in the reservoir on the north–south axis in pH, salinity, nutrients, conductivity, total dissolved solids and primary and secondary production, with the northern part of the reservoir being more riverine in character.
All authors cited indicate that the reservoir is warm polymictic. Stratification is fairly stable in April to June, but is frequently broken down during the rest of the
1965 1970 1975 1980 1985 1990 1995 2000 200530
100
1 000
9 000
Per
cent
age
area
of i
nund
atio
n af
ter
prev
ious
yea
r’s r
eces
sion
Inundation index = % inundation area/recession area
Book 1.indb 91 12/29/11 1:16 PM

Review of tropical reservoirs and their fisheries92
year by the southerly and harmattan winds and annual floods. The action of southerly winds blowing up the Akosombo Gorge mixes the water. Such winds tend to drive the surface layers northward, drawing the anoxic, iron-rich bottom waters to the surface. This is reflected in the high iron content throughout the water mass. During the flood periods, transparency is low, especially in the north owing to the progressive increase in colloidal suspended matter such as clay, silt and fine organic particulates washed into the reservoir by rain runoff. Mixing also causes the water to be turbid, limiting transparency. It is not clear from the reports whether algal blooms occur after resuspension of nutrient-laden water in the epilimnion.
Inflows from the Black Volta and White Volta Rivers to the upper reaches of the reservoir cause constant turbulence, which is especially noticeable in the rainy season. With the start of the first wet season in April, large quantities of suspended, dissolved
TABLE 20Physicochemical data at Ajena, near Akosombo Dam of Lake Volta, 1989
Depth (m)Parameter 0 1 5 10 15 20 30 40 50 60 70
Temperature (°C) 29.1 28.7 28.6 28.1 27.8 27.5 26.8 26.7 26.5 26.1 26.1pH 7.0 7.1 7.1 6.9 6.9 6.9 6.7 6.7 6.7 6.6 6.6Oxygen (mg/litre) 11.8 8.5 8.8 7.5 5.9 5.0 4.6 3.0 2.2 1.8 0.4Oxygen (% saturation) 138.1 110.8 87.1 86.7 67.0 60.0 49.4 35.7 24.5 17.7 5.9Acidity (mg/litre CaCO3) 16.8 16.9 17.8 17.7 17.7 18.5 18.2 19.1 19.6 20.8 24.1Alkalinity (mg/litre CaCO3) 40.8 40.7 40.6 41.5 42.4 40.4 41.1 42.8 41.8 40.3 39.9Total hardness (mg/litre CaCO3) 27.1 27.3 27.9 26.9 28.0 25.8 29.1 31.3 28.9 29.9 26.1TDS (mg/litre) 34.9 35.1 37.0 37.9 34.5 33.9 34.2 34.7 35.4 35.2 30.8Conductivity (μS/cm at 25 °C) 68.8 67.9 74.8 64.8 67.3 68.7 69.6 68.6 71.2 72.6 75.1Sodium (mg/litre) 3.9 4.0 4.2 4.0 3.8 4.0 3.9 3.8 3.8 3.1 3.8Potassium (mg/litre) 2.1 2.3 2.4 2.0 2.6 2.3 1.9 2.0 2.0 2.2 3.0Calcium (mg/litre) 5.1 5.8 5.8 5.4 5.4 5.5 5.1 6.0 5.8 6.0 6.1Magnesium (mg/litre) 4.2 4.0 4.2 4.1 4.6 3.8 4.7 5.2 4.4 3.9 3.5Chloride (mg/litre) 7.7 7.5 7.7 7.5 7.6 7.5 7.6 7.6 7.6 7.3 7.3Orthophosphate (μg/litre) 3 4 2 3 7 4 6 8 18 27 240Nitrate (μg/litre) 50 40 70 40 40 50 80 110 130 180 190Nitrite (μg/litre) 5 13 6 6 6 40 20 20 90 90 50Ammonium (μg/litre) 10 20 10 10 2 6 40 50 100 110 270Silicate (mg/litre) 3.1 3.1 3.1 3.0 3.0 3.3 3.7 3.4 2.8 3.5 5.4Sulphate (mg/litre) 0.2 0.6 0.4 0.3 0.3 0.4 0.3 0.7 0.7 0.8 6.2Secchi disc depth (cm) 220
Note: Values are means over the sampling period of February–December 1989, with samples taken monthly.Source: Antwi, 1990.
TABLE 21Mean values of limnochemical parameters, Yeji sector of Lake Volta (VII), February 1995–January 1996
Limnochemical factor
Depth (m)0 2 6 10 14
Temperature (°C) 31.0 30.0 29.5 29.4 29.3pH 7.2 (7.3) 7.2 7.0 6.9 (6.9) 6.7DO (mg/litre) 8.1 7.9 7.2 6.5 5.2O2 saturation (%) 108.9 103.9 94.1 85.2 67.5BOD (mg/litre) 3.9 na na na naAlkalinity (mg/litre CaCO3) 44.3 (35.7) 44.3 41.7 40.2 (37.3) 38.5TDS (mg/litre) 25.2 25.8 25.0 24.5 23.8Conductivity (μS/cm) 84 79 76 76 80Sodium (mg/litre) 12.1 (4.6) 9.6 11.0 12.1 (4.5) 11.7Phosphate (mg/litre) 0.41 (0) 0.34 0.36 0.50 0.39Nitrate (mg/litre) 0.51 0.63 0.66 0.82 0.97Nitrite (mg/litre) 0.02 (0.02) 0.02 0.02 0.02 0.05Ammonia-nitrogen (mg/litre) 0.83 (0.08) 0.33 0.36 0.57 (0.08) 0.43Secchi disc depth (cm) 50.2
Note: Comparative values recorded in 1968–1970 by Czernin-Chudenitz (1971) are in parentheses (number of samples and variability not given). na= not available.Source: Ofori-Danson and Ntow, 2005.
Book 1.indb 92 12/29/11 1:16 PM

Lake Volta, Ghana 93
and colloidal organic matter enter the reservoir with the turbid river water and reduce the Secchi disc depth to a minimum of 21 cm in October. Later, there is a gradual increase in Secchi disc depth, reaching a maximum of 81 cm in February as the dry season sets in, suggesting a gradual loss of suspended matter as it settles on the reservoir bottom. Transparency increases further with the loss of the seasonal algal blooms in the dry months. Ofori-Danson and Antwi (1994) recorded a Secchi disc depth of 220 cm in the gorge area in 1990. Ntow (2003) measured a mean Secchi disc depth of 50 cm and asserted that it had decreased from previous years. In the Yeji area (also called stratum VII), Secchi disc depth measurements for July 1968–July 1980 ranged from 35 cm to 260 cm, with a mean of 134 cm (FAO, 1971). More recent measures indicate Secchi disc depth of 50 cm at stratum VII (Viner, 1990). Although all measurements fall in the range measured by FAO (1971), the later measurements by Ntow and Viner are described as decreased transparency, which are perhaps a result of increased colloidal suspended particles rising from sediments at the reservoir bottom. Biswas (1966b) observed that the depth of light penetration was drastically reduced during the flood period of July–September and the harmattan season. Increases in turbidity are regarded by Ofori-Danson and Ntow (2005) as a major constraint on primary production and potential fish yield.
Turbidity brings high oxygen saturation levels of greater than 100 percent at the surface, possibly restricting primary production by limiting light penetration. Ewer (1966) and Viner (1966 unpublished, reported in Entz [1969]) have shown that the well-oxygenated zones of the reservoir that are suitable habitats for fish were restricted to the uppermost 5–10 m in depth. No large seasonal variation in the oxygen content was observed. Very low oxygen levels were measured earlier in the reservoir’s history and were attributed to the inundated area not having been cleared of vegetation, leaving gigantic quantities of organic material to rot once submerged. The difference in temperature between the surface and bottom is narrow, at only 1.7 °C, with practically no thermal stratification in the Yeji sector of the reservoir. This suggests the mixing of surface and deeper layers, thereby enhancing oxygen availability at deeper levels, thus enabling fish to live in all sectors of the water column.
Potential fish yields were estimated using the morpho-edaphic index model (MEI = total conductivity in microsiemens per centimetre over mean depth in metres) (Ryder, 1965, 1982; Welcomme, 1972; Henderson and Welcomme, 1974). According to Ofori-Danson and Ntow (2005), the potential fish yield of Lake Volta declined from 32.8 kg/ha in 1974 (27 880 tonnes at 8 500 km2) to 29.0 kg/ha (24 650 tonnes) in 1995/96. Although these calculated figures from the MEI are lower than any reported production figures based on landings estimates, the “decline” is attributed to limnological changes in the reservoir, notably increased turbidity. Current productivity estimates based on total landings may be as high as 295 kg/ha (see Section 4.5), or up to tenfold higher than the estimates calculated using the MEI. As nutrient concentrations can be low owing to rapid absorption by phytoplankton, standing concentrations and associated conductivity estimates are of limited value for estimating productivity. Ideally, nutrient loadings should be quantified. As standing concentrations are extremely low, organic eutrophication is not a problem in Lake Volta at this stage. The limnochemical characteristics of the reservoir are affected by climatic, hydrological and internal factors that show large fluctuations. Secondary and higher biological production characteristics are subject to regulatory hydrophysical and biological processes, causing fluctuations in local zooplankton, zoobenthos and fish population abundance and seasonal, patchy distributions of these biota.
4.4.2 Phytoplankton, zooplankton and primary productivityLimited work has been carried out on estimating primary productivity through the composition and abundance of phytoplankton and zooplankton. Work done by Viner
Book 1.indb 93 12/29/11 1:16 PM

Review of tropical reservoirs and their fisheries94
(1969, 1990) indicated that phytoplankton were uniformly distributed in the water column at Ajena, in the southern part of the reservoir, but were limited in abundance further north at the Afram confluence, Kpando and Kete Krachi. Bacillariophyta were more dominant at the southern stations, while cyanophytes were dominant further north. Chlorophyta were more abundant north of Kpando, while along the Oti River arm of the reservoir, north of Kete Krachi, cyanophytes were dominant. At Ampem – again further north, where the reservoir was shallow – bacillariophytes, cyanophytes and chlorophytes were dominant. No data are available after these 1965–66 reports. Light penetration could be responsible for the marked differences in phytoplankton composition along the various axes of the reservoir, but no information on transparency is available to assess this.
Phytoplankton abundance varied between the dry and rainy seasons (Biswas, 1966a). Phytoplankton growth was prolific in dry seasons and slower in rainy seasons. Plankton abundance in the southern part of the reservoir was low, as was the number of species (Rajagopal, 1969). More than 20 species confined to 10 genera were identified. The most abundant genera were Synedra and Melosira for the main channel, while Oscillatoria dominated the shallow arms and inshore areas. Eudorina and Volvox also occurred in relatively large numbers and algal blooms were observed only occasionally in some areas (Obeng-Asamoah, 1984). As observed by Biswas (1966a), rotifers formed the major constituent of zooplankton (90 percent) while copepods, cladocerans and protozoa were present in much smaller numbers (Obeng-Asamoah, 1984).
Estimates of primary productivity were undertaken using the light and dark bottle method. The daily values ranged from 0.8 to 5.2 g C/m3 in different regions of Lake Volta (a daily value of 5.2 g C/m3 would indicate that the reservoir is not oligotrophic). It was noted that a similar range of values was found in various Ugandan lakes (Talling, 1963). Low daily values of 0.8–1.8 g C/m3 were found in Lake Bunyoni, moderate daily values of 2.0–4.0 g C/m3 in Lake Edward, and high daily values of 4.0–6.0 g C/m3 in Lake George. Both moderate and high values have also been found in different parts of Lake Victoria. Gross primary productivity measurements at the surface of Lake Volta at Ajena showed that daily values were low, ranging from 0.2 to 1.35 g C/m3. Antwi (1990) ascribed this to limited nutrients.
4.5 FISH AND FISHERIES OF LAKE VOLTA4.5.1 Estimates of catchFish landings from Lake Volta have been recorded since the formation of the reservoir in 1965, when the Volta Lake Research and Development Project introduced a recording system that focused on landings of processed fish at central trading places around the reservoir (Table A2.1). Lake Volta is subdivided into eight strata (Figure 51) (Evans and Vanderpuye, 1973). In every stratum, a number of periodic markets – 32 in total for the whole reservoir, most of them operating every four days – are set up to trade in fresh and processed fish. Most fish is processed, as smoked, salted, dried or fermented (known as momone and mainly consisting of elephant fish [Mormyridae]) products. Fish is brought to these markets by boat, packed in baskets. The importance of a market is limited where a small number of baskets of fish, fewer than ten or so, are bartered for food and fuelwood. Large markets have more than 1 000 baskets of fish sold for cash each day. The main weekly markets around the Lake Volta are at Buipe, Yeji, Makango, Dambai, Kwamekrom, Tapa-Abotoase, Kpandu-Tokor, Dzemeni and Ampem. At each of these main markets, at least one recorder is available to monitor landings. A summary of landings from these nine markets was made annually until 1977, when the project ended. Since then, data have been collected and sent to the regional fisheries offices, but no reservoir-wide summaries have been made and no checking of local recorders has taken place, allowing the quality of the data to
Book 1.indb 94 12/29/11 1:16 PM

Lake Volta, Ghana 95
deteriorate. Landing estimates are based mostly on basket size and fullness. In Yeji, the project system was used until June 1990, after which a simplified system similarly based on basket size and fullness was introduced. At Kpandu-Tokor, the fish arriving at the market is weighed with a scale.
Annual estimates of production from Lake Volta fisheries are thus based on landings of processed fish at the nine main fish markets around the reservoir. Both overestimation and underestimation of total landings take place. As all fish arriving at the markets are recorded, recycling is a source of error, as fish is presented at market, taken home and treated (e.g. smoked), and thus double counted when returned to market at the following session. Moreover, fish can be sold at a secondary market and presented for sale again at a primary market. More severe errors cause underestimates. Landings in smaller markets are not taken into account, nor are landings at the spontaneous temporary markets at landing places where transport vessels stop. Many fishers also find ways of transporting their fish to the main markets in Kumasi and Accra themselves. Thus, it is clear that not all fish passes through the central market places.
In addition, production estimates are based on processed fish landings, which means that a fresh weight equivalent needs to be calculated based on a conversion factor that has been set at about 1.5–2, but should be about 2–3 (de Graaf and Ofori-Danson, 1997). Reservoir production estimates seem to take into account local consumption, and post-harvest losses are allowed for as a certain percentage of total landings (Braimah, 1995). Based on surveys, it is estimated that about one-third of the catch is consumed locally, while 50 percent of the remaining two-thirds passes through the main markets (P.C. Goudswaard, personal communication, 2008).
FIGURE 51Lake Volta, indicating the eight strata for collecting fishery statistics
Book 1.indb 95 12/29/11 1:16 PM

Review of tropical reservoirs and their fisheries96
De Graaf and Ofori-Danson (1997) report that about 4 500 tonnes of fresh fish is consumed annually by the population around stratum VII of Lake Volta, which amounts to a per capita consumption of 44 kg/year, or 120 g/day. All this means that the historical production estimates for Lake Volta are highly uncertain and, most probably, are severe underestimates.
The following analysis relies heavily on data and information taken from several unpublished reports by Goudswaard (1993a, 1993b, 1993c) and by Goudswaard and Avoke (1993a, 1993b, 1993c), which were based on work performed between 1991 and 1993 for the FAO/UNDP IDAF project in Yeji, and the report by de Graaf and Ofori-Danson (1997). Moreover, a time series of monthly fish landings by species category from 1998 to 2006 was available for the combined Kpandu-Tokor and Dzemeni markets, while a shorter, interrupted time series for 1990 and 2003–06 was available for the Yeji market. The first data set was used to analyse changes in target species and trophic levels over time as an index for species change in the reservoir. The second data set was used for comparison where possible. Total landings averaging 4 600 tonnes fresh weight at the two southern markets represent about 7 percent of the official landings of Lake Volta. Similar time series of landings are available for some other areas of Lake Volta, in particular stratum VII. These time series would enable a more detailed comparison of species changes in different areas of the reservoir, but were not available for this synthesis.
4.5.2 Fish species and trophic categoriesNot much is known of the fish fauna of the Volta River prior to its damming. Trewavas (Irvine, 1947) indicated which species were recognized at that time from the Volta River. A provisional checklist by Roberts (1967) included all species whose presence was recorded and could be expected from the Volta River. Daget (1956, 1960) and Roman (1966) collected specimens for taxonomic studies from the upper reaches of the Black Volta and White Volta Rivers in Burkina Faso. Detailed studies on the changes of the fish community of Lake Volta were made in the years immediately after the creation of the reservoir (Petr, 1968, 1973; Reynolds, 1973), but no complete review of the fish fauna has been made to date. Taxonomic knowledge has increased during recent decades, including the discovery and description of new species, and the removal of some species names through the discovery of synonyms and redescriptions. A publication on species abundance in a number of Nilo-Sudan river basins includes Lake Volta as part of the Volta Basin (Lévêque, Paugy and Teugels, 1991). This publication is based on preserved specimens in the collections of three European museums and a literature review. The present checklist of species in Table 22 is based on work done by Goudswaard and Avoke, who systematically collected specimens of fish caught by fishers and found during inspections around the town of Yeji from 1991 to 1993, between the village of Bonya along the White Volta River and Abugame in the south of the northern arm of Lake Volta. Of their more than 74 species recorded, about 60 are commercially important. The list is provisional and probably not complete. Over the same period, a collection was made through a zoological museum in Japan, but no published records of these specimens seem to exist. The collections were made in stratum VII of Lake Volta. Roberts (1967) recorded 112 fish species during the pre-impoundment phase, and Denyoh (1969) recorded 108 species during the filling stage. Currently, 121 species have been recorded (Dankwa et al., 1999) (Table 22). It is also known that 32 fish species are present that were not recorded during the early stages of reservoir filling (Denyoh, 1969).
Book 1.indb 96 12/29/11 1:16 PM

Lake Volta, Ghana 97
TABLE 22Fish species and families of Lake Volta
Family Number Species (trophic level)
Alestidae 7 Alestes baremoze (3.1), Alestes dentex (2.9), Brycinus leuciscus (2.91), Brycinus nurse (2.44), Brycinus macrolepidotus (2.34), Hydrocynus brevis (3.4), Hydrocynus forskalii (3.98)
Anabantidae 1 Ctenopoma petherici (3.16)
Arapaimidae 1 Heterotis niloticus (2.55)
Ariidae (+1) Arius gigas (presence uncertain) (?)
Bagridae 2 Bagrus bayad (3.99), Bagrus docmac (4.08)
Channidae 1 Parachanna obscura (3.4)
Cichlidae 9 Steatocranus irvinei (3.32), Chromidotilapia guntheri (2.44), Hemichromis fasciatus (3.18), Hemichromis bimaculatus (3.93), Tilapia dageti (2.06), Tilapia zillii (2.0), Tilapia guineensis (2.8), Oreochromis niloticus (2), Sarotherodon galilaeus (2.05)
Citharinidae 3 Distichodus rostratus (2), Paradistichodus dimidiatus (3), Citharinus citharus (2)
Clariidae 3 Heterobranchus bidorsalis (3.69), Clarias gariepinus (3.15), Clarias anguillaris (3.35)
Claroteidae 3 (+1) Chrysichthys auratus (3.66), Chrysichthys nigrodigitatus (2.58), Auchenoglanis occidentalis (2.9), Clarotes laticeps (presence uncertain) (3.1).
Clupeidae 3 Odaxothrissa mento (4.29), Pellonula leonensis (3.3), Sierrathrissa leonensis (3.1)
Cyprinidae 6 Barbus macrops (3.04), Labeo coubie (2.04), Labeo senegalensis (2.09), Labeo parvus (2), Leptocypris niloticus (2.9), Raiamas senegalensis (2.84)
Gobiidae 1 Nematogobius maindroni (?)
Gymnarchidae 1 Gymnarchus niloticus (3.71)
Hepsetidae (+1) Hepsetus odoe (from reservoir?) (4.5)
Latidae 1 Lates niloticus (4.48)
Malapteruridae 1 Malapterurus electricus (2.93)
Mochokidae 9 Hemisynodontis membranaceus (?), Synodontis clarias (2.96), Synodontis violaceus (?), Synodontis filamentosus (2.88), Synodontis eupterus (2.65), Synodontis velifer (2.89), Synodontis nigrita (2.89), Synodontis ocellifer (3.12), Synodontis schall (2.92)
Mormyridae 14 Mormyrus rume (2.48), Mormyrus macrophthalmus (3.15), Mormyrus hasselquistii (3.17), Hyperopisus bebe (3.6), Campylomormyrus tamandua (3.24), Marcusenius senegalensis (3.1), Marcusenius abadii (3.07), Hippopotamyrus pictus (3.21), Mormyrops anguilloides (3.58), Brienomyrus niger (3.25), Petrocephalus bane (3.2), Petrocephalus bovei (3.1), Petrocephalus soudanensis (3.14), Pollimyrus isidori (2.61).
Polypteridae 2 Polypterus senegalus (3.5), Polypterus endlicheri (3.8)
Protopteridae 1 Protopterus annectens (3.8)
Schilbeidae 4 Parailia pellucida (3.5), Siluranodon auritus (2.86), Schilbe intermedius (3.6), Schilbe mystus (3.45)
Tetraodontidae 1 Tetraodon lineatus (3.6)
Total 74 (+3)
Note: Trophic level in parentheses according to FishBase (www.fishbase.org) accessed on 14 June 2008. Estimates are made from the presence of individual food items. If both are available the trophic level second estimation is used.Source: Species list based on Goudswaard and Avoke (1993a).
No detailed studies of food preference by stomach analysis have been carried out for Lake Volta. Many freshwater fish have facultative feeding habits and can feed at different trophic levels depending on age, food availability, season, etc. However, a tentative classification of fish species according to trophic group can be made based on the literature, FishBase and incidental observations. The most numerous and commercially important fishes in Lake Volta are phytoplanctivorous species (Hemisynodontis membranaceus, Oreochromis niloticus and Sarotherodon galilaeus). Together with the detritivorous species (Chrysichthys auratus, C. nigrodigitatus, Heterotis niloticus and Synodontis species) they form the main consumers of primary algal production and detritus in the reservoir. Insectivorous species include many Mormyridae including Marcusenius senegalensis and Mormyrus rume. Alestes dentex and Brycinus nurse were found to be opportunistic insect feeders feeding on swarms of migrant locusts when they struck the water surface. The only specialist mollusc-eating species in Lake Volta, Tetraodon lineatus, is very rare although bivalves and gastropods are available in abundance. The number of piscivorous species in the
Book 1.indb 97 12/29/11 1:16 PM

Review of tropical reservoirs and their fisheries98
reservoir is high, but none is very numerous except the pelagic species Odaxothrissa mento, Schilbe mystus and S. intermedius, larger individuals of which are piscivorous. These are abundant but most specimens are small and feed mainly on insects. Large fish predators such as Lates niloticus and Gymnarchus niloticus are not abundant. Stocks of Bagrus bayad and B. docmac are heavily exploited. Hydrocynus brevis and H. forskalii are present in commercial catches, but gillnets select disproportionately for these species, so catches may not reflect actual species composition.
The length of the species caught is an important parameter to characterize a fishery, and it is generally assumed that higher trophic levels are found with larger fish. Although there is a tendency for fish of larger maximum lengths (L∞) to belong to higher trophic levels in Lake Volta (Figure 52), the regression is not significant and explains only 2 percent of the variation; species of the various trophic levels are distributed over all length (L∞) classes (Table A2.2).
FIGURE 52
Maximum observed total length and trophic level of species of Lake Volta
Note: Trophic level in parentheses according to FishBase (www.fishbase.org) accessed on 14 June 2008. Estimates are made from the presence of individual food items. If both are available the trophic level second estimation is used.
4.5.3 Fishing effort: techniques, catch rates and developmentsMany fishing methods are in use on Lake Volta (see Appendix 2), most of which target only one or a few of the more than 60 commercial fish species, although all gear catch multiple species (see below in the analysis of trophic signature of gears). Some fishing gear are used seasonally (Table 23), and fishers frequently shift between them in the course of the year. Fluctuations in the reservoir’s water level thus affect spatial and temporal allocation of effort. During recession, the surface area of the reservoir decreases and fish migrate to deeper waters, creating concentrations of fish biomass requiring specific fishing methods. Rising water levels provide opportunities for floodplain fish species to spawn in the submerged vegetation, as well as food and shelter for those species that prefer shallow water, requiring other fishing methods. Thus, the period for using a particular method depends on the duration of recession and flood. If a rainy period brings little or no rise in water level, fishing methods such as nifa-nifa and acadja (described in Appendix 2), which depend on high water levels, cannot be used or can be used for only a limited part of the year. Fishers migrate extensively along the shores, often together with their families, and can be found within weeks at completely different parts of the reservoir. Sometimes complete fishing villages of more than 100 canoes are deserted when the whole community migrates to better fishing grounds. This highly dynamic situation severely complicates the recording of data on catch and
Book 1.indb 98 12/29/11 1:16 PM

Lake Volta, Ghana 99
effort in the artisanal fisheries of Lake Volta, apparently exacerbated by many fishers’ reservations on cooperation with fishery data collectors and researchers (P.C. Goudswaard, personal communication, 2008).
Fishers on Lake Volta are generally full-time, operating about 300 days/year, in working weeks of about 6–6.5 days, with slight differences among the various ethnic groups involved in fishing. All fishers are absent from their village for about 30 days per year, depending on the annual festival at their place of origin: the Fanti (Efutu) have their Aboakyer in May, the Ga have Asafotu in August, the Ewe (Battor) celebrate their Asafotu in August and Hogbetsotso in December. Around Easter and Christmas, some fishers travel to their home towns. The absence of canoe owners does not mean that all activities are suspended. It is common practice that helpers continue regular fishing during the absence or illness of gear and boat owners. Relatives from elsewhere can take over all fishing activities during the absence of gear owners (Goudswaard of UNDP–FAO IDAF 1992–1993, unpublished data; Prins, 1992).
Only limited data on fishing effort exist (Tables 24–26). The data on total effort suggest that between 1970 and 1998 the total number of fishers increased by 3.5 times and the number of vessels doubled. This means that the mean number of fishers per vessel doubled from 1.5 in 1970 to about three in 1998, possibly an indication of reduced investment per fisher over the whole Lake Volta over this 20-year period. Effort data from stratum VII are less clear in this respect, as the number of fishers per boat varied between 2.8 and 4.7 in different estimates between 1989 and 1999. Results from the frame survey of 1998 (MOFA, 2003) are shown in Tables 25 and 26. The number of fishers per boat varies between 1.3 and 3.2 in different strata, with an average of 3. The low proportion of vessels with engines is another indication of low investment per fisher, which is typical in many small African freshwater fisheries (Jul-Larsen et al., 2003).
TABLE 23Seasonality in gear use on Lake Volta
Gear1 Jan Feb Mar Apr May Jun Jul Aug Sep Oct Nov Dec
Receding water level Rising water level
Palm trap
Hook (Bagrus)
Nifa-nifa
Beach seine
Acadja
Ripping hook
Gillnet
Bamboo pipe
Winch net
Wangara
Drift net
Cast net
Tilapia trap
Hook (Lates)
Lift basket
1 Light grey = used; black = best period; white = not used. Sources: 55 interviews with village chiefs, elders and fishers conducted between March and April 1992, as well as informal enquiries during 1992 and 1993 (Goudswaard, unpublished results).
Book 1.indb 99 12/29/11 1:16 PM

Review of tropical reservoirs and their fisheries100
TABLE 24Estimated fishing effort on Lake Volta since 1970, whole reservoir (total) and stratum VII
Fishers Boats Reference
Total Stratum VII Total Stratum VII
1970 18 358 12 074 1 700 VLRDP Phase I, UNDP
1975 20 600 13 800 1 900 VLRDP Phase II, UNDP/FAO/VRA
1978 14 746 de Graaf and Ofori-Danson, 1997
1989 15 500 4 300 de Graaf and Ofori-Danson, 1997
1992 18 300 6 500 de Graaf and Ofori-Danson, 1997
1996 39 934 8 068 canoes, 358 winch boats
de Graaf and Ofori-Danson, 1997
1998 71 861 17 278 28 053 5 369 MOFA, 2003
Note: FAO = Food and Agriculture Organization of the United Nations; MOFA = Ministry of Fisheries and Aquaculture; UNDP = United Nations Development Programme; VLRDP = Volta Lake Research and Development Project; VRA = Volta River Authority.
TABLE 25Estimate of gear numbers on Lake Volta from the frame survey, 1998
Gear Number Gear Number
Gillnet 998 250 Winch net 447
Fishing line 791 571 Atigya 3 500
Trap 338 667 Wangara 6 046
Cast net 8 972 Bamboo pipe 4 180 630
Nifa-nifa 5 700 Spear 76
Beach seine 10 895 Poisoning 0
Source: MOFA, 2003.
TABLE 26Some characteristics of the Lake Volta fishery by stratum, based on the frame survey, 1998
CharacteristicI II III
Stratum
IV V VI VII VIIITotal
Fishing villages 161 152 167 115 182 146 237 72 1 232
Fishers 9 574 5 612 9 333 8 187 8 378 8 715 17 278 4748 71 861
Fishing boats 3 620 1 795 3 059 2 685 6 636 3 167 5 369 1 704 28 035
Outboard motors 134 126 260 105 110 33 111 33 973
Fishers per village 59 37 56 71 46 60 73 66 58
Fishers per boat 2.6 3.1 3.1 3.0 1.3 2.8 3.2 2.8 3.0
Boats with engines (%) 4 7 8 4 2 1 2 2 4
Source: MOFA, 2003.
Daily catch rates using different gear vary from 6 kg/boat (pellonula seines) to 82 kg/boat (winch nets with engines) (Table 27). Catch rates per canoe in an area of stratum VII measured by de Graaf and Ofori-Danson (1997) are within the same range (Figure 53). Both the average catch rates and the coefficients of variation by gear observed during the surveys that are the basis for Table 27 are within known ranges for these gears in other fisheries (van Densen, 2001; van Zwieten et al., 2006). Median daily catch rates of all gear were 25 kg/boat. This would mean that the annual catch of a canoe is about 7.5 tonnes/year. An average two or three fishers per boat (see Table 27, and de Graaf and Ofori-Danson, 1997) gives a catch of 2.5–3.8 tonnes/fisher, which is in the range of values known for other African freshwater fisheries (Jul-Larsen et al., 2003; Kolding and van Zwieten, 2006).
De Graaf and Ofori-Danson (1997) presented catch rates per gear and focused on gillnets and lift nets in the northern, central and southern parts of stratum VII. Canoes with gillnets caught 14.7 kg/day (coefficient of variation [CV] = 81, N = 530), 11 kg/day (CV = 109, N = 939) and 19.9 kg/day (CV = 60, N = 272) in the three areas, with a large seasonal and spatial variation. The relatively high CV for the central region may indicate
Book 1.indb 100 12/29/11 1:16 PM

Lake Volta, Ghana 101
that the sample was not homogeneous and may have consisted of a variety of gears. On average, the estimated annual catch per canoe (unstratified in time) was 3.4 tonnes, which is equivalent to a catch per fisher of about 1.7 tonnes/year. Winch boats operating lift nets caught 13–97 kg/day, with an average of 49 kg/day. These boats caught on average 16.8 tonnes/year. With an average of nine fishers per winch boat, this would give an annual catch of about 1.9 tonnes/fisher. Both average catch values per fisher are on the low side of the range that can be expected from small African freshwater fisheries.
FIGURE 53 Range and mean catch per canoe per day at Jaklai (central stratum VII), June 1991–December 1995
Source: Redrawn after De Graaf and Ofori-Danson (1997) using the original data courtesy of G. De Graaf.
TABLE 27Catch data for selected fishing methods in northern Lake Volta (stratum VII), 1992–93
N CPUE1
(kg/boat per day)Coefficient of variation
(%, 100 × sd/mean)Min. catch
(kg/boat per day)Max. catch
(kg/boat per day)
25 mm gillnet 11 27.4 57 6.2 52.7
50 mm gillnet 102 20.0 64 2.5 70.8
75 mm gillnet 48 24.0 96 1.7 92.6
≥ 100 mm gillnet 29 25.1 92 2.7 96.8
Pelagic net 11 34.6 97 9.9 127.4
Drift net 11 19.0 50 4.7 31.3
Beat and gillnet 2 39.1 84 6.2 71.9
Cast net 10 28.8 74 4.6 59.2
Beach seine 19 40.1 115 5.2 224.6
Mosquito seine 5 6.4 31 3.9 8.2
Pellonula seine 6 10.6 53 2.5 16.8
Longlining 1 18 28.9 108 5.4 139.6
Longlining 2 3 7.5 41 4.8 11.9
Longlining 3 16 17.6 246 0.0 169.8
Ripping hook 4 15.6 30 9.9 21.9
Bamboo pipe 11 71.7 44 29.8 127.3
Lift basket 6 12.5 70 3.9 27.9
Palm leaf trap 5 32.5 15 24.5 38.6
Tilapia trap 1 16.0 – – –
Acadja 6 29.4 51 13.6 61.8
Nifa-nifa 1 106.2 – – –
Winch engine 22 81.8 68 16.8 239.0
Winch manual 7 25.2 70 4.4 52.6
Overall mean – 28.9 – – –
Median – 25.2 – – –
Note: CPUE = catch per unit effort; N = number; sd = standard deviation.1 Estimates are based on unstratified sample averages.Source: Goudswaard, 1993a, 1993b, 1993c.
0,00
10,00
20,00
30,00
40,00
50,00
60,00
01-ju
n-91
21-ju
l-91
09-s
ep-9
1
29-o
ct-9
1
18-d
ec-9
1
06-f
eb-9
2
27-m
ar-9
2
16-m
ay-9
2
05-ju
l-92
24-a
ug-9
2
13-o
ct-9
2
02-d
ec-9
2
21-ja
n-93
12-m
ar-9
3
01-m
ay-9
3
20-ju
n-93
09-a
ug-9
3
28-s
ep-9
3
17-n
ov-9
3
06-ja
n-94
25-f
eb-9
4
16-a
pr-9
4
05-ju
n-94
25-ju
l-94
13-s
ep-9
4
02-n
ov-9
4
22-d
ec-9
4
10-f
eb-9
5
01-a
pr-9
5
21-m
ay-9
5
10-ju
l-95
29-a
ug-9
5
18-o
ct-9
5
07-d
ec-9
5
Dai
ly C
PU
E (
kg/c
ano
e)
DATE
Book 1.indb 101 12/29/11 1:16 PM

Review of tropical reservoirs and their fisheries102
Braimah (1995) presents catch rates per canoe per stratum fluctuating between 2.74 and 19.59 kg/day, with an average per stratum of 7.3–9.6 kg/day, or an annual catch of about 2.2–2.9 tonnes/canoe (unstratified spatially or temporally). With two to three fishers per canoe, this would yield an annual catch of about 0.7–1.5 tonnes per fisher, which seems rather low.
4.5.4 Fishing effort: trophic signature, habitat use, length and resilience of the catch by gearThe highly adaptable effort dynamics on Lake Volta are comparable with those of many other small-scale African freshwater fisheries. With its mixed lacustrine, floodplain and riverine characteristics, it may even represent this dynamism in an extreme form, judging from the many highly inventive gear types and large dynamics in spatial effort allocation, both seasonally (in response to floods), daily and weekly in response to the local availability of fish and fish traders (P.C. Goudswaard, personal communication, 2008). These effort dynamics may generate an overall picture of species, abundance and size composition in the catch of the combined fisheries of the reservoir that may closely match the dynamics in size and species structure of a fish community, as well as the productivity of its various components. In principle, a fishery that harvests all species at all trophic levels and sizes at rates proportional to their natural mortality pattern is not selective at the community level. Unselective harvesting patterns can maintain the relative size and species structure of fish community, with each of the components fished according to its surplus productivity (taking into account the part of the surplus production taken by fish predation), and will lower only biomass (Jul-Larsen et al., 2003) (Figure 54). Overfishing at the community level occurs if the total fishery exceeds the overall annual surplus production of the combined fish community in the reservoir. A specific component of the fish community will be overfished only when specific investments are directed at that component, and fishers continue to fish the species despite the greater effort needed to maintain catches. This can be economically viable only if such catches are compensated with higher fish prices, or supported by increased efficiency per unit of labour, or increased economic efficiency in distributing fish to consumers. Data to test this hypothesis are generally lacking. What would be needed are data on the trophic level of each species caught, the relative species composition for each gear, and the total effort and catch by gear next to an estimate of the productivity of each species. The fishing in balance (FiB) index (Pauly, Christensen and Walters, 2000; Pauly and Watson, 2005) could be an important indicator for assessing changes in catch over time. The index shows whether trophic-level changes
FIGURE 54The trophic level at which a fishery intervenes
Note: Triangles represent trophic pyramids (Lindeman diagrams) with fish predators at the top (trophic level ≥ 4) and phytoplanctivores and detritivores (trophic level = 2) near the bottom. The width of the triangle represents relative biomass. Black curves represent selective exploitation, arrows indicate the direction of increased fishing pressure.Source: Adapted from Jul-Larsen et al., 2003.
Book 1.indb 102 12/29/11 1:16 PM

Lake Volta, Ghana 103
are matched by increases in catch proportionally related to abundance at different trophic levels (FiB = 0). It will increase (FiB > 0) if bottom-up effects or expansions in the fishery occur and decrease (FiB < 0) when the fishery loses so much biomass that decline in catch does not compensate for declines in trophic level. The index does not evaluate the specific impacts of fishing patterns, either on trophic levels or on ecological spaces.
There are indications that the Lake Volta fishery is an example of an unselective harvesting pattern, judged from a set of indicators that can be devised to assess these impacts and make a judgement regarding whether fishing down (Welcomme, 1999) is taking place. Three indicators based on direct observations are as follows:
(1) Trophic signature of a fishing gear. This indicates the average trophic level of the catch of a gear. Analysed over all gear, this indicator gives information on the levels at which the whole fishery targets the fish community and whether it has the potential to change the structure of a fish community.
(2) Average length of species caught. A main driver of “fishing down” is a decrease in mean length of the catch through the successive removal of larger fish. The anticipation is that fishers will respond either by reducing the mesh size or by shifting to gear that select for smaller individuals and species. Such information on gear changes is not available, but it can be inferred from the species targeted and the different lengths these can attain whether this process may be occurring on Lake Volta.
(3) Spatial habitat targeted by the gear. This indicator is estimated from the habitat preferences of the species caught and informs about the various habitats that are covered by fishers. A change in this indicator gives information on the current spatial utilization of gear in a fishery and, over time, a possible expansion of a fishery over different habitats.
A fourth potential indicator is the average resilience of the species in the catch. This indicator could be constructed based on a number of life-history parameters, some of which are derived from models. Such an indicator could provide information about the changes in dominant life-histories in the fishery. Length-at-catch data are generally not available for the Volta fisheries, except for a dedicated short study under the Improved Fisheries Productivity and Management in Tropical Reservoirs Project (Figure 55). However, the maximum total length (L∞) that the species can attain is available (Appendix 2, Table A2.2). These indicators can be constructed based on reported data on the relative species composition of the catch by gear and on information provided by FishBase on the trophic level, maximum length, habitat use and resilience by species.5 In addition, a data set of reported catches by species and gear types for 21 types of gear (Goudswaard, unpublished) was used for Lake Volta (see FishBase and captions of Figures 55 and 56 for calculations).
5 Trophic levels in FishBase are estimated from the diet composition (percentage of volume or number of food items in the stomach) or from food items (lists of food items found in the stomach). The trophic level estimates are either the single value that is currently available or the median number of values available from several studies or localities. Habitat: Fishbase recognizes three basic spatial domains where fish reside that are called habitats: pelagic, bentho-pelagic and benthic. Resilience: the American Fisheries Society has suggested values for several biological parameters that permit the classification of a fish population or species into the categories of high, medium, low and very low resilience or productivity (Musick, 1999). FishBase restricts the assignment of resilience categories to values of von Bertalannfy’s growth coefficient k, the age at maturity tm and the maximum age tmax and those records of fecundity estimates that referred to the minimum number of eggs or pups per female per year, assuming that these were equivalent to average fecundity at first maturity. The von Bertalanffy growth coefficient k addresses the potential vulnerability of stocks to excessive mortality, with k ≤ 0.10 indicating high vulnerability. Another useful index in assessing the vulnerability of stocks to excessive mortality is the intrinsic rate of increase r. Vulnerability is inversely proportional to r and groups that have annual increase rates of less than 10 percent are particularly at risk.
Book 1.indb 103 12/29/11 1:16 PM

Review of tropical reservoirs and their fisheries104
FIGURE 55Trophic signature of fishing gear and maximum length of species
Note: On left: The trophic signature of fishing gear, showing mean trophic level of the catch in 21 types of gear operated in Lake Volta. The weighted mean is calculated by multiplying the trophic level of a species (taken from FishBase) by its proportion in the catch and summing these over all the species in the catch. Maximum, minimum and median trophic levels of the species caught by a gear are indicated. On right: The average of the maximum length that species can attain caught by 21 types of gear operated in Lake Volta. Calculations are as with trophic signature, with trophic level replaced by maximum observed total length of the species. Shown in brackets are the numbers of species caught by a gear, followed by the number of samples (n) on which the proportion is calculated.
The 21 types of gear caught a variety of species. The minimum number of species caught by one gear was 9 (sample size n = 1) and the maximum 56 (n = 102). The difference could be the result of differences in sampling frequency, but all types of gear clearly target multiple species. Moreover, most gear catch species present over the whole trophic range. Virtually all gear catch species with a minimum trophic level of 2. Most species targeted by each gear have a trophic level of about 3, while the maximum trophic level is more variable (Figure 55, left).
All the types of gear used in the Lake Volta fishery have a clearly different trophic signature, indicating that all trophic levels available appear to be utilized (Figure 55). Weighting the trophic level with the proportion of each species in the catch gives an average trophic level for each gear that ranges between 2 and 4.5. Each of the 21 types of gear targets a different part of the fish community and thus has a different impact on the food web. Gear that fish at low trophic levels are tilapia traps, acadja, nifa-nifa and cast nets. Longlining for Bagrus (longline 3) and longlining for Lates (1) and Clarias (2) have high trophic signatures in that they catch species that are high in the trophic spectrum. One-inch (25 mm) gillnets that target the small pelagic predator Odaxothrissa mento also have a high trophic signature (Figure 55, left).
Fourteen of the 21 types of gear examined target species that can attain maximum weighted-average lengths of between 35 and 70 cm. Mosquito seines, pellonula seines and one-inch gillnets target smaller species, while ripping hooks and the various longlines target species that can attain larger lengths. Virtually all gear catch species that can attain lengths ranging between 10 and 200 cm. Small length ranges were found with mosquito seines targeting small species with lengths of between 4 and 16 cm, dominated by Pellonula leonensis (86 percent of the catch). Species of median length (40–150 cm) targeted by bamboo traps are dominated by Chrysichthys auratus (86 percent) and to a lesser extent C. nigrodigitatus (14 percent), while species targeted by palm traps are dominated by C. auratus (23 percent), C. nigrodigitatus (57 percent) and Synodontis schall (11 percent). Longlines mainly target large (71–200 cm) Lates niloticus (99 percent) (Figure 55, right).
Tilapia trap (9, n=1)Acadja (13, n=6)
Nifa-nifa (11, n=1)Castnet (31, n=10)
Gillnet 3" (45, n=48)Gillnet 4"+ (19, n=29)
Ripp.hook (10, n=4)Winch-manual 19, n=(7)
Beachseine (43, n=19)Driftnet (26, n=11)
Winch-engine (39, n=22)Palmtrap (6, n=5)
Gillnet 2" (56, n=102)Mosquitoseine (5, n=5)
Pellonula seine (14, n=6)Longline 2 (6, n=3)Liftbasket (6, n=6)Bamboo (5, n=11)
Longline 1 (19, n=18)Gillnet 1" (22, n=11)Longline 3 (4, n=16)
1 2 3 4 5
Trophic level
Mosquitoseine (5, n=5)Pellonula seine (14, n=6)
Gillnet 1" (22, n=11)Driftnet (26, n=11)Liftbasket (6, n=6)Bamboo (5, n=11)
Tilapia trap (9, n=1)Gillnet 2" (56, n=102)
Nifa-nifa (11, n=1)Gillnet 3" (45, n=48)
Castnet (31, n=10)Palmtrap (6, n=5)
Winch-manual 19, n=(7)Beachseine (43, n=19)
Winch-engine (39, n=22)Acadja (13, n=6)
Gillnet 4"+ (19, n=29)Ripp.hook (10, n=4)
Longline 1 (19, n=18)Longline 2 (6, n=3)
Longline 3 (4, n=16)
3 10 100
300
Maximum total length (cm)
Book 1.indb 104 12/29/11 1:16 PM

Lake Volta, Ghana 105
A study under the CP34 Project6, covering the dominant types of gear in the fishery, was conducted in 2007/08 with ten fishers who recorded daily the length of their catch using their own gears. Results showed that 90 percent of the majority of the specimens caught were less than 35 cm long and 10 percent were less than 15 cm (Figure 56). This corresponds to about 40–50 percent of the maximum length of most of the targeted species. Large cichlid species tend to reduce in size under heavy fishing pressure. The most important gear in the fishery targeting cichlids are acadjas, or atidzas. The average size of the two most important cichlids, forming about 85 percent of the total cichlid catch over one year in one atidza, was 28 cm (37 percent of Lmax) for Oreochromis niloticus and 25 cm (62 percent of Lmax) for Sarotherodon galilaeus. Average size of Tilapia zillii was 20 cm (40 percent of Lmax), Hemichromis fasciatus 15 cm (60 percent of Lmax) and Chromidotilapia guntheri 7 cm (39 percent of Lmax). For all species, sizeable proportions of the catch were large specimens, showing limited indication of an overall reduction in size resulting from heavy fishing pressure (Figure 57).
FIGURE 56Relative length-to-frequency distribution in the catch of dominant gear used
in the Lake Volta fishery at Dzemeni, Kpando area
Note: Between March 2007 and June 2008, ten fishers recorded their catches twice a week utilizing their own gear. Indicated are the number of sets recorded for a set of gear and the average number of specimens caught per set. The largest specimen caught was a Lates niloticus measuring 188 cm.
6 Improved Fisheries Productivity and Management in Tropical Reservoirs, funded by the CGIAR Challenge Program on Water and Food.
0
5
10
15Acadja, #set=266, avg=23.1
0
5
10
15<2" Gillnets, #set=35, avg=50.2
0
5
10
152"-<3" Gillnets, #set=286, avg=30.2
0
5
10
153"-<5" Gillnets, #set=447, avg=19,9
0
5
10
15> 5" Gillnets, #s et=100, avg=7.4
0
5
10
15Net traps, #set=249, avg=60.6
0 5 10 15 20 25
Length (cm)
0
5
10
15
Freq
uenc
y (%
)
Basket traps, #set=128, avg=50.0
0
0
0
0
0
0
30 35 40 45 50 55 60 65
Book 1.indb 105 12/29/11 1:16 PM

Review of tropical reservoirs and their fisheries106
FIGURE 57Proportional length frequency distribution of five cichlid species in the catch of an acadja
in the Dzemeni area of Lake Volta
Note: Data were collected daily for one year in 2007/08.
Next to their impact on the food web and size distributions, gear differ in the spatial distribution of the catch. Most gear target species that live in benthic and bentho-pelagic habitats, but again each at a slightly different level. Many fishers target the species that appear in flooded areas or that are associated with the benthic or bentho-pelagic parts of the fish community. Clearly spatially distinct are the one-inch (25 mm) gillnets targeting small pelagics, drift nets targeting pelagic and anadromous fish, pellonula seines (a bait fishery for the Bagrus line fishery) and mosquito nets targeting the clupeid Sierrathrissa leonensis – all targeting pelagic species (Figure 58, left). Thus, the different types of gear target species in different spatial sectors of the ecosystem.
Most types of gear target species with intermediate resilience to fishing pressure as defined by FishBase (footnote 5) and have a median resilience of 3 (Figure 58, right). Gear that target species with high resilience are one-inch (25 mm) gillnets, pellonula seines, lift baskets and mosquito seines. Gear that catch a suite of species with a weighted-average resilience to fishing higher than 3.1 are as follows (with the dominant species in the catch that to a large extent determines this position indicated in parentheses): four-inch (100 mm) gillnets (Citharinus citharus), drift nets (the small alestid Brycinus nurse), one-inch (25 mm) gillnets (the small clupeid Odaxothrissa mento, the alestids Parailia pellucida and the schilbeid Schilbe mystus), pellonula seines (the small clupeids Pellonula leonensis and Sierrathrissa leonensis), lift baskets (Schilbe mystus) and mosquito seines (Sierrathrissa leonensis). These gear target species that can withstand high fishing pressure.
Gear that catch a range of species with a weighted-average resilience lower than 2.9 are as follows (with the species with low resilience to fishing [1 and 2] in parentheses): ripping hooks (the large elephant fish Mormyrus rume), longlines (Polypterus senegalus, Malapterurus electricus, Heterobranchus bidorsalis, Gymnarchus niloticus, Labeo coubie and the large elephant fish Mormyrops anguilloides) and three-inch (75 mm) gillnets (Gymnarchus niloticus, Labeo coubie and the large elephant fishes Mormyrus rume and Mormyrops anguilloides). Except for Mormyrus rume, caught by ripping hooks, none of the species is the main target of the gear that catch them. The main target for longlines is Bagrus bayad and for three-inch (75 mm) gillnets is Sarotherodon galilaeus. High fishing pressure from these gear may be an important cause of the perceived decline in bycatch species.
0 5 10 15 20 25 30 35 40 45 50 55
Length (cm)
0.0
0.2
0.4
0.6
0.8
1.0
1.2
1.4
1.6Fr
eque
ncy
(%)
Acadja - cichlids#set = 266, N = 5 127
Sarotherodongalilaeus (L
max=41)
Oreochromisniloticus (Lmax=74)
Tilapiazillii (Lmax=49)
Hemichromisfasciatus (L
max=25)
Chromidotilapiaguentheri (Lmax=16)
Book 1.indb 106 12/29/11 1:16 PM

Lake Volta, Ghana 107
FIGURE 58
Mean habitat left and mean resilience of the catch of 21 types of gear operated in Lake Volta
Note: The weighted mean is calculated by multiplying the habitat or resilience category of a species (taken from FishBase) by its proportion in the catch and summing these over all the species in the catch. Median habitat and resilience categories of the species caught by a gear are indicated. The number of species caught is shown in parentheses after a gear, followed by the number of samples (n) on which the proportion is calculated. (Habitat: 1 = benthic, 2 = bentho-pelagic, 3 = pelagic. Resilience: 2 = low, 4 = high).
4.5.5 Developments in total landings and total catchThe annual total catch was estimated at 61 700 tonnes, from surveys carried out by the Volta Lake Research Project Phase II in 1969. Subsequently and until 1977, it averaged 38 500 tonnes/year (Figure 59 and Appendix 2, Table A2.1). In 1996, De Graaf and Ofori-Danson estimated the catch of stratum VII alone through stratified random sampling of gillnets and winch boats at 33 800 tonnes. They therefore concluded that the previously used production estimate of 44 000 tonnes/year for the whole reservoir was an underestimate. They concluded from their findings that the total production of the reservoir was most likely 150 000–200 000 tonnes/year (180–240 kg/ha) with a total annual value of US$30 million. Other unpublished catch estimates based on reservoir-wide catch assessment surveys and frame surveys proposed an annual production of 251 000 tonnes for 2000 (Braimah, 2000, 2001, 2003 in Béné, 2007). Another estimate for the same year amounted to 271 000 tonnes (De Graaf and Ofori-Danson, 1997).
Rough estimates based on annual catch rates per fisher at the 1998 level of effort (see Table 24) range from 110 000 to 271 000 tonnes, with a median of 130 000 tonnes. Even the lowest estimate based on data from Braimah (1995) of 0.7 tonnes per fisher would lead to an annual catch of 50 500 tonnes. Using the same catch rate data, but multiplied by the number of canoes, resulted in a total production of 70 000–181 000 tonnes (median 81 000 tonnes). In sum, catch estimates of Lake Volta’s fishery at present range from 40 000 to 271 000 tonnes. Within this broad range of estimates there is no consensus regarding the most probable range in production, although based on the previous analyses it is likely to be much higher than the catches reported by the Fisheries Directorate. Production figures are at least much higher than 100 000 tonnes. This upward revision of the catch estimates of Lake Volta confirms the emerging evidence that catches from many inland fisheries are severely underestimated (FAO, 2003; Kolding and van Zwieten, 2006, Mius et al. 2011).
Bamboo (5, n=11)Longline 3 (4, n=16)
Ripp.hook (10, n=4)Liftbasket (6, n=6)Palmtrap (6, n=5)
Longline 1 (19, n=18)
Tilapia trap (9, n=1)Beachseine (43, n=19)
Gillnet 4"+ (19, n=29)
Gillnet 3" (45, n=48)Gillnet 2" (56, n=102)
Nifa-nifa (11, n=1)
Winch-manual 19, n=(7)Castnet (31, n=10)
Winch-engine (39, n=22)
Longline 2 (6, n=3)Acadja (13, n=6)
Gillnet 1" (22, n=11)Driftnet (26, n=11)
Pellonula seine (14, n=6)Mosquitoseine (5, n=5)
1 2 3Habitat
Ripp.hook (10, n=4)Longline 1 (19, n=18)
Gillnet 3" (45, n=48)Beachseine (43, n=19)
Winch-manual 19, n=(7)Acadja (13, n=6)
Tilapia trap (9, n=1)Nifa-nifa (11, n=1)
Longline 3 (4, n=16)Bamboo (5, n=11)
Longline 2 (6, n=3)Palmtrap (6, n=5)
Gillnet 2" (56, n=102)Castnet (31, n=10)
Winch-engine (39, n=22)Gillnet 4"+ (19, n=29)
Driftnet (26, n=11)Gillnet 1" (22, n=11)
Pellonula seine (14, n=6)Liftbasket (6, n=6)
Mosquitoseine (5, n=5)
2.0
2.5
3.0
3.5
4.0
Resilience
Book 1.indb 107 12/29/11 1:16 PM

Review of tropical reservoirs and their fisheries108
The total annual production of the reservoir could fluctuate greatly as a result of high annual variability in the area flooded by the annual increases in discharge. As the dominant fishing methods generally target fish that are between one and four years old, fishery production will reflect recruitment variability caused by the variable annual floods. Despite – or perhaps because of – this high uncertainty, many documents claim that the resources of the reservoir are overexploited. The claims of overfishing are consistently made using both the high and the low estimates of total production, thereby constituting one of the few constants in the information around the Lake Volta fishery. The cause of the large decrease in landings after 1969 and the equally large, but more gradual, increase from 1996 onwards remains unexplained (Figure 59), although the former could have reflected the initial peak productivity period generally observed in newly inundated reservoirs. Béné (2007) conjectures that a reverse correlation may exist between the water level and landings in an interannual time frame. This hypothesis remains to be tested, however. The large changes in landings could also reflect changes or heterogeneity in statistical recording.
The catch estimate by minor stratum in 2000 based on a limited data set suggests that the largest proportion of the catch is taken from stratum VII (38 percent), followed by stratum V (21 percent) and stratum VIII (13 percent) (Figure 60). All three strata
1965 1970 1975 1980 1985 1990 1995 2000 20050
20 000
40 000
60 000
80 000
100 000
Land
ings
(to
nnes
)
0
100 000
200 000
300 000
Land
ings
(to
nnes
)
Reported Fisheries Directorate Other estimates
FIGURE 59Estimates of total catch from Lake Volta
Note: The left axis shows catch estimates from the Fisheries Directorate, and right axis shows other estimates (see Table A1.1 and text).
FIGURE 60Total weight of fish landed from Lake Volta, by stratum, in 2000
Source: Unpublished data from the Fisheries Directorate.
Book 1.indb 108 12/29/11 1:16 PM

Lake Volta, Ghana 109
are in the northern part of the reservoir, where the Volta Rivers merge. This means that the highest production is taken from areas that have the typical characteristics of a productive riverine floodplain.
4.5.6 Developments in composition of landingsChanges can be expected in catch composition resulting from changes in the composition of the fish community and the biomass of the different target species, as consequences of three interacting processes: (i) natural succession of species after the impoundment of the Volta River; (ii) decadal and long-term trends in water levels driven by climate variation and water management; and (iii) fishing pressure. Although the largest changes in fish community composition can be expected in the first decade after impoundment, succession may still play a role in the observed changes, in particular when combined with climatic changes and associated changes in water level, as observed in Lake Kariba (Kolding, Musando and Songore, 2003). Water levels show a general decreasing trend following impoundment, both as a result of climate and management, albeit with large decadal variations. How fishing pressure interacts with, and contributes to, these directional changes and with annual and decadal fluctuations depends on the size ranges, trophic levels and spatial ranges of the fish community.
For example, if fishers target specific size classes, they exert a directional influence on the trophic interactions within the fish community through the selective removal of these size classes. In the previous paragraphs, it was argued that Lake Volta fishers probably exploit all trophic levels and a wide range of spatial habitats. Judging from the wide range of gear and mesh sizes used, the available information (presented in Figures 56 and 57) and anecdotal information (Goudswaard, unpublished reports), a wide range of sizes in the catch can also be expected. A tendency for large individuals and species to disappear from the fisheries has been widely recorded from many rivers and lakes, irrespective of fishing strategy (Welcomme, 1999, 2001), but no direct information that this has occurred on Lake Volta is available. Large individuals are still present in the fishery (Figure 56), although, as will be shown with catch developments by category, a shift to smaller specimens in catch is probably taking place (Figure 61).
FIGURE 61Relative changes in catch composition from Lake Volta at Dzemeni and Kpando markets
(southern section of the reservoir), 1989–2006
Book 1.indb 109 12/29/11 1:16 PM

Review of tropical reservoirs and their fisheries110
High-resolution time series of catch rates are needed, preferably from experimental surveys using consistent survey design to monitor changes in relative biomass, species composition, length and food web structure. In the absence of such data, catch rates from the fishery can be used as a proxy. However, the only long-term data that are available for Lake Volta are landing estimates from the various markets around the reservoir. If the Lake Volta fishery is indeed an unselective fishery that closely follows and adapts to long-term and short-term changes taking place in the fish communities, the aggregated landings at the markets will reflect these changes in the fish community as a result of the three processes acting on them. If aggregated landings at different markets along the reservoir show the same or similar directional patterns, this would confirm that similar processes are taking place in different parts of the reservoir and that the fishery at least reacts to these processes in the same way. Local differences in species composition may reflect local differences in the availability of species, but probably more important than species per se are the changes in community composition with regard to different aspects such as trophic position, size and behavioural patterns in relation to the flood pulse (migration, habitat utilization, breeding patterns, etc.). Long-term landings data are available for the two markets along the southern part of the reservoir, Dzemeni and Kpando-Tokor. Long-term data on landings exist for other markets, in particular Yeji, but only a few years of data were available for this review. The relative composition of landings changed considerably over the period examined, most notably with the increasing dominance of Chrysichthys species and the decline of tilapia. This is particularly clear for the Dzemeni and Kpando landings (Figure 61), but similar changes seem to have taken place in Yeji (Figure 62). The relative composition of landings at Yeji also shows a large increase in the contribution of Clupeidae (Cynothrissa), but this is less apparent at Dzemeni and Kpando.
FIGURE 62Relative changes in catch composition from Lake Volta at Yeji market
(northern section of the reservoir), 1990–2006
Note: No data for 1991–2002.
Book 1.indb 110 12/29/11 1:16 PM

Lake Volta, Ghana 111
Closer inspection of developments in landings of individual categories reveals that at Dzemeni and Kpando, ten categories show declining trends in landings, two categories (Distichodus, Labeo) remain stable (although with much variation), and three categories (Chrysichthys, Bagrus and Clupeidae) show increasing trends in landings (Figure 63). The available time series data from Yeji are too short, and data gaps are too wide, to make any conclusive statements, but visual inspection of the time series shows patterns that generally do not contradict those of the Dzemeni and Kpando landings (Figure 64). The two series have four categories that are not in common: Gymnarchus (declining trend) and Clarias (stable) at Yeji and Hemichromis (declining) and other (stable) at Kpandu. Five of the remaining 14 categories (Labeo, Alestes, Schilbeidae, Hydrocynus and tilapia) seem to be stable or show declining trends at Yeji, in contrast to the Dzemeni and Kpandu time series. The remaining nine categories at Yeji show trends similar to those in the Dzemeni and Kpandu time series: increasing trends can be inferred for Chrysichthys, Bagrus and Clupeidae, while Distichodus is stable. Five categories (Citharinidae, Mormyridae, Heterotis, Lates and Synodontis) show declining trends.
Similar patterns in fish availability seem to occur in the northern and southern parts of the reservoir. This is confirmed when analysing changes in the overall trophic level of landings at these two sites (Figure 65). The overall trophic level is lower at Yeji than at Dzemeni and Kpando, although over the last few years it has been almost the same. In both cases, a slight increase to just above trophic level 3 is seen. Excluding the two main contributors to the landings, Chrysichthys and tilapias, the trophic level of the landings at the two markets clearly increases over time.
These findings contradict those in marine systems, where fishers worldwide are fishing down the food web, whereby large species that feed at higher trophic levels are
01 1
01 2
01 3
01 4 )67;0.2;1( sudohcitsiD
01 1
01 2
01 3
01 4 )29-74;0.2;3( oebaL
01 1
01 2
01 3
01 4 )17;0.2;1( sunirahtiC
01 1
01 2
01 3
01 4 )56-51;0.3-3.2;4( setselA
01 2
01 3
01 4
01 5 )52-71;9.3-2.3;2( simorhcimeH
01 2
01 3
01 4
01 5 )16-04;5.3;2( eadieblihcS
5002000259910991589101 3
01 4
01 5
01 6 )051-11;6.3-5.2;21( eadirymroM
5002000259910991589101 3
01 4
01 5
01 6 )221;6.2;1( sitoreteH
sn = psn = p
10.0 < pr2 45.0 =
10.0 < pr2 74.0 =
50.0 < pr2 32.0 =
50.0 < pr2 53.0 =
10.0 < pr2 74.0 =
10.0 < pr2 94.0 =
01 1
01 2
01 3
01 4
01 5
01 6 )61-4;3.4-1.3;3( eadiepulC
01 3
01 4
01 5
01 6 )402-8;3.3;71( srehtO
01 3
01 4
01 5
01 6 )002;5.4;1( setaL
01 3
01 4
01 5
01 6 )521-17;0.4;2( surgaB
01 3
01 4
01 5
01 6 )16-22;9.2;8( sitnodonyS
01 4
01 5
01 6
01 7 )19;7.3;2( sunycordyH
5002000259910991589101 4
01 5
01 6
01 7 ) 47-61;1.2;4( aipaliT
5002000259910991589101 4
01 5
01 6
01 7 )68-34;7.3-6.2;3( syhthcisyrhC
10.0 < pr2 14.0 =
100.0 < pr2 65.0 =
100.0 < pr2 18.0 =
50.0 < pr2 92.0 =
100.0 < pr2 28.0 =
100.0 < pr2 18.0 =
50.0 < pr2 26.0 =
sn = p
FIGURE 63Trends in log10-transformed landings (kilograms dry weight) by species group at Dzemeni
and Kpando markets between 1989 and 2008
Note: The figure shows only significant trends (p < 0.05) and the proportion of explained variability (coefficient of determination = r2). In parentheses are, respectively, the number of species, the trophic level and its range, and the maximum observed total length of the species and its range (cm). If variation in trophic level is ≤ 10, the average trophic level is given. Note differences in scale on the y axes.
Book 1.indb 111 12/29/11 1:16 PM
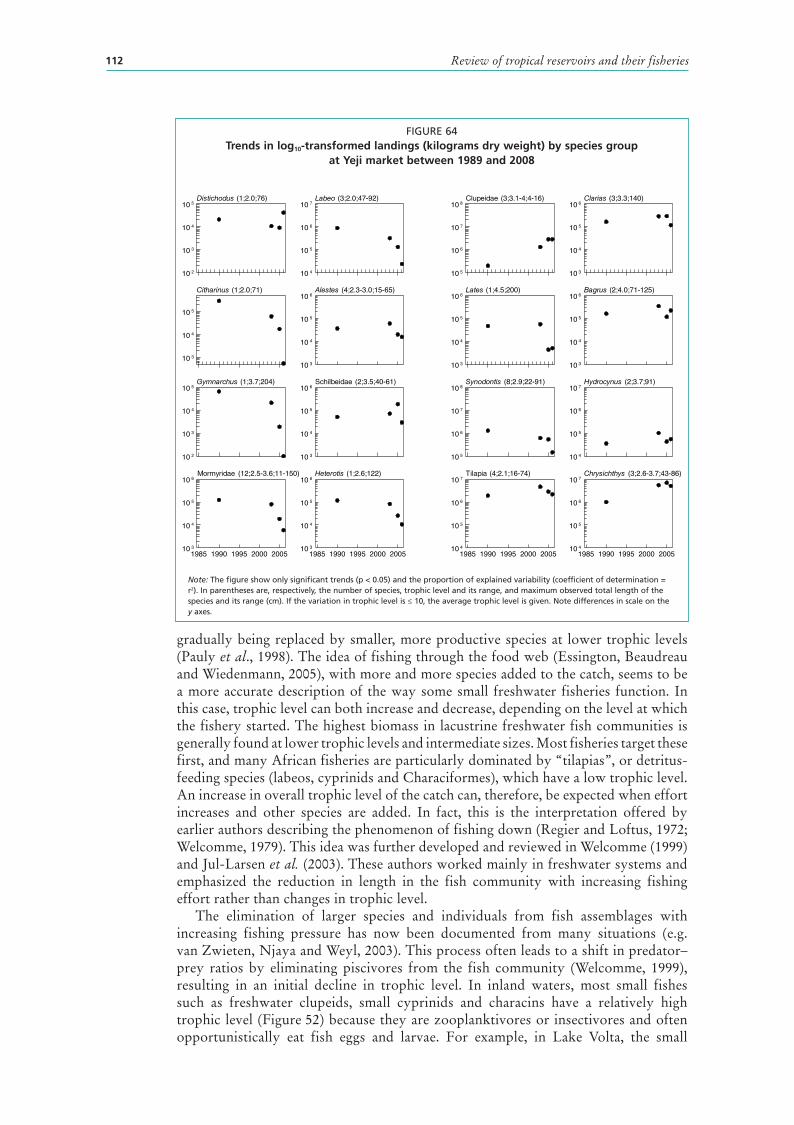
Review of tropical reservoirs and their fisheries112
gradually being replaced by smaller, more productive species at lower trophic levels (Pauly et al., 1998). The idea of fishing through the food web (Essington, Beaudreau and Wiedenmann, 2005), with more and more species added to the catch, seems to be a more accurate description of the way some small freshwater fisheries function. In this case, trophic level can both increase and decrease, depending on the level at which the fishery started. The highest biomass in lacustrine freshwater fish communities is generally found at lower trophic levels and intermediate sizes. Most fisheries target these first, and many African fisheries are particularly dominated by “tilapias”, or detritus-feeding species (labeos, cyprinids and Characiformes), which have a low trophic level. An increase in overall trophic level of the catch can, therefore, be expected when effort increases and other species are added. In fact, this is the interpretation offered by earlier authors describing the phenomenon of fishing down (Regier and Loftus, 1972; Welcomme, 1979). This idea was further developed and reviewed in Welcomme (1999) and Jul-Larsen et al. (2003). These authors worked mainly in freshwater systems and emphasized the reduction in length in the fish community with increasing fishing effort rather than changes in trophic level.
The elimination of larger species and individuals from fish assemblages with increasing fishing pressure has now been documented from many situations (e.g. van Zwieten, Njaya and Weyl, 2003). This process often leads to a shift in predator–prey ratios by eliminating piscivores from the fish community (Welcomme, 1999), resulting in an initial decline in trophic level. In inland waters, most small fishes such as freshwater clupeids, small cyprinids and characins have a relatively high trophic level (Figure 52) because they are zooplanktivores or insectivores and often opportunistically eat fish eggs and larvae. For example, in Lake Volta, the small
01 2
01 3
01 4
01 5 )67;0.2;1( sudohcitsiD
01 4
01 5
01 6
01 7 )29-74;0.2;3( oebaL
01 3
01 4
01 5
)17;0.2;1( sunirahtiC
01 3
01 4
01 5
01 6 )56-51;0.3-3.2;4( setselA
01 2
01 3
01 4
01 5 )402;7.3;1( suhcranmyG
01 3
01 4
01 5
01 6 )16-04;5.3;2( eadieblihcS
5002000259910991589101 3
01 4
01 5
01 6 )051-11;6.3-5.2;21( eadirymroM
5002000259910991589101 3
01 4
01 5
01 6 )221;6.2;1( sitoreteH
01 5
01 6
01 7
01 8 )61-4;4-1.3;3( eadiepulC
01 3
01 4
01 5
01 6 )041;3.3;3( sairalC
01 3
01 4
01 5
01 6 )002;5.4;1( setaL
01 3
01 4
01 5
01 6 )521-17;0.4;2( surgaB
01 5
01 6
01 7
01 8 )19-22;9.2;8( sitnodonyS
01 4
01 5
01 6
01 7 )19;7.3;2( sunycordyH
5002000259910991589101 4
01 5
01 6
01 7 )47-61;1.2;4( aipaliT
5002000259910991589101 4
01 5
01 6
01 7 )68-34;7.3-6.2;3( syhthcisyrhC
FIGURE 64Trends in log10-transformed landings (kilograms dry weight) by species group
at Yeji market between 1989 and 2008
Note: The figure show only significant trends (p < 0.05) and the proportion of explained variability (coefficient of determination = r2). In parentheses are, respectively, the number of species, trophic level and its range, and maximum observed total length of the species and its range (cm). If the variation in trophic level is ≤ 10, the average trophic level is given. Note differences in scale on the y axes.
Book 1.indb 112 12/29/11 1:16 PM

Lake Volta, Ghana 113
clupeid Odaxothrissa mento feeds on fish, while Sierrathrissa leonensis feeds on zooplankton and insects (E. Abban, personal communications, 2009). The length-based process is therefore expected to force the fish assemblage in the direction of these small species, as opposed to towards the detritus and phytoplankton feeders, which are usually larger, giving rise to the apparent reversal in fishing down the food web. Whether such a fishing down process has taken place cannot be fully ascertained owing to limited category resolution in the catch data. Present catches of demersal fish are dominated by specimens of < 35 cm (Figure 56). Categories of larger fish such as Citharinus, Heterotis, Lates and Hydrocynus indeed show decreasing catch trends, while small clupeids have increased. Other categories are more difficult to interpret, as they include catches of species that can attain a wide range of maximum lengths, but it can be expected that large Mormyridae and Alestidae are also susceptible to increased fishing pressure, so decreasing catches of these groups may indicate such trends as well. On the other hand, catches of Bagridae, which can become quite large,
FIGURE 65Mean trophic levels of landings and the FiB index
Note: Mean trophic level (TL) of the landings at Dzemeni and Kpando markets (south) and at Yeji market (north) and the mean TL of the landings at both markets, excluding Chrysichthys and tilapia. Fishing-in-balance (FiB) index calculated from the total catch in a year and the mean TL of the catch in that year, both of total catches and catches excluding Chrysichthys and tilapia. The trophic efficiency is set at 0.1. Changes in the FiB index are relative to 1989 in the south and 1990 in the north. The continuous line is the three-year moving average relative water level.
Book 1.indb 113 12/29/11 1:16 PM

Review of tropical reservoirs and their fisheries114
are increasing. Whether the increase in Chrysichthys indicates a shift from the larger C. nigrodigitatus to the smaller C. auratus is not clear. However, a shift in targeting species that attain smaller sizes is indeed taking place in Lake Volta and is consistent with the generally observed pattern that fishers are reducing their mesh sizes (Dankwa, personal communication).
The FiB index (Pauly and Watson, 2005) is defined as: FiBk = log[Yk .(TE-1)TL
k] – log[Y0. (TE-1)TL0]
where Y = yield, TL = trophic level, and TE = transfer efficiency, here set at 0.1. The subscripts refer to the year k counted from the baseline year 0. This index reveals whether changes in trophic level are associated with proportional increases in catch related to abundance at different trophic levels (FiB = 0). Figure 65 (bottom) indicates that for Dzemeni and Kpando the FiB index initially fell in the early 1990s. After 1994, it increased to a level > 0 and steeply increased after 2001. After 2005, it fell again slightly. The FiB index for the Yeji area shows a similar pattern. This indicates that bottom-up effects – in other words, nutrient-driven effects – are increasingly dominant in the fishery. Further spatial expansion of the fishery became unlikely as the nearshore, benthic and pelagic areas of the reservoir became fully utilized (over the period). However, it appears that tilapia (Oreochromis, Sarotherodon and tilapia species) and Chrysichthys catches are dominant in driving the observed increase in the FiB pattern. When they are excluded, the FiB index now fluctuates around 0, indicating a balanced fishery where changes in trophic level are met by appropriate catch levels at the trophic level targeted. Both Chrysichthys and tilapia species groups are low trophic-level categories, which points to a fishery that is increasingly reliant on, and adapts itself to, the bottom-up processes that drive these catch categories and, therefore, is increasingly reliant on the flooding regime. That long-term changes in water level may partly drive these processes is suggested by Figure 65, in which the FiB index may be negatively correlated with average water levels over longer periods of generally increasing or decreasing water levels, indicated by the three-year moving averages.
4.5.7 Effect of water level on fish productionThree processes that operate at different temporal and spatial scales affect fish catches that respond to changes in water level:
or rising water levels and the associated changes in reservoir area and volume. This change in catchability will be observed almost immediately in the catch rates of a specific fishery, with a short lag of one to two months (fishers may also adapt by changing the types of fishing gear they use).
size of the change in water levels, both as results of changing nutrient inputs from the flood pulse and of the area of the ecotone or floodplain inundating or drying up. Changes in the size of the flood pulse will result in changes in recruitment, which will be observed with a lag of one to several years (up to four) in the catch depending on the size range caught in the fishery and the growth rate of the species.
long-term climatic variability brings long-term trends in reservoir water volume or area overall. This will bring changes in community composition depending on the direction of the change and the form of the reservoir basin. These last changes are confounded by the expected natural succession in the fish community. Lake Volta has large areas of relatively shallow inundated plains combined with the deep gorge of the original river, and it can be expected that fish communities may change between those adapted more to
Book 1.indb 114 12/29/11 1:16 PM

Lake Volta, Ghana 115
riverine and floodplain (lotic) conditions or those adapted more to lake-like (lentic) conditions.
Floodplain characteristics in fisheries as described in the flood pulse concept (Junk, Bayley and Sparks, 1989), with its seasonal growth and seasonal reproduction related to water level, are generally recognized as typical for reservoirs such as Lake Volta. However, limited analysis has been carried out on the short-term and long-term effects of the seasonal fluctuations of the water level. De Graaf and Ofori-Danson (1997) correlated total daily catch rates of the fishery in stratum VII with water levels and the number of canoes. They concluded that catch rates correlate positively with water levels with some time lag and negatively with the number of canoes. Although it is not clear at what temporal scale the analysis was done, it was most probably on a monthly scale (their graph shows daily catch rates and water levels, but an earlier analysis of effort shows monthly totals in number of canoes, while no sample size of any of the variables is given). Given the above information, their analysis shows the effect of changes in catchability and local effects of changes in effort (process 1).
A similar process of seasonal changes in catchability has been noted by Braimah (1995). He observed that fish catches were high when water levels were low and vice versa (Figure 66) – based on water level fluctuations and monthly commercial fish catches recorded in the Yeji part of the Lake Volta from July 1989 to December 1991. These fluctuations in monthly fish catches in the Yeji part of the reservoir are very much influenced by the tilapia and Chrysichthys catches – when water levels are high, catches for both species groups are low, and vice versa. No information on changes in fishing effort over the same period was given. These seasonal changes in the relative availability of species, and in particular of tilapia and Chrysichthys, may also be inferred by visual inspection of the relative composition of landings as shown in Figure 61, although further analysis is needed to confirm this.
FIGURE 66Reservoir water levels and commercial catches in stratum VII, July 1989–December 1991
Source: Braimah, 1995.
Different parameters of the flood pulse can have different impacts on recruitment levels to the fishery (Welcomme and Halls, 2004). The speed and size of the change in water level can even have divergent effects on availability and accessibility of habitats, as well as recruitment for different species. This analysis used the absolute minimum
Book 1.indb 115 12/29/11 1:16 PM

Review of tropical reservoirs and their fisheries116
and maximum water levels and the degrees of inundation (water level rise in metres over one year) and recession (water level decline in metres over one year) to analyse these impacts on recruitment to the fishery. The absolute maximum and minimum levels signify the total amount of potentially available habitat for spawning, nursing, feeding and growing, while the levels of inundation and recession signify the relative change in availability of habitats during a year (Figure 49). This is better expressed by an inundation index, which indicates annual habitat availability (Figure 50). The impacts on the catches and landings in the fishery can be immediate, i.e. within the same year with no lag. For most species, this would be a result of changed availability of habitats characterized by different levels of accessibility. This corresponds in fact to a change in catchability, although it can be a recruitment effect on fast-growing species that are caught in their first year of growth. Conversely, the impacts can have a lag of one or more years. These are true recruitment effects, i.e. changes in water-level parameters that cause changes in survival and individual and population growth rates. As most fish species recruit to the fishery within one to four years after birth, similar lags of one to four years are expected. This was tested through regression analysis of annual changes in landings on maximum or minimum water levels or seasonal levels of inundation and recession with lags of zero to four years (Table 28).
TABLE 28Regression of annual change in landings in kilogram with changing water level, by species
Species Water-level parameter
No lag Lag 1 year Lag 2 years Lag 3 years Lag 4 years
slope r2 Slope r2 slope r2 slope r2 slope r2
Bagrus Maximum + 0.27*
Chrysichthys Maximum + 0.27*
Heterotis Maximum + 0.21*
Others Maximum + 0.36*
Synodontidae Maximum + 0.32*
Total Maximum + 0.25*
Bagrus Minimum + 0.25*
Chrysichthys Minimum + 0.24*
Others Minimum + 0.24* + 0.31*
Synodontidae Minimum + 0.32*
Alestes recession – 0.37** + 0.31*
Citharinus recession + 0.56*
Hemichromis recession – 0.27* + 0.31*
Heterotis recession + 0.25*
Hydrocynus recession – 0.27*
Labeo recession + 0.45**
Others recession + 0.54*** – 0.39**
Tilapia recession – 0.39** + 0.29* – 0.25*
Total recession + 0.26* – 0.24*Alestes inundation + 0.35**
Citharinidae inundation – 0.58* – 0.51*
Labeo inundation + 0.31* – 0.40* – 0.32* + 0.45**
Mormyridae inundation + 0.26* – 0.35* + 0.31*
Others inundation + 0.25*
Synodontidae inundation + 0.35**
Alestes Inundation index + 0.53*** + 0.44*
Citharinus Inundation index – 0.54*
Labeo Inundation index + 0.53**
Mormyridae Inundation index – 0.23*
Others Inundation index – 0.42**
Synodontidae Inundation index + 0.36*
Tilapia Inundation index + 0.37**
+ = positive slope, – = negative slope, * = significant at 5%, ** = significant at 1%, *** = significant at 0.1%, r2 = coefficient of determination.Note: Annual maximum or minimum water level or the seasonal levels of inundation (maximum this year, minimum last year) and recession (maximum last year, minimum this year) are in metres. Regressions are carried out with lags of zero (level of this year) to four years (level of four years ago). Only significant relations are shown. N = 17 in all cases.
Book 1.indb 116 12/29/11 1:16 PM

Lake Volta, Ghana 117
Positive relations in Table 28 indicate a positive effect of the specific water-level parameter on the catch, in other words on species availability through effects of recruitment, survival and growth. Negative relations are somewhat harder to understand, as higher or more quickly rising water levels would lead to decreased survival and growth in later years and vice versa, which could be the result of species-specific requirements regarding the size and timing of inundation and recession. Mechanisms of the impacts of water levels on species survival and growth may be different on a species-by-species basis; both for positive and negative relations, and final explanations should be on a species (group) or trait basis. The landings data for Dzemeni and Kpando markets are used as a proxy for species availability over years. Virtually all the species show increasing or declining trends over time as a result of succession, fishing or long-term fall in water levels. To disregard these long-term processes and focus on the immediate (or lagged) effect of the water-level parameters on the landings, one needs to consider the variations around the long-term trends, i.e. the change in landings. To achieve this, long-term trends in catches of species were removed through differencing the data, i.e. the landings of yeart-1 were subtracted from the landings of yeart. Absolute maximum water levels positively affected total landings four years after the event. Recessions immediately boosted landings, with greater recessions bringing greater increases in total catches relative to the trend. Two different groups of species contribute to these two different effects, while a third group shows no effect in relation to changes in water levels.
Direct negative effects of the size of recession (no lag) were observed for Alestes, Hemichromis and tilapia, indicating that larger recessions result in lower relative catches of these species in that year and vice versa. Except for Alestes baremoze and A. dentex, these species are nesting or substrate spawners that require swampy or floodplain conditions for reproduction and enter floodplains during inundation. Hemichromis lives in littoral riverine habitats and permanent floodplain lagoons with clear water. This is a nesting substrate spawner that breeds in the early summer. Tilapia zillii is a substrate spawner that prefers shallow, vegetated areas. Fry are common in marginal vegetation, while juveniles are found in the seasonal floodplain. The negative relation with the size of recession may be related to specific fishing methods for these species that target them in shallow waters. Larger areas of this habitat will remain in years with limited recessions. Both Alestes and tilapia are positively related to the inundation index, pointing to an increased relative catch with larger availability of flooded areas. Alestes baremoze performs downstream migrations during floods and recessions, and Alestes landings were positively affected by the size of the inundation (35 percent of the variability explained). Alestidae are open-water spawners and can have huge fluctuations in juvenile abundances depending on the size of the flood pulse, so the immediate effect can be on landings of both adults and young of that year. Recessions have a positive relation to the catch two years later, possibly indicating an effect of increased survival during large recessions and vice versa. In conclusion, landings of these species all increase with increased areas of inundation during a year. Heterotis, a typical floodplain species, can grow quite large, and landings of this species are again affected by the absolute flood levels three to four years earlier.
The second group of species – those affected by the absolute maximum levels four years earlier – are all large catfish such as Chrysichthys, Synodontis and Bagrus. Most of these species can grow large and can live in lakes, swamps and rivers, but prefer muddy and silty substrates. Some of the species are nest builders and require shallow, quiet areas. Synodontids are also positively affected by high minimum water levels, again indicating that these species do well in large, relatively stable, flooded areas. A similar explanation could be given for the Citharinidae, Labeo and Mormyridae. In this group of species, the size of inundation negatively correlates
Book 1.indb 117 12/29/11 1:16 PM

Review of tropical reservoirs and their fisheries118
with the relative size of the landings with a two-to-three-year lag, whereas landings are positively related to the size of recession. The specific life-history requirements of these categories of species apparently demand shorter periods of inundation for their recruitment to be successful. A factor influencing their breeding success may be that a very rapid rise and fall in level negatively affects spawning and nursery areas by stranding or overly deep flooding. Landings of the third group of species, Clupeidae, Lates spp. and Schilbeidae, showed no effects from water levels.
A word of caution regarding the interpretation of these results is that no statistical power analysis was carried out, but it can be expected that statistical power would be low, given the low number of observations and the high uncertainty around landings data. It is also probable that some of the observed significant effects are spurious. Longer time series and comparison between time series from different landing sites would allow more certain conclusions. Interactions between the ecotone and deeper parts of the reservoir, as well as the effects of more upstream areas on lower parts of the reservoir, should also be taken into account. Correlations between catches in different areas could reveal spatial shifts in species composition. It is too early to infer strong predictions from these analyses. However, it is encouraging that the effects of the various water-level parameters can be directly related to market landings and, further, that these effects appear to be logically related to the specific behavioural and life-history requirements of the species considered. It suggests that the aggregated landings at the various markets could be useful for examining and predicting the effects of the flood pulse. It also confirms that the fishers of Lake Volta readily adapt to changing conditions, make use of the flood pulse and efficiently follow changes in fish stocks.
4.6 EXTERNAL FACTORS AFFECTING LAKE VOLTA FISHERY PRODUCTIVITY4.6.1 Demography and sociocultural transformationPrior to the creation of the Lake Volta, the Ewe (specifically, the Battor) people were the dominant fishers on the Volta River. The creation of the reservoir prompted a rush of people to settle around it and the current main ethnic groups, in order of dominance, are the Mafi, Agave, Bakpa, Ga Adangbe, Fante, Battor, Mepe, Tefle, Nehummuru, Ningo, Anlo, Sokpoe and Gonja. The other groups are the Hausa/Gao, Vume and Nzima, who are minorities in the fishing villages. The Battor, Mafi, Agave, Bakpa, Mepe, Tefle, Sokpoe, Anlo and Vume (generally referred to as Ewe) dominate fishing on Lake Volta. They are followed by Ga Adangbe and Fante. This illustrates the way in which the traditional occupants of the river area around the present reservoir are being supplanted by incoming ethnic groups from various regions of Ghana.
In settlements, ethnic groups tend to aggregate in clusters. The organization of clusters seems to depend on fish availability in parts of the reservoir and, therefore, on the water level, as people tend to follow the floods and receding waters. Ewe and some Ga Adangbe build more permanent mud-walled houses, as compared to the temporary straw houses of the Fante that correspond to their higher mobility in search of better fishing grounds. Although the ethnic groups generally live in harmony, conflicts arise over fishing methods (e.g. regarding acadjas). Fisherfolk spend the greater part of their life in fishing villages, with the age of the oldest active fishers varying between 61 and 90 years (STEPRI-WorldFish, unpublished data). However, fisherfolk are generally relatively young. The modal age class for both sexes is 21–30 years (83.3 percent of women and 83.9 percent of men are aged between 10 and 40 years). The average household tends to be large, numbering between 10 and 12. This is often attributed to the labour-intensive nature of fishing and fish processing, for which more hands are needed. Males constitute 54 percent of the entire population. The average population growth rate in the fishing villages is 5.2 percent/year, which is higher than the national average of 3.1 percent/year, probably indicating significant immigration into fishing
Book 1.indb 118 12/29/11 1:16 PM

Lake Volta, Ghana 119
communities. Until recently, the main occupation for fishers was fishing combined with farming and livestock and poultry rearing as supplementary activities. However, with low fish catches per fisher, the latter activities are becoming increasingly important. By the early 1990s, farming had become the most important economic activity in just over 10 percent of fishing villages (Asare and Osei-Bonsu, 1993).
4.6.2 Urbanization and tourismThe 32 major fish markets on Lake Volta are developing quickly, together with high concentrations of human settlements. Like most rural communities in Ghana, fishing villages on Lake Volta lack adequate infrastructure such as good roads, regular transport services, proper waste and sewage disposal systems, and schools. Associated with the fish-marketing centres has been the provision of ferry-crossing points, which facilitate vehicular and passenger mobility. Increased accessibility to market centres has increased demand for services of various kinds, thus initiating and expanding service industries and the jobs they bring in catering, entertainment, accommodation, trade, fishing and farming. Traders concentrate their commercial activities at fish markets and trade in fish, salt, fishing gear, yams, cassava dough and petroleum products. Other major business pursuits include outboard-motor spare parts and repair, boat and canoe construction, hotel accommodation, and abattoirs. Other small businesses are conducted from small shops, kiosks and table tops. Trading in maize, the distilling of local drinks and baking are other commercial activities flourishing at market centres. Fish traders from all the regions patronize the fish markets, and residents of market centres have gradually become less dependent on farming and hunting and increasingly enter into regular paid employment and trading. The centres around the fish markets have relatively little or no proper waste or sewage disposal or toilet facilities, with sewage and waste draining or being washed directly into the reservoir. In some places, such as Dodi Island in stratum II, recreational facilities and a resort have been established. Thousands of visitors visit the island, especially on weekends. Private entrepreneurs plan more resorts at Yeji, Abotoase and Buipe. A large crowd of holidaymakers may cause eutrophication in the reservoir, and there is concern for nearby fishing communities that drink untreated water from the reservoir.
The Government of Ghana plans the establishment of communal fishery centres in the major market centres Lake Volta. One has been completed at Kpando and Torkor, and another at Yeji. The centres provide facilities for landing, handling, processing and marketing fish, as well as stores, workshops, training and social facilities, and are intended to serve the needs of several thousand communities around the reservoir and distant fish traders. Conflicts have arisen over the sharing of revenue among traditional authorities, district assemblies and the management of the centres.
4.6.3 IndustrializationThe northern part of Lake Volta, especially the Buipe area and parts of the Volta Region (e.g. the Aveme area), have deposits of high-quality limestone. While the exploitation of the natural resource is well organized at the Buipe limestone quarry, small local operations in the Aveme area are thought to cause considerable damage. In addition to the limestone factory at Buipe, small entrepreneurs have established mills for cassava, maize and rice all along the reservoir, but highly concentrated in the fish market centres. A few timber merchants have established sawmills in Krachi District. Furniture builders are found in all the market centres. No information has been presented on the potential or actual extent of the impact of these activities on the reservoir environment.
Two major port facilities at Buipe and Akosombo for north–south water transportation have created conditions for the development of bulk storage facilities for fuel, fertilizers and cement for onward redistribution in northern Ghana. Burkina Faso now uses Ghana as its gateway for importing goods and benefits from these new ports. Bulk storage
Book 1.indb 119 12/29/11 1:16 PM

Review of tropical reservoirs and their fisheries120
facilities, however, are thought to create large quantities of waste and spillover into the reservoir. No information has yet been presented detailing the impact on the reservoir.
4.6.4 Lake transportTransportation on Lake Volta is officially managed by the Volta Lake Transport Company. The transport system on the reservoir comprises: (i) a multipurpose bulk-cargo system for transporting commodities other than mineral oil products and a small number of passengers; (ii) a specialized bulk-cargo system for the contract transport of mineral oil products; and (iii) a passenger transport system.
Besides some divergence with the Volta River Authority (VRA), whose primary function is to generate and supply electrical energy for industrial commercial and domestic use in Ghana, when low water levels impede the movement of vessels, conflicts also occur between the Volta Lake Transport Company ferry operations and private transport boats for passengers and cargo across the reservoir. This has implications for fish traders, as they often travel on cargo boats and spontaneous fish markets generally arise at the landing sites of these boats along the reservoir (P.C. Goudswaard, personal communication).
4.6.5 Forestry and reforestationTree cover in the catchment area is thought to reduce wind and water erosion of soil, thereby improving water quality. Under the sponsorship of the VRA, two projects were initiated in 1995 to stimulate reforestation in the reservoir catchment. The Tree Cover Depletion Minimization Project was executed by the Integrated Development of Artisanal Fisheries Project in collaboration with other agencies with the aim of restoring 1 500 ha of tree cover by establishing wooded lots. Under the community collaborative forestry management programme, forest reserves are being established that are to be managed in collaboration with the settler communities in the reserves. A second project has the VRA working in collaboration with the Forestry Services Division of the Forestry Commission to restore 7 000 ha with fast-growing trees to protect the high slopes of the gorge area from erosion and prevent their causing siltation. Conflicts often arise between the VRA and the traditional authorities, which also lay claim to the lands adjoining the reservoir and wish to use the areas for other purposes than forest development.
4.6.6 Agricultural practicesAgricultureThe physical and ecological links between agriculture and fisheries of Lake Volta mainly relate to the intensity of erosion and subsequent siltation of the reservoir and to the use of agricultural fertilizers and pesticides. Major cropping systems in rainfed agriculture are: (i) the cassava–maize system found in deforested and degraded forest areas, in which cassava is intercropped with pepper, tomatoes, okra and nerri (watermelons Citrullus lanatus var. citroides); (ii) the yam–maize–cassava system practised in the disturbed and degraded forest zones, in which yam is intercropped with maize and cassava; and (iii) a rice system practised in lowlands and swampy upland sites.
Farmers have limited ability to take conservation measures to reduce soil erosion, as they use such simple tools as machetes, hoes and fire to clear and prepare land. The scale of soil disturbance may be great in shifting cultivation, as the soils are poor. Conflicts arise between farmers and the VRA, as the latter attempts to replant forests to mitigate siltation problems in the reservoir. Similar conflicts occur with the small irrigation schemes operating near the reservoir.
An important form of agriculture around the Lake Volta uses the land exposed during the seasonal recession of reservoir water level, locally called “drawdown agriculture”. The normal drop in the water level ranges from 2 to 6 m, which offers substantial areas of rich, arable land available for drawdown agriculture. Vanderpuye
Book 1.indb 120 12/29/11 1:16 PM

Lake Volta, Ghana 121
(1984) estimated that a drop of 3.4 m drains at least 80 000 ha of additional land. In recent years, 35 percent of the drawdown area has been almost permanently cultivated under beans, rice, tomatoes, vegetables, okra and groundnuts as a result of the generally lower water levels (Figure 49) (Braimah, 1995).
The increase in the area under agriculture in the uplands and the drawdown area of the reservoir appears to accelerate wind and water erosion. The use of fertilizers and field-burning are thought to affect the reservoir through eutrophication. The use of herbicides and insecticides is known to cause mass fish kills when incorrectly applied, especially in the drawdown area. Fishing with agricultural pesticides used as poison is practised in shallow pools that remain when the water has receded, as well as in small streams. The target species is Heterotis niloticus. Because it is illegal and because there is considerable opposition to the method from many fishers in the area, it tends to be carried out in secret so it may be more common than reported (P.C. Goudswaard, personal communication).
LivestockLivestock production has become important since the late 1980s. Animals reared in the catchment area are cattle, sheep, goats, pigs and poultry. Most livestock are free range and kept by herders who do not practise supplementary feeding. Large herds of cattle from neighbouring countries, especially Burkina Faso, also use the area around the reservoir. The presence of these cattle herds contributes significantly to the income of traditional authorities through the sale of grazing rights. However, negative aspects are the conflicts that arise between upland settler farmers and herders, and between them and the operators of the tree-planting programmes, as well as with drawdown farmers whose crops are destroyed when cattle approach the reservoir for watering.
WildlifeThe 3 478 km2 Digya National Park was established on the western shore of Lake Volta near stratum IV, along the Sene, Digya and Obosum arms, in September 1971 (Figure 51). Fishing is not allowed at all in the Digya arm, but communities along the Sene and Obosum arms are allowed to fish on the bank bordering the park. Conflicts arise between fishers and hunters on one hand and the Wildlife Services of the Forestry Commission on the other.
4.7 CONCLUDING REMARKSThe information available for this review suggests that the plethora of data that exist on catch, catch rates, landings and reservoir dynamics are severely underused for managing the fisheries. Landings data seem to be used solely to estimate and report the total production of Lake Volta. Production estimates that are based on these landings are underestimated, as indicated by the analysis of catch rates in this review and by past and recent catch assessment and frame surveys. Moreover, in many reports the view is advocated that traditional stock assessment through standard models is all the information needed to manage the fishery, while it is clear and generally acknowledged that effort and landings estimates are not very well suited for making even simple assessments of biomass-dynamic approaches in a fluctuating environment. However, the analysis shows that existing data can be used to assess changes in the fishery. If one recognizes that fishers on Lake Volta target the whole fish community and, to a large extent, follow the ecological changes that arise from long-term and short-term variations in the flood pulse – i.e. fishers react to changes in catch rates that largely result from processes related to the flooding regime of the reservoir, even more than they create them through increased effort – it could be inferred that the landings data actually reflect the changes in the fish community and the availability of fish species. Hence, the landings data can be used to monitor long-term changes in fish
Book 1.indb 121 12/29/11 1:16 PM

Review of tropical reservoirs and their fisheries122
communities in the reservoir, while short-term predictions could be made about the availability of species in relation to flood pulse dynamics. The long-term landings data that are available from several markets are an asset of which better use should be made. In the first place, the landing statistics of the different markets are independent samples from the same reservoir. Careful comparisons among these landing statistics in relation to some of the processes analysed in this review could provide more certainty in interpreting observed trends and reveal differences among various parts of the reservoir. Apart from short-term predictions of landings in relation to the flood pulse, knowledge of the behaviour and life-history of important species could inform local management approaches to fisheries and water levels. This knowledge would inspire management superior to that derived from traditional stock assessments, which do not take into account environmental variations or changes in carrying capacity that dominate the fish community processes in the reservoir.
Attempts at stock assessment in Lake Volta have been useful in so far as their outcomes have pointed to the fact that total production is severely underestimated, which was later confirmed by more detailed observations. However, they also led to the conclusion that the reservoir was severely overfished, as is usually the case with these models. While this cannot be ruled out, it turns out that claims of overfishing have been made over virtually the whole history of in the reservoir fishery, even when catch estimates were at 20 percent of what they are now. This points not only to the failure of these approaches and the inadequacy of the information base gained through species-by-species assessments for managing fisheries, but also to the failure to examine such claims critically. The overfishing discourse that has been adopted by many institutions and policy-makers, both directly and indirectly, and applied to fishery management may result in the marginalization and sometimes the criminalization of fishing communities (Béné, 2007), which are penalized as a direct result of this uncritical approach to fishery management information.
An approach to fishery management that recognizes the highly adaptive capacity of small-scale fisheries on this reservoir and could guide the efficient use of its available productivity would need a different information base. To follow and monitor the situation, a series of indicators needs to be developed that would reflect the dynamic nature of both the reservoir’s productivity and fishers’ reaction to that productivity. This review gives some direction to developing such an approach. Water level plays a central role in the productivity of the reservoir and should be central to fishery management plans. Attention to this dominant driver of the reservoir’s productivity should also direct more scientific attention to the mechanisms of species productivity at different temporal and spatial scales. For example, it should be recognized that Lake Volta is a relatively young reservoir and that the ecological succession of species in the fish communities may still play a dominant role in the observed changes, as has been recorded in Lake Kariba (Kolding, Musando and Songore, 2003). Such succession changes may be confounded with or accelerated by the changing long-term dynamics of water levels, with their overall downward trend, as well as with increasing fishing effort.
These conclusions call for an urgent and comprehensive assessment of the Lake Volta fisheries. A very important part of this assessment should be a careful and thorough reanalysis of the existing long-term but fragmented data sets, including market landings that have been collected over the years and are still being collected. Such an assessment would help identify the information available for fisheries management and guide the choice of the appropriate methodologies for statistical fishery monitoring. It would further directly inform policies on improving the reservoir’s productivity, while maintaining the ecological sustainability of the pulsing heart of Ghana.
REFERENCESAbban, E.K. 1999. Integrated development of artisanal fishes. Integrated Development
of Artisanal Fisheries Project. GHA/93/008 43 pp.
Book 1.indb 122 12/29/11 1:16 PM

Lake Volta, Ghana 123
Andah, W. & Gichuki, F. 2003. Volta Basin Profile: Strategic research for enhancing agricultural water productivity (Draft). International Water Management Institute, Challenge Program on Water and Food, Accra.
Antwi, L.A.K. 1990. Limno-chemistry of Volta Lake 25 years after its formation. Institute of Aquatic Biology Technical Report. 11 pp.
Asare, E.O. & Osei-Bonsu, S.N. 1993. Impact assessment of project on the forest ecosystem. Integrated Development of Artisanal Fisheries Project Technical Report. 136 pp.
Béné, C. 2007. Diagnostic study of the Volta Basin fisheries. Focal Basin Project – Volta. Report No. 1: Overview of the Volta Basin fisheries resources. Penang, Malaysia, WorldFish Center. 32 pp.
Biswas, S. 1966a. Ecological studies of phytoplankton in the newly forming Volta Lake of Ghana. Journal of the West African Science Association, 11: 14–19.
Biswas, S. 1966b. Oxygen and phytoplankton changes in the newly forming Volta Lake in Ghana. Nature, 209(5019): 218–219.
Biswas, S. 1969. Hydrobiology of the Volta River and some of its tributaries before the formation of the Volta Lake. Ghana Journal of Science, 8: 152–166.
Braimah, L.I. 1995. Recent developments in the fisheries of Volta Lake (Ghana). In R.R.M. Crul & F.C. Roest, eds. Current status of fisheries and fish stocks of four largest African reservoirs, pp. 111–134. Committee for Inland Fisheries of Africa Technical Paper No. 30. Rome, FAO. 134 pp.
Braimah, L.I. 2000. Full frame survey at Lake Volta, Ghana – 1998. Fisheries Subsector Capacity Building Project. Integrated Development of Artisanal Fisheries Project, Yeji, Ghana. 196 pp.
Braimah, L.I. 2001. Volta Lake fisheries management plan. Fisheries Subsector Capacity Building Project, Accra.
Braimah, L.I. 2003. Fisheries Management Plan for the Volta Lake, Accra, Ghana. Ministry of Food and Agriculture, Directorate of Fisheries. 77 pp.
Czernin-Chudenitz, C.W. 1971. Volta Lake research, Ghana: physico-chemical conditions of Lake Volta, Ghana. Technical Report No. 1 prepared for the Government of Ghana by FAO as executing agency for UNDP: FISF/GHA 10. Rome, FAO. 77 pp.
Daget, J. 1956. Les eaux et les poissons de Haute-Volta Mem. Institut français d’Afrique noire, 50: 95–169.
Daget, J. 1960. Poissons de la Volta Noire et de la Haute Comoé. Bulletin du Museum National d’Histoire Naturelle, 2e sér., 32(4): 320–330.
Dankwa, H.R., Abban, E.K. & Teugels, G.G. 1999. Freshwater fishes of Ghana: identification, distribution, ecological and economic importance. Annales Sciences Zoologiques, 283: 53.
de Graaf, G.J. & Ofori-Danson, P.K. 1997. Catch and fish stock assessment in stratum VII of Lake Volta. Integrated Development of Artisanal Fisheries Project Technical Report No. 97/I. Rome, FAO. 96 pp.
Denyoh, F.M.K. 1969. Changes in fish populations and gear selectivity in Volta Lake. In L.E. Obeng, ed. Man-made lakes: the Accra symposium, pp. 206–219. Accra, Ghana University Press.
Dickson, K.B. & Benneh, G. 1977. A new geography of Ghana. London, Longman Group. 173 pp.
Entz, B. 1969. Observations on the limno-chemical conditions of the Volta Lake. In L.E. Obeng, ed. Man-made lakes: the Accra symposium, pp. 110–115. Accra, Ghana University Press.
Essington, T.E., Beaudreau, A.H. & Wiedenmann, J. 2005. Fishing through marine food webs. Proceedings of the National Academy of Sciences, 103(9): 3171–3175.
Book 1.indb 123 12/29/11 1:16 PM

Review of tropical reservoirs and their fisheries124
Evans, W. A. & Vanderpuye, J. 1973. Early development of the fish populations and fisheries in Volta Lake. In W.C. Ackerman, G.F. White & E.B. Worthington, eds. Manmade lakes: their problems and environmental effects, pp. 94–100. Washington, DC, American Geophysical Union.
Ewer, D.W. 1966. Biological investigations on Volta Lake, May 1964 to May 1965. In R.H. Lowe-McConnell, ed. Man-made lakes, pp. 21–31. London, Symp. Biol. Inst.
FAO. 1971. Volta Lake Research, Ghana. Physico-chemical conditions of Lake Volta, Ghana. Based on the work of C.W. Czernin-Chudenitz. Technical Report No. 1. FI:SF/GHA 101. Rome.
FAO. 2003. Review of the state of world fishery resources: inland fisheries. FAO Fisheries Circular No. 942. Rome. 60 pp.
Goudswaard, P.C. 1993a. Biometric data on commercial fish species of Lake Volta. Integrated Development of Artisanal Fisheries Project unpublished report. Rome, FAO. 5 pp.
Goudswaard, P.C. 1993b. Catch and effort of commercial fishing methods in Lake Volta. Integrated Development of Artisanal Fisheries Project unpublished report. Rome, FAO. 19 pp.
Goudswaard, P.C. 1993c. Length frequency of processed fishes at the Yeji market, November 1991–December 1992. Integrated Development of Artisanal Fisheries Project unpublished report. Rome, FAO. 14 pp.
Goudswaard, P.C. & Avoke, S.K. 1993a. Fish species in the northern arm of Lake Volta. Integrated Development of Artisanal Fisheries Project unpublished report. Rome, FAO. 19 pp.
Goudswaard, P.C. & Avoke, S.K. 1993b. The Chrysichthys fishery in the northern arm of Lake Volta, Ghana. Integrated Development of Artisanal Fisheries Project unpublished report. Rome, FAO. 15 pp.
Goudswaard, P.C. & Avoke S.K. 1993c. Landing, transporting, trading and recording of processed fish in Yeji market. Integrated Development of Artisanal Fisheries Project unpublished report. Rome, FAO. 12 pp.
Henderson, H.F. & Welcomme, R.L. 1974. The relationship of yield to morpho-edaphic index and numbers of fishermen in African inland fisheries. Rome, FAO. 26 pp.
Irvine, F.R. 1947. The fishes and fisheries of the Gold Coast. London, Crown Agents for the Colonies.
Jul-Larsen, E., Kolding, J., Overa, R., Nielsen, J.R. & van Zwieten, P. 2003. Management, co-management or no management? Major dilemmas in southern African freshwater fisheries. FAO Fisheries Technical Paper No. 426/1. Rome, FAO. 127 pp.
Junk, W.J., Bayley, P.B. & Sparks, R.E. 1989. The flood pulse concept in river-floodplain systems. In D.P. Dodge, ed. Proceedings of the International Large Rivers Symposium, pp. 110–127. Canadian Special Publications of Fisheries and Aquatic Science No. 106.
Kolding, J. & van Zwieten, P. 2006. Improving productivity in tropical lakes and reservoirs. Challenge Programme on Food and Water, Aquatic Ecosystems and Fisheries. Cairo, WorldFish Center. 139 pp.
Kolding, J., Musando, B. & Songore, N. 2003. Inshore fisheries and fish population changes in Lake Kariba. In E. Jul-Larsen, J. Kolding, R. Overa, J.R. Nielsen & P. van Zwieten, eds. Management, co-management or no management? Major dilemmas in southern African freshwater fisheries, pp. 67–101. FAO Fisheries Technical Paper No. 426/1. Rome, FAO. 127 pp
Book 1.indb 124 12/29/11 1:16 PM

Lake Volta, Ghana 125
Kunstmann, H. & Jung, G. 2004. Impact of regional climate change on water availability in the Volta Basin of West Africa. IAHS, Foz do Iguaçu, Brazil, April 2005. IAHS publ. 295. pp. 1–11.
Lévêque, C., Paugy, D. & Teugels, G.G. 1991. Annotated check-list of the freshwater fishes of the Nilo-Sudan river basins, in Africa. Revue Hydrobiologie Tropicale, 24(2): 131–154.
Mills, D.I., West lund, L., de Graaf, G., Willmann, R., Kura, Y. & Kelleher, K. 2011. Under reported and under valued: Small-scale fisheries in the developing world. In: R.S. Poomeroy & N.L. Andrew, eds. Small-scale Fisheries Management: Frame worlds and Approaches for the Developing World, pp. 1-15. CABI, Oxfordshire.
Ministry of Fisheries and Aquaculture (MOFA). 2003. Fisheries Management Plan for the Volta Lake. Accra. 75 pp.
Musick, J.A. 1999. Criteria to define extinction risk in marine fishes: the American Fisheries Society initiative. Fisheries, 24(12): 6–14.
Ntow, W.J. 2003. The limnochemical conditions of the northern portion (Yeji area) of the Volta Lake 30 years after impoundment. Tropical Ecology, 44(2): 263–265.
Obeng-Asamoah, E.K. 1984. A limnological evaluation of Volta Lake. SCOPE/UNDP United Nations Development Programme, Sonderband Heft 55. Hamburg, Germany. pp. 425–435.
Ofori-Danson, P.K. & Antwi, L.A.K. 1994. Limnology of the Volta Lake (Akosombo Gorge area) twenty five years after impoundment. Tropical Ecology, 35(1): 69–82.
Ofori-Danson, P.K. & Ntow, W.J. 2005. Studies on the current state of the limno-chemistry and potential fish yield of Lake Volta (Yeji sector) after three decades of impoundment. Ghana Journal of Agricultural Science, 35: 65–72.
Pauly, D. & Watson, R. 2005. Background and interpretation of the ‘marine trophic index’ as a measure of biodiversity. Philosophical Transactions: Biological Sciences, 360: 415–423.
Pauly, D., Christensen, V. & Walters, C. 2000. Ecopath, ecosim and ecospace as tools for evaluating ecosystem impact of fisheries. ICES Journal of Marine Science, 57: 697–706.
Pauly, D., Christensen, V., Dalsgaard, J., Froese, R. & Torres, Jr., F.J. 1998. Fishing down marine food webs. Science, 279: 860–863.
Petr, T. 1968. Distribution, abundance and food of commercial fish in the Black Volta and the Volta man-made lake in Ghana during its first period of filling (1964–1966). I. Mormyridae. Hydrobiologia, 32: 417–448.
Petr, T. 1973. Distribution, abundance and food of commercial fish in the Black Volta and the Volta man-made lake in Ghana during the filling period (1964–1968). II. Characidae. Hydrobiologia, 45(2–3): 303–337.
Prins, H.P. 1992. Tsakla. Een vissersdorp aan het Volta meer. Verslag van een veldonderzoek naar de leefwijze van de vissers in het noordelijk deel van het Volta-meer in Ghana (West Africa). University of Amsterdam. (MSc thesis)
Rajagopal, P.K. 1969. Preliminary observations on the vertical distribution of plankton in different areas of Volta Lake. In L.E. Obeng, ed. Man-made lakes, the Accra symposium, pp. 123–126. Accra, Ghana University Press.
Regier, H.A. & Loftus, K.H. 1972. Effects of fisheries exploitation on salmonid communities in oligotrophic lakes. Journal of the Fisheries Research Board of Canada, 29(6): 959–968.
Reynolds, J.D. 1973. Biology and fisheries potential of four species of Alestes (pisces Characidae) in the new Volta Lake, Ghana. Revue de zoologie et de botanique africaines, 87: 298–307.
Book 1.indb 125 12/29/11 1:16 PM

Review of tropical reservoirs and their fisheries126
Roberts, T.R. 1967. A provisional check-list of the fresh-water fishes of the Volta basin, with notes on species of possible economic importance. Journal of the West African Science Association, 12(1): 10–18.
Roman, R. 1966. Les poissons des hautes bassins de la Volta. Annales of the Musée Royal d’Afrique Centrale, Ser. 8.
Ryder, R.A. 1965. A method for estimating the potential fish production of north-temperate lakes. Transactions of the American Fisheries Society, 94: 214–218.
Ryder, R.A. 1982. The morphoedaphic index: use, abuse, and fundamental concepts. Transactions of the American Fisheries Society, 111: 154–164.
Talling, J.F. 1963. Origin of stratification in an African rift lake. Limnology and Oceanography, 8: 68–78.
Tanaka, M., Adjadeh, T.A., Tanaka, S. & Sugimura, T. 2002. Water surface area measurement of Lake Volta using SSM/I 37-GHz polarization difference in rainy season. Advances in Space Research, 30: 2501–2504.
van Densen, W.L.T. 2001. On the perception of time trends in resource outcome. Its importance in fisheries co-management, agriculture and whaling. Enschede, The Netherlands, Twente University. 328 pp.
Vanderpuye, C.J. 1984. Synthesis of information on selected African reservoirs – Lake Volta in Ghana. In J.M. Kapetsky, & T. Petr, eds. Status of African reservoir fisheries, pp. 261–321. Rome, FAO. 326 pp.
van Zwieten, P.A.M., Njaya, F. & Weyl, O. 2003. Effort development and the collapse of the fisheries of Lake Malombe: Does environmental variability matter? In E. Jul-Larsen, J. Kolding, R. Overa, J.R. Nielsen & P. van Zwieten. 2003. Management, co-management or no management? Major dilemmas in southern African freshwater fisheries, pp. 134–162. FAO Fisheries Technical Paper No. 426/2. Rome, FAO. 271 pp.
van Zwieten, P.A.M., Sidik, S.A., Noryadi, Suyatna, I. & Abdunnur. 2006. Aquatic food production in the coastal zone: data-based perceptions on the trade-off between mariculture and fisheries production of the Mahakam Delta and Estuary, East Kalimantan, Indonesia. In C.T. Hoanh, T.P. Tuong, J.W. Gowing & B. Hardy, eds. Environment and livelihoods in tropical coastal zones: managing agriculture - fishery - aquaculture conflicts, pp. 219–236. UK, CABI Publishing, in association with the International Rice Research Institute, Philippines, and the International Water Management Institute, Sri Lanka.
Viner, A.B. 1969. Observations of the hydrobiology of the Volta lake, April 1965–April 1966. In L.E. Obeng, ed. Man-made lakes: the Accra symposium, pp. 133–144. Accra, Ghana University Press.
Viner, A.B. 1990. Hydrobiology of Lake Volta: some observations on biological features associated with the morphology and water stratification. Hydrobiologia, 35: 230–248.
Welcomme, R.L. 1972. The inland waters of Africa. Committee for Inland Fisheries of Africa Technical Paper No. 1. Rome, FAO. 117 pp.
Welcomme, R.L. 1979. Fisheries ecology of floodplain rivers. Longman. 317 pp.Welcomme, R.L. 1999. A review of a model for qualitative evaluation of exploitation
levels in multi-species fisheries. Fisheries Ecology and Management, 6: 1–20.Welcomme, R. L. 2001. Inland fisheries, ecology and management. Oxford, UK,
Blackwell Science. Welcomme, R.L. & Halls, A. 2004. Dependence of Tropical River Fisheries on Flow. In
R.L. Welcomme & T. Petr, eds. Proceedings of the Second International Symposium on the Management of Large Rivers for Fisheries, pp. 267–284. Vols. I & II. RAP Publication 2004/17. Bangkok, FAO Regional Office for Asia and the Pacific.
Book 1.indb 126 12/29/11 1:16 PM

127
5. General discussion
5.1 IS FISHING EFFORT DRIVING CATCH RATES OR ARE CATCH RATES DRIVING FISHING EFFORT? Nearly all reservoirs and artificial lakes become less fertile some years after inundation, as the initial supplies of nutrients are washed out or fixed in sediments (Petr, 1975, 1978; Kolding, Musando and Songore, 2003). The chemical composition of freshwater systems is a function of the hydrological regime and the geological nature of the surrounding catchment area. Schindler (1978) found that external nutrient loading explained most of the variance in phytoplankton production in a global lake review. Together, this indicates that lakes and reservoirs do not maintain their fertility unless external loading of nutrients is continually applied, and the hydrological regime is a major regulator for this supply (Kolding, 1994; Kolding and van Zwieten, 2006). Lakes and reservoirs can vary from highly stable systems to highly pulsed, but most reservoirs are at the pulsed end of the spectrum owing to their intimate association with rivers (Jul-Larsen et al., 2003). The more pulsed a system is, in terms of water-level changes relative to the depth of the system, the more the hydrological regime will act as a productivity driver and the less amenable it becomes to traditional fishery control, in which effort is considered the regulator of productivity.
It is still generally assumed, however, that unmanaged open-access fisheries will overshoot the sustainable carrying capacity of the system and eventually undermine productivity, leading to overfishing and possibly fishery collapse. Small-scale African freshwater fisheries are generally unmanaged in the sense that there are very few restrictions on nominal effort or fishing gear that are actually enforced (Jul-Larsen et al., 2003). This situation is generally perceived and interpreted as the main cause for the overfishing that is almost uniformly claimed in all lakes and reservoirs. However, when examining the output of a range of African freshwater fisheries, expressed as annual catch per area, or tonnes per square kilometre – in effect a measure of the productivity of a water body – against the density of operating fishers (numbers per square kilometre), it appears that each fisher catches on average 3 tonnes (range 1–5 tonnes) irrespective of the system in which they fish, indicating a linear relationship between production and effort (Kolding et al., 2008; and Figure 67).
This result suggests that the overall fishing effort (density of fishers) exerted on these systems is regulated by the productivity of the ecosystem through individual catch rates, instead of the other way around (productivity regulated by fishing effort) as usually assumed. Several conditions may lead to this particular situation:
not only choose between different fishing patterns, they may also choose to enter or to leave the fishery depending on the opportunities it offers in relation to other options, as well as the risks involved in fishing per se. In other words, catch rates can be driving fishing effort instead of the other way around, and fishers will, on average, start targeting different species or groups in the fish community or simply leave a fishery when individual catch rates drop below about 3 tonnes.
fishers cannot boost their catch rates to a high level because they cannot invest in more efficient or larger gear, often owing to lack of access to credit.
Book 1.indb 127 12/29/11 1:16 PM

Review of tropical reservoirs and their fisheries128
to increase the efficiency of particular types of gear. This means that the types of gear are chosen based on their efficiency in selectively targeting a particular component of a fish community, but the overall selection by the fish community of all gear taken together reflects the productivity of the various components of that fish community. Fishers go for the highest biomass present in different components of a fish community, which may change seasonally or over the years. This may also explain the high spatial and temporal dynamics in fishing patterns, or choice of fishing methods, often seen in these fisheries.
Preferences exist in species, taste and size (for non-cured fish); but on a per kilogram basis the differences in price are minimal between, say, “chisense”, “Kapenta” and dried “Pale” (Oreochromis) or “Nile perch”. This means that there is no selectivity on sizes and species driven by markets, as there is for example with many North Sea fishes.
FIGURE 67Catch rates and effort density in 15 African lakes and reservoirs
Note: Data are from 1989–1992. The regression line indicates an average annual yield of about 3 tonnes/fisher irrespective of waterbody and country. Superimposed (open circles) is the development in Lake Victoria between 1970 and 2004, which shows how productivity increased over time concurrently with the increase in effort. After an initial boom in production in the late 1980s and early 1990s, the catch rates again approached the overall mean.Source: Kolding et al., 2008.
In situations where these conditions are met, effort will regulate itself through a dynamic range of fishing patterns and through catch rates. It can also be assumed that the productivity of the system will be largely optimized by the same mechanisms, as any decrease in catch rates below the average will drive fishers out of the fishery, unless no other livelihood opportunities exist to reduce the risk of fishing.
The fisheries of Lake Volta and the IGB reservoirs can both be described as effectively open access. However, the resulting dynamics in the utilization of productive capacity appears to be rather different between the two systems, possibly because of differences in the potential “exit” strategies available to the local fishers. There is insufficient information from the reviews to fully support this claim, but there is enough evidence to advance it as a hypothesis that merits further investigation. The Lake Volta fishery, with its average annual catch per fisher of about 2–4 tonnes for all fishing methods, appears to share at least a number of the characteristics listed above. Since 1970, the number of fishers has increased by four times. This development has coincided with
Book 1.indb 128 12/29/11 1:16 PM

General discussion 129
a decrease in average investment per fisher, as indicated by the increase in the number of fishers per vessel. A highly diverse and dynamic fishery has developed, illustrated by the ability of fishers and fishing communities to react quickly through seasonal and spatial reallocation of fishing effort. The result is a wide range of sometimes highly inventive fishing methods that are often applied only seasonally, depending on the availability of target species. The fishing methods used target a range of different trophic levels (Figure 55) and cover a large spatial range (Figure 58). A trading system has developed that is geared towards these dynamics. Multispecies landings at different markets show the same directional patterns in composition, reflecting the general changes in the fish community that probably are a result of separate processes acting on them: nutrient supply (determined by water level); succession; and effort. The landings show that, as effort increases, additions and shifts in the importance of species result in an overall increase in trophic level.
This suggests that the fishery started at lower trophic levels, mainly targeting tilapias, and only later shifted to higher trophic levels, targeting catfishes and pelagic species when the biomass of the species in the early fishery decreased. These adaptations have created a fishery for all trophic levels, which could be an indication that it is becoming unselective at the community level. This is supported by the general increase in the diversity of gear, from an initial gillnet fishery to a multigear fishery at present. Limited information is available on fisher movements in and out of the fishery and the relationship between agriculture and fishing, but it can be expected that fishing is a temporary or complementary occupation for many. No direct information is available on the marketing or pricing of fish, but the markets appear to readily adjust to the changes in species.
The very high efficiency of the Lake Volta fishery is clearly illustrated in Figure 67, where it has the highest productivity of the 15 African lakes and reservoirs compared. Although it also has by far the highest density of fishers, the average catch rate is not below the regression line, which suggests that the productivity is sustainable and is regulating effort, as opposed to the more conventional view that effort drives productivity. Based on this figure alone, there are no indications that Lake Volta is overfished at present and recent size frequencies (Figures 56 and 57) support this notion.
Lake Nasser, on the other hand, is found at the lower end of the productivity range in Figure 67. There are a number of explanations for this. This is probably at least partly the result of Lake Nasser being the northernmost, and therefore seasonally coldest, of the 15 lakes and reservoirs. More important, though, is that: (i) there is no fishery for small pelagics in Lake Nasser; (ii) there are few landing sites; (iii) riparian settlements are few and fishing pressure fairly low; and (iv) a black market is estimated to subtract about 50 percent of the catch from the official landings. Still, it is interesting that Lake Nasser is considered overfished by the local management institutions, largely owing to the decrease in official landings, although they are strongly biased by smuggling. No other objective criteria support the notion that Lake Nasser is being overfished. As with other reservoirs, productivity correlates with changes in water level, which is a proxy for nutrient inputs (Figures 43 and 44).
When examining the large database on productivity and fishing effort for numerous reservoirs in the IGB, two things are striking: (i) the average productivity for these small, shallow waterbodies is extremely low; and (ii) the ratios between effort and fish productivity (kilograms per hectare) were less than one, indicating on average a falling marginal outcome per fisher with increasing productivity (see Figure 16). Although the data should be treated with caution, this lack of correlation suggests that fishing effort is determined by factors other than the productivity or the catch rates of the reservoir, which is the opposite of the case with African freshwater fisheries (Figure 67). In addition, no redistribution of fishing effort to reservoirs of higher productivity or to other income-generating activities seems to take place. Some of
Book 1.indb 129 12/29/11 1:16 PM

Review of tropical reservoirs and their fisheries130
the management arrangements that could lead to this perhaps distorted relationship between productivity and effort densities have been described in the review. In earlier years, reservoir fishers were assisted with loans and subsidies, enhancement programmes, market interventions (e.g. fish pricing), crop-sharing schemes and licences issued either free or for a nominal fee, perhaps because they were perceived as one of the least organized and least productive groups in society. Reservoir fisheries in the IGB states often seem to serve as a safety-net option, where only limited opportunities for alternative employment exist (Paul and Sugunan, 1990). However, this situation has been found to be detrimental to the ecosystems and the exploited resource and is now presented as counterproductive to conservation and yield optimization. Although this scenario is largely associated with what are thought to be open-access situations, this system is not open access but highly regulated through some of the interventions listed above. It may, therefore, be more accurate to say that the absence of other income-generating opportunities is the major cause of low productivity. Therefore, the large variations in catch rates in Indian reservoirs, where fishers catch on average between 0.1 and 4 tonnes/year, possibly reflect different fishing arrangements for these reservoirs. There is indeed a wide range of different management systems adopted by the states, ranging from outright auctioning to almost free fishing, and it would be interesting to find out if and how such arrangements lead to the anomalously low productivity per fisher of these reservoirs, for which no other clear explanation exists.
5.2 PRODUCTIVITY OF RESERVOIRSGeneralizing about capture fishery production per water surface area is difficult because catch data are lacking or unreliable and, surprisingly, because of the paucity of data on water surface area in many countries. Productive reservoir fisheries have developed in small reservoirs in Africa with annual yields of up to 329 kg/ha, in Latin America and the Caribbean with annual yields of up to 125 kg/ha, and in Asia with annual yields of up to 650 kg/ha (FAO, 2002). By comparison, the estimated productivity of all Indian reservoirs, ranging from 11 to 46 kg/ha, as well as the Lake Nasser estimate of 36.4 kg/ha, are extremely low. In contrast, the productivity of Lake Volta, assuming a catch of 250 000 tonnes and an area of 8 500 km2, is high at 294 kg/ha. Even when the official (and most likely underestimated) landings statistics are used, the reservoir would still be producing 51–88 kg/ha. Therefore, the low productivity observed in Lake Nasser and the IGB may simply reflect underreported catches, as with many other inland fisheries. Even so, if one assumes that the landings reported from Lake Nasser represent only 50 percent of the total catch, production per hectare would still be only about 73 kg/ha, which is comparable with low-productivity reservoirs in China (79 kg/ha), Thailand (74 kg/ha) and Indonesia (64 kg/ha). The productivity of Lake Nasser may, therefore, indicate underutilization of available resources, in addition to the lack of an open-water pelagic fishery, as described earlier.
It is difficult to compare directly data on a yield-per-hectare basis, as yield is not proportionally related to lake or reservoir size. A direct comparison between the productivity of the various lakes and reservoirs is possible, using annual yields of a hypothetical 1 000 ha lake based on log-log regressions of yield and lake area (Figure 68). This type of analysis, based on a selection of waterbodies for which information is available (Kolding and van Zwieten, 2006), provides estimates of annual average yields in Asia of 365 kg/ha for Philippine lakes, 239 kg/ha for Sri Lankan reservoirs, 79 kg/ha for Chinese reservoirs, 74 kg/ha for Thai reservoirs and 65 kg/ha for Indonesian reservoirs (Van Densen et al., 1999). Similar regressions for South American reservoirs suggest annual yields for a 1 000 ha reservoir of 144 kg/ha for Cuba and of 234 kg/ha for Mexico. By comparison, a hypothetical African lake of 1 000 ha would produce 168 kg/ha. Note from these figures that only in the case of the Philippines would the catch increase proportionally with the size of the waterbody;
Book 1.indb 130 12/29/11 1:16 PM

General discussion 131
for the rest, the slope is less than one. However, for a set of small reservoirs in South America, including very small ponds and reservoirs with high stocking densities, there is a significant increase in yield per unit area with waterbody size (Kolding and van Zwieten, 2006). Generally, however, in Africa, China, Cuba and Thailand, measures of catch per unit area decrease significantly with increase in lake or reservoir area. Medium-sized Sri Lankan reservoirs are highly productive, with annual catches sometimes reaching well above 200 kg/ha.
FIGURE 68Comparison of productivity of selected lakes and reservoirs
Note and sources: (A) Plot of total yield in kilograms on surface area in hectares for (1, open squares) 83 reservoirs in China of 9–10 824 ha (De Silva, Lin and Tang, 1992); (2, crosses) 20 reservoirs in Thailand (1 280–41 000 ha); (3, dots) 19 reservoirs in Sri Lanka (225–7 825 ha); (4, triangles) 17 Philippine lakes (206–90 000 ha, including Laguna de Bay) (Moreau and De Silva, 1991) and (5, open circles) 9 reservoirs in Indonesia (Hardjamulia and Suwignyo, 1988) (referred to in and plot redrawn from van Densen et al., 1999). (B) Plot of total yield on surface area for (1, open squares) 86 reservoirs in Cuba (5–7 945 ha); (2, crosses) 7 reservoirs in Mexico (5 200–96 000 ha); (3, open circles) 31 small reservoirs in Brazil, 1 in Peru, 1 in Costa Rica, 4 in others (0.016–0.07 ha) (data from Quirós, 1998). (C) Plot of total catch on surface area for 19 African lakes and reservoirs (11 300–6 880 000 ha) (data from van den Bossche and Bernacsek, 1990; Bayley, 1988; Kolding and van Zwieten, 2006). (D) Plot of total yield on surface area for reservoirs in Madhya Pradesh (27), Rajasthan (20), Uttar Pradesh (4), Himachal Pradesh (2) and Bihar (33) (data from Sugunan, 1995). All regressions are according to: log10 Yij = log10 a + b. log10 Si + ij, where Yij = total yield (kg), Si= area (ha), log a = intercept and b = slope. SE = the standard error, r2 = proportion of explained variation, *** = p < 0.001. No regression was made for the reservoirs in Rajasthan as the data appear to be calculated through a model and not based on observations. A, B and C adapted and updated from Kolding and van Zwieten (2006).
The catches from smaller tropical Southeast Asian reservoirs are generally dominated by the introduced tilapia, which is self-sustaining without supplementary stocking.
Following a similar analysis, a hypothetical 1 000 ha IGB reservoir would yield a low average of 20 kg/ha. This is anomalously low and seems to be far below the theoretical potential yield. It is not clear from either the present review or the general literature what causes this low productivity in reservoirs of the IGB.
The general explanation is based on the “the lack of understanding of reservoir ecology, trophic dynamics, inadequate stocking, wrong selection of species for stocking, small size of stocking materials and ‘irrational’ exploitation” (CIFRI, 2006), which apparently characterize many reservoirs in the IGB. To these potential reasons could be added the impacts of hydrological regimes for electricity generation or irrigation that may not fit species requirements for habitat and spawning, as well as the management regimes regulating fishing effort and fishing patterns as described above. Whatever the cause, these different hypotheses indicate a need for a more thorough
Book 1.indb 131 12/29/11 1:16 PM

Review of tropical reservoirs and their fisheries132
study of these reservoirs, recognizing that the causes may not be wholly ecological but related to overall effort as well as the management regime. It is clear that the theoretical potential for improvement is very high.
5.3 TOWARDS INDICATOR-BASED MANAGEMENTConsiderable quantities of data and information have been compiled for this review and an attempt has been made to summarize them. In all three case studies, the review reveals that information from different disciplines has rarely been integrated into a consistent framework useful for fishery management. Overall, the available information fails to explain the low productivity observed in the IGB reservoirs and Lake Nasser. In both cases, many data from a range of studies are available, although rarely synthesized. Yet all these fragmented, short-term, piecemeal studies do not allow good analysis and comprehension of the main drivers and changes in states that were observed in these systems. In fact, all these data, when considered separately or compiled as mere descriptions, may even lead to an information overload that prevents meaningful analyses. To allow the emergence of patterns through data analysis, a historical perspective is required. Ordering data in time series is an essential and necessary step towards assessing changes in relation to fisheries, fish communities and productivity. This essential step in understanding system drivers and pressures on fish stocks and fish communities, and in framing the processes examined into observed patterns, proved to be an almost insurmountable task in all three case studies.
The process of gathering information appears to be informed by institutional preconceptions as to the underlying mechanisms. Typical of these is the “effort drives catch rates” preconception in the cases of Lakes Nasser and Volta, or “nutrients drive fish production” in the case of the IGB reservoirs. Gathering data and managing information, therefore, focused on achieving better knowledge in relation to the preconceived notions, such as catch and effort through single-species stock assessments in the case of Lakes Nasser and Volta, and of fish production by stocking and enhancement through establishing the limnologically determined productive capacity of reservoirs in the case of the IGB reservoirs. Other information not included in the institutionalized paradigm, but possibly relevant to explaining the behaviour of fish communities, ecosystems and users of the reservoirs were, unfortunately, considered extraneous. For example, it is quite revealing that very few data are available on fishing effort, stocking levels or catch for virtually all the IGB reservoirs examined. Judging from the available literature, these types of variables do not seem to be considered important information for management. At the same time, detailed information is available on a range of physical, limnochemical and limnological properties of all reservoirs. By contrast, in Lake Volta, where the maintenance of catch and effort data collection is problematic, this limitation is considered a real hindrance to assessing the state of the fishery. Meanwhile, the most important physical feature of the Volta system – the enormous annual changes in reservoir area – is a factor that has a great impact on its productivity, but is largely ignored by the management and research institutions. In the case of Lake Nasser, it has been noted that, since the 1970s, fishery research has largely focused on limnology and fish biology, even though this research has rarely been used to guide management decisions. For a long time, the management focus appeared to be on the output (catch) and not so much on the input (effort), although this seems to have changed more recently, as there is now a perceived need to assess the stocks in the reservoir in order to optimize production. Research on fish biology and limnology concentrates on separate and isolated states and processes at different ecosystem levels – nutrients, algae, zooplankton and fish – which are all studied separately and with limited recognition of states and flows at other levels. There is, however, limited focus on such main external drivers of the ecosystem behaviour of Lake Nasser as long-term, gradual changes through sediment input and
Book 1.indb 132 12/29/11 1:16 PM

General discussion 133
seasonal changes in fluctuations in water levels, both of which can be expected to have a strong influence on fish community change and ecological succession.
Any attempt to account for both the full range and size of species caught in a reservoir or lake, as well as the full range of gear catching them, and to relate this information to external drivers of nutrients and productivity, such as water levels, requires complex information. This requirement to present large quantities of information in an informative way is addressed by indicator approaches now being developed in the context of ecosystem approaches to fisheries management (e.g. Cury and Christensen, 2005). The use of indicators has the advantage of making a direct link between drivers (e.g. water level, and climate affecting temperature and nutrient inputs), states (e.g. species abundance and catch rates) and pressures (e.g. fishing effort and catch), something that is often lacking in current stock-assessment models in fisheries management. In all three cases examined in this report, an examination of the time series of relevant information on ecosystem drivers, fish stocks and fish community states, as well as human-use pressures (effort, catch and stock enhancement), would offer a better understanding of the system and a longer-term perspective on the validity and outcomes of management approaches. This approach would assist in identifying fishery-management and ecosystem-management problems and in setting appropriate and realistic goals and quantified objectives for management. In addition, it would allow evaluation of the effectiveness of management measures and development initiatives. Last but not least, a time series approach to information could be a vehicle to direct management-relevant, process-based research with regard to both biological processes and the social and economic aspects of the productive use of the reservoirs.
This review is a first attempt to systematically compile and consolidate the available data over as long a time frame as possible. In all cases, it is clear that there is a great need to establish or maintain good catch and effort data-recording systems, i.e. recording both the output of and the input to the fishery, without which any evaluation of developments in the fishery and its productive capacity is virtually impossible. All three case studies confirm that analyses of productivity and productivity changes are severely limited by this lack of data and/or their unreliability. Calculating estimated yield capacity on the basis of primary production and related approaches, as is done in the IGB reservoirs, is merely a theoretical first-step exercise and cannot replace the actual monitoring of catch, stock enhancement and effort data to assess the effectiveness of biological management. A following step would be selecting indicators that cover the physical environment, primary and secondary biological levels, fish faunal composition, life-histories and abundance of the resources, and fishery dynamics in terms of yields, effort and catch rates, economics, and management.7 Together, these indicators should represent and illustrate a comprehensive picture of the present status and the past trends and changes of a reservoir ecosystem and its fisheries based on the best data available. Only when these data are viewed in combination will it be possible to derive an evidence-based understanding of the main processes that drive changes in productivity in reservoir ecosystems. In other words, there is a need for a phenomenological understanding of the system dynamics based on empirical observations, next to and in association with more theoretical and process-based approaches that aim at forecasting. This will be an iterative process where present understanding and needs will drive the choice of indicators. Through repeated evaluation of the changes monitored through the set of chosen indicators, a more comprehensive understanding of the emerging properties of the dynamics of the ecosystem will be possible (Kolding et al., 2008).
7 The reader may refer to recent literature on methodologies of selecting indicators for management within a predetermined framework (e.g. Rice and Rochet, 2005; Degnbol and Jarre, 2004; Shin et al., 2005; Choi et al., 2005), while van Zwieten et al. (2005) give an example of the development and use of such frameworks.
Book 1.indb 133 12/29/11 1:16 PM

Review of tropical reservoirs and their fisheries134
Compiling information through indicators in regularly updated state-of-the-system reports would consolidate the information base for understanding these dynamics. These reports would help in steering monitoring programmes to collect information on all relevant levels of ecosystem behaviour as well as specific management questions for which detailed, process-based research may be necessary. In contrast to the more traditional approaches to management, which generally focus on only one driver (effort or nutrients), the broader, more systemic or holistic analyses would allow regularly updated assessments of the relative impacts of multiple drivers and pressures on the regime, the productivity of fish communities in the system, and an evaluation of the success of management in the light of the different drivers and pressures. In summary, all three case studies in this review have illustrated a serious mismatch between short-term academic, reductionist research approaches that aim to know all about a few isolated processes and simpler, but long-term and consistent, monitoring schemes that aim to map and eventually understand higher-level drivers and major interactions affecting human pressures, fish stocks and reservoir productivity. It is better to see the forest than scrutinize the trees.
REFERENCESBayley, P.B. 1988. Accounting for effort when comparing tropical fisheries in lakes,
river floodplains, and lagoons. Limnology and Oceanography, 33(4): 963–972.Central Inland Fisheries Research Institute (CIFRI). 2006. Inventory of reservoirs
in the Indian Indo-Gangetic Basin. Project report for the Challenge Programme CP34 Improved fisheries productivity and management in tropical reservoirs. Barrackpore, India. 33 pp.
Choi, J.S., Frank, K.T., Petrie, B.D. & Leggett, W.C. 2005. Integrated assessment of a large marine ecosystem: A case study of the devolution of the eastern Scotian shelf, Canada. Oceanography and Marine Biology: An annual review, 43: 47–67.
Cury, P.M. & Christensen, V. 2005. Quantitative ecosystem indicators for fisheries management. ICES Journal of Marine Science, 62: 307–310.
De Silva, S.S., Lin, Y. & Tang, G. 1992. Possible yield-predictive models based on morphometric characteristics and stocking rates for three groups of Chinese reservoirs. Fisheries Research, 13: 369–380.
Degnbol, P. & Jarre, A. 2004. Review of indicators in fisheries management: A development perspective. South African Journal of Marine Science 26: 303–326.
FAO. 2002. The State of World Fisheries and Aquaculture 2002. Rome. 150 pp.Hardjamulia, A. & Suwignyo, P. 1988. The present status of the reservoir fishery in
Indonesia. In S.S. De Silva, ed. Reservoir fishery management and development in Asia, pp. 8–18. IDRC Proceedings Series 264-e. Ottawa.
Jul-Larsen, E., Kolding, J., Nielsen, J.R., Overa, R. & van Zwieten, P.A.M. 2003. Management, co-management or no management? Major dilemmas in southern African freshwater fisheries. Part 1: Synthesis report. FAO Fisheries Technical Paper No. 426/1. Rome, FAO. 127 pp.
Kolding, J. 1994. Plus ça change, plus c’est la même chose. On the ecology and exploitation of fish in fluctuating tropical freshwater systems. University of Bergen (Dr. Scient. thesis)
Kolding, J. & van Zwieten, P.A.M. 2006. Improving productivity in tropical lakes and reservoirs. Challenge Program on Water and Food. Aquatic Ecosystems and Fisheries Review Series 1, Theme 3 of CPWF. Cairo, WorldFish Center. 139 pp.
Book 1.indb 134 12/29/11 1:16 PM

General discussion 135
Kolding, J., Musando, B. & Songore, N. 2003. Inshore fisheries and fish population changes in Lake Kariba. In E. Jul-Larsen, J. Kolding, R. Overa, J.R. Nielsen, & P. van Zwieten, eds. Management, co-management or no management? Major dilemmas in southern African freshwater fisheries, pp. 67–101. FAO Fisheries Technical Paper No. 426/1. Rome, FAO. 127 pp.
Kolding, J., van Zwieten, P.A.M., Mkumbo, O., Silsbe, G. & Hecky, R. 2008. Are the Lake Victoria fisheries threatened by exploitation or eutrophication? Towards an ecosystem-based approach to management. In G. Bianchi & H.R. Skjoldal, eds. The ecosystem approach to fisheries, pp. 308–354. Wallingford, UK, CAB International.
Moreau, J. & de Silva, S.S. 1991. Predictive yield models for lakes and reservoirs of the Philippines, Sri Lanka and Thailand. FAO Fisheries Technical Paper No. 319. Rome, FAO. 42 pp.
Paul, S. & Sugunan, V.V. 1990. Development of reservoir fisheries: areas of hope and despair. In A.G. Jhingran, & V.K. Unnithan, eds. Reservoir fisheries in India, pp. 29–32. Proceedings of the national workshop on reservoir fisheries (3-4 January 1990). Special publication 3. Mangalore, India, Asian Fisheries Society Indian Branch.
Petr, T. 1975. On some factors associated with the initial high fish catches in new African man-made lakes. Archives of Hydrobiology, 75(1): 32–49.
Petr, T. 1978. Tropical man-made lakes: their ecological impact. Archives of Hydrobiology, 81(3): 368–385.
Quirós, R. 1998. Reservoir stocking in Latin America, and evaluation. In T. Petr, ed. Inland fishery enhancements. Papers presented at the FAO/DFID expert consultation on inland fishery enhancements in Dhaka, Bangladesh, 7–11 April 1997. FAO Fisheries Technical Paper No. 374. Rome, FAO. 463 pp.
Rice, J.C. & Rochet, M-J. 2005. A framework for selecting a suite of indicators for fisheries management. ICES Journal of Marine Science, 62(3): 516.
Schindler, D.W. 1978. Factors regulating phytoplankton production and standing crop in the world’s freshwaters. Limnology and Oceanography, 23(3): 478–486.
Shin, Y-J., Rochet, M-J., Jennings, S., Field, J.G. & Gislason, H. 2005. Using size-based indicators to evaluate the ecosystem effects of fishing. ICES Journal of Marine Science, 62: 384.
Sugunan, V.V. 1995. Reservoir fisheries of India. FAO Fisheries Technical Paper No. 345. Rome, FAO. 423 pp.
van den Bossche, J.P. & Bernacsek, G.M. 1990. Source book for the inland fishery resources of Africa, vol. 1 and 2. FAO Fisheries Technical Paper Nos. 18/1 and 18/2. Rome, FAO. 411 and 240 pp.
van Densen, W.L.T., Kechik, I.B.A., Balayut, E.A., Chookajorn, T., Moreau, J., Sarnita, A.S. & Yap, S.Y. 1999. Fish production, catch composition and changes in the freshwater fish communities in ASEAN lakes and reservoirs. In W.L.T. van Densen & M.J. Morris, eds. Fish and fisheries of lakes and reservoirs in Southeast Asia and Africa, pp. 229–244. Otley, UK, Westbury Publishing.
van Zwieten, P.A.M., Banda, M., Mwakiyongo, K., Manase, M., Kanyerere, G. & Nyasulu, T. 2005. Potential biological state and pressure indicators to evaluate the fisheries of Lake Malawi SE arm and Lake Malombe: Evaluative capacity of Fisheries Research Unit of Malawi. Literature review and indicator assessment. Case study: Southeast Arm of Malawi Knowledge in Fisheries Management Project (EU/INCO-DEV). 93 pp.
Book 1.indb 135 12/29/11 1:16 PM

Book 1.indb 136 12/29/11 1:16 PM

137
APPENDIX 1
Lake Nasser: additional tables
TABLE A1.1Water levels and area of Lake Nasser, 1979–2004
Year Maximum level (masl)
Minimum level (masl)
Average level (masl)
Surfacearea (km2)
Fresh fish output
(tonnes)
Total fish output (tonnes)
1979
1980
1981
1982
1983
1984
1985
1986
1987
1988
1989
1990
1991
1992
1993
1994
1995
1996
1997
1998
1999
2000
2001
2002
2003
2004
175.95
176.22
175.96
172.63
169.86
169.42
164.34
163.61
161.66
168.82
169.79
169.05
169.35
170.75
174.32
177.28
176.93
178.54
178.52
181.30
181.60
180.63
180.68
177.69
177.91
175.56
173.03
171.18
171.13
170.18
165.64
162.97
156.16
157.14
154.05
150.62
164.03
163.72
162.23
163.84
167.24
169.51
172.32
172.28
175.40
174.66
175.66
175.84
175.85
175.12
172.02
171.70
174.49
173.70
173.54
171.41
167.75
166.19
160.25
160.37
157.85
159.72
166.91
166.39
165.79
167.30
170.78
173.40
174.63
175.41
176.96
177.98
178.63
178.24
178.27
176.41
174.97
173.63
4 143
3 830
3 826
3 661
3 152
3 477
2 211
2 305
2 058
1 697
2 990
2 953
2 803
2 965
3 328
3 426
4 023
4 016
4 538
4 419
4 578
4 606
4 536
4 473
4 024
4 620
22 649
26 344
31 295
25 979
28 342
23 269
25 249
15 023
15 287
14 814
14 031
20 129
29 642
24 721
16 723
20 436
19 692
18 159
16 644
15 013
9 876
3 908
7 556
18 513
12 734
8 070
27 021
30 216
34 026
28 667
30 762
24 531
26 724
16 315
16 815
16 123
15 650
21 882
30 838
26 219
17 931
22 019
22 058
20 540
20 601
19 203
13 983
8 281
12 164
22 093
17 030
12 435
Source: Lake Nasser Development Authority.
Book 1.indb 137 12/29/11 1:16 PM
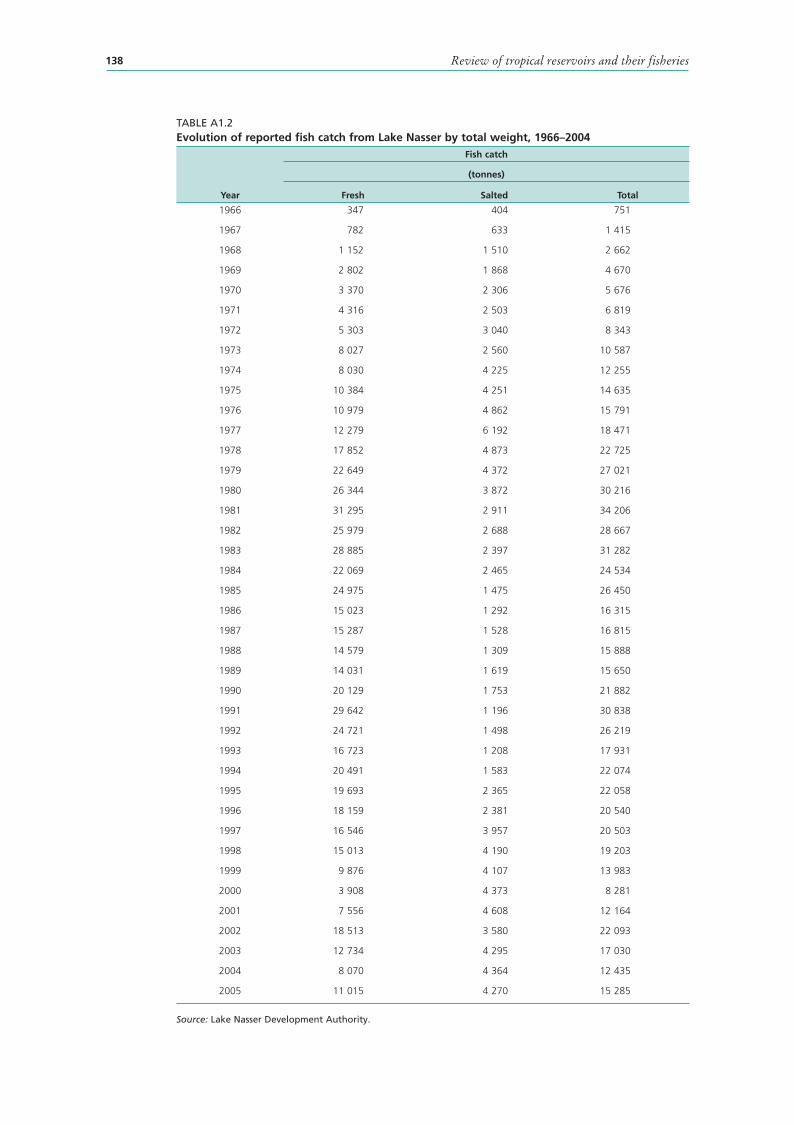
Review of tropical reservoirs and their fisheries138
TABLE A1.2Evolution of reported fish catch from Lake Nasser by total weight, 1966–2004
Year
Fish catch
(tonnes)
Fresh Salted Total
1966 347 404 751
1967 782 633 1 415
1968 1 152 1 510 2 662
1969 2 802 1 868 4 670
1970 3 370 2 306 5 676
1971 4 316 2 503 6 819
1972 5 303 3 040 8 343
1973 8 027 2 560 10 587
1974 8 030 4 225 12 255
1975 10 384 4 251 14 635
1976 10 979 4 862 15 791
1977 12 279 6 192 18 471
1978 17 852 4 873 22 725
1979 22 649 4 372 27 021
1980 26 344 3 872 30 216
1981 31 295 2 911 34 206
1982 25 979 2 688 28 667
1983 28 885 2 397 31 282
1984 22 069 2 465 24 534
1985 24 975 1 475 26 450
1986 15 023 1 292 16 315
1987 15 287 1 528 16 815
1988 14 579 1 309 15 888
1989 14 031 1 619 15 650
1990 20 129 1 753 21 882
1991 29 642 1 196 30 838
1992 24 721 1 498 26 219
1993 16 723 1 208 17 931
1994 20 491 1 583 22 074
1995 19 693 2 365 22 058
1996 18 159 2 381 20 540
1997 16 546 3 957 20 503
1998 15 013 4 190 19 203
1999 9 876 4 107 13 983
2000 3 908 4 373 8 281
2001 7 556 4 608 12 164
2002 18 513 3 580 22 093
2003 12 734 4 295 17 030
2004 8 070 4 364 12 435
2005 11 015 4 270 15 285
Source: Lake Nasser Development Authority.
Book 1.indb 138 12/29/11 1:16 PM

Appendix 1 139
TABLE A1.3Evolution of reported fish catch from Lake Nasser by species, 1966–2004
YearOutput (tonnes)
Fish species
Tilapia Samoos Bayad Libees Others Salted fish
(tonnes) (%) (tonnes) (%) (tonnes) (%) (tonnes) (%) (tonnes) (%) (tonnes) (%)
1966 752 275 36.6 6 0.8 25 3.3 133 17.7 na na 313 41.6
1967 1 414 471 33.3 27 1.9 69 4.9 310 21.9 na na 537 38.0
1968 2 663 764 28.7 77 2.9 64 2.4 751 28.2 na na 1 007 37.8
1969 4 670 1 975 42.3 289 6.2 112 2.4 953 20.4 na na 1 341 28.7
1970 5 676 2 384 42.0 451 7.9 176 3.1 817 14.4 na na 1 848 32.6
1971 6 819 3 157 46.3 518 7.6 245 3.6 934 13.7 na na 1 965 28.8
1972 8 343 4 146 49.7 451 5.4 259 3.1 826 9.9 na na 2 661 31.9
1973 10 588 7 108 67.1 391 3.7 161 1.5 210 2.0 na na 2 718 25.7
1974 12 255 7 243 59.1 490 4.0 124 1.0 83 0.7 na na 4 315 35.2
1975 14 634 9 659 66.0 525 3.6 121 0.8 4 0.0 na na 4 325 29.6
1976 15 791 10 582 67.0 448 2.8 76 0.5 na na na na 4 685 29.7
1977 18 470 11 182 60.5 563 3.0 66 0.4 362 2.0 na na 6 297 34.1
1978 22 725 17 044 75.0 na na na na na na na na 5 681 25.0
1979 27 020 22 346 82.7 373 1.4 46 0.2 332 1.2 na na 3 923 14.5
1980 30 216 25 427 84.2 432 1.4 30 0.1 375 1.2 na na 3 952 13.1
1981 34 196 30 529 89.3 400 1.2 21 0.1 434 1.3 na na 2 812 8.2
1982 28 666 23 713 82.7 275 1.0 11 0.0 307 1.1 na na 4 360 15.2
1983 31 282 27 809 88.9 258 0.8 6 0.0 197 0.6 520 1.9 2 492 8.0
1984 24 534 22 863 93.2 135 0.6 5 0.0 218 0.9 3 0.0 1 310 5.3
1985 26 999 24 907 92.3 139 0.5 3 0.0 171 0.6 274 1.1 1 505 5.6
1986 16 316 14 684 90.0 261 1.6 2 0.0 408 2.5 na na 961 5.9
1987 16 816 14 518 86.3 308 1.8 2 0.0 444 2.6 na na 1 544 9.2
1988 16 359 13 898 85.0 548 3.3 2 0.0 368 2.2 235 1.7 1 308 8.0
1989 15 650 13 008 83.1 709 4.5 2 0.0 313 2.0 na na 1 618 10.3
1990 21 883 19 563 89.4 477 2.2 na na 90 0.4 na na 1 753 8.0
1991 30 839 29 389 95.3 247 0.8 na na na na na na 1 203 3.9
1992 26 219 24 148 92.1 577 2.2 na na na na na na 1 494 5.7
1993 17 931 16 192 90.3 538 3.0 na na na na na na 1 201 6.7
1994 22 074 19 817 89.8 661 3.0 na na na na 55 0.3 1 541 7.0
1995 22 058 18 926 85.8 772 3.5 na na na na na na 2 360 10.7
1996 20 541 17 258 84.0 902 4.4 na na na na na na 2 381 11.6
1997 20 699 15 960 77.1 684 3.3 na na na na 98 0.6 3 957 19.1
1998 19 302 14 195 73.5 720 3.7 na na 98 0.5 98 0.7 4 191 21.7
1999 10 660 3 160 29.6 187 1.8 na na 277 2.6 2 929 92.7 4 107 38.5
2000 9 129 2 840 31.1 222 2.4 na na 847 9.3 847 29.8 4 373 47.9
2001 12 858 6 490 50.5 328 2.6 na na 716 5.6 716 11.0 4 608 35.8
2002 23 588 15 004 63.6 2 020 8.6 na na 1 492 6.3 1 492 9.9 3 580 15.2
2003 18 404 9 945 54.0 1 414 7.7 na na 1 375 7.5 1 375 13.8 4 295 23.3
2004 13 441 6 344 47.2 719 5.3 na na 1 007 7.5 1 007 15.9 4 364 32.5
na = not availableSource: Lake Nasser Development Authority.
Book 1.indb 139 12/29/11 1:16 PM

Review of tropical reservoirs and their fisheries140
TABLE A1.4Evolution of the set price for tilapia harvested from Lake Nasser, 1979–2001
Year EGP/tonne
1979
1980
1981
1982
1983
1984
1985
1986
1987
1988
1989
1990
1991
1992
1993
1994
1995
1996
1997
1998
1999
2000
2001
173
173
173
173
200
200
353
640
640
640
1 048
1 160
1 160
1 350
1 350
1 650
1 650
1 905
2 405
2 405
2 600
2 600
2 600
Source: Lake Nasser Development Authority.
TABLE A1.5Tax per kilogram of fish, 1999
Item Piaster/kg
Transportation costs on the reservoir
Lake Nasser Development Authority
Aswan Governorate
Fish union
General Syndicate of Agricultural and Irrigation Labourers
Cooperative association
Miscellaneous
Taxes
Fishers social services box
Association for Hired Fishers Care
Fishers saving box
34.5
3.0
1.0
1.0
1.0
1.0
0.5
1.0
1.0
1.0
1.0
Total monetary discount per kg
Producer price of tilapia per kg
Discount percentage
46.0
260.0
17.7
Source: Lake Nasser Development Authority.
Book 1.indb 140 12/29/11 1:16 PM

141
APPENDIX 2
Lake Volta: additional tables and information
TABLE A2.1Estimated total catch from Lake Volta, 1969–1977
Year Total catch stratum VII (tonnes)
Landings at Dzemeni and Kpando markets (strata II/III)
(tonnes)
Other estimates1
(tonnes)Estimated total catch
(tonnes)
1969 na na na 61 700
1970 na na na 39 200
1971 na na na 39 000
1972 na na na 36 000
1973 na na na 35 900
1974 na na na 37 300
1975 na na na 41 900
1976 na na na 40 700
1977 na na na 38 300
1978 na na na 37 261
1979 na na na 39 368
1980 na na na na
1981 na na na 40 000
1982 na na na 42 200
1983 na na na 43 200
1984 na na na 41 200
1985 na na na 43 200
1986 na na na 45 100
1987 na na na 45 100
1988 na na na 46 200
1989 na 3 717 na 46 200
1990 19 300 4 007 na 46 200
1991 na 3 597 36 3602 45 100
1992 na 3 796 na 45 100
1993 na 2 861 na 40 200
1994 na 3 894 na 42 200
1995 na 5 015 na 52 000
1996 33 800 5 033 150 000–200 0003 60 200
1997 na 4 724 na 62 200
1998 28 373 4 230 na 62 200
1999 na 4 773 na 78 800
2000 na 5 156 251 0004 74 800
2001 na 4 014 na 74 800
2002 na 3 990 na 74 800
2003 35 000 5 398 na 74 800
2004 na 6 604 na 53 900
2005 42 300 8 423 na na
2006 32 400 na na na
1 Fresh weight equivalent (= 3 × dry weight).2 including estimates for consumption (11.7 percent) and postharvest losses (5.7 percent) (Braimah, 1995).3 De Graaf and Ofori-Danson, 1997.4 MOFA, 2006; Braimah, 2001 and 2003.na = not available.Note: MOFA = Ministry of Fisheries and Agriculture. Braimah 2001 and 2003 not available; data cited from Béné (2007). Landings at stratum V in 1990 and 2003–2006 based on processed landings estimates from Yeji markets multiplied by 3 to obtain fresh weight equivalent.Sources: Volta Lake Research Project (UNDP/FAO/VRA); 1996: de Graaf and Ofori-Danson, 1997; 1998; 1978–1979: Vanderpuye, 1984; 1981–2004: estimated from Béné, 2007.
Book 1.indb 141 12/29/11 1:16 PM

Review of tropical reservoirs and their fisheries142
TABLE A2.2Fish species of Lake Volta
Species
Maximum
total length
(cm)
Trophic
levelHabitat Resilience
Alestes baremoze 43 3.05 benthopelagic Medium (K = 0.42; tm = 2–3; tmax = 5)
Alestes dentex 55 2.93 pelagic Medium (tmax = 7; tm = 2; K = 0.43–075)
Arius gigas 165 3.86 Benthopelagic Very low (Preliminary K or Fecundity)
Auchenoglanis occidentalis 86 2.90 demersal Medium (K = 0.3)
Bagrus bajad 125 3.99 demersal Medium (K = 0.18)
Bagrus docmak 71 4.08 benthopelagic Medium (K = 0.17, Fec = 2 000)
Barbus macrops 12 3.04 benthopelagic High (Preliminary K or Fecundity)
Brienomyrus niger 16 3.25 benthopelagic High (Preliminary K or Fecundity)
Brycinus leuciscus 15 2.91 pelagic High (K = 1.20)
Brycinus longipinnis 15 2.18 pelagic Medium (Fec = 160)
Brycinus luteus 10 2.93 pelagic High (Preliminary K or Fecundity)
Brycinus macrolepidotus 65 2.34 pelagic Medium (Preliminary K or Fecundity)
Brycinus nurse 25 2.44 pelagic High (K = 0.41–0.92; tm = 1) Campylomormyrus tamandua 53 3.24 demersal Medium (Preliminary K or Fecundity)
Chromidotilapia guentheri 16 2.44 benthopelagic High (tm < 1)
Chrysichthys auratus 43 3.66 demersal Medium (K = 0.16)
Chrysichthys nigrodigitatus 80 2.58 demersal Medium (K = 0.12–0.53)
Citharinus citharus 71 2.00 demersal High (K = 0.33–0.59, Fec = 685 000)
Clarias anguillaris 100 3.35 demersal Medium (Assuming tm = 2–4)
Clarias gariepinus 170 3.15 benthopelagic Medium (K = 0.06–0.19, tm = 2, Fec = 2,084)
Clarotes laticeps 98 3.14 demersal Low (Preliminary K or Fecundity)
Ctenopoma kingsleyea 25 3.19 demersal Medium (Preliminary K or Fecundity)
Ctenopoma petherici 18 3.16 benthopelagic Medium (Preliminary K or Fecundity)
Distichodus rostratus 76 2.00 demersal Medium (Preliminary K or Fecundity)
Gymnarchus niloticus 204 3.71 demersal Low (K = 0.12–0.17)
Hemichromis bimaculatus 17 3.93 benthopelagic High (Assuming tm < 1 and multiple annual spawning, Fec = 200–500)
Hemichromis fasciatus 25 3.18 benthopelagic High (K = 1.20)
Hepsetus odoe 70 4.50 demersal Medium (K = 0.27, tmax = 5)
Heterobranchus bidorsalis 150 3.69 demersal Very low (Preliminary K or Fecundity)
Heterobranchus isopterus 90 3.61 demersal Low (Preliminary K or Fecundity)
Heterobranchus longifilis 183 3.72 demersal Low (K = 0.11)
Heterotis niloticus 122 2.55 pelagic Medium (K = 0.22–0.4)
Hippopotamyrus pictus 37 3.21 demersal High (Preliminary K or Fecundity)
Hydrocynus brevis 86 3.40 demersal Medium (Preliminary K or Fecundity)
Hydrocynus forskalii 96 3.98 pelagic Medium (K = 0.17–0.45, tmax = 4)
Hyperopisus bebe 63 3.60 demersal Medium (Preliminary K or Fecundity)
Labeo coubie 92 2.04 benthopelagic Low (K = 0.12–0.26)
Labeo parvus 47 2.00 benthopelagic Low (Preliminary K or Fecundity)
Labeo senegalensis 65 2.09 benthopelagic Medium (K = 0.19–0.63(?), tmax = 6)
Lates niloticus 200 4.48 demersal Medium (K = 0.17–0.19, tm = 2–3)
Leptocypris niloticus 10 2.90 demersal High (Preliminary K or Fecundity)
Malapterurus electricus 149 2.93 benthopelagic Very low (Assuming tmax > 30)
Marcusenius abadi 40 3.07 demersal High (Preliminary K or Fecundity)
Marcusenius senegalensis 40 3.10 demersal High (Preliminary K or Fecundity)
Book 1.indb 142 12/29/11 1:16 PM

Appendix 2 143
Species
Maximum
total length
(cm)
Trophic
levelHabitat Resilience
Mormyrops anguilloides 150 3.58 demersal Low (K = 0.08–0.12)
Mormyrops breviceps 80 3.27 demersal Medium (Preliminary K or Fecundity)
Mormyrus hasselquistii 61 3.17 demersal Medium (Preliminary K or Fecundity)
Mormyrus macropthalmus 37 3.15 demersal High (Preliminary K or Fecundity)
Mormyrus rume 122 2.48 demersal Low (Assuming tm = 5–10)
Odaxothrissa mento 16 4.29 pelagic High (Preliminary K or Fecundity)
Oreochromis niloticus 74 2.00 benthopelagic Medium (K = 0.14–0.41, tm = 1–2, tmax = 9)
Parachanna obscura 60 3.40 demersal High (Preliminary K or Fecundity)
Paradistichodus dimidiatus 8 3.00 demersal High (Preliminary K or Fecundity)
Parailia pellucida 15 3.45 demersal High (Preliminary K or Fecundity)
Pellonula leonensis 10 3.30 pelagic High (Preliminary K or Fecundity)
Petrocephalus bane/P. bovei 25 3.20 demersal High (Preliminary K or Fecundity)
Petrocephalus bovei 14 3.11 demersal High (K = 0.53–1.10, tmax = 2.5)
Petrocephalus soudanensis 12 3.14 demersal High (Preliminary K or Fecundity)
Pollimyrus isidori 11 2.61 demersal High (tm = 0.5)
Polypterus endlicheri 77 3.77 demersal Medium (Preliminary K or Fecundity.)
Polypterus senegalus 51 3.54 demersal Very low (tmax = 34)
Protopterus annectens 100 3.83 demersal Very low (Assuming tmax > 30)
Raimas senegalensis 25 2.84 demersal Medium (Preliminary K or Fecundity)
Sarotherodon galilaeus 41 2.05 demersal Medium (K = 0.22–0.5, tm = 1.5–2)
Schilbe intermedius 61 3.60 pelagic High (tmax = 5, probably greater, K < 0.30, Fec = 18 000)
Schilbe mystus 40 3.45 demersal High (K = 0.09–0.94, tmax = 6–7, assuming Fec > 10 000)
Sierrathissa leonensis 4 3.10 pelagic High (tm < 1)
Siluranodon auritus 18 2.86 demersal High (Preliminary K or Fecundity.)
Steatocranus irvinei 14 3.32 demersal High (tm < 1)
Synodontis clarias 44 2.96 benthopelagic Medium (Preliminary K or Fecundity)
Synodontis eupterus 37 2.65 benthopelagic Medium (Preliminary K or Fecundity)
Synodontis filamentosa 32 2.88 benthopelagic High (Preliminary K or Fecundity)
Synodontis membranaceus 61 3.11 benthopelagic Medium (K = 0.14–0.55)
Synodontis nigrita 22 2.89 benthopelagic High (Preliminary K or Fecundity.)
Synodontis ocellifer 49 3.12 benthopelagic Medium (Preliminary K or Fecundity)
Synodontis schall 49 2.92 benthopelagic Medium (K = 0.10–0.54, tmax = 3, Fec = 64 273)
Synodontis velifer 24 2.89 benthopelagic High (Preliminary K or Fecundity)
Tetraodon lineatus 43 3.60 demersal Medium (Preliminary K or Fecundity)
Tilapia dageti 40 2.06 demersal Medium (Preliminary K or Fecundity)
Tilapia guineensis 38 2.80 benthopelagic High (K = 047)
Tilapia zillii 49 2.00 demersal Medium (K = 0.2–0.5, tm = 2–3, tmax = 7)
Note: Tm = age at maturity and tmax = maximum age. Sources: Goudswaard and Avoke, unpublished report. Values and descriptions compiled from www.fishbase.org (accessed on 14 June 2008).
Fishing methods of Lake VoltaThe following description of gear and catch rates are taken from an unpublished report by Goudswaard based on studies undertaken from February 1992 to April 1993. Fishing methods could be classified into 27 types, 23 of which were sampled.
TABLE A2.2 (continued)
Book 1.indb 143 12/29/11 1:16 PM

Review of tropical reservoirs and their fisheries144
Brush parks and vegetation parks Acadjas. Acadjas (in the Ewe language, atidza) are groups of tree branches closely placed in water about 1.5 m deep. The planted area is about 50 m2 for each acadja. After planting, the branches are left for 1–3 days, during which fish looking for shelter aggregate. Food (e.g. cassava root peelings) is placed between the branches as an attractant. The method is practised when the water level of the reservoir has receded below the level of submerged vegetation. Fishers plant a net on sticks around the acadja, which is lowered during the night before harvesting. The bottom strip of the net is dug into the soil by hand, and chicken-wire mesh traps are placed at regular distances between the net and the bottom. When all branches are removed from the acadja area, a small seine net is used to harvest those fish that have not moved into the traps. When all fish have been removed, the place is abandoned and a new acadja may be created elsewhere.
Acadjas are installed in soft-bottomed areas located in sheltered places such as bays. When acadja fishing stops, fishers use the same gear for a similar kind of fishing called nifa-nifa. Seventy-six acadjas were found operating in stratum VII between 1991 and 1993. Béné and Obirih-Opareh (2009) give an updated analysis of the use of acadjas in Lake Volta, and Welcomme (2002) describes their use in West Africa and elsewhere in the world.
Nifa-nifa. This method is similar to acadja but, instead of deliberately placed branches, the net is placed around existing submerged vegetation. Fish feeding between and from the submerged vegetation enter from deeper parts of the reservoir and adjacent areas in the submerged vegetation during the night. The net is lowered during the night, and chicken-wire traps are placed at regular intervals between the bottom and the net. During the day when the fish attempt to migrate to deeper waters, they find their way blocked and are caught in the traps. Occasionally a 3–3.5 inch (75–87 mm) gillnet is placed in the nifa-nifa to obtain species that do not enter the traps. Nifa-nifa fishers have two strategies: (i) after cropping one spot they leave the net on top of the sticks for some days and set them again after about five days; or (ii) they remove all sticks and net and move to another spot. Usually, a fisher only has one nifa-nifa net. Nifa-nifa is practised at high water level, when vegetation is submerged after the annual water level rise, which ends in October. Nifa-nifa is not practised 5–6 days before and after full moon. In March 1992, 69 nifa-nifa were counted between Sokpoekope and Mataheko, and 34 between Pejai and Lomkotor and the total number was estimated at 200–250 in the area investigated in stratum VII.
Gillnets, passive and active methodsGillnet fishing. Gillnets are widely used in Lake Volta, where most fishers use a hanging ratio of 0.5. Trammel nets are never found in the reservoir, although fishers are aware of the technique. Many fishers use a number of different mesh sizes and categorization is difficult for that reason. Nevertheless, seven different techniques can be distinguished.
(1) One-inch (25 mm) pelagic set gillnets (passive) are top set and target small pelagic fish species. The method is widely practised all over the Lake Volta. Fishers usually operate only one net, as the time needed to remove the catch may be several hours. Nets are set for only one night. Occasionally, the net is set during the day for some hours, but these catches are extremely poor.
(2) Small-mesh bottom set gillnets (passive) are all multifilament nets with meshes ranging from 1 to 2½ inches (35–63.5 mm). The nets are set overnight but may remain for two successive nights in shallow water. One boat usually carries four bundles of nets, which is the maximum the crew members can handle in removing fish and carrying out extensive repairs on these fragile nets of two and three ply.
(3) Three inch (75 mm) “disco” bottom set gillnets (passive) may range from 2½ to 3½ inches (63.5–89 mm) and are almost all of monofilament twine, popularly
Book 1.indb 144 12/29/11 1:16 PM

Appendix 2 145
known as “disco”. The targets are tilapiine species and, for this reason, the nets are placed in shallow waters along the reservoir. Usually, only one bundle is operated. Nets are not commonly repaired, and consequently the life span of a net is only one season. The method is common, but seasonal because of the migrating and spawning behaviour of the target species.
(4) Large-mesh bottom set gillnets (passive) is a category that includes all nets larger than 3½ inches (89 mm), both monofilament and multifilament. The nets are usually deep and, when set in shallow areas, may reach from the bottom to the surface. In the deeper parts of the reservoir, they are usually placed on the bottom.
(5) Large-mesh pelagic set gillnets (passive) are identical to the previous category except that they are placed 1 m below the surface of the water. Polystyrene floats on ropes attached at short intervals to the top line keep these nets in position. A few stones on ropes moored to the bottom keep the nets from drifting downstream. The targets are large pelagic species. The method is not very common as it is practised in the open-water areas of the reservoir where the active fishing of winch boats is destructive to this passive gear.
(6) Drift nets (passive) are monofilament with 2–3½ inch (50–89 mm) mesh that are placed in strong currents. The net is placed across the stream and is carried downstream. For this reason the method is very seasonal and used widely above and around the confluence of White and Black Volta Rivers. The target species are pelagic fish moving against the current, and anadromous species preparing to spawn in the upstream riverine environment during flood periods. During periods with high-velocity discharge, this is almost the only method practised. After this period, which lasts from July to October, all drift-net fishers turn to gillnet fishing. Drift nets last for only one season of 3–4 months.
(7) Gillnets with beating of water (active) uses a 3–3½ inch (75–89 mm) monofilament net set around a shallow area. When the net is set, the surface of the water is beaten with paddles, scaring the fish that try to escape from the area and are subsequently gilled, wedged or entangled. The method may be more common than reported.
Cast nets Fishing with cast nets in Lake Volta is seasonal and full-time. The method is usually practised by two fishers. One in the front of the boat casts the net, while the second paddles the canoe forward while herding the fish. Most cast nets are 2–2½ inch (51–63.5 mm) monofilament and 4–4.5 m long, measured centre to lead line. This means that approximately 50 m2 is surrounded in one casting. Cast netting is popular as an instant fishing technique, cheap to equip but labour-intensive. The number of full-time cast net fishers is small. Besides these professional fishers, there are cast net fishers who operate from the shores. Their nets usually have a one-inch (25 mm) mesh, and their target is small tilapiines. This last group is occasional fishers, and their number is very small. Catches with these nets are not recorded.
Seine netsSeine fishing is an active method in which a net is pulled on two sides through the water. Besides purse seining, there are three seine methods practised in Lake Volta that are quite distinctive in design and the fish species targeted:
(1) Beach seine fishing is the active method in which a part of the shore is surrounded by a two-inch (50 mm) net that is pulled ashore by a group of fishers. The codend of the seine is usually one-inch (25 mm) mesh of thick twine (ply 210D/30). The method is practised on every suitable shore (those that are free of obstacles like tree stumps, stones or vegetation) along the reservoir. Fishers claim stretches of
Book 1.indb 145 12/29/11 1:16 PM

Review of tropical reservoirs and their fisheries146
shore as their fishing area after removing these obstacles. Visiting fishers pay a fee in cash or catch for the use of a beach. The method is very common, and on suitable beaches, six out of every ten canoes may be involved in beach seining. As several places are unfit for beach seine fishing, an overall ratio of four out of ten canoes seems more realistic. The targets of beach seines are tilapiine species.
(2) Pellonula seine fishing uses a seine of half-inch (12.5 mm) knotless mesh net approximately 6–8 m in length and 1 m in height. The net is pulled by two people wading through the water. After a drag of about 20 m, a small child walks towards the middle of the net scaring fish into it, and it is lifted. The method is used to obtain bait for longline fishers; around Yeji town, the catch is sold to the kenke producers. The method is practised at sunrise, from 05:00 to 06:30 hours. There are probably equal numbers of pellonula seine and Bagrus line fishers.
(3) Mosquito net seine uses as a seine a piece of mosquito net of variable size that is dragged by two children through very shallow water of less than 1.5 m. The target species is the clupeid Sierrathrissa leonensis. The catch has to be processed immediately, and all fish are fried or cooked as street food. In the whole area, the method is only seen in and around Yeji town, practised almost daily by a few children.
(4) Purse seine fishing is popularly known in the area as winch net or winch boat operating. The method uses a floating ring net with iron rings on 1 m ropes from the lead line reaching the bottom of the reservoir. These rings carry a ground rope that is pulled with the head rope into the boat by hand, finally closing a bowl-shaped net that catches all fish not able to pass through the two-inch (50 mm) webbing. The method is illegal but commonly practised in the area north of Yeji. At least 360 boats are recognizable as winch net boats. A number of winch nets are operated as well from the usual type of canoe. Winch boats are divided in two groups: with or without an outboard engine. Winch boats operate at night, and many boats also make a number of trips during daylight hours.
(5) Engine-powered winch boats most often use a 25 horsepower outboard engine to reach the fishing grounds and set the net. The net should be set quickly to deprive fish of the chance to escape. In this respect, engine-powered winch boats have an advantage over manual winch nets. The number of fishers used to pull the net onto the boat averages about 9 but may vary from 6 to 14. Many boats operate in the absence of the owner. The area of operation has to be free of bottom obstacles. For this reason, most boats are active in the former river bed. However, with very high water levels towards the end of 1991, winch nets were active in shallow areas that, when water levels are low, are beach areas that have been cleared by beach seine fishers. The target species for winch net fishers in shallow water are tilapiines and, in the open waters, large pelagic fishes. It is uncommon for engine-powered winch net operators to be involved in other types of fishing, although some fishers also operate bamboo pipes.
(6) Manually operated winch boats are large open canoes of the usual type used by all kinds of fishers in the reservoir. As a result of manual paddling, the action radius of operation of these boats compared with engine-powered boats is small, and many operate in shallow waters close to home. Goudswaard (personal communiation) had the impression that most of these operators were active only during the daytime.
TrapsBamboo pipe fishing became very popular in the late 1980s among fishers of the northern arm of Lake Volta. The technique is quite simple. A number of pipes are hung from snoods measuring 1–1.5 m that are attached to a line hung between two tree stumps. The bamboo pipes are three internodes long. Either holes are cut in each internode or the
Book 1.indb 146 12/29/11 1:16 PM

Appendix 2 147
internode is broken throughout to form one long pipe. Bamboo pipe fishing is practised between submerged trees in areas where other methods like gillnetting, which targets the same synodontid species, is difficult as nets become entangled. After three days during high season or 14 days during the low season, a fisher lifts the pipes and shakes the fish out of the pipes. The number of pipes used by one fisher unit is usually about 600 but may vary between 400 and 3 000. The method is practised widely in the whole area. In January–May 1993, a total of 118 truckloads of about 2 200 pipes each were offloaded at Yeji, the main trading centre for pipes in the area. This would mean that more than 250 000 pipes were added to the existing number on the reservoir. Bamboo pipe fishing is practised by all kinds of fishers in combination with other gear.
Palm frond traps are produced from palm trees in the Volta Region and transported by Volta Lake Transport Company boats to Yeji, where marketing takes place for the whole area. The traps consist of two chambers that are baited with the waste from local beer production and placed on a line at the bottom of the reservoir. The targets are bottom-dwelling species. The method is highly seasonal, although a few fishers practise this method year-round with small catches in the off-season. The main season is from August to December. An estimated 200 fishers are involved in this type of fishing.
Tilapia traps are made of chicken wire or fine bamboo sticks woven together with bamboo leaves twisted into a kind of rope. The traps are produced at the fishing villages from raw materials arriving from the Ashanti Region. The traps are placed in shallow waters where tilapiine species wriggle themselves through the vegetation and a kind of path can be recognized. The method requires extensive knowledge of the area and of fish behaviour and is practised only by older fishers.
Hook and line and longlinesHook and line fishing can be divided into four different types by hook size and bait (ripping hooks are unbaited and for that reason are regarded as a distinct gear):
(1) Lates longlining targets large predator fishes like Lates niloticus and Gymnarchus niloticus, which are caught by hooks baited with live Chrysichthys. The hooks are Kirby sea hook numbers 1, 2, 3 or 4 and are usually checked daily, but may stay in the water a second day. Only six fishers using this fishing gear were found in Tokponya village, one at Ghanakwe Island, one in Dente Manso and one at Jaklai village.
(2) Clarias longline fishing targets Clarias by placing hooks in shallow areas using small fish or soap as bait. The hooks are Kirby sea hook number 14. The method is practised over the whole area on a small scale.
(3) Bagrus longlining uses gear similar to the methods above, but the hooks are Kirby sea hook number 12 and are always baited with small fish like Barbus macrops, Pellonula leonensis or tiny tilapiine fishes. The hooks are set in deep-water areas, usually the former river bed. Target species are predatory fishes like Bagrus bayad and B. docmac. One fisher may have 1 200–3 000 hooks. The method is common over the whole area and the most common longlining method. An estimated 100–150 fishers are involved in this kind of fishing. This estimate is based on the number of fishers counted in the sampled villages as a proportion of the total number of villages.
(4) Ripping hook fishing uses a large number of unbaited hooks attached to a line at short intervals. The line is tied to small sticks that are placed in very shallow water along beaches. The hooks hang 25–30 cm above the bottom. Bottom-feeding fish brush against the hooks while foraging and get snagged. The method is practised throughout the year. An estimated 50 fishers use this method.
Hand lining is done with one hook on a line baited with a piece of worm. It is widely practised at all locations by young children. The target species is Brycinus nurse, while small Chrysichthys and Synodontis are also caught. There is no hand lining that targets tilapiines.
Book 1.indb 147 12/29/11 1:16 PM

Review of tropical reservoirs and their fisheries148
Other methodsLift-basket fishing uses a basket woven of palm fronds attached to two poles 3 m in length. The basket is baited with fermented cassava flour and pushed alongside a canoe under water. After approximately three minutes, the basket is lifted and the fish shaken into the canoe. The method was found to be practised exclusively by women during daylight hours. The only places where the method was found were along the White Volta River, where 58 women were counted practising lift-basket fishing in September 1992.
Poisoning is practised in shallow pools that remain when water has receded or in small streams, using agricultural pesticide thrown into the water. The method is illegal. The target species is Heterotis niloticus. Opposition to the method by almost all fishers in the area and the incidental nature of the method means it may be more common than reported.
Wangara is a long, bottom-reaching net fixed between two tree stumps whose lower and upper lines are lifted by two fishers in a canoe. The method targets migrating fishes, especially tilapiines. The method is labour-intensive and capital-intensive and not common in the area. It is practised in very shallow places where streams enter the reservoir. The method is said to have been introduced to the reservoir by Malian and Nigerian fishers.
Harpooning is performed with an arrow that swimming fishers launch from a gun-like apparatus with rubber bands, targeting large tilapiines.
REFERENCESBéné, C. 2007. Diagnostic study of the Volta Basin fisheries. Focal Basin Project – Volta.
Report No. 1: Overview of the Volta Basin fisheries resources. Penang, Malaysia, WorldFish Center. 32 pp.
Béné, C. & Obirih-Opareh, N. 2009. Social and economic impacts of agricultural productivity intensification: the case of brush park fisheries in Lake Volta. Agricultural Systems, 102: 1–10.
Braimah, L.I. 1995. Recent developments in the fisheries of Volta Lake (Ghana). In R.R.M. Crul & F.C. Roest, eds. Current status of fisheries and fish stocks of four largest African resources, pp. 111–134. Committee for Inland Fisheries of Africa Technical Paper No. 30. Rome, FAO. 134 pp.
de Graaf, G.J. & Ofori-Danson, P.K. 1997. Catch and fish stock assessment in stratum VII of Lake Volta. Integrated Development of Artisanal Fisheries Project Technical Report No. 97/I. Rome, FAO. 96 pp.
Ministry of Fisheries and Aquaculture (MOFA). 2006. Inland Fisheries Policy. Accra. 18 pp.
Vanderpuye, C.J. 1984. Synthesis of information on selected African reservoirs – Lake Volta in Ghana. In J.M. Kapetsky, & T. Petr, eds. Status of African reservoir fisheries, pp. 261–321. Rome, FAO. 326 pp.
Welcomme, R.L. 2002. An evaluation of tropical brush and vegetation park fisheries. Fisheries Management and Ecology, 9: 175–188.
Book 1.indb 148 12/29/11 1:16 PM