REVIEW OF THE THEORETICAL LITERATURE - College of Europe
64
1 SUSTAINABLE GROWTH, EMPLOYMENT CREATION AND TECHNOLOGICAL INTEGRATION IN THE EUROPEAN KNOWLEDGE-BASED ECONOMY (SETI/SERD-2000-00126) REVIEW OF THE THEORETICAL LITERATURE by College of Europe (Bruges, Belgium), CeSPI (Rome, Italy), SPRU (University of Sussex, UK), Leverhulme (University of Nottingham, UK) January 2002
Transcript of REVIEW OF THE THEORETICAL LITERATURE - College of Europe

1
SUSTAINABLE GROWTH, EMPLOYMENT CREATION AND TECHNOLOGICAL
INTEGRATION IN THE EUROPEAN KNOWLEDGE-BASED ECONOMY
(SETI/SERD-2000-00126)
REVIEW OF THE THEORETICAL LITERATURE
by
College of Europe (Bruges, Belgium), CeSPI (Rome, Italy), SPRU (University
of Sussex, UK), Leverhulme (University of Nottingham, UK)
January 2002
2
Table of Contents
1. Introduction ............................................................................................................................................................................32. Technology and specialisation ............................................................................................................................................4
2.1 Technology and specialisation: theories and empirical evidence .....................................................................5The consideration of technology like a key determinant of country and sectorial trade performance has generatedan impressive development of theoretical and empirical proposals in the last years. Two themes in particularhave received special attention in recent years:....................................................................................................................5
2.1.1 The impact of technology on trade competitiveness and specialisation........................................................52.1.2 Trends in specialisation patterns ..........................................................................................................................7
2.2 The impact of specialisation on international competitiveness and economic growth ...............................9Table 2.1: The impact of specialisation on economic performance .................................................................10
Methodology .............................................................................................................................................................................10Dependent variable .............................................................................................................................................................10
Significant .................................................................................................................................................................................102.3 Specialisation and employment creation...............................................................................................................132.4 Open questions and directions for future research............................................................................................15
3. Services..................................................................................................................................................................................163.1 What are services?......................................................................................................................................................16
3.1.1 Services versus goods ..........................................................................................................................................163.1.2 The internationalisation of services ...................................................................................................................17
3.2 Trends in services ........................................................................................................................................................193.2.1 Trade in services....................................................................................................................................................19Table 3.1: World trade in goods and services .......................................................................................................20Table 3.2: Trade in services by EU country and broad sector for 1999 ........................................................20Table 3.3: Trade value by major economic region and selected industry (1990-1999) .............................22Table 3.4: Share in total services trade by major economic region and selected industry ...........................(1990-1999)......................................................................................................................................................................233.2.2 FDI in services.......................................................................................................................................................23Table 3.5: World foreign production in goods and services ..............................................................................24
3.3 The regulatory environment ....................................................................................................................................253.3.1 The free movement of services within the EU .................................................................................................25Table 3.6: Determinants of Market Structure in Services (late 1980’s).........................................................263.3.2 The GATS and beyond ........................................................................................................................................27
3.4 Services, employment and economic growth .......................................................................................................283.4.1 Explaining the service economy .........................................................................................................................293.4.2 Technological change in services.......................................................................................................................303.4.3 Consequences on employment....................................................................................................................313.4.4 Consequences on growth: Direct and indirect effects.....................................................................................33Table 3.7: Labour productivity by industry, 1987-1997 ....................................................................................333.4.5 The internationalisation of services and economic growth............................................................................35
3.5 Open issues and directions for future research...................................................................................................364. The Information and Communication Technology (ICT) revolution.........................................................................39
4.1 Theoretical frameworks ............................................................................................................................................404.1.1 ICT as a new techno-economic paradigm.........................................................................................................404.1.2 ICT as a GPT..........................................................................................................................................................40
4.2 ICT and growth in the US and in Europe: A short review..............................................................................414.2.1 An overview of the US debate on ICT and growth.........................................................................................414.2.2 International comparisons of ICT and growth in the OECD area.................................................................43
4.3 Open Issues and Directions for Future Research ...............................................................................................455. The internationalisation of technology ............................................................................................................................46
5.1 Theoretical framework ..............................................................................................................................................475.2 Recent empirical studies ............................................................................................................................................50
5.2.1 Studies based on R&D and patent data.............................................................................................................515.2.2 Studies based on surveys .....................................................................................................................................525.2.3 Studies based on patent citations analysis ........................................................................................................53
5.3 Open issues and directions for future research...................................................................................................546. A review of the methodology............................................................................................................................................54Bibliography .............................................................................................................................................................................59
3
1. Introduction
The aim of the SETI project is to investigate the impact of technological globalisation, thedevelopment and diffusion of Information and Communication Technologies (ICT) and therise of business services on national patterns of specialisation. Moreover, we are interested inassessing their impact on growth and employment potential in Europe. The interest for theseissues arises from a number of stylised facts. First, Europe is losing competitiveness in sectorswhere the rates of growth of innovation and demand have been faster. Second, the process ofinternationalisation of R&D appears to have been more marked in Europe with respect toJapan and the US and this raises the issue of the impact of this trend on European nationalsystems of innovation. Finally, the diffusion of ICT is producing an impact on the processesof internationalisation and the rise of business services. In this context we ask whether thepoor performance of Europe in the new technologies has contributed to the slowdown in thecatching-up process and the high rates of unemployment with respect to the US and what arethe future perspectives.
Different streams of literature are relevant for this project. First, there is a large literature onthe impact of technology on international specialisation. This literature is the starting point forthe development of the project. In this general framework we aim at assessing how the rise ofthe service sector, the internationalisation (globalisation) of technology, and the developmentand diffusion of ICT are shaping European specialisation patters. The phenomenon ofinternationalisation has been accompanied by the growth of particular activities within theservice sector and both trends have been favoured by the development of ICT.
Tertiarisation in a broad sense is not a new phenomenon, and the growth of the share ofemployment in the service sector follows a very long trend. Still the tertiarisation trendexperienced over the last two decades has some distinctive features, of which the mostmarked one is the unprecedented growth of business services over the last two decades. Thenew service sector mix very diverse types of activities, requiring different levels of skill. Thedevelopment of the highly qualified service activities in many new market niches is clearlylinked with the diffusion of ICT. This opens differentiated opportunities to different countries.The business services sector constitutes a new phenomenon, characteristic of a new set ofrelations between firms and this raises some new questions:
• How will different economies adjust to the broad organisational challenge with whichthey are confronted? And to what extent new organisational paradigms, linked to theincreasing role of services, will affect growth and employment performance at both theregional and national levels? Will, and to what extent, the process of internationalisationstrengthen the diffusion of new technology?
The role of manufacturing in overall growth of the developed countries has declined over thelast decades. Considering the increasing role of services as suppliers of high-quality inputsinto the manufacturing process one might be tempted to ask whether business services can bethe new engine of growth for the whole economy and how different economies will befavoured or hampered by this new phase of development. Because services are, by the strongpath-dependency of their development, very much country-specific, the emergence of a newgrowth regime is marked by national specificities, although one might have expected theopposite in times of increased internationalisation. In this context we want to investigatewhether there are interdependencies between national advantages in specific manufacturingsectors and the development of service activities. Anyway, the characters ofinternationalisation are different according to the types of sectors involved: this holds for

4
manufacturing and the service sector, as well as for the linkages between the two. Hence arelevant question is: • How the internationalisation and tertiarisation processes will differ across sectors? And
how existing specialisation patterns in Europe will affect future dynamics and constrainthe outcome?
In order to address these questions we will define a framework growth model where theeffects of specialisation, and innovation on growth and employment can be formally analysedand empirically tested along the lines already explored in Padoan (1998). Padoan (1998)presents an analytical description and an empirical estimation of a dynamic disequilibriummodel where equilibrium growth is made to depend upon the structure of specialisation aswell as on endogenous technological accumulation. A similar model can be developed inorder to analyse the relationship between innovation and employment creation at a sectorallevel. In this context it will be possible to formally analyse the relationship between growthand employment also within the service sector and the differences across countries.
The purpose of this review is to present the state of the art in different theoretical fields thatwill be integrated within the project. These are: the relationship between technology andspecialisation (Section 2); the process of tertiarisation (Section 3); the development anddiffusion of ICT (Section 4) and the internationalisation of technology (Section 5). Particularattention will also be devoted to the consequences of these new trends on growth andemployment opportunities. The review of the literature also aims at highlighting open issuesthat will be addressed in the development of the project. Finally, in the last section we reviewthe methodology that we intend to use in the quantitative part of the project. Figure 1.1summarises the various fields of literature relevant to the project and their interdependencies.
Figure 1.1 A summary of the streams of literature relevant to the SETI project
2. Technology and specialisation
This section focuses on technology-based theories of trade and specialisation. Section 2.1reviews the main theories and empirical evidence; Section 2.2 looks at the impact ofspecialisation on growth and international competitiveness; Section 2.3 examines the
Literature on the ICTrevolution (Section 4)
Literature ontechnology &specialisation(Section 2)
Literature on the rise ofbusiness services and theinternationalisation ofservices (Section 3)
Literature on theinternationalisation oftechnology (section 5)
Impact on growth and employment creation (all Sections)
5
relationship between specialisation and employment creation; finally, Section 2.4 emphasisesthe open questions and the directions for future research.
2.1 Technology and specialisation: theories and empirical evidence
The consideration of technology like a key determinant of country and sectorial tradeperformance has generated an impressive development of theoretical and empirical proposalsin the last years. Two themes in particular have received special attention in recent years:
• The first relates to the way in which technology enters as an explanation of the direction ofcountries’ trade specialisation.
• The second concerns to the characteristic traits of trade and technological specialisationpatterns of advanced countries: degree of stability, degree of concentration and trends toconvergence versus divergence over time.
Next, we present a brief description of the theoretical and the empirical literature around thesethemes. It is important to emphasise that almost all empirical research is confined to themanufacturing sector. This is a serious limitation if we agree with Laursen (2000, p. 12) that"private service sector makes up the same proposition of the economy as does manufacturingin many developed countries" and that "service sector is not only a growing sector indevelopment economies but also a more innovative sector in recent years".
2.1.1 The impact of technology on trade competitiveness and specialisation
Under the label of ‘technology gap theory’ Posner (1961) introduced the idea that temporarymonopoly profits can be appropriated, based on a technological lead, in an international tradecontext. Given the assumption that technology is not a free and universally available good,Posner argued that while technology might be important for trade in some sectors, and not inothers, innovations made in one country (in technology intensive sectors) would benefit thatcountry as long as the lead could be kept. That is, a country will have ample first-moveradvantages in a given sector, until other countries have imitated the innovation. Hence, in theoriginal formulation of Posner, once imitation has taken place, more traditional factors ofadjustment and specialisation would take over and determine trade flows. However, as arguedby Dosi and Soete (1988), there is not necessarily anything impermanent about theimportance of technology in determining trade flows, since static and dynamic scaleeconomies flowing from the initial break-through act to prolong the lead. Coupled with newproduct innovations, these scale economies might well secure a continuous trade flow. Aformalised neoclassical treatment of aspects of the idea is found in Krugman (1985). Metcalfeand Soete (1984) also observe that trade can be due to the difference between national rates ofdiffusion of demand and capacity growth and to time lags in technology transfer with respectboth to demand and production. While this type of trade should be transitory, it is possiblethat different diffusion patterns may result in different patterns of development within atechnology, thus affecting countries’ long-run comparative advantages. Overall studies usingthe technology-gap approach to trade emphasise inter-country differences in technical changeas the basis of international trade flows. In this framework it is variation across countries ininnovation capabilities within each sector, rather than inter-industry differences inendowments, which matters in explaining the direction of trade.
From an empirical point of view, the technology gap theory has gained support among othersfrom Soete (1981) and Dosi et al. (1990). Based on cross-country regression analysis, for asingle year, these two studies showed that among 40 sectors in about half of them
6
international competitiveness was influenced by technological advantages (measured as USpatents) in the same sector. From a panel data perspective, in a dynamic setting - and in anaggregate country perspective - Amendola et al. (1993) found convincing support for thehypothesis as well. Also applying panel data - and from a sectoral as well as a country-wiseperspective - Amable and Verspagen (1995) showed that competitiveness in trade wassignificantly influenced by technological capabilities (US patenting) in eleven out of theeighteen sectors in question, when using a dynamic specification of the model.
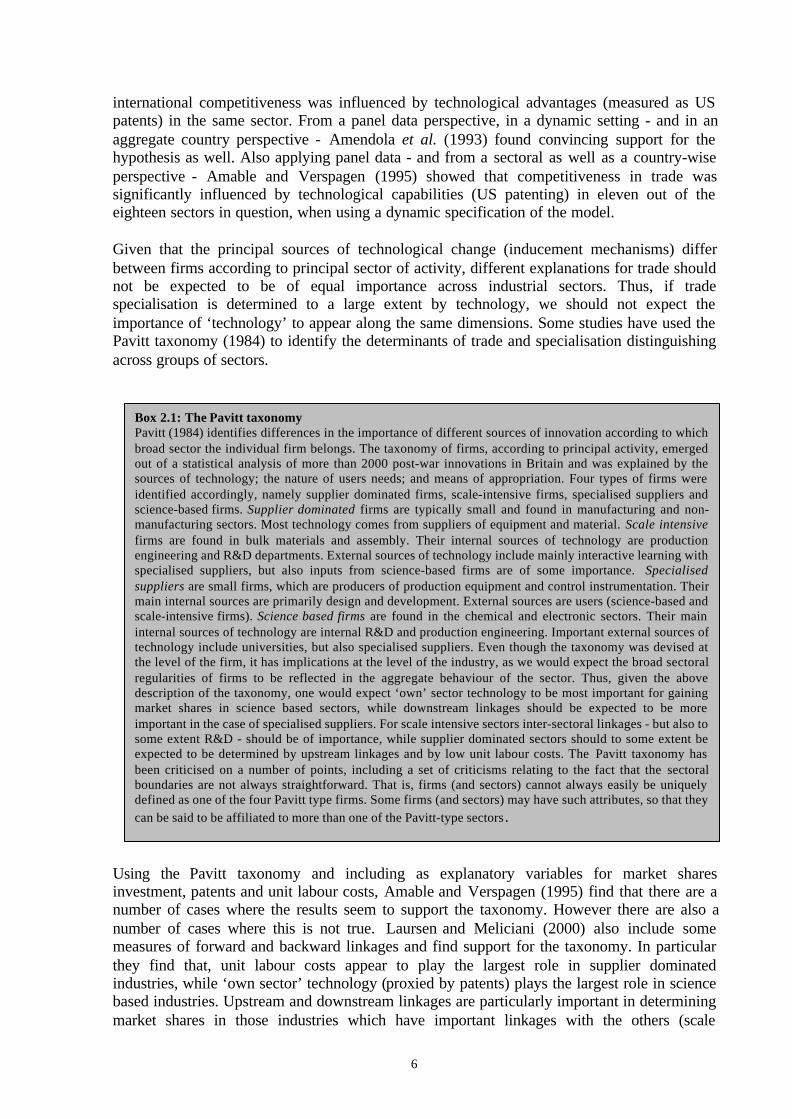
Given that the principal sources of technological change (inducement mechanisms) differbetween firms according to principal sector of activity, different explanations for trade shouldnot be expected to be of equal importance across industrial sectors. Thus, if tradespecialisation is determined to a large extent by technology, we should not expect theimportance of ‘technology’ to appear along the same dimensions. Some studies have used thePavitt taxonomy (1984) to identify the determinants of trade and specialisation distinguishingacross groups of sectors.
Using the Pavitt taxonomy and including as explanatory variables for market sharesinvestment, patents and unit labour costs, Amable and Verspagen (1995) find that there are anumber of cases where the results seem to support the taxonomy. However there are also anumber of cases where this is not true. Laursen and Meliciani (2000) also include somemeasures of forward and backward linkages and find support for the taxonomy. In particularthey find that, unit labour costs appear to play the largest role in supplier dominatedindustries, while ‘own sector’ technology (proxied by patents) plays the largest role in sciencebased industries. Upstream and downstream linkages are particularly important in determiningmarket shares in those industries which have important linkages with the others (scale
Box 2.1: The Pavitt taxonomyPavitt (1984) identifies differences in the importance of different sources of innovation according to whichbroad sector the individual firm belongs. The taxonomy of firms, according to principal activity, emergedout of a statistical analysis of more than 2000 post-war innovations in Britain and was explained by thesources of technology; the nature of users needs; and means of appropriation. Four types of firms wereidentified accordingly, namely supplier dominated firms, scale-intensive firms, specialised suppliers andscience-based firms. Supplier dominated firms are typically small and found in manufacturing and non-manufacturing sectors. Most technology comes from suppliers of equipment and material. Scale intensivefirms are found in bulk materials and assembly. Their internal sources of technology are productionengineering and R&D departments. External sources of technology include mainly interactive learning withspecialised suppliers, but also inputs from science-based firms are of some importance. Specialisedsuppliers are small firms, which are producers of production equipment and control instrumentation. Theirmain internal sources are primarily design and development. External sources are users (science-based andscale-intensive firms). Science based firms are found in the chemical and electronic sectors. Their maininternal sources of technology are internal R&D and production engineering. Important external sources oftechnology include universities, but also specialised suppliers. Even though the taxonomy was devised atthe level of the firm, it has implications at the level of the industry, as we would expect the broad sectoralregularities of firms to be reflected in the aggregate behaviour of the sector. Thus, given the abovedescription of the taxonomy, one would expect ‘own’ sector technology to be most important for gainingmarket shares in science based sectors, while downstream linkages should be expected to be moreimportant in the case of specialised suppliers. For scale intensive sectors inter-sectoral linkages - but also tosome extent R&D - should be of importance, while supplier dominated sectors should to some extent beexpected to be determined by upstream linkages and by low unit labour costs. The Pavitt taxonomy hasbeen criticised on a number of points, including a set of criticisms relating to the fact that the sectoralboundaries are not always straightforward. That is, firms (and sectors) cannot always easily be uniquelydefined as one of the four Pavitt type firms. Some firms (and sectors) may have such attributes, so that theycan be said to be affiliated to more than one of the Pavitt-type sectors.

7
intensive for upstream linkages and specialised suppliers for downstream linkages,respectively). Padoan (1998) also uses the Pavitt taxonomy to explain export and importshares in a dynamic model where knowledge accumulation affects trade performance andcompetitiveness but also trade enhance knowledge accumulation through imports. He findsthat the results are consistent with theoretical expectations about the importance of price andnon price determinants of trade performance in the four Pavitt’s macrosectors.
The technology-gap approach, in the most recent literature, has been used more often toexplain market shares rather than specialisation. Also the Pavitt taxonomy has been used inthis context with the aim of pointing out that different “factors of competitiveness” mightmatter more or less in different industries.
2.1.2 Trends in specialisation patterns
Taking into account the importance of technology like a key determinant of trade performanceand its principal microeconomic features, the empirical literature has also addressed thefollowing questions:
a) What is the degree of concentration of trade and technological specialisation patterns? Dothe countries tend to be more or less specialised over time?
b) What is the degree of similarity among specialisation patterns of advanced economies? Docountries converge or diverge in terms of specialisation patterns over time?
c) Are trade and technological specialisation patterns stable across countries and sectors?
Empirical studies do not show convincing conclusions in relation to the issue of the degree ofconcentration of each national pattern of specialisation. The findings of Amendola et al.(1992, 1998) show that in each country trade specialisation appears to be more concentratedthan technological specialisation, while the reverse is true in the work of Barcenilla (1999).Nevertheless, in the studies of Soete (1987), Archibugi and Pianta (1992a, 1992b), Amendolaet al. (1992, 1998) and Barcenilla (1999) there is a general consensus in the following result:smaller countries display a level of specialisation higher than big countries like Germany orFrance. This result reflects the fact that smaller countries need to reach a minimal dimensionin R&D and production to specialise in specific sectors. It is possible to notice a trend to de-specialisation in time that is evident in the trade field (Barcenilla, 1999; Laursen , 2000) andmore controversial in the technological field. Cantwell (1991) and Archibugi and Pianta(1992b) found an increase in technological specialisation. This is in contrast with the resultsof Barcenilla (1999) and Laursen (2000).
The issue of convergence is a major theme in economic research. General findings on thisissue show a clear economic or global convergence between advanced nations. The role oftechnology in this process is crucial, with innovations and product and process imitationleading to rapid diffusion of technical progress. Nevertheless, empirical studies ontechnological and trade specialisation have not reached clear conclusions.
The papers of Beelen and Verspagen (1994), Soete and Verspagen (1994), Barcenilla (1999)and Laursen (2000) show a tendency of trade specialisation patterns to converge, in contrastwith the findings of Wolff (1997) who recognises convergence in terms of factor endowmentsbut not in terms of patterns of specialisation. The results of Barcenilla (1999) show that theprocess of convergence is more evident in the technological than in the trade field. The

8
opposite is true in the findings of Archibugi and Pianta (1998) or Amendola et al. (1998) whoemphasise the existence of a paradox: a process of aggregate convergence is taking place withincreasing specialisation in selected technological niches by industrialised countries.
Finally, the hypothesis that national specialisation patterns evolve gradually and cumulativelyhas found great support in the empirical literature. It is especially true in the trade field. Theresults of Amendola et al. (1998), Barcenilla (1999) and Laursen (2000) confirm, in line withevolutionary theorising, that national export specialisation patterns are quite complex. Thestability of technological specialisation in the short and medium term is also recognised byPavitt (1988) and Cantwell (1989). However, the results of Barcenilla (1999) do not supportthe evolutionary hypothesis with respect to the technological field. Also Laursen (2000)specify that, in comparison, trade specialisation patterns are more stable than technologicalones. On this matter, Amendola et al. (1992) find that over long periods, the persistence oftechnological specialisation tends to fade away because of the emergence of newtechnological paradigms and new industries.
Recently, a study by Midelfart-Knarvik et al. (2000) has focussed on similar questionsadopting a different theoretical framework that draws both from factor-endowment and new-geography theories of specialisation. One of the merits of this study is that it considers alsosome service industries. The idea is that closer European integration is likely to bring with itmajor changes in industrial location. Industries will move to exploit differences in countries'comparative advantages. Moreover integration may change the attractiveness of central areasrelative to peripheral ones and may facilitate the clustering of activities that benefit fromlinkages with each other. The objectives of the study are to describe the changes in industriallocation that have occurred in Europe in recent decades; to establish whether these areassociated with countries’ economic structures becoming more or less similar, and industriesbecoming more or less spatially concentrated; to compare industrial location patterns inEurope and the US; and to identify the underlying forces that determine industrial locationand assess the extent to which these have changed in recent years. The authors find that:
a) Most European countries showed significant convergence of their industrial structureduring the 1970s, but this trend was reversed in the early 1980s. There has beensubstantial divergence from the early 1980s onwards, as countries have becomeincreasingly different from the average of the rest of the EU and, in bilateralcomparisons, from most of their EU partners.
b) The most dramatic changes in industry structure have been the expansion of relativelyhigh technology and high skill industries in Ireland and in Finland. However, thespecialisation process has occurred more generally, with nearly all countries showingincreasing difference from the early 1980s onwards.
c) Many, although not all, industries have experienced significant changes in theirlocation. In particular a number of industries that were initially spatially dispersed havebecome more concentrated. These are mainly slow growing and unskilled labourintensive industries whose relative contraction has been accompanied by spatialconcentration, usually in peripheral low wage economies. Amongst industries that wereinitially spatially concentrated, around half stayed concentrated. Significant dispersionhas occurred in a number of medium and high technology industries and in relativelyhigh growth sectors, with activity typically spreading out from the central Europeancountries.
9
d) Services are in general more dispersed than manufacturing. Two trends – the generalshift from manufacturing to services, and catch up by poorer countries with smallinitial services sectors – have reinforced this spatial dispersion of services.
e) While the industrial structures of EU countries are diverging, those of US states areconverging. However, in so far as it is possible to make any comparison of levels ofindustrial concentration between the EU and the US, they find that EU industries arestill less concentrated than are those in the US.
2.2 The impact of specialisation on international competitiveness and economic growth
Recently there has been a growing empirical literature on the relationship betweenspecialisation and trade and growth performance. This literature is very heterogeneous both inthe theoretical framework adopted and in the methodology. Moreover it mostly aims at testingsome ideas of various theoretical frameworks but it is rarely directly linked to any specificmodel. In other words the estimated equations are not, in most of the cases, reduced forms ofany specific theoretical model.
One way of looking at the impact of the different composition of national activities acrosssectors on countries’ trade performance has been the use of constant market share analysis.This approach aims at detecting to what degree the changes in the market share of a country inthe world market can be explained by the initial commodity composition of each country’sexports. In order to do so, it decomposes the overall change in market share into a structuraland a competitiveness component; the first effect is the difference between the hypotheticalshare had the single commodity shares remained constant at the initial commodity shares,while the second effect is the difference between the actual share and the hypothetical share.Most recent studies using constant market share analysis include Guerrieri and Milana (1995),Fagerberg (1996) and Laursen (1999). Guerrieri and Milana find that structural effectscontributed much to the remarkable gains in export shares achieved by Japan and the EastAsian NICs over the period 1973-90: these countries were able to improve their comparativeadvantage in high-technology goods as a whole and in particular in the field of electronics.Fagerberg finds that, between 1965 and 1990, trade in commodities with high R&Dexpenditures grew faster than other trade, and these changes were more favourable for thelarge and medium-sized high-income countries of the OECD area. Laursen, applying constantmarket share analysis to technology (patent data), finds that the catching-up countries (withthe exception of Japan) have been able to acquire market and technology shares despite their“wrong” specialisation pattern.
Other studies, within different theoretical frameworks, have directly analysed the impact ofthe degree and the “quality” of specialisation (either technological or trade specialisation) oncountries’ growth and trade performance. Table 2.1 summarises the main results emergingfrom these studies.
In a study directed at investigating the technological specialisation of the most advancedcountries, with no explicit theoretical claim, Archibugi and Pianta (1992b) made an attempt tocapture the effects of specialisation on growth, estimating an equation where growth inindustrial production is explained by specialisation in fast-growing patent classes, and anequation where it is related to the degree of specialisation (measured by the value of the Chi-squared statistics, a measure of concentration). They found no evidence of a significantrelationship between specialisation in the fast-growing patent classes and growth in industrial

10
production, while they found a strong link with the overall degree of specialisation. Theirresults suggest that there is a general advantage in being specialised that goes beyond thechoice of the more dynamic sectors. In a similar study, but using only correlation analysis,Pianta and Meliciani (1996) found a significant correlation between the degree oftechnological specialisation (measured by the value of the Chi-squared statistics) andcountries’ rates of growth. They also found that technological specialisation in electronics wasnot significantly correlated with countries’ rates of growth.
Table 2.1: The impact of specialisation on economic performance
Study Methodology Dependent variable Specialisation SignificantArchibugi and Pianta(1992b)
Pianta and Meliciani(1996)
Laursen (1999)
Dalum, Laursen andVerspagen (1999)
Amable (1996)
Pianta (1997)
Meliciani and Simonetti(1998)
Padoan (1998)
Meliciani (2001)
Regressionanalysis
Correlationanalysis
Regressionanalysis
Regressionanalysis
Regressionanalysis
Regressionanalysis
RegressionAnalysis
Regressionanalysis andsimulation
Regressionanalysis
Rate of growth ofindustrial production
Rate of growth of GDP
Rate of growth of exports
Sectoral growth of valueadded
Rate of growth of GDP
Rate of growth ofsectoral technologyRate of growth ofsectoral productionRate of growth ofsectoral exports
Rate of growth of GDP
Rate of growth of GDP,export and import shares
Rate of growth of GDP,export and import shares
Specialisation in fast growingpatent classesDegree of technologicalspecialisation
Technological specialisation inelectronics
Structural technology effectTechnology adaptation effectStructural market effect
Specialisation for each of thesector product groups
Inter-industry trade specialisationindexTrade specialisation in electronics
Technological specialisation inthe same sectorProduction specialisation in thesame sectorTrade specialisation in the samesector
Specialisation in fast growingpatent classesSpecialisation in ICT
Sectoral approach
Specialisation in fast-growingpatent classes
No
Yes
No
NoYesYes
Yes
Yes
Yes
No
No
No
Yes
Yes
Yes
Yes
Laursen (1999) estimates a technology-gap model of international competitiveness wheretechnological opportunity is assumed to affect countries’ ability to compete in internationalmarkets: assuming that technology is an important determinant of export growth, it can beexpected that countries which have access to sectors (or activities) offering high (low) levelsof technological opportunity will benefit from higher (lower) international demand. Withinthis framework, changes in trade performance are explained in terms of changes in unit labour
11
costs, investment, catching-up, a structural market effect (the advantage coming from beinginitially specialised in the classes that grew more in terms of exports), a structural technologyeffect (the advantage coming from being initially specialised in the classes that grew more interms of patents) and a technology adaptation effect (the ability to move actively into thetechnological sectors with above-average rates of growth). The results give no support for thestructural technology effect to have an impact on market shares, while a significant effect isfound for the technology growth adaptation effect and the structural market effect. Laursencomments on the results by stating that ‘it appears to be more important for national systemsof innovation to actively move into sectors offering above average technological opportunity,rather than being “fortunately” specialised initially’ (Laursen, 1999, p. 18).
Dalum, Laursen and Verspagen (1999) explore the relationship between specialisation andgrowth, arguing that this can be justified on the grounds of both supply-side elements(specialisation leads to higher productivity growth in the form of learning, and to the extent towhich different sectors or activities are characterised by different learning opportunitiesdifferent specialisation patterns can offer different growth opportunities) and demand-sideelements (Engel’s law, or the idea that as income rises demand for some goods grow morerapidly than for other goods). The supply-side elements are discussed in both the new growththeory and the evolutionary approach, while the demand-side arguments are characteristic ofthe post-keynesian and the evolutionary approaches. Dalum, Laursen and Verspagen do notcommit to any of the specific modelling environments proposed by the theories; rather theirapproach is based on a combination of certain elements of all theoretical frameworksdiscussed above.
In order to test the hypothesis that the structure of an economy matters for economic growth,they run a regression with the sectoral growth of value added as the dependent variable, andseveral variables (the growth rate of employment, the investment-output ratio, the number ofpatents granted in the US per employee, and the ratio of value added per employee relative tothe maximum level for the sector, as a measure of the scope for catching-up) together with ameasure of specialisation, as explanatory variables for a sample of OECD countries over theperiod 1965-88. The specialisation variable is computed as the revealed comparativeadvantage (RCA) for each of the sectors’ product groups; however owing to the large numberof product groups within some sectors they include in the regression only up to three of theprincipal components. The results for the specialisation variable show that, for all sectors buttextiles and basic metals, there is at least one, but often more, principal component for eachtime period (the time periods are 1965-1973, 1973-1979 and 1979-1988) that is significant.Over time the number of sectors where specialisation is significant appears to decrease.Looking at which activities have had a positive impact on growth, they find some unexpectedresults (for example that specialisation in semiconductors turns out to have had a negativeimpact on the rate of growth of the electrical goods sector in spite of high growth of trade insemiconductors). They conclude that a complex set of interacting supply and demand sidefactors can lead to unpredictable results as to which activities offer better opportunities forgrowth. Finally they also find that specialisation in some product groups has different impactson growth over time (positive or negative), and therefore policies aimed at changing thespecialisation patterns of the economy are risky and difficult to implement. Overall this studygives support to the view that specialisation can have an impact on growth, but fails toidentify some characteristics within the different product groups that can be beneficial ordetrimental to the growth process (it gives an ex post account of which product groupscontributed positively to sectoral growth with no ex ante explanation).
12
Amable (1996) refers to the work of Grossman and Helpman (1991), Rivera Batiz and Romer(1991), Lucas (1988), Young (1991) and Matsuyama (1992) as theoretical models where tradeaffects economic growth. In the first two studies the exchange of technical information, thediffusion of knowledge, scale effects and the differentiation of innovations (the consequenceof preventing duplication in research) act to enhance technical change, productivity and/orconsumers’ utility. In these models therefore it is the opening up of trade with the resultingprocess of specialisation that can be beneficial for growth, independently from the sectors inwhich countries specialise. In the other studies not every effect of international trade isnecessarily beneficial to growth. If international specialisation diverts a country fromtechnology-intensive industries, the opening up of trade can have a negative effect oncountries’ rates of growth. Referring to these streams of literature, Amable estimates anequation where growth depends on catching-up, education, investment and some measures ofspecialisation, in a sample of OECD as well as some Asian and Latin American countriesover the period 1960-90 (panel data). He uses three different measures of trade specialisation:inter-industry specialisation, a trade dissimilarity indicator, and an indicator of comparativeadvantage in electronics. The inter-industry specialisation index (Michaely index) is high if acountry’s trade structure is characterised by the coexistence of clearly defined export andimport industries, irrespective of the aggregate trade surplus: the higher the index the moretrade balances are dissimilar between industries, i.e. the higher is specialisation. The tradedissimilarity indicator measures the dissimilarity between a country’s trade pattern andinternational demand patterns: it is higher when a country exports commodities in an industrywhere international demand is relatively low. Its effect on growth is therefore expected to benegative. Considering that electronics has enjoyed fast rates of technological progress and hashad pervasive effects throughout most industry and service activities, specialisation inelectronics is expected to have a positive effect on economic growth. He finds a positiveeffect of inter-industry specialisation and also of specialisation in electronics, concluding thatthe positive influence of inter-industry specialisation does not mean that all patterns ofspecialisation are equivalent. On the contrary, countries specialised in electronics appear tohave experienced above-average rates of growth, and this lends some support to the view thatelectronics is a ‘strategic’ branch of activity.
Pianta (1997) investigates whether growth in technology, production and exports is higher inthe sectors where countries show stronger specialisation (measured by comparativeadvantage). He finds for a pooled sample of the six largest OECD countries (US, Japan,Germany, France, UK, and Italy) and 19 sectors, between the 1980s and the 1990s, thatnational sectoral performances in either production, export or patenting are negatively relatedto existing specialisation patterns. He concludes by stating that a sort of ‘decreasing returns’to specialisation appear to emerge that are at odds with the view of increasing benefits fromcomparative advantage: the presence of relative strengths within some sectors do not lead tohigher rates of growth within the same sectors either in technology, or in production andexports.
Meliciani and Simonetti (1998) look at the impact of specialisation in fast-growing patentfields and in ICT on economic growth, also controlling for the investment activity and theoverall technological intensity of the countries. They find that specialisation in ICT has apositive and significant impact on GDP growth over the whole period (70-93), whilespecialisation is fast-growing patent fields becomes significant only from the 1980s. Theyexplain this result considering that in the ‘70s many fast growing technology fields were stilllinked to the old technological paradigm, while the ICT paradigm becomes dominant startingfrom the 1980s.
13
Padoan (1998) estimates a dynamic disequilibrium model focused on trade specialisation andknowledge accumulation. The sectoral breakdown follows Pavitt taxonomy by groupingmanufacturing goods into four macrosectors. The empirical estimation shows the importanceof both price and non-price determinants of trade. Moreover simulation exercises confirmsteady state results on the relevance of country differences in trade specialisation and indomestic knowledge accumulation in affecting growth and they also clarify the relationshipbetween growth and changes in the structure of trade specialisation.
Meliciani (2001; 2002) looks at the impact of specialisation in fast-growing patent field oneconomic growth through the balance of payments. She finds that countries specialised infast-growing fields experience above average growth in export shares and below averagegrowth in import shares, with an overall positive impact on GDP growth through the balanceof payments.
Overall the empirical evidence on the importance of specialisation for internationalcompetitiveness and growth is controversial. While most studies find a link betweenspecialisation and growth and trade performance, there is no clear evidence whetherspecialisation matters per se, due to increasing returns, or if there are activities that offerbetter opportunities for growth. The rising importance of ICT, particularly over the 1980s, hasto be taken into account in order to understand the performance of different countries intechnology, trade and production. This can be an explanation for the limitations ofspecialisation per se to offer high growth opportunities in the more recent period.
2.3 Specialisation and employment creation
The debate on the effect of technological change on unemployment focuses on the labour-saving impact of process innovations and on the capability of the system to compensate theinitial displacement. Whereas the labour-saving effects of process innovations are only partlycompensated elsewhere in the system, by most of the various compensation mechanisms, thejob creation effects of product innovations can be very substantial and have a powerfulcompensating impact. To the extent therefore that the profits from labour saving processinnovation are subsequently channelled, directly or indirectly, into the development of newproducts and services, this provides the best possibility to generate new employment. This hasbeen particularly evident both in the US and in East Asia, but clearly Europe has not benefitedso much from this mechanism (Vivarelli, 1995). The job-creating and job-replacing effects oftechnical change have to be investigated in order to understand whether the sectors wheremore technological accumulation is taking place are also the fields where production andemployment grow.
The debate over the microeconomic causes of unemployment (or of equilibriumunemployment) largely ignores product composition even though this could be quite relevantfor determining equilibrium unemployment and its evolution over time. This point can beclarified by considering labour demand and supply effects. To the extent that labour demandis determined by product demand, the sectorial product composition affects demand for laboursince different products or sectors display different rates of growth of demand. The referencescommonly found in the literature relate to the distinction between mature and new productsand between industrial and service products. The demand for labour should grow faster innew sectors and in services. The available evidence confirms that the larger growth-elasticityof employment is found in services (in Europe as well as in the US) even though in the lattercase the growth elasticity of employment is high even in the manufacturing sector. On theother hand, as shown in the literature on endogenous growth and on the service economy, a
14
well developed advanced service sector generates positive externalities for the industrialsector. In the second place, given that productivity growth in services is lower than inindustry, the employment content of growth is enhanced by a higher share of services inoutput. A service orientation of employment has been under way for some time in theindustrialised economies at approximately the same rate as that of the share of value added inindustry and services (Baumol, Blackman, Wolff, 1989).
Product composition matters in determining the position and the evolution over time of thedemand for labour; however, the technological intensity for a given sectorial composition isalso relevant. It is not obvious that sectors of high demand growth or high technologicalinnovation are also those with the greatest growth of employment. As shown in Padoan(2000) the employment trend is worse in the so-called traditional sectors, and some of thehigh technology sectors display the best employment performance. The sectorial employmentdynamic within the manufacturing sector is highly variable, while the sector's overall trend isnegative. The main implication is that the production specialisation of a country and itsevolution are relevant for structural unemployment. This is another element of diversificationamong European countries (and regions).
The above considerations make it difficult to evaluate the role of the so-called technologicalcomponent of unemployment, i.e., whether the introduction of technology intensive products -which, per se, diminishes employment per unit - offsets the greater absolute employmentcreated by larger output. Available empirical evidence seems to confirm that employmentgrowth tends to be positive, or at least more sustained, in high-tech sectors. Moreover, there isevidence of a positive relation between innovation effort - as measured in terms of R&Dexpenditure as well as patenting - and employment. Of course, employment growth inducedby technological innovation will be possible to the extent that an adequate, highly trained,labour force will be available i.e., to the extent that a recomposition of labour demand ismatched by a recomposition of supply.
The dynamics of world demand are frequently associated with traditional (or mature) sectorswith low growth rates of demand, and innovative segments (often those with a high valueadded) with high growth rates (European Commission, 1998). Nevertheless, several studiesoffer a more complex picture. In a longer time-horizon we can discard cyclical componentsand concentrate the growth of international trade volumes (exports and imports of the mainOECD countries) as reference. We note that some medium-to-high-added-value sectors haveshown percentage growth rates lower than the industrial average in 1980-94 (and in 1970-94);this is the case of the petrochemical and steel segments, construction materials and food &beverages. On the other hand, trade volume have grown at a sustained pace in "traditional"segments such as furniture, footwear and clothing, in addition - as is to be expected - tochemistry (including pharmaceutics), machinery (including computers, consumer electronicsand telecommunications) and vehicles. Thus, the equation "traditional equals static" is notalways valid. This can help explain the relative employment creation performance ofsegments such as furniture, but it runs up against tangibly negative employment data in othertraditional sectors (even in those with sustained trade growth).
Several studies allow to classify the industrial sectors on the basis of a few parameters such asmarket concentration, the share of the factors of production in value added, returns to scale,intensity of R&D, and the number of patents (Davies and Lyons, 1996; OECD, 1996). A firstgroup of sectors with high R&D and skilled-labour intensity is also associated with high ratesof growth of world demand (computers, telecommunications, other chemicals and somesegments of the transport equipment). Among the capital-intensive sectors, we must

15
distinguish between skilled labour intensive ones (food, motor vehicles) and those whichemploy mostly unskilled labour (textiles, steel, glass, rubber and plastics). Finally, we canidentify sectors, respectively of high skilled-labour intensity (machinery, professionalinstruments, electrical equipment) and unskilled-labour intensity (clothing, furniture, leather,some metal products). In the high-tech and high added-value sectors, Europe as a wholedisplays a low "quality" of production specialisation, i.e., ability of generating value addedand of rewarding factors of production with high returns. While, in fact, only the US andJapan are specialised, respectively, in computers and telecommunications equipment both arealso specialised in vehicles (together with Germany and Spain), some EU countries arespecialised in chemicals (including Germany, France, UK and Netherlands) and in industrialmachinery (Germany, France, Italy, UK, Sweden and the Netherlands). Europe's limitedpresence in the high-tech sectors should be ascribed to a generally modest intensity of R&D inmany European countries (excluding Scandinavia, as well as non-EU Switzerland), measuredboth by low input levels of R&D and low output levels of patents.
2.4 Open questions and directions for future research
The literature reviewed so far is almost entirely confined to the manufacturing sector (oneexception is the paper by Midelfart-Knarvik et al.). This is a serious limitation when we wantto examine the impact of specialisation on growth and employment creation, especially inindustrialised countries. In fact in the EU services as a whole account for approaching two-thirds of output and employment. Moreover the development of new technologies have madethe manufacturing and the service sector much more interdependent. In particular services(especially business services) are playing an increasing role as suppliers of high-quality inputsinto the manufacturing process. Similarly the presence of delivery services can impact on theproductivity of manufacturing to the extent that services supply intermediate inputs to themanufacturing process. Finally the close interaction between many service activities and otherparts of the economy makes them potentially important conduits for the spread of newtechnologies, the diffusion of new knowledge and the promotion of organisational change.
We can therefore ask the questions: how is the rise of services affecting countriesspecialisation patterns? And what are the links between advanced services and manufactures?The ability to develop or adopt the new technologies in one country - to the extent that itaffects the development of high-quality business services - has not only a direct impact onnational specialisation in the manufacturing sector. It also has an indirect effect through theinterdependencies between the manufacturing and the service sector. This set of issues will beemphasised in Section 3.
The literature on technology and specialisation has also mostly ignored the issue of theinternationalisation (globalisation) of technology. The lack of interest in the location oftechnological activity by Multinational Enterprises (MNEs) can be attributed to thewidespread belief that MNEs were concentrating innovation activity in their home country.While this could be the case until recently, in the past decade the significance of theinternationalisation of R&D activities of MNEs has been growing. Moreover European firms,especially from small countries, have shown historically a higher tendency, with respect toAmerican firms, to conduct both production and innovation activities abroad.
The impact of these trends on national performance and, in particular, whether technologicalglobalisation has weakened the links between a country’s knowledge base and its trade,growth and employment performance is a controversial issue. Section 5 will focus on theoriesand empirical evidence concerning the globalisation of technology.
16
The processes of transformation that we have emphasised (the rise of business services andthe globalisation of technology) are strongly affected by the development and diffusion ofICT. Technological developments in telecommunications and information technology haveboosted the potential of many producer services. Also the internationalisation of services hastaken a major leap in the last two decades due to the revolution in ICT industries. MoreoverICT have a direct impact on countries’ specialisation patterns and growth and employmentperformance. Section 4 will deal with the most relevant issues raised by the diffusion of ICT.
3. Services
In developed countries the services sector has become increasingly important over the lastcouple of decades. In the EU services as a whole account for approaching two-thirds of outputand employment; for market services the share of output is close to 50%. Initially the growingimportance of services was met with concern since the services sector exhibits relatively lowproductivity growth. The expansion of services could well attract labour away from relativelyhigh growth manufacturing sectors into low-growth services industries. As a result, this trendwould lead to a reduction in economic growth. By contrast, more recently many have come tothe believe that there is something very positive about the growing importance of services orat least some groups of services. They put great emphasis on the role of producer servicesgenerally and information and communications technology (ICT) in particular. However todate there has been relatively little research, especially on the empirical side, that analyses thedifferential impact of individual services on economic growth.
The aim of this section is to provide a review of the literature on the economics of services,and in particular the internationalisation of services, as a contribution to the wider literaturereview. Not only has the relative importance of services in domestic production increased, butalso it has become increasingly clear that services are not as non-tradable as had beengenerally assumed. Even though this may never have been a very appropriate assumption, theinternationalisation of services has taken a major leap in the last two decades due to therevolution in ICT industries and the trend towards deregulation in domestic markets.Throughout the section special attention is given where possible to three key servicesindustries: distribution, management consulting and financial services.
The section is structured as follows. In Section 3.1 some concepts and definitions related tothe nature of services as well as to the internationalisation of services will be discussed. InSection 3.2 the recent developments in the internationalisation of services will be analysed.Section 3.3 reviews the regulatory environment for services both in the context of the EU andin the WTO. Section 3.4 examines how specialisation in services and the internationalisationof services affect economic growth and employment. Finally Section 3.5 discusses some openissues and directions for future research.
3.1 What are services?This section discusses first a number of concepts and issues related to the nature of services.Secondly, concepts related to the internationalisation of services will be examined.
3.1.1 Services versus goodsServices have long been defined negatively as all economic activities whose output is neitheragricultural nor a manufactured product. In a now classic study Fuchs (1968) tried to pindown the nature of services. Fuchs defines services on the basis of three key features. Thefirst feature that distinguishes services from goods resides in the non-storable nature of

17
services. As a result services have to be produced and consumed in the same place and at thesame time (generally referred to as the ‘physical proximity requirement’). Bhagwati (1984)and others have noted that due to the technological developments in telecommunications andinformation technology services the physical proximity requirement in the delivery of servicesmay have been reduced.1 However, the scope of separating receivers and providersgeographically may be limited due to the intangible nature of services, the second featureemphasised by Fuchs. Factor services are not as in manufactures employed to producephysical outputs, but factors instead produce intangible assets. Consequently, problems ofasymmetric information may arise as it is impossible to assess the quality of the service priorto purchase. Building a reputation is crucial to the strategy of services providers. Creatingtrust requires establishing long-term relationships which are importantly shaped by personalcontacts. The intangibility of services explains therefore the path-dependence thatcharacterises many service industries. Third, not only are services generally produced wherethey are consumed but they are also produced with the participation of the consumer, that is,services tend to be customised. Both intangibility and customisation tend to reinforce the‘physical proximity requirement’.
Hill (1977, p. 317-318) proposes a truly general definition distinguishing services from goods.“A good may be defined as a physical object which is appropriable and therefore transferablebetween economic units. A service – on the contrary – may be defined as a change in thecondition of a person, or of a good belonging to some economic unit, which is brought aboutas a result of the activity of some other economic unit, with agreement of the former person oreconomic unit”. According to this definition services are no longer considered as immaterialgoods, but are different in essence by being a change (Siniscalco, 1988). 2
More recently researchers seem to have abandoned the goal of defining services generally,instead they tend to adopt a more pragmatic approach acknowledging that the services sectorcomprises an extremely diverse set of economic activities. More attention is now directedtowards developing sensible classifications that allow one to answer more specific questions.
3.1.2 The internationalisation of servicesSampson and Snape (1985) argue that a definition based on geography as is used for goods, isnot appropriate, because this would exclude, for example, tourism. Indeed, they defineinternational transactions of services as ‘a transaction between the resident of one country anda resident of another’ (p. 172). However, this definition excludes for example foreignstudents. University students often spend one or more years abroad for study purposes and assuch become residents of the country of study. A more appropriate definition should thereforebe based on nationality. 3 Sapir and Winter (1994) implicitly acknowledge this as they includemigration and consequently argue that migration policy can constitute a barrier to trade.
The most common typology of international transactions in services is based on the analysisof movement of users and providers respectively that occurs for the transaction to take place
1 Bhagwati (1984) call this the ‘disembodiment effect’.2 For the measurement of services output Hill’s definition implies that one should focus on the change in thereceiver, which corresponds more to value-added than gross services output (Siniscalco, 1988). Weiss argues inresponse to Siniscalco that the challenge is to construct sound price indices as the value of the change incondition to the receiver is reflected in its price.3 Sampson and Snape’s definition however corresponds well to the existing balance of payments (BOP) statisticsas BOP statistics register transactions between residents and non-residents. A definition based on nationality,that is one that distinguishes between ‘foreign’ and ‘national’ residents is theoretically more appropriate, butpractically impossible to work with. However, analysis of the impact of GATS for example requires such data.

18
(Sampson and Snape, 1985; Sapir and Winter, 1994). This typology also provides the four‘modes of supply’ employed in the GATS.
Type 1 Neither the user nor the provider moves, but both reside in different countries. This isthe case to which Bhagwati (1984) referred. Trade in services of this type is similarto trade in goods. For this reason it is also called commodity trade. This type of tradein services is likely to arise in financial services (and some professional services).
Type 2 The user moves to the provider to receive the service. This the case in for exampletourism and education, but is not likely to be important for the three industries ofinterest in this paper. This is also called commodity trade.
Type 3 The provider moves to the user in order to perform the service. This type is referred toas factor trade (Ruane, 1990). This could be important for both financial andconsulting services if physical interaction is required but not on a regular basis.
Type 4 The provider establishes a foreign branch in order to obtain physical proximity tousers abroad. This is probably the most common type of internationalisation ofservices. It is important for banking, consultancy and distribution.
The first three types of transactions are generally referred to as trade, whereas type 4 involvesthe permanent movement of capital and possibly also labour. Theoretical models of trade inproducer services are proposed by Markusen (1989), Melvin (1989), Francois (1990a and b)Jones and Ruane (1990), Van Marrewijk et el. (1997), De Vaal and Van de Berg (1999).Models of the latter type by Van Marrewijk et al. (1996), and Markusen, Rutherford, and Tarr(2000).
Type 4 leads to the establishment of multinational service networks. Whereas internationalfragmentation of production in manufacturing is most often motivated by cost considerationsand market access, for services the ‘physical proximity requirement’ seems to be thepredominant consideration. Therefore, one may label such services providers as deliveryservices. Intuitively, it seems that service providers are more likely to establish several foreignaffiliates within a single country than for manufacturers.
For some services activities, those where economies of scale are particularly important andphysical proximity may not be regularly required, it may be justified to concentrate them inone location. Such services could be called specialist or headquarter services. Specialistservice activities are like to include management, marketing and product development.
Given those two types of services the internationalisation of services may take two forms.First, vertical fragmentation refers to the international fragmentation of the integratedactivities according to their different functions, that is, delivery and specialist activities tend tobe separated geographically (Markusen, 1984). Second, horizontal fragmentation refers to thecase where delivery and specialist services are located within the same country. Therevolution in telecommunications especially is likely to promote the establishment ofvertically fragmented networks as the intra-firm flow of information tends to be the moreintensive in such networks. However, the extent of vertical fragmentation may be very limitedas a result of diverging regulatory environment. Harmonisation in the EU may have affectedthe form of internationalisation, encouraging a further concentration of specialist services(form the national to the European level).
Within the vertical form of international fragmentation it is possible to distinguish betweenvertically concentrated and vertically dispersed organisational structures. The former refers to
19
the case where specialist activities tend to be located within agglomerations and the latterwhere specialist activities are dispersed. Their location may be based on history.
Similarly it may be useful to analyse the impact of the presence of delivery services on theproductivity of manufacturing to the extent that services supply intermediate inputs to themanufacturing process. Further, do services follow manufacturers (Sapir, 1988) or aremanufacturers attracted by advanced services infrastructure?4
In addition to the commonly used typology based on international transactions, this sectionthus introduces a new functional typology which may help to analyse in more detail type 4 ofinternationalisation in services viz:
vertical fragmentation (concentrated)vertical fragmentation (dispersed)horizontal fragmentation
3.2 Trends in servicesIn this section the extent of the internationalisation of services is analysed. Ideally, one wouldconsider trade in services (types 1 to 3), foreign direct investment in services, and migrationrelated to the internationalisation of services (type 4). Data on migration with the aim ofsupplying or receiving a service is not available.5 Only recently have statistical offices startedcollecting FDI data that distinguish between services and manufacturing. Disaggregated FDIdata distinguishing different services sectors is available only for the United States. Thereview deals first with trade in services followed by FDI in services.
3.2.1 Trade in servicesTrade in services is measured according to the residential definition of internationaltransactions. As a result international trade between ‘foreign’ and ‘national’ residents of thesame country is omitted. Non-residents become residents if they reside in the country for oneyear or more. Trade in services in this section only approximates to types 1-3, thusunderestimating the extent of internationalisation in services.
Empirical research on trade in services is quite limited, not least because of the availabilityand quality of statistics of trade in services. Some have employed production and employmentdata in order to make inferences regarding the pattern of specialisation in a way to bypass datalimitations on trade. However, it seems that such measures differ importantly from trade-based indices.
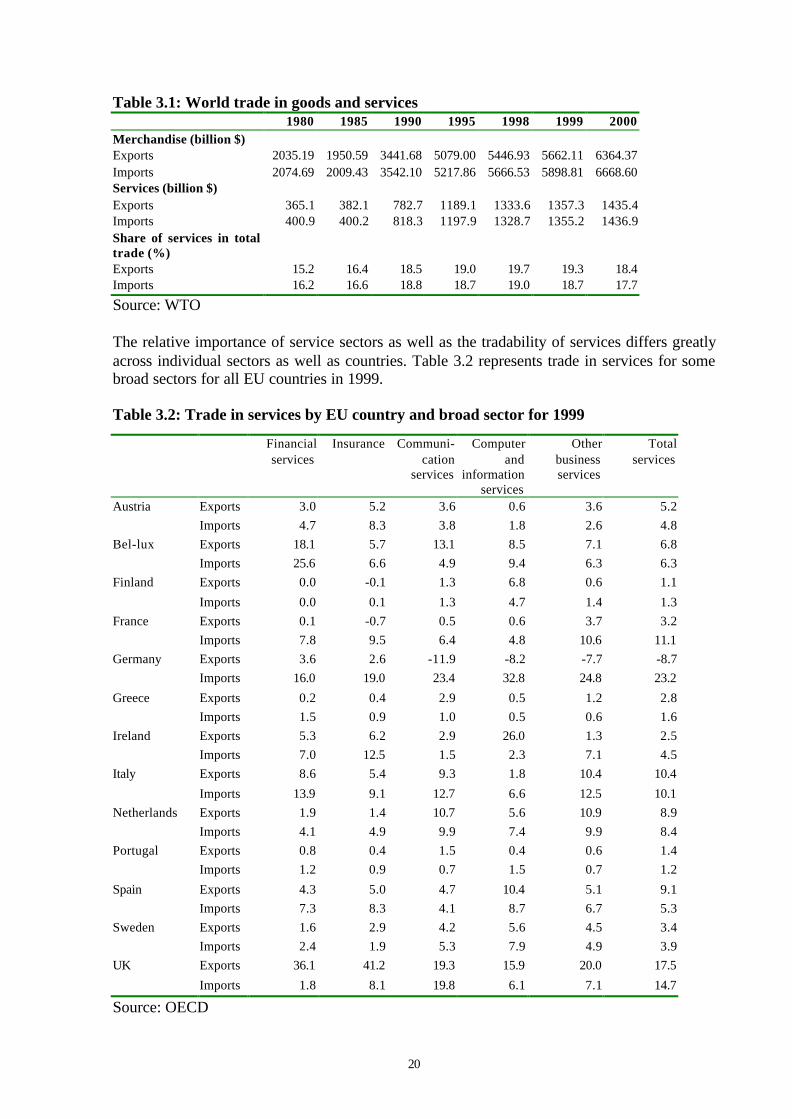
Table 3.1 compares trade in goods with trade in services. The first point to be noted is thattrade in services is much smaller than trade in goods. Nevertheless for a supposedly non-tradable sector the share of services in world trade is rather about 15% to 20%. Moreover, thetable shows that services have gained in relative importance from 15.2% of exports in 1980(16.2% of imports) to 18.4% of total exports in 2000 (17.7% of total imports). These sharestend be somewhat higher in developed countries and slightly lower in developing countries.
4 Gross, Raff, and Ryan (2001) find evidence for the former in the early years of Japanese FDI in Europe, butobserve that the picture is completely reversed in more recent years.5 Although not very satisfactory Chang et al. (1999) use BOP category ‘compensation for employees’ whichregisters “the earnings of all natural persons established abroad for less than one year (p. 112)”.
20
Table 3.1: World trade in goods and services1980 1985 1990 1995 1998 1999 2000
Merchandise (billion $)Exports 2035.19 1950.59 3441.68 5079.00 5446.93 5662.11 6364.37Imports 2074.69 2009.43 3542.10 5217.86 5666.53 5898.81 6668.60Services (billion $)Exports 365.1 382.1 782.7 1189.1 1333.6 1357.3 1435.4Imports 400.9 400.2 818.3 1197.9 1328.7 1355.2 1436.9Share of services in totaltrade (%)Exports 15.2 16.4 18.5 19.0 19.7 19.3 18.4Imports 16.2 16.6 18.8 18.7 19.0 18.7 17.7
Source: WTO
The relative importance of service sectors as well as the tradability of services differs greatlyacross individual sectors as well as countries. Table 3.2 represents trade in services for somebroad sectors for all EU countries in 1999.
Table 3.2: Trade in services by EU country and broad sector for 1999
Financialservices
Insurance Communi-cation
services
Computerand
informationservices
Otherbusinessservices
Totalservices
Austria Exports 3.0 5.2 3.6 0.6 3.6 5.2
Imports 4.7 8.3 3.8 1.8 2.6 4.8
Bel-lux Exports 18.1 5.7 13.1 8.5 7.1 6.8
Imports 25.6 6.6 4.9 9.4 6.3 6.3
Finland Exports 0.0 -0.1 1.3 6.8 0.6 1.1
Imports 0.0 0.1 1.3 4.7 1.4 1.3
France Exports 0.1 -0.7 0.5 0.6 3.7 3.2
Imports 7.8 9.5 6.4 4.8 10.6 11.1
Germany Exports 3.6 2.6 -11.9 -8.2 -7.7 -8.7
Imports 16.0 19.0 23.4 32.8 24.8 23.2
Greece Exports 0.2 0.4 2.9 0.5 1.2 2.8
Imports 1.5 0.9 1.0 0.5 0.6 1.6
Ireland Exports 5.3 6.2 2.9 26.0 1.3 2.5
Imports 7.0 12.5 1.5 2.3 7.1 4.5
Italy Exports 8.6 5.4 9.3 1.8 10.4 10.4
Imports 13.9 9.1 12.7 6.6 12.5 10.1
Netherlands Exports 1.9 1.4 10.7 5.6 10.9 8.9
Imports 4.1 4.9 9.9 7.4 9.9 8.4
Portugal Exports 0.8 0.4 1.5 0.4 0.6 1.4
Imports 1.2 0.9 0.7 1.5 0.7 1.2
Spain Exports 4.3 5.0 4.7 10.4 5.1 9.1
Imports 7.3 8.3 4.1 8.7 6.7 5.3
Sweden Exports 1.6 2.9 4.2 5.6 4.5 3.4
Imports 2.4 1.9 5.3 7.9 4.9 3.9
UK Exports 36.1 41.2 19.3 15.9 20.0 17.5
Imports 1.8 8.1 19.8 6.1 7.1 14.7
Source: OECD

21
Comparing imports and exports for the different countries, Germany and France have largetrade deficits in services revealing that their comparative advantage is still in manufacturing.By contrast, Spain, Greece and the UK run a trade surplus on services revealing a comparativeadvantage in services. However, for individual services sectors the picture differs importantly.Spain and Greece derive their comparative advantage in services from consumer services,especially tourism, whereas the United Kingdom’s comparative advantage is largely based onproducer services. Germany and France are large net importers of producer services.Elsewhere patterns of services activity are quite diverse.Financial services and insurance exhibit a similar pattern. The United Kingdom is the onlycountry with a strong trade surplus in these services sectors, while all others EU countries runa deficit. This may reflect the role of US and Japanese financial services firms within the EU. 6
Belgium-Luxembourg, Greece, Ireland, and Portugal are net exporters of communicationsservices, whereas France, Germany and Italy are net importers. This suggests an importantrole for country size in communications services. In computer services Ireland and the UnitedKingdom run notable trade surpluses. The category ‘other business services’ contains adiverse range of service activities. Broadly speaking, it consists of merchanting and traderelated services and miscellaneous business, professional and technical services. The lattergroup (consulting in a broad sense) represents more than 90% ‘of other business services’ inthe United Kingdom. Interestingly, Ireland appears to be a strong importer of other businessservices. Possibly, the dynamism of the Irish economy is reflected by the high demand forbusiness services. Alternatively, it could reflect the use of home service providers by foreignaffiliates in Ireland.
Disaggregated data for the world as whole are not available. Chang et al. (1999) estimatethem. Their results for 1996 reveal that transport and travel largely dominate global trade inservices, together accounting for 58% of total services trade. Financial and insurance servicesaccount for about a fifth of the remainder.7
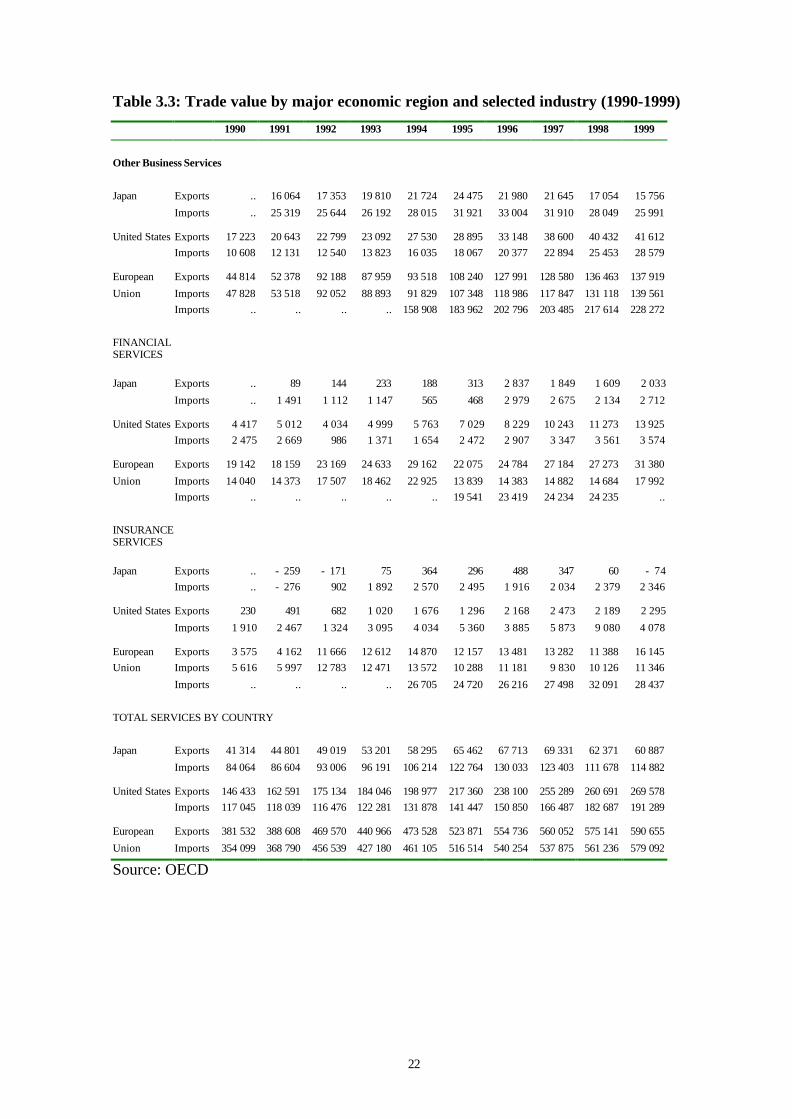
Table 3.3 represents the value and table 3.4 the share of trade in total services and someselected services for Japan, the US and the EU. For Japan trade in total services peakedaround 1996-1997 and fell back slightly afterwards. For both the US and the EU the value oftrade in total services increased significantly over the period 1990-1999 and at a fairlyconstant rate. Overall, the US is strong net exporter of services, the EU is also a net exporterbut by not nearly as much as the US, and Japan is a strong net importer. The only reversal inthe pattern of trade relates to the EU. The EU moved from a net importer in insurance andother business services in the early 1990’s to a net exporter in the late 1990’s. In the late1990’s the EU had become a net exporter of all three selected producer services.
6 For more information on the role of Japanese financial firms in the EU see Hawawini, G. and M. Schill (1994).7 The category ‘royalties and fees’ includes franchising, which under the GATS is a sub-sector of distributionservices.
22
Table 3.3: Trade value by major economic region and selected industry (1990-1999)
1990 1991 1992 1993 1994 1995 1996 1997 1998 1999
Other Business Services
Japan Exports .. 16 064 17 353 19 810 21 724 24 475 21 980 21 645 17 054 15 756
Imports .. 25 319 25 644 26 192 28 015 31 921 33 004 31 910 28 049 25 991
United States Exports 17 223 20 643 22 799 23 092 27 530 28 895 33 148 38 600 40 432 41 612
Imports 10 608 12 131 12 540 13 823 16 035 18 067 20 377 22 894 25 453 28 579
European Exports 44 814 52 378 92 188 87 959 93 518 108 240 127 991 128 580 136 463 137 919
Union Imports 47 828 53 518 92 052 88 893 91 829 107 348 118 986 117 847 131 118 139 561
Imports .. .. .. .. 158 908 183 962 202 796 203 485 217 614 228 272
FINANCIALSERVICES
Japan Exports .. 89 144 233 188 313 2 837 1 849 1 609 2 033
Imports .. 1 491 1 112 1 147 565 468 2 979 2 675 2 134 2 712
United States Exports 4 417 5 012 4 034 4 999 5 763 7 029 8 229 10 243 11 273 13 925
Imports 2 475 2 669 986 1 371 1 654 2 472 2 907 3 347 3 561 3 574
European Exports 19 142 18 159 23 169 24 633 29 162 22 075 24 784 27 184 27 273 31 380
Union Imports 14 040 14 373 17 507 18 462 22 925 13 839 14 383 14 882 14 684 17 992
Imports .. .. .. .. .. 19 541 23 419 24 234 24 235 ..
INSURANCESERVICES
Japan Exports .. - 259 - 171 75 364 296 488 347 60 - 74
Imports .. - 276 902 1 892 2 570 2 495 1 916 2 034 2 379 2 346
United States Exports 230 491 682 1 020 1 676 1 296 2 168 2 473 2 189 2 295
Imports 1 910 2 467 1 324 3 095 4 034 5 360 3 885 5 873 9 080 4 078
European Exports 3 575 4 162 11 666 12 612 14 870 12 157 13 481 13 282 11 388 16 145
Union Imports 5 616 5 997 12 783 12 471 13 572 10 288 11 181 9 830 10 126 11 346
Imports .. .. .. .. 26 705 24 720 26 216 27 498 32 091 28 437
TOTAL SERVICES BY COUNTRY
Japan Exports 41 314 44 801 49 019 53 201 58 295 65 462 67 713 69 331 62 371 60 887
Imports 84 064 86 604 93 006 96 191 106 214 122 764 130 033 123 403 111 678 114 882
United States Exports 146 433 162 591 175 134 184 046 198 977 217 360 238 100 255 289 260 691 269 578
Imports 117 045 118 039 116 476 122 281 131 878 141 447 150 850 166 487 182 687 191 289
European Exports 381 532 388 608 469 570 440 966 473 528 523 871 554 736 560 052 575 141 590 655
Union Imports 354 099 368 790 456 539 427 180 461 105 516 514 540 254 537 875 561 236 579 092
Source: OECD
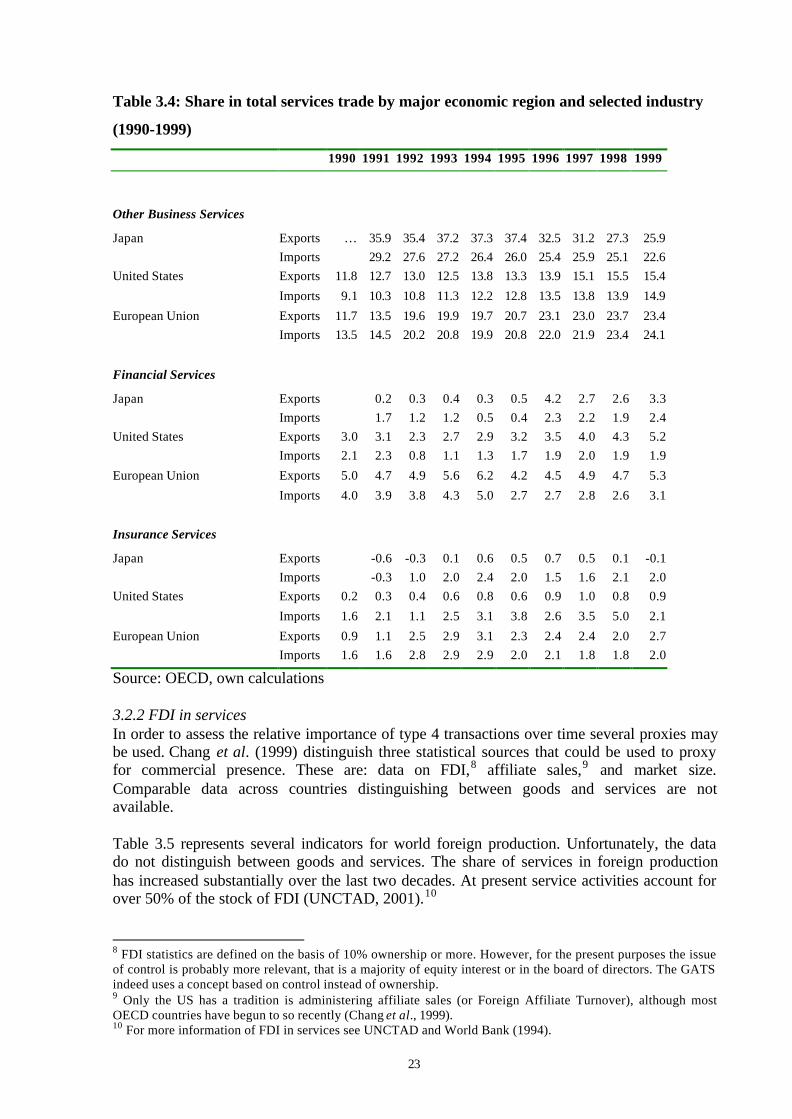
23
Table 3.4: Share in total services trade by major economic region and selected industry
(1990-1999)
1990 1991 1992 1993 1994 1995 1996 1997 1998 1999
Other Business Services
Japan Exports … 35.9 35.4 37.2 37.3 37.4 32.5 31.2 27.3 25.9
Imports 29.2 27.6 27.2 26.4 26.0 25.4 25.9 25.1 22.6
United States Exports 11.8 12.7 13.0 12.5 13.8 13.3 13.9 15.1 15.5 15.4
Imports 9.1 10.3 10.8 11.3 12.2 12.8 13.5 13.8 13.9 14.9
European Union Exports 11.7 13.5 19.6 19.9 19.7 20.7 23.1 23.0 23.7 23.4
Imports 13.5 14.5 20.2 20.8 19.9 20.8 22.0 21.9 23.4 24.1
Financial Services
Japan Exports 0.2 0.3 0.4 0.3 0.5 4.2 2.7 2.6 3.3
Imports 1.7 1.2 1.2 0.5 0.4 2.3 2.2 1.9 2.4
United States Exports 3.0 3.1 2.3 2.7 2.9 3.2 3.5 4.0 4.3 5.2
Imports 2.1 2.3 0.8 1.1 1.3 1.7 1.9 2.0 1.9 1.9
European Union Exports 5.0 4.7 4.9 5.6 6.2 4.2 4.5 4.9 4.7 5.3
Imports 4.0 3.9 3.8 4.3 5.0 2.7 2.7 2.8 2.6 3.1
Insurance Services
Japan Exports -0.6 -0.3 0.1 0.6 0.5 0.7 0.5 0.1 -0.1
Imports -0.3 1.0 2.0 2.4 2.0 1.5 1.6 2.1 2.0
United States Exports 0.2 0.3 0.4 0.6 0.8 0.6 0.9 1.0 0.8 0.9
Imports 1.6 2.1 1.1 2.5 3.1 3.8 2.6 3.5 5.0 2.1
European Union Exports 0.9 1.1 2.5 2.9 3.1 2.3 2.4 2.4 2.0 2.7
Imports 1.6 1.6 2.8 2.9 2.9 2.0 2.1 1.8 1.8 2.0
Source: OECD, own calculations
3.2.2 FDI in servicesIn order to assess the relative importance of type 4 transactions over time several proxies maybe used. Chang et al. (1999) distinguish three statistical sources that could be used to proxyfor commercial presence. These are: data on FDI,8 affiliate sales,9 and market size.Comparable data across countries distinguishing between goods and services are notavailable.
Table 3.5 represents several indicators for world foreign production. Unfortunately, the datado not distinguish between goods and services. The share of services in foreign productionhas increased substantially over the last two decades. At present service activities account forover 50% of the stock of FDI (UNCTAD, 2001).10
8 FDI statistics are defined on the basis of 10% ownership or more. However, for the present purposes the issueof control is probably more relevant, that is a majority of equity interest or in the board of directors. The GATSindeed uses a concept based on control instead of ownership.9 Only the US has a tradition is administering affiliate sales (or Foreign Affiliate Turnover), although mostOECD countries have begun to so recently (Chang et al., 1999).10 For more information of FDI in services see UNCTAD and World Bank (1994).
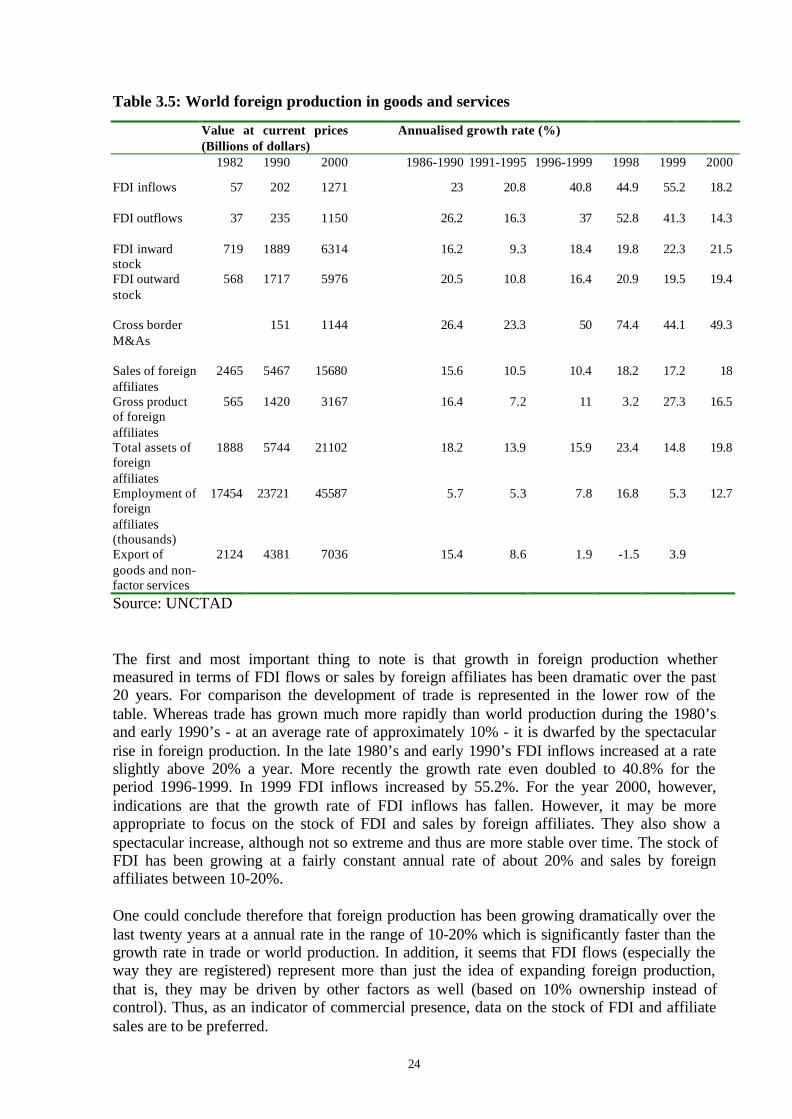
24
Table 3.5: World foreign production in goods and services
Value at current prices(Billions of dollars)
Annualised growth rate (%)
1982 1990 2000 1986-1990 1991-1995 1996-1999 1998 1999 2000
FDI inflows 57 202 1271 23 20.8 40.8 44.9 55.2 18.2
FDI outflows 37 235 1150 26.2 16.3 37 52.8 41.3 14.3
FDI inwardstock
719 1889 6314 16.2 9.3 18.4 19.8 22.3 21.5
FDI outwardstock
568 1717 5976 20.5 10.8 16.4 20.9 19.5 19.4
Cross borderM&As
151 1144 26.4 23.3 50 74.4 44.1 49.3
Sales of foreignaffiliates
2465 5467 15680 15.6 10.5 10.4 18.2 17.2 18
Gross productof foreignaffiliates
565 1420 3167 16.4 7.2 11 3.2 27.3 16.5
Total assets offoreignaffiliates
1888 5744 21102 18.2 13.9 15.9 23.4 14.8 19.8
Employment offoreignaffiliates(thousands)
17454 23721 45587 5.7 5.3 7.8 16.8 5.3 12.7
Export ofgoods and non-factor services
2124 4381 7036 15.4 8.6 1.9 -1.5 3.9
Source: UNCTAD
The first and most important thing to note is that growth in foreign production whethermeasured in terms of FDI flows or sales by foreign affiliates has been dramatic over the past20 years. For comparison the development of trade is represented in the lower row of thetable. Whereas trade has grown much more rapidly than world production during the 1980’sand early 1990’s - at an average rate of approximately 10% - it is dwarfed by the spectacularrise in foreign production. In the late 1980’s and early 1990’s FDI inflows increased at a rateslightly above 20% a year. More recently the growth rate even doubled to 40.8% for theperiod 1996-1999. In 1999 FDI inflows increased by 55.2%. For the year 2000, however,indications are that the growth rate of FDI inflows has fallen. However, it may be moreappropriate to focus on the stock of FDI and sales by foreign affiliates. They also show aspectacular increase, although not so extreme and thus are more stable over time. The stock ofFDI has been growing at a fairly constant annual rate of about 20% and sales by foreignaffiliates between 10-20%.
One could conclude therefore that foreign production has been growing dramatically over thelast twenty years at a annual rate in the range of 10-20% which is significantly faster than thegrowth rate in trade or world production. In addition, it seems that FDI flows (especially theway they are registered) represent more than just the idea of expanding foreign production,that is, they may be driven by other factors as well (based on 10% ownership instead ofcontrol). Thus, as an indicator of commercial presence, data on the stock of FDI and affiliatesales are to be preferred.
25
Chang et al. (1999) analyse the different types of international transactions of services(Section 3.2) using disaggregated data for the US. Trade in services is based on the IMF’sBOP statistics, whereas commercial presence is proxied by affiliate sales. In the aggregateboth types of transactions are fairly similar in importance. At a more disaggregated level theirrelative importance is fairly constant over time. For transport services, trade appears to be themost important mode of supply; for telecommunications, there is no significant difference;and for the remaining service industries, affiliate sales is the dominant form ofinternationalisation. For insurance and professional services, commercial presence isgenerally required as close co-operation between client and supplier may be necessary (unlessreinsurance of risks is concerned).
3.3 The regulatory environmentIn this section a brief overview will be given of the regulatory environment of services bothwithin the EU and in the global context. The General Agreement on Trade in Services (1995)is the first and so far only multilateral regulation which covers the internationalisation ofservices.
Tradability of services has traditionally been considered to be very low for two reasons. First,trade in services may be difficult or even impossible as a result of the nature of services (seeSection 3.1). Second, services tend to be heavily regulated. It is crucial to realise thatregulation is justified whenever market failures are present. The most important marketfailures in service industries are imperfect information, imperfect competition and networkexternalities. Both the WTO and the EU do not intend to deregulate service, but instead theyaim to liberalise international transactions in services for reasons that should become clear inSection 3.4.
In spite of regulations being perfectly justified they can, and often do, still act as a barrier totrade. On the basis of the classification in Section 3.1.2 it is possible to distinguish thefollowing barriers to the internationalisation of services: barriers to trade, barriers to themovement of users, barriers to the movement of providers, and barriers to FDI andmigration. 11
3.3.1 The free movement of services within the EUThe EU member states have committed themselves to establishing a common market allowingfor the free movement of goods, services, capital and labour since the signing of the Treaty ofRome in 1957. From the discussion in Section 3.2 it follows that completely free movementof services can only be achieved if the free of factors of productions is also addressed.Although substantial progress had been made in the integration of goods markets, servicesmarket integration was not seriously dealt with before the Single European Marketprogramme was initiated in 1986. That this was completely unjustified follows from data onthe importance of services (Buigues and Sapir, 1993). In 1990 market services accounted for48.2% of GDP and 42% of employment. The share of services in GDP had increased byapproximately 10% since 1970. During the 1980’s 10.4 million jobs were created in marketservices, whilst 3.6 million jobs were lost in manufacturing.
The SEM programme or “1992” initiative was meant to open up domestic services markets inorder to improve competition and allow service providers to exploit economies of scale. Inthis context Sapir (1993) analysed the actual and potential degree of competition in a number
11 For an extensive analysis of barriers to trade in services see Hoekman and Primo Braga (1997).
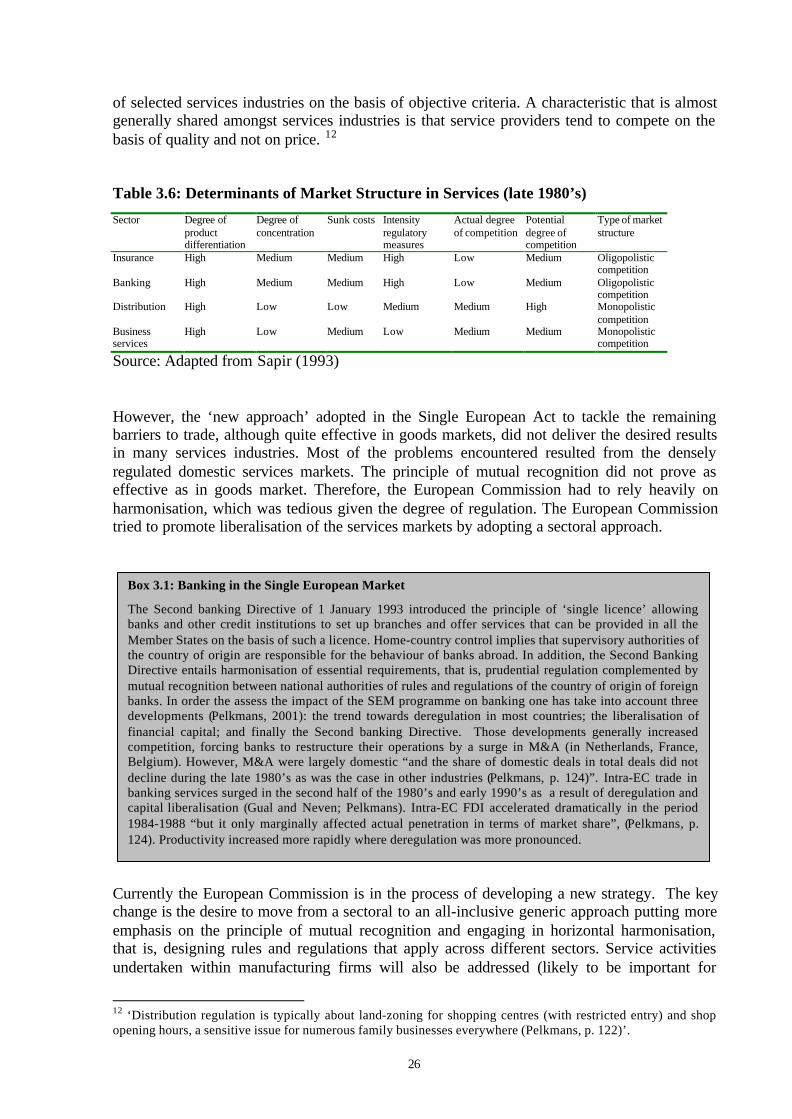
26
of selected services industries on the basis of objective criteria. A characteristic that is almostgenerally shared amongst services industries is that service providers tend to compete on thebasis of quality and not on price. 12
Table 3.6: Determinants of Market Structure in Services (late 1980’s)
Sector Degree ofproductdifferentiation
Degree ofconcentration
Sunk costs Intensityregulatorymeasures
Actual degreeof competition
Potentialdegree ofcompetition
Type of marketstructure
Insurance High Medium Medium High Low Medium Oligopolisticcompetition
Banking High Medium Medium High Low Medium Oligopolisticcompetition
Distribution High Low Low Medium Medium High Monopolisticcompetition
Businessservices
High Low Medium Low Medium Medium Monopolisticcompetition
Source: Adapted from Sapir (1993)
However, the ‘new approach’ adopted in the Single European Act to tackle the remainingbarriers to trade, although quite effective in goods markets, did not deliver the desired resultsin many services industries. Most of the problems encountered resulted from the denselyregulated domestic services markets. The principle of mutual recognition did not prove aseffective as in goods market. Therefore, the European Commission had to rely heavily onharmonisation, which was tedious given the degree of regulation. The European Commissiontried to promote liberalisation of the services markets by adopting a sectoral approach.
Currently the European Commission is in the process of developing a new strategy. The keychange is the desire to move from a sectoral to an all-inclusive generic approach putting moreemphasis on the principle of mutual recognition and engaging in horizontal harmonisation,that is, designing rules and regulations that apply across different sectors. Service activitiesundertaken within manufacturing firms will also be addressed (likely to be important for
12 ‘Distribution regulation is typically about land-zoning for shopping centres (with restricted entry) and shopopening hours, a sensitive issue for numerous family businesses everywhere (Pelkmans, p. 122)’.
Box 3.1: Banking in the Single European Market
The Second banking Directive of 1 January 1993 introduced the principle of ‘single licence’ allowingbanks and other credit institutions to set up branches and offer services that can be provided in all theMember States on the basis of such a licence. Home-country control implies that supervisory authorities ofthe country of origin are responsible for the behaviour of banks abroad. In addition, the Second BankingDirective entails harmonisation of essential requirements, that is, prudential regulation complemented bymutual recognition between national authorities of rules and regulations of the country of origin of foreignbanks. In order the assess the impact of the SEM programme on banking one has take into account threedevelopments (Pelkmans, 2001): the trend towards deregulation in most countries; the liberalisation offinancial capital; and finally the Second banking Directive. Those developments generally increasedcompetition, forcing banks to restructure their operations by a surge in M&A (in Netherlands, France,Belgium). However, M&A were largely domestic “and the share of domestic deals in total deals did notdecline during the late 1980’s as was the case in other industries (Pelkmans, p. 124)”. Intra-EC trade inbanking services surged in the second half of the 1980’s and early 1990’s as a result of deregulation andcapital liberalisation (Gual and Neven; Pelkmans). Intra-EC FDI accelerated dramatically in the period1984-1988 “but it only marginally affected actual penetration in terms of market share”, (Pelkmans, p.124). Productivity increased more rapidly where deregulation was more pronounced.

27
distribution). The generic approach is inspired by the idea that traditional divisions betweensectors become increasingly blurred. Fragmentation of production creates stronginterdependencies between different sectors. Regulation or liberalisation in one sector shouldtherefore be expected to have important knock-on effects in other industries.
3.3.2 The GATS and beyondThe General Agreement on Trade in Services (1995-1997) is the first and so far onlymultilateral regulation which covers the internationalisation of services. The GATS applies toall four types of international transactions of services discussed in Section 3.1.2.
The GATS consists of a general and a specific component. The general component consists ofrules and regulations that apply across the board to government policies affectinginternational transactions in services.13 The most important general obligation is the one ofMost-Favoured-Nation (MFN) treatment. Article II of the GATS requires each Member to“accord immediately and unconditionally to services and service suppliers of any otherMember treatment no less favourable than that it accords to like services and service suppliersof any other country”.
The specific component includes the specific commitments of each WTO Member, itsnational ‘schedule’. National ‘schedules’ lists those services for which a WTO Memberwishes to guarantee market access to foreign providers on a national treatment basis. ArticleXVI which relates to market access stipulates that a WTO Member cannot maintain or adopt,unless pre-specified in its national schedule, any restrictive measures. Restrictive measuresinclude limitations on:a) the number of service suppliers;b) the total value of services transactions or assets;c) the total number of services operations or the total quantity of service output;d) the total number of natural persons who may be employed in a particular sector;e) specific types of legal entity through which a service can be supplied; andf) foreign equity participation (e.g. maximum equity participation).
Article XVII:1 defines the concept of national treatment: “In the sectors inscribed in itsSchedule, and subject to any conditions and qualifications set out therein, each Member shallaccord to services and service suppliers of any other Member, in respect of all measuresaffecting the supply of services, treatment no less favourable than that it accords to its ownlike services and service suppliers”. Hence, the GATS does not allow discrimination between
13 Exceptions are services provided in the exercise of government authority, the air transport sector, air trafficrights and services related to exercise of traffic rights.
Box 3.2: On-Line Trading in Distribution
Distribution involves both wholesaling and retailing. Especially the potential of wholesale via the internetseems to offer great potential for on-line trading. Retail trade via the internet is limited to mainly non-foodproducts. The latter are likely to remain largely in the domain of supermarkets. Hubertus (2001) gives anindication of the relative importance of individual product categories in on-lines sales. Financial servicesturn out to be the largest product category traded over the internet, but online sales are also important forcomputer products, books, music/video and travel.
28
national and foreign service suppliers in those sectors where the WTO Member hascommitted itself to guaranteeing free market access.
Hoekman and Primo Braga (1997) state that most countries scheduled only a part of theirservices sector. Developed countries made (limited) commitments for 47% of the totalpossible compared to 16% by developing countries. Mattoo (2001) argues that “the GATS hasfailed to deliver meaningful liberalisation. The Agreement is generally perceived, not as ascourge of protection, but as a rather stodgy reaper of liberalisation accomplished elsewhere(p. 3)”.
Whether or not the GATS will prove effective in reducing barriers to trade in services willtherefore depend on the commitments made by individual WTO Members in their nationalSchedules. The only study that attempts to assess the impact of GATS on trade in services ispresented by Chang et al. (1999). They try to evaluate the impact of GATS systematically byservices sector and mode of international transaction. Not surprisingly, many data problemsarise and as such their study presents only a first step in research on liberalisation of trade inservices and its consequences.
The agenda for the next round of multilateral negotiation was set at the 4th MinisterialConference of the WTO in Doha in 2001. Services will again feature prominently on theagenda, and market access and its liberalisation will move into a higher gear. “In services (…)the World Bank has estimated that welfare gains from a 50% cut in services sector protectionwould be five times larger than for non-services sector trade liberalisation”. In addition, theDoha Declaration sets for the first time ever the objective of establishing a multilateral set ofrules and regulations with the objective of improving the potential of FDI globally and toestablish a consistent competition policy. Furthermore, the right of the host country toregulate will be preserved. Finally, developing countries will obtain an opt-out clause.
Finally, Hoekman and Primo Braga (1997) draw attention to two interesting politicaleconomy aspects of the liberalisation of services. First, a host may be quite favourablydisposed towards the liberalisation of services since a reduction in employment is notexpected (commercial presence). Secondly, problems may arise where co-ordination betweenregulatory bodies with regard to foreign affiliates is required.
3.4 Services, employment and economic growth
In this section the importance of services to economic growth and employment will beanalysed. Before discussing how services may affect economic growth and employment it
Box 3.3: Liberalisation of Trade in Financial Services under the GATS
Liberalisation of financial services is covered by the Financial Services Agreement (FSA) of GATS. Inaddition to the general rules set by the GATS, it contains the national schedules specifying rules andregulations with respect to market access in financial services. Prudential regulation need not be inscribed inthe national Schedule. As restrictions to market access are clearly defined, new financial instruments may beleft outside national Schedules and future negotiations may be impeded (Sorsa, 1997). “While the FSA goesfar beyond previous regional trade agreements (…), in terms of actually dismantling trade barriers in thearea of financial services, it has done little more than formalising the status quo (Cornelius, 2000, p.652)”.
29
will be useful to discuss the modern service economy in some more detail. Section 3.4.1 willtherefore concentrate on the causes behind the move towards the service economy. Section3.4.2 will discuss the nature of technological change in services. Section 3.4.3 will examinethe link between technological change and employment in services. Section 3.4.4 in turn willdeal with the consequence of the move towards the service economy for economic growth.More precisely, it will discuss the direct and indirect way in which this development maycontribute or impede economic growth. Section 3.4.5 finally will discuss the importance ofthe internationalisation of services to economic growth. It will thus provide a motivation forthe liberalisation of service markets in the context of the EU and the WTO.
3.4.1 Explaining the service economyTraditionally, the services sector has been associated with low productivity growth.Therefore, the rising importance of services in the economy has raised concern amongstacademics and policy-makers alike. In the United Kingdom this was reflected in the late1950’s by the introduction of an employment tax for services industries in order to discouragetheir growth. Baumol, Blackman and Wolff (1989) argue that the move towards a serviceseconomy constitutes a concern when services sector employment is associated with relativelylow wages and low career opportunities, and when service growth withdraws workers frommore productive manufacturing industries and thus impedes overall economic growth.
Before turning to figures of services sector growth it is useful to gain some understanding ofthe underlying factors that contributed to this trend. Here, five factors will be discussed.
First, there is strong evidence that the annual growth rate of labour productivity inmanufacturing has been much higher than that in services in the OECD countries (see Klodt,2000). Productivity grew at over 3 per cent a year in manufacturing compared with less thanhalf this rate in services14. The superior performance of manufacturing reflects a much higherexpenditure on innovation – Evangelista (2000) finds that innovation costs per employee inItaly in 1995 were three to four times higher in manufacturing than in services. Given that theimprovement in labour productivity in services has been relatively small, while output trendshave been fairly similar to those in manufacturing, the services sector absorbed a rising shareof total employment in combination with rising relative prices of services.
Second, economic development may have changed the pattern of tastes in favour of services.Clark (1957) argues that when income per capita increases demand will shift increasinglytowards services while the expenditure share on manufacturers stabilises and will eventuallyfall. Baumol, Blackman and Wolff (1989) reject this explanation on the basis that the share offinal expenditure on services is fairly similar in developed and developing countries. Theirargument is supported by Klodt (2000) who found that in FR Germany between 1978 and1990 the share of services in final demand was static and hence ‘non-homothetic preferencesof consumers are not the decisive determinant of structural change on the demand side. Themajor driving force behind the transition to the service society is a rising service intensity allover the economy’ (p9). This reflects the increasing role of services as a provider ofintermediate inputs in both manufacturing and services. Thus the finding by Rowthorn andRamaswamy (1999) that demand is indeed one of the explanatory factors ofdeindustrialisation must be qualified in that it is demand for services as intermediate goodsthat is the key factor, not a faster growth of final demand for services versus goods.
14 Germany is unusual in having a rough parity of productivity growth in the two sectors, perhaps due to thelimited presence of services activities with low productivity (ibid p12).

30
Third, and related to the previous point production processes are increasingly fragmented bothwithin and across national borders. Across national borders fragmentation is mainly driven byrelative factor price differences. Within countries economies of scale are likely to be the mainforce driving fragmentation of production. 15 It is a stylised fact that economies of scale areextremely important for production services (those result amongst others from the need tobuild up a reputation and establish a user network). Bhagwati (1984) refers to fragmentationof the latter type in the case of services as the ‘splintering process’. Bhagwati also argues thatsuch services are typically technically progressive, as it is the presence of economies of scalethat made them independent in the first place.16 Actually the types of fragmentation are likelyto reinforce each other. In order to split up production processes, producer services are neededto co-ordinate the activities between different locations. The technical revolution in ICTindustries may have been needed to unleash the fragmentation process (Jones andKierzkowski, 1990). Alternatively, the establishment of sophisticated international productionnetworks may have increased the demand for specialised producer services.
Even though the above does not suggest that economic development shifts tastes towardsconsumer services, economic development is associated with an increasingly complexproduction process which increases the demand for producer services. In addition, it seemsthat with economic development the drive towards specialisation becomes stronger.
Fourth, trade with developing countries may also have contributed to the North specialisingincreasingly in services industries. Although most studies have found a limited impact offoreign competition on labour markets in developing countries, Feenstra and Hanson (1996,1999) in their research on the international fragmentation of production find much strongereffects by focusing on the trade in intermediate inputs.
Fifth, technological developments in telecommunications and information technology haveboosted the potential of many producer services. Even though this development may notexplain the rising importance of services in terms of employment, it is undoubtedly a keyaspect of the modern service economy.
3.4.2 Technological change in servicesThe multifaceted nature of innovation makes it difficult to make comparisons betweenservices and manufacturing. Surveys suggest that expenditure on innovation is much higherper employee in manufacturing. However, this typically excludes expenditure for example oncustomisation and organisational change which may be important for innovation and whichare found particularly in the services sector (Evangelista, 2000). Moreover, the closeinteraction between many service activities and other parts of the economy makes thempotentially important conduits for the spread of new technologies, the diffusion of newknowledge and the promotion of organisational change (Miles 1993, 1996; Hauknes 1996).
Survey evidence for Italy (Evangelista 2000) suggests that the pattern of innovation inservices shares some common features with that in manufacturing – for example the dominantrole of large firms. Similarly both sectors have a high rate of process innovation However,product innovation is reported to be much less common in services. Interestingly, thejuxtaposition of production and consumption in services did not appear to hamper the ability
15 Sapir (1985) also mentions employment flexibility.16 The third argument does properly speaking not reflect an increase in the actual importance of services, butonly an increase in the recorded importance of services (Sapir, 1985).

31
of the firms surveyed to distinguish between the two categories of innovation. Given theheterogeneous nature of the services sector, it would be surprising if there were not markeddifferences in the pattern of innovation between different categories of services. This iscertainly borne out for Italy as Evangelista’s work demonstrates (see Box 3.4). Particularlyinteresting is the importance for some sectors, such as advertising, of the role of customerinteraction and software development in the innovation process. The evident diversitysuggests caution in generalising about technological change in the services sector as a whole.
Box 3.4: Innovation patterns in Italian services (Evangelista 2000)
Evangelista’s pioneering work in Italy suggests a classification of service activities according to their innovationbehaviour. A primary distinction is in relation to the extent to which innovation expenditure is focused on R&Dand design rather than investment. On this basis, R&D, Engineering and Computing are the core science andtechnology based service activities, with much above average expenditures on innovation, especially in the areasof R&D and design. These sectors have much in common with the ‘science-based’ firms and sectors identifiedby Pavitt (1984). Technical Consultancy is also in the high spend category but has in addition an importantemphasis on close interaction with final customers, other consultancies and research institutes.
All other service sectors are characterised by limited R&D and design activity and a reliance on investment forinnovation (embodied technological change). Within this broad group there is a spectrum of behaviour. At oneextreme, the ‘technology users’ reflect traditional user-producer links – the innovation pattern resembles Pavitt’s‘supplier dominated’ category. The most characteristic activities in this group are Waste Management, andTransport (both Sea and Land). Security, Cleaning and Other Business Services also fall into this group. At theother extreme are service activities which have a high emphasis on close interaction with consumers or users andlarge investments in software – Evangelista’s ‘interactive and IT’ group. Innovation costs derive from theacquisition of know-how from consultancy firms, the purchasing and development of new software and otherinnovation sources such as training and marketing. This group includes especially Advertising, but also Banks,Insurance, Trade/Repair of Motors and Hotels. Most of the remaining service activities fall into an intermediategroup, being technology users but with some emphasis on customer interaction and software – Legal Services,Other Financial Services, Tourist Services, and Retail.
Petit and Soete (1996) argue that technical change in services has its specificities. In the firstplace the development of goods and service markets are not submitted to the same type ofconstraints. The localisation of services and the interaction between customers and producersthat occurs in these trades impose specific constraints to the development of new products andof new processes. Both process and product innovations in services will thus be more severelyconstrained by the willingness, abilities and original tastes and habits of the customers thanthey are for goods. Process innovations in manufacturing of goods are neutral for the productmarket and product innovations can be channelled by widespread advertising, marketingtechniques or straightforward and rapidly diffusing demonstration effects. ICTs have also aspecific impact in that respect as these technologies transform the basic context in whichservices can be perceived and delivered. Petit and Soete (1996) argue that ICTs change thetradeability of services and expand the potential of fields and forms of new markets.Conversely ICTs transform the markets of goods, with more customerisation and lastingrelations, bringing thus characteristics of services to these markets.
3.4.3 Consequences on employmentIt is generally acknowledged that employment in our economies is increasingly dependent onservices. As in other highly developed economies, the European countries are continuing theirgradual move towards a service-based economy with today nearly 70% of the total labourforce being employed in service activities (Petit and Soete, 1996). It is also generallyacknowledged that services provide the key to future employment growth. Neither agriculturenor manufacturing have been able to generate sufficient output growth to offset, in the lasttwo decades, the productivity growth following the diffusion of labour saving machinery and

32
the reorganisation of work and trades, impulsed by an increasing international competition.And while some high-tech manufacturing sectors have succeeded through the introduction ofnew and improved high income elastic consumer goods to generate new employmentopportunities, their number has been falling steadily over time (Petit and Soete, 1996).
Evangelista and Savona (2001) argue that technological change is likely to play an importantrole also with respect to the overall dynamics of employment in services. In particular theemergence and widespread diffusion of ICTs has an impact on employment through threemain mechanisms, that is by:a) expanding final demand and/or shifting its composition from tangible goods to intangible,information and knowledge intensive services;b) changing the composition of intermediate demand both in services and manufacturingtowards information and knowledge based inputs and processes;c) increasing labour productivity in some of the service activities traditionally affected by theso-called cost-disease or productivity-bias.
The overall impact of technological change on employment in services is however verydifficult to be empirically assessed because of the joint presence of positive and negativedirect effects and the existence of a complex set of compensating mechanisms, operating bothwithin the service sector, between the service and the manufacturing sectors, and increasinglyat an international scale. In particular, mechanisms a) and b) above are likely to have apositive impact on employment, provided that they do not phase out pre-existing services,goods and intermediate inputs. On the other side, mechanism c) is likely to have a negativeimpact, although there might be positive compensating mechanisms on employment via thereduction of prices, income increases and the consequent growth of demand brought bytechnological change in services.
As far as the relationship between technological change and employment in services isconcerned, the lack of data and systematic analyses referring to the service sector is severe.Evangelista and Savona (2001) argue that in absence of robust statistical evidence, theliterature has been taken over by optimistic scenarios on the employment perspectives linkedto the emergence of the new technological paradigm. Most of the contributions have tended toemphasise the positive employment effects of ICTs, both at the firm level and in the servicesector as a whole. The traditional view, which portrayed services as "sheltered" sectors,characterised by low productivity and poor technological performance, has been supersededby one emphasising the high technological performance of sectors such as ICT-relatedservices, telecommunications, or high value added business services (the so called KIBS -Knowledge Intensive Based Services). However, as already mentioned above, the fact thatICTs might also be used to cut down costs, rationalise production and delivery processes, savejobs and skills has often been overlooked. In other words, only the positive effects associatedto the mechanisms a) and b) mentioned above have been taken into account. The debate onthe skill–bias nature of technological change shows a similar bias. There is in fact much moreemphasis on the jobs’ opportunities offered by the ICTs than on the jobs and skills maderedundant by the adoption of new technologies.
The contribution by Evangelista and Savona looks at the impact of innovation on employmentin services using the empirical evidence gathered through the 1993-95 Italian innovationsurvey. The empirical evidence presented shows that the impact of innovation on employmentvaries greatly according to the type of innovation strategy pursued by firms, across industriesand according to the level of qualification of the labour force. Innovation activities tend tosubstitute low skilled jobs with jobs with a higher level of qualification. Among small firms
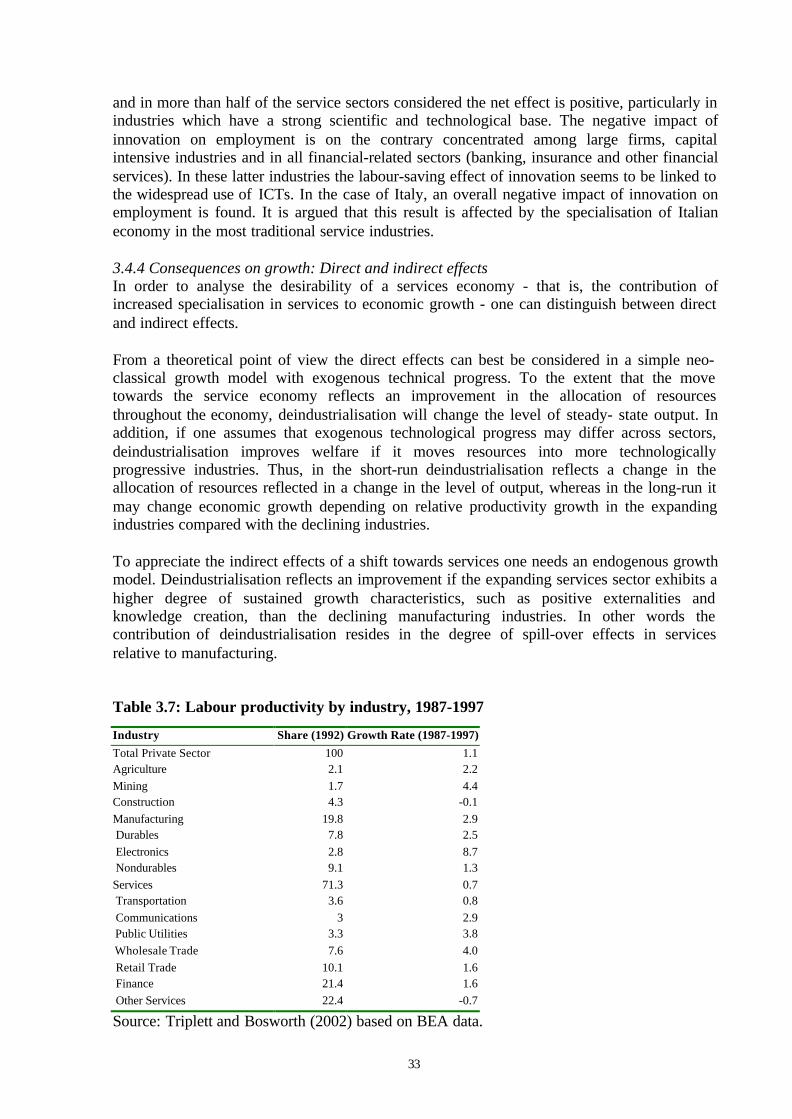
33
and in more than half of the service sectors considered the net effect is positive, particularly inindustries which have a strong scientific and technological base. The negative impact ofinnovation on employment is on the contrary concentrated among large firms, capitalintensive industries and in all financial-related sectors (banking, insurance and other financialservices). In these latter industries the labour-saving effect of innovation seems to be linked tothe widespread use of ICTs. In the case of Italy, an overall negative impact of innovation onemployment is found. It is argued that this result is affected by the specialisation of Italianeconomy in the most traditional service industries.
3.4.4 Consequences on growth: Direct and indirect effectsIn order to analyse the desirability of a services economy - that is, the contribution ofincreased specialisation in services to economic growth - one can distinguish between directand indirect effects.
From a theoretical point of view the direct effects can best be considered in a simple neo-classical growth model with exogenous technical progress. To the extent that the movetowards the service economy reflects an improvement in the allocation of resourcesthroughout the economy, deindustrialisation will change the level of steady- state output. Inaddition, if one assumes that exogenous technological progress may differ across sectors,deindustrialisation improves welfare if it moves resources into more technologicallyprogressive industries. Thus, in the short-run deindustrialisation reflects a change in theallocation of resources reflected in a change in the level of output, whereas in the long-run itmay change economic growth depending on relative productivity growth in the expandingindustries compared with the declining industries.
To appreciate the indirect effects of a shift towards services one needs an endogenous growthmodel. Deindustrialisation reflects an improvement if the expanding services sector exhibits ahigher degree of sustained growth characteristics, such as positive externalities andknowledge creation, than the declining manufacturing industries. In other words thecontribution of deindustrialisation resides in the degree of spill-over effects in servicesrelative to manufacturing.
Table 3.7: Labour productivity by industry, 1987-1997
Industry Share (1992) Growth Rate (1987-1997)
Total Private Sector 100 1.1Agriculture 2.1 2.2Mining 1.7 4.4Construction 4.3 -0.1Manufacturing 19.8 2.9 Durables 7.8 2.5 Electronics 2.8 8.7 Nondurables 9.1 1.3Services 71.3 0.7 Transportation 3.6 0.8 Communications 3 2.9 Public Utilities 3.3 3.8 Wholesale Trade 7.6 4.0 Retail Trade 10.1 1.6 Finance 21.4 1.6 Other Services 22.4 -0.7
Source: Triplett and Bosworth (2002) based on BEA data.
34
Table 3.7 reflects labour productivity by broad industry. As can be seen from Table 3.7, bothservices and manufacturing are extremely diverse. However, although manufacturingproductivity growth indeed exceeds that of services, it is the electronics sector that is largelyresponsible for this differential. In services, wholesaling exhibits higher productivity growththan manufacturing. Finance and retailing experience lower but still above averageproductivity growth. Finance though, is inflated upwards due the stock-market boom.Consulting (not represented) experienced zero productivity growth. One should be careful ininterpreting those numbers as there exist many measurement issues (see Text Box 3.5).
A crucial aspect of a large and increasingly important share of services is that services serveas intermediate inputs to manufacturing or other service industries. This not only complicatesthe measurement of output as highlighted in Box 3.5, but it may also seriously underestimatethe contribution of producer (intermediate) services to economic growth.
The literature linking the use of producer services to productivity in manufacturing is justbeginning to develop. However, it is felt that having a well-developed ‘service structure’ is acrucial ingredient to an economy’s performance. For some services industries the existence ofpositive externalities has been extensively emphasised. For more information on the role of afinancial infrastructure in economic growth see Box 3.6. Another example is presented by theresearch and development industry which constitutes the key in the Schumpeterian type ofsustained growth models. A general model that stresses that importance of specialisedproducer services is presented by Francois (1990a).
Box 3.5: Measurement Issues in Services
The low productivity in producer services may be product of the mismeasurement of output (Triplett andBosworth, 2002). Gullickson and Harper (1999) use input-output analysis to adjust for output that servesas an intermediate input to other industries. Triplett and Bosworth argue that there exists no universalmethod to the measurement of output in services industries.
Triplett and Bosworth state that the share of business services has doubled over the last decade (also one ofthe fastest-growing export sectors). Approximately 80% is provided to other businesses. “Measuring theoutput of business services involves an effort to determine who should receive credit for the productivitygains recorded by the users of business services” (p. 9). Especially for consulting it is difficult “to definethe firms’ activities in a way that leads to clear measures of their output”. Studies that have tried to collectsuch information on consulting are Nachum (1999) and Gordon (1999).
Distribution suffers from the problem that wholesaling also occurs within firms or wholesaling may not beclearly distinguishable from retailing. Also output is often by measured by the value of sales, not theservice activity itself (the margin).

35
3.4.5 The internationalisation of services and economic growthFirst of all, it should be noted that even in the absence of trade in services, services may stillhave an important international dimension. The availability of producer services or the‘service infrastructure’ within a country may be an important determinant of a country’scomparative advantage.
Liberalisation of trade in services involves the free movement of services as well as freemovement of factors of production. Liberalising trade in services affects economic growth ina number of ways.
First, it will affect the allocation of resources. Traditionally, this has been considered ashaving only a static effect (changes in the level of output). However, Ventura (1997) argues ina recent paper that under certain conditions the law of diminishing returns applies only toworld averages. The crucial point is that trade allows countries to specialise. By specialisingtowards more capital-intensive sectors one can circumvent diminishing returns. A similarargument should apply to the impact of foreign direct investment on capital accumulation.
Secondly, liberalisation is likely to have a pro-competitive effect thus reducing prices andincreasing efficiency. Services typically compete on a non-price basis. Instead increasedcompetition is likely to encourage innovation.
Third, trade in services will lead to external economies of scale in the form of a greatervariety of inputs (Francois, 1990b). Also producer services may be available at a betterquality or a lower cost.
Fourth, the larger market size allows services providers to exploit economies of scale. Itshould be noted that this equally holds for research and development. The incentive toinnovate will increase with the size of monopoly rents that can be reaped from successfulinnovations.
Fifth, liberalisation will encourage international knowledge diffusion. This is especiallyimportant for the liberalisation of foreign direct investment. In a recent study Borensztein, De
Box 3.6: Financial Development and Economic Growth
The availability and quality of financial services is a crucial ingredient of economic development. For areview of the literature see Pagano (1993) and Levine (1997). The contribution of financial development toeconomic growth does not reside, as is often argued, in a positive relationship between the private savingsrate and financial development – this link appears to be (nearly) non-existent -, but in the positiverelationship between financial development and intermediated savings. A positive effect of financialdevelopment on economic growth, with total private savings constant, can only be explained by either thelower cost of investment, i.e. a higher operational efficiency, or the better employment of capital, i.e. ahigher allocative efficiency. Operational efficiency is primarily important in order to induce savingsmobilisation, whereas allocative efficiency is most important for its impact on sustained economic growth.The provision of long-term finance (maturity transformation through liquidity insurance) is largelydependent on the ability of financial intermediaries to overcome incentive frictions resulting frominformation asymmetries when allocating capital. In order to solve for such frictions financialintermediaries engage actively in screening, monitoring and exerting corporate control.
36
Gregorio, and Lee (1998) show that foreign direct investment is associated with positiveproductivity spill-overs.
Many empirical studies have investigated a positive relationship between trade liberalisationin goods and economic growth (see for example Edwards, 1993). Only very recently havestudies begun to appear on liberalisation of services and economic growth. On the basis of therelative importance of services in production one might expect that trade liberalisation wouldyield even more important gains (Mattoo et al., 2001). Most empirical studies of liberalisationof services and economic growth are case studies. However, Kim and Kim (2001) conduct ageneral study on the link between the liberalisation of services in Korea in the 1990’s andproductivity improvements in services and manufacturing. Markusen, Rutherford and Tarr(2000) examine the impact of the liberalisation of producer services on the economy as whole.The comparative static model predicts gains form liberalisation in the range of 3-15% ofGDP. The source of these large gains resides in the indirect effect of services liberalisation onfinal goods sector productivity. “More service firms allow final goods producers to use morespecialised expertise, in the same way that larger markets allow for specialised machine tools(p. 25)”. 17
3.5 Open issues and directions for future research
This section has reviewed the literature on a number of issues regarding theinternationalisation of services. Services have become increasingly important in domesticproduction and play a significant role in globalisation. For policy-makers and researchersalike, services have moved to the top of the agenda.
With regards to concepts and definitions the literature seems to be fairly well established.However, it may be useful to improve the understanding of the organisational structure ofinternational service networks. In particular more attention should be directed towards an in-depth analysis of the specific characteristics, the measurement, the internationalisation, andthe impact on economic growth of distribution, financial, and consulting services.
A particularly interesting avenue is to analyse the role of these three specific services in acountry’s ‘service infrastructure’. How does the development of a country’s service
17 They note that although in the short-run this may harm wages of domestic skilled workers, the availability ofcheaper imported services leads the service-intensive final good industries to expand, increasing the demand forskilled labour.
Box 3.7: The Internationalisation of Financial Services and Economic Growth
There exists an extensive empirical literature that tries to establish the causality from financialintermediation to economic growth. However, very little work has been done on the relationship between theinternationalisation of financial services and economic growth. Francois and Schuknecht (1999) exploreboth theoretically and empirically the linkages between trade in financial services and growth. They find astrong positive correlation between liberalisation of trade in financial services and financial sectorcompetition as well as between the financial sector and economic growth. They interpret their results asevidence for a strong causal relationship between trade in financial services and economic growth.Mattoo et al. (2001) analyse the impact of openness in telecommunications and financial services onsustained economic growth. For both sectors they find positive and statistically significant results, althoughthe impact of financial service sector openness is much more pronounced than in telecommunications.

37
infrastructure affect productivity in the rest of the economy? Are distribution, financial, andconsulting services equally important is this respect? What is the role of culture inestablishing user networks? Does a service infrastructure attract manufacturing or do servicestravel with manufacturing?
One possible direction of future research that will be followed in this project is thedevelopment of a taxonomy of the internationalisation of services. It is helpful to think of theinternational services firm as employing labour in two activities: delivery and specialistbusiness services. The delivery activity will be responsible for the face-to-face contact withthe customer and hence for tailoring the services provided to the needs of the individualconsumer. The skill with which they are able to supply the service will depend on the inputthat they can get from the firm’s specialist business services activity which is a source ofinformation, knowledge and expertise. These specialist activities will tend to be carried out inthe firm’s head offices. In banking, for example, there will be certain financial activities suchas futures market operations which are located in financial centres like London and Frankfurt.By contrast the delivery activity is likely to be more geographically dispersed so as to be closeto customers. Services are generally distinguished from goods by their requirement for face toface contact between seller and buyer. This derives from the general non-storability ofservices combined with their characteristic intangibility. Although technological changes areeroding the distinction between services and goods, the face-to-face contact criterion remainsa useful one as far as delivery activities are concerned.
As communications have developed it is increasingly feasible for specialist and deliveryactivities to be geographically separated, not just within countries but also between them.International fragmentation of the production process has become increasingly important inmanufacturing allowing individual parts of the production process to be relocated where costsare lowest. We use fragmentation below as an important criterion in distinguishing betweenforms of internationalisation in services.
One might also like to consider the possibility that at least part of the delivery activity couldtake place outside the client’s country – this would allow the consumer to move to theproducer of specialist services. Some foreign banks may, for example, have branch offices inLondon which enable them to access specialist financial services which they don’t themselvescarry out in-house, and which they can then deliver back to their clients in their home country.We argue that the possible geographical separation of delivery and specialist business serviceswithin individual firms is a crucial aspect of internationalisation. However, the deliveryactivity is always located close to the consumer, enabling face-to-face contact, and theconsumer is considered to be immobile. This might need to be reconsidered but conceptuallythe geographical separation of some delivery activities from consumers does not lookinteresting since they then share many of the features of the specialist services.
Thinking of the services firm as employing labour in two activities – the specialist anddelivery activities – suggests a basis for a typology of the internationalisation of businessservices. A fundamental distinction should first be made between vertical and horizontalforms of internationalisation. In vertical forms, a firm’s specialist business services activitywould be located in the home country while the delivery activity is located in both the homecountry (for domestic consumers) and the foreign country (for foreign customers). Wheninternationalisation takes a horizontal form, both specialist and delivery activities are in thesame country; internationalisation occurs through the exchange of knowledge and expertisebetween specialist activities in different national subsidiaries of the same firm. In this view,the international firm delivers a branded, international product to a collection of national
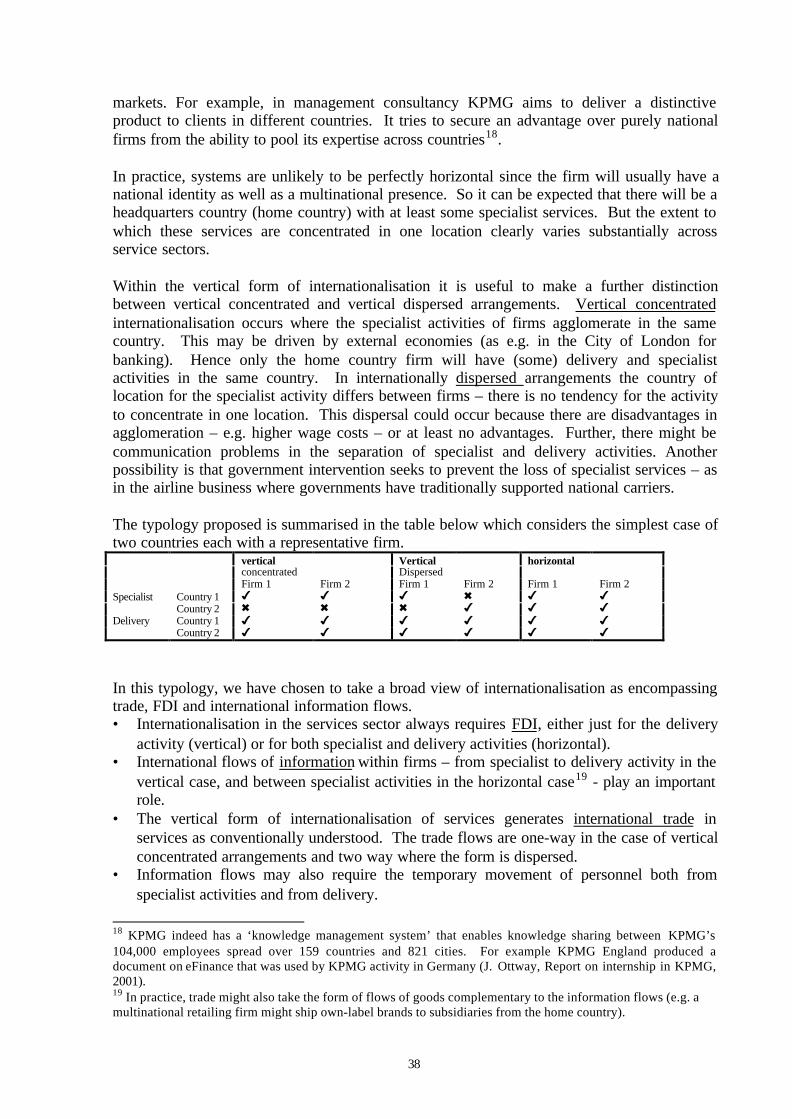
38
markets. For example, in management consultancy KPMG aims to deliver a distinctiveproduct to clients in different countries. It tries to secure an advantage over purely nationalfirms from the ability to pool its expertise across countries18.
In practice, systems are unlikely to be perfectly horizontal since the firm will usually have anational identity as well as a multinational presence. So it can be expected that there will be aheadquarters country (home country) with at least some specialist services. But the extent towhich these services are concentrated in one location clearly varies substantially acrossservice sectors.
Within the vertical form of internationalisation it is useful to make a further distinctionbetween vertical concentrated and vertical dispersed arrangements. Vertical concentratedinternationalisation occurs where the specialist activities of firms agglomerate in the samecountry. This may be driven by external economies (as e.g. in the City of London forbanking). Hence only the home country firm will have (some) delivery and specialistactivities in the same country. In internationally dispersed arrangements the country oflocation for the specialist activity differs between firms – there is no tendency for the activityto concentrate in one location. This dispersal could occur because there are disadvantages inagglomeration – e.g. higher wage costs – or at least no advantages. Further, there might becommunication problems in the separation of specialist and delivery activities. Anotherpossibility is that government intervention seeks to prevent the loss of specialist services – asin the airline business where governments have traditionally supported national carriers.
The typology proposed is summarised in the table below which considers the simplest case oftwo countries each with a representative firm.
vertical Vertical horizontalconcentrated DispersedFirm 1 Firm 2 Firm 1 Firm 2 Firm 1 Firm 2
Specialist Country 1 4 4 4 6 4 4Country 2 6 6 6 4 4 4
Delivery Country 1 4 4 4 4 4 4Country 2 4 4 4 4 4 4
In this typology, we have chosen to take a broad view of internationalisation as encompassingtrade, FDI and international information flows.• Internationalisation in the services sector always requires FDI, either just for the delivery
activity (vertical) or for both specialist and delivery activities (horizontal).• International flows of information within firms – from specialist to delivery activity in the
vertical case, and between specialist activities in the horizontal case19 - play an importantrole.
• The vertical form of internationalisation of services generates international trade inservices as conventionally understood. The trade flows are one-way in the case of verticalconcentrated arrangements and two way where the form is dispersed.
• Information flows may also require the temporary movement of personnel both fromspecialist activities and from delivery.
18 KPMG indeed has a ‘knowledge management system’ that enables knowledge sharing between KPMG’s104,000 employees spread over 159 countries and 821 cities. For example KPMG England produced adocument on eFinance that was used by KPMG activity in Germany (J. Ottway, Report on internship in KPMG,2001).19 In practice, trade might also take the form of flows of goods complementary to the information flows (e.g. amultinational retailing firm might ship own-label brands to subsidiaries from the home country).

39
For the three sectors identified by the SETI project for special attention the following tableattempts to identify the nature of the activities undertaken:
Specialist activity Delivery activityRetailing Product design, international
procurement, design of delivery systemsProduct delivery – retail stores
Banking Specialised financial services Product delivery – branch banksManagement consultancy Specialised management services,
collating information, managementactivity training
Product delivery – branch consultancies
We have already stressed how the ICT revolution has played a major role in the process offragmentation and internationalisation of services. In what follows we focus the attention onthe theoretical and empirical contributions that have highlighted the major characteristics ofthe ICT revolution and its impact on the economy.
4. The Information and Communication Technology (ICT) revolution
The all-purpose technological revolution based on Information and CommunicationTechnologies (ICT) – born in the US - has by now spread in most of European countries.However, while the macroeconomic benefits of the ICT revolution are already apparent insome industrial countries, and especially in the United States, in several European countriesthey are still hardly quantifiable. As it is widely known, ICT contributes to labour productivity growth through both capitaldeepening and total factor productivity (TFP) growth. The rapid decline of prices of goodsthat embody the new technology stimulates unusual investment in these goods, thus resultingin significant capital deepening (ICT-related capital deepening). At the same time,technological change raises TFP growth in the innovating sector. Both phenomena can lead toan acceleration in overall productivity growth. Therefore, it is straightforward that theamount, diffusion and characteristics of ICT investment expenditure is a key issue of theongoing technological revolution on the economic system. Two streams of literature have focussed on the role of ICT as a pervasive technology,affecting not only the productivity and employment level of the ICT sector, but of the wholeeconomic system. These are the Schumpeterian literature on techno-economic paradigms andthe neo-classical literature on General Purpose Technologies (GPT). The first theoreticalframework emphasises the complementarity between technological and organisational changeand the crucial role played by institutions in favouring or hampering the diffusion of the newparadigm in the different countries. The second approach is more formalised and focuses onthe comparison between the social optimum and the outcome of a decentralised economy inthe presence of GPTs which are characterised by innovational complementarities giving riseto increasing returns to scale. In this section, we first present these two frameworks (Section 4.1) and then provide a reviewof the empirical literature on ICT, productivity and growth with particular attention tocomparisons between the US and Europe (Section 4.2).

40
4.1 Theoretical frameworks
4.1.1 ICT as a new techno-economic paradigm
The concept of techno-economic paradigm has been used to refer to a set of guidingprinciples, which become managerial and engineering commonsense for each major phase ofdevelopment (Perez, 1983, 1985, 1988; Freeman and Perez, 1988). A change in paradigmcarries with it many clusters of radical and incremental innovations and has pervasive effectsthroughout the economy, spreading from the initial industries where it takes place to thewhole economy. Such characteristics may be found in different waves of development in coal,steel, oil, and nowadays in microelectronics and telecommunications.
Innovations in the field of microelectronics have led to a technological revolution that hasdirectly affected some industries (computers, electronic components, telecommunication) andindirectly the whole economic system of the leading industrial countries. Moreover it has alsoinvolved organisational and social changes to the extent that we can properly talk of a newtechno-economic paradigm. Freeman and Soete (1987) analyse the growing impact of the newtechno-economic paradigm by considering its uneven diffusion from a few leading sectors tothe economy as a whole. Considering in particular the service industries, they find that there isa group of service sectors based on information technology that are among the fastest growingactivities but still account for a small proportion of service output and employment (software,databanks, computerised information services, design etc.). There is another group of servicesectors that has also been affected by information technology with uneven increases in labourproductivity among firms and countries. This includes the banking, insurance and retailservices (this phenomenon is particularly important as it shows that gains in productivity arenot necessarily higher within the manufacturing sector). The majority of service sectors havenot been able to achieve major gains in labour productivity owing to the lack or very limiteddiffusion of information technologies.
Overall the new paradigm linked to ICT has unevenly affected the different sectors of theeconomy; however its impact does appear to have had a pervasive nature. As a consequencecountries’ ability to achieve high rates of growth and low rates of unemployment are likely tobe linked to the extent to which they are able to produce and use the new technologies.
4.1.2 ICT as a GPT
GPTs are characterised by the potential for pervasive use in a wide range of sectors and bytheir technological dynamism. As a GPT evolves and advances it spreads throughout theeconomy, bringing about and fostering generalised productivity gains. Most GPTs play therole of enabling technologies, opening up new opportunities rather than offering complete,final solutions. This phenomenon involves what we call innovation complementarities, that is,the productivity of R&D in a downstream sector increases as a consequence of innovation inthe GPT technology. These complementarities magnify the effects of innovation in the GPT,and help propagate them throughout the economy. Like other increasing returns to scalephenomena, innovation complementarities create both opportunities and problems foreconomic growth through technical advance. In particular it can be shown that a decentralised
41
economy will have difficulty in fully exploiting the growth opportunities of GPTs resulting in“too little, too late” innovation (Bresnahan and Trajtenberg, 1995; Helpman, 1998).
The literatures on techno-economic paradigms and GPTs share the view that in different timeperiods different technologies play a crucial role in their ability to impact on different sectorsof the economy. They also share the view that such major innovations create imbalances inthe system and that it takes time to exploit their full potential (this is one of the explanationsof the productivity slow-down in the neo-classical literature). However the more formaltreatment of the impact of these technologies in the GPTs literature comes at the expense of aless rich and articulated view on the relationship between technological and institutionalchange which is crucial in the literature on techno-economic paradigms. 4.2 ICT and growth in the US and in Europe: A short review
4.2.1 An overview of the US debate on ICT and growth
Growth theory and growth empirics have undergone a revival from the mid-1980s. First, thedominant paradigm, that of the neoclassical growth model and its offsprings, has been revisedin order to overcome its major limitations. Second, a new brand of growth models have beengenerated, the so-called “Endogenous growth models”. In the end, we have now availableboth new (“augmented”) neo-classical models and a “New growth theory” (see Barro andSala-i-Martin, 1995; and Aghion and Howitt, 1998 for comprehensive reviews). Coming togrowth empirics, the recent wave of research has first featured cross-country studies, thenpanel data econometrics and more recently time series and distribution dynamics (Durlauf andQuah, 1998). From the mid-1990s, that is almost a decade after the start of the new growth debate, the so-called “New economy” and its relations with growth have moved to the center of the stage.More and more researchers have started to study the conceptual links between theintroduction of information and communication technologies (ICT) and economic growth,and evaluate their quantitative effects on national accounts. A reason why that happened wasa mounting attention to the “Computer productivity paradox” of why productivity growth inthe US was not strong in the 1980s and early 1990s despite the spread of ICT in the economy(Triplett, 1999).
The paradox was due to many factors: first, there was (and possibly is) a measurementproblem involved in the definition of the ICT sector itself, and then in the economicevaluation of the components of this sector (the ICT goods). The problem is now apparentlysolved as the OECD provides an official definition of ICT, and the ICT goods and services areevaluated taking into account their inner quality (in the US, with the tool of hedonic pricing:see OECD, 2001, for an assessment of methodological issues). Another problem was implicitin the definition of productivity itself and in the productivity dynamics assumed by new-economy theorists. The distinction between the production and use of ICT is central in thiscase. According to a simple two-sector neoclassical framework, if we are to measure thegrowth contribution of technical progress in the sectors producing ICT, we have to computetotal factor productivity (TFP) in the ICT-producing industries, as in this case technicalprogress is associated with an outward shift of the production function. If, on the other hand,we are to measure the impact of ICT utilization on the productivity of whole economy, wehave to calculate the variation in average labour productivity (ALP) associated with theeconomy-wide rise in ICT investment (see Stiroh, 2001). This distinction is fundamental,because the overall impact of ICT on per capita output crucially depends on which is the main
42
channel of productivity improvement, and on the relative weight of the ICT sector vis-a-visthe rest of the economy. It is clear that the contribution of technical progress is the smaller,the lower the relative weight of the ICT-producing sector; on the other hand, in order for theeffects of the ICT investment channel to become visible, more time is required for the newcapital goods to fully generate a strong and permanent effect on labour productivity. A final question, related with the previous one, is whether productivity spillovers areassociated with the ICT. In this case too, we can have spillovers due to the diffusion oftechnical progress from the ICT-producing sectors outside (but how relevant is this likely tobe?), or productivity spillovers due to the use of ICT in the rest of the economy (networkexternalities; technical complementarities with other innovations generating in other sectors,such as the aircraft industry). In both cases, one has to distinguish between a neoclassical,constant-returns-to-scale (CRS) paradigm, and an alternative increasing-returns-to-scale (IRS)paradigm: no spillovers are admitted in the first one, but they are allowed in the second one.In general, empirical analysis is needed to discriminate across these models. Empirical studies on the contribution of ICT to growth have flourished in the US in recentyears. They have mainly be inspired by the growth-accounting methodoloy, and they haveprovided slightly different answers to the above questions (also because of differences in themeasurement approach). In the years of the so-called “Computer productivity paradox”(broadly speaking, the 1980s and the first half of the 1990s), the contribution of ICT servicesto growth was sluggish. According to the estimates obtained in growth-accounting studies, thecontribution of ICT capital goods to the annual growth rate was of 0.35 percentage point inthe period 1973-90, and of 0.40 percentage point in 1990-95 (Jorgenson and Stiroh, 2000).This is not a negligible contribution, but is possibly less than expected if one considers thatinvestment in ICT amounted already to 15 percent of non-residential gross fixed capitalformation of the US business sector in 1980, to rise to 22.5 percent in 1990 (OECD, 2001).Moreover, Moore’s Law of the doubling of the power of computer chips every eighteenmonths would have pointed out to a stronger impact of ICT investment on growth.
As mentioned above, the paradox faded away in the second half of the 1990s, when thecontribution of ICT to aggregate growth was estimated as substantially higher. Jorgenson andStiroh (2000) report that the contribution of computer hardware alone moved from 0.19percentage point per year in 1990-95 to 0.46 percentage point in 1995-98; adding computersoftware and communication equipment, the global contribution of ICT to growth is of 0.75percentage point in the second period. Slightly different figures are found by Oliner andSichel (2000), who estimate a contribution of computer hardware of 0.25 percentage point peryear in 1990-95, and of 0.63 in 1995-99. Both studies agree that ICT capital accumulation hasplayed an important role in the resurgence of US productivity growth in the late 1990s. Thereason why ICT investment was so late in materialising in aggregate accounting data, is thatthe dimension of the ICT producing sector, on the one had, and of the stock of ICT capitalgoods in the whole economy, on the other hand, was still small at the beginning of the 1990s.This means that, although technical progress and TFP growth were strong in the ICT sector,only after a sustained boom in ICT investment during the 1980s and 1990s there were enoughinformation technology inputs in the whole economy to have a significant effect on economy-wide productivity growth. This is not to deny the key role of technical progress in this neo-classical interpretation of the US productivity puzzle: quite the opposite, indeed, as theimpressive decline in the relative prices of these high-tech industries, due to innovation andTFP growth, prompted massive investment in ICT in other sectors. In turn, this ICTinvestment may act either as a substitute or a supplement to other kinds of capital expenditure:however, in both cases one is likely to expect a positive contribution to growth through the
43
ALP channel, either because ICT investment replaces more traditional, and less productivecapital goods; or through a capital deepening mechanism of higher capital-labour ratios. Notwithstanding the solution to the computer productivity paradox (the contribution of ICT toaggregate growth only becomes visible when information technology accounts for a largeenough set of capital goods in the economy, or when the ICT producing sector accounts for alarge part of GDP) a number of research questions are still open in the US debate. First,measurement debates are still under way, and especially the topic of if, and how, to adjust forthe evolving quality of ICT goods is currently investigated. Second, ALP growth seems toremain relatively sluggish in ICT-intensive sectors such as finance, insurance and real estateservices. The answers provided for this additional puzzles are that computers are stillrelatively new objects and that the full potential for labour productivity growth may take somemore time to be exploited, or that computers are simply not so productive in some industries(Stiroh, 2001). 4.2.2 International comparisons of ICT and growth in the OECD area
The academic and business debate on ICT and growth has eventually moved from a US-centered to an international dimension. In May 1999, the Economics Department of theOECD launched an ambitious two-year research project on “Sustainable growth and the NewEconomy”, which over time has provided a great deal of comparative studies on the natureand dynamics of innovation- and information-based growth.
The starting point of comparative studies is twofold: first, there is evidence of a gap in therelevance of the ICT sector between continental Europe, on the one hand, and the US and therest of the industrial countries, on the other hand, at the midst of the 1990s (Daveri, 2000). Infact great concern has been expressed about the position of most European countries, whichhave not been able to accumulate strong competencies in the fast-growing fields. Fagerberg,Guerrieri and Verspagen (1999) have argued that the problems that Europe faces in terms oflow rates of growth and high rates of unemployment are partly linked to the unsatisfactoryperformance of European countries in science based industries and in particular in ICT. Overthe 1980s European integration appears to have favoured natural resource-based and scale-intensive industries while Europe has experienced significant losses in export shares in R&Dbased industries.
Second, the growth performances of continental Europe and Japan have been remarkablyworse than those of the US in the 1990s, although the gap in ICT diffusion has beenprogressively closed during the decade (Schreyer, 2000). This evidence poses a number ofintriguing research questions. In the first place, Is there still a gap in ICT adoption in Europe,or is it currently being filled? Second, What was (or, is) approximately the time-delay in ICTadoption between the US and other main industrial countries? and What is the time-delay inthe contribution of ICT to growth? What are the key features of the US growth phenomenonof the 1990s, and what are the “systemic” requirements that seem essential in order for a“New Economy” to be established in OECD countries? Let us review some of the answers tothis questions. International comparisons of the role of ICT in industrial countries have shown that two, oreven three, groups of national patterns can be identified. According to Schreyer (2000, Table1), at the end of 1996 the share of capital stock accounted for by ICT goods was about 2percent in Italy and Japan, 3 percent in West Germany and France, 5 percent in Canada andthe UK and over 7 percent in the US. Even within Europe, Daveri (2000) identifies laggards

44
(Italy, Spain and to a lesser extent Germany and France) and fast adopters (the UK,Netherlands, Sweden, Finland). However, once we have classified industrial economiesaccording to their ICT endowments, the question becomes: Has the wedge between leadersand slow adopters been partially closed since the mid-1990s? While some authors offer apositive answer to that (see for instance Schreyer, 2000, p.5), recent evidence casts somedoubts on this issue. According to the OECD (2001, Table 2), the annual rate of growth ofconstant price ICT investment over 1996-99, based on harmonised prices, has been 23 percentin the US, 22 percent in France but only 15 percent in Italy and Germany. Japan performedeven worse, with an annual growth rate of 11 percent. Is is true that, as the national economiesof continental Europe started behind, expenditure in ICT is now close to 6 percent of GDP inWestern Europe with a strong catch-up effect vis-a-vis the US (Iammarino et al., 2001), theexceptional and sustained pace of economic growth in the US during the 1990s has magnifiedthe denominator of this ratio and thus accomodated larger expenditure for ICT and largernational product. This brings us to the second theme outlined above. The US experienced an historicallyunprecedent period of uninterrupted growth during the 1990s, while the pace of economicgrowth has been sensibly reduced in continental Europe. Of course, many factors contributedto these outcomes, including fiscal consolidation in Euroland, accomodative monetary policyin the US, structural differences in labour, product and financial markets across the Atlantic,and also the higher weight of R&D in the US economy relative to Europe. In Japan, economicconditions severely worsened during the 1990s, and stagnation virtually prevailed over thedecade. To what extent, and why, is the ICT sector also responsible for these developments?According to Daveri (2000), the growth contribution of ICT was substantial in the UK andNetherlands, and rapidly increasing in over the 1990s in Finland, Ireland and Denmark. Onthe other side, ICT contributed less to growth in France, Germany, Belgium and Sweden, andonly marginally in Spain and Italy. Hence, with the exception of Sweden, the distinctionbetween leading and slow adopters in Europe replicates the distinction between high and lowcontributions of ICT to aggregate growth. Moreover, the same line can be drawn between fastand slow growers. This interpretation is therefore consistent with the neo-classical taledescribed by Stiroh (2001), and the lag in European adoption of ICT (say, five to seven years)is the key for understanding the modest contribution to growth. If this is true, and followingthe US experience, one could expect a more relevant contribution of ICT to growth in Europein the next future, and possibly several years of rising per capita output.
Schreyer (2000) offers a different position, arguing that the gap in the growth contribution ofICT between the US and other G7 countries is not completely explained by the time-delay inthe adoption of ICT technologies. In fact, the modest contribution in the first half of the 1990sin Europe and Japan occurred despite significant investment in ICT. Schreyer suggest thatboth a methodological bias (namely, different measurement techniques) and the lack of astrong ICT-producing sector in continental Europe could be part of the solution to the puzzle.We will come back on this in the next paragraph. Recent evidence on the growth contributionof ICT across industrial countries seem to reinforce some skepticism on possible “automatic”prospects for productivity growth in Europe. In a study adopting an harmonised price indexand a new method for the treatment of software (considered as capital expenditure and not asintermediate consumption), the authors come to the conclusion that, while the role of ICT isrelevant and increasing in the US, Canada, Australia and Finland, there is no evidence of anincreasing contribution of ICT to growth in other industrial economies over 1995-99 (OECD,2001). In order to better understand the main features of the US model of productivity growth,and the possible requirements for extending it to Europe, let us move onto the next section.
45
4.3 Open Issues and Directions for Future Research
The main macroeconomic features of the US growth story in the 1990s can be summarised asfollows. In the labour market, we observed a rise in employment rates and a fall inunemployment, while at the same time there was a sustained increase in labour productivity.These developments seemed to allow for a structural change in the behaviour of the labourmarket, shifting down the “natural” rate of unemployment or the NAIRU (non-acceleratinginflation rate of unemployment), and thus leading to a low dynamics of aggregate prices in thepresence of prolonged growth. Exceptional investment rates in historical perspective, and verylow personal saving rates possibly due to the anticipation of future income growth (alsoreflected in high stock market values), explain the widening US current account deficit; at thesame time, the strong value of the dollar is mainly interpreted as a side-effect of the USgrowth prospects. US productivity growth in the second half of the 1990s was strong both in ICT-producing andICT-using sectors. However, the data show a clear distinction between the role of technicalprogress in the ICT-producing sectors, and the role of labour productivity growth in the ICT-using sectors (Jorgensen and Stiroh, 2000; Oliner and Sichel, 2000). Moreover, much of theacceleration in aggregate US productivity growth after 1995 can be traced to accelerations inthe pace of technical progress in ICT-producing sectors - measured as faster relative pricedeclines in these high-tech industries. No strong evidence of spillover effects has been found,hence the neoclassical constant-returns-to-scale paradigm looks appropriate as a heuristicframework to analyse the New Economy (Stiroh, 2001). Finally, software capitalaccumulation seems to have played a relevant role in US productivity dynamics in the secondhalf of the 1990s (OECD, 2001). To what extent the US success story is (or was?) accounted for by the existence of a strongICT-producing sector, which is lacking in several countries in Europe? In other words, is itthere a question of comparative advantage in high-tech industries that is consistent with awindfall of technical progress in the US but not in continental Europe? Another issueconcerns the role of structural factors in the recent comparative performance of the OECDeconomies, and in particular the impact of national factor markets in the different outcomeson the two sides of the Atlantic (and the Pacific as well). For instance, if we agree that thefinancing of innovation is clearly one of the key issues, as it deals with the Schumpeterianperspective on the role of financial markets that is more appropriate in a dynamic approach,then the contribution of capital markets to the development of the New Economy is crucial. We do not aim to yield exhaustive and final answers to such fundamental questions, but tofurther investigate this topic with particular attention to the performance of Europeancountries. As a matter of fact, the central growth debate at the turn of the century is: Why andhow the performance of the US economy has so radically changed in the last decade, bringingabout a renewed American leadership in terms of productivity and income growth, andsweeping away many arguments in favour of an “automatic” convergence of the otherindustrial economies towards the US? How can Europe (and Japan) establish the righteconomic environment such that technology diffusion and market functioning allow for new acatching-up process towards the US? As far as the issue of comparative advantage is concerned, Roeger (2001) calibrates a two-sector-two-skill growth model of the US and European economies, featuring both an ICT-producing and an ICT-using sector, and skilled and unskilled labour. The purpose of thecalibrations is to evaluate whether structural differences between the US and Europe can

46
explain the growth rate gap of the 1990s: it is widely believed that factor markets are moreflexible in the US, and this could account for the better macroeconomic performance. Roeger(2001) provides indeed some evidence showing that capital adjustment costs were probablylower in the US, as the variability of the cyclically adjusted investment to GDP ratio has beenclearly higher in the US than in Europe. As far as the labour market is concerned, his evidencequestions the idea that higher European adjustment costs may be mainly due to hiring andfiring regulations, while more support is found to the hypothesis of wage inflexibility acrossskill groups in Europe. However, the main point is that even if one includes differentialadjustment costs in Europe and the US in the model, the productivity growth gap is notexplained by the features of factor markets. The main point of Roeger is that higher rates ofTFP growth or technical progress, and not lower adjustment costs, are at the core of theproductivity growth leap in the US; in turn, TFP growth is associated with the comparativeadvantage the US have in the production of high-tech goods, hence comparative(dis)advantage and not Eurosclerosis in general must be blamed for the inferior growthperformance in Europe. If Roeger (2001) is right, namely there is no European comparative advantage in ICTproduction, then it becomes crucial for Europe to perform very well in ICT utilisation. Only asatisfactory performance in ICT utilisation can contribute to close the growth gap betweenItaly, and Europe in general, and the US. In this sense, it becomes relevant to investigate anumber of issues: first, what was the record of aggregate ICT investment in the Nineties, andhas the endowment gap with the US been filled so that we can now expect that the growth gapwill be filled as well? Second, has ICT investment been spread economy-wide, or has itstayed confined in a few productive branches? Third, what are the main features associatedwith sectoral patterns of ICT investment, and is ICT intensity higher in industries where thepotential for productivity growth seems larger?
As we have already argued ICT have also played an important role in the process ofinternationalisation (globalisation) of technology. At the same time, the internationalisation ofR&D has an impact on countries’ technological potential and competitiveness and thus affectsalso the way in which ICT technologies are developed and diffused in the economy. In whatfollows we focus the attention on the theoretical and empirical literature on theinternationalisation of technology. 5. The internationalisation of technology
Multinational companies (MNEs) play a dominant role in the innovation activities of theirhome country and control a vast proportion of world’s stock of advanced technologies. Theirdecisions in term of mode, location and exploitation of their R&D results greatly influence thehome country’s technological potential and competitiveness (Patel and Pavitt, 1999). Thegrowing significance of the internationalisation of R&D activities of MNEs over the past twodecades has therefore been cause of some concerns among innovation policy makers. InEurope it has been advanced that the performance of R&D activities in foreign countriesmight result in a “hollowing out” of domestic capabilities, whenever national firms locateinnovation activities in fast growing fields abroad. This is regarded as indicative of aweakening of the national innovation system and an erosion of the technologicalcompetitiveness (ETAN, 1998). In the United States the internationalisation of industrialR&D has brought with it worries about a possible impoverishment of the national technologybase due to the increasing local R&D activities of foreign MNEs.
47
To be able to evaluate the potential impact on the home countries it is crucial to determine theextent and the nature of the R&D activity that has been relocated abroad. To this end theexisting theoretical and empirical literature on the growing involvement of MNEs in foreignR&D will be reviewed.
5.1 Theoretical framework
Although the global generation of technology by European MNEs dates back to the interwarperiod (Cantwell, 1995), little research on the topic was been carried out until the 1980s. Wemust attribute the lack of interest in the location of R&D activity by MNEs to the widespreadbelief that MNEs were concentrating innovation activity in their home country. Empiricalevidence to support this assumption was provided using data on US MNEs. Americancompanies were performing most of their R&D effort at home where high demand andadvanced technological resources and capabilities were providing a constant stimulus to theirinnovation activities. European firms, especially from small countries, have instead shownhistorically a higher tendency to conduct both production and innovation activities abroadbecause of the lack of similar supply and demand conditions in their domestic market.
Early studies of the process of internationalisation of R&D used as an analytical frameworkthe product-cycle model of Vernon (1966, 1977). The original product-cycle model (1966) isbased on the assumption that innovation is a demand-led process: it arises from a marketstimulus. But according to this hypothesis, firms tend to be stimulated by the needs stemmingfrom the nearest market, the home market. The home market plays a dual role in this model: itis considered the source of stimulus of innovation and at the same time it is the preferredlocation for performing R&D activities. Innovating firms will therefore concentrate theirR&D effort at home where they can benefit from both the availability of scientists andengineers with the required skills, and the proximity to and, interaction with, potentialcustomers. Economies of scale in R&D activity and agglomeration effects, as well as the needfor the coordination and control of expensive and risky investments are also reasons forkeeping R&D and the initial stage of production in a common location (Vernon, 1977).Therefore in this model internationalisation of production was limited to mature andstandardised products and minor adaptive and development work would be the only R&D toaccompany the foreign production.
Nevertheless, this model, with its demand-led interpretation of the innovation process and theimportant role it gives to proximity to local costumers, has contributed significantly to ourunderstanding of why overseas R&D is undertaken. As firms increasingly locate productioncloser to their customers and suppliers they need R&D laboratories to adapt the technologiesand product developed at home to local conditions. The creation of such technical supportlaboratories, as defined by Hood and Young (1982), are then supposed to accompany the laterstages of the production process abroad. Indeed they seem to follow a linear progressionbased on the age, growth and relative size of the international production of the MNE (Lall1979). In this framework the technological advantages of the affiliates primarily reflect thoseof the home country (where the core of innovation activities continues to be concentrated) andforeign R&D units tend to enhance the existing parent-company technologies. This type ofR&D site has been termed “home-base exploiting” (HBE) (Kuemmerle, 1997) or “asset-exploiting” (Dunning and Narula, 1995).
In general, the more embedded the foreign subsidiary, and the greater the intensity of thevalue-adding activity, the greater the amount of R&D activity. This leads to a duplication ofits home base activities, since the host location is acting as a substitute for activities it may

48
have wished, ceteris paribus, to have undertaken at home (Zander, 1999), but now finds thatit can undertake more efficiently elsewhere. On the other hand, evidence clearly suggests thatthis is intermediated by industry level effects (e.g., Lall, 1979; Patel, 1997). This type offoreign R&D operations has usually supported the expansion of international production, notin high-tech product groups, but rather in sectors where adapting the product to serve the localmarket is important.
Over the last decade some of the factors encouraging centralisation of R&D activities havebecome less influential, i.e. the cost of technology transfer and the shortage of human capitaland scientific infrastructures in the host countries. As multinationals have extended anddiversified their global operations, they have set up global R&D networks. This strategy isbased not only on the wish to rationalise R&D expenditures and to avoid duplication of R&Dactivities, but also indeed to absorb and acquire technological spillovers, either from the localknowledge base (be they agglomeration effects or from public infrastructure), or from specificfirms. These R&D activities have been defined as “home-base augmenting” (HBA)(Kuemmerle, 1997) or “asset-seeking” R&D activity (Dunning and Narula, 1995). In suchkinds of investments, firms aim either to improve their existing assets, or to acquire (andinternalise) or create completely new technological assets by locating R&D facilities abroad.The assumption in such cases is that this provides access to location-specific advantages thatare not as easily available in the home base and that might be associated with the presence ofa lead market (Meyer-Kramer and Reger, 1999). Location decisions for this type of R&Dfacility are based not only on the technological infrastructure of the host country, but also onthe presence of other firms and institutions, which may create externalities that investingfirms could absorb. Another distinguishing feature of this type of R&D site is that it can becompletely independent from the production process of the firm: it could set up a foreignR&D facility in a country even if it has no intention of producing there.
There are several reasons why such HBA R&D activities would be hard to achieve from thehome base. As suggested by Von Hippel (1994), when the knowledge relevant for innovativeactivities is located in a certain geographical area and it is very “sticky” 20, the R&D activityshould take place at that site, according to the principle of cost minimization. Foreignaffiliates engaged in HBA activities are attracted to these technological clusters in order tobenefit from the external economies and knowledge spillovers generated by the concentrationof production and innovation activities.
Among the reasons for such sticky knowledge, the argument for the tacit nature of knowledgeoften stands out. The tacit nature of technology implies that even where knowledge isavailable through markets, it still needs to be modified to be efficiently integrated within theacquiring firm’s portfolio of technologies. In addition, the tacit nature of knowledgeassociated with production and innovation activity in these sectors implies that “physical” orgeographical proximity is important for transmitting it (Blanc and Sierra, 1999). While themarginal cost of transmitting codified knowledge across geographic space does not depend ondistance, the marginal cost of transmitting tacit knowledge increases with distance. This leadsto the clustering of innovation activities, in particular at the early stage of an industry lifecycle, where tacit knowledge plays a particularly important role (Audretsch and Feldman,1996). In other words, spillovers are stronger within a small geographical unit (see, e.g., Jaffeet al., 1993, Jaffe and Trajtenberg, 1996, Sjöholm, 1996, Maurseth and Verspagen, 2001).
20 Von Hippel (1994) defines stickiness as the incremental expenditure required to transfer that unit ofknowledge.
49
However, merely establishing R&D activities abroad for the purposes of tapping into pools ofscientific knowledge does not necessarily mean that firms will be successful in doing so.There are a wide variety of factors that determine the MNE’s efficiency in internalisingspillovers. First, it is difficult to manage cross-border R&D activities. A dispersion of R&Dactivities across the globe requires extensive coordination between them – and particularlywith the headquarters - if they are to function in an efficient manner with regards to thecollection and dissemination of information. This acts as a centripetal force on R&D, andaccounts for the tendency of firms to locate R&D (or at least the most strategically significantelements) closer to headquarters. Although these problems have been mitigated bydevelopments in ICT which have facilitated the management and coordination of internationalresearch networks, geographical distance still represents a barrier for the transfer ofknowledge.
Such growing complex linkages, both within networks internal to the firm, and betweenexternal networks and internal networks, require complex coordination if they are to provideoptimal benefits (see Zanfei, 2000, for a discussion). Such networks are not only difficult tomanage, but also require considerable resources (both managerial and financial). It is nosurprise, therefore, that external technology development is primarily the domain of largerfirms with greater resources, and more experience in trans-national activity (Hagedoorn andSchakenraad, 1994).
When firms engage in R&D in a foreign location to avail themselves of complementary assetsthat are location specific, they are aiming to explicitly internalise several aspects of the systemof innovation of the host location. However, developing and maintaining strong linkages withexternal networks of local counterparts is expensive and time consuming, and is tempered bya high level of integration with the innovation system in the home location. Such linkages areboth formal and informal, and will probably have taken years – if not decades – to create andsustain. Frequently, the most significant issues are ‘know-who’. Government fundinginstitutions, suppliers, university professors, private research teams and informal networks oflike-minded researchers take considerable effort to create, and once developed, have a lowmarginal cost of maintaining. Even where the host location is potentially superior to the homelocation - and where previous experience exists in terms of other value adding activities - thehigh costs of becoming familiar with, and integrating into a new location may be prohibitive.Keep in mind that firms are constrained by resource limitations, and that some minimumthreshold size of R&D activities exist in every distinct location. As such, to maintain morethan one facility with a threshold level of researchers must mean that the new (host) locationmust offer significantly superior spillover opportunities, or provide access to complementaryresources that are simply not available anywhere else, and which cannot be acquired by lessrisky means more efficiently. This may also explain in part the growing use of M&A activitywith regards to R&D. Buying an existing laboratory short-circuits the time taken to developsuch linkages, as they come with ready-made networks and linkages (Narula, 1999).However, acquired laboratories are difficult to integrate them efficiently into the internalnetwork of the firm, which may limit their efficiency, at least initially (Belderbos, 1999).
The high costs associated with integrating into the host location’s systems of innovation – incontrast to the low marginal cost of maintaining its embedness in its home location’sinnovation system – and the need for internal cohesion within the MNEs (Blanc and Sierra1999, and Zanfei, 2000) explain why firms are reluctant to expand internationally. However,these costs must be tempered by supply-side considerations: the development of thesetechnologies benefits from diversity and heterogeneity in the knowledge base, which mightcome from competitors, from interaction with customers and from other complementary
50
technologies. A single national innovation system is often unable to offer the requiredknowledge and skills in all the emergent areas with equal effectiveness (Patel and Pavitt,2000). To overcome the size of their national public science system as well as the lack ofadvanced users, MNEs based in small countries, such as Switzerland and the Netherlands,have become highly internationalised early on, including in their R&D operations. Morerecently, MNEs in high-tech sectors have adopted a similar strategy to make up for thelimitations of their national science base. The need to have multiple technologicalcompetencies is particularly compelling for firms operating in technology-intensive sectors(Granstand et al., 1997). Unlike mature technologies, where knowledge is codified andevolves slowly, new technologies are characterised by a high degree of tacit and uncodifiableknowledge, which does not follow a predetermined path. The reallocation of R&D activitiesin centres of excellence allows the MNEs to exploit other national technologicalspecialisation.
Thus, summarising, HBE activities are primarily associated with demand-based activities,with the internalisation of technological spillovers as a secondary issue. HBA activities, onthe other hand are primarily undertaken with the intention to acquire and internalisetechnological spillovers that are host location-specific. HBE activity, broadly speaking,represents an extension of R&D work undertaken at home, while HBA activity represents adiversification into new scientific areas.
While often reported to be a much smaller phenomenon in terms of international R&Dexpenditure (Patel and Vega, 1999; Gerybadze and Reger, 1999; Niosi, 1999), the number ofHBA sites seems to be increasing quite fast, particularly in technology-intensive sectors, suchas biotechnology, computers and telecommunications (Kuemmerle, 1999; Dalton and Serapio,1999; and Patel and Vega, 1999). Despite the clear-cut distinction at the conceptual levelbetween HBA and HBE activities, in practice it is very difficult to determine the specific roleof a foreign R&D unit. An R&D facility might be involved in adopting innovations developedby the parent company and at the same time try to gain access to local technology sources(Zander, 1999). These two activities are complementary and they might also be consequentialas shown by Kuemmerle (1999), who found that HBE sites usually get established beforeHBA R&D investment.
5.2 Recent empirical studies
A number of recent studies have analysed the internationalisation of R&D activities bymultinational companies using different methodologies and databases. The empirical analysiscarried out to assess this phenomenon can be allocated in three groups. The first groupfocuses on the relative volume, scope and geographical pattern of foreign R&D using patentdata (Patel and Vega, 1999; Cantwell and Janne, 1999; 2000) and R&D expenditure data byforeign affiliates (Dalton and Serapio, 1999). The second group of studies includes thosebased on surveys and case-studies whose main research question is to investigate the firms’motivations in carrying out R&D activities abroad and the specific activities that areperformed in foreign research facilities (Florida, 1997, Kuemmerle, 1999). The third group isa more recent stream of work which has examined the knowledge sources of foreign R&Dunits using patent citations analysis (Almeida, 1996 and Frost, 2001).
Each type of methodology provides different insights into the process of internationalisationof R&D, although they all suffer from some shortcomings. Survey-based studies are able tooffer a rich and detailed picture of a small number of cases, but they are mainly qualitative innature and they can only provide a description of sector or location in a determined point in
51
time. Patent analyses, apart from being quantitative studies, are able to examine theinternationalisation of R&D over a long time-span covering a larger sample of firms andsectors. The main disadvantages of using patent statistics are that they are not a satisfactorymeasure of the innovative activities in biotechnology and software and they are not able toaccount for the accumulation of un-codified knowledge in foreign locations. This is the casewhen foreign subsidiaries recruit talented scientists and technicians or when they acquire ahost country laboratory.
Patent citations analysis uses the citations recorded in patent documents as an indicator ofknowledge spillovers. When an inventor cites another patent, this indicates that theknowledge contained in the cited patent has been useful in the development of the citingpatent. This methodology can provide more insights in the process of technology sourcing offoreign R&D sites. Patent citations analysis presents the same disadvantages as patent data. Inaddition one should keep in mind that though suggested by the inventor, the final decision onwhich patents to cite in an application (which affects the claim to novelty of the invention,and thus the scope of the protection provided by the patent) lies ultimately with the patentexaminers. They may therefore not always reflect the way the innovation process has evolved.
5.2.1 Studies based on R&D and patent data
The study by Dalton and Serapio (1999) examines the magnitude, scope, sectoral distributionand country of origin of foreign R&D investment in the US as well the trend and destinationof foreign direct investment in R&D by US MNEs. R&D expenditure performed by foreignaffiliates in the United States tripled from 1987 to 1997, reaching a value of $19.7 billion,which corresponds to almost 15% of total company-funded R&D investment.21 What emergesfrom this study it that the internationalisation of R&D is a phenomenon which occursprimarily between a small number of highly industrialised country and it affects mainlytechnology intensive sectors. Most of the R&D financed by foreign subsidiaries comes fromfirms whose parent is located in one of three countries: Germany, Japan, and UnitedKingdom. Foreign companies have concentrated their R&D efforts in the US in threeindustries (drugs and biotechnology, industrial chemicals, and electronic equipment) and incertain areas (such as Silicon Valley and greater Los Angeles, Detroit, and Princeton).
Foreign companies have invested in the US for a variety of reasons which vary acrossindustries. According to the results of the survey carried out by Dalton and Serapio, the mostimportant function of foreign-owned laboratories in the biotechnology industry is “to takeadvantage of a more favourable environment for research”, “to cooperate with other US R&Dlaboratories” and “to engage in basic research”. These motives classify these R&D facilitiesas HBA sites. Major factors behind the R&D decisions of foreign firms in the automotiveindustry have been to meet American customers needs, to assist the parent company insatisfying US environmental regulations (a HBE strategy). In the electronic industry R&Dinvestment motives are more mixed, both supply and demand considerations are consideredimportant. However in the research activity related to high-tech products such as computersand semiconductors, technology acquisition emerges as the dominant motive. US MNEs’investment in foreign R&D facilities has increased from $5.2 billion in 1987 to $14.1 billionin 1997 and overseas R&D funding accounts for 11% of total R&D performed in the US MostR&D expenditure is concentrated in five countries (Germany, United Kingdom, Canada,France and Japan) and in four industries (drugs, automotive, computers, and electroniccomponents). Technology-oriented factors seem to explain the decision of US firms to locate
21 Part of the increase in foreign-funded R&D investment can be attributed to the wave of M&A in Americanpharmaceuticals and biotechnology, which has a significant R&D budget.

52
R&D abroad in the computers, hardware, software, industrial chemicals, and pharmaceuticalsindustries. Patenting activities of the largest American, Japanese, and European MNEsreported in the study by Cantwell and Janne (2000) show a similar pattern to the R&D data. Inparticular it emerges that European firms, mainly from relatively small countries, are the mostinternationalised in their R&D operations, while Americans and especially Japanese firmshave retained a very centralized research structure.
Patent statistics have been used by Patel and Vega (1999) to explore the relationship betweenthe technological advantage of the multinational company at home and the technologicalstrength of the host country. Using a sample of 220 firms with the highest volume ofpatenting outside the home country between 1990-96 the authors found that although foreignresearch efforts are concentrated in “high-technology fields” (such as pharmaceuticals,biotechnology, computers, telecommunications), they are mainly involved with developmentsof process and machinery technologies, i.e. they carry out HBE type of activities. Patent datasuggest that firms tend to locate R&D abroad in their “core” fields, in the areas where theyhave a technological advantage (US MNEs in computers, German, UK and Swiss firms inorganic chemicals and pharmaceuticals, and Japanese firms in computers, image and sound).For electronics and metals companies in almost half of the cases the technological advantageof the firm does not match the location’s technological strength, i.e. firms seems to go abroadto exploit technological knowledge accumulated at home. Chemicals, pharmaceuticals,mining, food and materials companies instead tend to locate their foreign R&D activitieswhere they can find complementary technological assets.
The study by Cantwell and Janne (1999) addresses a similar research question focusing on theinternational research strategy of European MNEs in European locations. In particular theyfound that European MNEs coming from the leading centre in their industries tend to adopt amore diversified spectrum of technological activities abroad so as to acquire complementaryassets. Firms with headquarters in lower order centres in the same industry, when operating inforeign centres of excellence, seem instead to exploit their technological assets replicatingtheir home country’s technological specialisation.
5.2.2 Studies based on surveys
Early works based on surveys are the ones by Håkanson (1992) and Pearce and Singh (1992).Håkanson examines the impact of different host country characteristics in the locationdecisions of foreign R&D units. The location pattern of 20 chemical and engineering SwedishMNEs seems to show that ‘demand related’ factors are more important than the ‘supplyrelated’ factors and that ‘political’ factors (such as trade barriers, the possibility ofparticipating in government sponsored research programs) are also playing a role indetermining the geographical location of foreign R&D operations. The results of the study byPearce and Singh (1992) based on a comprehensive sample of MNEs operating in 30industries seems to confirm that most overseas R&D is carrying out asset exploiting type ofactivities.
However, more recent surveys seem to find substantial support for the increasing importanceof ‘supply-side’ factors as motives for international decentralisation of R&D. The study byFlorida (1997) surveys a sample of 207 R&D facilities in the US in four technology sectors(electronics, automotive, chemicals and materials, and biotechnology) with regard to therelative importance of their technology-oriented activities (HBA) and market oriented-activities (HBE). The findings of this study suggest that both types of activities are playing animportant role in the overall activities of the sample laboratories. However technology-
53
oriented activities are relatively more significant, especially in R&D units operating in thebiotechnology and pharmaceutical sectors, while R&D sites in the chemical and automotivesectors seem to concentrate on tasks related to the support of manufacturing activities and theadaptation of products to the local market conditions. The innovating performance of thelaboratories in the sample confirms that these sites are not mere “listening posts” but arededicated to the creation of new scientific and technological knowledge. The survey indicatesalso that one of most implemented strategies for gaining access to localised knowledge is therecruitment of high-quality scientists.
Some of Florida’s results have been confirmed by a more recent survey by Kuemmerle(1999). This study analyses the activities of 238 foreign R&D facilities from 32 American,Japanese and European pharmaceuticals and electronics companies in different host countriesover time and investigates the motives, location characteristics, and mode of entry for R&Dfacilities abroad. What emerges from this study is that technology sources have increasinglybecome a motivation for setting-up foreign R&D laboratories. Kuemmerle found that 38% oflaboratories in the sample could be classified as HBA. The location of foreign R&D sitesseems to match the distribution of knowledge sources they build upon. When the purpose ofR&D is to try and gain access to localised knowledge, firms will establish centres inproximity to universities or national laboratories. When instead they are supportingmanufacturing and marketing activities R&D sites they will be located near a lead market orin a cluster of competitors. Although in principle acquisition of a foreign laboratory could bea valid instrument for getting access to localised knowledge, Kuemmerle found that greenfield investment are the dominant form of entry both for the case of HBA and HBE sites.
5.2.3 Studies based on patent citations analysis
Almeida’s (1996) study of the semiconductor industry tests the hypothesis of technologysourcing activities of foreign affiliates in the US using patent citations analysis. Thismethodology allows the author not only to assess whether or to what extent foreignsubsidiaries draw from local sources of knowledge, but also to what degree they contribute tolocal knowledge. Following Jaffe et al. (1993) the author is able to identify the regionallocation of the innovation activity using the address of the inventor and to control for thegeographical clustering of patenting activity by matching each citation listed in an affiliate’spatent with a control citation. The control citation is a patent with a similar technological andtemporal profile to the cited patent but which itself is not cited by the subsidiary patent. Itrepresents therefore the benchmark against which the localisation of the subsidiary citations ismeasured. The results seem to support the hypothesis that foreign subsidiaries build uponlocalised sources of knowledge: the patents cited by foreign affiliates are more likely to beoriginated in the US or in the same US States where affiliates operate. Using a similarprocedure, Almeida finds that foreign affiliates contribute to the regional knowledge base: thepatents granted to these foreign firms are cited more than expected by other patents originatedin the same region.
Frost (2001) builds upon and extends the work by Almeida investigating the geographicsources of foreign subsidiaries’ innovation process of across a much broader sample of USforeign subsidiaries in different industries and examining under what circumstances they drawfrom local sources of knowledge during their process of technological innovation. The resultsof this study show that both the characteristics of the subsidiary, such as the amount and thetype of innovation activity carried out, and the technological specialisation of the home andhost country are important in determining the geographic sources of innovation. Lessinnovative affiliates are more likely to build on the knowledge base of the parent company,
54
while more innovative subsidiaries, being more embedded in the local context, tend to drawupon local sources of knowledge. Frost found that foreign affiliates, that are devoting much oftheir R&D efforts in adapting technologies developed in the home country, are less likely touse technical ideas originating in the host country. 22 Similarly when the foreign affiliates areperforming R&D activities on technical fields, in which the home country has a technologicaladvantage and the host country presents a technological disadvantage, they seem more likelyto cite home country’s patents. The opposite case arises when foreign subsidiaries are activein technological fields in which the host country has a greater technological advantaged withrespect to the home country.
5.3 Open issues and directions for future research
We can therefore briefly summarise the main trends that emerge from the studies that wesurveyed:
1) the degree of R&D internationalisation has increased substantially in the last decadebut it remains concentrated in a small number of industrialised countries;
2) MNEs in the biotechnology, pharmaceutical and electronic industries carry out R&Dinvestment abroad to acquire and develop new technology, and in so doing they arelearning from local sources of knowledge;
3) the home country technological advantages and the host country technologicalcharacteristics both play an important role in determining the type of R&D activityperformed abroad.
So far the existing empirical literature has analysed the learning behaviour and thetechnological sourcing of foreign subsidiaries and little interest has been devoted in analysingthe impact that such innovation activities have on the home part of the multinational companyand on other firms in the home country. From a policy perspective the existence of aknowledge transfer from the subsidiary to the home plant and possibly on to other firms in thehome country is the most relevant issue. It might in fact be the case that the performance ofR&D abroad - when asset-seeking in nature - might represent an opportunity for enhancingthe technological expertise of other national firms. Assessing the existence and the scale ofsuch phenomenon is extremely important for science and technology policyrecommendations. Policy makers have a tendency to encourage domestic multinationals tomaintain their R&D activity at home and to discourage its re-allocation to foreign countries,however it might be possible that the internationalisation of corporate R&D may lead toincreases in the home country’s knowledge base and its competitive performance in general.
One direction for further research is to examine this issue using patent data and in particularpatent citation analysis to trace knowledge flows among subsidiaries, headquarters and otherfirms in the home country. The dataset compiled at SPRU, from information supplied by theUS Patent Office, on the name of the company, the technical class, and country of origin ofthe inventor, (for each patent granted in the US from 1969 to 2000) is the ideal data source tocarry out this type of analysis.
6. A review of the methodology
In this section we review the methodology that we intend to adopt in the quantitative part ofthe SETI project. In particular we have the following requirements: a) to perform a consistentdynamic analysis whether or not the case under consideration is of steady-state from both atheoretical and empirical point of view and b) to maintain the structure studied at the 22 This results is in line with the definition of HBE sites.

55
theoretical level in the empirical analysis. Although other questions, basically concerning thedimension of the sample, might arise, either points are central to the present approach. Themethodology employed is that of continuous time and poses its basis on the direct estimationof a simultaneous system of differential equations. Each equation is composed on the lefthand side (l.h.s.) by a dependent variable, which is the time derivative of the variable ofinterest and, on the right hand side (r.h.s.), by other variables defining the difference betweenthe actual value of the variable of interest and its desired value according to the behaviouralrules of the agents involved in the model. This difference is then multiplied by a coefficient toevaluate the speed of adjustment of the convergence process. This formulation allows forevery sort of theoretic formulation of general equilibrium whether linear or not, and with orwithout diffusion. Moreover the parameters can be readily estimated as they enter theobjective function, and the estimation is independent from the simplifying hypothesis ofsteady-state. The techniques to perform the estimation are the same of that in use for system23
but, in general, full information methods (FIML or 3SLS) are preferred. Another advantagewith respect to the ordinary methods is the sensitivity analysis that consists in the evaluationof the change in the dynamics of the system to variations in the underlying eigenvalues(Gandolfo, 1992; Wymer, 1997). This is possible because the method estimates the model asindicated by the theory so that changes in the eigenvalues are associated to changes in theparameters of interest. For this reason also simulations under different scenarios provides theanalysis with useful insights. Moreover the choice of the explicit introduction of theadjustment speeds makes it possible to understand whether and how long it takes to reach thesteady-state.
Before going on it is important to stress that the term continuous is not referred to a frequencyconcept but to the fact that the reality under consideration is continuos. For this reason,contrarily to what it might have been thought, macro and international economics is the mostappealing field for this approach. While, for further details, the reader is referred to themanual of Gandolfo (1981), in the remainder of this section there will be presented a model ofcontinuous time of Padoan (1998) that evaluates the role of technology diffusion by means ofinternational trade. The following model is addressed specifically to study the interactionbetween technology and trade and, even though it also considers the stock of R&Dexpenditure, cannot be compared to the models studied in the previous sections as in this casesuch a variable is exogenous. Moreover another aim of this model is also to investigate onsectoral effects according to the Pavitt (1984) taxonomy. Given these objectives the modeladopts the simplifying assumption of not stating a functional form for output which is insteaddefined on the basis of the equilibrium condition for the balance of payments24. For thisreason it needs some modifications to account more directly for growth issues. Apart fromthese adaptations, given its specificity, it constitutes a solid reference to how thismethodology works in this field.
The model will be first expounded in tabular form to be more easily commented below:
Export Share. Traditional goods.
(6.1) ( )
−=−=
∗
∗
loglog
logloglog
11
2
PS
SSSD
a
aaa
βγα
23 Continuous time estimations, simulations and sensitivity analysis may be carried out by means of Wymer(1994) programs.24 Specifically it refers to current account equilibrium condition: PX X = PM M, SM =M/Y, SX = X/W and thenWPXSX = YPMSM.

56
Export Share. Scale intensive goods.
(6.2) ( )
+−=
−=∗
∗
logloglog
logloglog
322
3
wb
bbb
TT
PS
SSSD
ββγ
α
Export Share. Specialised suppliers.
(6.3) ( )
+−=
−=∗
∗
logloglog
logloglog
543
4
wc
ccc
TT
PS
SSSD
ββγ
α
Export Share. Science based goods.
(6.4) ( )
+=
−=∗
∗
loglog
logloglog
64
5
wd
ddd
TT
S
SSSD
βγ
α
High tech export share.
(6.5)
+
+
=
h
dd
h
cc
h
b
x
bxh W
WS
WW
SWW
SS
S
Aggregate Export Share.
(6.6)
wd
x
dd
d
x
dd
c
x
cc
c
x
cc
b
x
bb
b
x
bb
a
x
aa
a
x
aax
WW
SS
WW
SS
SD
WW
SS
WW
SS
SD
WW
SS
WW
SS
SD
WW
SS
WW
SS
SDSD
λλ
λ
λ
λ
−
+
+
+
+
+
+
+
+
+
+
=
log
log
log
loglog
Import share. Traditional goods.
(6.7) ( )
+=−=
∗
∗
loglog
logloglog
116
7
PS
SSSD
ma
mamama
βγα
Import share. High tech goods.
(6.8) ( )
+++=
−=∗
∗
log logloglog
logloglog
1413127
8
mw
mh
mhmhmh
STT
PS
SSSD
βββγ
α
Aggregate import share.
(6.9)
+
=
m
mhmh
m
mamam S
SSD
SS
SDSD logloglog

57
Knowledge Accumulation.
(6.10) ( )
+−=++−=
∗
∗
logloglog
logloglogloglog
875
1096
d
mhw
SFT
SâTTTTD
ββγβα
Output.
(6.11) ( )
++=−=
∗
∗
loglogloglogloglog
logloglog 1
mmxx S-P-SPWY
YYYD α
VARIABLESEndogenous ExogenousSa : Export Share. Traditional goods P: Relative priceSb: Export Share. Scale intensive goods F: Stock of foreign R&D expenditureSc: Export Share. Specialised suppliers Tw: Stock of foreign knowledgeSd: Export Share. Science based goods W: Total foreign demandSxh: Export share. High tech export share Wi: Sectoral foreign demand (i = A, B, C, D,
H)Sx: Export share. Aggregate Export Share Price of exportsSml: Import share. Traditional goods Pm: Price of importsSmh: Import share. High tech goods D: d/dtSm: Import share. Aggregate import shareT: Stock of domestic knowledgeY: Output
Where error terms are omitted for simplicity’s sake and there are three identities25 (6.5), (6.6),(6.9) and eight behavioural equations. The variables pertaining to the latter are all expressedin naperian logs either to exploit the usual nice proprieties for coefficients and variablesthemselves in order to assign relevance to the rates of growth or to obtain a linearised systemwith a remainder not involving time. This, in fact, makes the conditions of the Poincarè-Liapunov-Perron theorem automatically satisfied so that the linear approximation is uniformlygood and the local stability analysis can be conducted correctly26. The system is very oftennon-linear either in variables or in the coefficients. Here the non-linearity pertains to thevariables and is provoked by the identities as one can easily check.
The system can be decomposed in three components: Trade, knowledge accumulation andoutput. The leading role is plaid by trade that refers to four sector according to Pavitt’staxonomy. Each curly bracket refer to an adjustment equation where the starred variablerepresents the target according to a separate behavioural equation. Without considering thedetails of each equation as they involve problems out of the scope of this section, it is worthnoticing that knowledge affects endogenously each trade sector but the one of traditionalgoods and conversely is affected by both high tech imports and exports. However this is theonly endogenous link with the stock of knowledge. In particular there is not an endogenousdomestic production process of knowledge. This aspect prevents the use of the model fromgrowth analysis because it lacks of a direct link between output and knowledge. An evidenceon this point has been reached in Maggi, Federici and Espa (2001) where the model has been
25 Identity (6.6) decomposes Dlog(Sx W) and is obtained from Sx = (SaWa + SbWb + ScWc + SdWd)/W and λi =DlogWi26 For further details the reader is referred to Gandolfo (1997) and Bellman (1953).

58
used for simulation purposes and the level of the stock of knowledge for the five involvedcountries (Germany, France, Italy, UK, Japan) penalised Japan with respect to the othercountries. The parade was correctly restored with new simulations after the introduction of anew equation in line with Lucas (1988) concept of knowledge that outlives individuals. Thenew variable has a desired level that depends on income and the stock of knowledge with afeed-back effect on the latter. In this way it was possible to introduce an endogenous domesticeffect on knowledge accumulation without altering the pre-existing nature of the model.However, notwithstanding this result a new estimation is necessary to better evaluate theeffects of knowledge on output given that its desired level is, ultimately dealt with as aresidual deriving from the current account equilibrium condition.
Another important aspect is that this model has been estimated for any country while it mightbe interesting to study diffusion effects between countries with a single general model inorder to exploit at most the sample size. A solution may be in principle the introduction ofpartial –instead of the simple- differential equations where the other independent variable thatcauses variations is the space. In this way it is also possible to use panel data for a moreconsistent estimate.
This brief exposition is clearly not at all exhaustive of the issues pertinent to the continuoustime methods but aims at give an intuition of the potential of this approach that is appositelyshaped for the study of economic dynamic systems.

59
Bibliography
Aghion, P.and P. Howitt (1998), Endogenous Growth Theory, MIT Press, Cambridge MA.Almeida, P. (1996), “Knowledge sourcing by foreign multinationals: patent citation analysis in the US
semiconductor industry”, Strategic Management Journal, Vol. 17, Winter Special Issue, pp. 155-65.Amable, B. (1996), “The effects of foreign trade specialisation on growth”, paper prepared as part of the EU
TSER project “Technology, Employment and European Cohesion”.Amable, B. and B. Verspagen (1995), “The role of technology in market shares dynamics”, Applied Economics
Vol. 27, pp. 197-204.Amendola, G., G. Dosi and E. Papagni (1993), “The dynamics of international competitiveness”,
Weltwirtschaftliches Archiv, Vol. 129, pp. 451-471.Amendola, G., P. Guerrieri and P. Padoan (1992), “International patterns of technological accumulation and
trade”, Journal of International and Comparative Economics, Vol. 1, pp. 173-197.Amendola, G., P. Guerrieri and P. Padoan (1998), “International patterns of technological accumulation and
trade”, in D. Archibugi and Michie, J. (eds), Trade, Growth and Technological Change, 141-167.Archibugi, D. and J. Michie (1995), “The globalisation of technology: a new taxonomy ”, Cambridge Journal of
Economics, Vol. 19, pp. 121-140.Archibugi, D. and J. Michie (1997) (eds.), Technology, Globalisation and Economic Performance, Cambridge
University Press, Cambridge.Archibugi, D. and M. Pianta (1992a), “Specialization and size of technological activities in industrial countries:
The analysis of patent data”, Research Policy, Vol. 21,1, pp. 79-93.Archibugi, D. and M. Pianta (1992b), The Technological Specialization of Advanced Countries: A report to the
EEC on International Science and Technology Activities, Kluwer Academic Publishers, Dodrecht.Archibugi, D. and M. Pianta (1994), “Aggregate convergence and sectoral specialization in innovation”, Journal
of Evolutionary Economics, vol. 4, pp. 17-33.Archibugi, D. and M. Pianta (1998), “Aggregate convergence and sectoral specialisation in innovation: evidence
for industrial countries”, in Archibugi, D. and Michie, J. (eds), Trade, Growth and Technical Change,Cambridge University Press, Cambridge.
Audretsch, D. and M. Feldman (1996), “R&D spillovers and the geography of innovation and production,”American Economic Review, Vol. 86, pp. 253-273.
Barcenilla, S. (1999), “Especialización tecnológica y especialización comercial. Evidencia empírica para lospaíses de la Unión Europea”, Información Comercial Española, Vol. 781, pp. 85-102.
Barro, R., and X. Sala-i-Martin (1995), Economic Growth, McGraw-Hill, New York.Baumol, W.J., S.A.B. Blackman and E.N. Wolff (1989), Productivity and American Leadership: The Long View,
MIT Press, Cambridge, MA.Beelen, E. and B. Verspagen (1994), “The role of convergence in trade and sectoral growth”, in J. Fagerberg, B.
Verspagen and N. Von Tunzelmann (eds.), The Dynamics of Technology, Trade and Growth, Edward Elgar,Aldershot.
Belderbos, R. (1999), “Entry mode, organisational learning, and R&D in foreign affiliates: Evidence fromJapanese firms”, NIBOR Research Memorandum RM/99/05.
Belmann, R. (1953), Stability Theory of the Differential Equations, McGraw-Hill, New York.Bhagwati, J. N. (1984), “Splintering and disembodiment of services and developing nations”, The World
Economy , Vol. 7, pp. 133-143.Blanc, H. and C. Sierra (1999), “The internationalisation of R&D by multinationals: a trade-off between external
and internal proximity”, Cambridge Journal of Economics, Vol. 23, pp. 187-206.Borensztein, M., J. de Gregorio and J.W. Lee (1998), “How does foreign direct investment affect economic
growth?”, Journal of International Economics, Vol. 45, pp. 115-135.Bresnahan, T.F. and M. Trajtenberg (1995), “General purpose technologies ‘Engines of growth’?”, Journal of
Econometrics, Vol. 65, pp. 83-108.Buigues, P and A. Sapir (1993), “Market services and European integration, issues and challenges”, European
Economy/Social Europe, 1993/3, reports and studies.Cantwell, J. (1989), Technological Innovation and Multinational Corporations, Bassil Blackwell, Oxford.Cantwell, J. (1991), “Historical Trends in international patterns of technological innovation”, in Foreman-Peck
(ed.), New Perspectives on the late Victorian Age, Cambridge University Press, Cambridge.Cantwell, J. (1995), “The globalisation of technology: what remains of the product cycle model?”, Cambridge
Journal of Economics, Vol. 19, pp. 155-74.Cantwell, J. and O. Janne (1999) “Technological globalisation and innovation centres: the role of corporate
technological leadership and location hierarchy”, Research Policy, Vol. 28, pp. 119-44.

60
Cantwell, J. and O. Janne (2000), “The role of multinational corporations and national states in the globalizationof innovatory capacity: the European perspective”, Technology Analysis and Strategic Management, Vol. 12,pp. 243-262.
Chang, P., G. Karsenty, A. Mattoo and J. Richterung (1999), “GATS, the modes of supply and statistics on tradein services”, Journal of World Trade, Vol. 33, pp. 93-115.
Clark, C. (1957), The Conditions of Economic Progress, London: Macmillan.Cornelius, P.K. (2000), “Trade in financial services, capital flows, and the value-at-risk of countries”, The World
Economy, Vol. 23, pp. 649-672.Dalton, D. and M. Serapio (1999) “Globalization of industrial R&D: an examination of foreign direct
investments in R&D in the United States”, Research Policy, Vol. 28, pp. 303-316.Dalum, B., K. Laursen and B. Verspagen (1999), “Does specialization matter for growth?”, Industrial and
Corporate Change, Vol 8, pp. 267-288.Daveri, F. (2000), “Is growth in Europe an ICT story too?”, Università degli studi di Parma and IGIER,
unpublished manuscript.Davies, S. and B. Lyons (1996), Industrial Organisation in the European Union, Oxford University Press,
Oxford.Dosi, G. and L. Soete (1988), “Technical change and international trade”, in G. Dosi, C. Freeman, R. Nelson, G.
Silverberg, and L. Soete (eds.), Technical Change and Economic Theory, Pinter, London.Dosi, G., C. Freeman, R. Nelson, G. Silverberg and L. Soete (1988), Technical Change and Economic Theory,
Pinter, London.Dosi, G., K. Pavitt, and L. Soete (1990), The Economics of Technical Change and International Trade,
Harvester Wheatsheaf., London.Dunning, J. and R. Narula (1995), “The R&D activities of foreign firms in the United States”, International
Studies of Management and Organization, Vol. 25, pp. 39-73.Durlauf, S.N. and D.T. Quah (1998), “The new empirics of economic growth”, NBER Working paper n.6422.Edwards, S. (1993), “Openness, trade liberalization, and growth in developing countries”, Journal of Economic
Literature, Vol. 31, pp. 1358-1393.ETAN-European Technology Assessment Network (1998), “Technology policy in the context of
internationalisation of R&D and innovation. How to strengthen Europe's competitive advantage intechnology”, Brussels, European Commission, Directorate-General Science Research and Development.
European Commission (1998), European Competitiveness in the Triad, European Economy, Supplement A n.7,July, p.16.
Evangelista, R. (2000), “Sectoral patterns of technological change in services”, Economics of Innovation andNew Technology, Vol. 9, pp. 183-221.
Evangelista, R. and M. Savona (2001), “The impact of innovation on employment and skills in services.Evidence from Italy”, paper presented at the Conference “The Future of Innovation Studies”, EindhovenCentre for Innovetion Studies, Eindhoven, September.
Fagerberg, J. (1996), Structural Changes in International Trade: Cause, Impact and Response, Working Paper, n.547, NUPI (Norwegian Institute of International Affairs), Oslo.
Fagerberg, J., P. Guerrieri and B. Verspagen (eds) (1999), The Economic Challenge for Europe: Adapting toInnovation-based Growth, Edward Elgar, Aldershot.
Feenstra, R.C. and G.H. Hanson (1996), “Globalization, outsourcing, and wage inequality”, American EconomicReview, Vol. 86, pp. 240-245.
Feenstra, R.C. and G.H. Hanson (1999), “The Impact of outsourcing and high-technology capital on wages:Estimates for the United States, 1979-1990”, Quarterly Journal of Economics, Vol. 114, pp. 907-941.
Florida, R. (1997), “The globalisation of R&D: results of a survey of foreign affiliated R&D laboratories in theUSA”, Research policy, Vol. 26, pp. 85-103.
Francois, J.F. (1990a), “Producer services, scale, and the division of labor”, Oxford Economic Papers, Vol. 42,pp. 715-729.
Francois, J.F. (1990b), “Trade in producer services and returns due to specialization under monopolisticcompetition”, Canadian Journal of Economics, Vol. 23, pp. 109-124.
Francois, J.F. and L. Schuknecht (1999), “Trade in financial services: Pro-competitive effects and growthperformance”, CEPR Discussion Paper, No. 2144.
Freeman, C. and C. Perez (1988), “Structural crises of adjustment, business cycles and investment behaviour, inDosi, G. et al. (eds.).
Freeman, C. and L. Soete (1987), Technical Change and Full Employment, Blackwell, Oxford.Frost, T. S. (2001), “The geographic sources of foreign subsidiaries’ innovation”, Strategic Management
Journal , Vol. 22, pp. 101-123.Fuchs, V.R. (1968), The Service Economy , Columbia University Press.Gandolfo, G. (1981), Qualitative Analisys and Econometric Estimation of Continuous Time Dynamic
Models, North Holland.
61
Gandolfo, G. (1992), “Sensitivity analysis in continuous time econometric models”, Computers MathematicsApplication , Vol. 24, pp. 43-55.
Gandolfo, G. (1997), Economic Dynamics, Springer-Verlag, Berlin.Gerybadze, A. and Reger, G. (1999), “Globalisation of R&D: recent changes in the management of transnational
corporations”, Research Policy, Vol 28, pp. 251-274.Gordon, R. (1999), “Management consulting firms: Some approaches to output measurement”, Paper presented
at the Brookings Workshop on Measuring the output of Business Services.Grandstand, O., P. Patel and K. Pavitt (1997), “Multi-technology corporations: why they have ‘distinctive core’
competencies”, California Management Review, Vol. 39, pp. 8-25.Gross, D.M., H. Raff, and M.J. Ryan (2001), “Intra- and inter-industry linkages in foreign direct investment:
Evidence from Japanese investment in Europe”, unpublished manuscript.Grossman, G. and E. Helpman (1991), Innovation and Growth in the World Economy , MIT Press, Cambridge
(Mass.).Gual, J. and D. Neven (1993) “Banking”, in European Economy/Social Europe, 1993/3, reports and studiesGuerrieri, P. and C. Milana (1995), “Changes and trends in the world trade in high-technology products”,
Cambridge Journal of Economics, Vol. 19, pp. 225-42.Gullickson, W. and M. Harper (1999), “Possible measurement bias in aggregate productivity growth”, Monthly
Labor Review (February), pp. 47-67.Hagedoorn, J. and J. Schakenraad (1994), “The effect of strategic technology alliances on company
performance”, Strategic Management Journal, Vol. 15, pp. 291-311.Håkanson, L. (1992), “Locational determinants of foreign R&D in Swedish multinationals” in Grandstand et al.
(eds.), Technology Management and International Business: Internationalisation of R&D and Technology,Wiley, Chichester.
Hauknes, J. (1996), “Innovation in the services economy”, STEP Report 7/96, Oslo.Hawawini, G. and M. Schill (1994), “The Japanese presence in the European financial services sector”, in M.
Mason and D. Encarnation (eds.), Does Ownership Matter? Japanese Multinationals in Europe, ClarendonPress, Oxford.
Helpman, E. (1998), General Purpose Technologies and Economic Growth, MIT Press, Cambridge.Hill, T.P. (1977), “On goods and services”, Review of Income and Wealth, Vol. 23, pp. 315-338.Hoekman, B. and C.A. Primo Braga (1997), “Protection and trade in services”, World Bank, Policy Research
Working Paper, No. 1747.Hood, N. and S. Young (1982) “US multinational R&D: corporate strategies and policy implications for the
UK”, Multinational Business, Vol. 2, pp. 10-23.Hubertus, J. (2001), “Distributive trades statistics: On-line retailing – a challenge for the future”, Statistics in
Focus, Industry Services and Trade, Theme 4, No. 43.Iammarino, S., C. Jona Lasinio and S. Mantegazza (2001), “Sviluppo e diffusione dell’ICT: l’Italia negli anni
‘90”, Studi e Note di Economia, n.2/2001.Jaffe, A. B. and M. Trajtenberg (1996), “Flows of knowledge from universities and federal labs: modelling the
flow of patent citations over time and across institutional and geographical boundaries”, NBER WorkingPaper 5712, Cambridge Massachusetts.
Jaffe, A. B., M. Trajtenberg and R. Henderson (1993), “Geographic localization of knowledge spillovers asevidenced by patent citations”, Quarterly Journal of Economics, Vol. 108, pp. 577-98.
Jones, R.W. and H. Kierzkowski (1990), “The role of services in production and international trade: Atheoretical framework”, in R.W. Jones and A. Krueger (eds.), The Political Economy of International Trade,Basil Blackwell, Oxford.
Jones, R.W. and F. Ruane (1990), “Appraising the options for international trade in services, Oxford EconomicPapers, Vol. 42, pp. 672-687.
Jorgenson, D.W. and K.J. Stiroh (2000), “Raising the speed limit: US economic growth in the information age”,Brookings Papers on Economic Activity, pp. 125-235.
Kim, J. and J-D. Kim (2001), “Liberalization of trade in services and productivity growth in Korea”, in T. Itoand A.O. Krueger (eds.), Services Trade in the Asia-Pacific Region, East Asia Seminar on EconomicsVolume 11, forthcoming.
Klodt, H. (2000), ‘Structural change towards services: the German experience’, University of Birmingham IGSDiscussion Paper, 2000/07.
Krugman, P.R. (1985) “A technology gap model of international trade”, in K. Jungenfelt and D. Hague (eds.),Structural Adjustment in Developed Open Economies, Macmillan, London.
Kuemmerle, W. (1997), “Building effective R&D capabilities abroad”, Harvard Business Review, March-April,1997, pp. 61-70.
Kuemmerle, W. (1999), “Foreign direct investment in industrial research in the pharmaceutical and electronicindustries: Results from a survey of multinational firms”, Research Policy, Vol. 28, pp. 179-93.

62
Lall, S. (1979), “The international allocation of research activity by US multinationals”, Oxford Bulletin ofEconomics and Statistics, Vol. 41, pp. 313-31.
Laursen, K. (1999), “The impact of technological opportunity on the dynamics of trade performance”, StructuralChange and Economic Dynamics, Vol. 10, pp. 341-357.
Laursen, K. (2000), Trade Specialisation, Technology and Economic Growth, Edward Elgar, Cheltenham.Laursen, K. and V. Meliciani (2000), “The importance of technology based intersectoral linkages for market
share dynamics”, Weltwirtschaftliches Archiv, Vol. 136, pp. 702-723.Levine, R. (1997), “Financial development and economic growth: Views and agenda”, Journal of Economic
Literature, Vol. 25, pp. 688-726.Lucas, R.E. (1988), “On the mechanism of economic development”, Journal of Monetary Economics, Vol. 22,
pp. 3-42.Maggi, B., D. Federici and G. Espa (2002), “Statistical economic approach to mix stock-flow dynamic models in
macroeconomics”, Quaderni di Statistica e Matematica Applicata alle Scienze Economico-sociali,(forthcoming).
Manzocchi, S., P.C. Padoan and C. Vicarelli (2000), “Specialisation and flexibility”, in Padoan, P.C. (ed.),Employment and growth in the Europe of monetary union , Edward Elgar, Cheltenam.
Manzocchi, S., P.C. Padoan, P. Parascandolo and M. Tozzi (2000), “Employment and European regions”, inPadoan, P.C. (ed.), Employment and Growth in the Europe of Monetary Union , Edward Elgar, Cheltenam.
Markusen, J.R. (1984), “Multinationals, multi-plant economies, and the gains from trade”, Journal ofInternational Economics, Vol. 16, pp. 205-226.
Markusen, J.R. (1989), “Trade in producer services and in other specialised intermediate inputs”, AmericanEconomic Review, Vol. 79, pp. 85-95.
Markusen, J., T.F. Rutherford, and D. Tarr (2000), “Foreign direct investment in services and the domesticmarket for expertise”, NBER Working Paper, No. 7700.
Marrewijk, C. van, J. Stibora, and A. de Vaal (1996), “Services tradability, trade liberalization and foreign directinvestment”, Economica, Vol. 97, pp. 1180-1196.
Marrewijk, C. van, J. Stibora, A. de Vaal, and J. Viaene (1997), “Producer services, comparative advantage, andinternational trade patterns”, Journal of International Economics, Vol. 42, pp. 195-220.
Matsuyama, K. (1992), “Agricultural productivity, comparative advantage, and economic growth”, Journal ofEconomic Theory, Vol. 58, pp. 317-334.
Mattoo, A. (2001), “Shaping future GATS rules for trade in services”, presented at the 11th NBER-Annual EastAsian Seminar on Economics, Seoul, June 22-24.
Mattoo, A., R. Rathindran and A. Subramanian (2001), “Measuring services trade liberalization and its impacton economic growth”, World Bank Working Paper, No. 2655.
Maurseth, P.-B. and B. Verspagen (2001), “Knowledge spillovers in Europe. A patent citations analysis”,mimeo, Eindhoven University of Technology and Norwegian Institute of Foreign Affairs.
Meliciani, V. (2001), Technology, Trade and Growth in OECD Countries: Does SpecialisationMatter?, Routledge, Londra.
Meliciani, V. (2002), “The impact of technological specialisation on economic growth in a balance-of-payments-constrained growth model”, Structural Change and Economic Dynamics, Vol. 13, pp. 101-118.
Meliciani, V. and R. Simonetti (1998), “Specialization in areas of strong technological opportunity andeconomic growth”, in Eliasson, G., C. Green and C. McCann (eds.), The Microfoundations of EconomicGrowth, University of Michigan Press, Michigan, USA.
Melvin, J.R. (1989), “Trade in producer services: A Heckscher-Ohlin approach”, Journal of Political Economy ,Vol. 97, pp. 1180-1196.
Metcalfe, J.S. and L. Soete (1984), “Notes on the evolution of technology and international competition”, in M.Gibbons, P. Gummett and B. Udgaonkar (eds.), Science and Technology Policy in the 1980s and Beyond ,Longman, Harlow, Essex.
Meyer-Krahmer, F. and G. Reger (1999), “New perspectives on the innovation strategies of multinationalenterprises: Lessons for technology policy in Europe”, Research Policy, Vol. 28, pp. 751-76.
Midelfart-Knarvik, K.H, H.G. Overman, S.J.Redding and A.J. Venables (2000), “The location of Europeanindustry”, Report prepared for the Directorate General for Economic and Financial Affairs, EuropeanCommission.
Miles, I. (1993), ‘Services and the new economy’, Futures, Vol. 25, pp. 653-672.Miles, I. (1996) “Infrastructure and the delivery of new services”, in OECD Employment and growth in the
knowledge based economy , OECD, Paris.Molero, J. (ed) (1995), Technological Innovation, Multinational Corporations and New International
Competitiveness. The case of intermediate countries, Harwood Academic Publishers, Reading.Nachum, L. (1999), “Measurement of productivity in Swedish management consulting firms”, presented at
Brookings Workshop on Measuring the Output of Business services, May 14.Narula, R. (1996), Multinational Investment and Economic Structure, Routledge, London.

63
Narula, R. (1999), “Explaining the growth of strategic R&D alliances by European firms”, Journal of CommonMarkets Studies, Vol. 37, pp. 711-23.
Niosi, J. (1999), “The internationalisation of R&D: from technology transfer to the learning organisation”,Research Policy, Vol. 28. pp. 107-117.
OECD (1996), Science, Technology and Industry Outlook, Paris.OECD (2001), The Impact of Information and Communication Technology on Output Growth: Issues and
Preliminary Considerations, OECD, Directorate for Science, Technology and Industry, SWP 2001/11.Oliner, S., and D. Sichel (2000), “The resurgence of growth in the late 1990s: is information technology the
story?”, Journal of Economic Perspectives, Vol. 14, pp. 3-22.Ottway, J. (2001), Report on internship in KPMG.Padoan, P.C. (ed) (2000), European Monetary Union and Employment, Edgar Elgar, Cheltenham.Padoan, P.C (1998), “Trade, knowledge accumulation and diffusion. A sectoral perspective”, Structural Change
and Economic Dynamics, Vol. 9, pp. 349-72.Pagano, M. (1993), “Financial markets and growth. An overview”, European Economic Review, Vol. 37, pp.
613-622.Patel, P. (1995), “Localised production of technology for global markets”, Cambridge Journal of Economics,
Vol. 19, pp. 141-153.Patel, P. (1997), “Localised production of technology for global markets”, in Archibugi, D. and J. Michie (eds),
Technology, Globalisation and Economic Performance, Cambridge University Press, Cambridge.Patel, P. and K. Pavitt (1991), “Large firms in the production of the world’s technology: An important case of
‘non-globalisation’”, Journal of International Business Studies, Vol. 22, pp. 1-21.Patel, P. and K. Pavitt (1994), “Uneven (and divergent) technological accumulation among advanced countries:
Evidence and a framework of explanation”, Industrial and Corporate Change, Vol. 3, pp. 759-787.Patel, P. and K. Pavitt (1999), “Global corporations & national systems of innovation: Who dominates whom?”
in D. Archibugi, J. Howells and J. Michie (eds), Innovation Policy in a Global Economy?, CambridgeUniversity Press, Cambridge.
Patel, P. and K. Pavitt (2000), “National systems of innovation under strain: the internationalisation of corporateR & D”, in R. Barrell, G. Mason and M. O'Mahoney (eds), Productivity, Innovation and EconomicPerformance, Cambridge University Press, Cambridge.
Patel, P. and M. Vega (1999), “Patterns of internationalisation of corporate technology: location vs. homecountry advantages”, Research Policy, Vol. 28, pp. 145-55.
Pavitt, K. (1984), “Sectoral patterns of technical change: Towards a taxonomy and a theory”, Research Policy,Vol. 13, pp. 343-373.
Pavitt, K. (1988), “International patterns of technological accumulation”, in Hood, N. and J.E. Vahlne (eds.),Strategies in Global Competition, Croom Helm, London.
Pearce, R. and S. Singh (1992), Globalising Research and Development, London, Macmillan.Pelkmans, J. (2001), European Integration: Methods and Economic Analysis, Financial Times/Prentice Hall,
Harlow, England.Perez, C. (1983), “Structural change and the assimilation of new technologies in the economic and social
system”, Futures, Vol. 15, pp. 357-75.Perez, C. (1985), “Micro-electronics, long waves and world structural change: New perspectives in developing
countries”, World Development, Vol. 13, pp. 441-63.Perez, C. (1988), “New technologies and development”, in C. Freeman and B.A. Lundvall (eds.), Small
Countries Facing the Technological Revolution, Pinter, London.Petit, P. and L. Soete (1996), “Technical change and employment growth in services: analytical and policy
challenges”, paper presented at the conference “Technology, Employment and Labour Markets”, Athens.Petit, P. and L. Soete (eds.) (2001), Technology and the Future of European Employment, Cheltenham, Elgar.Pianta, M. (1997), “Growth and specialisation in technology, production and trade: The limits of comparative
advantage”, paper prepared as part of the EU TSER project “Technology, Employment and EuropeanCohesion”.
Pianta, M. and V. Meliciani (1996), “Technological specialization and economic performance in OECDcountries”, Technology Analysis and Strategic Management, Vol. 8, pp. 157-174.
Posner, M. V. (1961), “International trade and technical progress”, Oxford Economic Papers, Vol. 13, pp. 323-341.
Rauch, J.E. (1999), ‘Networks versus markets’, Journal of International Economics, Vol. 48, pp. 7-35.Rivera-Batiz, L. and P.M. Romer (1991), “Economic integration and endogenous growth”, Quarterly Journal of
Economics, Vol. 106, pp. 531-555.Roeger W. (2001), The Contribution of Information and Communication Technologies to Growth in Europe and
the US: A Macroeconomic Analysis, Economic Paper 147, EU Commission DG1.Rowthorn, R. and R. Ramaswamy (1999), “Growth, trade, and deindustrialisation”, IMF Staff Papers, Vol. 46,
pp. 18-41.

64
Ruane, F. (1990), “Comment on papers by C.R. Neu and A. Sapir”, in R. Baldwin, C. Hamilton and A. Sapir(eds), Issues in US-EC Trade Relations, Chicago: University of Chicago Press, 269-276.
Sampson, G.P. and R.H. Snape (1985), “Identifying the issues in trade in services”, The World Economy, Vol. 8,pp. 171-182.
Sapir, A. (1985), “North-South issues in trade in services”, The World Economy, Vol. 8, pp. 27-42.Sapir, A. (1988), “International trade in telecommunications services”, in R. Baldwin, C. Hamilton, and A. Sapir
(eds), Issues in US-EC Trade Relations, Chicago: University of Chicago Press, pp. 231-244.Sapir (1993), “Sectoral dimension”, European Economy/Social Europe, 1993/3, reports and studies.Sapir, A. and C. Winter (1994), “Services trade”, in D. Greenaway and L. Alan Winters (eds.), Surveys in
International Trade, Blackwell, Oxford.Schreyer, P. (2000), “The contribution of information and communication technology to output growth: a study
of the G7 countries”, OECD, Directorate for Science, Technology and Industry, DSTI/DOC (2000) 2, 23March.
Siniscalco, D. (1988), “Defining and measuring output and productivity in the services sector”, in H. Giersch(ed.), World Services in World Economic Growth, Symposium 1988, Institut für Weltwirstschaft an derUniversität Kiel.
Sjöholm, F. (1996). “International transfer of knowledge: the role of international trade and geographicproximity”, Weltwirtschaftliches Archiv, Vol. 132, pp. 97-115.
Soete, L. (1981), “A general tests of the technological gap trade theory”, Weltwirtschaftliches Archiv., Vol. 117,pp. 638-666.
Soete, L. (1987), “The impact of technological innovation on international trade patterns: The evidencereconsidered”, Research Policy, Vol. 16, pp. 101-130.
Soete, L. and B. Verspagen (1994), “Competing for growth: The dynamics of technology gaps”, in L.L. Pasinettiand R. M. Solow (ed.), Economic Growth and the Structure of Long Term Development, London, Macmillan.
Stiroh, K., (2001), “What drives productivity growth?”, Economic Policy Review, FED New York, Vol. 7, pp.37-60.
Triplett, J.E. (1999), “The Solow computer paradox: what do computers do to productivity?”, Canadian Journalof Economics, Vol. 32, pp. 309-334.
Triplett, J.E. and B.P. Bosworth (2002), “Productivity in the services sector”, in R.E. Stern (ed.), Services in theInternational Economy , forthcoming.
UNCTAD and World Bank (1994), Liberalising Trade in Services: A Handbook , United Nations, New York andGeneva.
UNCTAD (2001), World Investment Report: Promoting Linkages, Geneva: United Nations.Vaal, A. de and Van den Berg (1999), “Producer services, economic geography and services tradability”,
Journal of Regional Science, Vol. 39, pp. 539-572.Ventura, J. (1997), “Growth and interdependence”, Quarterly Journal of Economics, Vol. 112, pp. 57-84.Vernon, R. (1966) “International investment and international trade in the product cycle”, Quarterly Journal of
Economics, Vol. 80, pp. 190-207.Vernon, R. (1977), Storm over Multinationals:The Real Issues, Macmillan, London.Verspagen, B. (1993), Uneven Growth Between Interdependent Economies, Aldershot, Avebury.Vivarelli, M. (1995), The Economics of Technology and Employment. Theory and Empirical Evidence, Edward
Elgar, Aldershot.Von Hippel, E. (1994), “Sticky information and the locus of problem solving: implications for innovation”,
Management Science, Vol. 40, pp. 429-439.Wymer, C. (1994), APREDIC and ESCONA programs.Wymer, C. (1997), “Structural non-linear continuous-time models in econometrics”, Macroeconomic
Dynamics, Vol. 1, pp. 518-548.Wolff, E.N. (1997), “Productivity growth and shifting comparative advantage on industry level”, in J. Fagerberg,
P. Hansson, L. Lundberg and A. Melchior (eds.), Technology and International Trade, Edward Elgar,Cheltenham.
Young, A. (1991), “Learning by doing and the dynamic effects of international trade”, Quarterly Journal ofEconomics, Vol. 106, pp. 369-405.
Zander, I. (1999), “How do you mean ‘global’? An empirical investigation of innovation networks in themultinational corporation”, Research Policy, Vol. 28, pp. 195-213.
Zanfei, A. (2000), “Transnational firms and the changing organisation of innovative activities”, CambridgeJournal of Economics, Vol. 24, pp. 515-542.