Review of Shear Wave Splitting-Crampin(2005)
19
Wave Motion 41 (2005) 59–77 A review of shear-wave splitting in the compliant crack-critical anisotropic Earth Stuart Crampin a,b,∗ , Sheila Peacock c a Shear-Wave Analysis Group, School of GeoSciences, University of Edinburgh, Grant Institute, West Mains Road, Edinburgh EH9 3JW, Scotland, UK b Edinburgh Anisotropy Project, British Geological Survey, Murchison House, West Mains Road, Edinburgh EH9 3LA, Scotland, UK c School of Earth Sciences, University of Birmingham, Edgbaston, Birmingham B15 2TT, UK Received 1 March 2004; accepted 17 May 2004 Available online 20 July 2004 Abstract Shear-wave splitting due to stress-aligned anisotropy is widely observed in the Earth’s crust and upper mantle. The anisotropy is the result of stress-aligned fluid-saturated grain-boundary cracks and pore throats in almost all crustal rocks, and we suggest by stress-aligned grain-boundary films of liquid melt in the uppermost 400 km of the mantle. The evolution of such fluid-saturated microcracks under changing conditions can be modelled by anisotropic poro-elasticity (APE). Numerical modelling with APE approximately matches a huge range of phenomena, including the evolution of shear-wave splitting during earthquake preparation, and enhanced oil recovery operations. APE assumes, and recent observations of shear-wave splitting confirm, that the fluid-saturated cracks in the crust and (probably) upper mantle are so closely spaced that the cracked rocks are highly compliant critical systems with self-organised criticality. Several observations of shear-wave splitting show temporal variation displaying extreme sensitivity to small stress changes, confirming the crack-critical system. Criticality has severe implications for many Solid Earth applications, including the repeatability of seismic determinations of fluid flow regimes in time-lapse monitoring of hydrocarbon production. Analysis of anisotropy-induced shear-wave splitting is thus providing otherwise unobtainable information about deformation of the inaccessible deep interior of the Earth. © 2004 Elsevier B.V. All rights reserved. Keywords: Crack-critical systems; Earth’s crust and upper mantle; Seismic anisotropy; Seismic birefringence; Shear-wave splitting 1. Introduction In 1981, one of us published in Wave Motion [1] a review of theoretical aspects of wave propagation in anisotropic and cracked elastic-media pertaining particularly to the assumed anisotropy of the Earth’s crust and upper-mantle. This present review reports the progress of over 20 years study of shear-wave splitting in an anisotropic Earth. Stress-aligned anisotropy-induced seismic shear-wave splitting (seismic birefringence or double refraction), first positively identified in 1980 in both the Earth’s crust [2] and upper mantle [3], has now been widely observed and ∗ Corresponding author. Tel.: +44 131 650 4908; fax: +44 131 668 3184. E-mail addresses: [email protected] (S. Crampin), [email protected] (S. Peacock). URL: http://www.glg.ed.ac.uk/∼scrampin/opinion/. 0165-2125/$ – see front matter © 2004 Elsevier B.V. All rights reserved. doi:10.1016/j.wavemoti.2004.05.006
-
Upload
renuga-subramaniam -
Category
Documents
-
view
19 -
download
1
description
Crampin 2005
Transcript of Review of Shear Wave Splitting-Crampin(2005)

Wave Motion 41 (2005) 59–77
A review of shear-wave splitting in the compliantcrack-critical anisotropic Earth
Stuart Crampina,b,∗, Sheila Peacockca Shear-Wave Analysis Group, School of GeoSciences, University of Edinburgh, Grant Institute,
West Mains Road, Edinburgh EH9 3JW, Scotland, UKb Edinburgh Anisotropy Project, British Geological Survey, Murchison House,
West Mains Road, Edinburgh EH9 3LA, Scotland, UKc School of Earth Sciences, University of Birmingham, Edgbaston, Birmingham B15 2TT, UK
Received 1 March 2004; accepted 17 May 2004Available online 20 July 2004
Abstract
Shear-wave splitting due to stress-aligned anisotropy is widely observed in the Earth’s crust and upper mantle. The anisotropyis the result of stress-aligned fluid-saturated grain-boundary cracks and pore throats in almost all crustal rocks, and wesuggest by stress-aligned grain-boundary films of liquid melt in the uppermost 400 km of the mantle. The evolution of suchfluid-saturated microcracks under changing conditions can be modelled by anisotropic poro-elasticity (APE). Numericalmodelling with APE approximately matches a huge range of phenomena, including the evolution of shear-wave splittingduring earthquake preparation, and enhanced oil recovery operations. APE assumes, and recent observations of shear-wavesplitting confirm, that the fluid-saturated cracks in the crust and (probably) upper mantle are so closely spaced that the crackedrocks are highly compliant critical systems with self-organised criticality. Several observations of shear-wave splitting showtemporal variation displaying extreme sensitivity to small stress changes, confirming the crack-critical system. Criticalityhas severe implications for many Solid Earth applications, including the repeatability of seismic determinations of fluid flowregimes in time-lapse monitoring of hydrocarbon production. Analysis of anisotropy-induced shear-wave splitting is thusproviding otherwise unobtainable information about deformation of the inaccessible deep interior of the Earth.© 2004 Elsevier B.V. All rights reserved.
Keywords:Crack-critical systems; Earth’s crust and upper mantle; Seismic anisotropy; Seismic birefringence; Shear-wave splitting
1. Introduction
In 1981, one of us published in Wave Motion[1] a review of theoretical aspects of wave propagation in anisotropicand cracked elastic-media pertaining particularly to the assumed anisotropy of the Earth’s crust and upper-mantle.This present review reports the progress of over 20 years study of shear-wave splitting in an anisotropic Earth.Stress-aligned anisotropy-induced seismic shear-wave splitting (seismic birefringence or double refraction), firstpositively identified in 1980 in both the Earth’s crust[2] and upper mantle[3], has now been widely observed and
∗ Corresponding author. Tel.:+44 131 650 4908; fax:+44 131 668 3184.E-mail addresses:[email protected] (S. Crampin), [email protected] (S. Peacock).URL: http://www.glg.ed.ac.uk/∼scrampin/opinion/.
0165-2125/$ – see front matter © 2004 Elsevier B.V. All rights reserved.doi:10.1016/j.wavemoti.2004.05.006

60 S. Crampin, S. Peacock / Wave Motion 41 (2005) 59–77
investigated. There are several thousand papers on the theory and observation of shear-wave splitting in the Earth, andshear-wave splitting is an anticipated phenomenon in almost all crustal and upper-mantle rocks. It has been inferredthat the crust and probably the uppermost 400 km of the mantle are critical systems of closely spaced fluid-saturatedmicrocracks with great sensitivity to changing conditions. This means that changes in shear-wave splitting directlymonitor changes in rock mass deformation. We suggest that the ability to monitor low-level deformation withshear-wave splitting is probably the most fundamental advance in solid Earth geophysics for several decades[4–7].Thus monitoring shear-wave propagation in anisotropic rocks is opening a new window into our understanding ofrock deformation and the evolution of crustal and mantle properties.
1.1. Background of seismic anisotropy in geoscience
The first confirmed observations of seismic anisotropy in the Earth were measurements of azimuthal velocityvariations ofP-waves refracted in oceanic basins recognised by Hess in 1964[8]. Hess interpreted these observationsin terms of wave propagation through olivine crystals, a common mantle material, aligned by the movement ofthe mantle away from spreading centres.P-waves are sensitive to a wide variety of phenomena and identifiableobservations ofP-wave velocity anisotropy require accurate measurements of travel times over a wide range ofdirections in a uniform homogeneous rock mass. Except for oceanic basins, large blocks of uniform homogeneousrock are very uncommon in the Earth and there have been few studies whereP-wave anisotropy has beenreliablyidentified.
The next observations of seismic anisotropy, in 1966, were measurements of systematic anomalies in the particlemotion of seismic surface waves[9], particularly the Second Rayleigh and Second Love Modes, which may becomewholly or partially coupled in layered anisotropic solids. These modes have most of their energy (and most of thecoupling) in the top few km of the upper mantle, immediately below the Mohorovicic discontinuity at around 33 kmdepth[10]. Theoretical modelling[10–12]showed that the observed particle motions and cross-mode coupling couldbe caused by as little as 4 km of 4% shear-wave velocity anisotropy at the top of the mantle. At that time, the causeof the anisotropy was not specified. A severe problem in analysing and interpreting suchsurface-waveanisotropyis the difficulty in determining the depth of the anisotropy, and there have again been limited further studies.
Wave propagation through plane-layered anisotropic models can be calculated by setting up 6× 6 propagatormatrix equations[13] matching the properties across interfaces. A major advance was to always calculating prop-agation in thex-plane with thez-plane horizontal[11], so that differences in direction, or changes of anisotropicalignment, could be accommodated merely by rotating the anisotropic matrices. This great convenience is obviousnow, but previous use of Christoffel transformations made it less obvious at the time[11].
The breakthrough in studies of anisotropy in the Earth came when theoretical studies[1,13–16]demonstratedthat stress-aligned shear-wave splitting was the most diagnostic phenomenon for recognising anisotropy in crackedrocks, and such stress-aligned shear-wave splitting was commonly observed in the Earth[2,3,17,18]. Shear-wavesplitting, analogous to the birefringence of light in crystals, occurs when shear waves enter a system of aligned cracks.The waves are split into two approximately orthogonal polarisations which travel at different velocities and writecharacteristic easily recognisable signatures into three-component seismograms.Fig. 1shows a schematic illustrationof the phenomenon. The cracks tend to be aligned perpendicular to the direction of minimum compressional stress,just like fractures induced by the injection of high-pressure fluid in the oil industry. Since below the critical depth,where the increasing vertical stress equals the minimum horizontal stress (usually between 500 and 1000 m), theminimum stress is horizontal and cracks tend to be vertical striking parallel to the maximum horizontal stress.This means thatorientationsof the polarisations generally provide information about the anisotropic symmetry andstress direction, whereastime-delaysbetween the split shear-waves provide information about the average crackdensity along the ray paths. Such stress-aligned crack-induced shear-wave splitting is now widely observed in theEarth’s crust[18–21] and upper mantle[22]. Shear-wave splitting is recognised in seismograms in igneous andmetamorphic rocks above small earthquakes[19,23–25], and in seismic reflection surveys and vertical seismicprofiles in sedimentary hydrocarbon reservoirs[17–21].

S. Crampin, S. Peacock / Wave Motion 41 (2005) 59–77 61
Fig. 1. Schematic illustration of shear-wave splitting in distributions of stress-aligned fluid-saturated parallel vertical microcracks alignednormalto the direction of minimum horizontal stress,σh. For nearly vertical propagation the polarisation of the faster split shear-wave is parallel tothe strike of the cracks, parallel to the direction of maximum horizontal stress,σH. Such parallel vertical crack orientations are typically foundbelow the critical depth (usually between 500 and 1000 m), where the vertical stress,σV, becomes greater thanσh.
Note that such stress-aligned anisotropic symmetry is close, but not usually identical, to hexagonal symmetry(transverse isotropy) with ahorizontalaxis of symmetry. As a result, it is sometimes, misleadingly, referred to asTIH-anisotropy. In practice, there is always a distribution of orientations leading (usually) to greater or smallerorthorhombic perturbation of the hexagonal TIH-anisotropy.
1.2. Other causes of anisotropy in crustal rocks
In contrast to TIH-anisotropy,TIV-anisotropyis transverse isotropywith averticalaxis of hexagonal symmetrywhere the shear-waves split into strictlySH- andSV-polarisations with no azimuthal variations[26]. Such symmetryis characteristic of finely layered horizontal sedimentary strata, where the anisotropy is caused by the interactionsof reflections and transmissions through thin isotropic layers. TIV-anisotropy is also characteristic of many shalesand clays, where the anisotropy is caused by horizontal platelets of mica and other minerals. Such TIV-anisotropyhas vertical and horizontal velocities that may differ by up to 40% which causes severe problems in seismicprocessing, and reconciling seismically derived depths with true depths at boreholes in the hydrocarbon industry.These technical problems can usually be accommodated by processing[27], although, like almost all examples ofazimuthal anisotropy, the behaviour of shear-wave splitting in in situ rocks with TIV anisotropy has only recentlybeen effectively calibrated[28].
Thus, TIV-anisotropy is comparatively well understood and probably has few surprises left. However, almost theonly real geophysical information it carries is that the rock was laid down in some sort of sedimentary process insome sort of fluid, and that gravity is vertical. In general TIV-anisotropy is not stress-sensitive, and we shall notrefer to TIV-anisotropy again.
Note that alignment of grains and intergranular pores not related to present-day stress also occurs in metamorphicrocks, particularly in slates, in which grains have been aligned by re-crystallisation under stress. This alignmentcan give rise to very high anisotropy[29,30]at arbitrary orientations determined by the tectonic history of the rock.Where ray paths cross zones of such strongly anisotropic rocks, shear-wave splitting due to aligned cracks elsewhereon the ray path may be severely disturbed[31].

62 S. Crampin, S. Peacock / Wave Motion 41 (2005) 59–77
1.3. What will be discussed
We shall discuss observations of stressed-aligned shear-wave splitting in the Earth’s crust. It can be shownthat stress-aligned crack-induced shear-wave splitting is controlled by the incipient low-level deformation of rockbefore fracturing takes place (pre-fracturing deformation)[32,33]. The effect of stress on microcrack geometry,which shear-wave splitting images directly, depends on the rock properties, and in a complex heterogeneous Earth,may be difficult to deduce from a few determinations of the effective anisotropy. Potentially more important aretime-lapse observations, where seismograms repeated with the same or similar source-to-receiver geometry canbe differenced to show the effects of very small changes to crack geometry between recording sessions. Similarsource-to-receiver geometry means similar ray paths, so that differences can often be interpreted directly in termsof the effects of the changing stress on the microcrack geometry along the ray paths.
Such time-lapse observations in the Earth have shown extraordinary sensitivity to near negligible changes.The reasons for this sensitivity is thought to be that the fluid-saturated cracks are critical systems verging onfracture-criticality with all the sensitivity, universality, and calculability that criticality implies[4,5,7,34–36]. Thiscriticality means that there are spatial and temporal heterogeneities so the detailed behaviour and properties ofmuch of the crust and upper mantle cannot be extrapolated from place to place or from time to time. The validityof any particular seismic measurement degrades with time so that many common procedures, such as averaging,are only possible in strictly limited circumstances. Consequently, the results of many conventional geophysicalmeasurements, for example, reservoir characterisation by the oil industry, may be correct over much more limitedtemporal and spatial resolution than was previously thought.
2. Basic theory and observation of shear-wave splitting in cracked rocks
Garbin and Knopoff[37] were the first to calculate the behaviour of wave propagation through aligned (parallel)cracks. They did not recognise that aligned cracks would make a rock effectively anisotropic, and their analysisshows shear-wave polarisations varying smoothly with direction. Crampin[14] used the calculations of Garbin andKnopoff to calculate anisotropic elastic constants for wave propagation through parallel cracks. Hudson[16] in amore sophisticated analysis determined the anisotropic elastic moduli for both velocity variations and attenuationthrough distributions of parallel cracks. Hudson confirmed the elastic constants of Crampin[14].
Many other authors have made modifications and ‘improvements’ to the theory, but Hudson[16] is still the basicsource for elastic constants of distributions of parallel cracks in effective media calculations. (Effective media arehomogeneous solids with the same elastic properties as the cracked rock, that can be used as an approximationin mathematical modelling when the cracks are much smaller than the seismic wavelength.) The attenuation inHudson[16] was derived from scattering. The effects of both primary and secondary scattering from neighbouringmicrocracks are minor and probably not important in many Earth structures.
These early developments were reviewed inWave Motionin 1981[1]. The underlying reason for those develop-ments was that observations of three-component seismograms had shown evidence of shear-wave splitting[2,3],and the only possible source of anisotropy that satisfies all observations is fluid-saturated stress-aligned microc-racks[19,38,39]. Almost all suitable three-component seismograms display shear-wave splitting in almost all insitu rocks.Fig. 2shows the examples of shear-wave splitting at two stations in Iceland[24], andFig. 3ashows theshear-wave alignments as rose diagrams of shear-wave polarisations observed above small earthquakes in Iceland[25]. The dominant direction of the diagrams is approximately NE to SW and is the direction of maximum tectoniccompressional stress, the strike of the cracks inFig. 1.
2.1. The shear-wave window
An absolute requirement for useful observations of shear-waves at a free surface of an isotropic half-space isthat the shear waves must be recorded within the shear-wave window defined by angles of incidence less thanθ

S. Crampin, S. Peacock / Wave Motion 41 (2005) 59–77 63
Fig. 2. Typical examples of seismograms of local earthquakes recorded within the shear-wave window at two stations in Iceland: (a) KRI and(b) BJA. At each station: (i) seismograms are rotated into vertical, horizontal radial, and horizontal transverse directions, with numbered 0.1 sintervals for polarisation diagrams of the shear-wave motion. (ii) Mutually orthogonal polarisation diagrams, where U, D, L, R, T, and A referto up, down, and left, right, towards, and away directions from the source. The number top left is the time interval in (i) above; top right is theamplitude factor (number of relative multiplications of the traces), where the arrowhead marks the arrival, and the arrow marks the horizontalvector polarisation, of the leading split shear-wave. (iii) Shows horizontal seismograms rotated into polarisation directions from (ii) of the fasterand slower split shear-waves, where the time-delay is the difference in arrival times in ms (after[24]).
= sin−1(Vs/Vp), whereVp andVs are theP- and shear-wave velocities, respectively[40]. For a Poisson’s ratio of1/4,θ is about 35◦. Within this window, the shear-wave signal recorded at the surface has the same waveforms as theincoming wave (but twice the amplitude). Outside the window, the shear-wave waveforms are so severely distortedby S-to-P conversions that even direct shear-wave arrivals in a homogeneous structure are usually unreadable. Notethat it is the angle of incidence to the free surface that defines the shear-wave window. Surface recordings of shearwaves on irregular topography, or above irregular internal interfaces, which modify the angle of incidence, mayseverely distort the shear-wave window[40]. However, a low-velocity layer at the surface may effectively widen theshear-wave window by refracting the upcoming shear waves towards vertical incidence. This effective shear-wavewindow is typically as much as 45◦ or 50◦.
2.2. Major advances: critical systems and APE-modelling
There have been many advances since 1981, particularly in the last 5 or 6 years. The two most significant advancesare:
(1) The recognition that the distributions of fluid-saturated microcracks in the Earth are so closely spaced thatthey are critical systems verging on fracture-criticality and self-organised criticality[6,7,19], so that shear-wave

64 S. Crampin, S. Peacock / Wave Motion 41 (2005) 59–77
Fig. 3. (a) Normalised equal-area rose diagrams superimposed on equal-area polar plots (out to 45◦) of the polarisations of the faster splitshear-wave observed above small earthquakes at the Iceland Seismic Network (red triangles) in years 1996–2000. Glaciers and ice caps areshown in white. (b) Rose diagrams and polar plots for the Tjörnes Fracture Zone outlined in (a). Green petals are polarisations for earthquakes inyears 1996–2000, and red petals are polarisations in 2001, when stations BRE, FLA, and HED were installed. Earthquake locations are shown for2000 and 2001. Note rose diagrams in (a) and (b) are normalised for each station, and green and red rose diagrams have different normalisations(after[7]).
splitting directly monitors pre-fracturing deformation[33]. The key observations were that shear-wave splittingin in situ rocks varies from a minimum of about 1.5% shear-wave velocity anisotropy (SWVA) to a maximumof about 4.5% in uniform unfractured rock[19]. The crack density,ε, defined byε = Na3/v, whereN is thenumber of cracks of radiusa in volumev, is approximately equal to a hundredth of the percentage shear-wavevelocity anisotropy (SWVA/100)[19]. Thus the dimensionless crack distributions inFig. 4represent the range ofobserved SWVA. Observed shear-wave splitting suggests that most rocks are close to fracture-criticality at about5% SWVA broadly agreeing withFig. 4 where at 5% SWVA cracks are so closely spaced that shear-strengthis lost and fracturing and earthquakes can occur. It can be shown that the theoretical percolation threshold for
Fig. 4. Cross-sections of uniform distributions of parallel stress-aligned fluid-saturated microcracks representing shear-wave velocity anisotropyin percent, crack densityε, and crack radiusa (after[19]).

S. Crampin, S. Peacock / Wave Motion 41 (2005) 59–77 65
distributions of stress-aligned parallel cracks is aboutε = 0.055, or 5.5% SWVA[33], for a Poisson’s ratioof 0.25. This suggests that if in situ rock is disturbed in any way, it is the geometry of the fluid-saturatedmicrocracks that responds to the disturbance. A remarkable feature of the 1.5–4.5% range of SWVA is thatit is observed, as expected from APE, to be independent of rock type (igneous, sedimentary, or metamorphicwith the exception noted above), porosity, or tectonics. It appears to be a universal feature of almost all rocks.The only recognised exception is that areas of high heat-flow such as Iceland may have larger percentages ofSWVA [24,25]. This is believed to be not due to higher crack density (implying a higher fracture-criticalitylimit) but to a higher temperature reducing the elastic moduli of the crack-filling fluid, and hence increasingthe shear-wave velocity anisotropy for a given crack density. Theoretically for given crack densities, levels ofshear-wave velocity anisotropy are very sensitive to the elastic properties of the rock matrix and the pore fluid[41].
(2) The evolution of closely spaced compliant fluid-saturated grain-boundary cracks and flat pores and pore throatsis so pervasive throughout most rocks that the behaviour can be modelled byanisotropic poro-elasticity(APE)[32,33]. The APE mechanism for low-level deformation is fluid migration by flow or diffusion along pressuregradients between neighbouring microcracks at different orientations to the stress-field. APE-modelling is fully3D, but 3D behaviour is difficult to illustrate in 2D diagrams, andFig. 5 shows the schematic illustration ofthe effects of such stress changes on a distribution of initially randomly orientedverticalfluid-saturated cracks.Note that the APE mechanism involves micro-scale (<2 mm, say) fluid movement around grain boundaries anddoes not involve any large-scale movement of fluids. Consequently, the response of the microcracks to changingconditions is almost immediate[33].
Fig. 5. Schematic illustration of APE-modelling the evolution of crack aspect-ratios in an initially random distribution of vertical cracks (solidlines) for four values of increasing maximum horizontal differential stress, normalised to the critical value at which cracks first begin to close.Below the critical stress there is zero SWVA. Pore-fluid mass is preserved and aspect-ratios are chosen to give a porosity ofϕ = 5%. Please see[6] for detailed interpretation (after[34]).

66 S. Crampin, S. Peacock / Wave Motion 41 (2005) 59–77
It can be shown[32,33] that APE prediction of the evolution of an initially random distribution of cracks whena deviatoric stress is applied is independent of porosity.Fig. 5 indicates that there is a minimum of about 1.5%shear-wave velocity anisotropy (Table 1) independent of porosity. This minimum is observed in the Earth (Fig.4) with almost identical parameters in a vast range of sedimentary, igneous, and metamorphic rocks of differentporosity, geology, and tectonic history[17–21]. APE is tightly constrained with no free parameters yet appears toapproximately match a range of some 15–20 different phenomena and millions of individual observations[5,6,35].Such uniformity and calculability were initially inexplicable until APE-modelling was developed.
The underlying reason for the universality is that the fluid-saturated microcrack distributions are so closelyspaced that they are critical systems possessing self-organised criticality[4–6,36]. Table 1summarises the match ofAPE-modelling to observations. The success of APE-modelling shear-wave anisotropy implies thatall fluid-saturatedmicrocracked rocks, of whatever origin or rock-type, can be modelled from a rock containing an initial distributionof randomly oriented fluid-saturated cracks with crack densities close to fracture-criticality. (Note that below a fewmetres depth, in situ cracks are subject to increasingly high pressures and temperatures in corrosive environments,so that direct physical calibration of APE is difficult.)
It is interesting to note that it is only shear-wave splitting that has this comparatively direct relationship withaligned crack distributions and anisotropy. SeismicP-waves are sensitive to so many phenomena that the ef-fects of anisotropic velocity variations are difficult to observe and very difficult to isolate. Other electrical and
Table 1Summary of match of APEa-modelling to observations (references in[5])
Static effectsField observations of SWVAb (below 500–1000 m depth)
(1) SWVA in all rocks independent of porosity and geology(2) Minimum SWVA in intact rock: observed≈1.5%; APE-modelled≈1.0%(3) Maximum SWVA in intact rock: observed≈4.5%; APE-modelled≈5.5%(4) Narrow range of observed crack density: 0.015≤ ε ≤ 0.045(5) Proximity of intact rocks to fracture-criticality at crack densityε ≈ 0.055 (≈5.5% SWVA), where fracture-criticality
can be associated with the percolation threshold
Other field observations(6) Fracture-criticality limit specifies crack distributions with a range of dimensions of about nine-orders of magnitude(7) π/2 shear-wave polarisation changes (90◦-flips) in over-pressured reservoirs
Dynamic effectsTemporal changes in SWVA during production procedures
(8) Changes between measurements made before and after hydraulic pumping tests(9) Changes between measurements made before and after both high-pressure and low-pressure CO2-injections in a
carbonate reservoir
Temporal changes in SWTDc before earthquakes(10) Variations of time-delays (with hindsight) before some dozen earthquakes worldwide with magnitudes from
M = 1.7–6(11) Successful forecast of time and magnitude of anM = 5 earthquake in SW Iceland
Temporal changes in SWTD before volcanic eruption(12) Variations in SWTD for some 5 months before 30 September 1996, Vatnajökull eruption, Iceland, at a range of
azimuths and distances up to 240 km
Variations of shear-wave properties in laboratory experiments(13) Ultrasonic variations of SWVA and permeability in uniaxial stress cell(14) Ultrasonic variations of (isotropic) shear-wave velocities to changes in confining pressure and pore-fluid pressure for
oil-, water-, and gas- (dry) saturations in sandstone cores in stress cells(15) Ultrasonic variations of velocity and attenuation from sonic (transducers) to seismic (resonant bar) frequencies
a Anisotropic poro-elasticity.b Shear-wave velocity-anisotropy.c Shear-wave time-delays.

S. Crampin, S. Peacock / Wave Motion 41 (2005) 59–77 67
electro-magnetic techniques are in principle sensitive to crack-induced anisotropy, but these techniques involvepotential analysis that cannot resolves small-scale details of crack distributions. Consequently, seismic waves arethe only direct way to image the critical distributions of microcracks in the interior of the Earth, and seismic inter-pretation of shear-wave splitting appears to be the only source of direct information about in situ anisotropy, andthe pre-fracturing deformation. Critical systems and their implications for conventional geophysics are discussedmore fully inSection 6.
3. The significance of changing crack aspect-ratios
Fig. 5shows that the major effect of small increases of stress in the APE-model is to increase the aspect-ratio ofcracks opening perpendicular to the direction of minimum compressional stress. Hudson’s analysis[15,16]showsthat increasing crack aspect-ratios of fluid-saturated cracks changes the time-delays between split shear-waves ina specific range of azimuths and incidence angles[35]. Interpreting field observations before a large (Ms = 6)earthquake, Peacock et al.[42–44]first suggested that the observed temporal changes of time-delays in a range ofstress-oriented directions could be explained by the accumulation of stress before an impending large earthquakeenlarging crack aspect-ratios. The effects of stress on aspect-ratios was later confirmed with APE-modelling theevolution of fluid-saturated cracks as inFig. 5 [32,33].
Changes in shear-wave splitting have only been recognised (with hindsight) before about a dozen earthquakesworld-wide ranging in magnitude fromMs = 1.7–6[25,35,45]. Observations of temporal changes at Station BJA inSW Iceland (Fig. 6) indicating increasing stress were used to stress-forecast in real time the time and magnitude of theM = 5 earthquake of 13 November 1998 3 days before the earthquake occurred[46]. Although shear-wave splittingprovides no direct information about the impending epicentre, knowledge that a large earthquake is approachingallows other precursors to be interpreted more realistically. In the case of the successful stress-forecast, continuing
Fig. 6. Variations of time-delays between split shear-waves above small earthquakes for 1996–1999 at station BJA. The bottom diagram showsthe variation of time-delays with time for ray paths with directions in Band-1: solid-angles±(15–45◦) to the average crack plane, where theaverage time-delay is sensitive to increasing stress. The top diagram show time-delays in directions in Band-2 (solid-angles±15◦ to the averagecrack plane), which is sensitive to crack density. The time-delays in ms are normalised to a 1 km path-length. Error bars are time-delays dividedby the errors in ray path distance from locations. The irregular lines are nine-point moving averages. The straight lines in Band-1 are least-squareestimates beginning just before a minimum of nine-point average and ending at a larger earthquake or eruption. Dashed lines refer to changesbefore the Vatnajökull eruption. The arrows below each plot indicate the times of these larger events with magnitudes and epicentral distancesindicated (after[25]).

68 S. Crampin, S. Peacock / Wave Motion 41 (2005) 59–77
seismic activity on a nearby fault allowed the fault break to be identified before the earthquake occurred[46]. (Notethat the explanation for the enormous scatter in shear-wave time-delays inFig. 6 is given inSection 5.3.)
Such forecasting using small earthquakes as the source of shear-waves requires persistent seismicity, adequaterecording and processing networks, and nearby large earthquakes[35]. Such circumstances are rare, and even iffound, sufficiently persistent seismicity is unreliable. The largest recent earthquake in SW Iceland, theMs = 6.6earthquake of June 2000, was not forecast because the source seismicity was quiescent for the initial 2 months ofthe seven-month build up of stress. With no signals, the increase was not recognised, and the earthquake was notstress-forecast[25].
4. Significance of pore space in porous rocks: squirt flow, the source of frequency-dependent attenuation
Thomsen[47] recognised that velocity variations would be modified by pore-space where distributions of alignedcracks occur in media also containing grain-scale ‘equant’ pores. These so-called “dual porosity” media are com-mon as oil reservoir rocks. He modelled velocity anisotropy in effective media with aligned cracks and ‘equant’pore-space. Modifications to velocity anisotropy were comparatively minor but, in some circumstances, equantpore-space can make significant modifications to seismic attenuation[48].
One of the effects of pore space is to modify attenuation by squirt flow, where fluid is pumped in and out of thinpores and pore throats as seismic waves propagate through porous media. First identified for isotropic (random)crack distributions[49], squirt flow was analysed for distributions of aligned cracks by Pointer et al.[48]. The effectscan be significant but are controlled by the ratio of wavelength to crack size. For sedimentary rocks, squirt flow isonly likely to be measurable at the comparatively high frequencies of exploration seismics.
However, squirt flow could provide valuable information. A major difficulty in exploration seismics is estimatingthe size of the fractures causing the shear-wave splitting. This is because the cube of the crack size trades offagainst number density in the crack density, which controls velocity variations in media containing aligned cracks.In industrial seismology shear-wave splitting is frequently interpreted in terms ofmacro-fracturesenabling oilflow and aiding hydrocarbon production. Although recognising that large fractures may affect shear-wave splitting[50,51], we suggest that stress-aligned fluid-saturatedmicrocracksare the major source of shear-wave splitting[52].One way to distinguish crack size is by measuring and interpreting frequency-dependent seismic attenuation, wheresquirt flow is (probably) the dominant mechanism. The basic equations have been developed[53] and modellingdata has been attempted[54]. However, correct interpretation requires very well-recorded observations which aredifficult to obtain, and there are no definitive results at the time of going to press.
5. Significance of high pore-fluid pressures and 90◦-flips in shear-wave polarisations
In APE-modelling of the evolution of fluid-saturated cracks under changes of stress, when pore-fluid pressures arelow, as is assumed forFig. 1, the aligned cracks tend to be perpendicular to the direction of minimum compressionalstress, and the faster split shear-wave is polarised parallel to the direction ofmaximumhorizontal stress. However,when pore-fluid pressures increase to critical levels, the effective stress-field realigns, microcrack distributions aremodified, and the faster split shear-wave does a 90◦-flip and becomes parallel to the direction ofminimumhorizontalstress[33]. Such 90◦-flips are very distinctive phenomena, and faster split shear waves with polarisationperpen-dicular to the direction of maximum compressive stress (stress-perpendicular polarisations) have been observed inboth exploration and earthquake seismology.
5.1. 90◦-flips in exploration seismology
Stress-perpendicular polarisations caused by high pore-fluid pressures were first recognised in a vertical-seismic-profile (VSP) in a reservoir in the Caucasus Oil Field[55]. The most definitive observation of 90◦-flips has been

S. Crampin, S. Peacock / Wave Motion 41 (2005) 59–77 69
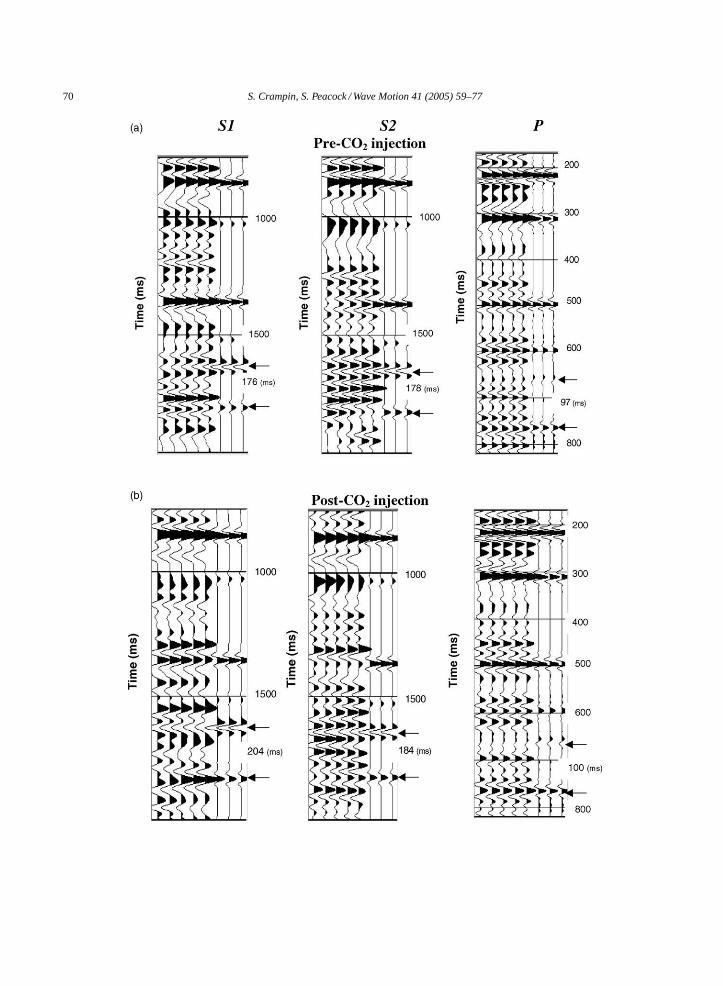
in fluid-injection experiments in Vacuum Field, New Mexico by the Reservoir Characterisation Project of theColorado School of Mines[56]. There were both high-pressure and low-pressure CO2-injections and the effectswere recorded by time-lapse seismic reflection surveys. The principal seismic effects were variations in the traveltimes of the split shear-waves. Angerer et al.[50] modelled the behaviour by setting up a suitable initial fracturedmodel and simulating the injections by inserting the appropriate CO2-pressures into the APE-modelling procedure.The effects on the shear-waves of both high- and low-pressure injections were modelled almost perfectly. Onlythe high-pressure results are shown inFig. 7. Before injection (Fig. 7a), the faster split shear-wave is polarised inthe S1-direction. After the high-pressure injection (Fig. 7b), the faster split shear-wave has done a 90◦-flip and isparallel to the previous S2-direction. These results are the best in situ calibration of APE-modelling to date.
5.2. 90◦-flips above large seismically active faults
Fig. 3bshows rose diagrams for the shear-wave polarisations at seismic stations in northern Iceland. As inFig. 3a,rose diagrams at most stations are approximately NE to SW, imaging the direction of maximum horizontal stress.Three stations on the Húsavık-Flatey Fault, however, show fault-parallel rose diagrams approximately orthogonalto the polarisations elsewhere. The Húsavık-Flatey Fault is a major transform fault of the Mid-Atlantic Ridge whichruns onshore in northern Iceland. Similar polarisation anomalies have also been observed in two places above anothermajor fault, the San Andreas Fault in California[42,57]. Modelling the effects with APE, Crampin et al.[58,59]shows that the most likely explanation is that the critically high pore-fluid pressures on all seismically active faultplanes cause shear-wave polarisations perpendicular to the direction of maximum compressive stress. If normallypressured paths result in positive time-delays, highly pressured paths cause stress-perpendicular first polarisationsand hence negative time-delays. At major faults such as the Húsavık-Flatey and the San Andreas, which extendthrough a large part of the crust, the normally pressured segment of the ray path above the fault is too short to reverse90◦-flips in the fault zone and the stress-perpendicular 90◦-flips are observed at the surface.
It has also been suggested[60] that the seemingly stress-perpendicular shear-wave polarisations, observed at thesurface above very shallow earthquakes in João Camara, northeast Brazil[61], are also pressure-induced 90◦-flips.Again, the normally pressured ray paths through anomalous near-surface rocks are too short above very shallowearthquakes to reverse the 90◦-flipped polarisations established in the fault zone.
5.3. 90◦-flips above small seismically active faults and scatter of shear-wave time-delays
Almost all measurements of time-delays between split shear-waves above small earthquakes display a large±80% scatter, as inFig. 6. In contrast, time-delays in shear-wave splitting in reflection profiles and VSPs inexploration seismics away from seismically active faults show negligible scatter, so the scatter appears to be anearthquake-related phenomenon. This scatter has been impossible to explain by conventional geophysics[24].
Section 5.2suggests that there are critically high pore-fluid pressures on large seismically active faults in orderto relieve friction and overcome asperities. We suggest[59] that such pore-fluid pressures exist on all seismicallyactive faults so that stress-perpendicular polarisations must be expected in the vicinity of all earthquake faults.Measures of shear-wave splitting above earthquakes are typically from small earthquakes rupturing small faults, orsmall segments of larger faults. Consequently, the high pore-fluid pressures surrounding faults are limited in extent,so that stress-perpendicular polarisations only occur in a limited zone around the source.
In most circumstances, the remainder of the ray path to the surface recorder through normally pressured rock islonger than the critically high-pressured path so that polarisations observed at the free surface are parallel to theregional stress direction. Each earthquake releases stress and changes the stress field, and it has been shown thatsmall temporal variations in the ratio of normally pressured path to high-pressured path, causing 90◦-flips alongvarying lengths of the path, can easily cause the±80% scatter in observed time-delays[59]. Thus what appears tobe±80% scatter is not an indication of measurement inaccuracies. It is actually a consequence of the sensitivity ofthe critical system to small changes of stress and pressure following every earthquake.
70 S. Crampin, S. Peacock / Wave Motion 41 (2005) 59–77

S. Crampin, S. Peacock / Wave Motion 41 (2005) 59–77 71
Although it has long been recognised that seismically active faults must be pervaded by high pore-fluid pressuresin order to permit slip without frictional heating[62–65], in the past there has been no way to demonstrate theirpresence. One of the major objectives of the current SAFOD (San Andreas Fault Observatory at Depth) plans todrill into the San Andreas Fault is to directly measure pore-fluid pressures on an active fault[66]. Thus the±80%scatter in shear-wave time-delays above small earthquakes may be a valuable demonstration thatall seismicallyactive faults are permeated by critically high pore-fluid pressures.
6. Critical systems of stress-aligned fluid-saturated cracks
The reason that the almost parameterless APE-modelling can calculate and predict the response of stress-alignedfluid-saturated microcracked rock to changing conditions in an extraordinarily complicated heterogeneous Earth isbecause the cracks are so closely spaced (seeFig. 4) that the cracked rock is a critical system[6,35,67]. Systemsverging on criticality maintain dynamic interactive processes that evolve locally until they reach criticality, whenall members influence all other members[67–69]. Equilibrium thermo-dynamics is the classical critical system,and enthusiasts argue that almost all complex systems in nature are critical systems[70]. Such systems are said topossess self-organised criticality (SOC), and evolve in response to some disturbance (increasing stress in the caseof the Earth) until criticality is reached. At fracture-criticality, when fractures are so pervasive that shear-strengthdisappears, the energy is released (by fracturing and earthquakes), the system relaxes to below criticality, and theevolution continues from the new position. The behaviour of critical systems near criticality is closer to that of othercritical systems than it is to the underlying sub-critical physics[5,36]. This universality is believed to be the reasonAPE-modelling matches such a wide range of phenomena (Table 1).
The best-known evidence for SOC in geophysics is the (empirical) self-similarity of the Gutenberg–Richterrelationship, where the log of the cumulative number of earthquakes is self-similar to the earthquake magnitude forseveral orders of magnitude. The APE mechanism for the evolution of aligned fluid-saturated crack distributionsprovides the sub-critical physics of the Gutenberg–Richter relationship, which had previously not been identified.The uniformity and coherence of shear-wave splitting parameters throughout the crust and upper-mantle and thelimited range of implied crack densities suggest that all fluid-saturated rocks have similar underlying, initiallyrandom, crack distributions with similar crack densities as illustrated schematically inFig. 4 [19].
As mentioned above, the interior of the Earth is difficult to access, and APE criticality is difficult to demonstratein situ. In the APE-modelling of the CO2-injections[50] in Fig. 7, and in changes before earthquakes[25,35,46], thecriticality is implied. The only direct observations of extreme compliance are from a prototype stress-monitoringsite (SMS)[71] measuring shear-waves in cross-hole seismics between boreholes, adjacent and parallel to theHúsavık-Flatey transform fault of the Mid-Atlantic Ridge in northern Iceland[7]. A calibration test measuringtravel times horizontally at 500 m depth between boreholes 315 m-apart happened to coincide with a 4-day swarmof small earthquakes with energy equivalent to a singleM ≈ 3.5 earthquake on a parallel transform fault 70 kmNNW [7].
Fig. 8shows the travel-time variations over 14 days, accurate to±0.02 ms ofP-waves,SH- andSV-waves, andshear-wave anisotropySH–SV. The seismic variations correlate with the low-level seismicity, but also correlatewith anomalies in N–S and E–W global positioning system (GPS) measurements and with a 1 m 5-day decrease
Fig. 7. (a) Pre-injection waveforms of a multi-component nearly vertical reflection survey near the centre of the Vacuum Field, New Mexico,carbonate reservoir. S1, S2, and P are record sections with mutually orthogonal polarisations, where the horizontals S1, and S2, have been rotatedinto the split shear-wave arrivals parallel (S1) and perpendicular (S2) to the direction of maximum horizontal stress, respectively. The left-handfive traces are observed waveforms at neighbouring receivers 17 m apart, and the right-hand three traces are synthetic seismograms modelledby APE to match the shear-wave arrivals. Top and bottom of injection zone for shear waves (established by extensive analysis by students atColorado School of Mines) are marked by arrows with time-delays in ms/km. (b) Post-injection waveforms after a high-pressure CO2-injection.Again, the left-hand traces are observations and right-hand traces are synthetic seismograms modelled by APE with structure from (a) and aninjection pressure of 17 MPa. Multiple arrivals are reverberations and are not modelled (after[50]).

72 S. Crampin, S. Peacock / Wave Motion 41 (2005) 59–77
Fig. 8. Variations at the SMSITES SMS from August 8–24, 2001: (a)P-wave travel times in ms; (b) travel times ofSV-waves (green crosses)andSH-waves (blue crosses) in ms; (c) Time-delay (SV–SH) in ms; (f) GPS displacements around Husavık in mm, north–south (blue circles)and east–west (red crosses); (e) pressure at 33 m depth in water well on Flatey Island in bars showing ocean tides and anomalous∼1 m drop inwater level; (d) twelve-hourly histogram of seismicity within 100 km of SMSITES, Husavık (after [7]). For interpretation of the references tocolour in this figure legend, the reader is referred to the web version of this article.

S. Crampin, S. Peacock / Wave Motion 41 (2005) 59–77 73
in level of water in a well immediately over the fault. Direction of the seismic-wave propagation is parallel tothe fault and is a symmetry direction so splitting intoSH- and SV-waves is expected. The SMS recorded dataduring four brief sessions, and we were fortunate to record these anomalies as continuous well-level measurementsindicated that the 1 m decrease in well-level was the only such decrease in 15-months of available data.M = 3.5is comparatively small earthquake with a fault dimension of a few tens of metres. Thus the variations in seismicproperties show great sensitivity at a distance several hundred times the equivalent source dimensions. Althoughnot yet fully interpreted, the anomalies in the figure are internally consistent. Such sensitivity would not be expectedin conventional geophysics, and is a direct indication of deformation in a critical system of fluid-saturated cracks.
The high accuracy of the seismic measurement (±0.20 ms) is due to highly repeatable DOV source transmittinga 200 ms sweep of frequencies up to 200 Hz (a vibroseis ‘chirp’) three or four times a minute over 315 m in avery quiet environment at 500 m depth with borehole stability and low ambient noise[7]. The repeatability allows100-fold stacking and the exceptional accuracy for field measurements.
7. Discussion
Criticality has major implications for conventional geophysical investigations. Taken from Paper[6] where theyare discussed in more detail,Table 2lists some of the effects. Critical systems have great sensitivity where minorremote disturbances can have major effects on local phenomena. This is the butterfly’s wings sensitivity of theoreticalchaos. This extreme compliance means that the detailed behaviour of rock varies from place to place and from time totime, with the implication that any particular observation degrades with time. These variations may be in responseto known disturbances, as in the seismic activity inFig. 8, but may also be caused by the effects of solid earthand ocean tides, movements of magma (Item 11 in table), and by remote seismic activity. Since the earthquakemagnitude scale is exponential, a unit increase in magnitude implies approximately an order of magnitude moreenergy. Consequently, extrapolation fromFig. 8, suggests that a single SMS would be able to monitor changesinduced byM = 5 earthquakes up to (conservatively) 200 km;M = 6, up to 700 km;M = 7, up to 2000 km; andM= 8, earthquakes to probably worldwide.
This implies that the Earth is continually ‘flexing’ in response to typically unattributable local or distant per-turbations. This may have serious consequences. For example, oil companies are currently investing billions ofdollars in seismic time-lapse surveys of producing reservoirs, where (usually) three-component reflection surveysover extensive areas are repeated with similar source-to-receiver geometries in order to monitor the movement offluids in producing reservoirs. If there are temporal variations in the seismic properties of the reservoir that are notassociated with oil extraction (Items b1 and b2 inTable 2), then the basis of the technique is undermined. Notehowever, that the seismic travel times inFig. 8 that display the effects of criticality are measured to exceptionallyhigh accuracy (±20�s with wavelengths of order of∼6 cm). In contrast if resolution is low, many of the difficultiesassociated with criticality may be ignored (although criticality as an explanation of the behaviour of shear-wavesplitting would still be required[35]).
Despite these various advances outlined, above, there are still at least two serious postulates on which the SOChypothesis depends, that have yet to be proved.
(1) Shear-wave splitting in the crust is caused by microcracks. We consider that the overall observations of com-pliance inTable 1indicates stress-aligned microcracks, grain-boundary cracks, flat pores, and pore throats asthe source of the splitting (see discussion at the end ofSection 4, above). As pointed out inSection 4, thereis ambiguity between micro- and macro-cracks as the cause of velocity anisotropy. This controversy mightbe resolved by better measurements of seismic attenuation. Macrofractures are nevertheless merely the endpoint of the process of crack growth and might be expected to mirror the properties of alignment, in particular,of the progenitor microcracks. However, macrofractures lead to seismic reflections and refractions and causeshear-wave splitting only when they are numerous enough and then they lead to significant attenuation anddeterioration of the slower split shear-wave[51]. In addition, microcracks are sensitive to the contemporary

74 S. Crampin, S. Peacock / Wave Motion 41 (2005) 59–77
Table 2Some practical implications of critical crack systems with SOC for fluid–rock interactions within the Earth’s crust (references in[4])
(a) General implications(1) Fluid-saturated crack distributions are highly compliant and crack geometry responds to small nearly negligible changes of
stress, pressure, and physical properties of the pore fluids(2) Since fluid–rock properties vary with time, and vary from place to place, measured fluid–rock properties are only strictly
valid at the place and time they are measured. Hence, the need for measurements with single-well imaging if accuratespecifications are required
(3) Since fluid–rock interactions have a dominant effect on almost all physical and chemical behaviour within the crust andmantle (see a2, above), these various effects apply to a huge range of geophysical phenomena, particularly those associatedwith any deformation, including almost all processes during hydrocarbon recovery
(4) Behaviour of stress-aligned fluid-saturated crack distributions appears to be remarkably uniform (within certain limits) evenin very heterogeneous structures
(5) Pre-fracturing deformation of any given fluid–rock configuration can be monitored by observations of shear-wave splitting(6) Pre-fracturing deformation can be modelled by anisotropic poro-elasticity (APE)(7) Response of fluid–rock systems to known changes can be calculated by APE(8) Response to calculated changes (a6, above) can be monitored by shear-wave splitting (a5, above), and the response
controlled by feedback by adjusting changes to optimise the response
(b) Specific implicationsImplications for hydrocarbon exploration and production
(1) Reservoir properties may change from place to place(2) Reservoir properties may change with time, even without production processes(3) Relevant properties need to be measured at the place and time they are needed(4) Response to known changes can be calculated and predicted(5) Response of a reservoir can be controlled, in the sense of a8, above(6) Possibility of long-range and long-time correlations across and between reservoirs(7) There is a limit to the temporal and spatial resolution of any particular measurement
(c) Implications for earthquake geophysics(1) Deterministic prediction of time, magnitude, and place of large earthquakes is likely to be impossible(2) With sufficient source seismicity or appropriate cross-hole SMS observations, times and magnitudes of future largeearthquakes can be stress-forecast. Other information may then indicate location(3) In presence of sufficient source seismicity, or appropriate cross-hole SMS observations, times of future volcanic eruptionscan be stress-forecast(4) There is the possibility of long-range and long-time correlations between earthquakes
(d) Implications for rock physics(1) Much of the behaviour in stress-cells in the rock-physics laboratory can be modelled and predicted by APE
stress-field, whereas macrocracks have fixed orientations determined by a previous stress-field, and do not havea dynamic response to changes of stress.
(2) Shear-wave splitting in the uppermost mantle is caused by films of hydrologised melt. Following Hess[8],most seismologists consider that the shear-wave splitting in the upper mantle is due to aligned crystals knownas lattice-preferred orientation (LPO). In fact the typical parameters of shear-wave splitting in the mantle areremarkably similar to those of the crack-induced shear-wave splitting in the crust. In the mantle there is the samestress (or flow) aligned polarisations, and the same range of shear-wave velocity-anisotropy with a minimum ofabout 1% and a maximum of about 5% compared to the 1.5–4.5% range observed in the crust (Table 1). Petrologysuggests there is up to 0.1 wt.% water in the upper 400 km of the mantle[72] which promotes melting. Whencrystals melt, they first melt along grain boundaries, and it has been shown experimentally[73] that in the presenceof triaxial stress the melt appears as films of liquid melt along grain boundaries for the appropriate dihedralangles. Such films of melt, like the fluid-saturated microcracks in the crust, would be aligned perpendicular tothe direction of minimum stress, exactly analogous to the fluid-saturated grain-boundary cracks in the crust. Inthe mantle the fluid is water-induced melt rather than the water-based salt solution saturating cracks in the crust.Note that crack-induced shear-wave splitting for thin cracks is almost independent of porosity and aspect-ratio

S. Crampin, S. Peacock / Wave Motion 41 (2005) 59–77 75
[33], and the water-induced melt expected in the upper mantle will yield aspect-ratios sufficient to eliminatetangential shear coupling across cracks and induce shear-wave splitting.
Note that observations of shear-wave splitting do not give any direct information about the location of theanisotropy along the ray path. However it is generally consistent with other observations that mantle anisotropy isconfined to the uppermost 400 km, the approximate depth of the olivine-spinel phase change at 415–445 km[74].
Note also that polarisations of the faster split shear-wave in the mantle are generally found to be aligned withthe presumed direction of flow of the heavily viscous mantle material. If mantle shear-wave spitting is oriented bystress-aligned films of hydrologised melt as suggested above, the polarisations will be perpendicular to the directionof minimum stress. Hence observations suggest that the direction of minimum stress is orthogonal to the directionof flow, implying that the mantle is pushed by spreading centres rather than pulled by subduction.
8. Conclusions
These various studies of shear-wave splitting in an anisotropic cracked Earth, including many hundreds of papersnot referenced here, are probably the most comprehensive investigation of wave propagation in any anisotropicmaterial. Stress-aligned shear-wave splitting is now expected in almost all rocks in the crust and the uppermost400 km of the mantle. Our understanding of shear-wave splitting in the Earth’s crust, and its association with rockdeformation, has advanced substantially in the last year or two, as the essential crack-critical nature of the crust hasbecome better understood.
The implication is that the crust and uppermost 400 km of the mantle are critical systems of closely spacedfluid-saturated microcracks with great sensitivity to changing conditions. This ability to monitor low-level deforma-tion, might well be the most fundamental advance in solid Earth geophysics for several decades, and is the drivingforce for the developments reviewed in this paper. Thus, it can be argued that wave-propagation in anisotropicrocks is likely to lead to major changes in geophysical practice by industrial as well as earthquake geophysi-cists. Shear-wave splitting is opening a window into a New Geophysics of the Solid Earth where many effects arecalculable, sometimes predictable, and potentially even controllable[6].
Acknowledgements
We acknowledge with gratitude the vast contribution of all our colleagues in the ideas reported in this review. Thiswork was partially supported by the European Commission SMSITES and PREPARED projects, contract numbersEVR1-CT1999-43002 and EVG1-CT2002-00073, respectively.
References
[1] S. Crampin, A review of wave motion in anisotropic and cracked elastic-media, Wave Motion 3 (1981) 343–391.[2] S. Crampin, R. Evans, B. Üçer, M. Doyle, J.P. Davis, G.V. Yegorkina, A. Miller, Observations of dilatancy-induced polarization anomalies
and earthquake prediction, Nature 286 (1980) 874–877.[3] M. Ando, Y. Ishikawa, H. Wada,S-wave anisotropy in the upper mantle under a volcanic area in Japan, Nature 286 (1980) 43–46.[4] S. Crampin, Shear-wave splitting in a critical crust: the next step, in: P. Rasolofosaon (Ed.), Proceedings of the Eighth International
Workshop on Seismic Anisotropy, Boussens, Rev. Inst. Franc. Pet. 53 (1998) 749–763.[5] S. Crampin, S. Chastin, Shear-wave splitting in a critical crust. II. Compliant, calculable, controllable fluid–rock interactions, in: L.T. Ikelle,
T. Gangi (Eds.), Anisotropy 2000: Fractures, Converted Waves, and Case Studies, Proceedings of the Ninth International Workshop onSeismic Anisotropy, Camp Allen, SEG Open File Publication No. 6, 2001, pp. 21–48.
[6] S. Crampin, S. Chastin, A review of shear-wave splitting in the crack-critical crust, Geophys. J. Int. 155 (2003) 221–240.[7] S. Crampin, S. Chastin, Y. Gao, Shear-wave splitting in a critical crust. III. Preliminary report of multi-variable measurements in active
tectonics, J. Appl. Geophys. 54 (2003) 265–277.

76 S. Crampin, S. Peacock / Wave Motion 41 (2005) 59–77
[8] H. Hess, Seismic anisotropy of the uppermost mantle under oceans, Nature 203 (1964) 629–631.[9] S. Crampin, Higher mode seismic surface waves: propagation in Eurasia, Bull. Seism. Soc. Am. 56 (1966) 1227–1239.
[10] S. Crampin, D.W. King, Evidence for anisotropy in the uppermost mantle beneath Eurasia from the polarization of higher mode seismicsurface waves, Geophys. J. Roy Astron. Soc. 49 (1977) 59–85.
[11] S. Crampin, The dispersion of surface waves in multilayered anisotropic media, Geophys. J. Roy. Astron. Soc. 21 (1970) 387–402.[12] S. Crampin, D.B. Taylor, The propagation of surface waves in anisotropic media, Geophys. J. Roy. Astron. Soc. 25 (1971) 71–87.[13] F. Gilbert, G.E. Backus, Propagator matrices in elastic wave and vibrational problems, Geophysics 31 (1966) 335–356.[14] S. Crampin, Seismic wave propagation through a cracked solid: polarization as a possible dilatancy diagnostic, Geophys. J. Roy. Astron.
Soc. 53 (1978) 467–496.[15] S. Crampin, Effective anisotropic elastic-constants for wave propagation through cracked solids, Geophys. J. Roy. Astron. Soc. 76 (1984)
135–145.[16] J.A. Hudson, Wave speeds and attenuation of elastic waves in material containing cracks, Geophys. J. Roy. Astron. Soc. 64 (1981) 133–150.[17] S. Crampin, I. Bush, C. Naville, D.B. Taylor, Estimating the internal structure of reservoirs with shear-wave VSPs, Lead. Edge 5 (11)
(1986) 35–39.[18] R.M. Alford, Shear data in the presence of azimuthal anisotropy, in: Proceedings of the 56th Annual International SEG Meeting, Houston,
Expanded Abstracts, Dilley, Texas, 1986, pp. 476–479.[19] S. Crampin, The fracture criticality of crustal rocks, Geophys. J. Int. 118 (1994) 428–438.[20] S. Crampin, Anisotropists Digest 149 and 150, [email protected].[21] D. Winterstein, Anisotropists Digest 147, [email protected].[22] M.K. Savage, Seismic anisotropy and mantle deformation: what have we learned from shear wave splitting? Rev. Geophys. 37 (1999)
65–106.[23] S. Crampin, R. Evans, S.B. Üçer, Analysis of records of local earthquakes: the Turkish dilatancy projects (TDP1 and TDP2), Geophys. J.
Roy. Astron. Soc. 83 (1985) 1–16, 17–30, 31–45, 47–64, 61–73, 75–92.[24] T. Volti, S. Crampin, A four-year study of shear-wave splitting in Iceland. 1. Background and preliminary analysis, in: D.A. Nieuwland
(Ed.), New Insights into Structural Interpretation and Modelling, Geol. Soc. Lond., Spec. Publ. 212 (2003) 117–133.[25] T. Volti, S. Crampin, A four-year study of shear-wave splitting in Iceland. 2. Temporal changes before earthquakes and volcanic eruptions,
in D.A. Nieuwland (Ed.), New Insights into Structural Interpretation and Modelling, Geol. Soc. Lond., Spec. Publ. 212 (2003) 135–149.[26] S. Crampin, Anisotropy and transverse isotropy, Geophys. Prosp. 34 (1986) 94–99.[27] I. Tsvankin, Seismic Signatures and Analysis of Reflection Data in Anisotropic Media, Pergamon Press, Amsterdam, 2001.[28] D. Winterstein, G.S. De, VTI documented, Geophysics 66 (2001) 237–245.[29] N.I. Christensen, Compressional wave velocities in metamorphic rocks at pressures to 10 kilobars, J. Geophys. Res. 70 (1965) 4164–6147.[30] N.I. Christensen, Shear wave velocities in metamorphic rocks at pressures to 10 kilobars, J. Geophys. Res. 71 (1966) 3556–5349.[31] S. Kaneshima, M. Ando, S. Crampin, Shear-wave splitting above small earthquakes in the Kinki District of Japan, Phys. Earth Planet. Inter.
45 (1987) 45–58.[32] S.V. Zatsepin, S. Crampin, Modelling the compliance of crustal rock. I. Response of shear-wave splitting to differential stress, Geophys. J.
Int. 129 (1997) 477–494.[33] S. Crampin, S.V. Zatsepin, Modelling the compliance of crustal rock. II. Response to temporal changes before earthquakes, Geophys. J.
Int. 129 (1997) 495–506.[34] S. Crampin, S.V. Zatsepin, Production seismology: the use of shear waves to monitor and model production in a poro-reactive and interactive
reservoir, in: Proceedings of the 65th Annual International SEG Meeting, Houston, Expanded Abstracts, 1995, pp. 199–202.[35] S. Crampin, Calculable fluid–rock interactions, J. Geol. Soc. 156 (1999) 501–514.[36] A. Bruce, D. Wallace, Critical point phenomena: universal physics at large length scale, in: P. Davies (Ed.), The New Physics, Cambridge
University Press, 1989, pp. 236–267.[37] H.D. Garbin, L. Knopoff, The compressional modulus of a material permeated by a random distribution of free circular cracks, Quart.
Appl. Math. 30 (1973) 453–464;H.D. Garbin, L. Knopoff, The compressional modulus of a material permeated by a random distribution of free circular cracks, Quart.Appl. Math. 33 (1975) 296–300;H.D. Garbin, L. Knopoff, The compressional modulus of a material permeated by a random distribution of free circular cracks, Quart.Appl. Math. 33 (1975) 301–303.
[38] S. Crampin, J.H. Lovell, A decade of shear-wave splitting in the Earth’s crust: what does it mean? What use can we make of it? and whatshould we do next? Geophys. J. Int. 107 (1991) 387–407.
[39] S. Crampin, Arguments for EDA, Can. J. Expl. Geophys. 29 (1993) 18–30.[40] D.C. Booth, S. Crampin, Shear-wave polarizations on a curved wavefront at an isotropic free-surface, Geophys. J. Roy. Astron. Soc. 83
(1985) 31–45.[41] S. Crampin, A review of the effects of crack geometry on wave propagation through aligned cracks, Can. J. Expl. Geophys. 29 (1993) 3–17.[42] S. Peacock, S. Crampin, D.C. Booth, J.B. Fletcher, Shear-wave splitting in the Anza seismic gap, southern California: temporal variations
as possible precursors, J. Geophys. Res. 93 (1988) 3339–3356.[43] S. Crampin, D.C. Booth, R. Evans, S. Peacock, J.B. Fletcher, Changes in shear wave splitting at Anza near the time of the North Palm
Springs Earthquake, J. Geophys. Res. 95 (1990) 11197–11212.

S. Crampin, S. Peacock / Wave Motion 41 (2005) 59–77 77
[44] S. Crampin, D.C. Booth, R. Evans, S. Peacock, J.B. Fletcher, Comment on “Quantitative measurements of shear wave polarizations at theAnza Seismic Network, Southern California: implications for shear wave splitting and earthquake prediction” by R.C. Aster, P.M. Shearer,J. Berger, J. Geophys. Res. 96 (1991) 6403–6414.
[45] Y. Gao, S. Crampin, Observations of stress relaxation before earthquakes, Geophys. J. Int. 157 (2004) 578–582.[46] S. Crampin, T. Volti, R. Stefánsson, A successfully stress-forecast earthquake, Geophys. J. Int. 138 (1999) F1–F5.[47] L. Thomsen, Elastic anisotropy due to aligned cracks in porous rock, Geophys. Prosp. 43 (1995) 805–829.[48] T. Pointer, E. Liu, J.A. Hudson, Seismic wave propagation in cracked porous media, Geophys. J. Int. 142 (2000) 193–198.[49] G.M. Mavko, A. Nur, Melt squirt in the asthenosphere, J. Geophys. Res. 80 (1975) 1444–1448.[50] E. Angerer, S. Crampin, X.-Y. Li, T. Davis, Processing, modelling, and predicting time-lapse effects of overpressured fluid-injection in a
fractured reservoir, Geophys. J. Int. 149 (2002) 267–280.[51] M.C. Mueller, Prediction of lateral variability in fracture intensity using multicomponent shear-wave surface seismic as a precursor to
horixontal drilling in the Austin Chalk, Geophys. J. Int. 107 (1991) 409–415.[52] S. Crampin, R. Evans, B.K. Atkinson, Earthquake prediction: a new physical basis, Geophys. J. Roy. Astron. Soc. 76 (1984) 147–156.[53] M. Chapman, Frequency dependent anisotropy due to meso-scale fractures in the presence of equant porosity, Geophys. Prosp. 51 (2003)
369–379.[54] S. Maultzsch, M. Chapman, E. Liu, X.-Y. Li, Modelling frequency dependent seismic anisotropy in fluid-saturated rock with aligned
fractures: implication of fracture size estimation from anisotropic measurements, Geophys. Prosp. 51 (2003) 381–392;S. Maultzsch, M. Chapman, E. Liu, X.-Y. Li, The potential of measuring fracture sizes with frequency-depoendent shear-wave splitting,First Break 21 (2003) 45–51.
[55] S. Crampin, S.V. Zatsepin, C. Slater, L.Y. Brodov, Abnormal shear-wave polarizations as indicators of pressures and over pressures, in:Proceedings of the 58th Conference, EAGE, Amsterdam, Extended Abstracts, 1996, p. X038.
[56] T.L. Davis, R.D. Benson, S.L, Roche, D. Talley, 4-D 3-C seismology and dynamic reservoir characterization—a geophysical renaissance,in: Proceedings of the 67th Annual International SEG Meeting, Dallas, Expanded Abstracts, vol. 1, 1997, pp. 880–889.
[57] Y. Liu, D.C. Booth, S. Crampin, R. Evans, P. Leary, Shear-wave polarizations and possible temporal variations in shear-wave splitting atParkfield, Can. J. Expl. Geophys. 29 (1993) 380–390.
[58] S. Crampin, T. Volti, S. Chastin, A. Gudmundsson, R. Stefánsson, Indication of high pore-fluid pressures in a seismically-active fault zone,Geophys. J. Int. 151 (2002) F1–F5.
[59] S. Crampin, S. Peacock, Y. Gao, S. Chastin, The scatter of time-delays in shear-wave splitting above small earthquakes, Geophys. J. Int.156 (2004) 39–44.
[60] S. Crampin, Comments on “Local shear wave observations in João Camara, northeast Brazil” by A. F. do Nascimento, R. G. Pearce, andM. K. Takeya, J. Geophys. Res. 109 (2004) B02313.
[61] A.F. do Nascimento, R.G. Pearce, M.K. Takeya, Local shear wave observations in João Camara, northeast Brazil, J. Geophys. Res. 107(2002) B10, ESE 8-1-9.
[62] R.H. Sibson, Controls on low-stress hydro-fracture dilatancy in thrust, wrench and normal faults terrains, Nature 289 (1981) 665–667.[63] R.H. Sibson, Rupture nucleation on unfavorably oriented faults, Bull. Seism. Soc. Am. 80 (1990) 1580–1604.[64] J.R. Rice, Fault stress states, pore pressure distribution, and the weakness of the San Andreas fault, in B. Evans, T.-F. Wong (Eds.), Fault
Mechanics and Transport Properties of Rocks, Academic Press, San Diego, 1992, pp. 475–503.[65] S. Hickman, R.H. Sibson, R. Bruhn, Introduction to special section: mechanical involvement of fluids in faulting, J. Geophys. Res. 100
(1995) 12,831–12,840.[66] http://www.icdp-online.de/sites/sanandreas/objectives/objectives.html.[67] S. Crampin, The New Geophysics: shear-wave splitting provides a window into the crack-critical rock mass, The Lead. Edge 22 (2003)
536–550.[68] S. Ma, Modern Theory of Critical Phenomena, Frontiers in Physics, Benjamin-Cummings, 1976.[69] H.J. Jensen, Self-organized Criticality, Cambridge University Press, 1998.[70] P. Bak, How Nature Works, Springer-Verlag, New York, 1996.[71] S. Crampin, Developing stress-monitoring sites using cross-hole seismology to stress-forecast the times and magnitudes of future
earthquakes, Tectonophysics 338 (2001) 233–245.[72] D. Bercovici, S.-I. Karato, Whole-mantle convection and the transition-zone water filter, Nature 425 (2003) 39–44.[73] M.J. Daines, D.L. Kohlstedt, Influence of deformation on melt topology in peridotites, J. Geophys. Res. 102 (1997) 10257–10271.[74] G.C. Brown, A.E. Mussett, The Inaccessible Earth, 2nd ed., Chapman & Hall, London, 1993.