Review of recent nancial report - Australian Accounting ... · Cutting the clutter Review of recent...
22
Cutting the clutter Review of recent financial report de-cluttering trends in the ASX 200 October 2014 kpmg.com.au
-
Upload
phungthien -
Category
Documents
-
view
214 -
download
0
Transcript of Review of recent nancial report - Australian Accounting ... · Cutting the clutter Review of recent...

Cutting the clutterReview of recent financial report
de-cluttering trends in the ASX 200
October 2014
kpmg.com.au
kathleenj
Text Box
AASB 17-18 December 2014 Agenda Paper 3.11 (M142)

Operating and financial reviews: October 2014 2
Foreword – Delivering a clearer messageTimes have changed. For years, many have seen the financial report as a compliance document, requiring a significant amount of resources to prepare that is difficult to understand due to technical jargon used and the abundance of disclosures. This year a number of ASX200 companies have released shorter, de-cluttered financial reporting that represents a positive step forward in delivering a clearer message.Corporate reporting is quickly climbing up the board agenda. Boards are trying to do more with less - challenging themselves on how to clearly articulate their messages to investors and other stakeholders, while using their resources effectively.
The ASX Corporate Governance Council has also put the spotlight on this area, recently releasing the third edition of their principles and recommendations. Principle 4 now states: “Safeguard integrity in corporate reporting – A listed entity should have formal and rigorous processes that independently verify and safeguard the integrity of its corporate reporting.” This principle explicitly puts director responsibility in the context of all corporate reporting.
KPMG Australia has been working closely with a number of companies in helping them cut the clutter from their financial and other corporate reporting, obtain quick wins in their goal of delivering a clearer message to the capital markets and in managing stakeholder engagement through this process.
We hope this publication encourages other companies to take up the challenge of producing clearer, de-cluttered financial and other corporate reports that focus on key performance measures and disclosures. Whilst for some this may take a “leap of faith”, the outcome should be a better quality financial report that is more focused on what is important to the reader. Organisations will then be ready to take next steps and de-clutter the entire corporate reporting portfolio, improve the user experience, reduce reporting costs and enhance capital allocation.
Bernie Szentirmay Partner
© 2014 KPMG, an Australian partnership. All rights reserved. October 2014. NSW N12375AUD.

Operating and financial reviews: October 2014 3
The Changing Corporate Reporting Landscape in 2014• International Integrated Reporting Framework released• B20 recommend G20 endorse corporate reporting reform to
underpin more infrastructure investment• ASX Corporate Governance Principle 4 amended to embrace all
corporate reporting• Director liability being addressed• Government asked to look at volume and complexity in corporate
reporting to support voluntary cutting the clutter initiative• Integrated Reporting Assurance Framework deliberations
kick off globally
Foreword 2
Introduction 4
The principles of Cutting the Clutter 5
Results 6
Practical application 7
Standard setters and regulators 9
KPMG – How we can help 10
Appendix 1 – Our methodology 11
Appendix 2 – Example reporting 12
Contents
© 2014 KPMG, an Australian partnership. All rights reserved. October 2014. NSW N12375AUD.
Operating and financial reviews: October 2014 4© 2014 KPMG, an Australian partnership. All rights reserved. October 2014. NSW N12375AUD.
Introduction – About this reportThis report is designed to raise awareness and assist companies that are assessing whether to embrace the “cutting the clutter” trend in financial reporting, either in isolation or as part of a broader project to improve the quality of corporate reporting.
A significant shift in Australian corporate reporting has occurred in recent times, taking external reporting beyond its traditional emphasis on compliance:
• International and local accounting bodies are talking about de-cluttering and the need to re-focus disclosures in financial reports• ASIC released RG 247 Effective disclosure in an operating and financial review (OFR) in 2013, and have challenged organisations to better explain business models, operations, risks, strategies, financial results and future prospects• G100 has Integrated Reporting as the number one item on its agenda for 2014• ASX Corporate Governance Council’s amendments to principle 4 reflects the reality that financial reporting is no longer the primary corporate reporting tool underpinning capital market analysis and capital allocation decisions
• Companies in the UK, Asia and now in Australia are releasing de-cluttered reports to enable clearer delivery of key financial messages. Cutting the clutter is now being actively embraced by many ASX 200 companies.
For some organisations these changes will prompt them to embark on a journey of corporate reporting reform. As the journey progresses, it should result in more meaningful corporate reporting for report users, less work for report preparers and better information for business and investment decision making. In short, it should help to deliver more transparency at less cost.

Operating and financial reviews: October 2014 5© 2014 KPMG, an Australian partnership. All rights reserved. October 2014. NSW N12375AUD.
The principles of Cutting the Clutter in financial reports are simple:Remove immaterial or irrelevant financial report disclosures that have built up over time
Re-order and re-label accounting policies and detailed notes so that they better reflect the key financial measures and focus areas of most relevance
Re-write technical wording into plain English, whilst still fully complying with relevant accounting standard and regulatory requirements.
We have looked at the emerging trend of companies cutting the clutter within their financial reports over the most recent reporting season, focussing on the ASX 200. This publication highlights entities that have reduced and/or reconfigured content, using company specific examples.
Our review revealed the following results:
• Whilst new accounting standards have increased disclosure, some companies have been able to “buck the trend”, reducing their total financial report page count compared to the prior year
• 50% of organisations have financial reports that are shorter in length than the prior period• 37% of organisations were able to reduce the number of notes to the financial statements
compared to the prior period• 19% of organisations have re-ordered their flow of notes to the financial statements, and
10% have used subheadings and re-grouped notes to focus attention on specific items of disclosure.
These results indicate that many entities in the ASX 200 have started to embrace de-clutteringthe annual financial report. Refer to Appendix 1 for a summary of individual entity details, and Appendix 2 for a selection of company specific examples of financial report de-cluttering.

Decrease37%
Increase32%
No change31%
Decrease50%
Increase40%
No change10%
No90%
Yes10%
No90%
Yes10%
Yes19%
No81%
Decrease37%
Increase32%
No change31%
Decrease50%
Increase40%
No change10%
No90%
Yes10%
No90%
Yes10%
Yes19%
No81%
Decrease37%
Increase32%
No change31%
Decrease50%
Increase40%
No change10%
No90%
Yes10%
No90%
Yes10%
Yes19%
No81%
Decrease37%
Increase32%
No change31%
Decrease50%
Increase40%
No change10%
No90%
Yes10%
No90%
Yes10%
Yes19%
No81%
Decrease37%
Increase32%
No change31%
Decrease50%
Increase40%
No change10%
No90%
Yes10%
No90%
Yes10%
Yes19%
No81%
Operating and financial reviews: October 2014 6© 2014 KPMG, an Australian partnership. All rights reserved. October 2014. NSW N12375AUD.
Results – Organisations are starting to cut the clutter
Remove
Re-label & Reorder
REDUCED NUMBER OF PAGES89 organisations reduced their total page numbers, with 46 organisations reducing the number of pages by more than 5, despite the suite of new accounting standards becoming effective for periods beginning on or after 1 January 2013 which added to disclosure requirements.
MAKING ACCOUNTS EASIER TO FOLLOW
18 companies have grouped notes to the financial statements into categories, such as Result for the year, Operating Assets and Liabilities, Capital Management and Financing, and other notes. In addition, 33 companies re-ordered their notes compared to the prior year.
DE-CLUTTERING NOTES
65 organisations reduced the number of notes, with 45 organisations reducing the number of notes by more than 2.
Rewrite
DID THE FINANCIAL REPORT USE NEW SUB-HEADINGS TO GROUP NOTES TOGETHER?
HAS THE ORDER OF THE NOTES TO THE FINANCIAL STATEMENTS CHANGED FROM PRIOR YEAR?
WAS THERE ANY EVIDENCE TO SUGGEST THAT THE ENTITY HAD TRIED TO SIMPLIFY THE LANGUAGE USED IN FINANCIAL REPORT DISCLOSURES?
Most common simplification observed was in relation to accounting policy wording.
* Note: Numbers and percentages exclude entities that have not yet released 2014 financial reports and certain other entities where data was not available
Operating and financial reviews: October 2014 7© 2014 KPMG, an Australian partnership. All rights reserved. October 2014. NSW N12375AUD.
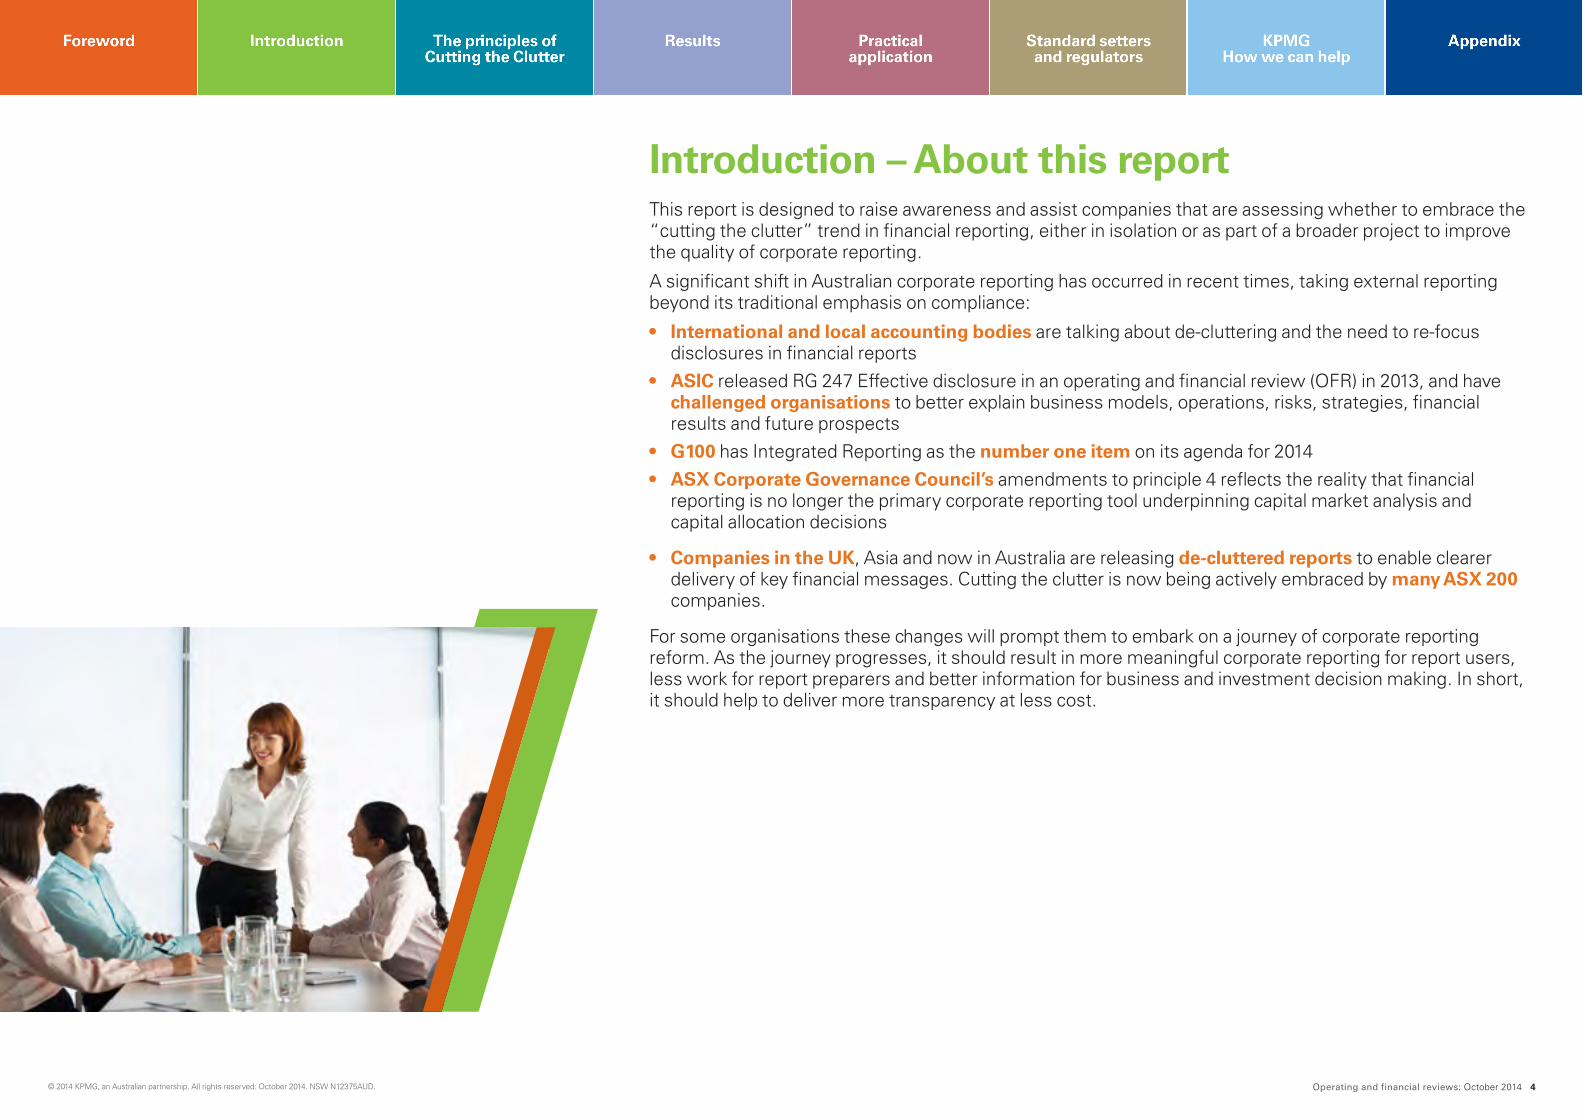
Practical application – the pathway to successful de-cluttering
Financial reportThe results of our analysis indicate that de-cluttering the financial report is a scalable activity with application so far by Australian ASX 200 listed companies varying from simply removing immaterial disclosures, to more extensive re-ordering and grouping of notes and including plain English explanations.
Corporate reporting Successful de-cluttering does not stop with the financial report. While cutting the clutter can be a logical first step for many companies in improving the clarity of reporting, the financial report only tells a small part of the story. To maximise the benefits of de-cluttering, companies should consider if their annual report and wider corporate reporting portfolio could also benefit from being redesigned and streamlined to more clearly and concisely communicate how they create value in the short, medium and long term.
Improving corporate reporting is a journey and is likely to be completed in several stages, occurring over a number of reporting periods. The speed at which change is achieved will depend on the driver of the change, i.e., industry best practice, regulatory drivers such as RG247 and ASX Corporate Governance Principles and Recommendations which have mandatory commencement dates, the appetite of the board and senior management, the take-up of market-driven initiatives such as Integrated Reporting <IR>, and the capacity within the organisation to implement change.
Remove immaterial disclosures
Move accounting policies and/or
simplify wording
Group notes & re-order
Add additional information and
plain English explanations
Potential timeline and drivers of change:
2014 Key Driver: RG247
• Further enhancements to the OFR, improving disclosure around strategy and prospects for future financial years, including material business risks
2015 Key Driver: ASX Corporate Governance Principles and Recommendations (third edition)
• Directors are now responsible for the integrity of all corporate reporting under Principle 4
• Increased disclosure of economic, environmental and social sustainability risks and how they are managed in the Corporate Governance Statement
2016 Potential Driver:
• Increase pressure from market leaders and early adopters of the International Integrated Reporting <IR>Framework
2017+ Potential Driver:
• Endorsement of the International Integrated Reporting <IR> Framework • Development of a ‘flagship’ report

Operating and financial reviews: October 2014 8© 2014 KPMG, an Australian partnership. All rights reserved. October 2014. NSW N12375AUD.
Practical application – the pathway to successful de-cluttering
CFOs should ask themselves …
Keys to success are …
Achieve quick wins by …
1. Are our financial reports cluttered with technical jargon that investors either don’t need to know or don’t understand?
2. Are our financial reports structured in a way that focuses investors on what I think they should focus on?
3. Are our financial reports easy to read? Do they include immaterial, redundant or boiler-plate disclosures that don’t add anything?
4. Are our financial reports longer than they need to be?
5. Do we want to try and save costs in preparing our financial reports?
Companies who have undertaken this process highlight the need for strong stakeholder engagement across the finance team, investor relations, audit committee and relevant external users in order to gain support and manage expectations.
Whilst for some it may take a ‘leap of faith’ to embrace the de-cluttering process, the end product should be a clearer and more focused document that will better tell your story.
• Identifying accounting policies that do not relate to the prior or current year financial performance or position and remove
• Move accounting policies to the related financial statement note, e.g. revenue accounting policy with the revenue note, to improve clarity
• Order notes in level of importance to investors – important information should be read first
• Group like notes together – presenting a holistic view of key financial reporting focus areas, e.g. tax expense with deferred tax balances
• Reword boiler-plate disclosure so that it actually describes your business circumstances with minimal technical jargon
Operating and financial reviews: October 2014 9© 2014 KPMG, an Australian partnership. All rights reserved. October 2014. NSW N12375AUD.
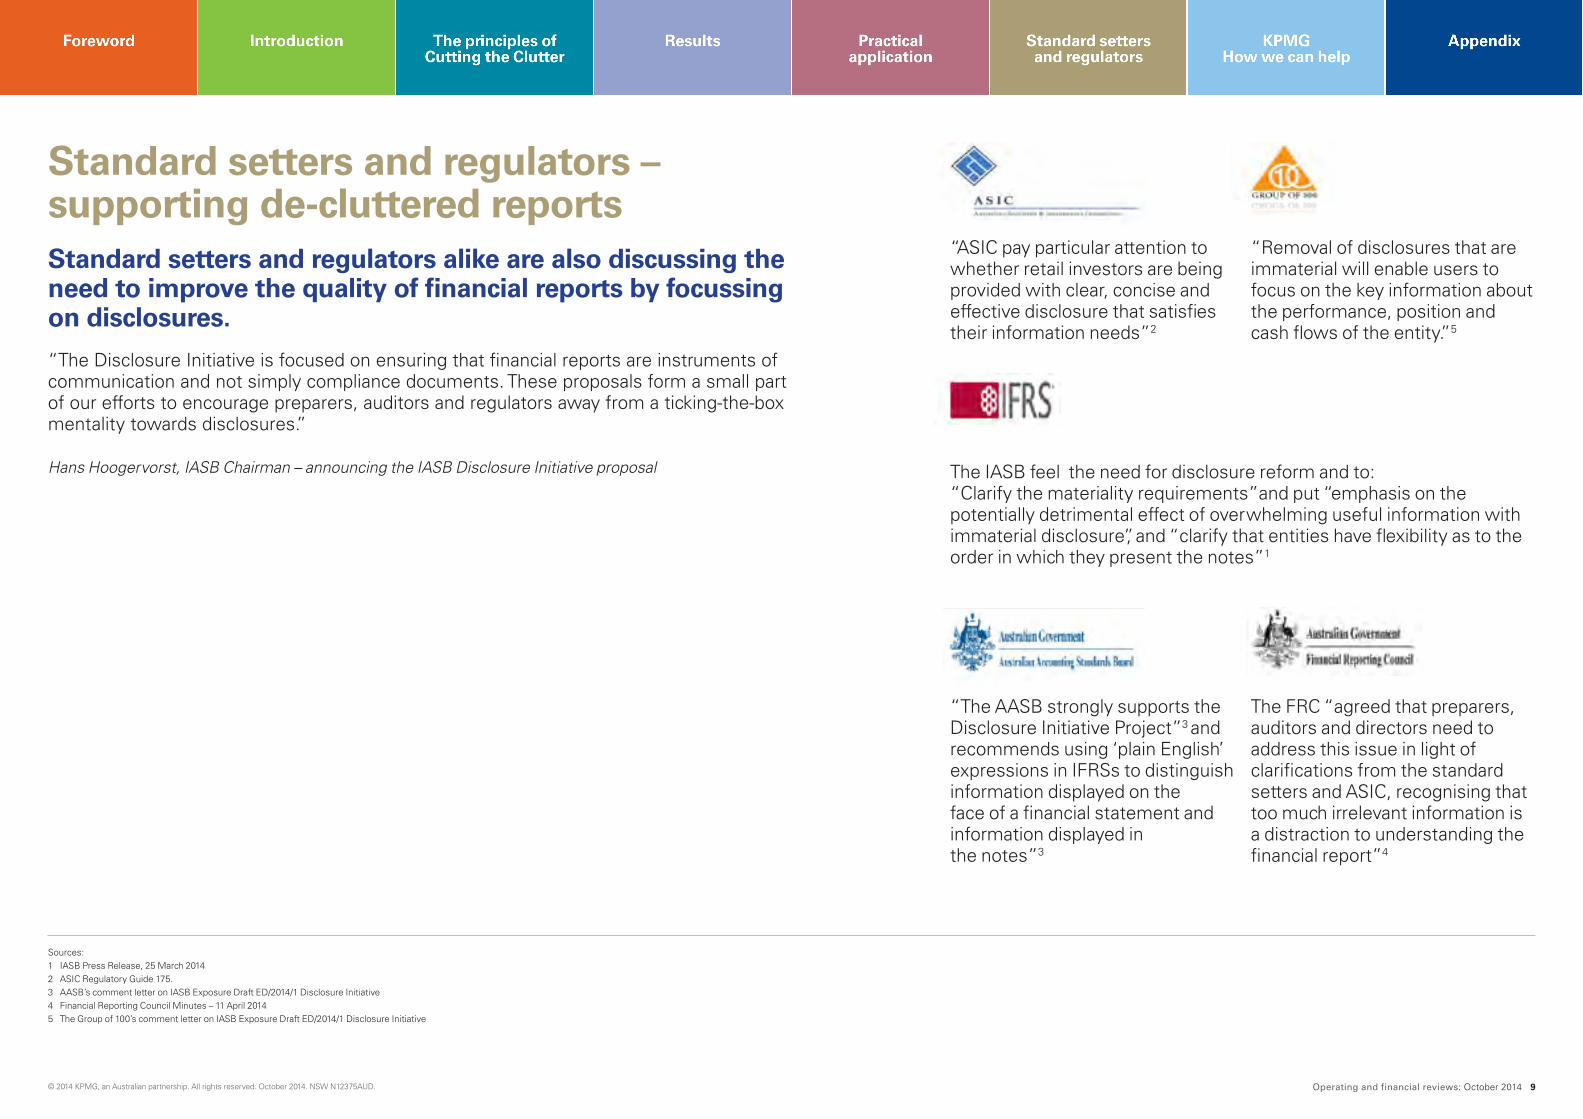
Standard setters and regulators – supporting de-cluttered reportsStandard setters and regulators alike are also discussing the need to improve the quality of financial reports by focussing on disclosures.
“The Disclosure Initiative is focused on ensuring that financial reports are instruments of communication and not simply compliance documents. These proposals form a small part of our efforts to encourage preparers, auditors and regulators away from a ticking-the-box mentality towards disclosures.”
Hans Hoogervorst, IASB Chairman – announcing the IASB Disclosure Initiative proposal
“ASIC pay particular attention to whether retail investors are being provided with clear, concise and effective disclosure that satisfies their information needs”2
“The AASB strongly supports the Disclosure Initiative Project”3 and recommends using ‘plain English’ expressions in IFRSs to distinguish information displayed on the face of a financial statement and information displayed in the notes”3
“Removal of disclosures that are immaterial will enable users to focus on the key information about the performance, position and cash flows of the entity.”5
The FRC “agreed that preparers, auditors and directors need to address this issue in light of clarifications from the standard setters and ASIC, recognising that too much irrelevant information is a distraction to understanding the financial report”4
The IASB feel the need for disclosure reform and to:“Clarify the materiality requirements”and put “emphasis on the potentially detrimental effect of overwhelming useful information with immaterial disclosure”, and “clarify that entities have flexibility as to the order in which they present the notes”1
Sources: 1 IASB Press Release, 25 March 20142 ASIC Regulatory Guide 175.3 AASB’s comment letter on IASB Exposure Draft ED/2014/1 Disclosure Initiative4 Financial Reporting Council Minutes – 11 April 20145 The Group of 100’s comment letter on IASB Exposure Draft ED/2014/1 Disclosure Initiative

Operating and financial reviews: October 2014 10© 2014 KPMG, an Australian partnership. All rights reserved. October 2014. NSW N12375AUD.
KPMG – How we can help KPMG can help you streamline your financial reports in a number of ways by providing:
• thought leadership and examples of de-cluttered disclosures• feedback on your current financial reports and how you compare to benchmark companies• management and Audit Committees with insight on the best way to approach the de-cluttering process • assistance in identifying quick wins using our experience from working with clients who have undertaken a de-cluttering process• assistance in drafting de-cluttered financial reports and participating in project workshops and discussions
The contacts at KPMG in connection with this publication are:
Bernie SzentirmayPartner
T: +61 3 9288 5423M: +61 422 005 [email protected]
Michael BrayPartner
T: +61 3 9288 5720M: +61 417 257 [email protected]
Emma RocheSenior Manager
T: +61 2 9455 9257M: +61 407 651 [email protected]
Simon DuboisSenior Manager
T: +61 3 9288 6927M: +61 409 302 [email protected]
The contacts at KPMG in connection with Better Business Reporting are:
Nick RidehalghPartner
T: +61 2 9455 9312M: +61 417 661 [email protected]
Simone SchlitterDirector
T: +61 2 9335 8511M: +61 400 469 [email protected]
Kylie DumbleManager
T: +61 2 9335 7292M: +61 426 966 [email protected]

Operating and financial reviews: October 2014 11© 2014 KPMG, an Australian partnership. All rights reserved. October 2014. NSW N12375AUD.
Appendix 1 – Our methodologyIn preparing this report we have reviewed the most recent annual financial reports of the ASX 200 companies as at 22 October 2014.* The financial reports subject to our review covered the annual reporting periods from 31 December 2013 to 31 August 2014.
The following table shows the organisations for which we could see evidence of applying the de-cluttering principles. In addition, we noted that a number of organisations also simplified wording in their note disclosures.
Ticker Company Notes re-ordered?
Notes reduced?
Page numbers reduced?
AGK AGL Energy Limited √ √ √
AGO Atlas Iron Limited √
AHE Automotive Holdings Group Limited √
AMC Amcor Limited √
ANN Ansell Limited √ √
AOG Aveo Group √ √
ARI Arrium Limited √
ASX ASX Limited √ √ √
AWC Alumina Limited √ √
BCI BC Iron Limited √
BEN Bendigo and Adelaide Bank √ √
BGA Bega Cheese Limited √ √ √
BPT Beach Energy Limited √
CAB Cabcharge Australia Limited √
CBA Commonwealth Bank of Australia √
COH Cochlear Limited √ √
CPU Computershare Limited √
CSL CSL Limited √
DUE Duet Group √
EGP Echo Entertainment Group Limited √ √
FBU Fletcher Building Limited √ √
FDC Federation Centres √ √ √
FLT Flight Centre Limited √ √
FMG Fortescue Metals Group Ltd √ √
FXJ Fairfax Media Limited √
GEM G8 Education Limited √
GMG Goodman Group √ √ √
GWA GWA Group Limited √
Ticker Company Notes re-ordered
Notes reduced?
Page numbers reduced?
HVN Harvey Norman Holdings Limited √
IAG Insurance Australia Group Limited √
IFL IOOF Holdings Limited √ √ √
IGO Independence Group NL √
IIN Iinet Limited √ √
ILU Iluka Resources Limited √ √
IOF Investa Office Fund √
LLC Lend Lease Group √ √
LNG Liquefied Natural Gas Limited √
LYC Lynas Corporation Limited √
MFG Magellan Financial Group Limited √
MGR MIRVAC Group √
MGX Mount Gibson Iron Limited √
MML Medusa Mining Limited √
MSB Mesoblast Limited √ √
MTS Metcash Limited √ √
MTU M2 Group LTD √
NVT Navitas Limited √
ORA Orora Limited √
PBG Pacific Brands Limited √
PDN Paladin Energy LTD √ √
QAN Qantas Airways Limited √
REA REA Group Ltd √
RFG Retail Food Group Limited √
RIO Rio Tinto Limited √
RRL Regis Resources Limited √ √
SDF Steadfast Group Limited √ √
SEK Seek Limited √
Ticker Company Notes re-ordered?
Notes reduced?
Page numbers reduced?
SGM Sims Metal Management Limited √
SGP Stockland √ √ √
SGT Singapore Telecommunications Limited
√ √
SHL Sonic Healthcare Limited √ √
SKT SKY Network Television Limited √
SPK Spark New Zealand Limited √ √ √
SWM Seven West Media Limited √
SXY Senex Energy limited √
TAH Tabcorp Holdings Limited √ √
TLC Transurban Group √
TEN Ten Network Holdings Limited √ √ √
TGR Tassal Group Limited √
TME Trade Me Group Limited √ √ √
TOL Toll Holdings Limited √ √
TPI Transpacific Industries Group Ltd √ √ √
TPM TPG Telecom Limited √ √
TSE Transfield Services Limited √ √ √
TTS Tatts Group Limited √
VED Veda Group Limited √
VRL Village Roadshow Limited √
WES Wesfarmers Limited √ √ √
WHC Whitehaven Coal Limited √
* Excludes entities that have not yet released 2014 financial reports and certain other entities where data was not available, for example; no prior year comparatives

Operating and financial reviews: October 2014 12© 2014 KPMG, an Australian partnership. All rights reserved. October 2014. NSW N12375AUD.
AGL Financial Report 2014
AGL Financial Report 2014 Contents Page Consolidated Statement of Profit or Loss 3 Consolidated Statement of Comprehensive Income 4 Consolidated Statement of Financial Position 5 Consolidated Statement of Changes in Equity 6 Consolidated Statement of Cash Flows 7 Notes to the Consolidated Financial Statements 1 Summary of significant accounting policies 8 2 Significant accounting judgements, estimates and assumptions 21 3 Segment information 23 4 Revenue 28 5 Expenses 28 6 Finance costs 28 7 Income tax 29 8 Dividends 31 9 Trade and other receivables 32 10 Inventories 33 11 Other financial assets 33 12 Other assets 34 13 Investments in associates and joint ventures 34 14 Exploration and evaluation assets 35 15 Oil and gas assets 36 16 Property, plant and equipment 36 17 Intangible assets 38 18 Assets classified as held for sale 40 19 Trade and other payables 41 20 Borrowings 41 21 Provisions 42 22 Other financial liabilities 43 23 Other liabilities 43 24 Issued capital 44 25 Reserves 45 26 Retained earnings 45 27 Earnings per share 46 28 Commitments 46 29 Contingent liabilities and contingent assets 47 30 Remuneration of auditors 47 31 Subsidiaries 48 32 Business combinations 50 33 Joint operations 51 34 Deeds of cross guarantee 52 35 Defined benefit superannuation plans 54 36 Share-based payment plans 57 37 Related party disclosures 62 38 Cash and cash equivalents 63 39 Financial instruments 64 40 Parent entity 73 41 Subsequent events 74 Directors’ Declaration 75 Auditor’s Independence Declaration 76 Independent Auditor’s Report 77
AGL Financial Report 2013
Contents Page
Consolidated Statement of Profit or Loss 3Consolidated Statement of Comprehensive Income 4Consolidated Statement of Financial Position 5Consolidated Statement of Changes in Equity 6Consolidated Statement of Cash Flows 7Notes to the Consolidated Financial Statements 1 - Summary of significant accounting policies 8 2 - Significant accounting judgements, estimates and assumptions 25 3 - Correction of unbilled distribution liability 26 4 - Segment information 27 5 - Revenue 32 6 - Other income 32 7 - Expenses 32 8 - Net financing costs 33 9 - Profit before income tax 3310 - Income tax 3511 - Dividends 3812 - Cash and cash equivalents 3813 - Trade and other receivables (current) 3914 - Inventories (current) 4015 - Other financial assets (current) 4016 - Other assets (current) 4017 - Trade and other receivables (non-current) 4018 - Inventories (non-current) 4019 - Investments accounted for using the equity method 4120 - Exploration and evaluation assets 4321 - Oil and gas assets 4422 - Property, plant and equipment 4523 - Intangible assets 4724 - Other financial assets (non-current) 4925 - Other assets (non-current) 4926 - Trade and other payables (current) 4927 - Borrowings (current) 4928 - Provisions (current) 5029 - Other financial liabilities (current) 5030 - Other liabilities (current) 5031 - Borrowings (non-current) 5032 - Provisions (non-current) 5233 - Other financial liabilities (non-current) 5334 - Other liabilities (non-current) 5335 - Issued capital 5436 - Reserves 5537 - Retained earnings 5638 - Earnings per share (EPS) 5639 - Capital and other expenditure commitments 5740 - Lease commitments 5841 - Contingent liabilities and contingent assets 5942 - Remuneration of auditors 5943 - Subsidiaries 6044 - Acquisition of subsidiaries and businesses 6245 - Disposal of subsidiaries 6546 - Jointly controlled operations and assets 6647 - Deed of cross guarantee 6748 - Key management personnel disclosures 6949 - Defined benefit superannuation plans 7550 - Share-based payment plans 7851 - Related party disclosures 8352 - Cash flow information 8553 - Financial instruments 8654 - Subsequent events 10155 - Parent Entity information 10256 - Net tangible asset backing 103
Directors' Declaration 104Auditor's Independence Declaration 105Independent Auditor's Report 106
AGL Financial Report 20132
Appendix 2 – Example Reporting
Example 1 – AGLAGL’s 2014 financial report is 29 pages shorter and contains 15 less notes compared to the 2013 financial report.
Source: ASX Release – AGL Energy Limited Financial Reports for the year ended 30 June 2014 Date: 20 August 2014
Source: ASX Release – AGL Energy Limited Financial Report Date: 28 August 2013
Remove
Operating and financial reviews: October 2014 13© 2014 KPMG, an Australian partnership. All rights reserved. October 2014. NSW N12375AUD.
NOTES TO THE CONSOLIDATED FINANCIAL STATEMENTS Year ended 30 June 2014
Transfield Services Annual Report 2014 |79
GROUP PERFORMANCE
Operating segments ..................................................................................80
Revenue ........................................................................................................... 84
Expenses ......................................................................................................... 84
Discontinued operations .......................................................................... 85
Earnings / (loss) per share ...................................................................... 86
Subsequent events ..................................................................................... 86
RISK MANAGEMENT
Critical accounting estimates and judgments .................................87
Financial, capital and other risk management ................................ 88
Contingent assets and liabilities ............................................................ 91
Commitments for expenditure .............................................................. 92
WORKING CAPITAL
Trade and other receivables ................................................................... 93
Inventories ......................................................................................................94
Trade and other payables ........................................................................94
CAPITAL EMPLOYED
Employee benefits ...................................................................................... 95
Other provisions .......................................................................................... 95
Interests in joint ventures ......................................................................... 96
Other financial assets ................................................................................ 99
Property, plant and equipment ............................................................. 99
Intangible assets ........................................................................................ 100
BASIS OF PREPARATIONThese consolidated financial statements are general purpose financial statements. They have been prepared in accordance with Australian Accounting Standards and Interpretations issued by the Australian Accounting Standards Board and the Corporations Act 2001. They also comply with IFRS as issued by the International Accounting Standards Board.
Details of the Group’s accounting policies, including changes during the year, are included in the following notes:
• Change in Accounting policies and presentation of comparatives ..........................................................................................................................114
• Summary of significant accounting policies .......................................................................................................................................................................116
NOTE INDEXTAXATION
Income taxes ................................................................................................102
Deferred tax assets ....................................................................................103
Deferred tax liabilities ..............................................................................103
NET DEBT
Cash and cash equivalents .................................................................... 104
Reconciliation of operating profit after income tax to net cash inflow from operating activities .......................................................... 104
Loans and borrowings .............................................................................105
EQUITY
Contributed equity ................................................................................... 106
Share-based payments ........................................................................... 106
Dividends .......................................................................................................108
OTHER INFORMATION
Related party transactions .................................................................... 109
Remuneration of auditors ........................................................................110
GROUP STRUCTURE
Subsidiaries ....................................................................................................110
Deed of cross guarantee ........................................................................... 111
Parent entity financial information ...................................................... 113
102 TRANSFIELD SERVICES 2013
NOTES TO AND FORMING PART OF THE CONSOLIDATED FINANCIAL STATEMENTSFOR YEAR ENDED 30 JUNE 2013
NOTES Page number
Note 1. Summary of significant accounting policies 103
Note 2. Financial, capital and other risk management 121
Note 3. Critical accounting estimates and judgements 127
Note 4. Operating segments 128
Note 5. Revenue 132
Note 6. Impairment 133
Note 7. Expenses 133
Note 8. Income taxes 134
Note 9. Cash and cash equivalents 135
Note 10. Trade and other receivables 135
Note 11. Inventories 136
Note 12. Prepayments and other assets 136
Note 13. Other financial assets 136
Note 14. Property, plant and equipment 136
Note 15. Deferred tax assets 137
Note 16. Intangible assets 139
Note 17. Trade and other payables 142
Note 18. Loans and borrowings 142
Note 19. Employee benefits 143
Note 20. Derivatives 143
Note 21. Other provisions 144
Note 22. Deferred tax liabilities 146
Note 23. Contributed equity 147
Note 24. Non-controlling interest 148
Note 25. Dividends 149
Note 26. Related party transactions 149
Note 27. Key management personnel 152
Note 28. Business combinations 156
Note 29. Investment in associate 158
Note 30. Interests in joint ventures and partnerships 159
Note 31. Reconciliation of operating profit after income tax to net cash inflow from operating activities 161
Note 32. Earnings / (loss) per share 162
Note 33. Remuneration of auditors 163
Note 34. Events occurring after statement of financial position date 163
Note 35. Contingent assets and liabilities 163
Note 36. Commitments for expenditure 165
Note 37. Share based payments 166
Note 38. Deed of cross guarantee 169
Note 39. Parent entity financial information 171
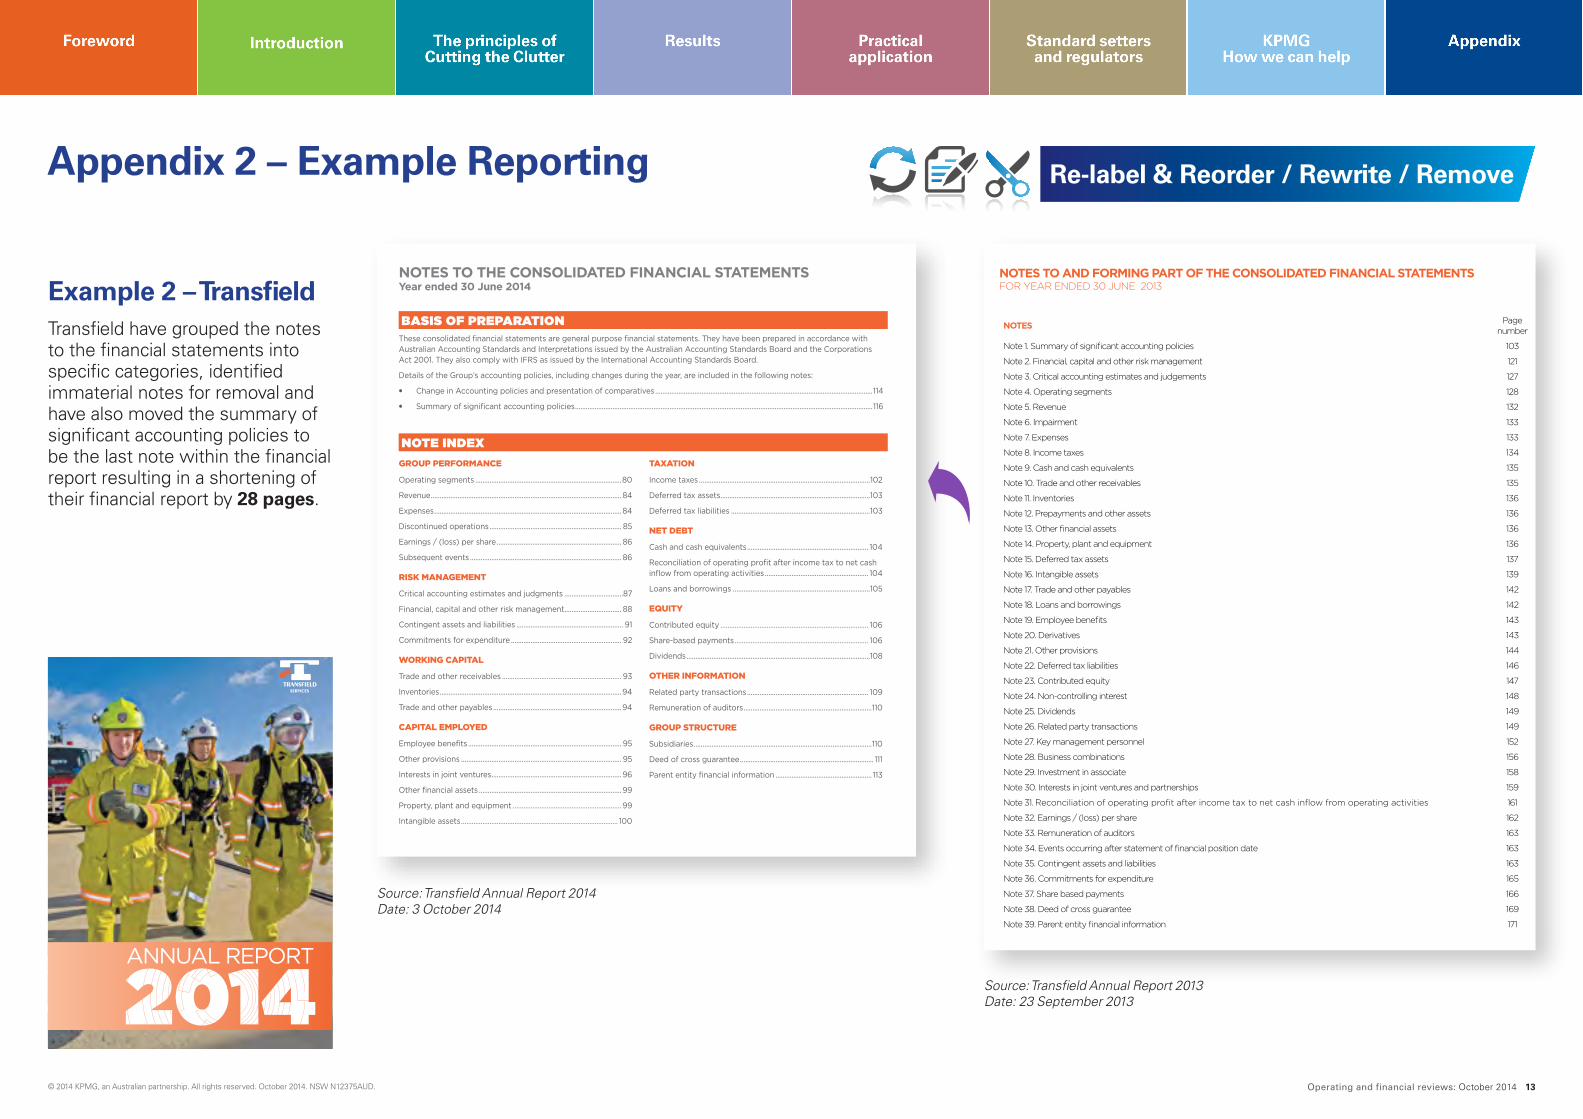
Source: Transfield Annual Report 2013Date: 23 September 2013
Example 2 – TransfieldTransfield have grouped the notes to the financial statements into specific categories, identified immaterial notes for removal and have also moved the summary of significant accounting policies to be the last note within the financial report resulting in a shortening of their financial report by 28 pages.
Source: Transfield Annual Report 2014Date: 3 October 2014
Transfield
Services Limited
69
00
0 4
84
417
A
NN
UA
L REPO
RT 20
14
ANNUAL REPORT
Re-label & Reorder / Rewrite / RemoveAppendix 2 – Example Reporting

Operating and financial reviews: October 2014 14© 2014 KPMG, an Australian partnership. All rights reserved. October 2014. NSW N12375AUD.
notes to the FinanCial statements1. summary oF signiFiCant aCCounting PoliCies
The principal accounting policies adopted in the consolidated financial report’s preparation are set out below. These policies have been consistently applied to all the years presented, except as stated below. The financial report is for the consolidated entity consisting of Flight Centre Limited (FLT) and its subsidiaries.
Presentation of transactions recognised in other comprehensive incomeFrom 1 July 2012, FLT applied amendments to AASB 101 Presentation of Financial Statements outlined in AASB 2011–9 Amendments to Australian Accounting Standards – Presentation of Items of Other Comprehensive Income. The change in accounting policy only relates to disclosures and has no impact on consolidated earnings per share or net income. The changes have been applied retrospectively and require the group to separately present those items of other comprehensive income that may be reclassified to profit or loss in the future from those that will never be reclassified to profit and loss. These changes are included in the statement of comprehensive income.
Presentation of expenses in consolidated income statementFor the half year ended 31 December 2012 and going forward, the group has voluntarily changed the presentation of expenses in the consolidated income statement from function to nature. The group determined the further disclosure of the nature of the expenses provided more relevant information to the financial statements’ users.
The prior year expense presentation by function cannot be readily mapped into the nature as presented currently for the prior year. As such, the detail of the reclassifications has not been disclosed.
The adjustment is shown in the consolidated income statement and the comparative amounts in the prior period have also been adjusted to show the nature of the expense. The amount of expenses recorded in each period presented has not changed, only the presentation has changed.
(a) Basis of preparationThis general purpose financial report has been prepared in accordance with Australian Accounting Standards and interpretations issued by the Australian Accounting Standards Board and the Corporations Act 2001. FLT is a for–profit entity for the purpose of preparing the financial statements.
Compliance with IFRSThe group’s consolidated financial statements also comply with International Financial Reporting Standards (IFRS), as issued by the International Accounting Standards Board (IASB).
New & amended standards adopted by the groupNone of the new standards and amendments of standards that are mandatory for the first time for the financial year beginning 1 July 2012 affected any of the amounts recognised in the current period or any prior period and are not likely to affect future periods.
Early adoption of standardsThe group has not elected to apply any pronouncements before their operative date in the annual reporting period beginning 1 July 2012.
Historical cost conventionThese financial statements have been prepared under the historical cost convention, as modified by the revaluation of available‑for‑sale financial assets and financial assets and liabilities (including derivative financial instruments) at fair value through profit and loss.
Critical accounting estimatesThe preparation of financial statements in conformity with Australian Accounting Standards requires the use of certain critical accounting estimates. It also requires management to exercise its judgment when applying the group’s accounting policies. The areas involving a higher degree of judgment or complexity or areas where assumptions and estimates are significant to the financial statements are disclosed in note 2.
(B) Principles of consolidation
(i) SubsidiariesThe consolidated financial statements incorporate the assets and liabilities of all FLT subsidiaries at 30 June 2013 and the subsidiaries’ results for the year then ended. FLT and its subsidiaries together are referred to in this financial report as the group or the consolidated entity.
Subsidiaries are entities (including special purpose entities) over which the group has the power to govern the financial and operating policies. The existence and effect of potential voting rights that are currently exercisable or convertible are considered when assessing whether the group controls another entity.
Subsidiaries are fully consolidated from the date on which control is transferred to the group and are deconsolidated when that control ceases.
The acquisition method of accounting is used to account for the group’s acquisition of subsidiaries (refer to note 1(g)).
Intercompany transactions, balances and unrealised gains on transactions between group companies are eliminated. Unrealised losses are also eliminated unless the transaction provides evidence of the transferred asset’s impairment. Subsidiaries’ accounting policies have been changed, where necessary, to ensure consistency with the group’s policies.
Non–controlling interests in the results and equity of subsidiaries are shown separately in the consolidated balance sheet, income statement, statement of comprehensive income and statement of changes in equity respectively.
Investments in subsidiaries are accounted for at cost in FLT’s individual financial statements.
(ii) AssociatesAssociates are all entities over which the group has significant influence but not control or joint control. Investments in associates are accounted for by the parent using the cost method and in the consolidated financial statements using the equity method of accounting, after initially being recognised at cost. The group’s investment in associates includes goodwill (net of any accumulated impairment loss) identified on acquisition (refer to note 19).
The group’s share of its associates’ post‑acquisition profits or losses is recognised in the income statement and its share of post‑acquisition movements in reserves is recognised in other comprehensive income reserves. The cumulative post‑acquisition movements are adjusted against the investments’ carrying amounts. Dividends receivable from associates are recognised in the parent entity’s income statement. In the consolidated financial statements, they reduce the investments’ carrying amounts.
When the group’s share of losses in an associate equals or exceeds its interest in the associate, including any other unsecured long–term receivables, the group does not recognise further losses, unless it has incurred obligations or made payments on the associate’s behalf.
Unrealised gains on transactions between the group and its associates are
40 ABN 25 003 377 188
Example 3 – Flight CentreFlight Centre have grouped the notes to the financial statements into specific categories. In addition, they provide an introduction to each section and include specific accounting policies in the note dealing with the related balance.
annual report 2013/14
the dawn of a golden era in world travel
Cheaper airfares more airline choice
greater comfortless flying time
Etihad’s The Residence
Source: Flight Centre Limited Annual Report 12/13Date: 27 September 2013
Re-label & Reorder
Source: Flight Centre Travel Group Limited Annual Report 13/14Date: 27 August 2014
Appendix 2 – Example Reporting
notes to the FinanCiaL statements
significant matters in the current reporting period ...........................................................................................................................34
a FinanCiaL overview .....................................................35
A1 Segment information ...........................................................35
A2 Revenue ..............................................................................39
A3 Other income ......................................................................40
A4 Expenses ............................................................................40
A5 Intangible assets ................................................................. 41
A6 Business combinations ........................................................43
B Cash management .......................................................45
B1 Cash and cash equivalents ...................................................45
B2 Available-for-sale (AFS) financial assets ...............................46
B3 Cash & AFS - financial risk management ..............................46
B4 Borrowings .......................................................................... 47
B5 Ratios .................................................................................48
B6 Dividends ............................................................................49
B7 Capital expenditure ..............................................................50
C FinanCiaL risk management .....................................51
C1 Financial risk management................................................... 51
C2 Derivative financial instruments ............................................54
C3 Other financial assets ..........................................................54
d reward and reCognition ...........................................55
D1 Key management personnel .................................................55
D2 Business ownership scheme (BOS) ......................................55
D3 Share-based payments ........................................................56
D4 Contributed equity ...............................................................58
e reLated parties ...........................................................59
E1 Investments accounted for using the equity method ..............59
E2 Related party transactions ...................................................60
F other inFormation ......................................................62
F1 Other expenses ................................................................... 62
F2 Earnings per share ..............................................................63
F3 Trade and other receivables .................................................64
F4 Property, plant and equipment .............................................66
F5 Trade and other payables ..................................................... 67
F6 Financial liabilities at fair value through P&L ..........................68
F7 Provisions ...........................................................................69
F8 Reserves ............................................................................. 70
F9 Tax ..................................................................................... 71
F10 Auditor’s remuneration......................................................... 73
g group struCture .........................................................74
G1 Subsidiaries ........................................................................ 74
G2 Deed of cross guarantee ...................................................... 74
G3 Parent entity financial information.........................................77
h unreCognised items ....................................................79
H1 Commitments ...................................................................... 79
H2 Contingencies ..................................................................... 79
H3 Events occurring after the end of the reporting period ........... 79
i summarY oF aCCounting poLiCies ............................80
FLIGHT CENTRE TRAVEL GROUP LIMITED annuaL report 13/14 33
B caSh ManageMent
FLT has a focus on maintaining a strong balance sheet through increasing cash and investments and reducing debt. The strategy also considers the group’s expenditure, growth and acquisition requirements and the desire to return dividends to shareholders.
B1 Cash and cash equivalents
B2 Available-for-sale (AFS) financial assets
B3 Cash & AFS - financial risk management
B4 Borrowings
B5 Ratios
• Net debt
• Gearing ratio
B6 Dividends
B7 Capital expenditure
B1 caSh and caSh equiVaLentS
Accounting policy
Client cash represents amounts from customers held before release to service and product suppliers.
Additional information on cash accounting policies is included in note I(j).
2014 $’000
2013 $’000
General cash at bank and on hand 476,042 433,799
Client cash 785,640 793,220
1,261,682 1,227,019
For the purpose of the consolidated statement of cash flows, cash and cash equivalents is equal to the balance as disclosed above.
reconciliation of profit after tax to net cash inflow from operating activities
Profit for the year 206,918 246,082
Depreciation and amortisation 53,777 49,812
Net (gain) / loss on disposal of non-current assets 4,662 1,087
Net (gain) on reversal of impairment - (5,562)
Impairment charges against assets 61,300 -
Net (gain) / loss on sale of financial assets at fair value (5,127) (2,572)
Share of (profits) / losses of joint ventures and associates not received as dividends or distributions (1,346) 1,004
Net exchange differences 12,772 (15,429)
(Increase) / decrease in trade and other receivables (73,559) (46,864)
(Increase) / decrease in deferred tax assets 8,040 (1,623)
(Increase) / decrease in inventories (86) 6
Increase / (decrease) in trade creditors, other payables and financial liabilities at fair value through profit or loss (5,371) 136,271
Increase / (decrease) in net income taxes payable (35,612) (2,605)
Increase / (decrease) in deferred tax liabilities (3,547) (1,423)
Increase / (decrease) in other provisions 4,272 12,139
Net cash inflow / (outflow) from operating activities 227,093 370,323
FLIGHT CENTRE TRAVEL GROUP LIMITED annuaL report 13/14 45

Operating and financial reviews: October 2014 15© 2014 KPMG, an Australian partnership. All rights reserved. October 2014. NSW N12375AUD.
Contents of the notes to the financial statements
Page
Basis of preparation 961. Reporting entity 962. Basis of preparation 963. Critical accounting estimates and judgements 97
Performance for the year 994. Segment information 995. Revenue 1016. Expenses 1027. Earnings per share 1038. Income tax 1049. Dividends 105
10. Reconciliation of profit after income tax to net cash inflow from operating activities 105
Operating assets and liabilities 10611. Receivables 10612. Inventories 10613. Property, plant and equipment 10714. Payables 10915. Provisions 110
Capital structure and finance costs 11216. Net debt and finance costs 11217. Financial risk management 11418. Contributed equity 116
Other notes 11719. Events occurring after the reporting period 11720. Other income 11721. Remuneration of auditors 11722. Deferred tax 11823. Reserves and retained earnings 11924. Share-based payments 12025. Commitments 12126. Retirement benefit obligations 12227. Key Management Personnel 12328. Controlled entities and deed of cross guarantee 12529. Parent entity financial information 12730. Contingent liabilities 12831. Related party transactions 12832. Other accounting policy 12833. New accounting standards and interpretations 129
95
Iluka Resources LimitedNotes to the consolidated financial statements
31 December 2012
Contents of the notes to the financial statements
Page
1 Summary of significant accounting policies 502 Critical accounting estimates and judgements 603 Financial risk management 614 Segment information 645 Revenue 666 Other income 667 Expenses 678 Income tax 689 Cash and cash equivalents 6910 Receivables 6911 Inventories 6912 Property, plant and equipment 7013 Intangible assets 7114 Deferred tax 7115 Payables 7216 Interest-bearing liabilities 7317 Provisions 7518 Contributed equity 7619 Reserves 7720 Dividends 7821 Key Management Personnel 7922 Remuneration of auditors 8123 Retirement benefit obligations 8224 Contingent liabilities 8525 Commitments 8626 Controlled entities and deed of cross guarantee 8727 Reconciliation of profit after income tax to net cash inflow from operating activities 8928 Earnings per share 8929 Share-based payments 9030 Parent entity financial information 9131 Related party transactions 9232 Events occurring after the reporting period 92
49
Example 4 – Iluka Resources The Iluka Resources December 2013 financial report:
• Utilises subheadings to group notes together• Does not have a separate summary of significant accounting policies note – now included within associated notes• is 10 pages shorter compared to the December 2012 report
Source: ASX release: Iluka Annual Report 2013Date: 25 March 2014
Source: ASX release: Iluka Annual Report 2012 Date: 28 March 2013
FOCUS ON SHAREHOLDER RETURNS THROUGH THE CYCLE / FLEX OPERATIONS IN LINE WITH MARKET DEMAND / CONTINUE MARKET DEVELOPMENT / MAINTAIN STRONG BALANCE SHEET / PRESERVE AND ADVANCE MINERAL SANDS GROWTH OPPORTUNITIES / CONTINUE TO EVALUATE/ PURSUE CORPORATE GROWTH OPPORTUNITIES / ACT COUNTER-CYCLICALLY WHERE APPROPRIATE
CREATE AND DELIVER VALUE FOR SHAREHOLDERS
Annual Report
2013
Remove / Re-label & Reorder Appendix 2 – Example Reporting

Operating and financial reviews: October 2014 16© 2014 KPMG, an Australian partnership. All rights reserved. October 2014. NSW N12375AUD.
Example 5 – IOOFThe IOOF 2014 financial report is 13 pages shorter compared to the 2013 report and utilises subheadings to group like notes together.
Source: ASX release: IOOF Full Year Statutory Accounts and Appendix 4EDate: 22 August 2014
IOOF Annual Financial Report 2014
Contents PageDirectors' Report 1Remuneration Report 10Directors' Declaration 31Lead Auditor's Independence Declaration 32Independent Auditor's Review Report to the Members 33Consolidated Statement of Comprehensive Income 35Consolidated Statement of Financial Position 36Consolidated Statement of Changes in Equity 37Consolidated Statement of Cash Flows 39
Notes to the financial statementsSection 1 - Risk management 401-1 Risk management 401-2 Capital risk management 461-3 Financial Instruments 47
Section 2 - Results for the year 492-1 Operating segments 492-2 Revenue 512-3 Expenses 522-4 Net cash provided by operating activities 542-5 Income taxes 552-6 Dividends 582-7 Earnings per share 58
Section 3 - Capital management and financing 593-1 Borrowings 593-2 Share capital 613-3 Capital commitments and contingencies 623-4 Reserves 63
Section 4 - Operating assets and liabilities 634-1 Acquisitions 634-2 Equity-accounted investees 644-3 Intangible assets (other than goodwill) 654-4 Goodwill 664-5 Provisions 68
Section 5 - Statutory funds 695-1 Assets relating to statutory funds 695-2 Liabilities relating to statutory funds 695-3 Reconciliation of movements in contract liabilities 705-4 Contribution to profit or loss of statutory funds 715-5 Actuarial assumptions and methods 725-6 Disclosures on asset restrictions, managed assets and trustee activities 725-7 Capital adequacy position 73
Section 6 - Other disclosures 736-1 Parent entity financials 736-2 Group subsidiaries 746-3 Share-based payments 746-4 Remuneration of auditors 786-5 Key management personnel 786-6 Related party transactions 79
Section 7 - Basis of preparation 807-1 Reporting entity 807-2 Basis of preparation 807-3 Other significant accounting policies 817-4 New standards and interpretations not yet adopted 847-5 Subsequent events 84
IOOF HOLDINGS LTD Annual Financial Report for the year ended 30 June 2013
Note Contents Page Number
Directors' Report 1Remuneration Report 12Directors' Declaration 37Lead Auditor's Independence Declaration 38Independent Auditor's Report to the Members 39Statement of Comprehensive Income 41Statement of Financial Position 42Statement of Changes in Equity 43Statement of Cash Flows 46
Notes to the Financial Statements1 Reporting entity 472 Basis of preparation 473 Significant accounting policies 484 Risk management 615 Financial instruments 686 Operating segments 697 Revenue 718 Expenses 729 Finance costs 7210 Income tax expense 7311 Cash and cash equivalents 7412 Receivables 7413 Other financial assets 7514 Other assets 7515 Equity‐accounted investees 7616 Property and equipment 7717 Deferred tax assets and liabilities 7818 Goodwill 7919 Other intangible assets 8120 Payables 8221 Borrowings 8222 Other financial liabilities 8323 Provisions 8424 Other liabilities 8425 Share capital 8526 Reserves 8727 Retained profits/(losses) 8828 Dividends 8829 Earnings per share 8930 Acquisition of subsidiary 9031 Share‐based payments 9132 Remuneration of auditors 9533 Key management personnel 9634 Related party transactions 9635 Operating leases 9836 Capital commitments 9837 Contingencies 9838 Reconciliation of cash flows from operating activities 10139 Group entities 10240 Statutory funds 10541 Subsequent events 108
Source: ASX release: IOOF Holdings Limited Full Year Statutory Accounts Date: 25 October 2013
Remove / Re-label & Reorder
IOOF Holdings LtdABN 49 100 103 722
30 June 2014Annual Financial Report
Appendix 2 – Example Reporting

Operating and financial reviews: October 2014 17© 2014 KPMG, an Australian partnership. All rights reserved. October 2014. NSW N12375AUD.
Example 6 – Lend LeaseLend Lease have included the accounting policies that relate to specific balances within the associated note in their 2014 report. The Significant Accounting Policies note principally contains the statement of compliance, basis of preparation and impact of new / revised accounting standards policies.
Re-label & Reorder
Source: Lend Lease Annual Report 2014Date: 30 September 2014
Source: Lend Lease Annual Report 2013Date: 30 September 2013
2000 SYDNEY OLYMPIC VILLAGE 2006 TORINO WINTER OLYMPIC VILLAGE 2012 LONDON OLYMPIC ATHLETES VILLAGE 313@SOMERSET SHOPPING CENTRE 30 THE BOND, SYDNEY NATIONAL SEPTEMBER 11 MEMORIAL AND MUSEUM NEW YORK ACADEMY OF SCIENCE CANBERRA ADELAIDE WOMEN’S AND CHILDREN’S HOSPITAL ADELAIDE OVAL ALKIMOS ANZ HEADQUARTERS – MELBOURNE DOCKLANDS ANZAC BRIDGE AURORA PLACE AUSTRALIA SQUARE AUSTRALIAN WORLD EXPO PAVILION SHANGHAI BARANGAROO HEADLAND PARK BARANGAROO SOUTH BBC HEADQUARTERS BLUES POINT TOWER BLUEWATER SHOPPING CENTRE BON SECOURS ST FRANCIS MEDICAL PAVILION BRISBANE INTERNATIONAL AIRPORT BROADGATE LONDON CALTEX HOUSE CANELAND CENTRAL CASTLECRAG CRAIGIEBURN DARLING HARBOUR & COCKLE BAY DARLING HARBOUR LIVE DARLING PARK THE DARLING QUARTER DEPARTMENT OF DEFENSE MILITARY HOUSING PRIVATIZATION INITIATIVE DEUTSCHE BANK PLACE ELEPHANT & CASTLE ERINA FAIR ETIHAD STADIUM MELBOURNE GATEWAY BRIDGE GOLD COAST UNIVERSITY HOSPITAL GRAND CENTRAL STATION RESTORATION GREENWICH PENINSULA HER MAJESTY’S TREASURY BUILDING REDEVELOPMENT HUME HIGHWAY IRON COVE BRIDGE JACKSONS LANDING JEM SINGA-PORE KUALA LUMPUR PETRONAS TOWERS LAKESIDE JOONDALUP LANCASHIRE COUNTY COUNCIL SCHOOLS PFI INITIATE LLOYDS BUILDING LONDON M2 MOTORWAY M7 MOTORWAY MACARTHUR SQUARE MELBOURNE MARKETS MELBOURNE TENNIS CENTRE MLC CENTRE MID–CITY SHOPPING CENTRE MUSEUM FOR AFRICAN ART NEW YORK NATIONAL MUSEUM CANBERRA NORTH SHORE MEDICAL CENTRE ONE57 NEW YORK PARKWAY PARADE PARRAMATTA STADIUM PORT BOTANY EXPANSION QANTAS DOMESTIC TERMINAL QUEENSLAND CHILDREN’S HOSPITAL RNA SHOWGROUNDS ROYAL CHILDREN’S HOSPITAL MELBOURNE ROYAL MANCHESTER CHILDREN’S HOSPITAL SCOTTISH NATIONAL ARENA SCOTTISH PARLIAMENT BUILDINGS SETIA CITY MALL STATUE OF LIBERTY RESTORATION SUNSHINE COAST UNIVERSITY HOSPITAL SUNSHINE PLAZA SHOPPING CENTRE SYDNEY INTERNATIONAL AIRPORT SYDNEY FOOTBALL STADIUM SYDNEY FOUR SEASONS HOTEL SYDNEY OLYMPIC AQUATIC CENTRE SYDNEY OPERA HOUSE – STAGE 1 SYDNEY SHAN-GRI–LA HOTEL TAIPEI 101 THE INTERNATIONAL QUARTER THE ROYAL EXCHANGE REMODELLING THE THEATRE ROYAL THE US DEPARTMENT OF THE ARMY’S PRIVATIZATION OF ARMY LODGING THREDBO VILLAGE TIME WARNER CENTRE TRUMP TOWER CHICAGO VICTORIA HARBOUR MELBOURNE WATERBANK PERTH YARRABILBA 2000 SYDNEY OLYMPIC VILLAGE 2006 TORINO WINTER OLYMPIC VILLAGE 2012 LONDON OLYMPIC ATHLETES VILLAGE 313@SOMERSET SHOPPING CENTRE 30 THE BOND, SYDNEY NATIONAL SEP-TEMBER 11 MEMORIAL AND MUSEUM NEW YORK ACADEMY OF SCIENCE CANBERRA ADELAIDE WOMEN’S AND CHILDREN’S HOSPITAL ADELAIDE OVAL ALKIMOS ANZ HEADQUARTERS – MELBOURNE DOCKLANDS ANZAC BRIDGE AURORA PLACE AUSTRALIA SQUARE AUSTRALIAN WORLD EXPO PAVILION SHANGHAI BARANGAROO HEADLAND PARK BARANGAROO SOUTH BBC HEADQUARTERS BLUES POINT TOWER BLUEWATER SHOPPING CENTRE BON SECOURS ST FRANCIS MEDICAL PAVILION BRISBANE INTERNATIONAL AIRPORT BROADGATE LONDON CALTEX HOUSE CANELAND CENTRAL CASTLECRAG CRAIGIEBURN DARLING HARBOUR & COCKLE BAY DARLING HARBOUR LIVE DARLING PARK THE DARLING QUARTER DEPARTMENT OF DEFENSE MILITARY HOUSING PRIVATIZATION INITIATIVE DEUTSCHE BANK PLACE ELEPHANT & CASTLE ERINA FAIR ETIHAD STADIUM MELBOURNE GATEWAY BRIDGE GOLD COAST UNIVERSITY HOSPITAL GRAND CENTRAL STATION RESTORATION GREENWICH PENINSULA HER MAJESTY’S TREASURY BUILDING REDEVELOP-MENT HUME HIGHWAY IRON COVE BRIDGE JACKSONS LANDING JEM SINGAPORE KUALA LUMPUR PETRONAS TOWERS LAKESIDE JOONDALUP LANCASHIRE COUNTY COUNCIL SCHOOLS PFI INITIATE LLOYDS BUILDING LONDON M2 MOTORWAY M7 MOTORWAY MACARTHUR SQUARE MELBOURNE MARKETS MELBOURNE TENNIS CENTRE MLC CENTRE MID–CITY SHOPPING CENTRE MUSEUM FOR AFRICAN ART NEW YORK NATIONAL MUSEUM CANBERRA NORTH SHORE MEDICAL CENTRE ONE57 NEW YORK PARKWAY PARADE PARRAMATTA STADIUM PORT BOTANY EXPANSION QANTAS DOMESTIC TERMINAL QUEENSLAND CHILDREN’S HOSPITAL RNA SHOWGROUNDS ROYAL CHILDREN’S HOSPITAL MELBOURNE ROYAL MANCHESTER CHILDREN’S HOSPITAL SCOTTISH NATIONAL ARENA SCOT-TISH PARLIAMENT BUILDINGS SETIA CITY MALL STATUE OF LIBERTY RESTORATION SUNSHINE COAST UNIVERSITY HOSPITAL SUNSHINE PLAZA SHOPPING CENTRE SYDNEY INTERNATIONAL AIRPORT SYDNEY FOOTBALL STADIUM SYDNEY FOUR SEASONS HOTEL SYD-NEY OLYMPIC AQUATIC CENTRE SYDNEY OPERA HOUSE – STAGE 1 SYDNEY SHANGRI–LA HOTEL TAIPEI 101 THE INTERNATIONAL QUARTER THE ROYAL EXCHANGE REMODELLING THE THEATRE ROYAL THE US DEPARTMENT OF THE ARMY’S PRIVATIZATION OF ARMY LODGING THREDBO VILLAGE TIME WARNER CENTRE TRUMP TOWER CHICAGO VICTORIA HARBOUR MELBOURNE WATERBANK PERTH YARRABILBA 2000 SYDNEY OLYMPIC VILLAGE 2006 TORINO WINTER OLYMPIC VILLAGE 2012 LONDON OLYMPIC ATHLETES VILLAGE 313@SOMERSET SHOPPING CENTRE 30 THE BOND, SYDNEY NATIONAL SEPTEMBER 11 MEMORIAL AND MUSEUM NEW YORK ACADEMY OF SCIENCE CANBERRA ADELAIDE WOMEN’S AND CHILDREN’S HOSPITAL ADELAIDE OVAL ALKIMOS ANZ HEADQUARTERS – MEL-BOURNE DOCKLANDS ANZAC BRIDGE AURORA PLACE AUSTRALIA SQUARE AUSTRALIAN WORLD EXPO PAVILION SHANGHAI BARANGAROO HEADLAND PARK BARANGAROO SOUTH BBC HEADQUARTERS BLUES POINT TOWER BLUEWATER SHOPPING CENTRE BON SECOURS ST FRANCIS MEDICAL PAVILION BRISBANE INTERNATIONAL AIRPORT BROADGATE LONDON CALTEX HOUSE CANELAND CENTRAL CASTLECRAG CRAIGIEBURN DARLING HARBOUR & COCKLE BAY DARLING HARBOUR LIVE DARLING PARK THE DARLING QUARTER DEPARTMENT OF DEFENSE MILITARY HOUSING PRIVATIZATION INITIATIVE DEUTSCHE BANK PLACE ELEPHANT & CASTLE ERINA FAIR ETIHAD STADIUM MELBOURNE GATEWAY BRIDGE GOLD COAST UNIVERSITY HOSPITAL GRAND CENTRAL STATION RESTO-RATION GREENWICH PENINSULA HER MAJESTY’S TREASURY BUILDING REDEVELOPMENT HUME HIGHWAY IRON COVE BRIDGE JACKSONS LANDING JEM SINGAPORE KUALA LUMPUR PETRONAS TOWERS LAKESIDE JOONDALUP LANCASHIRE COUNTY COUNCIL SCHOOLS PFI INITIATE LLOYDS BUILDING LONDON M2 MOTORWAY M7 MOTORWAY MACARTHUR SQUARE MELBOURNE MARKETS MELBOURNE TENNIS CENTRE MLC CENTRE MID–CITY SHOPPING CENTRE MUSEUM FOR AFRICAN ART NEW YORK NATIONAL MUSEUM CANBERRA NORTH SHORE MEDICAL CENTRE ONE57 NEW YORK PARKWAY PARADE PARRAMATTA STADIUM PORT BOTANY EXPANSION QANTAS DOMESTIC TERMINAL QUEENSLAND CHILDREN’S HOSPITAL RNA SHOWGROUNDS ROYAL CHILDREN’S HOSPITAL MEL-BOURNE ROYAL MANCHESTER CHILDREN’S HOSPITAL SCOTTISH NATIONAL ARENA SCOTTISH PARLIAMENT BUILDINGS SETIA CITY MALL STATUE OF LIBERTY RESTORATION SUNSHINE COAST UNIVERSITY HOSPITAL SUNSHINE PLAZA SHOPPING CENTRE SYDNEY INTERNATIONAL AIRPORT SYDNEY FOOTBALL STADIUM SYDNEY FOUR SEASONS HOTEL SYDNEY OLYMPIC AQUATIC CENTRE SYDNEY OPERA HOUSE – STAGE 1 SYDNEY SHANGRI–LA HOTEL TAIPEI 101 THE INTERNATIONAL QUARTER THE ROYAL EXCHANGE REMOD-ELLING THE THEATRE ROYAL THE US DEPARTMENT OF THE ARMY’S PRIVATIZATION OF ARMY LODGING THREDBO VILLAGE TIME WARNER CENTRE TRUMP TOWER CHICAGO VICTORIA HARBOUR MELBOURNE WATERBANK PERTH YARRABILBA 2000 SYDNEY OLYMPIC VILLAGE 2006 TORINO WINTER OLYMPIC VILLAGE 2012 LONDON OLYMPIC ATHLETES VILLAGE 313@SOMERSET SHOPPING CENTRE 30 THE BOND, SYDNEY NATIONAL SEPTEMBER 11 MEMORIAL AND MUSEUM NEW YORK ACADEMY OF SCIENCE CANBERRA ADELAIDE WOMEN’S AND CHILDREN’S HOSPITAL ADELAIDE OVAL ALKIMOS ANZ HEADQUARTERS – MELBOURNE DOCKLANDS ANZAC BRIDGE AURORA PLACE AUSTRALIA SQUARE AUSTRALIAN WORLD EXPO PAVILION SHANGHAI BARANGAROO HEADLAND PARK BARANGAROO SOUTH BBC HEADQUARTERS BLUES POINT TOWER BLUEWATER SHOPPING CENTRE BON SECOURS ST FRANCIS MEDICAL PAVILION BRISBANE INTERNATIONAL AIRPORT BROADGATE LONDON CALTEX HOUSE CANELAND CENTRAL CASTLECRAG CRAIGIEBURN DARLING HARBOUR & COCKLE BAY DARLING HARBOUR LIVE DARLING PARK THE DARLING QUARTER DEPARTMENT OF DEFENSE MILITARY HOUSING PRIVATIZATION INITIATIVE DEUTSCHE BANK PLACE ELEPHANT & CASTLE ERINA FAIR ETIHAD STADIUM MELBOURNE GATEWAY BRIDGE GOLD COAST UNIVERSITY HOSPITAL GRAND CENTRAL STATION RESTORATION GREENWICH PENINSULA HER MAJESTY’S TREASURY BUILDING REDEVELOPMENT HUME HIGHWAY IRON COVE BRIDGE JACKSONS LANDING JEM SINGAPORE KUALA LUMPUR PETRONAS TOWERS LAKESIDE JOONDALUP LANCASHIRE COUNTY COUNCIL SCHOOLS PFI INITIATE LLOYDS BUILDING LONDON M2 MOTORWAY M7 MOTORWAY MACARTHUR SQUARE MELBOURNE MARKETS MELBOURNE TENNIS CENTRE MLC CENTRE MID–CITY SHOPPING CENTRE MUSEUM FOR AFRICAN ART NEW YORK NATIONAL MUSEUM CANBERRA NORTH SHORE MEDICAL CENTRE ONE57 NEW YORK PARKWAY PARADE PARRAMATTA STADIUM PORT BOTANY EXPANSION QANTAS DOMESTIC TERMINAL QUEENSLAND CHILDREN’S HOSPITAL RNA SHOWGROUNDS ROYAL CHILDREN’S HOSPITAL MELBOURNE ROYAL MANCHESTER CHILDREN’S HOSPITAL SCOTTISH NATIONAL ARENA SCOTTISH PARLIAMENT BUILDINGS SETIA CITY MALL STATUE OF LIBERTY RESTORATION SUNSHINE COAST UNIVERSITY HOSPITAL SUNSHINE PLAZA SHOPPING CENTRE SYDNEY INTERNATIONAL AIRPORT SYDNEY FOOTBALL STADIUM SYDNEY FOUR SEASONS HOTEL SYDNEY OLYMPIC AQUATIC CENTRE SYDNEY OPERA HOUSE – STAGE 1 SYDNEY SHAN-GRI–LA HOTEL TAIPEI 101 THE INTERNATIONAL QUARTER THE ROYAL EXCHANGE REMODELLING THE THEATRE ROYAL THE US DEPARTMENT OF THE ARMY’S PRIVATIZATION OF ARMY LODGING THREDBO VILLAGE TIME WARNER CENTRE TRUMP TOWER CHICAGO VICTORIA HARBOUR MELBOURNE WATERBANK PERTH YARRABILBA 2000 SYDNEY OLYMPIC VILLAGE 2006 TORINO WINTER OLYMPIC VILLAGE 2012 LONDON OLYMPIC ATHLETES VILLAGE 313@SOMERSET SHOPPING CENTRE 30 THE BOND, SYDNEY NATIONAL SEP-TEMBER 11 MEMORIAL AND MUSEUM NEW YORK ACADEMY OF SCIENCE CANBERRA ADELAIDE WOMEN’S AND CHILDREN’S HOSPITAL ADELAIDE OVAL ALKIMOS ANZ HEADQUARTERS – MELBOURNE DOCKLANDS ANZAC BRIDGE AURORA PLACE AUSTRALIA SQUARE AUSTRALIAN WORLD EXPO PAVILION SHANGHAI BARANGAROO HEADLAND PARK BARANGAROO SOUTH BBC HEADQUARTERS BLUES POINT TOWER BLUEWATER SHOPPING CENTRE BON SECOURS ST FRANCIS MEDICAL PAVILION BRISBANE INTERNATIONAL AIRPORT BROADGATE LONDON CALTEX HOUSE CANELAND CENTRAL CASTLECRAG CRAIGIEBURN DARLING HARBOUR & COCKLE BAY DARLING HARBOUR LIVE DARLING PARK THE DARLING QUARTER DEPARTMENT OF DEFENSE MILITARY HOUSING PRIVATIZATION INITIATIVE DEUTSCHE BANK PLACE ELEPHANT & CASTLE ERINA FAIR ETIHAD STADIUM MELBOURNE GATEWAY BRIDGE GOLD COAST UNIVERSITY HOSPITAL GRAND CENTRAL STATION RESTORATION GREENWICH PENINSULA HER MAJESTY’S TREASURY BUILDING REDEVELOP-MENT HUME HIGHWAY IRON COVE BRIDGE JACKSONS LANDING JEM SINGAPORE KUALA LUMPUR PETRONAS TOWERS LAKESIDE JOONDALUP LANCASHIRE COUNTY COUNCIL SCHOOLS PFI INITIATE LLOYDS BUILDING LONDON M2 MOTORWAY M7 MOTORWAY MACARTHUR SQUARE MELBOURNE MARKETS MELBOURNE TENNIS CENTRE MLC CENTRE MID–CITY SHOPPING CENTRE MUSEUM FOR AFRICAN ART NEW YORK NATIONAL MUSEUM CANBERRA NORTH SHORE MEDICAL CENTRE ONE57 NEW YORK PARKWAY PARADE PARRAMATTA STADIUM PORT BOTANY EXPANSION QANTAS DOMESTIC TERMINAL QUEENSLAND CHILDREN’S HOSPITAL RNA SHOWGROUNDS ROYAL CHILDREN’S HOSPITAL MELBOURNE ROYAL MANCHESTER CHILDREN’S HOSPITAL SCOTTISH NATIONAL ARENA SCOT-TISH PARLIAMENT BUILDINGS SETIA CITY MALL STATUE OF LIBERTY RESTORATION SUNSHINE COAST UNIVERSITY HOSPITAL SUNSHINE PLAZA SHOPPING CENTRE SYDNEY INTERNATIONAL AIRPORT SYDNEY FOOTBALL STADIUM SYDNEY FOUR SEASONS HOTEL SYD-NEY OLYMPIC AQUATIC CENTRE SYDNEY OPERA HOUSE – STAGE 1 SYDNEY SHANGRI–LA HOTEL TAIPEI 101 THE INTERNATIONAL QUARTER THE ROYAL EXCHANGE REMODELLING THE THEATRE ROYAL THE US DEPARTMENT OF THE ARMY’S PRIVATIZATION OF ARMY LODGING THREDBO VILLAGE TIME WARNER CENTRE TRUMP TOWER CHICAGO VICTORIA HARBOUR MELBOURNE WATERBANK PERTH YARRABILBA 2000 SYDNEY OLYMPIC VILLAGE 2006 TORINO WINTER OLYMPIC VILLAGE 2012 LONDON OLYMPIC ATHLETES VILLAGE 313@SOMERSET SHOPPING CENTRE 30 THE BOND, SYDNEY NATIONAL SEPTEMBER 11 MEMORIAL AND MUSEUM NEW YORK ACADEMY OF SCIENCE CANBERRA ADELAIDE WOMEN’S AND CHILDREN’S HOSPITAL ADELAIDE OVAL ALKIMOS ANZ HEADQUARTERS – MEL-BOURNE DOCKLANDS ANZAC BRIDGE AURORA PLACE AUSTRALIA SQUARE AUSTRALIAN WORLD EXPO PAVILION SHANGHAI BARANGAROO HEADLAND PARK BARANGAROO SOUTH BBC HEADQUARTERS BLUES POINT TOWER BLUEWATER SHOPPING CENTRE BON SECOURS ST FRANCIS MEDICAL PAVILION BRISBANE INTERNATIONAL AIRPORT BROADGATE LONDON CALTEX HOUSE CANELAND CENTRAL CASTLECRAG CRAIGIEBURN DARLING HARBOUR & COCKLE BAY DARLING HARBOUR LIVE DARLING PARK THE DARLING QUARTER DEPARTMENT OF DEFENSE MILITARY HOUSING PRIVATIZATION INITIATIVE DEUTSCHE BANK PLACE ELEPHANT & CASTLE ERINA FAIR ETIHAD STADIUM MELBOURNE GATEWAY BRIDGE GOLD COAST UNIVERSITY HOSPITAL GRAND CENTRAL STATION RESTO-RATION GREENWICH PENINSULA HER MAJESTY’S TREASURY BUILDING REDEVELOPMENT HUME HIGHWAY IRON COVE BRIDGE JACKSONS LANDING JEM SINGAPORE KUALA LUMPUR PETRONAS TOWERS LAKESIDE JOONDALUP LANCASHIRE COUNTY COUNCIL SCHOOLS PFI INITIATE LLOYDS BUILDING LONDON M2 MOTORWAY M7 MOTORWAY MACARTHUR SQUARE MELBOURNE MARKETS MELBOURNE TENNIS CENTRE MLC CENTRE MID–CITY SHOPPING CENTRE MUSEUM FOR AFRICAN ART NEW YORK NATIONAL MUSEUM CANBERRA NORTH SHORE MEDICAL CENTRE ONE57 NEW YORK PARKWAY PARADE PARRAMATTA STADIUM PORT BOTANY EXPANSION QANTAS DOMESTIC TERMINAL QUEENSLAND CHILDREN’S HOSPITAL RNA SHOWGROUNDS ROYAL CHILDREN’S HOSPITAL MEL-BOURNE ROYAL MANCHESTER CHILDREN’S HOSPITAL SCOTTISH NATIONAL ARENA SCOTTISH PARLIAMENT BUILDINGS SETIA CITY MALL STATUE OF LIBERTY RESTORATION SUNSHINE COAST UNIVERSITY HOSPITAL SUNSHINE PLAZA SHOPPING CENTRE SYDNEY INTERNATIONAL AIRPORT SYDNEY FOOTBALL STADIUM SYDNEY FOUR SEASONS HOTEL SYDNEY OLYMPIC AQUATIC CENTRE SYDNEY OPERA HOUSE – STAGE 1 SYDNEY SHANGRI–LA HOTEL TAIPEI 101 THE INTERNATIONAL QUARTER THE ROYAL EXCHANGE REMOD-ELLING THE THEATRE ROYAL THE US DEPARTMENT OF THE ARMY’S PRIVATIZATION OF ARMY LODGING THREDBO VILLAGE TIME WARNER CENTRE TRUMP TOWER CHICAGO VICTORIA HARBOUR MELBOURNE WATERBANK PERTH YARRABILBA 2000 SYDNEY OLYMPIC VILLAGE 2006 TORINO WINTER OLYMPIC VILLAGE 2012 LONDON OLYMPIC ATHLETES VILLAGE 313@SOMERSET SHOPPING CENTRE 30 THE BOND, SYDNEY NATIONAL SEPTEMBER 11 MEMORIAL AND MUSEUM NEW YORK ACADEMY OF SCIENCE CANBERRA ADELAIDE WOMEN’S AND CHILDREN’S HOSPITAL ADELAIDE OVAL ALKIMOS ANZ HEADQUARTERS – MELBOURNE DOCKLANDS ANZAC BRIDGE AURORA PLACE AUSTRALIA SQUARE AUSTRALIAN WORLD EXPO PAVILION SHANGHAI BARANGAROO HEADLAND PARK BARANGAROO SOUTH BBC HEADQUARTERS BLUES POINT TOWER BLUEWATER SHOPPING CENTRE BON SECOURS ST FRANCIS MEDICAL PAVILION BRISBANE INTERNATIONAL AIRPORT BROADGATE LONDON CALTEX HOUSE CANELAND CENTRAL CASTLECRAG CRAIGIEBURN DARLING HARBOUR & COCKLE BAY DARLING HARBOUR LIVE DARLING PARK THE DARLING QUARTER DEPARTMENT OF DEFENSE MILITARY HOUSING PRIVATIZATION INITIATIVE DEUTSCHE BANK PLACE ELEPHANT & CASTLE ERINA FAIR ETIHAD STADIUM MELBOURNE GATEWAY BRIDGE GOLD COAST UNIVERSITY HOSPITAL GRAND CENTRAL STATION RESTORATION GREENWICH PENINSULA HER MAJESTY’S TREASURY BUILDING REDEVELOPMENT HUME HIGHWAY IRON COVE BRIDGE JACKSONS LANDING JEM SINGAPORE KUALA LUMPUR PETRONAS TOWERS LAKESIDE JOONDALUP LANCASHIRE COUNTY COUNCIL SCHOOLS PFI INITIATE LLOYDS BUILDING LONDON M2 MOTORWAY M7 MOTORWAY MACARTHUR SQUARE MELBOURNE MARKETS MELBOURNE TENNIS CENTRE MLC CENTRE MID–CITY SHOPPING CENTRE MUSEUM FOR AFRICAN ART NEW YORK NATIONAL MUSEUM CANBERRA NORTH SHORE MEDICAL CENTRE ONE57 NEW YORK PARKWAY PARADE PARRAMATTA STADIUM PORT BOTANY EXPANSION QANTAS DOMESTIC TERMINAL QUEENSLAND CHILDREN’S HOSPITAL RNA SHOWGROUNDS ROYAL CHILDREN’S HOSPITAL MELBOURNE ROYAL MANCHESTER CHILDREN’S HOSPITAL SCOTTISH NATIONAL ARENA SCOTTISH PARLIAMENT BUILDINGS SETIA CITY MALL STATUE OF LIBERTY RESTORATION SUNSHINE COAST UNIVERSITY HOSPITAL SUNSHINE PLAZA SHOPPING CENTRE SYDNEY INTERNATIONAL AIRPORT SYDNEY FOOTBALL STADIUM SYDNEY FOUR SEASONS HOTEL SYDNEY OLYMPIC AQUATIC CENTRE SYDNEY OPERA HOUSE – STAGE 1 SYDNEY SHAN-GRI–LA HOTEL TAIPEI 101 THE INTERNATIONAL QUARTER THE ROYAL EXCHANGE REMODELLING THE THEATRE ROYAL THE US DEPARTMENT OF THE ARMY’S PRIVATIZATION OF ARMY LODGING THREDBO VILLAGE TIME WARNER CENTRE TRUMP TOWER CHICAGO VICTORIA HARBOUR MELBOURNE WATERBANK PERTH YARRABILBA 2000 SYDNEY OLYMPIC VILLAGE 2006 TORINO WINTER OLYMPIC VILLAGE 2012 LONDON OLYMPIC ATHLETES VILLAGE 313@SOMERSET SHOPPING CENTRE 30 THE BOND, SYDNEY NATIONAL SEP-TEMBER 11 MEMORIAL AND MUSEUM NEW YORK ACADEMY OF SCIENCE CANBERRA ADELAIDE WOMEN’S AND CHILDREN’S HOSPITAL ADELAIDE OVAL ALKIMOS ANZ HEADQUARTERS – MELBOURNE DOCKLANDS ANZAC BRIDGE AURORA PLACE AUSTRALIA SQUARE AUSTRALIAN WORLD EXPO PAVILION SHANGHAI BARANGAROO HEADLAND PARK BARANGAROO SOUTH BBC HEADQUARTERS BLUES POINT TOWER BLUEWATER SHOPPING CENTRE BON SECOURS ST FRANCIS MEDICAL PAVILION BRISBANE INTERNATIONAL AIRPORT BROADGATE LONDON CALTEX HOUSE CANELAND CENTRAL CASTLECRAG CRAIGIEBURN DARLING HARBOUR & COCKLE BAY DARLING HARBOUR LIVE DARLING PARK THE DARLING QUARTER DEPARTMENT OF DEFENSE MILITARY HOUSING PRIVATIZATION INITIATIVE DEUTSCHE BANK PLACE ELEPHANT & CASTLE ERINA FAIR ETIHAD STADIUM MELBOURNE GATEWAY BRIDGE GOLD COAST UNIVERSITY HOSPITAL GRAND CENTRAL STATION RESTORATION GREENWICH PENINSULA HER MAJESTY’S TREASURY BUILDING REDEVELOP-MENT HUME HIGHWAY IRON COVE BRIDGE JACKSONS LANDING JEM SINGAPORE KUALA LUMPUR PETRONAS TOWERS LAKESIDE JOONDALUP LANCASHIRE COUNTY COUNCIL SCHOOLS PFI INITIATE LLOYDS BUILDING LONDON M2 MOTORWAY M7 MOTORWAY MACARTHUR SQUARE MELBOURNE MARKETS MELBOURNE TENNIS CENTRE MLC CENTRE MID–CITY SHOPPING CENTRE MUSEUM FOR AFRICAN ART NEW YORK NATIONAL MUSEUM CANBERRA NORTH SHORE MEDICAL CENTRE ONE57 NEW YORK PARKWAY PARADE PARRAMATTA STADIUM PORT BOTANY EXPANSION QANTAS DOMESTIC TERMINAL QUEENSLAND CHILDREN’S HOSPITAL RNA SHOWGROUNDS ROYAL CHILDREN’S HOSPITAL MELBOURNE ROYAL MANCHESTER CHILDREN’S HOSPITAL SCOTTISH NATIONAL ARENA SCOT-TISH PARLIAMENT BUILDINGS SETIA CITY MALL STATUE OF LIBERTY RESTORATION SUNSHINE COAST UNIVERSITY HOSPITAL SUNSHINE PLAZA SHOPPING CENTRE SYDNEY INTERNATIONAL AIRPORT SYDNEY FOOTBALL STADIUM SYDNEY FOUR SEASONS HOTEL SYD-NEY OLYMPIC AQUATIC CENTRE SYDNEY OPERA HOUSE – STAGE 1 SYDNEY SHANGRI–LA HOTEL TAIPEI 101 THE INTERNATIONAL QUARTER THE ROYAL EXCHANGE REMODELLING THE THEATRE ROYAL THE US DEPARTMENT OF THE ARMY’S PRIVATIZATION OF ARMY
LEND LEASEANNUAL REPORT
2014
OVER 50YEARSCREATING THE BEST PLACES
LEN
D L
EA
SE
AN
NU
AL
RE
PO
RT
201
4
Lend LeaseANNUAL REPORT 2014 99
2. Revenue
Accounting Policies
Revenue from the provision of services is recognised in the Income Statement in proportion to the stage of completion of the transactions at the balance sheet date.
¡ For construction and development: the value of work performed using the percentage complete method, which is measured by reference to costs incurred to date as a percentage of total forecast costs for each contract.
¡ Development also includes retirement living Deferred Management Fees (‘DMF’). A typical DMF contract provides for an annual fee for a fixed period on the property occupied by a resident (e.g. 3% per annum of purchase or resale price for a period up to 10–12 years, or 30%–36% in total) plus a share of the capital gain realised on turnover. For both owned retirement villages (investment property) and managed retirement villages, DMF income is recognised on an annual accrual basis based upon the expected term of the resident’s licence and estimates of capital growth since the resident first occupied the unit.
¡ For infrastructure development: origination, asset management and facility management fee entitlements are recognised for services rendered.
¡ For investment management: funds and asset management fee entitlements are recognised for services rendered.
Revenue from the sale of development properties is recognised in the Income Statement when:
¡ The significant risks and rewards have been transferred to the buyer;
¡ The Group retains neither continuing managerial involvement to the degree usually associated with ownership, nor effective control over the development properties sold;
¡ The revenue can be measured reliably and it is probable that the Group will receive the consideration due; and
¡ The Group can reliably measure the costs incurred or to be incurred in respect of the transaction.
Rental revenue is recognised in the Income Statement on a straight line basis over the term of the lease unless another systematic basis is more appropriate. Lease incentives granted are recognised as an integral part of the total rental income.
Other revenue primarily includes dividends/distributions and miscellaneous items. Dividend/distribution income is recognised when the right to receive payment is established, usually on declaration of the dividend/distribution.
Financial DisclosureJune 2014
A$mJune 20131
A$m
Revenue from the provision of services
Construction 11,011.3 11,466.4
Development 295.6 273.2
Infrastructure Development 238.9 313.0
Investment Management 205.4 130.4
Total revenue from the provision of services 11,751.2 12,183.0
Revenue from the sale of development properties 2,079.6 898.2
Rental revenue 53.3 48.9
Other revenue 51.8 32.5
Total revenue 13,935.9 13,162.6
1 June 2013 has been adjusted to reflect the impact of the first time adoption of the new AASB 11 Joint Arrangements standard (refer to Note 1.3 ‘Impact of New/Revised Accounting Standards’).
124 Lend Lease annual report 2013
notes to the ConsoLIdated FInanCIaL stateMents CONTINUED
1. significant accounting policies continued
1.3 Impact of New/Revised Accounting Standards continued
new accounting standards and Interpretations not Yet adoptedCertain new accounting standards and interpretations have been published that are not mandatory for the financial year ended 30 June 2013 but are available for early adoption and have not been applied in preparing this report.
The potential effect of these is outlined below: n AASB 9 Financial Instruments, AASB 2009-11 Amendments to
Australian Accounting Standards arising from AASB 9, AASB 2010-7 Amendments to Australian Accounting Standards arising from AASB 9 (December 2010) and AASB 2012-6 Amendments to Australian Accounting Standards – Mandatory Effective Date of AASB 9 and Transition Disclosures (September 2012).
These standards address the classification, measurement and derecognition of financial assets and financial liabilities. The potential effect of this standard is yet to be determined.
n AASB 10 Consolidated Financial Statements introduces a new definition of control and addresses whether an entity should be included within the consolidated financial statements of the parent company.
n AASB 11 Joint Arrangements establishes principles for financial reporting by parties to a joint arrangement.
The Group’s assessment of the impact of AASB 10 and AASB 11 indicates that the application of these standards is unlikely to have a significant impact on the Group’s financial position and performance.
n AASB 12 Disclosure of Interests in Other Entities relates to disclosure requirements for all forms of interests in other entities, including subsidiaries, joint arrangements, associates and unconsolidated structured entities. Application of this standard will not affect amounts recognised in the financial statements, however it will impact the type of information disclosed in relation to the Group’s investments.
n AASB 13 Fair Value Measurements and AASB 2011-8 Amendments to Australian Accounting Standards arising from AASB 13 introduce new guidance on fair value measurement and disclosure requirements when fair value is permitted by accounting standards. Application of this standard will not affect amounts recognised in the financial statements, however it will impact the type of information disclosed in relation to the fair value hierarchy.
n The revised AASB 119 Employee Benefits (June 2011) and AASB 2011-10 Amendments to Australian Accounting Standards arising from AASB 119 (September 2011) introduce changes to the accounting for and presentation of pensions and other post-employment benefits. The revised standard eliminates the corridor approach which defers the recognition of actuarial gains and losses attributable to the Group’s defined benefit plans in the Statement of Comprehensive Income. The revised standard also requires the net interest expense on fund obligations and interest income on assets to be determined by applying the discount rate used to measure the fund obligations. Previously, the Group determined interest income on fund assets based on the expected long term return for each asset class.
Had the revised standard been applied at 30 June 2013, and previously unrecognised cumulative gains and losses had been recognised, total equity would have decreased by A$63.8 million, after tax. The amount recognised in the Statement of Comprehensive Income for current year actuarial gains to 30 June 2013 would have been A$23.2 million, after tax. In addition, the impact to the defined benefit expense on adopting the amendments would decrease profit after tax by A$2.8 million, for the year ended 30 June 2013.
The standards above become mandatory for the June 2014 financial year, with the exception of AASB 9 which will apply to the June 2016 financial year. With the exception of AASB 13, which applies prospectively, the standards are to be applied retrospectively.
1.4 Revenue, Other Income and Profitsrevenue from the provision of servicesRevenue from the provision of services is recognised in the Income Statement in proportion to the stage of completion of the transactions at the balance sheet date.
For property construction: the value of work performed using the percentage complete method, which is measured by reference to costs incurred to date as a percentage of total forecast costs for each contract.
For property and funds management: property development and management fee entitlements for services rendered.
For aged care and retirement living: n Deferred Management Fees (‘DMF’):
A typical DMF contract provides for an annual retainer for a fixed period (e.g. 3% per annum of purchase or resale price for a period up to 12 years, or 36% in total) plus a share of the capital gain realised on turnover.
For both owned retirement villages (investment property) and managed retirement villages, DMF income is recognised on an annual accrual basis based upon the expected term of the resident’s licence and estimates of capital growth since the resident first occupied the unit.
n Aged Care Revenue:
Aged Care revenue comprises daily resident living contributions, retention fees and government funding, which are all determined in accordance with Federal Government authorised rates.
This revenue is recognised as the services are provided. The Group is entitled to charge an annual retention fee to hostel residents. These annual fees are regulated by the Federal Government and are paid by a resident on departure. These fees are accrued during the resident’s period of occupancy.
revenue and profits from the sale of development propertiesRevenue and profits from the sale of development properties are recognised in the Income Statement when:
n The significant risks and rewards have been transferred to the buyer; n The Group retains neither continuing managerial involvement to the
degree usually associated with ownership, nor effective control over the development properties sold;
n The revenue can be measured reliably and it is highly probable that the Group will receive the consideration due; and,
n The Group can reliably measure the costs incurred or to be incurred in respect of the transaction.
rental revenueRental revenue is recognised in the Income Statement on a straight line basis over the term of the lease unless another systematic basis is more appropriate. Lease incentives granted are recognised as an integral part of the total rental income.
Appendix 2 – Example Reporting

Operating and financial reviews: October 2014 18© 2014 KPMG, an Australian partnership. All rights reserved. October 2014. NSW N12375AUD.
Example 7 – SeekSeek have grouped the notes to the financial statements into specific categories. They have also moved the summary of significant accounting policies to be the last note within the financial report.
Re-label & Reorder
Appendix 4E andStatutory AccountsFor the year ended 30 June 2014
Lodged with the ASX under Listing Rule 4.3A SEEK Limited ABN 46 080 075 314
54 SEEK Limited Annual Report 2014
Financial Report
Contents Page
Financial statements55 Consolidated income statement56 Consolidated statement of comprehensive income57 Consolidated balance sheet58 Consolidated statement of changes in equity59 Consolidated statement of cash flows
Notes to the consolidated financial statements60 Note 1 Critical accounting estimates and judgements
Performance62 Note 2 Segment information69 Note 3 Revenue69 Note 4 Other income70 Note 5 Expenses71 Note 6 Earnings per share (EPS)72 Note 7 Income tax
Cash76 Note 8 Cash and cash equivalents77 Note 9 Reconciliation of profit for the year to net cash inflow from operating activities78 Note 10 Financial risk management
Assets87 Note 11 Trade and other receivables88 Note 12 Other financial assets89 Note 13 Plant and equipment
90 Note 14 Intangible assets
93 Note 15 Net tangible asset backingLiabilities
93 Note 16 Trade and other payables94 Note 17 Borrowings95 Note 18 Other financial liabilities
Note 19 ProvisionsEquity
100 Note 20 Contributed equity101 Note 21 Equity106 Note 22 Dividends
Group structure107 Note 23 Business combinations108 Note 24 Discontinued operation110 Note 25 Interests in other entities118 Note 26 Deed of cross guarantee121 Note 27 Parent entity financial information
Unrecognised items122 Note 28 Contingent liabilities122 Note 29 Commitments for expenditure123 Note 30 Events occurring after the balance sheet date
Others124 Note 31 Share-based payments128 Note 32 Related party transactions129 Note 33 Remuneration of auditors130 Note 34 Summary of significant accounting policies
144 Directors’ declaration145 Independent auditor’s report to the members of SEEK Limited
51SEEK Limited Annual Report 2013
ContentsPage
Financial statements52 Consolidated income statement53 Consolidated statement of comprehensive Income54 Consolidated balance sheet55 Consolidated statement of changes in equity56 Consolidated statement of cash flows
Notes to the consolidated financial statements57 Note 1 Summary of significant accounting policies71 Note 2 Financial risk management78 Note 3 Critical accounting estimates and judgements80 Note 4 Segment information85 Note 5 Revenue86 Note 6 Other income86 Note 7 Expenses87 Note 8 Income Tax90 Note 9 Cash and cash equivalents90 Note 10 Trade and other receivables92 Note 11 Investments accounted for using the equity method95 Note 12 Other financial assets96 Note 13 Plant and equipment97 Note 14 Intangible assets100 Note 15 Trade and other payables100 Note 16 Borrowings102 Note 17 Other financial liabilities103 Note 18 Provisions106 Note 19 Contributed equity107 Note 20 Other equity109 Note 21 Dividends110 Note 22 Key management personnel disclosures114 Note 23 Remuneration of auditors115 Note 24 Contingent liabilities116 Note 25 Commitments for expenditure117 Note 26 Share-based payments119 Note 27 Related party transactions120 Note 28 Deed of cross guarantee123 Note 29 Business combinations127 Note 30 Interests in controlled entities129 Note 31 Events occurring after balance date129 Note 32 Reconciliation of profit for the year to net cash inflow from operating activities130 Note 33 Earnings per share (EPS)130 Note 34 Net tangible asset backing131 Note 35 Parent entity financial information132 Directors’ declaration133 Independent auditor’s review report to the member of SEEK Limited
This Financial Report covers SEEK Limited as a consolidated entity consisting of SEEK Limited and its controlled entities. The financial report is presented in the Australian currency. The Financial Report was authorised for issue by the directors on 21 August 2013. The Company has the power to amend and reissue the Financial Report.
SEEK Limited is a company limited by shares, incorporated and domiciled in Australia. Its registered principal place of business is:Level 6, 541 St Kilda Road, MELBOURNE VIC 3004
A description of the nature of the consolidated entity’s operations and its principal activities is included in the review of operations and activities in the Directors Report on pages 7 to 40, which are not part of this Financial Report. Through the use of the internet, we have ensured that our corporate reporting is timely, complete and available globally at minimum cost to the Company. All press releases, financial reports and other information are available at our Investor Relations page on our website at www.seek.com.au.
Source: Seek Limited Annual Report 2013Date: 30 October 2013
Source: Seek Limited Appendix 4E and statutory accounts 2014Date: 20 August 2014
Appendix 2 – Example Reporting

Operating and financial reviews: October 2014 19© 2014 KPMG, an Australian partnership. All rights reserved. October 2014. NSW N12375AUD.
Consolidated Notes Year Ended 30 June 2014 65
(B) Results for the year
In this section This section explains the results and performance of Stockland and the Stockland Trust Group.
This section provides additional information about those individual line items in the financial statements that the Directors consider most relevant in the context of the operations of the entity, including:
(a) Accounting policies that are relevant for understanding the items recognised in the financial statements.
(b) Analysis of the Group’s result for the year by reference to key areas, including: revenue, results by operating segment, personnel costs, income tax and earnings per security.
(B1) Revenue Revenue is recognised at the fair value of the consideration received or receivable, net of the amount of goods and services tax (“GST”) levied.
Property development sales Revenue from land and property sales is recognised when Stockland has transferred significant risks and rewards of ownership to the buyer and the amount of revenue can be reliably measured.
Rent from investment properties Rent is recognised on a straight-line basis over the lease term, net of any incentives.
Rent from investment properties includes $9 million (2013: $8 million) contingent rent billed to tenants. Contingent rent represents 1% of gross lease income.
Deferred Management Fees Deferred Management Fees (“DMF”) are recognised over the tenancy period. DMF’s include both fixed fees recognised on a straight line basis and contingent fees recognised when earned.
DMF are calculated on the entry price of the unit. DMF are recognised each period, however fees are only realised in cash at the end of the residents tenure.
DMF calculated on the exit price of the unit are recognised and realised in cash at the end of the resident’s tenure.
Accounting for DMF is further explained in Note B2.
Dividends and distributions Revenue from dividends and distributions are recognised in profit or loss on the date they are declared by the relevant entity.
Revenue recognised during the year is set out below:
Stockland Stockland
Trust Group
2014
$M2013
$M 2014
$M2013
$M
Property development sales 1,109 955 – –
Rent from investment properties 679 674 681 680
Deferred Management Fees from Retirement Living 74 55 – –
Dividend and distribution income 19 1 – 1
Other revenue 58 43 13 –
Total revenue 1,939 1,728 694 681
Example 8 – StocklandStockland has grouped its note disclosures into six sections in the 2014 financial report. Each section sets out the accounting policies applied in preparing the relevant note. They have also included “Keeping it simple” text boxes to provide commentary on more complex sections in plain English, and have reduced total page length by 14.
Source: Stockland Financial Report 2014Date: 18 August 2014
Source: Stockland Financial Report 2013Date: 25 September 2013
FinancialReport30 June 2014
Focused on growth
Re-label & Reorder / RewriteConsolidated Notes Year Ended 30 June 2014 59
(A) Basis of Preparation 60
(B) Results for the year 65 (B1) Revenue 65 (B2) Operating segments 66 (B3) Personnel expenses 72 (B4) Taxation 73 (B5) Earnings per security/unit 77
(C) Operating assets and liabilities 78 (C1) Real Estate assets and liabilities 78 (C2) Financial assets and liabilities 93 (C3) Other non-financial assets and liabilities 94
(D) Capital Structure and Financing Costs 98 (D1) Net financing costs 98 (D2) Cash and cash equivalents 100 (D3) Interest-bearing loans and borrowings 100 (D4) Other financial assets and liabilities 104 (D5) Fair value hierarchy 106 (D6) Financial risk factors 110 (D7) Issued capital 118 (D8) Dividends and distributions 122
(E) Group Structure 123 (E1) Investments in associates 124 (E2) Investments in joint venture entities 124 (E3) Investments in unconsolidated structured entities 125 (E4) Controlled entities 126 (E5) Deed of Cross Guarantee 128 (E6) Parent entity disclosures 130
(F) Other items 132 (F1) Contingent liabilities 132 (F2) Commitments 132 (F3) Notes to Cash Flow Statements 133 (F4) Related party disclosures 134 (F5) Key Management Personnel disclosures 136 (F6) Auditor’s remuneration 137 (F7) Events subsequent to the end of the year 137
Consolidated NotesYear ended 30 June 2014
Consolidated Notes Year Ended 30 June 2014 59
(A) Basis of Preparation 60
(B) Results for the year 65 (B1) Revenue 65 (B2) Operating segments 66 (B3) Personnel expenses 72 (B4) Taxation 73 (B5) Earnings per security/unit 77
(C) Operating assets and liabilities 78 (C1) Real Estate assets and liabilities 78 (C2) Financial assets and liabilities 93 (C3) Other non-financial assets and liabilities 94
(D) Capital Structure and Financing Costs 98 (D1) Net financing costs 98 (D2) Cash and cash equivalents 100 (D3) Interest-bearing loans and borrowings 100 (D4) Other financial assets and liabilities 104 (D5) Fair value hierarchy 106 (D6) Financial risk factors 110 (D7) Issued capital 118 (D8) Dividends and distributions 122
(E) Group Structure 123 (E1) Investments in associates 124 (E2) Investments in joint venture entities 124 (E3) Investments in unconsolidated structured entities 125 (E4) Controlled entities 126 (E5) Deed of Cross Guarantee 128 (E6) Parent entity disclosures 130
(F) Other items 132 (F1) Contingent liabilities 132 (F2) Commitments 132 (F3) Notes to Cash Flow Statements 133 (F4) Related party disclosures 134 (F5) Key Management Personnel disclosures 136 (F6) Auditor’s remuneration 137 (F7) Events subsequent to the end of the year 137
Consolidated NotesYear ended 30 June 2014
Stockland Financial Report104
(D4) Other financial assets and liabilities
Keeping it simple . . . A derivative is a type of financial instrument typically used to manage risk. A derivative's value changes over time in response to underlying variables such as exchange rates or interest rates and is entered into for a fixed period. A hedge is where a derivative is used to manage an underlying exposure. Stockland uses derivatives to manage exposure to foreign exchange and interest rate risk.
Derivative financial instruments Derivative financial instruments are recognised initially at fair value and remeasured at each balance date. The gain or loss on re-measurement to fair value is recognised in profit or loss. However, where derivatives qualify for hedge accounting, recognition of any resultant gain or loss depends on the nature of the item being hedged, refer to Note D6(d).
The fair value of interest rate swaps is the estimated amount that the Group would receive or pay to terminate the swap at the reporting date, taking into account current interest rates and the current creditworthiness of swap counterparties.
The fair value of forward foreign exchange contracts is determined by using the difference between the contract exchange rate and the quoted forward exchange rate at the reporting date.
Third party valuations are used to determine the fair value of the Group's derivatives. The valuation techniques use inputs such as interest rate yield curves and currency prices/yields, volatilities of underlying instruments and correlations between inputs.
Other financial assets Investments in other financial assets which are managed in accordance with Stockland’s documented risk policy based on their fair value and held-for-trading purposes will be designated as financial assets carried at fair value through profit or loss. Investments in other financial assets will be recognised at fair value with movements recognised in other comprehensive income.
The fair value of “Securities in listed entities” is determined by reference to the quoted bid price of the entity at balance date.
The fair value of “Units in unlisted entities” is determined by reference to the net assets of the underlying investments at balance date.
These investments are included in “Non-current assets – Other financial assets” unless Stockland intends to dispose of the investment within twelve months of balance date in which case the investment is classified as “Current assets – Other financial assets”.
During the year, Stockland obtained a 19.9% (115,166,597 securities) stake in Australand at an average price of $3.78. This comprises a 15.7% direct holding in securities of Australand and 4.2% indirect interest via a cash settled equity swap agreement. The direct holding is included in “Securities in listed entities” while the indirect holding is included in “Other Financial Instrument”. Based on the closing price of Australand at 30 June 2014, this holding has resulted in the following gains:
$52 million (net of tax) of fair value gains recognised in Other Comprehensive Income $1 million (net of tax) recognised in the Statement of Profit & Loss on partial sale of the indirect holding
Both the direct holding and indirect interest have been classified as current as at 30 June 2014.
An investment is derecognised when Stockland has transferred the contractual rights to receive cash flows from the investment and substantially all the risks and rewards of ownership of the investment to a third party. If an investment does not qualify for derecognition, the investment will continue to be recognised and a liability recognised for the consideration received. If the investment will qualify for derecognition within twelve months of balance date, the liability is recorded as “Current liabilities – Other liabilities”.
Stockland Financial Report 2013 55
Financial Report 2013
ATTRIBUTABLE TO UNITHOLDERS OF THE STOCKLAND TRUST GROUP
Notes
Issued capital
$M
Executive remuneration
reserve$M
Cash fl ow hedge
reserve$M
Undistributed income
$M
Total equity
$M
Balance as at 1 July 2012 7,179.8 17.6 3.4 835.3 8,036.1
Profi t for the period – – – 646.6 646.6
Other comprehensive income – – 8.2 – 8.2
Total comprehensive income – – 8.2 646.6 654.8
Securities bought back during on-market buyback, net of transaction costs 27 (2.8) – – – (2.8)
Securities issued from capital raising, net of transaction costs 27 381.5 – – – 381.5
Securities purchased and held in Employee Share Plan (Treasury Shares) 27 (4.6) – – – (4.6)
Distributions to unitholders 29 – – – (541.7) (541.7)
Expense relating to rights and securities granted under share plans, net of tax 28 – (0.8) – – (0.8)
374.1 (0.8) – (541.7) (168.4)
Balance as at 30 June 2013 7,553.9 16.8 11.6 940.2 8,522.5
Balance as at 1 July 2011 7,700.3 21.3 6.6 771.2 8,499.4
Profi t for the period – – – 606.1 606.1
Other comprehensive expense – – (3.2) – (3.2)
Total comprehensive (expense)/income – – (3.2) 606.1 602.9
Securities bought back during on-market buyback, net of transaction costs 27 (524.7) – – – (524.7)
Units issued during the year, net of transaction costs 27 4.2 – – – 4.2
Distributions to unitholders 29 – – – (542.4) (542.4)
Units exercised under share plans transferred to undistributed income 28 – (0.4) – 0.4 –
Vested units purchased on-market 28 – (6.8) – – (6.8)
Expense relating to rights and securities granted under share plans, net of tax 28 – 3.5 – – 3.5
(520.5) (3.7) – (542.0) (1,066.2)
Balance as at 30 June 2012 7,179.8 17.6 3.4 835.3 8,036.1
The above consolidated Statement of Changes in Equity should be read in conjunction with the accompanying notes.
Consolidated Statements of Changes in Equity (continued) FOR THE YEAR ENDED 30 JUNE 2013
Appendix 2 – Example Reporting

Operating and financial reviews: October 2014 20© 2014 KPMG, an Australian partnership. All rights reserved. October 2014. NSW N12375AUD.
for the year ended 30 June 2014 - Wesfarmers Limited and its controlled entities
Financial statements
Wesfarmers annual report 2014 103
financial statements
Income statement Page 104
Statement of comprehensive income Page 105
Balance sheet Page 106
Cash flow statement Page 107
Statement of changes in equity Page 108
notes to the financial statements
About this report Page 109
Segment information Page 111
Key numbers Capital risk Group structure unrecognised items other
1. Income 10. Capital management
15. Financial risk management
18. Associates and joint arrangements
21. Commitments and contingencies
23. Parent disclosures
2. Expenses 11. Dividends and distributions
16. Hedging 19. Subsidiaries 22. Subsequent events 24. Deed of Cross Guarantee
3. Tax expense 12. Equity and reserves
17. Impairment of non-financial assets
20. Discontinued operations
25. Auditors’ remuneration
4. Cash and cash equivalents
13. Earnings per share
26. Related party transactions
5. Trade and other receivables
14. Interest-bearing loans and borrowings
27. Other accounting policies
6. Inventories 28. Share-based payments
7. Property, plant and equipment
29. Director and executive disclosures
8. Goodwill and intangible assets
9. Provisions
signed reports
Directors’ declaration Page 147
Independent auditor’s report Page 148
asX information
Annual statement of coal resources and reserves Page 149
Shareholder information Page 152
Five-year financial history Page 153
Investor information Page 154
Corporate directory Page 155
Contents
95
Wesfarmers | aNNUaL report 2013
Financial statementsfor the year ended 30 June 2013 – Wesfarmers Limited and its controlled entities
Contents Directors’ declaration 176
Independent auditor’s report 177
Annual statement of coal resources and reserves 178
Shareholder information 180
Five-year financial history 182
Investor information 183
Corporate directory 184
Income statement 96
Statement of comprehensive income 97
Balance sheet 98
Cash flow statement 99
Statement of changes in equity 100
Notes to the financial statements 101
1 Corporate information 101
2 summary of significant accounting policies 101
3 segment information 115
4 Income and expenses 118
5 Income tax 119
6 earnings per share 121
7 Dividends paid and proposed 121
8 Cash and cash equivalents 122
9 trade and other receivables 123
10 Inventories 124
11 Investments backing insurance contracts, reinsurance and other recoveries 124
12 Investments in associates 125
13 property, plant and equipment 126
14 Intangible assets and goodwill 128
15 other assets 131
16 trade and other payables 131
17 Interest‑bearing loans and borrowings 132
18 provisions 134
19 Insurance liabilities 136
20 other liabilities 140
21 Contributed equity 141
22 retained earnings 143
23 reserves 143
24 financial risk management objectives and policies 144
25 Hedging activities 154
26 Commitments and contingencies 157
27 events after the balance sheet date 158
28 Interest in jointly controlled assets 159
29 parent disclosures 160
30 subsidiaries 161
31 Deed of Cross Guarantee 167
32 related party transactions 169
33 auditor’s remuneration 169
34 share‑based payment plans 170
35 pension plan 172
36 Director and executive disclosures 173
Example 9 – WesfarmersWesfarmers have grouped notes into six key sections: Key numbers, Capital, Risk, Group structure, Unrecognised items and Other. They have also explained their “basis of materiality” in selecting notes to be included in the financial report, and have reduced the length of the financial report by 37 pages
Re-label & Reorder
Delivering today. Value tomorrow.
Wesfarmers | Annual Report 2014
A CENTURY OF PROGRESS
Source: Wesfarmers Annual Report 2014Date: 09 September 2014
Source: Wesfarmers Annual Report 2013Date: 26 September 2013
for the year ended 30 June 2014
Notes to the financial statements: Segment information
Wesfarmers annual report 2014 111
The Group’s operating segments are organised and managed separatelyaccording to the nature of the products and services provided.
Each segment represents a strategic business unit that offersdifferent products and operates in different industries and markets.The Board and executive management team (the chief operatingdecision-makers) monitor the operating results of the business unitsseparately for the purpose of making decisions about resourceallocation and performance assessment.
The types of products and services from which each reportablesegment derives its revenues are disclosed below. Segmentperformance is evaluated based on operating profit or loss (segmentresult), which in certain respects, is presented differently fromoperating profit or loss in the consolidated financial statements.
Interest income and expenditure are not allocated to operatingsegments, as this type of activity is managed on a group basis.
Transfer prices between business segments are set on an arm’slength basis in a manner similar to transactions with third parties.Segment revenue, expenses and results include transfers betweenbusiness segments. Those transfers are eliminated on consolidationand are not considered material.
The operating segments and their respective types of products andservices are as follows:
retailcoles – Supermarket and liquor retailer, including a hotel portfolio;
– Retailer of fuel and operator of convenience stores; and
– Coles property business operator.
Home Improvement and Office Supplies (HIOS) – Retailer of building material and home and garden improvement
products;
– Servicing project builders and the housing industry; and
– Office supplies products.
Kmart – Retailer of apparel and general merchandise, including toys, leisure,
entertainment, home and consumables; and
– Provision of automotive service, repairs and tyre service.
target – Retailer of apparel, homewares and general merchandise, including
accessories, electricals and toys.
Insurance – Supplier of specialist rural and small business regional insurance;
and
– Supplier of broking services and general insurance through brokingintermediaries.
The Group has classified the Insurance segment as a discontinuedoperation in 2014.
Industrialresources – Coal mining and development; and
– Coal marketing to both domestic and export markets.
Industrial and Safety (WIS) – Supplier and distributor of maintenance, repair and operating
products;
– Manufacture and marketing of industrial gases and equipment;
– Specialised supplier and distributor of industrial safety products andservices; and
– Provider of risk management and compliance services.
chemicals, energy and Fertilisers (WesceF) – Manufacture and marketing of chemicals for industry, mining and
mineral processing;
– Manufacture and marketing of broadacre and horticultural fertilisers;
– National marketing and distribution of LPG and LNG;
– LPG and LNG extraction for domestic and export markets; and
– Manufacture, marketing and distribution of industrial, medical andspecialty gases.
OtherIncludes:
– Forest products: non-controlling interest in Wespine Pty Ltd;
– Property: non-controlling interest in BWP Trust;
– Investment banking: non-controlling interest in Gresham PartnersGroup Limited;
– Private equity investment: non-controlling interests in Gresham PrivateEquity Fund No. 2 and Gresham Private Equity Fund No. 3; and
– Corporate: includes treasury, head office, central support functionsand other corporate entity expenses. Corporate is not considered anoperating segment and includes activities that are not allocated toother operating segments.
SeasonalityRevenue and earnings of various divisions are affected by seasonalityand cyclicality as follows:
– For retail divisions, earnings are typically greater in the Decemberhalf of the financial year due to the impact of the Christmas holidayshopping period;
– For the Resources division, the majority of the entity’s coalcontracted tonnages are renewed on an annual basis from Aprileach calendar year and are subject to price renegotiation on aquarterly basis; and
– For the Chemicals, Energy and Fertilisers division, earnings aretypically greater in the second half of the financial year due to theimpact of the Western Australian winter season break on fertilisersales.
Geographical informationThe table below provides information on the geographical locationof revenue and non-current assets (other than financial instruments,deferred tax assets and pension assets). Revenue from externalcustomers is allocated to a geography based on the location of theoperation in which it was derived. Non-current assets are allocatedbased on the location of the operation to which they relate. Revenueand non-current assets from the Insurance division have beenexcluded.
revenue Non-current assets
2014 2013 2014 2013
$m $m $m $m
Australia 58,959 56,787
1,218 961
4 1
60,181 57,749
28,949 29,558
574 611
5 19
29,528 30,188
New Zealand
Other foreign countries
notes to the financial statements: About this report | for the year ended 30 June 2014
A ceNtury OF PrOGreSS
110 Wesfarmers annual report 2014
the notes to the financial statementsThe notes include information which is required to understand the financial statements and is material and relevant to the operations, financial position and performance of the Group. Information is considered material and relevant if, for example:
– the amount in question is significant because of its size or nature; – it is important for understanding the results of the Group;
– it helps to explain the impact of significant changes in the Group’sbusiness – for example, acquisitions and impairment writedowns; or
– it relates to an aspect of the Group’s operations that is importantto its future performance.
The notes are organised into the following sections:
– Key numbers: provides a breakdown of individual line items in thefinancial statements that the directors consider most relevant and summarises the accounting policies, judgements and estimates relevant to understanding these line items;
– Capital: provides information about the capital managementpractices of the Group and shareholder returns for the year;
– Risk: discusses the Group’s exposure to various financial risks,explains how these affect the Group’s financial position and performance and what the Group does to manage these risks;
– Group structure: explains aspects of the group structure and howchanges have affected the financial position and performance of the Group;
– Unrecognised items: provides information about items that are not recognised in the financial statements but could potentiallyhave a significant impact on the Group’s financial position and performance; and
– Other: provides information on items which require disclosure to comply with Australian Accounting Standards and other regulatory pronouncements however, are not considered critical inunderstanding the financial performance or position of the Group.
Significant changes in the current reporting periodThe financial position and performance of the Group was particularlyaffected by the following events and transactions during the reportingperiod:
– The disposal of the underwriting, premium funding and brokingoperations, which collectively constituted the entire businessoperations of the Wesfarmers’ Insurance division, in June 2014.Wesfarmers recorded a combined pre-tax profit of $1,040 millionduring the year in relation to these discontinued operations (referto note 20);
– The disposal of the Group’s 40 per cent interest in the WesternAustralian-based industrial gas producer and supplier Air LiquideWA Pty Ltd and its associated interest in the Kwinana IndustrialGas Joint Venture in December 2013. On completion of thetransaction Wesfarmers recognised a pre-tax profit of $95 million;
– The carrying value of the Target cash generating unit (CGU)exceeded its recoverable amount and an impairment of$677 million was recognised in respect of its goodwill in‘impairment expenses’. The decrease in the recoverable amountlargely reflects a financial performance in 2014 below expectationsas a result of difficult trading conditions and an increase in thediscount rate on account of the risk associated with Target’sturnaround strategy (refer to note 17);
– The recognition of a $94 million provision for restructuringactivities commenced within the Coles Liquor business;
– The acquisition of additional coal resources, being MineralDevelopment Licence 162, from Peabody Energy Budjero PtyLtd for $70 million in January 2014, which is expected to extendCurragh’s mine life and provide future options to further optimisemine operations;
– The sale and lease back of a portfolio of 27 Bunnings Warehouseproperties for $591 million; and
– A capital return to shareholders of 50 cents per fully-paid ordinaryand partially protected share in November 2013, accompanied bya proportionate share consolidation (refer to note 10).
A CENTURY OF PROGRESS
Appendix 2 – Example Reporting

Operating and financial reviews: October 2014 21© 2014 KPMG, an Australian partnership. All rights reserved. October 2014. NSW N12375AUD.
2014 Financial Report Contents
Directors’ report 25
Remuneration report – audited 34
Lead auditor’s independence declaration 51
FINANCIAL STATEMENTS
Consolidated statement of comprehensive income
52
Consolidated statement of financial position 54
Consolidated statement of changes in equity 56
Consolidated statement of cash flows 58
Notes to the financial statements 59
Directors’ declaration 96
Independent auditor’s report 97
NOTES TO THE FINANCIAL STATEMENTS
Note 1. General information 59
Note 2. Significant accounting policies 59
Note 3. Critical accounting judgements, estimates and assumptions
61
Note 4. Operating segments 62
Note 5. Earnings per share 63
Note 6. Dividends 64
Note 7. Intangible assets and goodwill 65
Note 8 Borrowings 67
Note 9. Notes to the statement of changes in equity and reserves
68
Note 10. Business combinations 70
Note 11. Subsidiaries 76
Note 12. Investments in associates 78
Note 13. Investment in joint venture 81
Note 14. Financial instruments 82
Note 15. Contingencies 83
Note 16. Commitments 84
Note 17. Events after the reporting period 84
Note 18. Profit and loss information 86
Note 19. Share based remuneration 86
Note 20. Taxation 89
Note 21. Notes to the statement of cash flows 91
Note 22. Related party transactions 92
Note 23. Parent entity information 94
Note 24. Remuneration of auditors 95
24 | Steadfast Group Annual Report 2014
Steadfast Group Annual Report 201322
2013 Financial Report Contents
21 Directors’ report
28 Remuneration report – audited
41 Lead auditor’s independence declaration
Financial statements 42 Statement of comprehensive income
43 Statement of financial position
44 Statement of changes in equity
45 Statement of cash flows
46 Notes to the financial statements
89 Directors’ declaration
90 Independent auditor’s report
Notes to the financial statements 46 Note 1. General information
46 Note 2. Significant accounting policies
53 Note 3. Critical accounting judgements, estimates and assumptions
54 Note 4. Operating segments
55 Note 5. Revenue
55 Note 6. Expenses
56 Note 7. Income tax expense/(benefit)
57 Note 8. Current assets – cash and cash equivalents
57 Note 9. Current assets – trade and other receivables
57 Note 10. Current assets – other
57 Note 11. Non-current assets – investments
58 Note 12. Non-current assets – property, plant and equipment
59 Note 13. Non-current assets – intangible assets and goodwill
61 Note 14. Non-current assets – deferred tax assets
61 Note 15. Current liabilities – trade and other payables
62 Note 16. Current liabilities – borrowings
62 Note 17. Current liabilities – income tax payable
62 Note 18. Current liabilities – provisions
63 Note 19. Non-current liabilities – other payables
63 Note 20. Non-current liabilities – borrowings
64 Note 21. Non-current liabilities – deferred tax liabilities
65 Note 22. Non-current liabilities – provisions
65 Note 23. Equity – issued capital
67 Note 24. Equity – reserves
68 Note 25. Equity – non-controlling interest
68 Note 26. Equity – dividends
69 Note 27. Financial instruments
71 Note 28. Key management personnel disclosures
72 Note 29. Remuneration of auditors
73 Note 30. Contingent assets
73 Note 31. Contingent liabilities
73 Note 32. Commitments
73 Note 33. Related party transactions
75 Note 34. Parent entity information
76 Note 35. Business combinations
80 Note 36. Subsidiaries
81 Note 37. Investments in associates
82 Note 38. Interests in joint venture
83 Note 39. Events after the reporting period
87 Note 40. Reconciliation of profit/(loss) after income tax to net cash from operating activities
87 Note 41. Earnings per share
88 Note 42. Share based payments
Example 10 – SteadfastSteadfast applied judgement to their financial statements and removed immaterial notes, reducing them by 18. They also re-ordered and re-wrote accounting policies to aid improvement in communication with a focus on what was significant to the financial statements.
Source: Steadfast Annual Report 2014Date: 27 August 2014
Source: Steadfast Annual Report 2013Date: 30 August 2013
Scale.Strength.Steadfast. Annual Report 2014
Notes to the Financial Statements FOR THE YEAR ENDED 30 JUNE 2014
NOTE 1. GENERAL INFORMATION
This general purpose financial report is for the year ended 30 June 2014 and comprises the consolidated financial statements for Steadfast Group Limited (Steadfast or the Company) and its subsidiaries, and the Group’s interests in associates and a joint venture (Steadfast Group or the Group). These financial statements are presented in Australian dollars, which is Steadfast’s functional and presentation currency.
The Company is a for-profit listed public company limited by shares, incorporated and domiciled in Australia. Its registered office and principal place of business is Level 3, 99 Bathurst Street, Sydney NSW 2000.
A description of the nature of the Group’s operations and its principal activities is included in the Directors’ report, which is not part of the financial report.
This general purpose financial report was authorised for issue by the Board on 27 August 2014.
This year’s financial report is re-ordered and re-written to aid improvement in communication. The flow of information is grouped as follows:
• significant accounting policies and critical accounting judgements, estimates and assumptions – Notes 2 and 3;
• key financial indicators of the Group – Notes 4 to 6;
• significant assets and liabilities – Notes 7 to 8;
• equity related matters – Note 9;
• group structure – Notes 10 to 13;
• risk and unrecognised items – Note 14 to 16; and
• additional information and disclosures required by Accounting Standards – Notes 17 to 24.
NOTE 2. SIGNIFICANT ACCOUNTING POLICIES
A. STATEMENT OF COMPLIANCE
This financial report has been prepared in accordance with the Corporations Act 2001, Australian Accounting Standards and other authoritative pronouncements of the Australian Accounting Standards Board, as appropriate for for-profit oriented entities and the Australian Securities Exchange (ASX) Listing Rules.
International Financial Reporting Standards (IFRS) refer to the overall framework of standards and pronouncements approved by the International Accounting Standards Board. IFRS forms the basis of the Australian Accounting Standards. This financial report of the Group complies with IFRS.
B. BASIS OF PREPARATION OF THE FINANCIAL REPORT
The significant accounting policies adopted in the preparation of this financial report are set out below. The accounting policies adopted in the preparation of this financial report have been applied consistently by all entities in the Group and are the same as those applied for the previous reporting period unless otherwise noted. These financial statements have been prepared under the historical cost convention, modified, where applicable, by the measurement at fair value of certain non-current assets, financial assets and financial liabilities.
I. Changes in accounting polices
The Company has adopted all of the new recognition and measurement requirements, revised or amending Accounting Standards and Interpretations issued by the Australian Accounting Standards Board that are mandatory for the year ended 30 June 2014. There were a number of new and revised Australian Accounting Standards applicable for the current reporting period. Adoption of these standards has not had any material effect on the financial position or performance of the Group.
The Group elected to early adopt AASB2013-3 Amendments to AASB136 – Recoverable Amount Disclosures for Non-Financial Assets, adoption of this standard only affects disclosures in Note 7 Intangible assets and goodwill for the year ended 30 June 2014.
II. Reclassification of comparatives
Certain prior year comparative information has been revised in this financial report to conform to the current period’s presentation. The reclassifications are for:
• improving readability of the statement of comprehensive income and the statement of financial position by providing further details/breakdown of expenses and assets and liabilities on the face of these two statements; and
• aligning the nature of the rebate to Steadfast Network Brokers as accrued expenditure (which is grouped with trade and other payables). The rebate was classified as a provision in the prior period. The comparatives of current trade and other payables and current provisions were increased and decreased by $6.020 million, respectively. The reclassification has no profit and loss impact.
III. Rounding
The Group is of the kind referred to in the class order 98/100 dated 10 July 1998 issued by the Australian Securities & Investment Commission. In accordance with that class order, amounts in this financial report have been rounded to the nearest thousand dollars, unless otherwise stated.
C. REVENUE RECOGNITION
Revenue is recognised when it is probable that the economic benefit will flow to the Group and the revenue can be reliably measured.
Revenue is measured at the fair value of the consideration received or receivable.
Steadfast Group Annual Report 2014 | 59
Re-label & Reorder / Rewrite / RemoveAppendix 2 – Example Reporting

The information contained in this document is of a general nature and is not intended to address the objectives, financial situation or needs of any particular individual or entity. It is provided for information purposes only and does not constitute, nor should it be regarded in any manner whatsoever, as advice and is not intended to influence a person in making a decision, including, if applicable, in relation to any financial product or an interest in a financial product. Although we endeavour to provide accurate and timely information, there can be no guarantee that such information is accurate as of the date it is received or that it will continue to be accurate in the future. No one should act on such information without appropriate professional advice after a thorough examination of the particular situation.
To the extent permissible by law, KPMG and its associated entities shall not be liable for any errors, omissions, defects or misrepresentations in the information or for any loss or damage suffered by persons who use or rely on such information (including for reasons of negligence, negligent misstatement or otherwise).
© 2014 KPMG, an Australian partnership and a member firm of the KPMG network of independent member firms affiliated with KPMG International Cooperative (“KPMG International”), a Swiss entity. All rights reserved.
The KPMG name, logo and “cutting through complexity” are registered trademarks or trademarks of KPMG International Cooperative (“KPMG International”).
Liability limited by a scheme approved under Professional Standards Legislation.
October 2014. NSW N12375AUD.
kpmg.com.au