Review of Literature - INFLIBNETshodhganga.inflibnet.ac.in/bitstream/10603/9024/10/09_chapter...
65
Review of Literature
Transcript of Review of Literature - INFLIBNETshodhganga.inflibnet.ac.in/bitstream/10603/9024/10/09_chapter...

Review of Literature

Review of literature
6
CHAPTER 2
REVIEW OF LITERATURE
2.1. History of ethanol as biofuel
Ethanol as a fuel has been used throughout man‟s long history. Even the
invention of ignition engines was done with bioethanol. Ethanol was one of the
most popular lamp illuminants used in 1850s and approximately 90 million
gallons ethanol was produced in the United States. But due to the tax
imposition on ethanol to assist in financing the civil war and the cheaper price
of kerosene, it quickly replaced ethanol as the premier illuminant in 1861
(Morris, 1993). Then in 1906, the alcohol tax was lifted, which renewed the
interest in ethanol and in 1908, Henry Ford designed the automobile car „Model
T‟ to run on ethanol. By 1914, the production of ethanol had rebounded slightly
and reached 10 million gallons (Morris, 1993). But in 1919, due to the
emergence of petroleum as fuel, the use of ethanol as fuel decreased again. This
prohibition was ended in 1933 and by the early 1940s the production of ethanol
rebound again when it was used during World War II for fuel and to make
synthetic rubber. During this period, about 600 million gallons of ethanol was
produced annually in the U.S (Morris, 1993). At the end of World War II,
demand for ethanol dwindled and continued to decline for the next two decades,
mostly due to cheap petroleum imports. But again the oil embargo by Arab
countries in 1973 created petroleum shortages, resulting in significant increase
in gasoline price (Campbell and Laherrere, 1998). Since the 1970‟s, the gasoline
shortage accelerated the concerns about the rising prices for crude oil and
increasing political instability due to which the use of ethanol as biofuel is again
under consideration worldwide.
2.2. Bioethanol: First and Second generations
2.2.1. First generation bioethanol
The bioethanol produced by fermentation of sugar (sugarcane juice, molasses,
sugar beet juice, fruit juice) and starchy feedstocks (wheat, corn, potato) are
commonly known as first generation bioethanol (Antony et al., 2007). The
ethanol production methods used are enzymatic digestion (to release sugars

Review of literature
7
from stored starches), fermentation of the sugars, distillation and drying. 1st
generation bioethanol have played an important role in establishing the
infrastructure and policy drivers required to support renewable transport fuels
in the international market place (EIA, 2008). However, there are a number of
concerns about the potential drawbacks of 1st generation bioethanol (IEA, 2008),
such as;
2.2.1.1. Competition between food vs fuel: It is clear that the development of
a bioenergy options, particularly food-based bioethanol may adversely affect
food demands. It is obvious fact that higher food prices will have devastating
effects on the developing world, where disposable incomes are lower. This alarm
to use food resources for alternative biofuels
2.2.1.2. Deforestation: The constant production of first generation biofuels
might lead to major deforestation and lant thus available may changed from
permanent forest cover to agriculture.
2.2.1.3. Multi-feed stock flexibility: For commercial viability, technologies
and plant designs, which are able to process a number of different feedstocks in
a flexible way is preferable. If many single food crops used for biofuels are
seasonal then to operate a plant round the year, the storage of raw material
may accelerate the cost of biofuel production.
2.2.2. Second generation bioethanol
Now, it is clearly understood that the first-generation bioethanol production is
not a sustainable approach and these increasing criticisms have raised the
attention to use non-food crops for the production of second generation
bioethanol. The second-generation bioethanol is produced from lignocellulosic
biomass comprised of the residual non-food parts of the food-crops, as well as
other crops that are not used for food purposes and also municipal, industrial
and construction waste. Second-generation biofuels are expected to reduce net
carbon emission, increase energy efficiency and reduce energy dependency,
potentially overcoming the limitations of first-generation biofuels (Antizar-
Ladislao and Turrion-Gomez, 2008). The other major benefits of switching to
cellulosic ethanol are its renewable nature, long term sustainability, low net
carbon emission, high energy efficiency, low energy dependency, increase in
national security and diversifying rural economies (IEA, 2008). However, there is

Review of literature
8
still much work to be done in terms of improving second generation biofuel
technology pathways, to reduce costs and to improve performance and
reliability of the conversion process.
2.3. Current Status of Bioethanol
2.3.1. Current status of Bio-ethanol production worldwide
Bioethanol production worldwide has increased considerably since the oil crisis
in 1970 (Campbel and Laherrare, 1998). Its market grew from less than a billion
litres in 1975 to more than 65 billion litres in 2008 (Biofuel Platform, 2010), and
is expected to reach 100 billion litres in 2015 (Licht, 2005). According to IEA
(2008) the total worldwide demand for oil is projected to rise by 1% per year
mostly due to increasing demand in energy market of developing countries,
especially India (3.9%/year) and China (3.5%/year). With regard to bioethanol,
the share of the US in the global production is 50% and Brazil provides 39 % of
the total global supply, while the share of OECD-Europe is 5 % (Gnansounou,
2010). Since Brazil is one of the most developed nations in ethanol production,
almost all the Brazilian vehicles use either pure ethanol or the blend of gasoline
and ethanol (75:25) (Mussatto et al., 2010; RFA, 2010). The high percentage in
which ethanol is added to gasoline in Brazil is also an effort on part of the
government to reduce the imports of oil (Prasad et al., 2007). As a result of these
efforts, ethanol production in Brazil has substantially risen from 555 million
litres (1975/76) to 16 billion litres (2005/06) (Orellana and Bonalume Neto,
2006; Souza, 2006), but a major reason for this is sugarcane juice.
Interestingly, the innovations introduced by the automobile industry with flex-
fuel cars, which may be fueled with ethanol and/or gasoline in any proportion
increased the market for ethanol (Anfavea, 2005; Souza, 2006).
It is noteworthy that the United States (US), the largest consumer of petroleum
products (2.42 billion litres/day or 20.7 million barrels/day in 2007), meets its
demand by importing about 58% i.e., 1.4 billion litres or 12 million barrels/day
(EIA, 2008). It is predicted that the gasoline consumption will rise further along
with the rising population, as gasoline is a primary energy source that meets
non-commercial transportation demands (EIA, 2008). Similar to Brazil, the US
is also a big investor in bioethanol research (Solomon et al., 2007), and has
increased the ethanol production from 6.16 billion litres or 1.63 billion gallons

Review of literature
9
in 2000, to 39.3 billion litres or 10.4 billion gallons in 2009, representing a 7-
fold increase (Petrova and Ivanova, 2010). Currently over 95% of ethanol
production in the United States comes from corn, while the rest is made from
wheat, barley, cheese whey, and beverage residues (Solomon et al., 2007).
However, it is expected that about 1.53 billion litres or 405 million gallons of
cellulosic ethanol will be produced by the end of 2012 (Solomon et al., 2007).
In Europe, maximum amount of ethanol is produced from wheat and sugar-beet
and France, Germany and Spain are the European countries more strongly
committed to ethanol production (Prieur-Vernat and His, 2006). The European
Union strategy for biofuels is also to decrease their dependence on oil and
reduce the negative impact caused to the environment. The share of OECD
countries in global oil demand is also expected to decrease from 57% in 2007 to
43% in 2030 (IEA, 2009).
China has also invested much in the production of ethanol, and since it is the
world‟s largest auto market, it imported about 52% of the total transportation
oil consumed in 2008 (Fang et al., 2010). The production of ethanol for biofuels
began in China in 2001, using corn as a raw material, and by 2007, four grain-
based ethanol plants with the production of about 1.75 billion litres or 1.4
million metric tons (MMT) ethanol have been developed. However, due to the
competition for ethanol and food applications, projects on fuel ethanol based on
grains were restricted and development of “non-food ethanol” (ethanol made
from non-food crops) was supported by the Chinese government (Fang et al.,
2010). Many technologies of ethanol production based on non-food crops, such
as cassava, sweet sorghum, sweet potato, Jerusalem artichoke, Kudzuvine root,
and others, are being developed (Li and Chan-Halbrendt, 2009). Till now, the
exclusive application of gasoline containing 10% ethanol to motor vehicles has
been enforced in all areas of Heilongjiang, Jilin, Liaoning, Henan, Anhui,
Guangxi and selected areas of Hebei, Shandong, Jiangsu and Hubei provinces
(Fang et al., 2010). Similarly, Thailand has also invested in the production of
ethanol. In 2007, there were 7 ethanol plants with a total capacity of 955
thousand litres/day, comprising 130 thousand litres/day cassava ethanol and
825 thousand litres/day molasses ethanol and as a result of government
promotions, 12 new plants with a total installed capacity of 1.97 Million
litres/day are being constructed (Silalertruksa and Gheewala, 2009).

Review of literature
10
Other countries like Japan and Korea etc. are also in race and hence an
indigenous and affordable source of energy has become a high priority in order
to surmount the issue of energy security and sustainability. The production of
biofuels in Japan started in 2003 and by 2007 the total amount of bioethanol
production reached approximately 30 thousand litres per year (Matsumoto et
al., 2009). Similarly Korea is also very concerned about its high CO2 emission
and dependence on imported crude oil (Kim et al., 2010). The annual
consumption of gasoline in Korea is about 10 billion litres and 3 or 5 million
litres of ethanol would be needed in order to implement 3% ethanol-blending
(E3) or 5% ethanol-blended gasoline (E5) countrywide (Kim et al., 2010).
Therefore, the Korean government announced its plan to increase the supply of
transportation biofuels from 0.2 billion litres (2008) to 5 billion litres by 2030
(KMKE, 2008).
2.3.2. Status of bioethanol production in India
In the year 2003, the Planning Commission of the Government of India brought
out an extensive report on the development of biofuel (Planning Commission,
2003) and bioethanol was identified as a principal biofuel to be developed for
the nation. In India the ethanol blend in gasoline was proposed to 10 % by
2011-2012 and 5% ethanol blend in gasoline was made mandatory in 11 states
and 3 Union territories of the nation (Sukumaran et al., 2010). In 2006, the
demand for ethanol for 5% gasoline doping/blending level was 0.64 billion
Liters, while the estimated current demand for 10 % blending is projected to be
2.2 billion Liters in 2017 (Sukumaran et al., 2010). According to 2006 estimate,
the actual production of ethanol was only 0.39 billion liters which was not
sufficient to meet the fuel demand if the entire gasoline had to be doped at 5%
level.
In India, ethanol is mainly produced from sugarcane molasses, but the
substrate has to compete with the food demand and therefore cannot supply the
required amount of ethanol. Therefore, the nation needs to develop bio-ethanol
technologies, which use biomass feedstock that does not have food or feed
value. The most appropriate bio-ethanol technology for the nation would be to
produce it from lignocellulosic biomass, such as rice straw, rice husk, wheat
straw, sugarcane tops and bagasse, municipal waste and forest waste
(Sukukumaran et al., 2009). According to Kim and Dale (2004), the total

Review of literature
11
bioethanol production from plant biomass is estimated to be 491Giga Liters
(GL)/ year globally. India alone has the capacity to produce 25% i.e., 123
GL/year of the total world ethanol production, if the entire lignocellulosic
residues available are used for ethanol production. Hence, to contemplate a
bioethanol production plant, the lignocellulosic biomass assessment with
geographical distribution and accurate information on availability of biomass in
different parts of the country is a pre-requisite. With this in view during the
Ninth Plan, the Ministry had sponsored 500 taluka level biomass assessment
studies in 23 States to compile data on availability of lignocellulosic biomass. As
an extension of this effort, a project for preparation of “Biomass Resource Atlas
for India” has been jointly sponsored to Indian Institute of Science (IISc),
Bangalore, and Regional Remote Sensing Service Centre (RRSSC), Bangalore,
which aims at integration of the data on biomass availability obtained from
taluka-level studies and from other reliable sources, with information on crop
distribution pattern derived from GIS-based maps provided by RRSSC. Some
major plant species along with their biomass types and biomass production has
been listed in table 2.1.
2. 4. Lignocellulose
Plant biomass is the most abundantly available and renewable natural resource
on earth. Lignocellulose is comprised of three main polymers, cellulose,
hemicellulose and lignin (Figure 2.1) and together termed as lignocellulose. The
chemical properties of the components of lignocellulosics make them a
substrate for enormous biotechnological products (Kuhad and Singh, 1993;
Kuhad et al., 1997; Sun and Cheng, 2002; Hahn-Hagerdal et al., 2007; Kuhad et
al., 2007).
2.4.1. Cellulose
Cellulose is a glucan polymer of D-glucopyranose units, which are linked
together by β-1, 4-glucosidic bonds. The wood cellulose has an average degree
of polymerization (DP) of at least 9,000–10,000 and possibly as high as 15,000.
An average DP of 10,000 would correspond to a linear chain length of
approximately 5 μm in wood. An approximate molecular weight for cellulose
ranges from about 10,000 to 150,000 Dalton (Goring and Timell, 1962).

Review of literature
12
Table 2.1: Availability of plant biomass (lignocellulosic material) biomass
data at national level
Species Biomass
Type
Biomass
(KT/Yr)
Total Biomass
(KT/Yr) Species
Biomass
Type
Biomass
(KT/Yr)
Total Biomass
(KT/Yr)
Arhar Husk 606.2
5658.2
Mango
Bark 2.049
8.54 Stalks 5052.0 Branches 2.049
Babul
Bark 499.1
2079.0
Leaves 2.393
Branches 499.1 Twig 2.049
Leaves 581.7
Mesquite
Bark 28.58
119.08 Twig 499.1 Branches 28.58
Bajra
Cobs 1972.3
15810.71
Leaves 33.34
Husk 1793.0 Twig 28.58
Stalks 11953.0 Mustard
Husk 1553.2 8309.8
Bamboo Leaves 92.41
2466.41 Stalks 6756.6
Stalks 2374.0
Neem
Bark 2.049
8.54 Banana Residue 11936.5 11936.5 Branches 2.049
Chir pine
Bark 0.484
2.007
Leaves 2.393
Branches 0.484 Twig 2.049
Leaves 0.555 Paddy
Husk 19938.6 169478.4
Twig 0.484 Straw 149539.8
Coconut
Fronds 7253.8
11734.4 Salvadora sp.
Bark 3.069
12.801 Husk & Pith 3166.3 Branches 3.069
Shell 1314.3 Leaves 3.594
Conifers
Bark 82.14
328.56
Twig 3.069
Branches 82.14
Shisham
Bark 80.52
335.57 Leaves 82.14 Branches 80.52
Twig 82.14 Leaves 94.01
Cotton
Boll shells 6320.6
43202.0
Twig 80.52
Husk 6320.6 Sugarcane Tops & Leaves 13211.2 13211.2
stalks 30560.8 Sunflower Stalks 1391.8 1391.8
Cotton wood
Bark 2.049
8.54 Teak
Bark 1421.2
5921.7 Branches 2.049 Branches 1421.2
Leaves 2.393 Leaves 1658.1
Twig 2.049 Twig 1421.2
Eucalyptus
Bark 341.1
1463.2.4
Tobacco Stalks 316.6 316.6
Branches 341.1 Turmeric Stalks 28.7 28.7
Leaves 398.0
Umbrella
thorn Acacia
Bark 160.85
670.15 Twig 220.2 Branches 160.85
Residues 162.8 Leaves 187.6
Groundnut shell Shell 2044.6
15675.5 Twig 160.85
Stalks 13630.9 Wheat
Pods 18650.4 111902.4
Jowar
Cobs 5044.8
29827.5
Stalks 93252.0
Husk 2017.9
White mulberry
Bark 0.959
4.007 Stalks 17152.4 Branches 0.959
Maize Cobs 5612.4
28814.1 Leaves 1.13
Stalks 23201.7 Twig 0.959
Source: (http://lab.cgpl.iisc.ernet.in/Atlas/Tables/Tables.aspx); Kuhad et al. (2011a)

Review of literature
13
There are several types of cellulose in wood: crystalline and noncrystalline and
accessible and nonaccessible. Most wood-derived cellulose is highly crystalline
and may contain as much as 65% crystalline regions. The remaining portion
has a lower packing density and is referred to as amorphous cellulose.
Accessible and nonaccessible refer to the availability of the cellulose to water,
microorganisms, etc. The surfaces of crystalline cellulose are accessible but the
rest of the crystalline cellulose is nonaccessible, whereas, most of the
noncrystalline cellulose is accessible but part of the noncrystalline cellulose is
so covered with both hemicelluloses and lignin that it becomes nonaccessible
(Rowell et al., 2005; Kuhad et al., 2011a). Concepts of accessible and
nonaccessible cellulose are very important in moisture sorption, pulping,
chemical modification, extractions, and interactions with microorganisms.
2.4.2. Hemicelluloses
Unlike cellulose, hemicelluloses are not chemically homogenous (Eriksson et al.,
1990; Kuhad et al., 1997; Perez et al., 2002; Kapoor, 2007; Kuhad et al., 2011a).
The hemicelluloses are comprised of both linear and branched hetero-polymers
of D-xylose, L-arabinose, D-mannose, D-glucose, D-galactose and D-glucuronic
acid (Figure 2a). In general, the hemicellulose fraction of woods consists of a
collection of polysaccharide polymers with a lower DP than cellulose (100–200)
and containing mainly the sugars D-xylopyranose, D-glucopyranose, D-
galactopyranose, L-arabinofuranose, D-mannopyranose, D-
glucopyranosyluronic acid, and D-galactopyranosyl-uronic acid with lower
amounts of other sugars. They usually contain a backbone consisting of one
repeating sugar unit linked β-(1→4) with branch points (1→2), (1→3), and/or
(1→6). Hemicelluloses usually consist of more than one type of sugar unit and
called accordingly e.g., galactoglucomanan, arabinoglucuronoxylan,
arabinogalactan, glucuronoxylan, glucomannan, etc. The hemicelluloses also
contain acetyl- and methyl-substituted groups (Rowell et al., 2005). The
hemicellulose from hardwood and agricultural residues are typically rich in
xylan, while, on the other hand, softwood contains more mannan and less xylan
(Kuhad et al., 1997; Perez et al., 2002; Kapoor et al., 2007; Olofsson et al., 2008;
Moxley et al., 2009; Kuhad et al., 2011a).
Review of literature
14
Figure 2.1: Structure of different components of lignocellulosic biomass
Source: Kuhad et al., 2011a
2.4.2.1. Soft wood hemicellulose
Galacto-mannans are the principal hemicelluloses in soft wood. Their backbone
is a linear chain built up by 1, 4-linked β-D-gluco-pyranose and β-D-manno-
pyranose units (Figure 2b). The mannose and glucose units in the backbone are
partially substituted at C-2 and C-3 positions by acetyl groups, approximately 1
per 3-4 hexose units as reviewed earlier (Kuhad et al., 1997). Arabino-
glucuronoxylan is another major hemicellulosic sugar and is composed of 1,4-
linked-β-D-xylopyranose units. This chain is substituted at C-2 by 4-o-Methyl-
α-D-glucuronic acid group with approximately two such units per ten xylose
units. The xylose backbone is also substituted by α-L-arabino-pyranose units,
on the average 1.3 residue per ten xylose units (Kuhad et al., 1997, 2007,
2011a, b; Perez et al., 2002). Arabino-galactan is a minor component in both
softwoods and hardwoods. The backbone of this galactan is built up by 1, 3-
linked α-D-galacto-pyranose units, and almost every galactose unit is
substituted at C-6 position.

Review of literature
15
A
cetyl-galactoglucomannan (softwoods)
O-acetyl-4-O-methylglucuronoxylan (hardwoods) glucomannans (hardwoods)
B
O
O
O OO
O
O
O
O
OO
O
O
O
O
OOH
OH
OH
OH
OH OH
OAc
OAcOAc
CH3O
COOH
OH
OH
O
O
O OO
O
O
O
O
OO
O
O
O
O
OOH
OH
OH
OH
OH OH
OAc
OAcOAc
CH3O
COOH
OH
OH
O
O
O O
O
O
OO
OO
O
OH HO OH OH HO OH OH
OH
OH
OHHO
CH2AcO
OAc
CH2OH
CH2OH
CH2OH
O
CH2OH
O
O
O O
O
O
OO
OO
O
OH HO OH OH HO OH OH
OH
OH
OHHO
CH2AcO
OAc
CH2OH
CH2OH
CH2OH
O
CH2OH
O
O
O OO
O
O
O
O
OO
O
O
O
O
OOH
OH
OH
OH
OH OH
OAc
OAcOAc
CH3O
COOH
OH
OH
O
O
O OO
O
O
O
O
OO
O
O
O
O
OOH
OH
OH
OH
OH OH
OAc
OAcOAc
CH3O
COOH
OH
OH
O
O
O O
O
O
OO
OO
O
OH HO OH OH HO OH OH
OH
OH
OHHO
CH2HO
OAc
CH2OH
CH2OH
CH2OH
O
CH2OH
O
O
O O
O
O
OO
OO
O
OH HO OH OH HO OH OH
OH
OH
OHHO
CH2HO
OAc
CH2OH
CH2OH
CH2OH
O
CH2OH
O
O
O OO
O
O
O
O
OO
O
O
O
O
OOH
OH
OH
OH
OH OH
OAc
OAcOAc
CH3O
COOH
OH
OH
O
O
O OO
O
O
O
O
OO
O
O
O
O
OOH
OH
OH
OH
OH OH
OAc
OAcOAc
CH3O
COOH
OH
OH
O
O
O O
O
O
OO
OO
O
OH HO OH OH HO OH OH
OH
OH
OHHO
CH2HO
OAc
CH2OH
CH2OH
CH2OH
O
CH2OH
O
O
O O
O
O
OO
OO
O
OH HO OH OH HO OH OH
OH
OH
OHHO
CH2HO
OAc
CH2OH
CH2OH
CH2OH
O
CH2OH
O
O
O OO
O
O
O
O
OO
O
O
O
O
OOH
OH
OH
OH
OH OH
OAc
OAcOAc
CH3O
COOH
OH
OH
O
O
O OO
O
O
O
O
OO
O
O
O
O
OOH
OH
OH
OH
OH OH
OAc
OAcOAc
CH3O
COOH
OH
OH
O
O
O O
O
O
OO
OO
O
OH HO OH OH HO OH OH
OH
OH
OHHO
CH2HO
OAc
CH2OH
CH2OH
CH2OH
O
CH2OH
O
O
O O
O
O
OO
OO
O
OH HO OH OH HO OH OH
OH
OH
OHHO
CH2HO
OAc
CH2OH
CH2OH
CH2OH
O
CH2OH
O
O
O OO
O
O
O
O
OO
O
O
O
O
OOH
OH
OH
OH
OH OH
OAc
OAcOAc
CH3O
COOH
OH
OH
O
O
O OO
O
O
O
O
OO
O
O
O
O
OOH
OH
OH
OH
OH OH
OAc
OAcOAc
CH3O
COOH
OH
OH
O
O
O O
O
O
OO
OO
O
OH HO OH OH HO OH OH
OH
OH
OHHO
CH2HO
OAc
CH2OH
CH2OH
CH2OH
O
CH2OH
O
O
O O
O
O
OO
OO
O
OH HO OH OH HO OH OH
OH
OH
OHHO
CH2HO
OAc
CH2OH
CH2OH
CH2OH
O
CH2OH
OHO
O
O OO
O
O
O
O
OO
O
O
O
O
OOH
OH
OH
OH
OH OH
OAc
OAcOAc
CH3O
COOH
OH
OH
O
O
O OO
O
O
O
O
OO
O
O
O
O
OOH
OH
OH
OH
OH OH
OAc
OAcOAc
CH3O
COOH
OH
OH
O
O
O O
O
O
OO
OO
O
OH HO OH OH HO OH OH
OH
OH
OHHO
CH2HO
OAc
CH2OH
CH2OH
CH2OH
O
CH2OH
O
O
O O
O
O
OO
OO
O
OH HO OH OH HO OH OH
OH
OH
OHHO
CH2HO
OAc
CH2OH
CH2OH
CH2OH
O
CH2OH
O
O
O OO
O
O
O
O
OO
O
O
O
O
OOH
OH
OH
OH
OH OH
OAc
OAcOAc
CH3O
COOH
OH
OH
O
O
O OO
O
O
O
O
OO
O
O
O
O
OOH
OH
OH
OH
OH OH
OAc
OAcOAc
CH3O
COOH
OH
OH
O
O
O O
O
O
OO
OO
O
OH HO OH OH HO OH OH
OH
OH
OHHO
CH2HO
OAc
CH2OH
CH2OH
CH2OH
O
CH2OH
O
O
O O
O
O
OO
OO
O
OH HO OH OH HO OH OH
OH
OH
OHHO
CH2HO
OAc
CH2OH
CH2OH
CH2OH
O
CH2OH
O
O
O
O OO
O
O
O
O
OO
O
O
O
O
OOH
OH
OH
OH
OH OH
OAc
OAcOAc
CH3O
COOH
OH
OH
O
O
O OO
O
O
O
O
OO
O
O
O
O
OOH
OH
OH
OH
OH OH
OAc
OAcOAc
CH3O
COOH
OH
OH
O
O
O O
O
O
OO
OO
O
OH HO OH OH HO OH OH
OH
OH
OHHO
CH2HO
OAc
CH2OH
CH2OH
CH2OH
O
CH2OH
O
O
O O
O
O
OO
OO
O
OH HO OH OH HO OH OH
OH
OH
OHHO
CH2HO
OAc
CH2OH
CH2OH
CH2OH
O
CH2OH
O
O
O OO
O
O
O
O
OO
O
O
O
O
OOH
OH
OH
OH
OH OH
OAc
OAcOAc
CH3O
COOH
OH
OH
O
O
O OO
O
O
O
O
OO
O
O
O
O
OOH
OH
OH
OH
OH OH
OAc
OAcOAc
CH3O
COOH
OH
OH
O
O
O O
O
O
OO
OO
O
OH HO OH OH HO OH OH
OH
OH
OHHO
CH2HO
OAc
CH2OH
CH2OH
CH2OH
O
CH2OH
O
O
O O
O
O
OO
OO
O
OH HO OH OH HO OH OH
OH
OH
OHHO
CH2HO
OAc
CH2OH
CH2OH
CH2OH
O
CH2OH
O
O
O OO
O
O
O
O
OO
O
O
O
O
OOH
OH
OH
OH
OH OH
OAc
OAcOAc
CH3O
COOH
OH
OH
O
O
O OO
O
O
O
O
OO
O
O
O
O
OOH
OH
OH
OH
OH OH
OAc
OAcOAc
CH3O
COOH
OH
OH
O
O
O O
O
O
OO
OO
O
OH HO OH OH HO OH OH
OH
OH
OHHO
CH2HO
OAc
CH2OH
CH2OH
CH2OH
O
CH2OH
O
O
O O
O
O
OO
OO
O
OH HO OH OH HO OH OH
OH
OH
OHHO
CH2HO
OAc
CH2OH
CH2OH
CH2OH
O
CH2OH
O
O
O OO
O
O
O
O
OO
O
O
O
O
OOH
OH
OH
OH
OH OH
OAc
OAcOAc
CH3O
COOH
OH
OH
O
O
O OO
O
O
O
O
OO
O
O
O
O
OOH
OH
OH
OH
OH OH
OAc
OAcOAc
CH3O
COOH
OH
OH
O
O
O O
O
O
OO
OO
O
OH HO OH OH HO OH OH
OH
OH
OHHO
CH2HO
OAc
CH2OH
CH2OH
CH2OH
O
CH2OH
O
O
O O
O
O
OO
OO
O
OH HO OH OH HO OH OH
OH
OH
OHHO
CH2HO
OAc
CH2OH
CH2OH
CH2OH
O
CH2OH
OHO
O
O OO
O
O
O
O
OO
O
O
O
O
OOH
OH
OH
OH
OH OH
OAc
OAcOAc
CH3O
COOH
OH
OH
O
O
O OO
O
O
O
O
OO
O
O
O
O
OOH
OH
OH
OH
OH OH
OAc
OAcOAc
CH3O
COOH
OH
OH
O
O
O O
O
O
OO
OO
O
OH HO OH OH HO OH OH
OH
OH
OHHO
CH2HO
OAc
CH2OH
CH2OH
CH2OH
O
CH2OH
O
O
O O
O
O
OO
OO
O
OH HO OH OH HO OH OH
OH
OH
OHHO
CH2HO
OAc
CH2OH
CH2OH
CH2OH
O
CH2OH
O
O
O OO
O
O
O
O
OO
O
O
O
O
OOH
OH
OH
OH
OH OH
OAc
OAcOAc
CH3O
COOH
OH
OH
O
O
O OO
O
O
O
O
OO
O
O
O
O
OOH
OH
OH
OH
OH OH
OAc
OAcOAc
CH3O
COOH
OH
OH
O
O
O O
O
O
OO
OO
O
OH HO OH OH HO OH OH
OH
OH
OHHO
CH2HO
OAc
CH2OH
CH2OH
CH2OH
O
CH2OH
O
O
O O
O
O
OO
OO
O
OH HO OH OH HO OH OH
OH
OH
OHHO
CH2HO
OAc
CH2OH
CH2OH
CH2OH
O
CH2OH
O
(i) (ii) (iii) (iv)
(v) (vi) (vii)
Figure 2.2: (A) Structure of monosaccharides commonly present in xylan
backbone (where (i) β-D-glucopyranose; (ii) α-L-rhamnopyranose; (iii) α-L-
fucopyranose; (iv) β-D-xylopyranose; (v) β-D-mannopyranose; (vi) β-D-
galactopyranose and (vii) α-L-arabinofuranose); (B) Structures of polymeric
units of softwood and hardwood xylans.
Source: Kuhad et al., 2011b

Review of literature
16
2.4.2.2. Hardwood hemicellulose
The o-acetyl-4-o-Methyl-glucurono-β-xylan (commonly known as
glucuronoxylan) is the major component of hard wood hemicelluloses (Kuhad et
al., 1997; Pereira et al., 2003) (Figure 2B). The xylan content varies between 15-
30% in different hard wood species. The backbone of xylan consists of β-D-xylo-
pyranose units linked by 1, 4-bonds, while seven of ten xylose units are
substituted by acetyl group at C-2 or C-3 position and in one of ten xylose
units, the 4-o-methy1-α-D-glucuronic acid residue unit is linked at C-1, 2
positions to the hemicellulose backbone (Bastawde et al., 1992; Kuhad et al.,
1997; Perez et al., 2002; Kapoor, 2007). Gluco-mannan is another hemicellulose
in hard woods (Figure 2). This polysaccharide comprises 2% to 5% of the wood
and is composed of β-D-gluco-pyranose and β-D- manno-pyranose units by 1,
4- bonds. Depending on the wood species, the glucose: mannose ratio varies
between 1:1 and 1:2 (Kuhad et al., 1997; Perez et al., 2002; Rowel et al., 2005;
Kapoor, 2007).
2.3.3. Lignin
Lignin is amorphous and highly complex polymer of phenylpropanoid units and
is considered to be an encrusting substance in the plant biomass (Kuhad et al.,
1997). The precursors of lignin biosynthesis are p-coumaryl alcohol, coniferyl
alcohol, and sinapyl alcohol. p-coumaryl alcohol is a minor precursor of both
softwood and hardwood lignins. Whereas, the coniferyl alcohol is the
predominate precursor of softwood lignin, and coniferyl and sinapyl alcohol are
both precursors of hardwood lignin (Alder, 1977). Softwood lignin has methoxyl
content of ~15–16%, while, hardwood lignin has a methoxyl content of ~21%.
Moreover ecological factors such as age of the wood, climate, plant sustenance
and amount of sunlight also affect the chemical structure of lignin (Kuhad and
Singh, 1993; Kuhad et al., 1997) Lignin does not have a single repeating unit
like cellulose does, but instead consists of a complex arrangement of
substituted phenolic units. Lignins can be classified in several ways, but they
are usually divided according to their structural elements. All wood lignins
consist mainly of three basic building blocks of guaiacyl, syringyl, and p-
hydroxyphenyl moieties, although other aromatic units also exist in many
different types of woods. There is a wide variation of structures within different
wood species. The lignin content of softwoods is usually in the range of 18–25%,
Review of literature
17
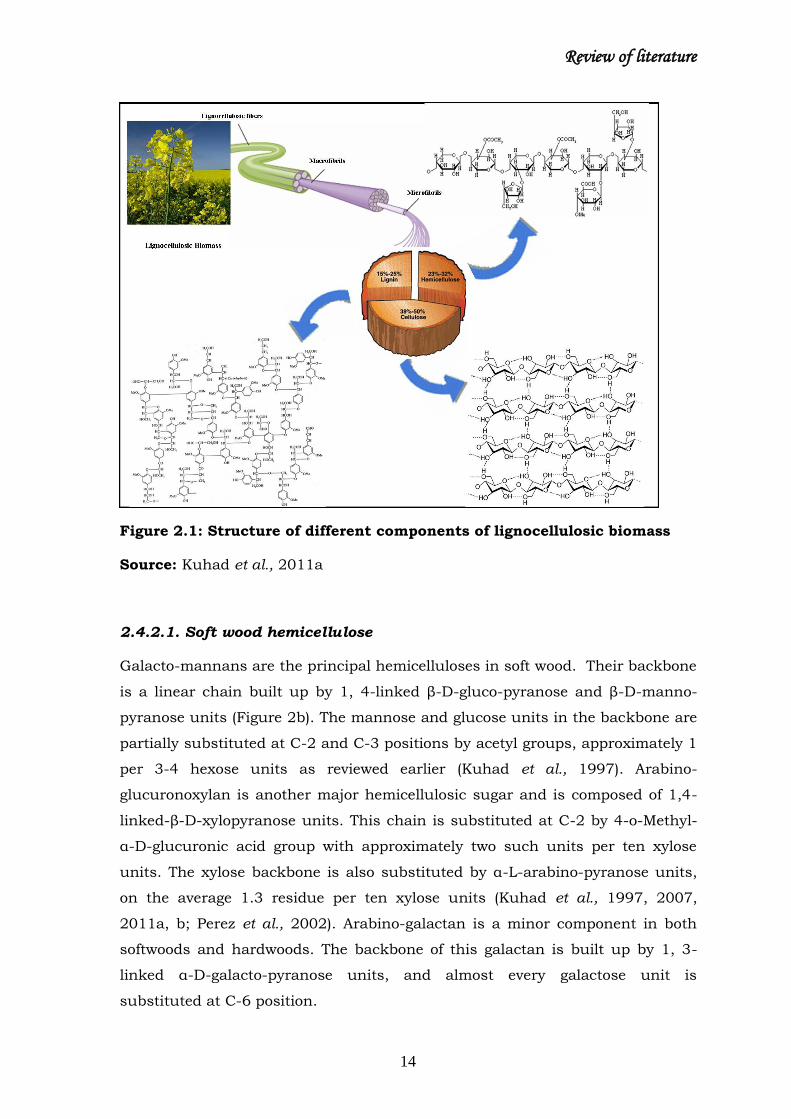
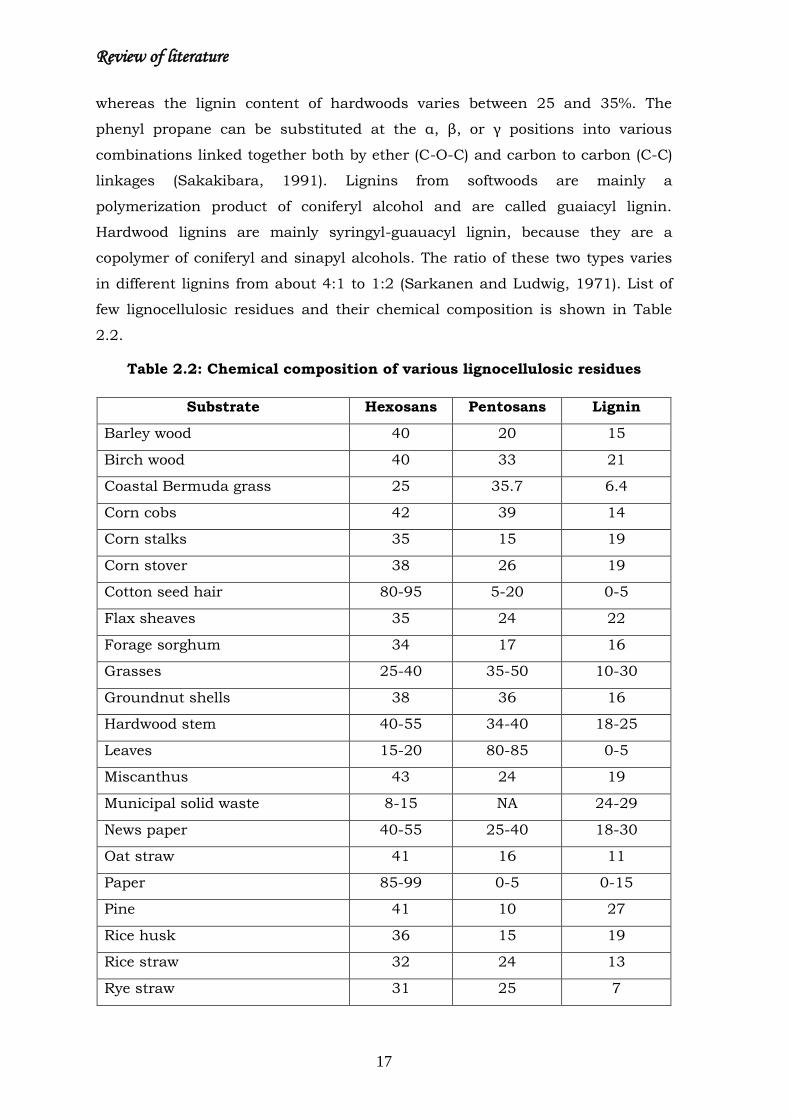
whereas the lignin content of hardwoods varies between 25 and 35%. The
phenyl propane can be substituted at the α, β, or γ positions into various
combinations linked together both by ether (C-O-C) and carbon to carbon (C-C)
linkages (Sakakibara, 1991). Lignins from softwoods are mainly a
polymerization product of coniferyl alcohol and are called guaiacyl lignin.
Hardwood lignins are mainly syringyl-guauacyl lignin, because they are a
copolymer of coniferyl and sinapyl alcohols. The ratio of these two types varies
in different lignins from about 4:1 to 1:2 (Sarkanen and Ludwig, 1971). List of
few lignocellulosic residues and their chemical composition is shown in Table
2.2.
Table 2.2: Chemical composition of various lignocellulosic residues
Substrate Hexosans Pentosans Lignin
Barley wood 40 20 15
Birch wood 40 33 21
Coastal Bermuda grass 25 35.7 6.4
Corn cobs 42 39 14
Corn stalks 35 15 19
Corn stover 38 26 19
Cotton seed hair 80-95 5-20 0-5
Flax sheaves 35 24 22
Forage sorghum 34 17 16
Grasses 25-40 35-50 10-30
Groundnut shells 38 36 16
Hardwood stem 40-55 34-40 18-25
Leaves 15-20 80-85 0-5
Miscanthus 43 24 19
Municipal solid waste 8-15 NA 24-29
News paper 40-55 25-40 18-30
Oat straw 41 16 11
Paper 85-99 0-5 0-15
Pine 41 10 27
Rice husk 36 15 19
Rice straw 32 24 13
Rye straw 31 25 7
Review of literature
18
Salix 41.5 22-25 25
Saw dust 55 14 21
Soft wood stem 45-50 25-35 25-35
Solid cattle manure 1.6-4.7 1.4-3.3 2.7-5.7
Sorghum straw 33 18 15
Sorted refuge 60 20 20
Soya bean stalks 34 25 20
Spruce 45 26 28
Sugarcane bagasse 33 30 29
Sweet sorghum 23 14 11
Swine waste 45 30-35 12
Switch grass 37 29 19
Waste paper from chemical pulp 60-70 10-20 5-10
Wheat straw 30 24 18
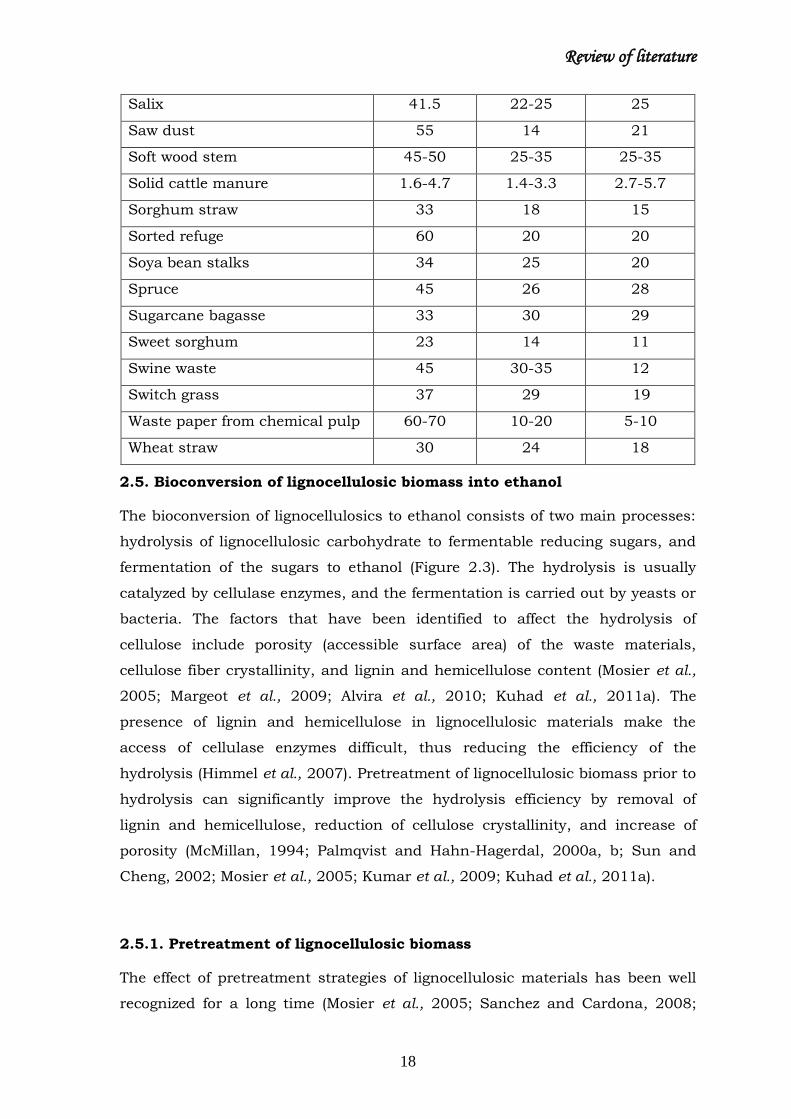
2.5. Bioconversion of lignocellulosic biomass into ethanol
The bioconversion of lignocellulosics to ethanol consists of two main processes:
hydrolysis of lignocellulosic carbohydrate to fermentable reducing sugars, and
fermentation of the sugars to ethanol (Figure 2.3). The hydrolysis is usually
catalyzed by cellulase enzymes, and the fermentation is carried out by yeasts or
bacteria. The factors that have been identified to affect the hydrolysis of
cellulose include porosity (accessible surface area) of the waste materials,
cellulose fiber crystallinity, and lignin and hemicellulose content (Mosier et al.,
2005; Margeot et al., 2009; Alvira et al., 2010; Kuhad et al., 2011a). The
presence of lignin and hemicellulose in lignocellulosic materials make the
access of cellulase enzymes difficult, thus reducing the efficiency of the
hydrolysis (Himmel et al., 2007). Pretreatment of lignocellulosic biomass prior to
hydrolysis can significantly improve the hydrolysis efficiency by removal of
lignin and hemicellulose, reduction of cellulose crystallinity, and increase of
porosity (McMillan, 1994; Palmqvist and Hahn-Hagerdal, 2000a, b; Sun and
Cheng, 2002; Mosier et al., 2005; Kumar et al., 2009; Kuhad et al., 2011a).
2.5.1. Pretreatment of lignocellulosic biomass
The effect of pretreatment strategies of lignocellulosic materials has been well
recognized for a long time (Mosier et al., 2005; Sanchez and Cardona, 2008;

Review of literature
19
Margeot et al., 2009; Kumar et al., 2009; Alvira et al., 2010; Kuhad et al.,
2011a). The pretreatment strategies must meet the following requirements: (1)
improve the formation of sugars or the ability to subsequently form sugars by
enzymatic hydrolysis; (2) avoid the degradation or loss of carbohydrate; (3) avoid
the formation of hydrolysis and fermentation inhibitory byproducts; and (4)
cost-effectiveness of the process. Various physical, physico- chemical, chemical,
and biological processes have been used for pretreatment of lignocellulosic
materials.
Figure 2.3: Schematic representation of process for bioethanol production
from lignocellulosic biomass
Source: Kuhad et al (2011a)
2.5.1.1. Physical pretreatment
2.5.1.1.1. Mechanical comminution
Lignocellulosic residues can be pretreated by comminution through a
combination of chipping, grinding and milling to reduce cellulose crystallinity
depending on the final particle size of the material (10–30 mm after chipping
and 0.2–2 mm after milling or grinding) (Sun and Cheng, 2002). The milling
process has been found to reduce the cellulose crystallinity and subsequently

Review of literature
20
improving the digestibility of the lignocellulosic biomass efficiently. Different
milling processes (ball milling, two-roll milling, hammer milling, colloid milling
and vibro energy milling) can be used to improve the enzymatic hydrolysis of
lignocelullosic materials (Taherzadeh and Karimi, 2008). The power requirement
for mechanical comminution of agricultural materials depends on the final
particle size and characteristics of plant materials (Sun and Cheng, 2002;
Mosier et al., 2005; Hendriks and Zeeman, 2009).
2.5.1.1.2. Extrusion
Extrusion process is a novel and promising physical pretreatment method for
biomass conversion to ethanol. In extrusion, the materials are subjected to
heating, mixing and shearing, resulting in physical and chemical modifications
during the passage through the extruder. Screw speed and barrel temperature
are believed to disrupt the lignocellulose structure causing defibrillation and
shortening of the fibers, which in turn increases carbohydrates accessibility for
enzymatic hydrolysis (Karunanithy et al., 2008). The different reactor
parameters must be taken into account to achieve the highest efficiency in the
process. In recent studies application of enzymes during extrusion process is
being considered as a promising technology for ethanol production (Alvira et al.,
2010).
2.5.1.1.3. Pulsed-Electric-Field Pretreatment
Pulsed-electricfield (PEF) pretreatment involves application of a short burst of
high voltage to plant materials placed between two electrodes. PEF pretreatment
can have serious effects on the structure of plant tissues. When a high-
intensity, external electric field is applied, a critical electric potential is induced
across the cell membrane, which leads to rapid electrical breakdown and local
structural changes in cell membrane and the cell wall. The electric field results
in a dramatic increase in mass permeability and, in some cases, mechanical
rupture of the plant tissue.
In biomass-to-fuel conversion, pretreatment of biomass with PEFs can expose
the cellulose in the plant fibers. Using high field strengths in the range of 5-20
kV/cm, plant cells can be significantly ruptured (Kumar et al., 2009). By
applying electric pulses with high field strengths, PEF pretreatment can create
permanent pores in the cell membrane and hence facilitate the entry of acids or
enzymes used to break down the cellulose into its constituent sugars. In the

Review of literature
21
case of the chemical modification of plant tissue, particularly in lignocellulose
hydrolysis, appropriate chemicals might need to be transported into the tissue
to aid in cell-wall breakdown and digestion. Two advantages of PEF
pretreatment are that it can be carried out at ambient conditions and energy
requirement is low because of very short pulse times (100 μs). Furthermore, the
actual PEF process itself does not involve moving parts, so no complex
instrument design is required. Recently Kumar et al. (2009) had used this
process for Switch grass and found considerable improvement in the enzymatic
digestibility of the substrate.
2.5.1.1.4. Pyrolysis
Pyrolysis of lignocellulosic materials was carried out at temperatures above
300°C, under which the cellulose is decomposed to produce residual char and
gaseous products. The dilute acid hydrolysis of residual char resulted in more
than 80% conversion of cellulose to reducing sugars with more than 50%
glucose (Fan et al., 1987). Moreover, the process efficiency can be enhanced
under oxygen rich conditions (Shafizadeh and Bradbury, 1979), and also with
the addition of some specific catalysts such as zinc chloride or sodium
carbonate improved process efficacy (Sun and Cheng, 2002; Zwart et al., 2006;
Kumar et al., 2009).
2.5.1.1.5. Ultrasound pretreatment
The effect of ultrasound waves on lignocellulosic biomass has also been
employed for extracting hemicelluloses, cellulose and lignin (Sun and
Tomkinson, 2002). Several researchers have reported the enhanced
saccharification of cellulose using ultrasonic pretreatment methods (Yachmenev
et al., 2009). Higher enzymatic hydrolysis yields after ultrasound pretreatment
may be attributed to the cavitation effects. The cavitation effect is caused by
introduction of ultrasound field into the enzyme-substrate suspension greatly
enhance the transport of enzyme macromolecules toward the substrate surface.
Furthermore, mechanical impacts, produced by the collapse of cavitation
bubbles, provide an important benefit of opening up the surface of solid
substrates for enzymatic action. The maximum effects of cavitation occur at 50
°C, which is the optimum temperature for many enzymes (Yachmenev et al.,
2009).

Review of literature
22
2.5.1.1.6. Microwave pretreatment
Microwave-based pretreatment can be considered a physicochemical process
since both thermal and non-thermal effects are often involved. Pretreatments
were carried out by immersing the biomass in dilute chemical reagents and
exposing the slurry to microwave radiation for residence times ranging from 5 to
20 min. Zhu and coworkers (2006) have identified alkalis as suitable chemical
reagents for microwave-based pretreatment. Among different alkalis used, the
sodium hydroxide is observed as the most effective alkali reagent.
2.5.1.2. Chemical pretreatment
2.5.1.2.1. Acid hydrolysis
Mineral acids such as H2SO4 and HCl have been used to pretreat the
lignocellulosic materials. Although concentrated mineral acids (hydrochloric
acid, HCl; sulphuric acid, H2SO4 and nitric acid, HNO3) are powerful agents for
cellulose hydrolysis but they are toxic, corrosive and hazardous and require
reactors that are resistant to corrosion. Moreover, the recovery of concentrated
acid is problematic enough to make the process economically feasible (Sivers
and Zacchi, 1995; Torget et al., 2000). Whereas, dilute acid hydrolysis has been
successfully developed for pretreatment of lignocellulosic materials. The dilute
sulfuric acid pretreatment can achieve high reaction rates and significantly
improves cellulose hydrolysis (Esteghlalian et al., 1997; Sun and Cheng, 2002;
Cara et al., 2008; Rocha et al., 2009; Gupta et al., 2011a). Recently the focus of
dilute acid hydrolysis processes, remained on using less severe conditions and
achieve high yields of xylan to xylose conversion. This is necessary to achieve
favorable overall process economics because of xylan which accounts up to one
third of the total carbohydrate in many lignocellulosic materials (Gupta et al.,
2009; Kuhad et al., 2010a). There are primarily two types of dilute acid
pretreatment processes: high temperature, continuous-flow process for low solid
load (5–10%), and low temperature, batch process for high solid load (10–40%).
Although dilute acid pretreatment can significantly improve the cellulose
hydrolysis, its cost is usually higher than some physico-chemical pretreatment
processes such as steam explosion or Ammonia Fiber Explosion/Expansion
(AFEX). Moreover, the neutralization of pH is necessary for the downstream
enzymatic hydrolysis and fermentation processes.

Review of literature
23
Recently, few organic acids such as fumaric or maleic acids are also used as
alternatives to inorganic acids enhance cellulose hydrolysis for ethanol
production. These acids when compared with sulfuric acid in terms of
hydrolysis yields from wheat straw and formation of sugar degradation
compounds during pretreatment, showed higher efficiency with less amount of
furfural (Kootstra et al., 2009).
2.5.1.2.2. Alkaline hydrolysis
Alkaline hydrolysis is one of the critical method used to pretreat the plant
biomass, however the effect of alkaline pretreatment method depends on the
lignin content of the materials (Fan et al., 1987; McMillan, 1994; Sun and
Cheng, 2002; Mosier et al., 2005; Kumar et al., 2009; McIntosh and Vancov,
2010; Gupta et al., 2011a). The mechanism of alkaline hydrolysis is believed to
be saponification of intermolecular ester bonds cross-linking xylan
hemicelluloses and other components, for example, lignin and other
hemicellulose. Dilute NaOH treatment of lignocellulosic materials caused
swelling of lignocellulosic materials, leading to an increase in internal surface
area, a decrease in the degree of polymerization, and crystallinity, separation of
structural linkages between lignin and carbohydrates, and disruption of the
lignin structure is commonly reported (Sun and Cheng, 2002; Carrillo et al.,
2005). Recently, Hu and coworkers (2008) used microwave, and radio frequency
based dielectric heating in the alkali pretreatment of switchgrass to enhance its
enzymatic digestibility. In this strategy switchgrass could be treated on a large
scale at high solid loading with uniform temperature distribution (Hu et al.,
2008, Hu and Wen, 2008).
2.5.1.2.3. Ionic liquids (ILs) pretreatment
The use of ionic liquids (ILs) as solvents for pretreatment of cellulosic biomass
has recently received much attention (Kumar et al., 2009; Kuhad et al., 2011a).
ILs are salts, typically composed of large organic cations and small inorganic
anions, which exist as liquids at relatively low temperatures; often at room
temperature. Their solvent properties can be varied by adjusting the anion and
the alkyl constituents of the cation. These interesting properties include
chemical and thermal stability, non-flammability, low vapour pressures and a
tendency to remain liquid in a wide range of temperatures (Hayes, 2009). Since
no toxic or explosive gases are developed, ionic liquids are also known as
„„green” solvents. Carbohydrates and lignin can be simultaneously dissolved in

Review of literature
24
ILs with anion activity (e.g. the 1-butyl-3 methylimidazolium cation (C4mim)+)
because ILs form hydrogen bonds between the non-hydrated chloride ions of the
IL and the sugar hydroxyl protons in a 1:1 stoichiometry. As a result, the
intricate network of non-covalent interactions among biomass polymers of
cellulose, hemicellulose, and lignin is effectively disrupted while minimizing
formation of degradation products. However, most of the work showing the
effectiveness of ILs has been carried out using pure crystalline cellulose, and its
applicability to a more complex combination of constituents in lignocellulosic
biomass requires more extensive studies. The use of ILs has also been already
demonstrated on some lignocellulosic feedstocks such as straw (Li et al., 2009)
or wood (Lee S.H. et al., 2009). The ILs technology is under development,
therefore the commercial recovery methods have not been fully developed. In
addition, techniques need to be worked out to recover hemicellulose and lignin
from solutions after extraction of cellulose (Hayes, 2009).
2.5.1.2.4. Lime treatment
Lime pretreatment removes the lignin fraction from the polysaccharide fraction,
thus making the remaining polysaccharides vulnerable to enzyme digestion
(Kim and Holtzapple, 2005, O‟Dwyer et al., 2007). With regard to process
operation, different conditions are employed for different types of cellulosic
materials: 100°C for 13 h for corn stover, 150°C for 6 h with 14 atm for poplar
wood, and 100°C for 2 h for switchgrass (Mosier et al., 2005). The oxygenation of
reaction mixture can greatly improve delignification, especially when treating
lignin rich woods. The process of lime pretreatment involves slurrying the lime
with water, spraying it onto the biomass and storing thhe material in a pile for
few weeks (Mosier et al., 2005, Kim and Holtzapple, 2005). Recently, Park and
coworkers developed a novel a one-batch lime-pretreatment process called
„„calcium capturing by carbonation (CaCCO)”. The CaCCO process entraps the
formed CaCO3 in the reaction vessel throughout the conversion process and no
solid-liquid separation approach has been used (Park et al., 2010).
2.5.1.2.5. Organosolv process
In the organosolv process, an organic or aqueous organic solvent mixture with
inorganic acid catalysts (HCl or H2SO4) is used to break the internal lignin and
hemicellulose bonds (Xu et al., 2003; Zhao et al., 2009). The solvents used in
the process include methanol, ethanol, acetone, ethylene glycol, triethylene
glycol, tetrahydrofurfuryl alcohol and organic acids such as oxalic,
Review of literature
25
acetylsalicylic and salicylic acid etc. (Sun and Cheng, 2002; Itoh et al., 2003; Xu
et al., 2003; Kumar et al., 2009; Zhao et al., 2009; Kuhad et al., 2011a). A high
yield of xylose is usually obtained with the addition of acid. Solvents used in the
process are drained from the reactor, evaporated, condensed and recycled to
reduce the process cost. Removal of solvents from the system is necessary
because the solvents may be inhibitory for growth of organisms, enzymatic
hydrolysis, and subsequent fermentation (Itoh et al., 2003; Xu et al., 2003; Zhao
et al., 2009; Kuhad et al., 2011a).
2.5.1.2.6. Oxidative delignification
The pretreatment of lignocellulosic biomass with hydrogen peroxide greatly
enhanced its susceptibility to enzymatic hydrolysis. About 50% lignin and most
hemicellulose were solubilized by 2% H2O2 at 30 °C within 8 h, and 95%
efficiency of glucose production from cellulose was achieved in the subsequent
saccharification by cellulase at 45 °C for 24 h (Azzam, 1989). Besides, alkaline
peroxide (Bjerre et al., 1996; Lissens et al., 2004; Martín et al., 2008), the
chlorite oxidation and wet oxidation are also used as promising oxidative
delignifying pretreatments. Bjerre et al. (1996) used wet oxidation and alkaline
hydrolysis of wheat straw (20 g straw/l, 170 °C, 5–10 min), and achieved 85%
conversion yield of cellulose to glucose. Whereas, the sodium chlorite treatment
yielded approximately 90 % delignification in woody material (Prosopis juliflora;
Lantana camara) (Gupta et al., 2009; Kuhad et al., 2010b).
2.4.1.2.7. Ozonolysis
Ozone is used to degrade lignin and hemicellulose in many lignocellulosic
materials. The degradation was essentially limited to lignin and hemicellulose
was slightly attacked, but cellulose was un-affected which resulted into
increased in vitro digestibility of the cellulosic substrates (Kumar et al., 2009).
According to Vidal and Molinier (1988), the ozone treatment removed 60% lignin
from wheat straw which in turn enhance the enzymatic saccharification rate by
5 times. Ozonolysis pretreatment has the following advantages: (1) it effectively
removes lignin; (2) it does not produce toxic residues for the downstream
processes; and (3) the reactions are carried out at room temperature and
pressure (García-Cubero et al., 2009). However, requirement of large amount of
ozone makes the process expensive and commercially unfeasible.

Review of literature
26
2.5.1.3. Physico-chemical pretreatment
2.5.1.3.1. Ammonia fiber explosion (AFEX) and Ammonia Recycle Percolation
Process
AFEX is another type of physico-chemical pretreatment in which lignocellulosic
materials are exposed to liquid ammonia at high temperature and pressure for
certain time, and then the pressure is suddenly decreased (Teymouri et al.,
2005; Lee et al., 2010). The concept of AFEX is similar to steam explosion. In
ammonia fiber/freeze expansion (AFEX) process, a 5–15% ammonia solution
flows through a column reactor that is packed with biomass at 1 mL/cm2 for 14
min at temperatures between 160 and 180°C (Mosier et al., 2005). However, the
AFEX process was not very effective for the plant material with high lignin
content such as Lantana camara (28–35% lignin) and aspen chips (25% lignin).
Hydrolysis yield of AFEX-pretreated newspaper and aspen chips was reported as
only 40% and below 50%, respectively (McMillan, 1994).
Moreover, to reduce the cost and protect the environment, ammonia must be
recycled after the pretreatment. In an ammonia recovery process (ARP), aqueous
ammonia (10-15 wt %) passes through biomass at elevated temperatures (150-
170 °C) with a fluid velocity of 1 cm/min and a residence time of 14 min, after
which the ammonia was then withdrawn from the system by a pressure
controller for recovery. In the ARP method, the ammonia is separated and
recycled and since, the ammonia pretreatment does not produce inhibitors for
the downstream biological processes, so washing is not required (Sun and
Cheng, 2002; Galbe and Zacchi, 2007; Margeot et al., 2009). Generally, AFEX
and ARP processes are not differentiated in the literature, although AFEX is
carried out in liquid ammonia and ARP is carried out in an aqueous ammonia
solution (10-15%). It is also observed that the ammonia fiber explosion
pretreatment simultaneously reduces lignin content and removes some
hemicellulose and decrystallize cellulose. The cost of ammonia, and especially of
ammonia recovery, elevates the cost of the AFEX pretreatment (Mosier et al.,
2005; Kumar et al., 2009; Alvira et al., 2010).
2.5.1.3.2. Auto-hydrolysis (Steam explosion)
Steam explosion is commonly reported method for lignocellulosic materials. The
process causes hemicellulose degradation and lignin transformation due to high
temperature, thus increasing the potential of cellulose hydrolysis (Lee J.M. et
al., 2009, Boluda-Aguilar et al., 2010). Steam explosion pretreatment typically

Review of literature
27
subjects lignocellulose to temperatures between 160 and 260°C (corresponding
pressures of 100–700 psia; psia = pounds per square inch absolute;
atmospheric pressure is 14.5 psi) with saturated steam for a period of ten
seconds to several minutes, followed by a flashing process to explosively release
the steam. This treatment results in an explosive disruption of the lignocellulose
material, thus “opening up” the substrate to increase digestibility (Mosier et al.,
2005). The factors that affect steam explosion pretreatment are residence time,
temperature, chip size and moisture content (Duff and Murray, 1996; Lee et al.,
2009; Alvira et al., 2010). The advantages of steam explosion pretreatment
include the low energy requirement compared to mechanical comminution and
no recycling or environmental costs are associated (Sun and Cheng, 2002;
Kumar et al., 2009). Limitations of steam explosion include destruction of a
portion of the xylan fraction, incomplete disruption of the lignin–carbohydrate
matrix, and generation of compounds that may be inhibitory to microorganisms
used in fermentation processes (Palmqvist and Hahn-Hagerdal, 2000 a, b;
Chandel et al., 2007a, Jurado et al., 2009).
2.5.1.3.3. CO2 explosion
Similar to steam and ammonia explosion pretreatment, the CO2 explosion is also
used for pretreatment of lignocellulosic materials (Schacht et al., 2008). It was
hypothesized that CO2 would form carbonic acid and increase the hydrolysis
rate. The yields from CO2 explosion of lignocellulosics were relatively low
compared to steam or ammonia explosion pretreatment (Zheng et al., 1998; Kim
and Hong, 2001; Mosier et al., 2005;, Kumar et al., 2009). Zheng and coworkers
(1998) compared CO2 explosion with steam and ammonia explosion and found
that CO2 explosion was more cost-effective than ammonia explosion and did not
cause the formation of inhibitory compounds.
2.5.1.3.4. Liquid Hot Water Pretreatment
Liquid hot water pretreatment is very similar to steam explosion, the major
difference being the explosive decompression of steam explosion pretreatment is
replaced by controlled cooling to keep the water in the liquid phase throughout
the process (Weil et al., 1994). This process has been shown to remove up to
80% of the hemicellulose and to enhance the enzymatic digestibility of
pretreated material in plant residue feedstocks, such as corn stover (Mosier et
al., 2005), sugarcane bagasse (Laser et al., 2002) and wheat straw (Pérez et al.,
2008). Pressured reactors are used to keep the water in the liquid state at high

Review of literature
28
reaction temperatures, termed as “uncatalyzed solvolysis” by Mok and Antal
(1992). Various biomass samples have been pretreated with compressed liquid
water. The liquid hot water pretreatment is attractive which eliminates the use
of expensive chemicals/catalysts to facilitate the hemicellulose
depolymerization; subsequently, there is no need for neutralization or chemical
recovery after the pretreatment. The resulting pretreated materials are reported
to be highly amicable to the enzymatic saccharification step (Weil et al., 1998;
Mosier et al., 2005; Lu and Mosier, 2008; Alvira et al., 2010).
2.4.1.3.5. Control pH liquid Pretreatment
The controlled pH liquid hot water pretreatment process will maximize the
solubilization of the hemicellulose fraction as liquid soluble oligosaccharides
with minimum formation of monomeric sugars. The minimization of complete
hydrolysis to monosaccharides minimizes the subsequent degradation of these
sugars to various aldehydes during pretreatment. By controlling the
depolymerization of hemicellulose, the major xylose containing product is
soluble xylan oligosaccharides (Weil et al., 1998). These oligosaccharides must
be subsequently hydrolyzed to fermentable sugars by enzymes or acids. In
liquid hot water pretreatment, acetic acids and other organic acids are liberated
as a result of the cleavage of O-acetyl and uronic acid substitution on
hemicellulose by the action of water. These acids help catalyze further
hemicellulose solubilization. They also may degrade the resulting monomeric
sugars to furfural, which may have negative effects on the subsequent
fermentation. With careful addition of base or buffer, controlled pH
hydrothermolysis can maintain the pH of the liquid phase between 5.5 and 7.0
during the whole process, thus minimizing the formation of degradation
products. Thus controlled pH liquid hot water is a modified version of hot water
pretreatment which provides greater control of the chemical reactions that
occur during pretreatment (Weil et al., 1998; Lu and Mosier, 2008).
2.5.1.4. Biological pretreatment
The pretreatment has become a necessity to maximize the hydrolysis of
cellulosics and eventually the production of ethanol. The advantages of
biological delignification of plant amterial over chemical and mechanical
pretreatment methods include (i) mild reaction conditions, (ii) avoids the use of

Review of literature
29
toxic and corrosive chemicals, (iii) higher product yield, (iv) fewer side reactions,
less energy demand and (v) less reactor resistance to pressure and corrosion.
(Lee, 1997; Kuhar et al., 2008; Sanchez, 2009). In situ microbial delignification
appears to be a feasible strategy to achieve improved depolymerization of
hemicellulose and cellulose.
The white-rot fungi (WRF) are the most effective microorganisms for biological
pretreatment as they degrade lignin more extensively and rapidly than any other
known group of organisms (Eriksson, 1993; Kuhad et al., 1997; Keller et al.,
2003; Kuhad et al., 2007). Some WRF have been reported to degrade lignin
selectively and this capability of selected WRF can be exploited for
delignification of plant materials without affecting much of cellulose (Kuhar et
al., 2008, Gupta et al., 2011b). Thus, selected lignin-degrading WRF with
comparatively low cellulase and xylanase activities could be advantageous for
efficient delignification and eventually in the reduction of chemical and energy
inputs for chemical or enzymatic hydrolysis of the substrate(s).
Few studies have been reported on the pretreatment of plant biomass with WRF
for its affect on cellulose hydolysis. According to Hatakka (1983), 35% of the
wheat straw is convertible to reducing sugars when pretreated with Pleurotus
ostreatus for 5 weeks. Taniguchi and co-workers (2005) also observed a similar
conversion rate in rice straw pretreated with P. ostreatus for 60 days. Keller and
coworkers (2003) observed a 3 to 5 fold improvement in the enzymatic cellulose
digestibility in corn stover pretreated with Coriolus versicolor in more than 30
days. Thus, most of these fungal pretreatments have suffered because of long
incubation periods. Therefore, to economize microbial pretreatment of
lignocellulosics to improve the hydrolysis of carbohydrates to reducing sugars
and to eventually improve ethanol yield, there is a need to test more and more
basidiomycetous fungi for their ability to delignify the plant material quickly and
efficiently (Kuhad et al., 2011a). Recently our group has demonstrated the
potential of insitu pretreatment of P. juliflora with Crinipellis sp. RCK-1 before
its acid or enzymatic hydrolysis in increasing sugar yield and in turn producing
ethanol as a biofuel (Kuhar et al., 2008).
Biological pretreatment in combination with other pretreatment technologies
has also been studied (Itoh et al., 2003, Balan et al., 2008). Itoh and colleagues
(2003) reported production of ethanol by simultaneous saccharification and
fermentation (SSF) from beech wood chips after bio-organosolvation

Review of literature
30
pretreatments by ethanolysis and white-rot fungi, Ceriporiopsis subvermispora,
Dichomitus squalens, P. ostreatus, and C. Versicolor. The yield of ethanol
obtained after pretreatment with C. subvermispora for 8 weeks was 0.294 g/g of
ethanolysis pulp and 0.176 g/g of beech wood chips. The yield was 1.6 times
higher than that obtained without the fungal treatments. The combined process
enabled the separation of lignin, cellulose, and hemicelluloses using only water,
ethanol, and wood-rot fungi. The biological pretreatments saved 15% of the
electricity needed for ethanolysis. In another interesting approach, Balan et al.
(2008) studied the effect of fungal treatment of rice straw followed by AFEX
pretreatment and enzymatic hydrolysis. They reported that treating rice straw
with white-rot fungus, followed by AFEX gave significantly higher glucan and
xylan conversions. Recently our group has studied the SSF of P. juliflora and L.
camara followed by acid hydrolysis and observed that fungal treatment
significantly reduce the amount of inhibitors generated and eventually the
requirement of detoxiying agent was also reduced (Gupta et al., 2011b)
2.5.2. Detoxification
Thermochemical pretreatments are the most commonly used treatment for the
deconstruction of plant materials. However, under such stringent conditions,
the carbohydrate moieties of lignocellulosic biomass undergo non-selective
degradation resulted in generation of fermentation inhibitory products (Chandel
et al., 2007a; Gupta et al., 2009, 2011b; Kuhad et al., 2010b, 2011a). On the
basis of their origin these inhibitors are divided into three groups, furfurals,
hydroxymethyl furfurals (HMF) and phenolics. Furfural and hydroxymethyl
furfurals are pentose and hexose sugars degradation compounds, respectively.
While, the phenolics are the degradation compounds of acid soluble lignin
(Chandel et al., 2007a). These compounds depending on their concentration in
the hydrolysates can inhibit microbial cell and affect the specific growth rate
and cell mass yield per ATP. Furfurals and hydroxymethyl furfurals (furans) are
known to inhibit the glycolytic enzymes and the direct inhibition of alcohol
dehydrogenase (ADH) contributes to the acetaldehyde excretion, which resulted
in the prolonged lag phase in the microbes (Palmqvist and HahnHagerdal,
2000a, b). The phenolics cause partition in the biological membrane and loss of
integrity thereby affect the ability to serve as selective barrier and enzyme

Review of literature
31
matrix. Therefore in order to make these hydrolysates fermentable their
detoxification to remove the inhibitors without much sugar loss is essential.
Various detoxification methods including biological, physical and chemical ones
have been proposed to transform inhibitors into inactive compounds or to
reduce their concentration. However, the effectiveness of detoxification method
depends both on the type of hemicellulosic hydrolysates and on the species of
microorganisms employed.
2.4.2.1. Physical detoxification
The physical methods for detoxification of hydrolysates includes vacuum
evaporation, extraction, activated charcoal adsorption and ion exchange
treatment. Vacuum evaporation of hydrolysates reduced the contents of volatile
compounds such as acetic acid, furfural and vanillin, present in the
hydrolysates and thus improves their fermentability. Converti et al. (2000)
reported that evaporation is suitable to remove the acetic acid, furfural and
other volatile compounds from hemicellulose hydrolysates improving the
fermentative process for xylitol production. However, the method also has a
drawback to moderately enhance the concentration of non-volatile toxic
compounds (extractives and lignin derivatives) which could lead to increased
fermentation inhibition. Parajo and coworkers (1998) used vacuum evaporation
method with wood hydrolyzate and observed an increase in concentration of
lignin derivatives and extractives which resulted in longer fermentation time
(from 24 to 96 h) leading to poor productivity. Similar observations were also
reported by other workers as well (Larsson et al., 1999; Silva and Roberto,
2001). As an additional report the ethyl acetate extraction has also been
reported to increase the ethanol yield in fermentation in Pichia stipitis (Pasha et
al., 2007).
In contrast, Weil et al. (2002) used two ion exchange resins XAD-4 and XAD-7
for the detoxification of hydrolysates and observed that the strain E. coli KO11
could ferment the detoxified hydrolysate nearly as rapidly as the mixed sugars
control with in 80h and produced equal amount of ethanol. Similarly, Chandel
and colleagues (2007) reported a significant decrease of furans (63.4%), total
phenolics (75.8%) and acetic acid (85.2%) when an industrial resin DIAION
(HPA 25) was used for the detoxification of acid hydrolysate of sugarcane
bagasse. Interestingly, Wickaramasinghe and Grzenia (2008) when compared
the efficiency of anion exchange membrane to that of anion exchange resin for

Review of literature
32
acetic acid removal, concluded that the membrane exhibited better performance
in terms of dimensionless throughput and product loss. The membrane binds
acetic acid more efficiently than that of resins and the total volume of waste
water will be less for a membrane based system compared to resins. The use of
zeolites had also been reported to improve the ethanol yield during fermentation
by removing fermentation inhibitors with almost no loss of fermentable sugars
(Ranjan et al., 2009).
As another method, activated charcoal adsorption has gaining considerable
attention. The charcoal removed the furfural derivatives efficiently, but do not
have similar impact on acetic acid. Miyafuji et al. (2003) reported that since,
many furans and phenolics compounds are hydrophobic, thus the wood
charcoal prepared at higher temperature can remove the inhibitory compounds
more effectively compared to the wood charcoal than at lower temperature.
Gupta et al. (2009) reported the removal of HMF (38.24%), furfural (29.31%),
acetic acid (45.26%) and caffeic acid (74.92%) from the acid hydrolysate of
Prosopis juliflora with activated charcoal. Similar results have been reported in
the work of Kuhad et al. (2010b) and Gupta et al. (2011b).
2.5.2.2. Chemical detoxification
Chemical methods for detoxification include precipitation of toxic compounds
and ionization of some inhibitors under certain pH values, the latter being able
to change the degree of toxicity of the compounds (Van Zyl et al., 1998; Roberto
et al., 1991; Martinez et al., 2001; Mussatto, 2002).
Detoxification of lignocellulosic hydrolysates by alkali treatment, i.e., increasing
the pH to 9–10 with Ca(OH)2 (overliming) and readjustment to 5.5 with H2SO4,
has been described as early as 1945 by Leonard and Hajny. After an overliming
treatment (pH 10), causing the formation of a large precipitate, the ethanol
productivity was further increased. The detoxifying effect of overliming is due
both to the precipitation of toxic components and to the instability of some
inhibitors at high pH. This has been demonstrated by the fact that pre-
adjustment to pH 10 with NaOH of a strongly inhibiting dilute-acid hydrolysate
of spruce prior to fermentation resulted in twice as high ethanol yield (and
comparable to the yield in a reference fermentation containing glucose and
nutrients) as after only adjustment to fermentation pH (5.5) (Palmqvist, 1998).
Martinez et al. (2001) reported that using Ca(OH)2 to adjust the pH of sugarcane
bagasse hemicellulose hydrolyzate (overliming treatment) to 9.0, proved to be a

Review of literature
33
very efficient detoxification method. Purwadi and coworkers (2004) overlimed
the detoxified hydrolysates of forest residues to various pH ranging from 9.0 to
12.0 using Ca(OH)2 followed by readjustment of the pH to 5.0. They observed
that increasing the pH, time and/or temperature resulted in more effective
degradation of furans and resulted in better fermentability for the hydrolysates.
Similar observations were reported by other researchers as well (Alriksson et al.,
2006, Chandel et al., 2007; Gupta et al., 2009; Kuhad et al., 2010a).
2.5.2.3. Biological detoxification
Biological method of detoxification involved the use of specific enzymes or
microorganisms that act on toxic compounds present in the hydrolysates and
change their composition. The enzymes used commonly for detoxification are
oxidases and dehydrogenases. The enzyme peroxidases and laccase from white
rot fungi are most commonly used for the removal of phenolics while the
furfuryl dehydrogenase was used for the furans. The detoxification mechanism
of these enzymes probably involves oxidative polymerization of low molecular
weight compounds or the enzymatic transformation to the non-toxic forms.
These enzymes showed significant improvement in enhancing the sugar
consumption and ethanol yields. Johnsson and coworkers (1998) used laccase
and peroxidase enzyme of white rot fungus Trametes versicolor to detoxify the
willow wood hydrolysates, which resulted in approximately 2-3 enhanced
ethanol productivity due to the action removal of phenolics compounds. Similar
observations were reported by other groups as well (Schneider, 1996; Palmqvist
et al., 1997; Silva and Roberto, 2001; Chandel et al., 2007). The use of
microorganisms has also been proposed to selectively remove inhibitors from
lignocellulosic hydrolysates. In similar aspects, Koopman et al. (2010)
elucidated the degradation pathway of the most hazardous inhibitors, Furfural
and HMF in the bacterium Cupriavidus basilensis HMF 14, which has the
ability to metabolize furans. They concluded that the non-specific
dehydrogenases abundant in the cell could participate in the conversion, given
that the necessary activity NAD dependant furfuryl dehydrogenase is present.
2.5.3. Enzymatic hydrolysis
Enzymatic hydrolysis of cellulose is carried out by cellulase enzymes which are
highly specific. The products of the hydrolysis are usually reducing sugars
Review of literature
34
majorly glucose. The utility cost of enzymatic hydrolysis is low compared to acid
or alkaline hydrolysis because enzyme hydrolysis is usually conducted at mild
conditions (pH 4-6 and temperature 45– 50°C) and does not have a corrosion
problem (Kuhad et al., 2010, 2011b). Both bacteria and fungi can produce
cellulases for the hydrolysis of lignocellulosic materials. These microorganisms
can be aerobic or anaerobic, mesophilic or thermophilic. Bacteria belonging to
Clostridium, Cellulomonas, Bacillus, Thermomonospora, Ruminococcus,
Bacteriodes, Erwinia, Acetovibrio, Microbispora, and Streptomyces can produce
cellulases and among them Cellulomonas fimi and Thermomonospora fusca have
been studied extensively (Bisaria, 1991; Duff and Murray, 1996; Sun and
Cheng, 2002; Kuhad et al., 2011c). Fungi that have been reported to produce
cellulases include Sclerotium rolfsii, P. chrysosporium and species of
Trichoderma, Aspergillus, Schizophyllum, Fusarium and Penicillium (Sternberg,
1976; Fan et al., 1987; Duff and Murray, 1996; Kuhad et al., 1999; Sun and
Cheng, 2002; Kuhad et al., 2011c). Of all these fungal genera, Trichoderma has
been most extensively studied for cellulase production.
The cellulase system contains of three major enzyme components:
endoglucanase (EG; EC 3.2.1.4), cellobiohydrolase (CBH; EC 3.2.1.91), and β-
glycosidase (EC 3.2.1.21). Evidence suggests that these enzymes act
synergistically (Din et al., 1994; Teeri et al., 1998; Boraston et al., 2004; Gupta
et al., 2009). The exoglucanase (CBH) act on the ends of the cellulose chain and
release β-glucosidase as the end product; endoglucanase (EG) randomly attack
the internal O-glycosidic bonds, resulting in glucan chains of different lengths;
and the β-glycosidases act specifically on the β-cellobiose disaccharides and
produce glucose (Beguin and Aubert, 1994; Kuhad et al., 1999; Kuhad et al.,
2011b) (Figure 2.4).
Structurally, cellulases typically have two separate domains: a catalytic domain
(CD) and a cellulose binding module (CBM), which is linked by a flexible linker
region. The CBM is comprised of approximately 35 amino acids, and the linker
region is rich in serine and threonine (Divne et al., 1998). The nature of the
lignocellulosic substrate changes during the time course of enzymatic hydrolysis
(Wang et al., 2006). Initially, amorphous non-crystalline regions are attacked,
because they are more accessible and easier to be hydrolyzed. After the initial
hydrolysis stage, as the percentage of crystalline regions in the substrate rises,
the enzymatic hydrolysis rate falls rapidly. Such observed kinetic behavior

Review of literature
35
correlates to the high-crystalline nature of the bulk of cellulose fraction, and
inaccessibility of the glycosidic bonds is the key rate-limiting factor for the low
enzymatic hydrolysis. Besides the recalcitrance of the substrate, there are a few
factors that also limit cellulase efficiency during the hydrolysis process, which
include end-product inhibition, thermal deactivation of the native protein, non-
specific binding to lignin (Yang and Wyman, 2004), and irreversible adsorption
of the enzymes to the heterogeneous substrate (Taniguchi et al.,2005).
Mechanistically, the reactions catalyzed by cellulases are suggested to involve
general acid-base catalysis by a carboxylate pair at the enzyme active site. One
residue acts as a general acid and protonates the oxygen of the O-glycosidic
bond; at the same time, the other residue acts as a nucleophile. Depending on
the distance between the two carboxylic groups, either inverting (~10 Å
distances) or retaining (~5 Å-distances) mechanisms are observed in cellulases
(Withers, 2001).
Figure 2.4: Schematic representation of enzymatic saccharification of
cellulose. (Source: Kuhad et al. 2011)

Review of literature
36
Besides cellulases, hemicellulases are another group of polysaccharide
degrading enzymes that are specific to the hemicellulose substrate. As a
heterogeneous, branched polymer, hemicelluloses require enzyme activities
specific to as many as 21 different bonds (Collins et al., 2005; Polizeli et al.,
2005; Shallom and Shoham, 2003). Thus, a consortium of hemicellulases is
needed for a complete breakdown of hemicellulose. Endo-1,4-xylanases are
needed for hydrolyzing the backbone 1,4-β-linked xylose residues; acetylxylan
esterases participate in cleavage of the acetyl ester bonds; and β-D-xylosidases
are utilized for the hydrolysis of xylan oligomers through exo-type attack
(Kapoor et al., 2008). Similar to cellulases, xylanases have separate catalytic
domains and carbohydrate binding modules (CBMs) (Divne et al., 1998; Teeri,
1997; Teeri et al., 1998). Synergism and concerted action among xylanases
enhance the effectiveness in hetero-polymeric xylan hydrolysis. It has also been
reported that β-xylosidases remove the short-chain oligosaccharides,
minimizing the end product inhibition of exoxylanases; thus, overall xylan
hydrolysis efficiency is increased (Polizeli et al., 2005; Hu et al., 2008). Also, by
adding acetylxylan esterases, acetic acids will be liberated and a less acetylated
xylan is exposed for greater accessibility to endoxylanase action (Polizeli et al.,
2005).
To reduce the enzyme cost in the production of fuel ethanol from lignocellulosic
biomass, two aspects are widely addressed: optimization of the cellulases
production and development of a more efficient cellulase-based catalysis
system. Additionally, protein engineering and directed evolution are powerful
tools that can facilitate the development of more efficient thermophilic cellulases
(Baker et al., 2005). Recycling and reusage of the enzymes is also an attractive
methodology to reduce enzymatic hydrolysis costs (Singh et al., 1991; Ramos et
al., 1993; Gregg et al., 1998; Lee et al., 1995; Sun and Cheng, 2002; Mosier et
al., 2005). The recovery of enzymes is largely influenced by adsorption of the
enzymes onto the substrate, especially to lignin. Another constraint in the
recycling of the enzymes is enzymes inactivation. There are several strategies to
recover and reuse the cellulases. The filtrate obtained after complete hydrolysis
of the cellulose fraction can be concentrated by ultra-filtration to remove sugars
and other small compounds that may inhibit the action of the enzymes (Tu et
al., 2007). Another method for recycling enzymes is by immobilization, which
enables separation of the enzymes from the process flow. The principle of
immobilization is to fixate the carbohydrolytic enzymes onto a solid matrix

Review of literature
37
either by adsorption or grafting (Dourado et al., 2002, Mosier et al., 2005). The
recycling techniques are mostly tested at laboratory scale. Therefore, the ability
to scale up the techniques, the robustness and feasibility still needs to be
demonstrated.
2.5.4. Fermentation
Ethanol fermentation is a biological process in which sugars are fermented by
microorganisms to produce ethanol and CO2. As compared to starch and
molasses, the fermentation of plant biomass (lignocellulosic) hydrolysates is a
complex process. There are two major streams of sugars i.e., pentose-rich sugar
syrup and hexose rich sugars coming from hemicellulose and cellulose
separately. The general requirements of an organism for efficient ethanol
production from lignocellulosic hydrolysate is that it should give a high ethanol
yield, a high productivity, high tolerance against inhibitors, able to ferment at
low pH and be able to withstand high ethanol concentrations.
2.4.4.2. Pentose fermentation
During the last three decades, a number of laboratories have demonstrated the
utilization of pentose sugars by various yeasts, fungi, and bacteria for the
production of alcohols and other fermentation products (Table 2.3).
Table 2.3: List of microorganisms that can ferment pentose sugars
Bacteria Reference Fungi and Yeasts Reference
Aeromonas hydrophila Singh and Mishra, 1993 Candida boidinii Vandeska et al., 1996
Bacillus macerans Dien et al., 2003 Candida shehatae Abbi et al., 1996a
Bacillus polymyxa Singh and Mishra, 1993 Fusarium oxysporum Jeffries and Jin, 2004
Bacteriodes Polygramatis Patel, 1984 Mucor corticolous Millati et al., 2005
Clostridium acetobutylicum El Kanouni et al., 1998 Mucor hiemalis Millati et al., 2005
Clostridium Thermosellum Herrero and Gomez, 1980 Mucor indicus Millati et al., 2005
Escherichia coli Yomano et al., 1998 Neurospora crassa Deshpande et al., 1986
Klebsciella oxytocea Ingram et al., 1999 Pachysolen tannophilus Schneider et al., 1981
Lactobacills pentosus Chaillou et al., 1999 Paecilomyces sp NF1 Mountfort et al., 1991
Lactobacillus casei Roukas and Kotzekidou,
1998
Pichia stipitis Gupta et al., 2009
Lactobacillus pentoaceticus Chaillou et al., 1999 Rhizopus orizae Millati et al., 2005
Lactobacillus plantanum Sreenath et al., 1999
Lactobacillus xylosus Sreenath et al., 1999

Review of literature
38
The yeast species identified so far for the pentose fermentation are, Candida
shehatae, Pichia stipitis and Pachysolen tannophilus (Abbi et al., 1996a, b;
Palmqvist and Hahn-Hagerdal, 2000a; Mosier et al., 2005; Hahn-Hagerdal et al.,
2007; Talebnia et al., 2008; Kuhad et al., 2011b). Some other microorganisms
that can ferment pentose sugars are Clostridium sp., Klebsciella sp.,
Lactobacillus sp., Aeromonas hydrophila, Rhizopus orizae, Fusarium oxysporum
and Neurospora crassa (El Kanouni et al., 1998; Chaillou et al., 1999; Screenath
et al., 1999; Dien et al., 2003; Millati et al., 2005; Ruiz et al., 2007; Vasudevan
et al., 2007; Hahn-Hagerdal et al., 2007). To date several studies have been
carried out for the fermentation of xylose rich hydrolysates from various
lignocellulosic materials and a summary of recent studies is shown in table 2.4.
Moniruzzaman (1995) achieved a theoretical ethanol yield of 78% during the
fermentation of enzymatic hydrolysate of steam exploded rice straw, however, a
2 to 3 h lag due to diauxic phenomenal metabolic shift from glucose to xylose
was also observed. While, in another study, using the acid and the auto-
hydrolysate of rice straw, C. shehatae NCIM 3501 showed enhanced ethanol
production in auto- hydrolysate (23.1 g/L) than in acid hydrolysate (20.0 g/L)
because of lower inhibitors concentration (Abbi et al., 1996a). Although, the
pentose fermentation process does not require intensive aerobic fermentation
because of high cell mass synthesis, low ethanol yields and higher aeration
energy consumption. However, aeration is required for the biomass production,
which was a major problem during the fermentation of non-detoxified
hydrolysate. Interestingly, the fermentation of non-detoxified corn stover
hydrolysate at higher aeration improved the ethanol production which was due
to the higher xylose consumption translating higher biomass concentration
(Agbogbo et al., 2007). In a similar study the degree of aeration showed a
prominent effect on xylose utilization, ethanol production and xylitol
minimization during the fermentation of membrane treated sugar maple
hydrolysate using P. stipitis NRRL Y-7124 (Stoutenberg, 2008). Further to
enhance the ethanol production, different detoxification strategies were used by
various researchers (Chandel et al., 2007a). The removal of toxic inhibitors from
fermentation broth significantly improved the ethanol yield (2.4- fold) and
productivity (5.7- fold), compared to neutralized hydrolysate. Similarly, the
fermentation of sugarcane bagasse acid hydrolysate with C. shehatae NCIM
3501 showed maximum ethanol yield (0.48 g/g) from ion exchange treated
hydrolysate, followed by activated charcoal (0.42 g/g), laccase (0.37 g/g),

Review of literature
39
overliming (0.30 g/g) and neutralized hydrolysate (0.22 g/g) (Abbi et al., 1996a).
While in another study, the sequential application of overliming with sodium
sulfite addition resulted in maximum ethanol yield and productivity of 0.32 g/g
and 0.065 g/L/h, respectively (Okur and Sarcaglu, 2008).
Table 2.4: Summaries of the recent work on lignocellulose hydrolysate
fermentation using non-recombinant strains of microorganisms.
Substrates Organism Sugar
(g/L)
Ethanol
(g/L)
Ethanol Yield
(g/g)
Reference
Corn cob P. stipitis 30 10.4 0.34 Saracoglu and Arslan, 2000
Cashew apple bagasse S. cerevisiae 50 20 0.4 Rocha et al., 2009
Cassava waste S. cerevisiae 38 8.73 0.23 Raman and Pothiraj, 2008
Corn stover P. stipitis 40 15.92 0.4 Zhu et al., 2009
Corn stover P. stipitis 60 25 0.42 Agbogbo et al., 2006
Corn stover P. stipitis 40 15 0.37 Agbogbo and Wenger, 2007
Newspaper S. cerevisiae 14.64 5.64 0.39 Kuhad et al., 2010b
Lantana camara S. cerevisiae 36.5 17 0.48 Kuhad et al., 2010c
Poplar P. stipitis 39 12 0.31 Fenske et al., 1998
Prosopis juliflora P. stipitis 18 7.1 0.39 Gupta et al., 2009
Prosopis juliflora S. cerevisiae 40 18 0.45 Gupta et al., 2009
Red oak spent sulfite liquor P. stipitis 49 20.2 0.41 Nigam et al., 2001b
Red oak wood chips P. stipitis 36 14.5 0.4 Nigam et al., 2001a
Rice straw P. stipitis 15 6 0.4 Moniruzzaman, 1995
Rice straw C. shehatae 20 9 0.45 Abbi et al., 1996a
Rice straw P. stipitis 33 14.9 0.45 Huang et al., 2009
Secondary fiber fines S. cerevisiae 5.4 2.12 0.39 Jeffries and Schartman, 1999
Sugar cane bagasse C. shehatae 30 8.67 0.29 Chandel et al., 2007a
Sugar cane bagasse P. tannophilus 63.5 19 0.34 Cheng et al., 2008
Sugar cane bagasse S. cerevisiae 79 30 0.38 Vasquez et al., 2007
Sugar maple P. stipitis 35 12.4 0.35 Stoutenberg et al., 2008
Sun flower seed hull P. stipitis 34 11 0.32 Okur and Saracoglu, 2008
Sun flower stalks S. cerevisiae 40 17.2 0.43 Sharma et al., 2004
Switch grass P. stipitis 39 14 0.36 Fenske et al., 1998
Wheat straw P. stipitis 52 22.3 0.43 Nigam et al., 2001c

Review of literature
40
Several strategies have been employed for the enhanced conversion of pentose
sugars into ethanol. In an attempt to ferment glucose and xylose
simultaneously, Grootjen and coworkers used a co-culture cultivation of
alginate immobilized S. cerevisiae and P. stipitis in a conventional bioreactor,
where, the P. stipitis cells inoculum were taken in comparatively higher amount,
which allowed more xylose utilization under anaerobic conditions and the
fermentation appears to be simultaneous (Grootjen et al., 1990). Furthermore,
the modified stirred tank reactor (STR) system equipped with two teflon-made
HPLC filters air diffusers with improved mixing and less shearing during co-
culture strategy improved the ethanol yield up to 80 % with calcium alginate
immobilized P. stipitis and S. cerevisiae (De Bari et al., 2004). Interestingly, an
agar sheet sandwiched between two chambered bioreactor has also been used
for the co-immobilization of S. cerevisiae and C. shehatae during the mixed
sugar (glucose and xylose) fermentation, however, the cell proliferation in the gel
clogged the microporous membrane which in turn limited the mass transfer
(Lebeau et al., 2007). In another study to overcome the problem of glucose
catabolite repression, sieve plates adjusted STR with a movable device was used
for the coculture of immobilized Zymomonas. mobilis and free P. stipitis to
improve the fermentation efficiency (Fu et al., 2009). Recently, a calcium
alginate immobilized recombinant S. cerevisiae strain ZU-10 hasve been used
for the fermentation of detoxified corn stover hemicellulosic hydrolysate, which
showed the consumption of more than 92 % xylose with an enhanced ethanol
yield and productivities with higher tolerance to fermentation inhibitors (Zhao
and Xia, 2010).
Despite various improvements of these amendments, it has been observed that
the repeat culture with the same batch of immobilized microorganism under the
same conditions resulted in decreased performance (Fu et al., 2009).
Alternatively yeast cells immobilized by self flocculation have shown many
advantages such as no requirement of support matrix, maintained biomass and
enhanced ethanol tolerance. Moreover flocculated yeast cells can be recovered
by sedimentation from fermentation broth. However, CO2 bubbles produced
during ethanol fermentation can alter the settling zone and disturb the
sedimentation of yeast floc whereas a specially designed baffle can overcome
this problem (Zhao and Bai, 2009). There are also some reports of yeast cells
immobilization for biocatalysts development for simultaneous saccharification
and fermentation (SSF). Fujita and coworkers constructed a yeast-based whole-
Review of literature
41
cell biocatalyst displaying T. reesei xylanase II on the cell-surface and showed
xylan degradation by recombinant cells (Fujita, 2002). Whereas, intensive
attempts are have also been made for the development of yeast cells displaying
cellulase activities on the cell surface so to decrease the usage of exogeneously-
added cellulase use (Tsai et al., 2009; Jeon et al., 2009).
A high -productivity system that involved a membrane bioreactor with cell
recycling of Z. mobilis ZM4 capable of converting both glucose and xylose to
ethanol had been developed (Joachmisthal et al., 2000). Similar strategy was
also applied during the continuous cultivation of a recombinant xylose
fermenting S. cerevisiae TMB 3001 on a xylose-glucose mixture (Roca and
Olsson, 2003). Interestingly, in case of lignocellulose hydrolysate containing
mixed sugars, it was observed that the recycled cells get adapted to the
fermentation inhibitors present in the hydrolysate and showed better results
(Sreenath and Jeffries, 2000). The same was further confirmed by Pruwadi and
coworkers, where continuous cultivation of high cell density flocculating yeast
in toxic dilute acid hydrolysate of spruce residues in a singly and serial
bioreactor adapted to the medium and reduced the requirement of any
detoxification (Purwadi et al., 2007). Recently, a fuzzy optimization of
continuous fermentation with cell recycling for ethanol production was carried
out (Wang and Lin, 2010). From the computational results, the overall
productivity of the continuous fermentation process with cell recycling allowed a
higher dilution rate with 7.3 fold higher productivity (Wang and Lin, 2010).
2.5.4.2. Hexose sugar fermentation
A variety of microorganisms ranging from bacteria, fungi and yeasts are known
to ferment hexose sugars (Table 2.5), however, the most common and efficient
microbes used for hexose fermentation are Saccharomyces cerevisiae and
Zymomonas mobilis (Hahn-Hagerdal et al., 2007). Various studies have been
carried out using S. cerevisiae for the fermentation of lignocellulosic
hydrolysates. An enzymatic hydrolysate of Alfa-alfa when fermented with S.
cerevisiae consumed more than 98 % sugars and caused 85% fermentation
efficiency with ethanol productivity of 1.3 g/L/h (Belkacemi et al., 1997). While
as per another report, the enzymatic hydrolysate (180 g/L) of washed steam
exploded oak chips when employed for continuous fermentation with S.
cerevisiae, an ethanol concentration of (77 g/L) with an ethanol productivity
(16.9 g/L/h) and ethanol yield (0.43 g/g) was obtained (Lee et al., 1999). Wang

Review of literature
42
and coworkers (2004) reported an ethanol production 41-46 g/L from various
monomeric and oligomeric sugars i.e., glucose (85 g/L), fructose (91.1 g/L) and
sucrose (96.6 g/L) using S. cerevisiae. Later on Chen et al. (2007) used fed-
batch enzymatic saccharification strategy to achieve 110 g/L sugar
concentration and when this hydrolysate was fermented with S. cerevisiae,
almost 95.3 g/L sugar was consumed to produce 45.7 g/L ethanol with an
ethanol yield of 94 %. In another study, enzymatic hydrolysate of acid and alkali
treated Cashew apple bagasse on fermentation with S. cerevisiae produced 20.0
g/L and 8.2 g/L ethanol with an ethanol productivity of 3.33 g/L/h and 2.7
g/L/h, respectively (Rocha et al., 2009). Recently our group has achieved an
ethanol yield of 0.48 g/g from the enzymatic hydrolysate of pretreated P. juliflora
and L. camara containing 36.5 and 37.5 g/L sugars, respectively (Gupta et al.,
2009; Kuhad et al., 2010a).
Table 2.5: Microorganisms fermenting hexose sugars to ethanol
Organisms Reference Organisms Reference
Candida shehatae Abbi et al., 1996a Rhizopus miehei Millati et al., 2005
Fusaruium sporium Mamma et al., 1995 Rhizomucor pusillis Millati et al., 2005
Kloeckera apiculata Aguilera et al., 2006 Saccharomyces cerevisiae Kuhad et al., 2010b
Kluyeromyces marxianus Ballesteros et al., 2004 S. bayarus Belloch et al., 2008
Mucor indicus Abdenifar et al., 2009 S. paradoxus Belloch et al., 2008
M. hiemalis Millati et al., 2005 S. kudriazevii Belloch et al., 2008
M. corticolous Millati et al., 2005 S. cariocanus Belloch et al., 2008
Neurospora crassa Mamma et al., 1995 S. mikatae Belloch et al., 2008
Pachysolen tannophillus Abbi et al., 1996a S. pastorianus Belloch et al., 2008
Pichia stipitis Gupta et al., 2009 Schizosaccharomyces pombe Hu et al., 2005
Pichia membranifaciens Aguilera et al., 2006 Terulospora delbruecki Aguilera et al., 2006
Rhizopus oryzae Abdenifar et al., 2009 Zymomonas mobilis
Besides the enzymatic hydrolysates, several studies have been carried out to
use the S. cerevisiae to utilize the hexose sugars present in the acid hydrolysate
of lignocellulosic substrates. Brandberg and coworkers (2005) fermented a non-
detoxified dilute acid wood hydrolysate using S. cerevisiae ATCC 96581 under
continuous mode (with or without cell recycling) and observed that, 99% of the
sugars were converted at a cell concentration of 6 g/L leading to an ethanol
concentration of 17 g/L and a productivity of 1.6 g/L/h. To improve the
Review of literature
43
productivity, three different types of cell retention process i.e., cross-flow
filtration with recirculation, sedimentation, and immobilization in calcium
alginate were evaluated He observed that when 75% of the cells were retained
by filtration, the hexose conversion increased to 94%, and the ethanol
production rate was 2.3 g/L/h. Comparable results were achieved with cell
recirculation by a settler and immobilization. When the dilution rate was
increased to 0.2/h, neither filtration nor sedimentation could prevent washout
of the cells. On the other hand, culture immobilization increased the ethanol
productivity to 3.5 g/L/h, although hexose conversion dropped (Brandberg et
al., 2007).
Taherzadeh and his group (2001) used a dilute acid hydrolysate supplemented
with defined mineral media for the fermentation with S. cerevisiae CBS 8066
immobilized in Ca-alginate beads and observed that the 79- 86% of glucose was
consumed with 0.45 and 0.47 g/g ethanol yield. Further to improve the ethanol
productivity, the same group immobilized S. cerevisiae cells in different bio-
processes such as CSTR, fluidized bed bioreactor (FBBR) and combined CSTR
and FBBR (Purwadi and Taherzadeh 2008). In CSTR operated at dilution rates
between 0.22 and 0.86/h, conversion of an initial glucose concentration
decreased from 100% to 77%, but productivities increased from 2.1 to
6.6 g/L/h. If fluidized bed bioreactor (FBBR) was connected to the CSTR,
glucose conversion was higher than 99%. In contrast, a single FBBR gave a
higher glucose conversion of 92% at a dilution rate of 0.86/h and a higher
ethanol productivity of 7.4 g/L/h (Purwadi and Taherzadeh, 2008).
Besides entrapment, encapsulated S. cerevisiae cells were also used for
fermentation, as encapsulation has the advantages of checking the diffusion of
nutrients as well as the cell leakage. Talebnia and Taherzadeh (2006)
encapsulated S. cerevisiae CBS 8066 cells and observed that ethanol
productivity increased with increasing dilution rate from 1.1 to 4.2 g/L/h, and
cell viability was high under all conditions ranging between 77% and 90%. The
flocculating S. cerevisiae strain has also been used for the fermentation of acid
hydrolysates (Tang et al., 2006; Purwadi et al., 2007).
As an additional approach, simultaneous saccharification and fermentation
(SSF) has also been employed for improved ethanol production. In the SSF
process, the stages are virtually the same as in separate hydrolysis and
fermentation (SHF) systems, except that both are performed in the same

Review of literature
44
reactor. It has been shown that SSF reduces the processing time, which in turn
leads to increase in the production of ethanol (Ballesteros et al., 1991; Wyman,
1994; Alfani et al., 2000; Soderstrom et al., 2005). During the SSF process, the
liberated glucose is quickly converted to ethanol by fermenting microorganism,
the inhibition of cellulase by the reaction end-products is reduced and this
single fermenter process eliminates a portion of the investment cost by reducing
the number of fermenters required for start-up. In addition, the SSF process
reduces the contamination risk due to the presence of ethanol in the medium
(Banat et al., 1998; McMillan, et al., 1999; Soderstrom et al., 2005; Ohgren et
al., 2007). However, the performance of the SSF process is limited by the
different optimum temperatures for enzymatic saccharification and microbial
fermentation. The optimum temperature for cellulases is usually in the range of
40 to 50°C, while the optimum temperature of ethanol production for the most
common ethanologenic yeast, S. cerevisiae, is between 30 and 37°C (Suryawati
et al., 2008). Hence, the coexistence of two process conditions for microbe and
enzyme hinders the efficacy of process. In order to overcome this notable
problem, thermotolerant yeast strains have been used in high temperature SSF
processes (Suryawati et al., 2008). In such cases, the performance of SSF with
thermotolerant yeast at temperatures closer to the optimum temperatures for
cellulase activity could enhance saccharification, reduce the operation time and
reduce cellulase dosage (Suryawati et al., 2008). Szczdodrak and Targonski
(1988) tested a total of 58 yeast strains belonging to 12 different genera and
capable of growing and fermenting sugars at temperatures of 40–46 ◦C. They
selected several strains belonging to the genera Saccharomyces, Kluyveromyces
and Fabospora in view of their capacity to ferment glucose, galactose and
mannose at 40, 43 and 46 ◦C, respectively. Ballesteros and colleagues (1991)
studied different treatments to improve the thermotolerance of some species
belonging to the genera Saccharomyces, and Kluyveromyces and the best results
were obtained with Kluyveromyces marxianus LG. Bollók and coworkers (2000)
also used Kluveromyces strain in SSF experiments of softwood and almost 70 %
ethanol conversion was obtained. Harikrishna et al. (2001) have reported final
ethanol concentrations of 2–2.5% (w/v) in 72 h SSF of lignocellulosic wastes
with thermotolerant yeast at 10% (w/v) initial substrate concentration. While,
Ballesteros and coworkers (2004) used the mutated K. marxianus strain CECT
10875 and achieved a SSF yield of 50 to 72 % in 72-82 h using various
lignocellulosic feedstocks (poplar and eucalyptus, Sorghum sp. bagasse, wheat
Review of literature
45
straw and Brassica carinata residue). Further, Ohgren and colleagues (2007)
and coworkers compared the SHF and SSF in steam exploded corn stover and
observed that SSF gave a 13% higher overall ethanol yield than SHF. Recently, a
respiratory-deficient mutant of the thermotolerant yeast Candida glabrata
(Cgrd1), was subjected to ethanol production by high-temperature SSF under
aerobic conditions to achieve maximum ethanol (17.0 g/L) within 48 h at 66.6%
of its theoretical yield and with 0.35 g/L h productivity (Watanabe et al., 2010).
2.4.5. Ethanol Recovery: Distillation and Dehydration
Under ideal conditions, an ethanol and water mixture can be separated based
on their difference in volatility. Because ethanol is more volatile than water
(ethanol vaporizes at 78°C whereas water vaporizes at 100°C), upon heating the
ratio of ethanol-to water in the vapor phase will become higher than that in the
liquid phase. Therefore, in an ideal distillation column separation, the overhead
product will mainly be ethanol, and water will be the main bottom product. An
azeotropic mixture of ethanol (95.6%). and water (4.4%) will be reached upon
completion of distillation operation, which is determined by the difference in the
boiling points between water and ethanol (Fair, 2001). Because the ethanol-
water mixture from fermentation is far from being ideal, the actual ethanol
recovery process is a multistage and highly integrated process (Wankat, 1988).
There are several dehydration processes to remove water from an azeotropic
ethanol/water mixture. The first process is azeotropic distillation is adding
benzene or cyclohezane to the mixture. When these components are added to
the mixture, it forms a heterogeneous azeotropic mixture in vapour-liquid-liquid
equilibrium, which when distilled produces anhydrous ethanol in the column
bottom, and a vapour mixture of water and cyclohexane/benzene. While in
extractive distillation, consists of adding a ternary component, which will
increase the ethanol‟s relative volatility. When the ternary mixture is distilled, it
will produce anhydrous ethanol on the top stream of the column. The third
method uses molecular sieves to remove water from ethanol. In this process,
ethanol vapour pressure pass through a bed of molecular sieve beads. The
bead‟s pores are sized to allow absorption of water while excluding ethanol.
Recently, distillation followed by molecular sieve dehydration operations have
been used to recover a pure ethanol product of fuel-grade (>99.5%). Molecular
Review of literature
46
sieves are crystalline metal aluminosilicates (zeolites) with a 3-D porous
structure of silica and tetrahedral alumina (Kresge and Dhingra, 2004). Zeolite
materials can strongly and preferentially adsorb water from vapor mixtures,
thus they are able to remove the remaining 4.4% water content in the azeotropic
mixture from the rectification column. Therefore, minimization of total energy
input is a critical requirement for an economic design of an ethanol
distillation/dehydration system. In the past 40 years, installation of multistage,
pressure distillation systems have reduced energy consumption by 50%,
compared to the earlier all-atmospheric pressure systems (Madson, 2003). In
modern molecular sieve dehydration systems, “pressure swing adsorption” is
employed to remove the water content, where a relatively high pressure is
applied at the water removal stage and a relatively low pressure is applied at the
desiccant regeneration stage. Therefore, operation temperature can be kept
almost constant, and the heat of adsorption can be effectively stored and further
supplied to the regeneration stage (Swain, 2003). An alternative to molecular
sieve material is corn grits (Ladisch and Dyck, 1979). Corn grits can selectively
remove water from an azeotropic mixture and are advantageous in that the
materials are biorenewable, of low cost, and easily disposable. However, a major
drawback of the corn grits is its mechanical stability over a long period of time
(Beery and Ladisch, 2001).
2.5. Strain Improvement for ethanol fermentation
2.5.1. Mutation
There are several reports where mutagenised recombinant strains showed
enhanced ethanol production over their parent strains (Wahlbom et al., 2003;
Watanabe et al., 2005; Kim et al., 2007; Liu and Hu, 2010). In an early report, a
recombinant S. cerevisiae strain TJ1 mutagenised with ethyl methane sulfonate
(EMS) was found to have lower xylose reductase (XR) activity but high Xylitol
dehydrogenase (XD) and xylulokinase (XKS) activities than the parent strain,
which in turn resulted in 1.6 fold increase in ethanol production (Tantirungkij et
al., 1993). Further, a mutant of S. cerevisiae TMB 3001 capable of utilizing
xylose under anaerobic condition was developed by sequential EMS
mutagenesis and adaptation of the mutant strain under microaerobic and
anaerobic conditions (Sonderegger and Sauer, 2003). Similar strategy was used

Review of literature
47
to develop two EMS mutagenised S. cerevisiae strains 3399 and 3400 with
improved growth on xylose (Wahlbom et al., 2003). Since the most efficient
glucose utilizing microbes are not able to metabolize the pentoses anaerobically,
therefore strategies like natural selection and random mutations were also
tested (Matushika et al., 2009a). Besides EMS, several other mutagens had also
been used to obtain mutants derepressed for pentose metabolism. Sreenath and
Jeffries (2000) used 2-deoxyglucose (2-DOG) mutated strain, which showed
considerable improvement in xylose utilization. While in another report, a UV
mutagenised P. stipitis NRRL Y-7124 strain was found to produce higher ethanol
than the wild strain (Bajwa et al., 2009).
Site-directed mutagenesis is another efficient approach used to obtain the
mutants for better xylose fermentation. Watanabe and coworkers (2005) used
multiple site- directed mutagenesis of the NAD+-dependent XDH from P. stipitis
and introduce a structural zinc atom for the complete reversal of the coenzyme
specificity. The selected mutants were found to exhibit significant
thermostability and enhanced catalytic activity with NADP+. Similarly, several
PsXDH mutants were generated with complete reversal of coenzyme specificity
toward NADP+ by multiple site-directed mutagenesis within the coenzyme-
binding domain and with increased thermostability by refining the structural
zinc-binding loop without affecting their activities (Annaluru et al., 2007). In
addition one of these S. cerevisiae mutant (MA-R5) under the control of a strong
constitutive promoter showed particularly high ethanol production from xylose
and low xylitol yield by fermentation of not only xylose as the sole carbon
source, but also a mixture of glucose and xylose (Watanabe et al., 2007;
Matushika et al., 2008; 2009b). Additionally, an ethanologenic E. coli mutant
that is, devoid of foreign genes, has also been developed by combining the
activities of pyruvate dehydrogenase and the fermentative alcohol
dehydrogenase and the mutant was found able to ferments glucose or xylose to
ethanol with 82% ethanol yield under anaerobic conditions (Kim et al., 2007).
2.5.2. Protoplast Fusion
Protoplast fusion provides characteristic advantage such as promotion of high
frequencies of genetic information between organisms for which poor or no
genetic exchange has been demonstrated or which are genetically
uncharacterized (Heluane et al., 1993; Lin et al., 2005; Pasha et al., 2007). In
the presence of a fusogenic agent such as polyethylene glycol (PEG), protoplasts

Review of literature
48
are induced to fuse and form transient hybrids or diploids. Several reports on
protoplast fusion between pentose and hexose utilizing yeasts showed efficient
utilization of both sugars with higher biomass yield. Heluane and coworkers
(1993) transferred the genes of xylose utilization from P. tannophilus to S.
cerevisiae. The hybrids reassembled the S. cerevisiae parent morphologically but
displayed the ability to use the pentose sugars (xylose) similar to P. tannophilus.
The same has been supported by other workers, where a fusant of
Schizosaccharomyces pombe and Lentinus edodes were found to utilize xylan as
carbon source (Lin et al., 2005). In an another study, the protoplasts of
thermotolerant S. cerevisiae and mesophilic xylose-utilizing C. shehatae were
fused by electrofusion and the fusant yeast gave an ethanol yield of
approximately 0.459 g/g with productivity of 0.67 g/L/h and fermentation
efficiency of 90% and showed higher temperature tolerance up to 40°C as well
(Pasha et al., 2007). Moreover, using a combinatorial approach, a xylose
fermenting fusant (F6) of C. shehatae and S. cerevisiae was developed, which
showed improved ethanol production (28 %) than its parental strain (Li et al.,
2008). In this strategy the C. shehatae was first adapted for ethanol tolerance
and then mutagenised the adapted strain by UV irradiation and thus selected a
respiration deficient mutant RD-5 was selected. Further, the protoplasts of RD-
5 and S. cerevisiae were fused and the resultant fusant strain F6 showed 28%
higher ethanol production than the parent Candida shehatae stain, with the
production level of 18.75 g/L from 50 g/L xylose. Recently a strategy of genome
shuffling was also used, in which the genomes of 6 UV mutagenised P. stipitis
strains (WT, Ps302, GS301, GS302, GS401 and GS402) were shuffled and after
the third and fourth rounds of genome shuffling, putative improved mutant
colonies were pooled, re-grown and spread on hardwood spent sulphite liquor
(HW SSL) gradient plate (Bajwa et al., 2010). Of these, 2 mutants (GS401 and
GS402) from the fourth round could grew in 80% (v/v) HW SSL, and another 2
mutants (GS301 and GS302) from the third round could grow in 85% (v/v) HW
SSL. While, P. stipitis WT and PS 302 could not grow in any of the HWSSL
concentrations. Thus the mutated strains showed improved inhibitors tolerance
against HWSSL hardwood spent sulphite liquor (Bajwa et al., 2010).
2.5.3. Adaptation
Fermentation of wood-derived hydrolysates is problematic because of the toxic
inhibitors released during thermo-chemical hydrolysis, however, the adaptation

Review of literature
49
approach can be an alternative means to improve the microbial strains (Yomano
et al., 1998; Agbogbo et al., 2008; Zhu et al., 2009). There are several reports on
enhancement of ethanol yield and productivity using adapted strains of P.
stipitis and C. shehatae for the fermentation of undetoxified or partially
detoxified hydrolysates (Liu et al., 2004; Attfield and Bell, 2006; Zhu et al.,
2009). For instance, an ethanologenic yeast when adapted against inhibitors by
repeated sub-culturing in a medium with furfural and HMF up to a
concentration of 10-20 mM was found to grow more efficiently than its parent
strain in the presence of inhibitors (Liu et al., 2004). While, another strategy of
natural selection and breeding was used to develop non-recombinant strains of
S. cerevisiae that could grow efficiently on xylose (Attfield and Bell, 2006). By
breeding and natural selection over 23 mating cycles and 1463 selection days, a
non-genetically modified S. cerevisiae (MBG-2303) was obtained, which grew
aerobically on xylose and demonstrated 57 fold higher biomass production than
the control strain (Attfield and Bell, 2006). Later on, it was demonstrated that
adaptation of P. stipitis CBS 6054 on solid agar produced more ethanol (19.4
g/L) than liquid adapted (18.4 g/L) and unadapted strains (16.3 g/L) (Agbogbo
et al., 2008). Recently, studies were carried out on adaptation of P. stipitis CBS
5776 strain which on fermentation of steam exploded prehydrolyzate of corn
stover showed improved ethanol yield of 15.92 g/L with 80.34% theoretical yield
(Zhu et al., 2009).
Moreover, the evolutionary adaptation approaches have also been applied to
recombinant strains to improve their fermentation capability. Lawford and his
group improved the xylose-fermenting recombinant strains of Z. mobilis 39767
to tolerate higher concentration of acetic acid by subculturing in a medium
containing 10-50 % of hydrolysate and the adapted isolates demonstrated a
significant improvement in ethanol productivity compared to un-adapted strains
(Lawford and Rousseau, 1999). Similarly, an engineered E. coli KO11 was
developed to tolerate high ethanol concentration using a long term adaptation
strategy of alternative serial selections for liquid and solid medium. The mutants
(LY01, LY02 and LY03) demonstrated more than 50 % survival rate in 10 %
ethanol (0.5 min exposure) and also decrease in fermentation time (Yomano et
al., 1998). In almost all previous efforts of evolutionary adaptation the organism
was first subjected to genetic engineering, which was followed by adaptive
selection (Sonderegger and Sauer, 2003; Kuyper et al., 2005; Wisselink et al.,
2009). However, recently a new strategy consisting genetic engineering,
Review of literature
50
mutation with EMS followed by two-step evolutionary adaptation (under
sequential aerobic and oxygen limited conditions) has also been attempted (Liu
and Hu, 2010). The strain thus developed showed four fold increase in its
specific growth rate compared to the parental strain. Interestingly the activity of
critical enzymes of xylose metabolism (XR, XDH and XK) remain unchanged
suggesting that chemical mutagenesis and evolutionary adaptation might have
created a new genetic traits making the mutants capable of xylose metabolism
in the favor of xylose metabolism (Liu and Hu, 2010).
2.5.4 Genetic Manipulation for improved ethanol fermentation
Substantial progress in the genetic engineering of different microbes for the
conversion of xylose or pentose sugars to ethanol has been achieved (Karhumaa
et al., 2005; Matushika et al., 2008; Liu and Hu, 2010; Kuhad et al., 2011b).
Although the genetically engineered host strains of bacteria and yeast showed
tremendous improvement in final ethanol yields and efficient utilization of
pentose sugars, but the information about the usage of genetically modified
organisms for large scale pentose fermentation is scarcely available. The potent
recombinant microbes are listed in table 2.6.
2.5.4.1. Genetic engineered Saccharomyces cerevisiae
S. cerevisiae produces ethanol from hexose sugars but cannot ferment xylose or
arabinose, however, the yeast is able to metabolize the xylose isomer, xylulose
and recombinant DNA technologists have taken advantage of this in creating
xylose-fermenting strains.
Ho and coworkers (1998) were the first to produce successfully a recombinant S.
cerevisiae strain capable of effective xylose fermentation and xylose and glucose
co-fermentation, where plasmids with XR and XDH genes from P. stipitis and
XKS gene from S. cerevisiae were transformed into S. cerevisiae for the co-
fermentation of glucose and xylose. Similar strategy for improved xylose
utilization and ethanol production from have also been reported by other groups
(Karhumaa et al., 2007; Matushika et al., 2008; Matushika and Swayama, 2008;
Vleet and Jeffries, 2009).
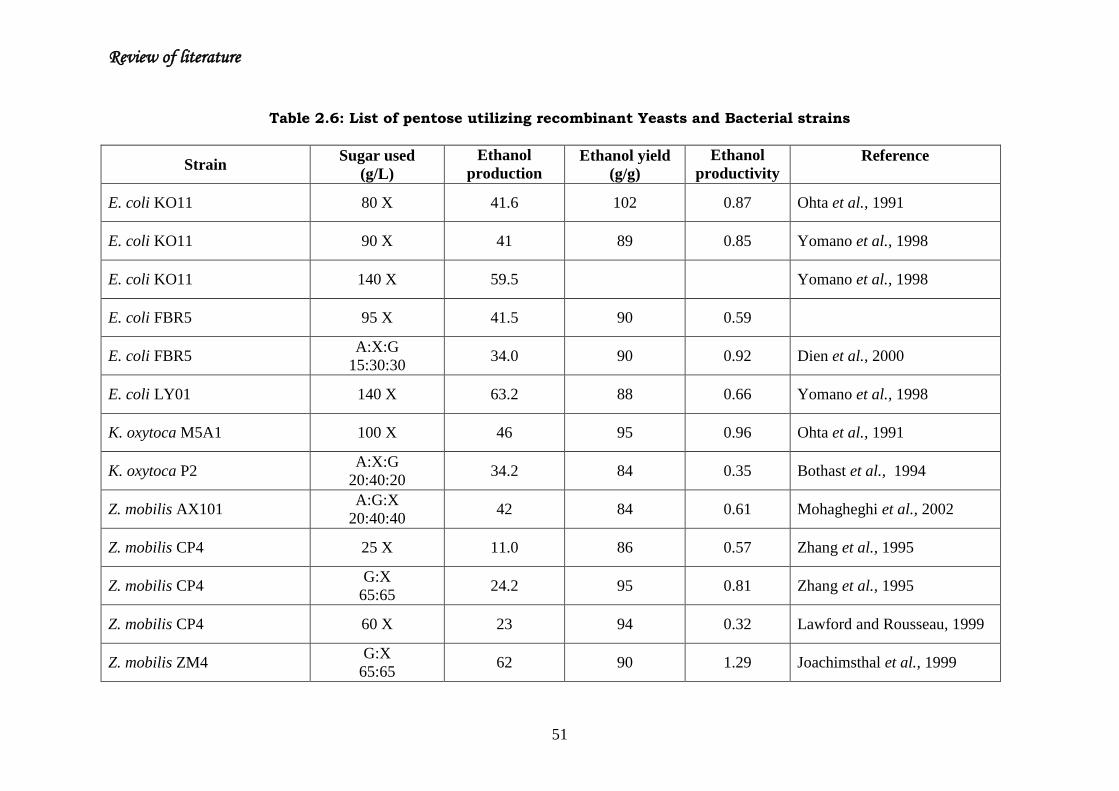
Review of literature
51
Table 2.6: List of pentose utilizing recombinant Yeasts and Bacterial strains
Strain Sugar used
(g/L)
Ethanol
production
(g/L)
Ethanol yield
(g/g)
Ethanol
productivity
(g/L/h)
Reference
E. coli KO11 80 X 41.6 102 0.87 Ohta et al., 1991
E. coli KO11 90 X 41 89 0.85 Yomano et al., 1998
E. coli KO11 140 X 59.5 Yomano et al., 1998
E. coli FBR5 95 X 41.5 90 0.59
E. coli FBR5 A:X:G
15:30:30 34.0 90 0.92 Dien et al., 2000
E. coli LY01 140 X 63.2 88 0.66 Yomano et al., 1998
K. oxytoca M5A1 100 X 46 95 0.96 Ohta et al., 1991
K. oxytoca P2 A:X:G
20:40:20 34.2 84 0.35 Bothast et al., 1994
Z. mobilis AX101 A:G:X
20:40:40 42 84 0.61 Mohagheghi et al., 2002
Z. mobilis CP4 25 X 11.0 86 0.57 Zhang et al., 1995
Z. mobilis CP4 G:X
65:65 24.2 95 0.81 Zhang et al., 1995
Z. mobilis CP4 60 X 23 94 0.32 Lawford and Rousseau, 1999
Z. mobilis ZM4 G:X
65:65 62 90 1.29 Joachimsthal et al., 1999
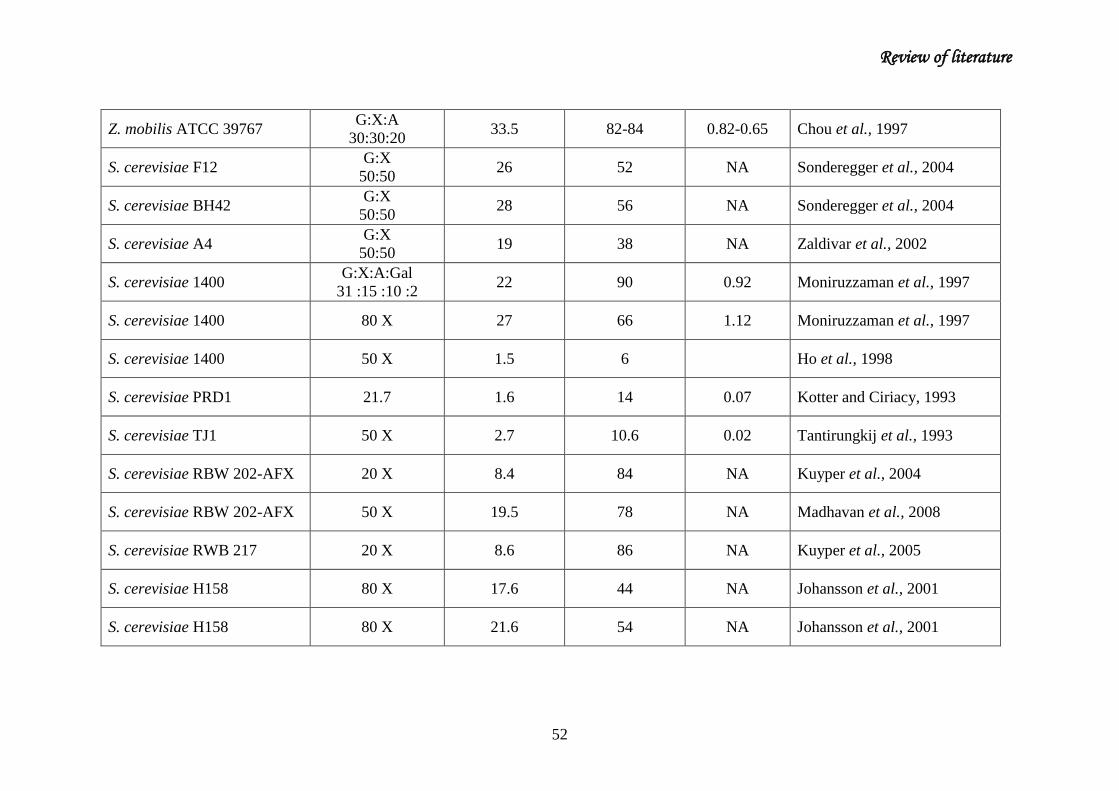
Review of literature
52
Z. mobilis ATCC 39767 G:X:A
30:30:20 33.5 82-84 0.82-0.65 Chou et al., 1997
S. cerevisiae F12 G:X
50:50 26 52 NA Sonderegger et al., 2004
S. cerevisiae BH42 G:X
50:50 28 56 NA Sonderegger et al., 2004
S. cerevisiae A4 G:X
50:50 19 38 NA Zaldivar et al., 2002
S. cerevisiae 1400 G:X:A:Gal
31 :15 :10 :2 22 90 0.92 Moniruzzaman et al., 1997
S. cerevisiae 1400 80 X 27 66 1.12 Moniruzzaman et al., 1997
S. cerevisiae 1400 50 X 1.5 6 Ho et al., 1998
S. cerevisiae PRD1 21.7 1.6 14 0.07 Kotter and Ciriacy, 1993
S. cerevisiae TJ1 50 X 2.7 10.6 0.02 Tantirungkij et al., 1993
S. cerevisiae RBW 202-AFX 20 X 8.4 84 NA Kuyper et al., 2004
S. cerevisiae RBW 202-AFX 50 X 19.5 78 NA Madhavan et al., 2008
S. cerevisiae RWB 217 20 X 8.6 86 NA Kuyper et al., 2005
S. cerevisiae H158 80 X 17.6 44 NA Johansson et al., 2001
S. cerevisiae H158 80 X 21.6 54 NA Johansson et al., 2001

Review of literature
53
S. cerevisiae H 2673 50 X 11.5 46 NA Verho et al., 2003
S. cerevisiae H 2723 50 X 12 48 NA Verho et al., 2003
S. cerevisiae H 2684 50 X 20.5 82 NA Verho et al., 2003
S. cerevisiae ZU-10 80 X 30.2 75.6 0.50 Zhao and Xia, 2009
S. cerevisiae LEK 122 20 X 2.5 24.5 0.025 Liu and Hu, 2010
S. cerevisiae LEK 122 50 X 6.35 25.4 0.064 Liu and Hu, 2010
S. cerevisiae LEK 513 50 X 8.13 32.5 0.113 Liu and Hu, 2010
S. cerevisiae TMB 3001 10 X 2.4 48 NA Sonderegger and Sauer, 2003
S. cerevisiae TMB 3001 G :X
5 :15 2.5 25 0.15 Eliasson et al., 2000
S. cerevisiae TMB 3001 50 X 15.5 62 0.22 Jeppsson et al., 2002
S. cerevisiae TMB 3001 10 X 4.4 88 0.061 Traff-Bjerre et al., 2004
S. cerevisiae TMB 3008 50 X 19 76 0.27 Jeppsson et al., 2002
S. cerevisiae TMB 3030 50 X 14 56 NA Jeppsson et al., 2003
S. cerevisiae TMB 3037 50 X 17 68 NA Jeppsson et al., 2003

Review of literature
54
S. cerevisiae TMB 3050 50 X 14.5 58 NA Karhumaa et al., 2005
S. cerevisiae TMB 3057 50 X 16.5 66 0.13 Karhumaa et al., 2007
S. cerevisiae TMB 3066 50 X 21.5 86 0.073 Karhumaa et al., 2007
S. cerevisiae TMB 3120 10 X 4.6 92 0.064 Traff-Bjerre et al., 2004
S. cerevisiae TMB 3251 50 X 17 68 0.24 Jeppsson et al., 2002
S. cerevisiae TMB 3253 50 X 14 56 NA Jeppsson et al., 2003
S. cerevisiae TMB 3254 50 X 14 56 NA Jeppsson et al., 2003
S. cerevisiae TMB 3255 50 X 20.5 82 0.29 Jeppsson et al., 2002
S. cerevisiae TMB 3256 50 X 18 72 NA Jeppsson et al., 2003
S. cerevisiae TMB 3261 50 X 17 68 NA Jeppsson et al., 2003
S. cerevisiae TMB 3266 10 X 4.6 92 0.064 Traff-Bjerre et al., 2004
S. cerevisiae TMB 3267 10 X 4.1 82 0.057 Traff-Bjerre et al., 2004
S. cerevisiae TMB 3270 50 X 18 72 0.32 Jeppsson et al., 2006
S. cerevisiae TMB 3271 50 X 15.5 62 0.28 Jeppsson et al., 2006

Review of literature
55
S. cerevisiae TMB 3400 8 X 1.44 36 NA Wahlbom et al., 2003
S. cerevisiae TMB 3400 20 X 5 50 NA Wahlbom et al., 2003
S. cerevisiae TMB 3400 50 X 17 68 0.12 Karhumaa et al., 2007
P. stipitis FPL UC7 80 X 30.4 76 0.41 Shi et al., 1999
P. stipitis FPL-shi 21 80 X 38.4 96 0.43 Shi et al., 1999
P. stipitis FPL-shi 31 80 X 24.8 62 0.15 Shi et al., 2002
Where,
A= arabinose,
G = glucose,
X= xylose,
Gal = galactose,
M = mannose.

Review of literature
56
Thereafter to achieve reduction in xylitol formation during xylose fermentation,
recombinant S. cerevisiae strains expressing PsXR and PsXDH and
overexpressing of ScXKS were constructed that lowered the oxidative PPP
activity through the GND1 (6-phosphogluconate dehydrogenase) and ZWF1
genes (glucose- 6-phosphate dehydrogenase) (Jeppsson et al., 2002). These
mutants showed increase in ethanol yield and xylose consumption rate
compared to the parent strain. Alternatively the shift of metabolic flux towards
ethanol formation appeared a significant strategy to improve the intracellular
cofactor concentrations in S. cerevisiae (Bro et al., 2006). The impact of over-
expression of NADH kinase (encoded by the POS5 gene) on glucose and xylose
metabolism in recombinant xylose-utilizing S. cerevisiae has also been studied
(Huo et al., 2009). The expression of NADH kinase in cytosol instead of
mitochondria redirected the carbon flow from CO2 to ethanol during aerobic
growth on glucose, whereas under anaerobic growth the flux directed toward
ethanol and acetate fermentation (Huo et al., 2009).
The approach of protein engineering has also been investigated to reduce xylitol
excretion and enhancing ethanol yield using recombinant S. cerevisiae. Using
this approach an improved ethanol production accompanied by decreased
xylitol formation was achieved in recombinant S. cerevisiae expressing mutated
PsXR (having reduced affinity for NADPH), PsXDH and ScXKS (Jeppsson et al.,
2006). Besides, the heterologous expression of xylose specific transporters in
recombinant S. cerevisiae for improved ethanol production has also been tested.
The SUT1 gene (Weierstall et al., 1999) coding a sugar transporter in P. stipitis,
has been successfully expressed in S. cerevisiae (Katahira et al., 2006).
Moreover, the glucose/xylose-facilitated diffusion transporter and
glucose/xylose symporter from C. intermedia, encoded by Gxf1 and GXxf2 genes
(Leandro et al., 2008) have been expressed in S. cerevisiae (146), where the
recombinant xylose-fermenting S. cerevisiae strain harboring Gxf1 showed
faster xylose uptake and ethanol production (Runquist et al., 2009). Recently, a
combinatorial approach of genetic engineering, chemical mutagenesis and
evolutionary adaptation has been used to improve the xylose utilization. The S.
cerevisiae strain W303-La was introduced with XI and XKS gene from P. stipitis
NRRL7124 to make S. cerevisiae LEK 122. Thereafter, the selected strain was
chemically mutagenised with EMS followed by their evolutionary adaptation for
xylose utilization and growth under oxygen-limited conditions (Liu and Hu,
2010).

Review of literature
57
2.5.4.2. Genetically engineered Zymomonas mobilis
The xylose utilization in Z. mobilis was developed by integrating XI and XKS from E.
coli, Xanthomonas campestris and K. penumoniae in its genome (Feldman et al., 1992;
Zhang et al., 1995). In another work, the operons encoding xylose assimilation and
pentose phosphate pathway enzymes were transformed into Z. mobilis to generate pZB5
strain for the effective fermentation of xylose to ethanol (Zhang et al., 1995; Ruiz et al.,
2007). Further to construct improved strains with higher ethanol productivities and
yields, pZB5 was transformed into Z. mobilis ethanol producing strain ZM4; ATCC
31821, which showed the capability of converting a mixture of 65g/L of glucose and 65
g/L of xylose to 62 g/L ethanol in 48h with an overall yield of 0.46 g/g (Joachmisthal et
al., 2000). Following the similar approach, another group incorporated five genes of
arabinose utilization from E. coli ara A (coding for L-arabinose isomerase), ara B (coding
for L-ribulokinase), ara D (coding for L-ribulose-5 phosphate-4-epimerase), tal and tkt in
Z. mobilis ATCC 39767 (Deanda et al., 1996). A number of other improvements have
also been made into Z. mobilis strains and the newest strain Z. mobilis AX101 fermentsed
both arabinose, xylose and glucose and carriesd seven necessary recombinant genes as
part of chromosomal DNA (Chou et al., 1997; Lawford et al., 2002; Mohagheghi et al.,
2002). However, these strains showed acetic acid sensitivity (Mohagheghi et al., 2002).
To address the problem of sensitivity to toxic fermentation inhibitors, a new strain of Z.
mobilis ZM4/AcR (pZB5) was developed with increased acetate resistance that has
enhanced performance in the presence of 12 g sodium acetate per L at pH 5 (Jeon et al.,
2009). Recently, in a recent effort, transcriptomic and metabolomic profiles for Z. mobilis
ZM4 under aerobic and anaerobic fermentations have been elucidated using microarray,
high-performance liquid chromatography and gas chromatography-mass spectrometry
(GC-MS) analysis (Yang et al., 2009).
2.5.4.3. Genetically engineered Escherichia coli
The construction of E. coli strains to selectively produce ethanol was one of the
first successful applications of metabolic engineering. Ingram‟s group has done
extensive work on the development of efficient recombinant E. coli strains for
ethanol production. They eliminated the dependence of host on alcohol
dehydrogenase (ADH) activity by combining adh B and pdc (coding for pyruvate
decarboxylase, PDC) genes of Z. mobilis to form pet operon (Ingram et al., 1987;
Beall et al., 1991). Considering a number of factors that influence ethanol

Review of literature
58
production such as substrate range and growth conditions, E. coli strains ATCC
11303 was chosen as the host for the pet plasmid (Alterthum and Ingram,
1989). Further, to improve the genetic stability, the pet operon was integrated
into the chromosome of ATCC 11303. This strain was further modified by
deletion of the succinate production gene (frd) to prevent the formation of
succinate, a major byproduct of E. coli metabolism. The final strain so developed
strain (KO11) was able to convert glucose and xylose to ethanol at theoretical
yields of 100% in rich media containing ample yeast extract (Ohta et al., 1991).
To further improve pentose fermentation by KO11, a number of spontaneous
mutants defective in glucose transport were selected and two such strains SL28
and SL40 when fermented using individual or mixture of xylose and glucose
produced ethanol more efficiently (20 %) than the parent strain KO11 (Lindsay
et al., 1995). The recombinant E. coli strain was further improved to achieve
better xylose fermentation, the glycolytic flux and the growth rate of
recombinant strain (Gonzalez et al., 2002). Later on to address this problem, a
lactate producing recombinant of KO11 was reengineered for ethanol production
by deleting genes encoding for fermentative routes for NADH and randomly
inserting a promoter-less cassette containing the complete Z. mobilis ethanol
pathway into KO11 chromosome (Attfield and Bell, 2006).
In contrast, Dien and coworkers (2000) developed new ethanologenic strains of
E. coli such as FBR3, FBR4 and FBR5 with plasmid pLOI297 having Z. mobilis
pyruvate to ethanol converting enzymes. Alternatively a homo-ethanologenic
strain of E. coli SE2738 from wild type E. coli K-12 W3110 was also developed;
where the mutant strain exhibited 82 % theoretical ethanol yield when grown on
xylose under anaerobic conditions (Kim et al., 2007). In a recent study a
minimal E. coli cell for efficient ethanol production from hexoses and pentoses
was developed using elementary mode analysis to dissect the metabolic network
into its basic building blocks (Trinh et al., 2008). Later on, using the similar
approach, a glycerol to ethanol converting E. coli strain was designed by
reducing the functional space of central carbon metabolism to a total of 28
glycerol utilizing pathways (Trinh et al., 2009). More recently an attempt has bee
made, E. coli has also been attempted to engineer E. coli for the production of
ethanol from fatty acid feedstocks, resulting in ethanol yield much higher than
the theoretical maximum obtained from sugars (Clomburg and Gonzalez, 2010).

Review of literature
59
2.6. Economic evaluation of cellulosic ethanol production
The first detailed technical reports found in the litreature concerning the US
cases dates back to the mid-80‟s (Chandel et al., 2007b; Gnansounou and
Dauriat, 2010). In 1987, Stone & Webster Engineering Corporation studied the
economic feasibility of wood-based ethanol plant, which includes feedstock
handling, acid catalyzed steam explosion pre-treatment, enzyme production and
hydrolysis, concentration of glucose, fermentation, distillation and anaerobic
digestion and on the basis of constant US$ (1984) the ethanol selling price was
estimated to be $0.93/litre or $3.5/gal. Similarly, another report released by
Chem Systems, Inc. (1987) which consisted of separate hydrolysis and
fermentation of hardwood, on-site enzyme production, carbon dioxide recovery
and furfural production, estimated an ethanol selling price of $0.54/ litre or
$2.06/gal.
Later on, NREL reported the lignocellulose conversion to ethanol following acid
hydrolysis at a cost of ~ $0.05 per litre or $ 0.20 per gallon ethanol (Aden et al.,
2002). They also reported that though enzymatic hydrolysis has great potential
for improvement but the saccharifying enzymes are very expensive (~US$ 0.08-
0.13 per litre ethanol or 0.3-0.5 per gallon ethanol) (Aden et al., 2002).
Therefore, over the past decade, much effort was devoted to reduce the
cellulases production cost. Aden and coworkers (2002) estimated that if the
enzyme cost comes less than 2.67 cents/litres or 10 cents per gallon of ethanol,
the cost of ethanol production could drop as low as $0.28/litre or $1.07 / gallon
(in 2002 dollars) and in another report NREL has aimed to achieve this goal by
2012 (Aden, 2008). Concerning the RD&D in lignocellulosic bioethanol, a
„„multi-year program plan” was released and was updated every two years,
including 2005 (US DOE, 2005), 2007 (US DOE, 2007) and 2009 (US DOE,
2009). The detailed updates of the technology model are provided by Aden
(2008), Aden and Foust (2009), and Humbird and Aden (2009).
Besides US, European research institutions have also made significant
contributions to the techno-economic evaluation of bioethanol production
(Hamelinck, 2004; Kuijvenhoven, 2006). In the REFUEL project (2006–2008) by
the European Commission, seven EU institutes evaluated the prospects for
biofuels in terms of resource potential and costs (Gnansounou and Dauriat,
2010). The economic evaluation was based on constant € of 2002 and expected
Review of literature
60
a net production cost of $0.90/litre or €0.62/litre in 2010, $0.85/litre or
€0.59/litre in 2020 and $0.72/litre or €0.50/litre in 2030 (Londo et al., 2008).
In another case study, Sassners and coworkers (2008) compared the techno-
economic performances for the conversion of different lignocellulosics (Spruce,
corn-stover and salix) to ethanol, which required estimation of annual
production cost including annualized capital cost and annual operation costs.
According to them, the annual production costs (US$) vary significantly, i.e.
$0.66-0.69/l ethanol (spruce), 0.67-0.86 (corn stover) and 0.72-0.87 (salix).
Similarly, Wingren et al. (2008) performed a techno-economic evaluation of
simultaneous saccharification and fermentation (SSF) based softwood-to-
ethanol process. The economic evaluation uses the same approach as by
Sassners et al. (2008) and the production cost varies between 0.546 to 0.591
US$/l.
While in another study, Wright and Brown (2007) evaluated the economics of
advanced biochemical process (pretreatment, saccharification, fermentation and
distillation) for producing bioethanol from plant fibres. Based on US$(2007) the
capital costs and the operating costs for bioethanol production was 1.06-1.48
and 0.35-0.45 $/litre ethanol or 4.03-5.60 and 1.34 - 1.69 US$/gallon ethanol,
respectively. Moreover on anticipating further improvements in bioconversion
technologies, the projected capital cost and operating costs for future plants are
estimated to be 3.33–4.44 and 0.40-0.89 US$/gallon ethanol, respectively
(Hamelinck et al., 2005; Wright and Brown, 2007). At the same time, Galbe et
al. (2007) also reviewed the different studies on the process economics of
ethanol production from lignocellulosic materials published during the last
decade and found that the variation of the production cost could be in the range
of US$ 0.13–0.81 per litre of ethanol. Recently, Gnansounou and Dauriat (2010)
proposed a six-step application of cost evaluation to the design of
lignocellulosics ethanol pathways; (i) to identify desired ethanol characteristics;
(2) to target selling price of lignocellulosic ethanol; (3) to target cost of
lignocellulosic ethanol; (4) to target cost of each step of the supply pathway; (5)
cost management activities; and (6) continuous improvement.

Review of literature
61
2.7. Commercialization of bioethanol
As a consequence of the mandatory targets of blending ethanol, the demand for
bioethanol is increasing rapidly in industrialized countries worldwide and it is
expected that the market for cellulosic ethanol will become mature in the next
5-10 years (Gnansounou and Dauriats, 2010). Moreover, the international
ethanol market has been stimulated by governmental policies of incentive for
the use of renewable fuels (Table 2.7). In expansion the international market is
very regional with the largest producers also being the largest consumers
(Almeida and Silva, 2006). Currently, there are 448 bioethanol production units
installed in Brazil (Udop, 2009), but the country still needs expansion of ethanol
production (Soccol et al., 2010). In the US, ethanol is used in two forms: mixed
with gasoline in the maximum proportion of 10%, or in mixtures containing
85% ethanol and 15% gasoline, as an alternative fuel (EIA, 2008). In 2011, the
US produced 13.9 billion gallons ethanol from its 209 ethanol refineries located
in 29 states, which is an increased production from 2010 (13.2 billion gallons)
and 2000 (1.63 billion gallons) (RFA, 2012).
While, in EU most of the members states seem to be on track to meet or even
exceed the first interim target in 2012 and will have to increase their RES
shares more rapidly in the future to meet the 2020 target. In India as well the
addition of 5% ethanol to gasoline is mandatory in 10 states and 3 territories
and in the next step, the supply of ethanol mixtures with gasoline will be
expanded to the whole country. Some efforts will also be directed to increase the
ethanol percentage in the mixture to 10% (Prasad et al., 2007). Sweden also
uses mixtures containing 5% ethanol in gasoline, while in Canada and some
regions of China mixtures containing up to 10% ethanol in gasoline may be
found (Souza, 2006). In Japan, the replacement of 3% of gasoline by ethanol is
authorized (Orellana and Bonalume Neto, 2006), but efforts will be made to
increase this value to 10% (Souza, 2006). In Thailand, renewable energy policy
promotes the use of a 10% blend of bio-ethanol with 90% gasoline (Silalertruksa
and Gheewala, 2009).

Review of literature
62
Table 2.7: List of major policies and plans for bioethanol worldwide
Policies/Plans/Act Country
Brazilian alcohol Program (Proalcool) Brazil
Ministry of Mines and Energy, Brazil Brazil
Brazilian Sugarcane Industry Association
(UNICA) Brazil
Brazilian Renewable Energy and Incentive
Program (PROINFA) Brazil
Agriculture and Agri-food Canada (AAFC) Canada
National Science and Engineering Research
Council (NEERC, Canada) Canada
National Development and Reform Commission
(NDRC) China
National High-Tech Program (China) China
Organisation for economic cooperation and
development (OECD) Europe
European Union Strategy (EU) EU Countries
International Energy Agency (IEA) IEA countries (28)
Ministry of Petrolium and Natural Gases (MPNG) India
Ministry of New and Renewable Energy (MNRE) India
Planning Commission, Govt. of India India
National Energy Policy (Malayasia) Malayasia
Ministry of Agriculture (Russia) Russia
Bureau of Energy (BOE, Taiwan) Taiwan
United National Development Programme
(UNDP)
United Nation's member
countries (166)
Energy Information Administration (EIA) United States of America
Environment Protection Agency (EPA) United States of America
United States Department of Agriculture (USDA) United States of America
National Renewable Energy Laboratory (NREL) United States of America
Department of Energy (DOE, US) United States of America

Review of literature
63
Many countries world wide such as Brazil, United States, China, India, Russia,
Japan, Malaysia, Canada, Europe, Korea and Taiwan etc. are developing their
own bioethanol commercialization plans and strategies. Additionally, in order to
accelerate the uptake of bioethanol towards commercialization, exemption from
both federal and provincial fuel excise taxes has been provided (Mabee and
Saddler, 2010; Mussatto et al., 2010), which acts as a rebate for the bioethanol
producer. Besides a few other important strategies or policies such as
government and private grants funding in R&D, subsidy to bioethanol
producers and production of ethanol fueled vehicles etc are also recommended
in order to promote cellulosic ethanol production as a substitute for
conventional transportation fuel (GBEP, 2008; Mabee and Saddler, 2010;
Mussatto et al., 2010). However the major recommendations in most of the
policies are as described by Tan et al. (2008): (a) government and private funds
should be made available for R&D to reduce the cost of bioethanol production;
(b) incentives and tax rebatement should be provided to bioethanol producing
companies; and (c) the production of bioethanol should be promoted by the
introduction. Besides policies to promote bioethanol, there are direct
investments in R&D, pilot and demonstration plants. As a result, several R&D
projects as well as pilot plants and demonstration projects on second generation
bioethanol are being implemented worldwide (Table 2.8). The demonstration
plants are at different levels of maturity, few of them are in advanced stage
(Abengoa, Inbicon, BioGasol), while others are in design phase.
A. SEKAB
The pilot plant of SEKAB, located in Örnsköldsvik, Sweden, was started ethanol
production in 2005. The plant has a capacity to produce 300–400 litres
ethanol/day from 2 tons biomass (Gnansounou, 2010). The main feedstock for
ethanol production is wood chips from pine trees. While other substrates such
as sugarcane bagasse, wheat and corn stover as well as energy grass can be
also used. The plant can operate with either two stage dilute acid hydrolysis or
dilute acid pre-treatment followed by simultaneous saccharification and
fermentation (Galbe et al., 2005). The technology is already been in action in a
pilot plant operated on a 24/7 basis since 2004, and the accumulated running
time now exceeds 28,000 hours (www.sekab.com/cellulosic-ethanol/demo-
plant). Moreover, the technology is ready to a scale of commercial ethanol plant
integrated with heat and power generation plant (Biofuel digest, 2009).

Review of literature
64
Table 2.8: List of few advanced biofuels project including annual capacity
(million gallons) by company for 2009-2013.
Companies 2009 2010 2011 2012 2013 Technology
Abengoa 0.00 0.00 15.00 15.00 15.00 Enzymatic hydrolysis
ADM 0.00 0.00 0.00 1.00 1.00 Enzymatic hydrolysis
AE Biofuels 0.01 10.01 10.01 10.01 10.01 Enzymatic hydrolysis
American Process 0.00 0.00 0.89 0.89 0.89 Enzymatic hydrolysis
BlueFire Ethanol 0.01 0.01 3.91 3.91 22.91 Acid hydrolysis
Coskata 0.05 0.05 0.05 100.0 100.05 Gasification
DDCE 0.00 0.25 0.25 0.25 0.25 Enzymatic hydrolysis
Enerkem 0.30 0.30 10.30 10.30 20.30 Gasification
Fulcrum 0.01 0.01 0.01 10.51 10.51 Gasification
Haldor Topsoe 0.00 0.00 0.00 0.80 0.80 Enzymatic hydrolysis
Inbicon 1.40 1.40 1.40 19.40 19.40 Enzymatic hydrolysis
IneosBIO 0.00 0.00 8.00 8.00 8.00 Enzymatic hydrolysis
Iogen 0.48 0.48 23.48 23.48 23.48 Enzymatic hydrolysis
KL Energy 1.30 1.30 1.30 1.30 1.30 Enzymatic hydrolysis
LanzaTech 0.01 0.51 0.51 0.51 0.51 Gasification
Lignol 0.01 0.01 0.01 0.01 0.01 Enzymatic hydrolysis
Logos
Technologies 0.00 0.00 0.00 0.80 0.80 Enzymatic hydrolysis
Mascoma 0.20 0.20 0.20 20.20 20.20
Consolidated
bioprocessing
POET 0.02 0.02 25.02 25.02 25.02 Enzymatic hydrolysis
Range Fuels 0.00 20.00 20.00 20.00 20.00 Gasification
Scottish Bioenergy 0.01 0.01 0.01 0.01 0.01 Enzymatic hydrolysis
SEKAB 0.01 0.01 0.01 0.01 0.01 Enzymatic hydrolysis
St1 Biofuels Oy 0.00 0.00 0.01 0.01 0.01 Enzymatic hydrolysis
Terrabon 0.00 0.10 0.10 0.10 0.10 Hydrogenation
TMO Renewables 0.01 0.01 0.01 0.01 0.01 Enzymatic hydrolysis
UPM-Kymmene 0.00 0.00 0.00 0.68 0.68 Enzymatic hydrolysis
Verenium 1.40 1.40 1.40 37.40 37.40 Enzymatic hydrolysis
Weyland / Statoil
Hydro 0.00 0.01 0.01 0.01 0.01 Enzymatic hydrolysis
ZeaChem 0.00 0.25 0.25 0.25 0.25 Gasification/fermentation
http://www.biofuelsdigest.com/blog2/2010/02/08/advanced-biofuels-planned-capacity-to-reach-1-38-billion-gallons-by-2013/

Review of literature
65
B. Abengoa Bioenergy
Abengoa Bioenergy has built their demonstration plant in Babilafuente,
Salamanca (Spain). The plant can produce 5 Million Liters ethanol per year and
can process 70 tones agricultural residues per day (Gnansounou, 2010). The
feedstocks are wheat straw and corncob and the conversion technology used is
the separate hydrolysis and fermentation (SHF). The construction of biomass
plant was completed in 2008, and in 2009, the plan betan its operation
reaching 5000 operating hours, with a yield of 200L/tonne of straw. The plant
has target to achieve a yield higher than 300L/ tonne, as well to ferment C-5
sugars. Abengoa is now developing a commercial scale in Hugoton, Kansas
(USA), to validate this technology, which can produce 100 million Liters per
annum (www.abengoa.com/corp/web/en/noticias_y_publicaciones/noticias/
historico/2011/02_ febrero/bio_20110217.html).
C. BioGasol
The company BioGasol has its pilot plant in the Technical University of
Denmark, which has a capacity of 10 tonnes ethanol per year. The company is
also manufacturing one of the first Danish demonstration- ethanol plants (5.2
million litres) of second generation feedstock (Ganansounou, 2010). The process
technology consists of pretreatment, SSF, fermentation of xylose using a
proprietary thermophilic anaerobic bacterium and production of biogas from
processed water (Ganansounou, 2010). Since the beginning of 2011, Biogasol
has been working in phase 2 of the “”BornBiofuel” Demonstration plant project,
after developing cost effective and scaleable solutions wit in pretreatment and
C-5 fermentation during phase-1 (2008-2010). The integrated plant will
demonstrate Biogasol core technologies and will be located a Aakirke by on the
island of Bornholm, Denmark (www.biogasol.com/BornBioFuel-177.aspx)
D. Inbicon and DONG Energy
Inbicon, a subsidiary of DONG Energy, has installed a cellulosic ethanol
demonstration plant in 2009 in Kalundborg (Gnansounou, 2010). The
Kalundborg will plant produce 5.4 million litres of ethanol per year from wheat
straw and will consist of SSF with a hydrothermal pre-treatment (Gnansounou,
2010; Larsen et al., 2008). The lignin will be vaporized according to the
„„Integrated Biomass Utilization System (IBUS)” concept by a cogeneration plant
to provide heat. The electricity will be sold to the electrical network (Larsen et
Review of literature
66
al., 2008). The next scale up from the Inbicon Biomass Refinery will be a
commercial size that will produce 5.4 million liters a year from 30,000 Metric
tones of biomass probably wheat straw or corcob and stover
(www.inbicon.com/Biomass%20Refinery/Pages/Inbicon_Biomass_Reninery_
at_Kalundborg.aspx).
E. Shell Oil
In Canada, a Shell‟s fuel station in Ottawa (jointly run with Iogen), became the
first fuel station in the country to serve cellulosic ethanol. The station offers a
10 % blend of gasoline and wheat straw ethanol manufactured at a
demonstration-scale cellulosic ethanol of Iogen Energy Corporation (Biofuel
digest, 2009; gas2.org/2009/06/10/shell-announces=Ce10-cellulosic-ethanol-
available-now-at-ottawa-station/). The company first partnered this in 2002 at a
lower share but subsequently increased its ownership stake in Iogen‟s
technology to 50 % in 2007 (Biofuel digest, 2009; www.shell.ca/home/
content/can-en/aboutshell/media_centrre/news_and_media_releases /archieve
/2008/July12_biofuel.html).
F. Novozymes
Novozymes launched the Cellic product family, the first commercial enzymes for
cellulosic bioethanol, which have the best cost performance from amongst any
cellulosic ethanol enzymes commercially available (Biofuel digest, 2009).
Besides, Novozymes has also launched Spirizyme Ultra and Liquozyme SC 4X
for saccharification and liquification of starch, respectively (Biofuel digest,
2009). These enzymes yielded better saccharification with eventually increase
cellulosic ethanol production. Novozymes has developed a research partnership
with several international companies. It has collaborated with a Latin American
environmental firm Cetrel, which will convert sugarcane bagasse to biogas,
using enzymes from Novozymes. Similarly, they collaborated with an Indian
fermentation based company PRAJ during the Climate Change Summit in
Copenhagen in 2009. Recently Novozyme is launching Cellic CTec3-which is 1.5
times better than the previous generation Cellic Ctec-2and 5 times better than
the standard biomass degrading enzyme sin the market
(www.novozymes.com/en/solution/bioenergy/cellulosic-ethanol/cellulosic-
extraction/pages/default.aspx).

Review of literature
67
G. Verenium Corporation and BP Biofuels
Verenium operated an integrated cellulosic ethanol pilot plant and a 5.29
million liters per year demonstration scale facilities in Jennings, Louisiana.
This plant is used for strengthening the company for advanced fermentation
and to use a vast range of feedstocks for cellulosic ethanol production (Biofuel
digest, 2009). The plant also serves as a R&D facility to develop new enzymes
for optimizing the cellulosic ethanol production. However, on July 15, 2010,
these plants were acquired by BP Biofuels, North America under an MOU
agreement (http://ir.verenium.com/releasedetail.cfm?ReleaseID=488510;
www.renewableenergyworld.com/rea/news/article/2010/07/bp-to-acquire-
vereniums-cellulosic-biofuel-platform).
H. POET
The first pilot plant of cellulosic ethanol was began in Scotland, SD. This plant
has an annual product capacity of 20,000 gallons of cellulosic ethanol, but
more importantly,it allows new technogies and process to validate. This help in
reducing the ethanol production cost for $4.13/gallon to $3.0/gallon
(www.poet.com/innovation/cellulosic/pilot.asp). Poet has committed to produce
3.5 billion gallons of cellulosic ethanol by 2022
(www.poet.com/innovation/cellulosic/plan.asp). Now they have announced to
launch its first commercial scale demonstration plant under the proect-
LIBERTY in IOWA in late 2013. The plant is expected to produce 25 million
gallon per annum cellulosic ethanol (www.projectliberty.com).
2.8. Future Prospects
Ethanol has always been considered a better short- and mid-term liquid biofuel,
as it reduces the dependence on reserves of crude oil and promises cleaner
combustion leading to a healthier environment. Interestingly, the world‟s focus
is switching over from corn and sugarcane to cellulosic or plant biomass as
renewable raw material for production of bioethanol (Campbell and Laherrere,
1998; Saha et al., 2005; Himmel et al., 2007; Kuhad et al., 2011a). However, to
reduce the final production cost, technological bottlenecks in commercial
production of lignocellulosic ethanol from pentose sugars need to be addressed.
In recent years, a significant development in ethanol conversion has been
made, however the current industrial activity of bioethanol production is limited
mainly because of the raw material processing, cost-effective sugar release from

Review of literature
68
biomass, and unavailability of efficient fermentation strategies. The process for
conversion of structural carbohydrates to sugars requires adequate
deconstruction of lignocellulosic biomass leading to maximum sugar yield. An
efficient pretreatment strategy should be developed that can harness maximum
sugars and can fractionate lignin in a recoverable form. Moreover for the
efficient saccharification of cellulosics, approach of bioprospecting for novel
cellulase and saccharifying enzymes should be carried out. In addition, high-
throughput screening techniques and better expression systems for efficient
production of membrane proteins, and enzyme complexes such as cellulosomes
are in need of development. Since the higher sugar concentration will lead to
higher ethanol in the fermentation, therefore strategies such as continuous
feeding of substrate or fed-batch enzymatic saccharification should be adopted
to improve the sugar concentration in the enzymatic hydrolysate. Moreover, to
reduce the enzyme cost, research is needed in the direction to recover and reuse
the enzymes.
Another major concern is the generation of microbial inhibitors during
the pretreatment process, which represent a significant carbon loss and
consequently, lignocellulosic ethanol economy is largely affected due to lower
ethanol yield. Although, various detoxification strategies have been applied to
remove these inhibitors for improved hemicellulosic hydrolysate‟s fermentability
(Mosier et al., 2005; Chandel et al., 2007a; Gupta et al., 2009; Kuhad et al.,
2010b; Palmqvist and Hahn-Hagerdal, 2000a, b), however, the process of
detoxification also increase the processing cost. Therefore, there is an
imperative need for bioprospecting of new microbes capable of converting
pentose sugars present in the hydrolysate efficiently even in the presence of the
toxic inhibitors or use of robust hosts, such as Bacillus (Geobacillus) strains
(Zhang et al., 2010)
Further efforts are required to improve the fermentation efficiency of both
the sugar hydrolysates i.e., enzymatic hydrolysate (C-6 sugars) and the acid
hydrolysate (C-5 sugars). An approach of simultaneous saccharification and
fermentation (SSF) should be employed to exploit both the sugars in a more
economic way. Various fermentation strategy such as CSTR and fed-batch
strategy should be used to enhance the ethanol concentration. The approach of
genetic engineering should be used to improve the microorganisms in terms of
higher ethanol tolerance, inhibitor tolerance, osmotolerance and co-
Review of literature
69
fermentation of C-5 and C-6 sugars. Additionally, the better elucidation of
pentose sugars transport at the molecular level and characterization of kinetic
and regulatory properties, including quorum-sensing mechanisms, should be
given high priority because it may provide the basis for the simultaneous use of
pentose as well as hexose sugars released during biomass hydrolysis (Galazka
et al., 2010). Moreover, the approach of flux analysis to divert or increase the
activity of certain crucial enzymes for ethanol production with efficient xylose
utilization must be a priority (Matushika et al., 2009b).
To further make the bioethanol production process successful at
industrial scale with reduction in capital and operation cost, some integrated
unit operations using robust microorganisms for better product yields should be
adopted (Zhang, 2008). An ideal up-scaling strategy needs to be fully integrated
to evaluate the complete system (e.g., enzymes, nutrients, product yields and
titers, and yeasts) with sufficient flexibility to investigate alternative process
configurations. From a process scale-up perspective, the challenges lie not only
with finding the most efficient organism for hemicellulose conversion but also to
make an intelligent use of the entire feedstock during process integration.
Before we freeze in the dark, we must prepare to make the transition from nonrenewable carbon
resources to renewable bioresources.
Ragauskas and coworkers (2006)