Strand: Listening and Responding Strand Unit: Exploring Sounds

Review of I‐73 and Grand Strand Expressway
Alternative Economic Studies
FINAL REPORT
November, 2012
Prepared by Parsons Brinckerhoff for:
Grand Strand Business Alliance, Myrtle Beach South Carolina

Report Disclaimer and Limitations
The Report, information contained herein, and any statements contained within the Report are based
upon information provided to Parsons Brinckerhoff by and obtained from publicly available
information or sources, or information provided to PB in the course of investigations and evaluations
of the economic studies included. Conclusions are based on that information and the best
professional judgment of Parsons Brinckerhoff.
Parsons Brinckerhoff does not assume responsibility or bear any liability whatsoever as to the actions
taken by others, including third parties, based upon the statements made in this Report. Parsons
Brinckerhoff’s Report is time‐relevant, specifically referring to conditions and information available at
the time of review.
Questions regarding this report or its contents should be directed to PB as follows:
Ira Hirschman, Project Manager +1 212 613‐8805

I. Purpose
The Grand Strand Business Alliance (GSBA) of Myrtle Beach South Carolina has contracted with Parsons
Brinckerhoff to review previous economic studies and other materials related to the economic impacts
of highway alternatives connecting I‐95 to Myrtle Beach, including the I‐73 Interstate Highway Project (I‐
73 Project) and an alternative SC 38/US 501 highway upgrade project.
This review report, which focuses exclusively on the segment from I‐95 to Myrtle Beach, comprises a
comprehensive review of the following recent impact studies:
Economic Impact Study of I‐73, for Northeastern Strategic Alliance (NESA Economic Study)1
Construction impact study, by Dr. Don Schunk (Schunk Study)2
Grand Strand Expressway Study for the South Carolina Coastal Conservation League (Smart Mobility Report)3
An Economic Analysis of I‐73 and the Grand Strand Expressway, for the Coastal Conservation League (CCL Economic Study)4
Elements in the review include:
Reasonableness of cost estimates based on order of magnitude analysis, but no engineering
estimates.
Reasonableness and inclusiveness of economic benefits included in the studies; consistency with
best practices for analysis of economic impacts of highway projects based on the experience of the
review team.
Reasonableness and reliability of input data used to estimate benefits.
Reasonableness and reliability of methodologies used and results derived.
This review report comprises the primary written deliverable for this assignment. In addition, and based
on this review report, Parsons Brinckerhoff will prepare a Power Point presentation, highlighting the
results of investigations contained here.
In accordance with our contract agreement with the GSBA this review report does not draw conclusions
with respect to the ultimate merits and/or comparative ranking of the project alternatives on the basis
of economic impacts or other criteria. However, this assessment is intended to provide sufficient
1 Chmura Economics and Analytics, Economic Impact of I‐73 in South Carolina, prepared for Northeastern Strategic Alliance (NESA), 3/22/2011. 2 http://www.i73.com/job_creation.html 3 Smart Mobility, The Grand Strand Expressway: An Alternative to the Proposed I‐73 to Myrtle Beach, South Carolina, prepared for South Carolina Coastal Conservation League (CCL), 3/25/2011 4 Miley Associates, An Economic Analysis of I‐73 and the Grand Strand Expressway (GSX) Alternative, prepared for the Coastal Conservation League (CCL), 4/2012.

information for study recipients to understand the methods, assumptions and data, including
limitations, and the meaning and validity of output measures derived in the studies under review.
While Parsons Brinckerhoff reviewed the Smart Mobility Report (one of the four reports
included in the study agreement), that report includes no economic analysis or specific
quantified economic assertions. Its content is limited to descriptions of possible non‐Interstate
links between I‐95 and SC 22, including the SC 38/US 501 upgrade. It provides a discussion of
the authors’ opinions with respect to the comparative merits of that alternative, relative to the
I‐73 project, including views regarding cost, environmental impact, and congestion reduction. It
also includes comments regarding the recently completed Environmental Impact studies. No
analysis of a quantitative nature is provided in that report to support assertions of economic
benefit or comparative performance.
The description of the SC 38/US 501 upgrade alternative in the Smart Mobility Report appears
to be the basis for the CCL Economic Study. However, neither report provides sufficient
documentation to determine whether common operational assumptions have been made in
both concerning the SC 38/US 501 upgrade. The Smart Mobility Report presents its estimates
of costs for the SC 38/US 501 upgrade at $147 M, versus $1,300 M for the I‐73 project, “as
proposed in the EIS.”5 The report does not indicate in what year dollars the costs are
expressed (e.g., year 2011 dollars, year of expenditure dollars, etc.) This makes validation of
the cost estimates a matter of some guesswork. The Smart Mobility Report indicates that the
costs are “planning level costs based on typical unit costs for projects in North and South
Carolina, not based on site specific engineering analysis”. 6 A fuller discussion of the Smart
Mobility Report cost estimates and their likely reliability is presented later in this review report.
Beyond estimated costs for the two projects, no further economic analysis is presented in the
Smart Mobility Report, and accordingly is not considered further in this assessment.
In addition to the four studies which Parsons Brinckerhoff has agreed to review, the recently
completed FEIS for the I‐73 project also includes economic assessments.7 This review report
does not review the economic assessments contained in the I‐73 FEIS. The FEIS, which focused
on Preferred Alternative 3, included a number of economic assessments covering several topic
areas, but did not specifically conduct Benefit Cost analysis, and does not report a benefit cost
ratio. However, this review report does take into consideration economic data either reported
in the FEIS or which might have been assembled in support of the FEIS, in order to shed light or
help verify information presented in both the NESA Economic Study (of I‐73) and the CCL
5 Smart Mobility Report, p. 11. 6 Ibid 7 South Carolina Department of Transportation, FEIS: Economic Impact Technical Memorandum: From I‐95 to the Myrtle Beach Region.

Economic Study (of the SC 38/US 501 upgrade). Our review report cites those data as they
specifically relate to the assessments in the NESA and CCL studies.
II. Terminology
The following define key terms used in economic analysis of transportation projects, which are
referenced in this assessment:
1. Benefit Cost Analysis (BCA) ‐ BCA compares the economic benefits to society arising from
an investment over the full life cycle of the investment, versus all of the costs that are
incurred during that same period of time. A full BCA generally seeks a complete accounting
of all societal benefits including public benefits such as passenger and freight travel time
savings, reduced air emissions, reduced highway accidents, and productivity benefits
directly attributable to the improvement, such as when workers can access higher
productivity employment opportunities, or can do work while traveling. Most BCAs
conducted for transportation projects, as reflected in the guidance for BCAs provided by the
USDOT for TIGER grant applications8, exclude projected economic development benefits
such as real estate benefits like developments around highway interchanges, tourism
increases and spending, and other economic impacts which may entail shifting of impacts
from one locale to another, or that can involve double counting. BCAs also exclude
construction related job creation, which is a reflection of a project’s cost, and any multiplier
impacts.
Benefits and costs are adjusted in a BCA to account for the “time value of money” through a
method known as “discounting”. Discounting is done by reducing (discounting) the value of
future benefits and costs by means of a discount rate. A typical time period for analysis of
highway projects is 40‐50 years or possibly longer.
2. Discount Rate – the percentage rate by which future costs and benefits are reduced to
reflect the time value of money. The discount rate is a form of interest rate or interest
hurdle rate, reflecting the interest that could be earned on an investment now at some
point in the future. A real discount rate, which eliminates inflation as a factor, is usually
used in a BCA. If inflation is expected to be 3% and projects are earning 5% face value in
8 USDOT TIGER IV Grant guidelines: Federal Register, Vol.77, p.4878. U.S. Department of Transportation, Tiger Benefit‐Cost Analysis (BCA) Resource Guide http://www.dot.gov/tiger/docs/tiger‐12_bca‐resourceGuide.pdf

private risk free markets (e.g., for long term government bonds), then the real discount rate
would be approximately equal to 2%.
3. Benefit Cost Ratio (BCR) – The BCR is a primary output of a BCA, and the metric most
frequently used to support public sector decision making. It is the ratio of all discounted
project benefits, as defined above, to discounted project costs over the complete life cycle,
including initial construction and engineering, and ongoing annual maintenance costs.
Salvage values may also be included.
4. Net Present Value – Another output of a BCA. The NPV is the difference between
discounted benefits and costs. It measures the net discounted dollar value of a project. It is
sometimes used instead of the BCR to assess the merits of competing projects.
5. Payback period – Another output of a BCA. It reflects the point in time after which a
project’s future discounted benefits equal (and thereafter exceed) its initial construction
cost (the initial project investment).
6. Economic Impact Analysis – Economic impact analysis is often distinguished from BCA
because the former can include estimates or forecasts of the impact of projects on
employment during construction, as well as possible impacts on real estate development or
regional economic competitiveness, business growth, and employment. Economic impact
analysis provides important information about the potential local, regional, or state benefits
of a project, but it is separate from formal BCA because economic impacts may reflect a
shifting of benefits from one locale to another, or they may involve significant double
counting, such as real estate value increases and travel time savings. In this case, real
estate value increases are often thought to reflect how real estate values “capitalize” travel
time or accessibility improvements into land value; adding both in a BCA would entail at
least some double counting.
7. Economic Multipiers/Multiplier Effects – Regional economic models known as Input –
Output Models (IO Models) are a well established tool used to estimate how much initial
expenditures (such as for constructing transportation project, or increasing sales by local
businesses) cycle through the economy and produces additional “secondary” economic
impacts. Those impacts, frequently referred to as multiplier effects, are derived using
economic multipliers which are obtained from IO models. Direct impacts represent new
spending, hiring, and production by civil engineering construction companies to
accommodate the demand for resources in order to complete the project. Indirect impacts

result from the increase in production of industries supplying intermediate goods and
services to the civil engineering construction industry. Induced impacts stem from the re‐
spending of wages earned by workers/households benefitting from the direct and indirect
activity. For example, if an increase in labor demand leads to earnings in a set of industries,
workers in these industries will spend some proportion of their increased earnings at local
retail shops, restaurants, and other places of commerce, further stimulating economic
activity.
III. Summary of PB Findings
Table 1 below summarizes the categories of economic impact considered by each study. The
table does not assess their validity. This assessment follows in Section IV.
Table 1. Economic Impacts to I‐95 to Myrtle Beach Corridor Considered by Each Study
Economic Impact
Study of I‐73,
(NESA Economic
Study)
Coastal
Conservation
League (CCL
Economic Study)
Smart Mobility
Report (CCL)
Schunk Study
Construction related
employment and other
economic impacts
No, only by reference
to Schunk study
Yes No Not in report, but Schunk reports a Chmura estimate for I‐73 of 22,347 jobs in South Carolina over 5 year period
Benefit Cost Analysis No but payback
period for entire I‐73
in S. Carolina
estimated at 4 years.
Yes No No
Travel time/efficiency
benefits
Yes Yes No No
Tourism Benefits Yes, estimated for Myrtle Beach
No No No
Hurricane Evacuation No No No No
Corridor
Economic/Business
Impacts
Yes, for interchange development and increased tourism spending
Yes, very general, referred to as “spillover” impacts
No No

Corridor/interchange business impacts
Yes (see above) Not specifically No No
Fiscal Impacts Tax revenue increases
associated with
tourism and travel
benefits
No No No
Project Costs Yes, but includes all of I‐73 in S. Carolina from border to Myrtle Beach
Yes (figure cited for
SC 38/US 501
upgrade)
Yes (figure cited
for SC 38/US 501
upgrade)
Yes I‐73 only
The Parsons Brinckerhoff review concludes the following:
Parsons Brinckerhoff was not able to find the basis of the $3.5 million dollar per mile cost
to upgrade the SC 38/US 501 corridor as reported in the CCL Economic Study or the Smart
Mobility Report. The SC 38/US 501 corridor between I‐95 and SC 22 is approximately 42
miles long and is four lanes along its entire length. The CCL implies the SC 38/US 501 route
is essentially an expressway. However, the SC 38/US 501 corridor does not meet AASHTO’s
expressway classification criteria. Parsons Brinckerhoff’s planning level cost per mile range
for upgrading the existing arterial four lane divided highway corridor to an expressway is
between $4.5 million and $5.5 million per mile. The total planning cost to upgrade the 42
miles of the corridor is between $190 million and $230 million, plus or minus ten percent.
A four lane expressway would not be comparable in capacity or performance to a six lane
interstate. Accordingly, comparisons to a six lane arterial such as the I‐73 project are not
valid. Capacity is limited by both the physical space and time available for movements. The
expressway will have interrupted flow due to limited accesses. This results in lost time for
drivers by slowing traffic. It is the judgment of the Parsons Brinckerhoff traffic engineers
who have observed the alternatives that a six lane facility would be needed to achieve the
maximum hourly rate at which approximately the same number vehicles can reasonably be
expected to traverse a section of roadway during the same period of time of a controlled
access four lane facility of I‐73.
A planning level cost to upgrade the arterial four lane corridor to a six lane interstate
corridor comparable to the I‐73 Project is between $1.3 billion and $1.6 billion.
The CCL Economic Study presents a benefit cost ratio (BCR) for the US 501 project, and
compares it with a Benefit Cost ratio for the I‐73 Interstate Highway project. The basis for
the BC ratio presented in that study for the SC 38/US 501 upgrade is without substantial
data source documentation with respect to both benefits and costs. The cost of the SC
38/US 501 upgrade, based on Parsons Brinckerhoff’s review of comparable completed

projects, appears to be underestimated (see above). At the same time, the benefits appear
overestimated by a significant order of magnitude. As a result, claims that the BC ratio for
a US 501 upgrade exceed 1.0 are found by Parsons Brinckerhoff to be unsupported by
credible data.
While the NESA study does not conduct a BCA, it concludes that the I‐73 project will have
a payback period of four years. This reflects an implicit BCA (as payback period
computations are derived from a BCA). A four year payback period, using best practices
for BCA would be improbable given project costs and annual estimated travel time
savings from the FEIS. The 4 year estimate reflects a combining and inclusion of benefits
that should not be included in a formal BCA, such as multiplier impacts, expectations about
increases in tourism spending, and economic gains from estimated new service business
formations around I‐73 Interchanges. While these are legitimate items to consider in
economic impact analysis, they would not necessarily qualify as benefits for a formal BCA.
Both the CCL study and the NESA study present arguments for and against economic
development benefits. Both should be regarded as partial and non‐rigorous, although
the NESA analysis is data based. Specifically:
o The CCL study refers to “spillover” benefits citing a few academic studies in this
area. In this case, spillover benefits are asserted to generate negative economic
impacts in the corridor by diverting business from traditional town centers and along
the existing highways in the corridor to the I‐73 corridor. This may occur to a
degree, and is consistent with some economic studies of highways, but would not
reflect the entire set of possible impacts. The assessment appears highly selective
on the negative side.
o The NESA study asserts substantial benefits from increased tourism in Myrtle
Beach and from service business formations around I‐73 interchanges. The
methodologies used by Chmura to make these planning estimates are interesting
and backed by some good information such as surveys of Myrtle Beach visitors.
However, while these impacts may occur over time, they would be subject to many
other factors not considered, and should be regarded as having a very wide margin
of error and be viewed as illustrative rather than definitive.
Neither study considers in the BCA or economic analysis the economic benefits of
providing an enhanced hurricane evacuation route. This should be assessed as part of a
refined BCA of the I‐73 project, and the benefits can be quantified and included in the BCA.
Estimates of construction employment from highway projects can vary depending on
assumptions about average construction wages and other variables. Given this, Parsons
Brinckerhoff finds that estimates by Schunk and Chmura) authors of the NESA study) for
the I‐73 Project in South Carolina are within a credible range.

By contrast, the estimates found in the CCL Economic Study for the SC 38/US 501
alternative appear misleading and inaccurate when stated as they are in comparison with
the I‐73 Project. Based on the CCL’s own estimated project cost of $147 million for the SC
38/US 501 project, full time person years of employment for the SC 38/US 501 project
would be only about 14 percent of the person years of employment for the I‐73 project,
or 76 percent lower. This is in sharp contrast with the CCL report which concludes that the
SC 38/US 501 project will generate only 30 percent less construction related employment
than the I‐73 project.
We note that while economic studies were also performed in the FEIS for the I‐73 project (but
not for an SC 38/US 50110 option) the FEIS economic analysis did not derive a BC ratio or any
other related BCA analysis metric – that is, no attempt is made to compare estimated economic
benefits with project costs. Other economic analyses included in the FEIS, including a “User
Benefits” analysis performed using the REMI model based on the impact of travel efficiencies,
and another “strategic” economic analysis, utilizing EDGE, a relatively unknown tool not well
recognized within the field of transportation economics. A strategic economic analysis is
understood or appears to be a competitiveness/economic impact analysis. The Parsons
Brinckerhoff scope of work does not include an assessment of the FEIS economic analyses.

IV. Detailed Findings
IV.1 Review of Cost Estimates
Parsons Brinckerhoff was not able to find the basis of the $3.5 million dollar per mile cost to
upgrade the SC 38/US 501 corridor as reported in the CCL Economic Study or the Smart Mobility
Report. The SC 38/US 501 corridor between I‐95 and SC 22 is approximately 42 miles long and
is four lanes along its entire length. The CCL implies the SC 38/US 501 route is essentially an
expressway. However, the SC 38/US 501 corridor does not meet AASHTO’s expressway
classification criteria. The report does recommend further study of the corridor to determine if
additional improvements would be appropriate, such as:
Construct modern superstreet arterial intersections where needed.
Conduct access management improvements in areas of frequent curb cuts.
Construct grade separated interchanges at high volume crossings if needed for traffic
capacity.
The South Carolina Department of Transportation Trans Carolina Corridor Study reports the corridor
between SC 576 and SC 22 currently operates at service Level F and needs major improvements to
accommodate existing uses and future users.
Parsons Brinckerhoff’s planning level cost per mile range for upgrading the existing arterial four lane
divided highway corridor to an expressway is between $4.5 million and $5.5 million per mile. The total
planning cost to upgrade the 42 miles of the corridor is between $190 million and $230 million, plus or
minus ten percent. These planning unit costs are based on:
applying the definition of an expressway to the corridor
conducting a table top review of the corridor
a review of recent regional construction costs.
The assumptions and associated costs are provided in the appendices. This upgrade would not bring the
corridor to interstate standards.
Upgrading the existing four lanes divided highway corridor to an expressway would require:
controlling access through right‐of‐way acquisition,
consolidating driveways,
consolidating at‐grade intersections,
constructing parallel service roads,
constructing grade‐separated interchanges at three intersections to,
constructing a bypass around Aynor,
replacing and widening bridges across the Great Pee River,
widening shoulders and providing additional paved shoulders, and
constructing an additional lane on the connecting ramp at SC 22 and US 501.

A planning level cost to upgrade the arterial four lane corridor to a six lane interstate corridor is
between $1.3 billion and $1.6 billion. Existing interchanges flyovers, overpasses and bridges would need
to be reconfigured along with the roadway for the additional lanes and shoulder widths. Access would
further be restricted only to grade separated interchanges. Therefore additional parallel service roads
and further consolidation of intersections would be needed. Utilities would also need to be relocated
outside the right‐of‐way.
The American Association of State Highway and Transportation Officials (AASHTO) defines an
expressway as a highly mobility low to moderate access facility with posted speed limit between 45 to
60 miles per hours. An expressway is further defined by the following criteria:
Access is limited or partially controlled.
Traffic signals are not allowed.
Driveways are not allowed in limited controlled access areas and one driveway connection per
parcel or a consolidated driveway between parcels are allowed in partial controlled access
areas.
Connection with major intersecting roadways are with grade separated interchanges and with
minor intersecting roadways are with at‐grade intersections without signals.
Acceleration and deceleration lanes are used with at‐grade intersections.
Median area widths are typically 48 feet with crossovers allowed.
Crossovers are placed no closer than 2,000 feet for speed limits greater than 45 miles per hour.
A minimum cross‐section of 4 lanes plus a median are typical.
Right of way widths vary depending on speed but are typically between 150 and 200 feet.
Fencing is provided along each side of the right of way where limit controlled access is provided.
A quick table top review of the SC 38/US 501 corridor identifies a number of curb cuts for
commercial/retail and residential access as well as a number of at grade intersecting private, county and
state roads. This is demonstrated by:
the more than 150 curb cuts along the approximate four mile section of SC 38 Corridor between
I‐95 and US 501, and
curb cuts along the 25.4 mile corridor from the intersection with US 501 and SC 576 southeast
of Marion to SC 22 east of Aynor, including the Town of Aynor.
The 12.8 mile corridor between US 501 interchange and SC 576 interchange southeast of Marion has
limited controlled access with only two identifiable curb cuts and approximately twenty median breaks
which half are associated with at‐grade intersecting roads.
There are several stop lights along the corridor, one near I‐95 on SC 38, another on US 501 at Marion
and one in Aynor. There are approximately sixteen state roads and thirty county roads which “T”
intersects the corridor at‐grade and twenty state roads and five county roads which cross the corridor at
grade. There are seven interchanges, US 301, US 501, US 501 Business, SC 41, US 76, SC 576, SC 41

south east of Marion and SC 22. There are two roadway overpasses along the corridor, County Road 41
near Marion and the new overpass near Aynor and a couple of bridges over railroads.
Parsons Brinckerhoff reviewed seven local and state highway construction project costs for the purpose
of verifying typical costs associated with roadway projects for the region. The North Carolina
Department of Transportation fiscal year 2009 per mile planning costs were also considered.
IV.2 Review of Economic Benefits
1. Benefit Cost Analysis (BCA)
A key economic indicator of a proposed project’s merit is the BC ratio. Only the CCL Economic Study
specifically reports results of a BCA of any kind; the NESA Economic Study does not explicitly indicate
that a formal BCA for the I‐73 project was conducted.
CCL Economic Study: The following observations are made with respect to the CCL Study’s BCA findings.
a. Two BC ratios are reported in the CCL Economic Study – one for the SC 38/US 501 upgrade and
another for the I‐73 project. The former is reported to have achieved a BC ratio of 1.4 while the
latter project is reported to have a BC ratio of 0.26. The CCL Economic Study indicates it utilized
the TREDIS model, an economic software program frequently used in transportation economic
studies, available on commercial terms from the Economic Development Research Group (EDRG)
located in Boston. TREDIS is a computational tool that conducts BCA using standard methods and is
one of many accepted tools within the industry for this purpose; the validity of TREDIS BCA results
are however dependent and contingent on the comprehensiveness and validity of the input data
supplied to the model, such as travel time and user cost savings on the benefits side, and project
capital cost estimates on the cost side.
b. Based on Parsons Brinckerhoff’s reading of the report, the BCA appears to reflect only estimated
travel time savings (“transportation efficiency savings” in the CCL Economic Study).
Methodologically, this represents a very conservative approach to BCA, as it does not include a
range of impacts normally included in transportation investment BCAs. However, it provides a
reasonable benchmark against which to compare other alternatives, assuming all alternatives
otherwise impact the environment, safety and other outcomes about equally.
c. The CCL Economic Study estimates that annual travel time savings (VHT savings) for the year 2030
will be 976,924. (Table 2, p. 12)
d. The travel time savings in the CCL Economic Study (see c above), which are the basis for user
benefits (transportation efficiency benefits), could not be verified by any known source of
information. PB reviewed the I‐73 FEIS analysis, and found no similar travel time savings estimates,
as the FEIS did not evaluate an alternative comparable to the SC 38/US 501 upgrade alternative.
The FEIS does estimate travel time savings for the I‐73 Preferred Alternative (Alternative 3); the FEIS
estimates annual travel time savings of between 241,000 and 314,000 VHT, depending on whether
an average AADT or a peak season AADT is used. FEIS estimated travel time savings should be

considered the best available source for travel time, as it is based on travel demand modeling and
detailed traffic engineering.
e. Based on the above, the travel time savings for the SC 38/US 501 alternative appear to be
significantly overstated, especially given PB’s assessment of the more limited operational
improvements to be derived from the SC 38/US 501 upgrade relative to I‐73.
f. The CCL Economic study fails to report significant information about assumptions made in the
derivation of their reported BC ratios. Essential information not reported are:
Discount rate
Analysis period for computing NPV of cost and benefits
Whether maintenance costs are included or excluded in the computations
What benefit categories beyond travel time savings are included, if any.
g. The cost estimates utilized in the BCA analysis reported in the CCL Study appear to underestimate
significantly the construction costs of the SC 38/US 501 upgrade (see previous section). Moreover,
the costs associated with the SC 38/US 501 upgrade are believed to deliver levels of service not
closely comparable to a fully controlled access highway such as I‐73. This in turn suggests that
estimates of travel time savings associated with SC 38/US 501 may be significantly overstated with
respect to the operational parameters of a highway.
Key Conclusion: The CCL Economic Study’s BCA and associated BCR for the SC 38/US 501 alternative
should be considered flawed. Costs are understated, benefits appear greatly overstated, and the
sources of information and methods poorly documented, unreliable, and unverifiable. The estimated
BCRs reported in the CCL Economic Study for both projects are judged to be neither credible nor
reliable. This finding is unrelated to the use of the TREDIS model, which is a standard and credible tool
within the industry.
NESA Economic Study: The following observations are made with respect to the NESA Study’s findings.
a. The NESA Study does not present results of any formal BCA.
b. The NESA Economic Study estimates a payback period for the I‐73 project. While payback period is
one of several possible metrics derived from a formal BCA, the benefits included in the payback
period as reported in the NESA study are not validly combined and should not be included as
additive within a formal BCA.
c. While the NESA Study does not include a formal BCA analysis comparable in any way to the BCA
results (i.e., the BCR) reported in the CCL Study, the NESA study estimates “Travel Efficiency and
Cost Savings” for the year 2030. As noted above, the CCL BC ratios are simplified and reflect a
simple comparison of the NPV of travel time savings vs. project costs.
d. The NESA study estimates the dollar equivalent value of “travel efficiency and cost saving” for 2030.
For the Southern segment (from I‐95 to SC 22) the study reports an annual benefit of $52.3 M. The
methodology utilized to derive this estimate is not based on an analysis of traffic or travel efficiency,
but on the basis of other studies of highway projects in Virginia and West Virginia that estimated
travel efficiency and cost savings as a percentage of regional economic output. This is an
inappropriate methodology for this purpose, since it bears no reasonable relationship to the actual

travel efficiencies in a given highway corridor, and appears unrelated to traffic conditions or
highway design or capacity.
e. While the methodology for estimating travel efficiencies in the NESA study is deemed invalid, the
estimate can be checked to determine if it may in this case be reasonable. It is possible to roughly
estimate the equivalent VHT (travel time) savings associated with the $52.3 M. Assuming that the
$52.3 M is in current dollars, and utilizing hourly value of travel time averages recommended by the
USDOT for TIGER grant application BCAs (approximately $20/hour per traveler), and assuming
further an average vehicle occupancy of 1.5, the equivalent VHT savings would equal approximately
1.74 million annual VHT saved. That is dramatically higher than the VHT savings reported for I‐73 in
the FEIS. Allowing for some additional transportation efficiency and cost savings from reduced
vehicle maintenance and operations (e.g., less motor fuel, reduced vehicle maintenance and
depreciation), the travel efficiency benefits estimated in the NESA study still appear substantially
overstated relative to the FEIS analysis.9
f. While the NESA study does not conduct a BCA, it concludes that the I‐73 project will have a
payback period of four years. This reflects an implicit BCA (as payback period computations
are derived from a BCA). A four year payback period, using best practices for BCA would be
improbable given project costs and annual estimated travel time savings from the FEIS. The
4 year estimate reflects a combining and inclusion of benefits that should not be included in
a formal BCA, such as multiplier impacts, expectations about increases in tourism spending,
and economic gains from estimated new service business formations around I‐73
Interchanges. While these are legitimate items to consider in economic impact analysis,
they would not necessarily qualify as benefits for a formal BCA.
Key Conclusion: While the NESA study does not attempt to derive a BC ratio for the I‐73 project, its
estimates of travel efficiency appear unrealistically overstated, and are derived from methodologies that
are inappropriate. This inaccuracy may be regarded as of relatively minor consequence, as the NESA
study does not focus on this aspect of economic benefit, but rather focuses on the impacts of I‐73 on
regional economic competitiveness and tourism, new business formations, and regional employment
and income.
2. Construction Related Employment
The following table summarizes what Parsons Brinckerhoff has determined with respect to estimates of
employment from construction. It is important to note that construction employment (including
multiplier impacts) is always reported in terms of “person years” of work, rather than as “jobs”, since
projects can have different construction phasing and duration, and also because construction jobs are
time limited by the period of construction – i.e., they are not permanent jobs in the sense that they do
not continue indefinitely.
9 By further comparison, the CCL Study estimate of VHT savings for I‐73 relative to a no‐build for 2030 is 1.3 million VHT

In the table, a fourth column to the right is given as a benchmark, reflecting industry rules of thumb for
construction related employment recommended in various sources, including the FHWA. The FHWA
estimates about 27,000 jobs per dollar of federal highway spending10; given a federal matching rate of
80%, that figure translates to about 35,000 jobs per total dollar of highway spending. For this, we utilize
an average of about 30,000 jobs per billion dollars of construction spending, including direct and
multiplier impacts.
Table 2. Summary of construction related employment impacts
Conclusion:
1. Estimates of construction employment from highway projects can vary depending on assumptions
about average construction wages and other variables. Given this, Parsons Brinckerhoff finds that
estimates by Schunk and Chmura (authors of the NESA study) for the I‐73 Project in South Carolina
are within a credible range.
2. By contrast, the estimates found in the CCL Economic Study for the SC 38/US 501 alternative appear
misleading and inaccurate when stated as they are in comparison with the I‐73 Project. Based on
the CCL’s own estimated project cost of $147 million for the SC 38/US 501 project, full time person
10 http://www.fhwa.dot.gov/policy/otps/pubs/impacts/index.htm
NESA (Chmura) CCL Schunk Industry
average
I‐73 I‐73 SC 38/US 501 I‐73 I‐73
Person years
per billion
dollars of
construction
spending
17,190 12,153 14,571 29,692 30,000
Average annual
person years
4,469 3,160 2,142
(assuming one
year for
construction)
7,720 7,800
Total person
years over the
construction
period
22,347 15,800 2,142 38,600 39,000

years of employment should be in the range of 2,000 to 2,500. The CCL estimate of 2,142 jobs
“over the life of the project” (p. 15) is reasonable when understood as person years of employment.
However, in the CCL study, that figure is compared to the I‐73 estimate of 3,160 jobs per year
reported in that study. That latter figure, however, should be multiplied by 5 in order to arrive at
total person years of employment over the five year construction duration as indicated. Thus, total
jobs (i.e., total person years of employment) for the I‐73 project would be in the range of 15,800
using the annual figure (3,160) cited in the CCL report (and considerably higher using industry
benchmarks). Therefore, the statement made in the CCL study, that for the SC 38/US 501 “total
employment over the life of the projected is 30 percent lower” than the I‐73 project is inaccurate
and misleading. In fact, total person years of employment for the SC 38/US 501 project would be
only about 14 percent of the person years of employment for the I‐73 project, or 76 percent lower.
3. Economic Impacts: Tourism, Interchange and Corridor Development Impacts
Both the CCL study and the NESA study present arguments for and against economic
development benefits. Both should be regarded as partial and non‐rigorous, although the
NESA analysis is data based. Specifically:
The CCL study refers to “spillover” benefits citing a few academic studies in this area. In this
case, spillover benefits are asserted to generate negative economic impacts in the corridor
by diverting business from traditional town centers and along the existing highways in the
corridor to the I‐73 corridor. This may occur to a degree, and is consistent with some
economic studies of highways, but would not reflect the entire set of possible impacts. The
assessment appears highly selective on the negative side.
The NESA study asserts substantial benefits from increased tourism in Myrtle Beach and
from service business formations around I‐73 interchanges. The methodologies used by
Chmura to make these planning estimates are interesting and backed by some good
information such as surveys of Myrtle Beach visitors. However, while these impacts may
occur over time, they would be subject to many other factors not considered, and should be
regarded as having a very wide margin of error and be viewed as illustrative rather than
definitive.
4. Other Economic Impacts
Neither study considers in the BCA or economic analysis the economic benefits of providing an
enhanced hurricane evacuation route. This should be assessed as part of a refined BCA of the I‐
73 project, and the benefits can be quantified and included in the BCA.
Dfdfd
APPENDIX
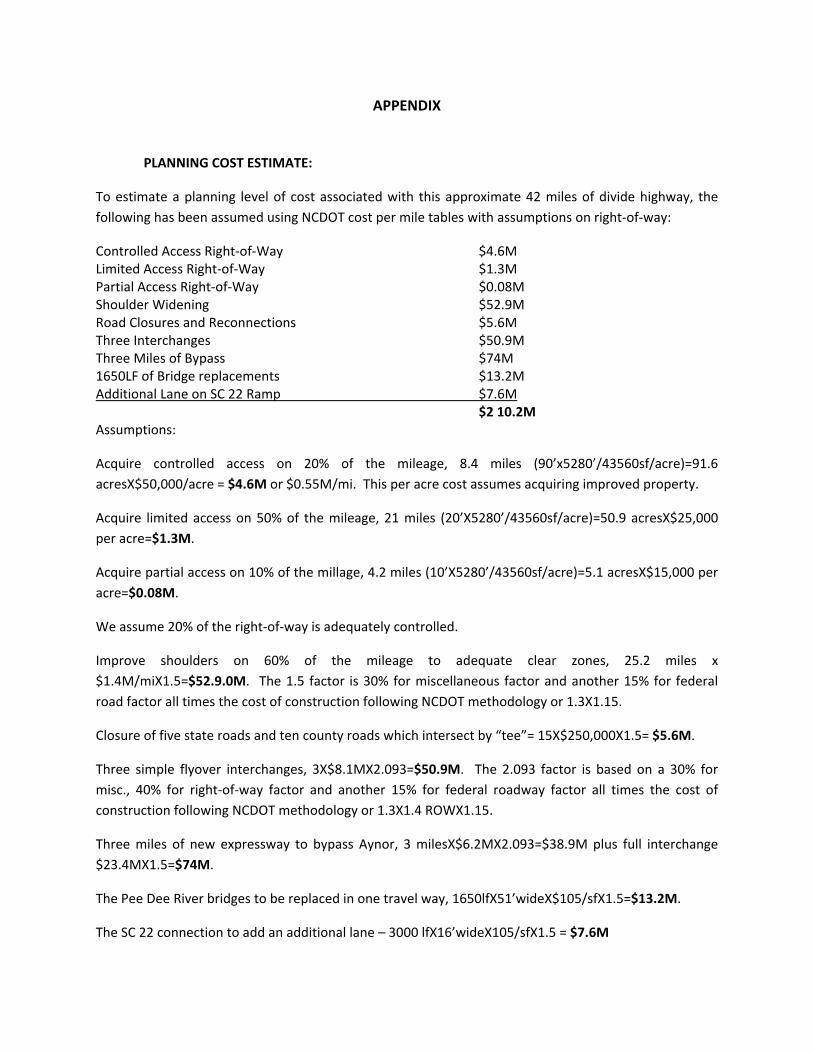
PLANNING COST ESTIMATE:
To estimate a planning level of cost associated with this approximate 42 miles of divide highway, the
following has been assumed using NCDOT cost per mile tables with assumptions on right‐of‐way:
Controlled Access Right‐of‐Way $4.6M Limited Access Right‐of‐Way $1.3M Partial Access Right‐of‐Way $0.08M Shoulder Widening $52.9M Road Closures and Reconnections $5.6M Three Interchanges $50.9M Three Miles of Bypass $74M 1650LF of Bridge replacements $13.2M Additional Lane on SC 22 Ramp $7.6M $2 10.2M Assumptions:
Acquire controlled access on 20% of the mileage, 8.4 miles (90’x5280’/43560sf/acre)=91.6
acresX$50,000/acre = $4.6M or $0.55M/mi. This per acre cost assumes acquiring improved property.
Acquire limited access on 50% of the mileage, 21 miles (20’X5280’/43560sf/acre)=50.9 acresX$25,000
per acre=$1.3M.
Acquire partial access on 10% of the millage, 4.2 miles (10’X5280’/43560sf/acre)=5.1 acresX$15,000 per
acre=$0.08M.
We assume 20% of the right‐of‐way is adequately controlled.
Improve shoulders on 60% of the mileage to adequate clear zones, 25.2 miles x
$1.4M/miX1.5=$52.9.0M. The 1.5 factor is 30% for miscellaneous factor and another 15% for federal
road factor all times the cost of construction following NCDOT methodology or 1.3X1.15.
Closure of five state roads and ten county roads which intersect by “tee”= 15X$250,000X1.5= $5.6M.
Three simple flyover interchanges, 3X$8.1MX2.093=$50.9M. The 2.093 factor is based on a 30% for
misc., 40% for right‐of‐way factor and another 15% for federal roadway factor all times the cost of
construction following NCDOT methodology or 1.3X1.4 ROWX1.15.
Three miles of new expressway to bypass Aynor, 3 milesX$6.2MX2.093=$38.9M plus full interchange
$23.4MX1.5=$74M.
The Pee Dee River bridges to be replaced in one travel way, 1650lfX51’wideX$105/sfX1.5=$13.2M.
The SC 22 connection to add an additional lane – 3000 lfX16’wideX105/sfX1.5 = $7.6M

The sum of the above planning level cost is approximately $210.2M to bring the existing facilities to
expressway/freeway standards.
Interstate is defined a network of freeways which connect states and is part of the national highway
system. A freeway is defined as a highly mobility low access facility with posted speed limit 55 miles per
hour or greater. The facility has full control access which no traffic signals or driveways are allowed.
Connecting roadways are connected with grade‐separated interchanges or crossovers. Median area
widths range between 48 to 80 feet and u‐turns in the median for use by authorized vehicles only when
justified. The minimum cross‐section will be 4 lanes and a median. Right of way widths will vary on
speed but typically between 150 and 300 feet. Fencing is provided along each side of the right of way to
deter animal and pedestrian access and crossing.
Finally to compare Interstate to Interstate, widen from 4 lanes to 6 lanes for interstate level, plus
replacing the other travel way bridges within the Pee Dee River, plus replace three over passes, plus the
above improvements we obtain as cost of approximately $1,429M, ((42 milesX$13.7X2.093 [widen from
4 to 6 lanes]) +$13.2M (the other Great Pee Dee bridge replacements) + (3X$2.1X1.5 [3 additional
interchanges]) + $202.6M [expressway improvements]).

REVIEWED REGIONAL COSTS:
Parsons Brinckerhoff reviewed planning and engineering, right of way, utility and construction costs
provided by South Carolina Department of Transportation for four Horry County Sales Tax
Transportation program. The four projects included the widening of SC 544 from a two lane to a five
lane arterial, new four lane divided parkway, minor road over US 501 at Aynor, and a major grade‐
separated interchange project at US 17 and SC 707. These costs are presented below in Tables 1.
TABLE 1 ‐ HORRY COUNTY RIDE PROGRAM INDIVIDUAL PROJECT COSTS (Millions)
Project Miles PE Cost
ROW Cost Utility Cost Construction Cost
Total Cost Cost per Mile
SC 544‐ US 501 to Socastee Bridge Widening (2 lane to 5 lane)
9.6mi 1.5M $8.4M $0.875M/mi
$2M $0.2M/mi
$31.1M $3.24M/mi
$43.0M $4.5M/mi
Carolina Bays Parkway 501/544 New 4‐land divided Arterial
5.1mi 2.1M $37M $7.26M/ mi
$2.6M $0.51M/mi
$71.6M $14.04M/mi
$113.3M $22.2M/mi
Aynor Overpass US 501 (2 lane) (2011)
2.0mi (mainline)
2.9M $1.1M $0.55M/mi
$200K $0.1M/mi
$12M $6.0M/mi
$16.2M $8.1M/mi
Back Gate US 17 & SC 707 Interchange (4 lane) (2012)
1.466mi (mainline)
4.7M $17.8M $12.14M/mi
$4.8M $3.27M/mi
$92.3M $62.96M/mi
$119.6M $81.6M/mi
M = million dollars, Mi = mile Source: SCDOT RPG
Additionally, three other South Carolina Department of Highways construction projects in the Dillon and
Marion county areas. These are the US 501 flyover SC 38, The overpass over US 76 and twin bridges
over the Great Pee Dee River, and the recent two lane reconstruction of US 378. These costs are
presented below in Table 2.
TABLE 2 SOUTH CAROLINA DEPARTMENT OF TRANSPORTATION INDIVIDUAL CONSTRUCTION PROJECT COSTS
Project Miles Construction Cost Cost per Mile
SC 38/US 501 (2004) 12.885 miles of roadwork two lane to four land roadway
$22.0M $1.7M/mi
US 301/US 76 Bridge Replacement (2004)
150’ over pass and twin 180 foot flat slab bridges over the Great PEE DEE with 1.065 miles of
roadway
$6.05M $5.7M/mi

TABLE 2 SOUTH CAROLINA DEPARTMENT OF TRANSPORTATION INDIVIDUAL CONSTRUCTION PROJECT COSTS
Project Miles Construction Cost Cost per Mile
US 378 Bridge and Roadway (2009)
Reconstruction 6.396 miles of 2 lane facility with bridges
$26.5M $4.1M/mi
M = million dollars, Mi = mile Source: SCDOT Bid Tab
The State of North Carolina 2009 spread sheet, www.ncdot.gov/download/performance/
CostEstimateGuide.xls, for preparing construction cost estimates using cost per mile table includes
the following, which represents 2008 costs:
New Location 4‐Lane Shoulder Section W/Median Freeway $6.20M per mile
Widen Existing 2‐Lane Shoulder Section to:
4‐Lane Shoulder Section W/Median (Freeway) $5.00M per mile
Widen Existing 4 Lane w/median to 6 Lane Interstate Section $13.70M per mile
Widen Existing 18’ to 24’ Shoulder Section $1.40M per mile
Grade Separations $2.10M each
Simple Diamond Interchange $10.95M each
Full Clover Interchange W/1 Collector‐Distributor $23.40M each
Simple Flyover Interchange $8.15M each
Right‐of‐Way in Rural 20‐25% of TOTAL project cost
Right‐of‐Way in Urban 40‐45% of TOTAL project cost

TRAFFIC DATA:
The 2011 average annual daily traffic (AADT) count for the segment between I‐95 and US 301 is 7,200.
The segment between US 301 and US 501 is 9,000 AADT. The 2011 ADDT at the junction of US 76 and
US 501 is 17,100, which is down from 2007’s AADT of 19,000. The 2011 average annual daily traffic
count between the Town of Aynor and SC 22 is 23,500, which is down from 2007’s AADT of 25,400.