Review of groundwater models and modelling … a better understanding of how the whole groundwater...
60
L 14 September 2011 Review of groundwater models and modelling methodologies for the Great Artesian Basin A technical report to the Australian Government from the CSIRO Great Artesian Basin Water Resource Assessment Smith AJ and Welsh WD
Transcript of Review of groundwater models and modelling … a better understanding of how the whole groundwater...

L
14 September 2011
Review of groundwater models and modelling
methodologies for the Great Artesian Basin A technical report to the Australian Government from the
CSIRO Great Artesian Basin Water Resource Assessment
Smith AJ and Welsh WD

Great Artesian Basin Water Resource Assessment acknowledgments
The Assessment was prepared by CSIRO for the Australian Government under the Water for the Future initiative and the
National Water Commission (NWC) Raising National Water Standards Program. Geoscience Australia was a significant
contributor to the Assessment. Important aspects of the work were undertaken by Sinclair Knight Merz, Flinders
University, South Australian Department for Water, and MA Habermehl Pty Ltd.
The Assessment was guided and reviewed by a Steering Committee, which had representatives from the following
organisations: Australian Government Department of Sustainability, Environment, Water, Population and Communities;
National Water Commission; Australian Bureau of Agricultural and Resource Economics and Sciences; New South
Wales Office of Water; Queensland Department of Environment and Resource Management; Queensland Water
Commission; South Australia Department for Water; and Northern Territory Department of Natural Resources,
Environment, The Arts and Sport.
This report benefited from reviews by Mat Gilfedder and External Reviewer Noel Merrick.
We acknowledge input from the following individuals for this report: Peter Baker, Ian Callow, Jane Coram, Randall Cox,
Tanja Cvijanovic, Peter Gooday, Nathan Goodwin, James Hill, Matt Kendall, Ian Lancaster, Lisa Mensforth, Sanjeev
Pandey, Dirk Platzen, Bernie Prendergast, Ian Prosser, Derek White, Michael Williams and Des YinFoo.
Great Artesian Basin Water Resource Assessment disclaimers
Derived from or contains data and/or software provided by the Organisations. The Organisations give no warranty in
relation to the data and/or software they provided (including accuracy, reliability, completeness, currency or suitability)
and accept no liability (including without limitation, liability in negligence) for any loss, damage or costs (including
consequential damage) relating to any use or reliance on the data or software including any material derived from that
data or software. Data must not be used for direct marketing or be used in breach of the privacy laws. Organisations
include: the Northern Territory Department of Natural Resources, Environment, The Arts and Sport; the Queensland
Department of Environment and Resource Management; Queensland Geological Survey; South Australian Department
for Water; Primary Industries and Resources South Australia; New South Wales Department of Primary Industries and
the New South Wales Office of Water.
CSIRO advises that the information contained in this publication comprises general statements based on scientific
research. The reader is advised and needs to be aware that such information may be incomplete or unable to be used in
any specific situation. No reliance or actions must therefore be made on that information without seeking prior expert
professional, scientific and technical advice. To the extent permitted by law, CSIRO (including its employees and
consultants) excludes all liability to any person for any consequences, including but not limited to all losses, damages,
costs, expenses and any other compensation, arising directly or indirectly from using this publication (in part or in whole)
and any information or material contained in it. Data are assumed to be correct as received from the organisations.
Citation
Smith AJ and Welsh WD (2011) Review of groundwater models and modelling methodologies for the Great Artesian
Basin. A technical report to the Australian Government from the CSIRO Great Artesian Basin Water Resource
Assessment. CSIRO Water for a Healthy Country Flagship, Australia.
Publication details
Published by CSIRO © 2011 all rights reserved. This work is copyright. Apart from any use as permitted under the
Copyright Act 1968, no part may be reproduced by any process without prior written permission from CSIRO.
ISSN 1835-095X
Cover photograph: Pore pressure monitoring of Great Artesian Basin aquitard, Anna Creek Station, SA, 2011.
Photo: BD Smerdon, CSIRO.
Director’s foreword
Following the November 2006 Summit on the southern Murray-Darling Basin (MDB), the then Prime Minister and MDB
State Premiers commissioned CSIRO to undertake an assessment of sustainable yields of surface water and
groundwater systems within the MDB. The project (completed in 2008) was a world first for rigorous and detailed basin-
scale assessment of the anticipated impacts of climate change, catchment development and increasing groundwater
extraction on the availability and use of water resources.
Following the success of the MDB project, the Council of Australian Governments (COAG) agreed to expand the CSIRO
assessments of water yield so that, for the first time, Australia would have a comprehensive scientific assessment of
water yield in all major water systems across the country. This would allow a consistent analytical framework for water
policy decisions across the nation. Thus in March 2008 COAG commissioned three further Sustainable Yields projects
(for northern Australia, south-west Western Australia and Tasmania), providing a nation-wide expansion of the
assessments. These were completed in September 2009, December 2009 and February 2010, respectively.
Determinations of sustainable yield and/or over-allocation require choices by communities and governments about the
balances of outcomes (environmental, economic and social) sought from water resource management and use. These
choices are best made on the basis of sound technical information, with the fundamental underpinning information being
a robust description of the extent and nature of the water resource.
The Great Artesian Basin Water Resource Assessment (the Assessment), undertaken by CSIRO and partners together
with other consultants, provides this fundamental underpinning information for the Great Artesian Basin (GAB).
Consistent with the previous Sustainable Yields projects, this assessment provides an analytical framework to assist
water managers in the GAB to meet National Water Initiative (NWI) commitments. A key outcome of the Assessment is
to communicate the best available science to the Australian Government in order to advance basin groundwater
management under the NWI water reform agenda. It provides an information base that supports both investment and the
environment, and that underpins the capacity of Australia’s water management regimes to deal with change both
responsibly and fairly (NWI Clause 5). In accordance with NWI Clause 40, the Assessment will inform the implementation
of existing water plans through providing information about the status of GAB aquifer systems, data from which could be
used to better monitor the performance of water plan objectives, outcomes and water management arrangements. The
Assessment will also assist in achieving Action 79 under the NWI in relation to better recognising the different types of
surface water – groundwater interactions.
Dr Bill Young
Director, Water for a Healthy Country Flagship
CSIRO

Contributors* to the Great Artesian Basin Water
Resource Assessment
Project Director Bill Young
Project Leader Brian Smerdon
Project Management Scott Keyworth, Ian Prosser, Becky Schmidt
Geoscience Australia: Ross Brodie, Project Coordinator (TBA), Project
Manager (TBA)
Data Management Team Mick Hartcher, Phil Davies
Geoscience Australia: Gail Ransom
Environment Team South Australian Department for Water: Michelle Bald, Glen Scholz,
Melissa White
Hydrodynamics Team Sinclair Knight Merz: Richard Cresswell
Flinders University: Andrew Love, Pauline Rousseau-Gueutin
MA Habermehl Pty Ltd: Rien Habermehl
Andrew Taylor
Hydrogeology Team Geoscience Australia: Tim Ransley, Jim Kellett, Chris Lawson, Gabriel
Nelson, Bruce Radke, Gerard Stewart
Numerical Modelling Team Wendy Welsh, Tony Barr, Catherine Moore, Tony Smith
Reporting Team Jan Mahoney, Maryam Ahmad, Heinz Buettikofer, Simon Gallant,
Frances Marston, Ben Wurcker
Communications Mary Mulcahy, Rebecca Jennings
Project Support Ken Currie, Nicole Smith, Amanda Sutton, Project Officer (TBA)
* CSIRO unless otherwise indicated; Team Leaders underlined

Executive summary
About the project
The Great Artesian Basin (GAB) is Australia’s largest groundwater basin. It underlies arid and semi-arid regions and
extends across one-fifth of Australia. The GAB stretches across Queensland, New South Wales, South Australia and the
Northern Territory.
Groundwater resources in the GAB support an extensive pastoral industry, inland population centres, mining activities,
and other extractive industries – and demand for these resources is increasing. The consequent management issues
require a better understanding of how the whole groundwater system operates. Thus an integrated reappraisal of the
latest hydrogeology, hydrochemistry and groundwater modelling is timely.
Such a reappraisal was the aim of the Great Artesian Basin Water Resource Assessment (the Assessment). The
Assessment built upon on the approach taken by CSIRO and partners in the Murray-Darling Basin, South-West Western
Australia, Northern Australia, and Tasmania Sustainable Yields projects. Consistent with these other projects, the
Assessment provides an analytical framework to assist water managers in the GAB to meet National Water Initiative
(NWI) commitments.
Funded by the Australian Government Department of Sustainability, Environment, Water, Populations and Communities
and the National Water Commission, the Assessment outlines the current status of water resources in the GAB and the
potential impacts of climate change and resource development on those water resources. It was a desktop study. No
new data were collected. Rather, groundwater modelling using existing data as a base and new interpretations of
existing data were undertaken. The Assessment highlights areas that require further investigation, and includes a gap
analysis.
Summary and conclusions
This report reviews contemporary groundwater models within the area being considered in the Assessment. The review
provides a list of groundwater models that simulate flow in aquifers of the Jurassic and Cretaceous periods, and identifies
those models that are potentially suitable for the purposes of the Assessment. For the purposes of the Assessment, a
groundwater model must be capable of simulating impacts of future climate, represented as future groundwater recharge,
and groundwater development, represented as future groundwater extraction.
Modelling of groundwater flow in GAB aquifers began in the 1970s for the purposes of assessing water resources and
predicting environmental impacts of development. A total of 4 whole-of-GAB models and 18 notable part-GAB models
have been developed since the 1970s, with more than half developed since 2006.
The review finds that the GABtran model is the most suitable existing groundwater model for achieving the purposes of
the Assessment across the reporting regions. For parts of the GAB not covered by the GABtran model, and in areas
where the model cannot simulate groundwater development in the Jurassic and deeper aquifers, an approach must be
identified for additional development of the GABtran model or alternative modelling should be proposed to meet the
purposes of the Assessment. The findings for each reporting region are summarised below.
Surat region
• GABtran is capable of simulating the effects of future climate.
• GABtran is not capable of simulating the effects of groundwater development because extraction for coal
seam gas (CSG) production will originate from formations underlying the aquifers represented in GABtran.
• A collaboration has been established between CSIRO and the Queensland Water Commission (QWC) to
develop consistency between the QWC groundwater model and GABtran, considering that the models have
different purposes.
Central Eromanga region
• GABtran is capable of simulating the effects of future climate.
• GABtran is capable of simulating the effects of groundwater development from the Cannington-Osborne and
Olympic Dam borefields.
Western Eromanga region
• GABtran is capable of simulating the effects of future climate.
• GABtran is capable of simulating the effects of groundwater development from the Olympic Dam borefield.
• GABtran is not capable of simulating the effects of groundwater development at the Prominent Hill mine
because extraction will originate from formations underlying the aquifers represented in GABtran.
• Simulated groundwater conditions at the Prominent Hill mine suggest interaction with GAB aquifers; however,
replicating this interaction in GABtran would require synchronised adjustment and recalibration of the
Prominent Hill groundwater model and GABtran, which will be impractical within the Assessment.
Carpentaria region
• GABtran is capable of simulating the effects of future climate.
• GABtran is capable of simulating the effects of groundwater development at the Ernest Henry and Mount
Margaret mines, following a comparison of parameterisation used in the fine-scale mine models and larger-
scale GABtran model.
Recommendations
The following recommendations are based on the information and conclusions presented in this review.
• The GABtran model should be adopted as the most suitable existing groundwater model for the purposes of
the Assessment, provided that appropriate methods for addressing key deficiencies with respect to the
Assessment can be developed.
• The Assessment has insufficient time and resources to extend the single-layer GABtran model to a multi-
layered groundwater flow model. The need, purpose and appropriate design of a new whole-of-GAB model
have not been established. Thus, the inherent deficiencies of modelling the GAB using a single model layer
should be accepted by the Assessment.
• In the Surat region, the GABtran model results should be coupled with the QWC’s Surat Cumulative
Management Area groundwater model results to enable simulation of development impacts due to
groundwater extraction in GAB aquifers below the base of the GABtran model, and specifically those aquifers
that are or will be impacted by CSG development.
• In the Carpentaria region, the spatial coverage of the GABtran model should be extended into Cape York such
that the extended GABtran model covers as much of the reporting region as is practical, excluding the Laura
Basin.
• With respect to the ability of the GABtran model to simulate the proposed future climate scenarios, the
significance of not including the recharge areas of the deepest artesian aquifers, the Adori and Hutton
Sandstones and their correlatives, should be identified, including a method for simulating future groundwater
recharge from these areas if it is determined to be significant for the purposes of the Assessment.

Units of measurement
Measurement unit Description
ML Megalitres, 1,000,000 litres
GL Gigalitres, 1,000,000,000 litres
TL Teralitres, 1,000,000,000,000 litres
cumecs Cubic metres per second; m3/sec; equivalent to 1,000 litres per second
Acronyms and initialisms
AARC AustralAsian Resource Consultants
ABARES Australian Bureau of Agricultural and Resource Economics and Sciences (previously known as
ABARE–BRS)
AGC Australian Groundwater Consultants
AGE Australasian Groundwater and Environmental Consultants
APLNG Australia Pacific Liquified Natural Gas
AQUIFEM-N multi-layered finite element aquifer flow model
BHPB BHP Billiton
CDA central development area
CSG coal seam gas
CSIRO Commonwealth Scientific and Industrial Research Organisation
DECCW The NSW Department of Environment, Climate Change and Water
DERM The QLD Department of Environment and Resource Management
EHM Ernest Henry Mine
EIS environmental impact studies
FEFLOW finite element subsurface flow system
GAB Great Artesian Basin
GAB95 Olympic Dam groundwater flow model
GABFLOW steady-state groundwater flow model of the Great Artesian Basin
GABHYD Great Artesian Basin hydraulic model
GABROX Olympic Dam groundwater flow model
GABSIM Great Artesian Basin simulation model
GABtran Great Artesian Basin transient groundwater flow model
GIS geographic information system
GLNG Gladstone Liquified Natural Gas
LNG liquified natural gas
MINEDW three-dimensional finite-element code

MODFLOW modular three-dimensional finite-difference groundwater flow model
MSR mean sum of residuals
MSSQ mean sum of squares
NSW New South Wales
NT Northern Territory
NTS University of Technology, Sydney
NWDA north west development area
ODEX Olympic Dam expansion
PMWIN Processing Modflow for Windows
QCLNG Queensland Curtis Liquified Natural Gas
QLD Queensland
QWC Queensland Water Commission
R correlation coefficient
R2 coefficient of determination
RMFS root mean fraction square
RMS root mean square
SA South Australia
SEDA South East Development Area
SEWPaC Department of Sustainability, Environment, Water, Population and Communities
SKM Sinclair Knight Merz
SMSR scaled mean sum of residuals
SR sum of residuals
SRMFS scaled RMFS
SRMS scaled RMS
SRMS scaled root mean square
SSQ sum of squares
SURFACT saturated and unsaturated flow, recharge, fracture flow, and analysis of contaminant transport
SWS Schlumberger Water Services
WMC Water Management Consultants
Contents
1 Introduction ................................................................................................................................. 1
1.1 The Great Artesian Basin Water Resource Assessment ................................................................... 1
1.2 The Assessment area........................................................................................................................ 1
1.3 The Assessment regions ................................................................................................................... 1
1.4 Purpose of the model review ............................................................................................................. 2
2 Methods ........................................................................................................................................ 7
2.1 Information sources ........................................................................................................................... 7
2.2 Review procedure ............................................................................................................................. 7
2.3 Estimation of model coverage ........................................................................................................... 7
3 Results ......................................................................................................................................... 9
3.1 Historical overview............................................................................................................................. 9
3.2 The GABtran model ......................................................................................................................... 13
3.3 Surat region ..................................................................................................................................... 15
3.4 Central Eromanga region ................................................................................................................ 24
3.5 Western Eromanga region ............................................................................................................... 29
3.6 Carpentaria region ........................................................................................................................... 33
4 Summary, conclusions and recommendations ..................................................................... 39
4.1 Surat region ..................................................................................................................................... 40
4.2 Central Eromanga region ................................................................................................................ 40
4.3 Western Eromanga region ............................................................................................................... 41
4.4 Carpentaria region ........................................................................................................................... 41
4.5 Conclusions ..................................................................................................................................... 41
4.6 Recommendations........................................................................................................................... 42
References ........................................................................................................................................... 44
Appendix A Selected summary of groundwater models for the Great Artesian Basin ...... 47
Tables
Table 3.1 Contemporary groundwater models within the Assessment area.................................................................................... 11
Table 3.2 Statistical performance measures for the GABtran model .............................................................................................. 15
Table 3.3 Contemporary groundwater models within the Surat region............................................................................................ 15
Table 3.4 Contemporary groundwater models within the Central Eromanga region ....................................................................... 25
Table 3.5 Contemporary groundwater models within the Western Eromanga region ...................................................................... 29
Table 3.6 Contemporary groundwater models within the Carpentaria region .................................................................................. 34

Figures
Figure 1.1 Geographic extent of the Great Artesian Basin and selected overlying surface water drainage divisions ........................ 3
Figure 1.2 Stratigraphic sequences across the basins of the Great Artesian Basin (a): the Eromanga and Carpentaria basins
(adapted from Habermehl and Lau, 1997) ....................................................................................................................................... 4
Figure 1.3 The regions of the Great Artesian Basin Water Resource Assessment ........................................................................... 6
Figure 3.1 Timeline of groundwater modelling of the Great Artesian Basin .................................................................................... 12
Figure 3.2 Boundary geometries of groundwater models within the Assessment area ................................................................... 13
Figure 3.3 Cross-section through the Great Artesian Basin (after Radke et al., 2000). The GABtran modelled aquifer is shaded
blue and other aquifers are shaded orange .................................................................................................................................... 14
Figure 3.4 Boundary geometries of groundwater models within the Surat region ........................................................................... 17
Figure 3.5 Vertical extent and layering of groundwater models within the Surat region (note: row shading corresponds to Figure
1.2) ................................................................................................................................................................................................ 18
Figure 3.6 Boundary geometries of groundwater models within the Central Eromanga region ....................................................... 26
Figure 3.7 Vertical extent and layering of groundwater models within the Central Eromanga region (note: row shading
corresponds to Figure 1.2) ............................................................................................................................................................. 27
Figure 3.8 Boundary geometries of groundwater models within the Western Eromanga region ..................................................... 30
Figure 3.9 Vertical extent and layering of groundwater models within the Western Eromanga region (note: row shading
corresponds to Figure 1.2) ............................................................................................................................................................. 31
Figure 3.10 Boundary geometries of groundwater models within the Carpentaria region ............................................................... 35
Figure 3.11 Vertical extent and layering of groundwater models within the Carpentaria region (note: row shading corresponds to
Figure 1.2) ..................................................................................................................................................................................... 36

© CSIRO 2011 Review of groundwater models and modelling methodologies for the Great Artesian Basin ▪ 1
1 Introduction
1.1 The Great Artesian Basin Water Resource Assessment
The Great Artesian Basin (GAB) is Australia’s largest groundwater basin. It underlies arid and semi-arid regions and
extends across one-fifth of Australia, including extensive areas of Queensland, South Australia, New South Wales and
the Northern Territory. CSIRO and partners have been commissioned to conduct the Great Artesian Basin Water
Resource Assessment (the Assessment) by building on the approach taken by CSIRO and partners in the
Murray-Darling Basin, South-West Western Australia, Northern Australia, and Tasmania Sustainable Yields projects.
Detailed information about the terms of reference, deliverables and reporting schedule of the Assessment is contained in
the proposed project methodology report (CSIRO/GA, 2011).
1.2 The Assessment area
For the purposes of the Assessment, the GAB (Figure 1.1) is defined as:
1. aquifers of the Jurassic and Cretaceous periods within the geographic extent of the GAB, including parts of
those aquifers that are in a sub-artesian condition
2. relevant shallow, overlying aquifers and surface water, to the extent of their connection with the aquifers
referred to in 1 above.
The geographic extent of the GAB is considered to mark the contiguous extent of the unconformity beneath the base unit
of the Jurassic geological sequence, or, where absent, that unit most immediately above it. See Figure 1.2 for
stratigraphic sequences across the basins within the GAB. Consideration is given to underlying sequences where these
are considered to be in hydraulic contact with the Jurassic (or Cretaceous) aquifers. The underlying Triassic beds are not
considered, except where they impact on the waters within the Jurassic and Cretaceous beds.
1.3 The Assessment regions
The GAB consists of a number of depositional basins that are variously separated by, but (at least in part) hydraulically
connected across, intracratonic highs and zones of divergent groundwater flow. Each depositional basin has been the
focus of exploration efforts and can be used to define discrete regions that may be described individually. The regions for
which the Assessment is being undertaken and reported on do not strictly adhere to the boundaries of these depositional
basins. These region boundaries have been selected so they will not intersect areas of interest that will have focused
investigation. Four regions, each containing one of the major basins of the GAB, have been defined (see Figure 1.3):
• Surat
• Central Eromanga
• Western Eromanga
• Carpentaria.
Each region will be the focus of an individual region report and, in addition, a whole-of-GAB report will be compiled.
In this report the GAB boundaries correspond to those in the proposed project methodology report (CSIRO/GA, 2011);
however, as part of the Assessment those boundaries are expected to be modified slightly because of re-interpretation of
hydrogeology and system conceptualisation.

2 ▪ Review of groundwater models and modelling methodologies for the Great Artesian Basin © CSIRO 2011
1.4 Purpose of the model review
This document is the first of four technical reports that contain supporting information and analysis for the Assessment.
The report topics include: (1) review of groundwater models and modelling methodologies, (2) hydrostratigraphy,
hydrogeology and system conceptualisation, (3) modelling of climate and development, and (4) environment.
The purpose of this review of groundwater models and modelling methodologies report is to compile a current list of
contemporary groundwater models within the Assessment area, and identify those models that are potentially suitable for
the purpose of the Assessment. Ideally, a potentially useful model is one that is capable of simulating the impacts of
future climate and groundwater development. The Assessment will consider three scenarios for the period 2010 to 2070:
• Scenario A – historical climate and current development
• Scenario C – future climate and current development
• Scenario D – future climate and future development.
Unlike previous Sustainable Yields projects, this Assessment does not consider the consequences to surface water
supplies or of a short (10- or 11-year) recent past scenario as this is insufficient time to exhibit any difference (within
statistical uncertainty) to the longer-term (100-year plus) record for groundwater pressure or for watertable surfaces. This
reflects the longer time frames for adjustment of groundwater systems relative to surface water systems. Thus this
Assessment will not be modelling or reporting a Scenario B. Scenario B was previously defined as relating to the recent
climate (last 10 or 11 years), reflecting the intent in the original Murray-Darling Basin Sustainable Yields Project (CSIRO,
2008) to evaluate the consequences of the recent drought conditions on Murray-Darling Basin water resources.
Climate sequences will be based on temporal projections of rainfall, temperature and areal potential evapotranspiration,
which will be represented as future time series of groundwater recharge. To be capable of representing these scenarios,
a groundwater model must contain a recharge area. Groundwater development will be represented as future extractions
from GAB aquifers. Thus, a model that is suitable for the purpose of the Assessment must also be capable of simulating
the impacts of cumulative groundwater extraction from inside and outside of the modelled area.
The findings of this review will determine which models will be used for the Assessment.

© CSIRO 2011 Review of groundwater models and modelling methodologies for the Great Artesian Basin ▪ 3
Figure 1.1 Geographic extent of the Great Artesian Basin and selected overlying surface water drainage divisions

4 ▪ Review of groundwater models and modelling methodologies for the Great Artesian Basin © CSIRO 2011
Figure 1.2 Stratigraphic sequences across the basins of the Great Artesian Basin (a): the Eromanga and Carpentaria basins (adapted
from Habermehl and Lau, 1997)

© CSIRO 2011 Review of groundwater models and modelling methodologies for the Great Artesian Basin ▪ 5
Figure 1.2 Stratigraphic sequences across the basins of the Great Artesian Basin (b): Surat Basin, Clarence Morton Basin and
Coonamble Embayment (adapted from Habermehl and Lau, 1997)

6 ▪ Review of groundwater models and modelling methodologies for the Great Artesian Basin © CSIRO 2011
Figure 1.3 The regions of the Great Artesian Basin Water Resource Assessment
© CSIRO 2011 Review of groundwater models and modelling methodologies for the Great Artesian Basin ▪ 7
2 Methods
2.1 Information sources
The key resources used for this review are a mix of public environmental assessment reports and other private and
unpublished reports provided to CSIRO for the purposes of the Assessment. A list of contemporary groundwater models
and their associated references can be found in the results section in Chapter 3 (Table 3.1). Other relevant documents
and personal communications are cited in the report body.
An initial list of contemporary groundwater models of GAB aquifers was compiled based on existing knowledge of the
Assessment project team and through direct enquiries to the relevant state and territory government water management
agencies, including the Queensland Department of Environment and Resource Management, South Australian
Department for Water, Northern Territory Department of Natural Resources, Environment, The Arts and Sport, and New
South Wales Office of Water.
2.2 Review procedure
The review was conducted using the following broad approach.
1. Literature search to compile a list of contemporary groundwater models within the Great Artesian Basin Water
Resource Assessment (the Assessment) area.
2. Initial reading, and extraction and tabulation of basic model facts relating to the purpose and design of the
models, and the numerical methods used, including:
a. purpose of the model and its current status
b. conceptual basis of the modelling and modelled processes
c. areal extent of model coverage, including total area, fraction of the Assessment regions, and coverage
of recharge beds
d. vertical extent and layering of models, and representation of GAB stratigraphic units
e. boundary conditions and representation of the aquifer water balance, including rainfall and flood
recharge, surface and groundwater exchanges, inter-aquifer flows, artesian discharges, bore
extractions and evapotranspiration
f. numerical methods such as the choice of modelling platform, grid and mesh design, and time stepping
g. model calibration and performance
h. types of predictive scenarios and their durations.
3. Preliminary appraisal of the suitability of each model for the purposes of the Assessment based on the
information compiled in (2) above.
4. More detailed review of selected models that were identified as potentially suitable for the Assessment.
2.3 Estimation of model coverage
Sometimes the total active model area was reported directly, or it could have been determined from information provided
about the model grid design. In other cases, an estimate of the model area was made by manually digitising an outline of
the model boundary and using geographic information system (GIS) tools to compute the associated area. The model
boundaries were digitised over georeferenced raster images that were extracted from the model reports. The region
boundaries were based on current system conceptualisation.

8 ▪ Review of groundwater models and modelling methodologies for the Great Artesian Basin © CSIRO 2011
If the boundary of a groundwater model extended beyond the Assessment area, or across multiple regions, then the
areas of the model domain residing within each of the regions was determined by intersecting the relevant boundaries
and computing the areas of the intersected regions using GIS tools.

© CSIRO 2011 Review of groundwater models and modelling methodologies for the Great Artesian Basin ▪ 9
3 Results
3.1 Historical overview
A total of 4 whole-of-GAB groundwater models and 18 notable part-GAB models of Great Artesian Basin (GAB) aquifers
have been developed during the past 40 years; more than half of these since 2006. Groundwater models have been
developed for two primary reasons:
• as water resource assessment tools to inform estimations of aquifer yield, and to support groundwater
resource management and allocation decisions
• as predictive tools for environmental impact assessments of major mineral and energy resource projects.
A chronological summary of groundwater modelling activity in the GAB can be seen in Figure 3.1 in the form of a timeline
from 1970 to present day. Each bar on the timeline represents the development of a groundwater model, and the colour
indicates the region within which the majority of the modelled area resides. Additional summary information relating to
the most recent version of each model is presented in Table 3.1 and Figure 3.2. This includes the coverage of each
model within the Assessment regions, and the geographical locations and boundary geometries of the models.
Three regional foci for groundwater modelling are evident around the margin of the GAB. They correspond to:
• mining projects located near the southern margin of the Eromanga region in southern South Australia
• mining projects located near the boundary of the Eromanga and Carpentaria regions in northern Queensland
• coal seam gas (CSG) projects located along the north-east margin of the Surat region in south-east
Queensland.
Groundwater modelling is virtually non-existent outside of these regions except for several groundwater resource models
developed for water catchments in New South Wales and south-east Queensland.
3.1.1 Whole-of-GAB groundwater modelling
Numerical modelling of the GAB aquifers commenced in the early 1970s when the Bureau of Mineral Resources Geology
and Geophysics (now Geoscience Australia) developed two whole-of-GAB transient models. These were known as
GABSIM (Ungemach, 1975) and GABHYD (Seidel, 1978). Development of the models was an ambitious undertaking for
the time and ultimately did not yield a useful groundwater assessment tool (Welsh, 2000). The modelling program was
ceased in 1978. Whole-of-GAB groundwater modelling was re-initiated in the 1990s by the Australian Geological Survey
Organisation. The groundwater function was subsequently moved to the Bureau of Rural Sciences (now the Australian
Bureau of Agricultural and Resource Economics and Sciences) where this work was completed. This work produced the
steady-state model GABFLOW (Welsh, 2000) and the transient model GABtran (Welsh, 2006). The GABtran model
superseded GABFLOW and is the only contemporary groundwater model covering the majority of the Assessment area.
3.1.2 Part-GAB groundwater modelling
Since the early 1980s, a number of significant groundwater models have been developed to support environmental
impact assessments of borefield production and aquifer dewatering for major mine sites within the GAB. They include the
Olympic Dam and Prominent Hill mines in South Australia, and the Ernest Henry, Cannington and Osborne mines, and
Mount Margaret prospect in northern Queensland.
Several notable groundwater resource models have been developed for alluvial river valleys of the Lower Namoi, Lower
Macquarie, Lower Gwydir and Dumaresq rivers in New South Wales, and the Upper Condamine River in south-east
Queensland. Within the GAB, these models are concerned mainly with shallow groundwater resources in Cenozoic
sediments. Presently, a new multi-layered groundwater model of the Namoi River catchment and underlying GAB

10 ▪ Review of groundwater models and modelling methodologies for the Great Artesian Basin © CSIRO 2011
aquifers is being developed for the Namoi Catchment Water Study (SWS, 2010a), which is anticipated to be finished by
March 2012.
During the past few years, rapid growth of the CSG industry in south-east Queensland has been driving large-scale
groundwater modelling of the north-east Surat region. Large multi-layered groundwater models have been developed to
support environmental impact statements (EIS) for the Australia Pacific LNG (APLNG) Project, Gladstone LNG (GLNG)
Project and Queensland Curtis LNG (QCLNG) Project. Updated and new groundwater models are also under
development for supplementary EIS studies within these projects, and for other CSG development proposals that are
currently in preparation.
In 2010, a review of the existing groundwater models within the Surat region (GHD, 2010) was conducted for the
Queensland Water Commission to evaluate their suitability for assessing and managing the impacts of the CSG industry.
None of the existing models were found to be suitable for assessing regional cumulative impacts that are anticipated to
arise from multiple CSG projects involving multiple operators. Based on the recommendations of the review, the
Queensland Water Commission is constructing a regional groundwater model for the Surat Cumulative Management
Area (QWC, 2010), which is anticipated to be completed by 2012.
© CSIRO 2011 Review of groundwater models and modelling methodologies for the Great Artesian Basin ▪ 11
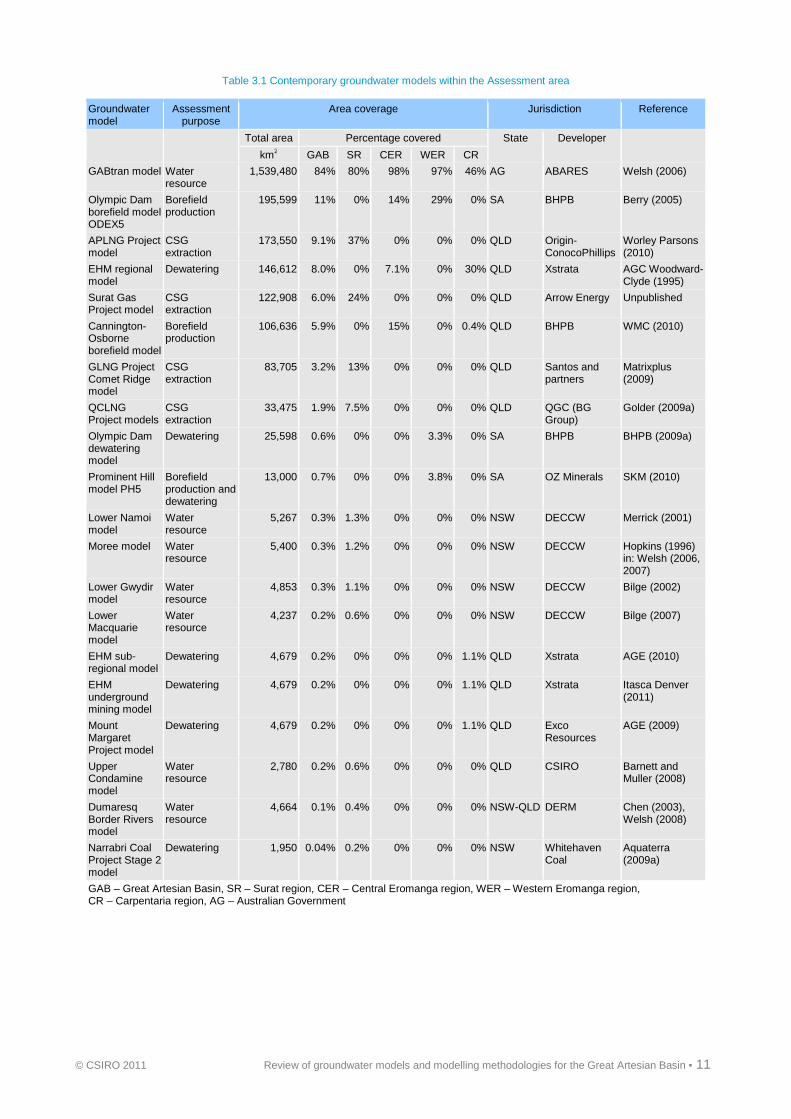
Table 3.1 Contemporary groundwater models within the Assessment area
Groundwater model
Assessment purpose
Area coverage Jurisdiction Reference
Total area Percentage covered State
Developer
km2 GAB SR CER WER CR
GABtran model Water resource
1,539,480 84% 80% 98% 97% 46% AG ABARES Welsh (2006)
Olympic Dam borefield model ODEX5
Borefield production
195,599 11% 0% 14% 29% 0% SA BHPB Berry (2005)
APLNG Project model
CSG extraction
173,550 9.1% 37% 0% 0% 0% QLD Origin-ConocoPhillips
Worley Parsons (2010)
EHM regional model
Dewatering 146,612 8.0% 0% 7.1% 0% 30% QLD Xstrata AGC Woodward-Clyde (1995)
Surat Gas Project model
CSG extraction
122,908 6.0% 24% 0% 0% 0% QLD Arrow Energy Unpublished
Cannington-Osborne borefield model
Borefield production
106,636 5.9% 0% 15% 0% 0.4% QLD BHPB WMC (2010)
GLNG Project Comet Ridge model
CSG extraction
83,705 3.2% 13% 0% 0% 0% QLD Santos and partners
Matrixplus (2009)
QCLNG Project models
CSG extraction
33,475 1.9% 7.5% 0% 0% 0% QLD QGC (BG Group)
Golder (2009a)
Olympic Dam dewatering model
Dewatering 25,598 0.6% 0% 0% 3.3% 0% SA BHPB BHPB (2009a)
Prominent Hill model PH5
Borefield production and dewatering
13,000 0.7% 0% 0% 3.8% 0% SA OZ Minerals SKM (2010)
Lower Namoi model
Water resource
5,267 0.3% 1.3% 0% 0% 0% NSW DECCW Merrick (2001)
Moree model Water resource
5,400 0.3% 1.2% 0% 0% 0% NSW DECCW Hopkins (1996) in: Welsh (2006, 2007)
Lower Gwydir model
Water resource
4,853 0.3% 1.1% 0% 0% 0% NSW DECCW Bilge (2002)
Lower Macquarie model
Water resource
4,237 0.2% 0.6% 0% 0% 0% NSW DECCW Bilge (2007)
EHM sub-regional model
Dewatering 4,679 0.2% 0% 0% 0% 1.1% QLD Xstrata AGE (2010)
EHM underground mining model
Dewatering 4,679 0.2% 0% 0% 0% 1.1% QLD Xstrata Itasca Denver (2011)
Mount Margaret Project model
Dewatering 4,679 0.2% 0% 0% 0% 1.1% QLD Exco Resources
AGE (2009)
Upper Condamine model
Water resource
2,780 0.2% 0.6% 0% 0% 0% QLD CSIRO Barnett and Muller (2008)
Dumaresq Border Rivers model
Water resource
4,664 0.1% 0.4% 0% 0% 0% NSW-QLD DERM Chen (2003), Welsh (2008)
Narrabri Coal Project Stage 2 model
Dewatering 1,950 0.04% 0.2% 0% 0% 0% NSW Whitehaven Coal
Aquaterra (2009a)
GAB – Great Artesian Basin, SR – Surat region, CER – Central Eromanga region, WER – Western Eromanga region, CR – Carpentaria region, AG – Australian Government

12 ▪ Review of groundwater models and modelling methodologies for the Great Artesian Basin © CSIRO 2011
Figure 3.1 Timeline of groundwater modelling of the Great Artesian Basin

© CSIRO 2011 Review of groundwater models and modelling methodologies for the Great Artesian Basin ▪ 13
Figure 3.2 Boundary geometries of groundwater models within the Assessment area
3.2 The GABtran model
GABtran (Welsh, 2006) is a single-layer transient groundwater model covering approximately 84 percent of the
Assessment area, including 80 percent of the Surat region, 98 percent of the Central Eromanga region, 97 percent of the
Western Eromanga region and 46 percent of the Carpentaria region. The active model area is approximately
1,500,000 km2, which is discretised into approximately 60,000 active model cells sized 5 km x 5 km. The single model
layer represents groundwater resources in the Lower Cretaceous-Jurassic main confined aquifers (Figure 3.3).
14 ▪ Review of groundwater models and modelling methodologies for the Great Artesian Basin © CSIRO 2011
GABtran’s predecessor models were the steady-state model GABFLOW (Welsh, 2000), and the transient models
GABHYD (Seidel, 1978) and GABSIM (Ungemach, 1975).
Areal groundwater recharge and discharge processes in GABtran are simulated using two separate boundary conditions.
The two boundary conditions represent the net distributed vertical flux and the net point fluxes. In both cases, the net flux
values are pre-estimated and then provided as model inputs. In each model cell, a single prescribed flow boundary
condition is used to represent the combined value of the net vertical recharge and the net vertical leakage, including
rainfall infiltration and evapotranspiration, and leakage from and to underlying and overlying aquifers. In model cells
corresponding to the locations of extraction bores and springs, a separate prescribed flow boundary condition is used to
represent the net point discharge from both processes. These are summed by the MODFLOW software for each model
cell.
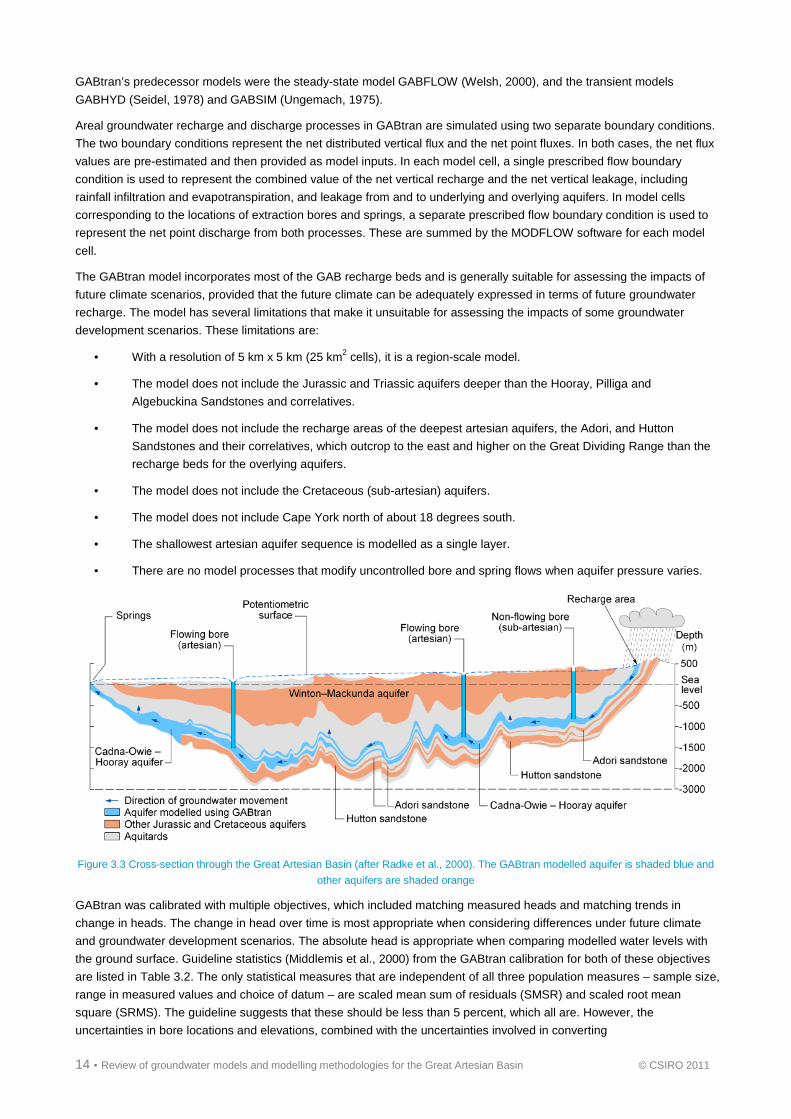
The GABtran model incorporates most of the GAB recharge beds and is generally suitable for assessing the impacts of
future climate scenarios, provided that the future climate can be adequately expressed in terms of future groundwater
recharge. The model has several limitations that make it unsuitable for assessing the impacts of some groundwater
development scenarios. These limitations are:
• With a resolution of 5 km x 5 km (25 km2 cells), it is a region-scale model.
• The model does not include the Jurassic and Triassic aquifers deeper than the Hooray, Pilliga and
Algebuckina Sandstones and correlatives.
• The model does not include the recharge areas of the deepest artesian aquifers, the Adori, and Hutton
Sandstones and their correlatives, which outcrop to the east and higher on the Great Dividing Range than the
recharge beds for the overlying aquifers.
• The model does not include the Cretaceous (sub-artesian) aquifers.
• The model does not include Cape York north of about 18 degrees south.
• The shallowest artesian aquifer sequence is modelled as a single layer.
• There are no model processes that modify uncontrolled bore and spring flows when aquifer pressure varies.
Figure 3.3 Cross-section through the Great Artesian Basin (after Radke et al., 2000). The GABtran modelled aquifer is shaded blue and
other aquifers are shaded orange
GABtran was calibrated with multiple objectives, which included matching measured heads and matching trends in
change in heads. The change in head over time is most appropriate when considering differences under future climate
and groundwater development scenarios. The absolute head is appropriate when comparing modelled water levels with
the ground surface. Guideline statistics (Middlemis et al., 2000) from the GABtran calibration for both of these objectives
are listed in Table 3.2. The only statistical measures that are independent of all three population measures – sample size,
range in measured values and choice of datum – are scaled mean sum of residuals (SMSR) and scaled root mean
square (SRMS). The guideline suggests that these should be less than 5 percent, which all are. However, the
uncertainties in bore locations and elevations, combined with the uncertainties involved in converting

© CSIRO 2011 Review of groundwater models and modelling methodologies for the Great Artesian Basin ▪ 15
temperature-corrected modelled water levels to their observed equivalents, leave head differences as the more accurate
method of assessing the impact of future climate and groundwater development scenarios.
Table 3.2 Statistical performance measures for the GABtran model
Performance measure Head gradient Temperature-corrected head
Value Units Value Units
Sample size 4,066 na 4,320 na
Range of measured values 18 m/y 368 m
Sum of residuals (SR) 1,098 m/y 26,308 m
Mean sum of residuals (MSR) 0.27 m/y 6.1 m
Scaled mean sum of residuals (SMSR) 1.5 % 1.7 %
Sum of squares (SSQ) 1,020 (m/y)2 422,970 m2
Mean sum of squares (MSSQ) 0.25 (m/y)2 98 m2
Root mean square (RMS) 0.50 m/y 9.9 m
Root mean fraction square (RMFS) 9,867 % 40 %
Scaled RMFS (SRMFS) 92 % 20 %
Scaled RMS (SRMS) 2.8 % 2.7 %
Correlation coefficient (R) 0.42 na 0.99 na
Coefficient of determination (R2) 0.18 na 0.98 na
Source: Welsh (2006)
na – not applicable
3.3 Surat region
3.3.1 Synopsis of groundwater models
The Surat region contains at least ten contemporary part-GAB groundwater models that individually cover between
0.2 percent and 37 percent of the region. The GABtran model covers approximately 84 percent of the region, including
the main Cretaceous aquifers and their recharge beds, but omits the Jurassic, Triassic and deeper stratigraphic units that
contain coal seam gas (CSG) resources. See Table 3.3 for groundwater models within the Surat region and Figure 3.4
for their locations and boundary geometries. Additional information about the vertical extent, layer structure and
stratigraphic representation of each model is provided in Figure 3.5.
Table 3.3 Contemporary groundwater models within the Surat region
Groundwater model Assessment purpose Area coverage Jurisdiction Reference
Total area Percentage covered
State Developer
km2 GAB SR
GABtran model Water resource 1,539,480 84% 80% AG ABARES Welsh (2006)
APLNG Project model CSG extraction 173,550 9.1% 37% QLD Origin-ConocoPhillips
Worley Parsons (2010)
Surat Gas Project model CSG extraction 122,908 6.0% 24% QLD Arrow Energy Unpublished
GLNG Project Comet Ridge model
CSG extraction 83,705 3.2% 13% QLD Santos and partners
Matrixplus (2009)
QCLNG Project models CSG extraction 33,475 1.9% 7.5% QLD QGC (BG Group)
Golder (2009a)
Lower Namoi model Water resource 5,267 0.3% 1.3% NSW DECCW Merrick (2001)
Moree model Water resource 5,400 0.3% 1.2% NSW DECCW Hopkins (1996) in: Welsh (2006, 2007)
Lower Gwydir model Water resource 4,853 0.3% 1.1% NSW DECCW Bilge (2002)
Lower Macquarie model Water resource 4,237 0.2% 0.6% NSW DECCW Bilge (2007)
16 ▪ Review of groundwater models and modelling methodologies for the Great Artesian Basin © CSIRO 2011
Groundwater model Assessment purpose Area coverage Jurisdiction Reference
Upper Condamine model Water resource 2,780 0.2% 0.6% QLD SKM–CSIRO Barnett and Muller (2008)
Dumaresq Border Rivers model
Water resource 4,664 0.2% 0.4% NSW-QLD
DERM Chen (2003), Welsh (2008)
Narrabri Coal Project Stage 2 model
Dewatering 1,950 0.04% 0.2% NSW Whitehaven Coal
Aquaterra (2009a)
GAB – Great Artesian Basin, SR – Surat region, AG – Australian Government
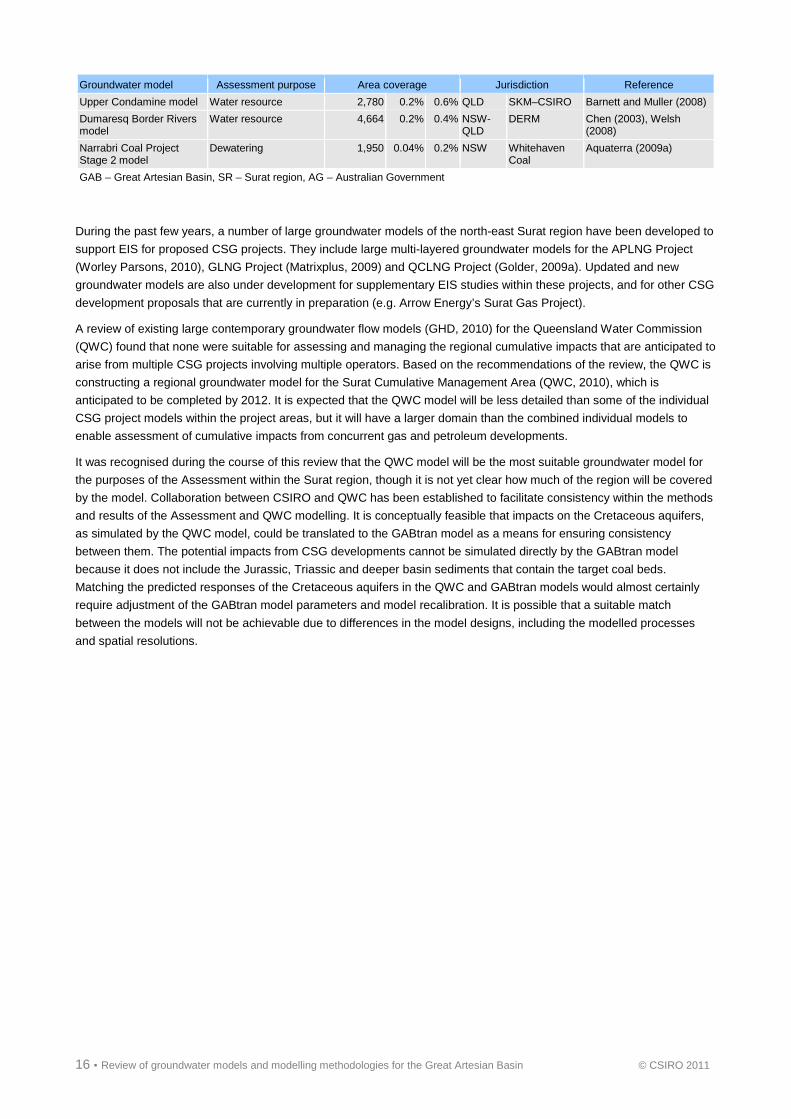
During the past few years, a number of large groundwater models of the north-east Surat region have been developed to
support EIS for proposed CSG projects. They include large multi-layered groundwater models for the APLNG Project
(Worley Parsons, 2010), GLNG Project (Matrixplus, 2009) and QCLNG Project (Golder, 2009a). Updated and new
groundwater models are also under development for supplementary EIS studies within these projects, and for other CSG
development proposals that are currently in preparation (e.g. Arrow Energy’s Surat Gas Project).
A review of existing large contemporary groundwater flow models (GHD, 2010) for the Queensland Water Commission
(QWC) found that none were suitable for assessing and managing the regional cumulative impacts that are anticipated to
arise from multiple CSG projects involving multiple operators. Based on the recommendations of the review, the QWC is
constructing a regional groundwater model for the Surat Cumulative Management Area (QWC, 2010), which is
anticipated to be completed by 2012. It is expected that the QWC model will be less detailed than some of the individual
CSG project models within the project areas, but it will have a larger domain than the combined individual models to
enable assessment of cumulative impacts from concurrent gas and petroleum developments.
It was recognised during the course of this review that the QWC model will be the most suitable groundwater model for
the purposes of the Assessment within the Surat region, though it is not yet clear how much of the region will be covered
by the model. Collaboration between CSIRO and QWC has been established to facilitate consistency within the methods
and results of the Assessment and QWC modelling. It is conceptually feasible that impacts on the Cretaceous aquifers,
as simulated by the QWC model, could be translated to the GABtran model as a means for ensuring consistency
between them. The potential impacts from CSG developments cannot be simulated directly by the GABtran model
because it does not include the Jurassic, Triassic and deeper basin sediments that contain the target coal beds.
Matching the predicted responses of the Cretaceous aquifers in the QWC and GABtran models would almost certainly
require adjustment of the GABtran model parameters and model recalibration. It is possible that a suitable match
between the models will not be achievable due to differences in the model designs, including the modelled processes
and spatial resolutions.

© CSIRO 2011 Review of groundwater models and modelling methodologies for the Great Artesian Basin ▪ 17
Figure 3.4 Boundary geometries of groundwater models within the Surat region
The Surat region also contains several notable groundwater models that were developed to facilitate yield assessments
and groundwater allocation management of shallow alluvial aquifers of the Lower Macquarie, Lower Namoi, Lower
Gwydir, Dumaresq Border Rivers and Upper Condamine river valleys. In general, these models are considered to be of
limited use for the purposes of the Assessment, primarily because of their relatively small sizes, and due to the differing
approaches used for simulating interaction with deeper GAB aquifers. The Upper Condamine model has no flow
connections to GAB aquifers; the Lower Namoi model uses a general head boundary condition to simulate upward
leakage into the alluvium from the underlying GAB; the Lower Macquarie model includes two GAB aquifer layers
overlying impermeable bedrock that receive lateral inflows; the Dumaresq Border Rivers model simulates a very small
amount of leakage from the alluvial aquifer to the GAB at a single fault off-set location, which accounts for only a few
percent of the model water balance; and interaction between alluvial and GAB aquifers in the Lower Gwydir model is
unspecified. The task of matching inter-aquifer flows simulated by these models, with the inter-aquifer flow distribution
simulated by a larger groundwater model such as GABtran, is expected to be impractical within the scope of the
Assessment. This task would almost certainly require modification and recalibration of all the models, without any
assurance that a successful match could be achieved.

18 ▪ Review of groundwater models and modelling methodologies for the Great Artesian Basin © CSIRO 2011
In the absence of consistent coupling between local and regional models, it is difficult to conceive a rigorous method for
utilising the Lower Macquarie, Lower Namoi, Lower Gwydir, Dumaresq Border Rivers and Upper Condamine models for
assessing the potential impacts of the proposed climate and development scenarios on the shallow groundwater
resources and their supported environmental values.
Figure 3.5 Vertical extent and layering of groundwater models within the Surat region
(note: row shading corresponds to Figure 1.2)
© CSIRO 2011 Review of groundwater models and modelling methodologies for the Great Artesian Basin ▪ 19
3.3.2 Lower Namoi groundwater model
The Lower Namoi groundwater model was developed to support sustainable yield estimation for the Lower Namoi Valley
in northern New South Wales. The first version of the model was reported by Merrick (1986) though earlier model
development appears to have started in around 1982 (Table 5-1 in Ivkovic (2006)). Subsequent model updates and
revisions up to version 6 are documented in Merrick (1989, 1998a, 1998b, 2001). A detailed appraisal of the model
against the Murray-Darling Basin Commission groundwater modelling guidelines (Middlemis et al., 2000) was conducted
by Kelly et al. (2007). Since version 3, the Lower Namoi model has been constructed using MODFLOW. The user
interface PMWIN was adopted at version 5 and the model was subsequently converted to Groundwater Vistas and
Visual MODFLOW (N Merrick (UTS), 2011, pers. comm.).
Version 6 of the Lower Namoi model was constructed with three layers to represent Cenozoic sediments corresponding
to the Narrabri, Gunnedah and Cubbaroo formations. It has a uniform finite difference grid, with 2.5 km x 2.5 km cells,
and an active model area of approximately 5267 km2, which is equivalent to 1.3 percent of the Surat region and
approximately 0.3 percent of the GAB.
Groundwater recharge processes represented in the model include prescribed inflows from rainfall and floods, leakage to
streams, artesian leakage from the base of the model and lateral boundary inflows. The groundwater discharge
processes include stream seepage, bore extractions and lateral boundary outflows.
A transient calibration of version 6 was conducted for the period 1980 to 1998 using 55 groundwater hydrographs from
27 monitoring sites. The model performance was verified against an additional 70 hydrographs from 43 sites.
For the 1980 to 1998 calibration period, stream losses in the model represented the most significant source of
groundwater recharge. They accounted for approximately 57 percent of total model inflows, and were roughly double the
combined inflows from flood and rainfall recharge. Recharge from upward artesian leakage at the base of the model was
approximately 11 percent of the total inflow. Groundwater discharge was dominated by bore extractions, which
represented approximately 95 percent of the total groundwater outflow from the model.
The reported water balance information suggests that the model-predicted groundwater level is likely to be relatively
insensitive to climatic variation of local diffuse rainfall recharge, which represents a relatively small component of the total
groundwater inflow. In version 6, the prescribed rate of diffuse recharge was only 0.1 percent of rainfall in the north and
0.5 percent in the south. Conversely, the model is likely to be relatively sensitive to development scenarios involving
significant change of shallow groundwater extraction, which is the dominant component of the model total outflow. The
task of matching artesian leakage to an alternative set of values (e.g. an inter-aquifer leakage distribution from a deeper
aquifer model) is likely to be non-trivial and would entail model recalibration.
3.3.3 Upper Namoi groundwater models
The series of groundwater models developed for the Upper Namoi region between 1998 and 2001 was reviewed by Kelly
et al. (2007). They include groundwater models for the Upper Namoi, Borambil Creek, Liverpool Plains and Mooki River
catchments. A FEFLOW model of the Maules Creek sub-catchment was also developed by the University of New South
Wales in 2009 (Giambastiani et al., 2009). All of these models lie outside of the Assessment area and are not further
considered in this review.
3.3.4 Moree groundwater model
A single-layer groundwater model for a small area of the GAB recharge beds near the township of Moree in northern
New South Wales was developed by the Department of Land and Water Conservation (now New South Wales Office of
Water) to assess potential impacts of groundwater pumping for irrigation. A copy of the Moree model report by Hopkins
(1996) could not be located for this review; however, a brief summary of the model was presented by Welsh (2006, 2007).
The model was reported to be developed in MODFLOW using a uniform finite difference grid with 36 rows, 24 columns
and 2.5 km x 2.5 km cells. This is equivalent to a model area of 5,400 km2, which represents approximately 1.2 percent
of the Surat region and 0.3 percent of the GAB.

20 ▪ Review of groundwater models and modelling methodologies for the Great Artesian Basin © CSIRO 2011
The model covers a minor portion of the GAB recharge beds and is understood to represent only the shallow
groundwater system. It is reported by Welsh (2007) that the model inflows and outflows include stream losses and gains,
and seasonal pumping. The current status of the model is unknown, although it appears that it is no longer in use. For
these reasons, the Moree model is not further considered in this review.
3.3.5 Lower Gwydir groundwater model
The Lower Gwydir groundwater flow model (Bilge, 2002) was developed in MODFLOW for an active area of
approximately 4853 km2 of the Gwydir Valley in north-east New South Wales. This represents approximately 1 percent of
the Surat region and 0.3 percent of the GAB. Milne-Home et al. (2007) previously reviewed the model against the
Murray-Darling Basin Commission groundwater modelling guidelines (Middlemis et al., 2000). The model is constructed
with two layers to represent the hydraulic behaviour of the river-valley alluvial aquifer. The model grid consists of 175
rows and 114 columns, and uniform 1 km x 1 km cells.
Boundary conditions and water balance components of the model include groundwater recharge from rainfall and
irrigation infiltration, river exchange, groundwater pumping, and lateral inflow and outflow. The model was calibrated for
the period 1986 to 1998 against 51 groundwater hydrographs. Lateral interaction with bounding bedrock formations is
implied by the use of time-varying prescribed head boundary conditions on lateral model boundaries; however, the extent
to which this is representative of interaction with the GAB is unclear. The conceptual model assumes that there is no
significant recharge to the Gwydir Valley aquifer from the GAB.
Overall, the Lower Gwydir groundwater model is considered to be unsuitable for the purposes of the Assessment. It
simulates only the alluvial aquifer system, it covers only a small portion of the Surat region, and interaction with
underlying GAB aquifers is unspecified.
3.3.6 Dumaresq Border Rivers groundwater model
The Dumaresq River groundwater model (Chen, 2003) was developed in MODFLOW by the Queensland Department of
Resources and Mines (now DERM) for the Dumaresq-Barwon Border Rivers Commission to address water resource
assessment and management needs. Although the model grid covers an area of 4664 km2, less than 50 percent of the
grid area resides within the GAB, which in area corresponds to approximately 0.4 percent of the Surat region. A large
number of the model cells are also inactive, with the distribution of active cells being limited to a relatively narrow strip of
alluvium bordering the Dumaresq River. Interaction with underlying sub-artesian GAB aquifers is conceptualised as
downward leakage along a single line near the western extent of the alluvium, which corresponds to the alignment of the
Peel Fault off-set. This leakage represents only a few percent of the model water balance.
Because it covers a very small fraction of the Surat region, and interaction with underlying GAB aquifers is minor, the
Dumaresq River groundwater model is considered to be unsuitable for the purposes of the Assessment.
3.3.7 Narrabri Coal Project groundwater models
Stage 2 of the Narrabri Coal Project will involve the establishment of underground longwall mining operations at the
Narrabri Coal mine, which is located on the south-east margin of the Surat region, approximately 30 km south-east of
Narrabri in northern New South Wales (Figure 3.4).
The Stage 1 groundwater model (GHD, 2007) was developed in MODFLOW to facilitate the environmental assessment
of surface facilities that are required to support the proposed Stage 2 underground mining. This model was superseded
by the Stage 2 groundwater model (Aquaterra, 2009a) which covers a larger area. The model was designed to assess
potential groundwater inflow rates to the mine, regional changes in groundwater level, and impacts on baseflow
contributions to surface water, particularly the Namoi River.
The Stage 2 groundwater model is an 11-layer MODFLOW model with an active area of approximately 1950 km2.
Approximately 755 km2 (39 percent) of the active model area resides within the Assessment area, which is equivalent to
approximately 0.2 percent of the Surat region and 0.04 percent of the GAB. The model grid was constructed with 269
rows and 270 columns, resulting in 72,630 cells per model layer and 798,930 total model cells. The number of active

© CSIRO 2011 Review of groundwater models and modelling methodologies for the Great Artesian Basin ▪ 21
model cells per layer is 55,162. Cell dimensions vary across the model domain from 50 m x 50 m in the mining area up to
500 m x 500 m near the model boundaries. The hydrostratigraphic units represented in the model are indicated in Figure
3.5.
The simulated inflows consisted of rainfall recharge and leakage from rivers and streams. The outflows were
groundwater discharge to rivers, prescribed outflows, and lateral boundary flows. A steady-state model calibration was
conducted based on water level observations at 22 sites, representing measurements within seven of the model layers.
A relatively short transient calibration was conducted for the period November 2007 to September 2008 using
18 groundwater hydrographs.
For the Stage 2 predictive simulations, a series of models of approximately two years’ duration each were run in
succession to allow progressive adjustment of model parameters in the mining area, which were anticipated to change
with progressive expansion of the longwall collapse zone. The predictive model simulations were based on a 29-year
mine life (2010 to 2028) followed by a 100-year recovery period (2029 to 2129). The maximum predicted impact on
baseflow during mining was a reduction of approximately 2 percent compared to pre-mining baseflow in one of six river
reaches. The simulated impact of mining on groundwater outflow to the GAB intake beds was reported to be less than
0.4 percent.
Although the Narrabri Coal Stage 2 model provides projections of development impacts on the GAB aquifers and the
connected surface water resources, it is considered to be of limited value to the Assessment because it covers only a
very small part of the region and associated GAB recharge beds.
3.3.8 Lower Macquarie groundwater model
The Lower Macquarie groundwater model (Bilge, 2007) was developed by the New South Wales Department of Water
and Energy (now Office of Environment and Heritage) to assess the sustainable yield and management of the
groundwater resource in the Lower Macquarie alluvium, which is used for irrigation, stock, domestic and town water
supplies. The model area is located in central New South Wales and straddles the southern most margin of the Surat
region (Figure 3.4).
A review of predecessor models and other related groundwater models within the Macquarie-Bogan catchments was
conducted by Dent et al. (2007). Those models are now superseded by the Lower Macquarie model and are not further
considered in this review.
The model was constructed using MODFLOW and is based on a four-layer conceptual model of the local
hydrostratigraphy. Four corresponding model layers were used to represent the upper unconfined aquifer (alluvium), a
deeper embedded palaeochannel aquifer (deep alluvium) and two confined-unconfined aquifers corresponding to the
Pilliga Sandstone and Purawaugh Formation. The model grid was designed with 192 rows, 206 columns and uniform
500 m x 500 m cells. The total grid area is 9888 km2 but more than half the total cells are inactive, resulting in an active
model area of approximately 4239 km2. Only approximately two-thirds of the active model area resides within the Surat
region, which represents approximately 0.6 percent of the region and 0.2 percent of the GAB.
Groundwater inflow processes represented in the Lower Macquarie model included distributed recharge from rainfall,
river flooding, irrigation and irrigation channel leakage; river and stream losses; and lateral boundary inflows. The
groundwater outflow processes consist of extraction from bores, river and stream gains and lateral boundary outflows.
A transient model calibration was conducted for the 23-year period 1980 to 2003 utilising approximately 60 groundwater
hydrographs.
Because the model covers only a minor fraction of the Surat and GAB regions, it is considered to be unsuitable for the
broader purposes of the Assessment.
3.3.9 Upper Condamine groundwater model
The Upper Condamine catchment is located in south-east Queensland near the eastern-most margin of the Surat region.
The most recent groundwater model of the Upper Condamine alluvial aquifer was developed by CSIRO (Barnett and
Muller, 2008) based on the pre-existing flow model developed by Sinclair Knight Merz (SKM, 2002). Earlier groundwater

22 ▪ Review of groundwater models and modelling methodologies for the Great Artesian Basin © CSIRO 2011
modelling of the Condamine Groundwater Management Area was reviewed by Kelly and Merrick (2007). They concluded
that each of the three single-layer MODFLOW models developed between 1990 and 1996 had too few cells to
adequately represent the modelled regions. Those models have since been superseded by the Upper Condamine model
and are not further considered in this review.
The Upper Condamine groundwater model was developed in MODFLOW using three model layers to represent
sub-layers within the river valley alluvium. The model grid covers an area of approximately 5934 km2 and was
constructed with 86 rows, 69 columns and uniform 1 km x 1 km cells. It covers approximately 0.6 percent of the Surat
region and approximately 0.2 percent of the GAB.
Inflow processes in the model include vertical recharge, river losses and lateral boundary inflow. The modelled outflows
were river gains, bore extraction and lateral boundary outflow. A transient calibration of the model was conducted for the
period 1980 to 2001 using 13 representative groundwater hydrographs.
Overall, the Upper Condamine model is considered to be unsuitable for the purposes of the Assessment because it
considers only the shallow alluvial groundwater resource, without connection to GAB aquifers, and the model area
covers only a small part of the region.
3.3.10 Namoi Catchment Water Study model
In September 2010, Schlumberger Water Services was commissioned by the Namoi catchment Ministerial Oversight
Committee to undertake the Namoi Catchment Water Study. The study has been scheduled in four phases and is
anticipated to be completed by March 2012 (SWS, 2010a). Under the study’s terms of reference (Namoi catchment water
study working group, 2009) the modelling should accommodate progressive changes in the water system due to coal
and gas development under different scenarios, and consider the potential impacts on the Namoi catchment as a whole.
As part of the phase 3 tasks, work has commenced on the development of two groundwater models that will be used to
undertake assessments of potential impacts from existing and proposed resource development projects.
The larger model will assess the impacts of CSG development across the Namoi catchment west of the Hunter-Mooki
fault using an 18-layer geological model developed in the Petrel geological modelling package. A smaller model will be
developed for the ‘most likely’ area for coal mine development covering the central part of the catchment. These models
will be linked so that cumulative impacts on surface water and groundwater resources of both activities can be assessed
(P Baker (SEWPaC), 2011, pers. comm.).
3.3.11 Coal seam gas groundwater models
The procedure for CSG extraction involves pumping groundwater to achieve hydraulic depressurisation of the target coal
bed, which liberates methane and other gases (adsorbates) from the surface of the coal (adsorbent). Depressurisation
during CSG extraction can propagate large distances into the target coal bed beyond the immediate extraction area,
which has the potential to drain groundwater and lower the pressure in connected aquifers over large areas.
Rapid growth of the Queensland CSG industry during the past five or so years has involved the development of a
number of large-scale groundwater models of the north-east Surat region to assess the potential impacts of the coal
seam gas extraction on groundwater resources. A review of those models for the QWC (GHD, 2010) found that none
were suitable for assessing and managing the regional cumulative impacts that are anticipated to arise from multiple
CSG projects involving multiple operators.
Based on the recommendations of the review, the Queensland Water Commission (QWC) is constructing a regional
groundwater model for the Surat Cumulative Management Area (QWC, 2010). The model construction is anticipated to
be completed by 2012. It is expected that the QWC model will be less detailed than some of the individual coal seam gas
project models within the project areas, but it will have a larger domain than the combined individual models to enable
assessment of cumulative impacts from concurrent gas and petroleum developments.
It was recognised during the course of this review that the QWC model will be the most suitable groundwater model for
the purposes of the Assessment within the Surat region. A collaboration between CSIRO and QWC has been
established to facilitate consistency within the methods and results of the Assessment and QWC modelling. In light of the

© CSIRO 2011 Review of groundwater models and modelling methodologies for the Great Artesian Basin ▪ 23
intention to use the QWC model for the purposes of the Assessment, the following sections are limited in content to basic
information and facts about the existing coal seam gas groundwater models, primarily for completeness of the review.
Queensland Curtis LNG Project
The Queensland Curtis LNG (QCLNG) Project involves the development of CSG resources in the Walloon Coal
Measures located within the north-east margin of the Surat region in south-east Queensland. Groundwater modelling
(Golder, 2009a, 2009b) was undertaken as part of the CSG component of the QCLNG EIS. The objectives of the
groundwater modelling study were to develop an ‘idealised’ regional groundwater model, provide estimates of the
groundwater extraction volumes required to depressurise the coal seams, and predict the potential impacts of the
proposed CSG extraction on groundwater pressures within the associated GAB aquifers.
Three virtually identical groundwater models were developed to assess groundwater impacts within the Central
Development Area (CDA), South East Development Area (SEDA) and North West Development Area (NWDA). The
models overlap in space (Figure 3.4) and occupy a total area of approximately 33,475 km2. Individually, the models each
cover an area of 17,280 km2 (120 km x 144 km). In total they cover approximately 7.5 percent of the Surat region and
1.9 percent of the GAB. The model boundaries lie entirely within the APLNG and Surat Gas Project model domains, and
the NWDA and CDA models overlap part of the Gladstone LNG (GLNG) Comet Ridge model area.
The models were developed using MODFLOW and were each constructed with 18 model layers (Figure 3.5) to represent
hydrostratigraphic units within the Cenozoic, Cretaceous and Jurassic sediments to a total depth of roughly 1200 m
below ground surface (Table 2 of Appendix D in Golder (2009a)). The model grids each have 234 rows and 272 columns
with a minimum cell size of 250 m x 250 m within the central zone of each model. They are described in the modelling
report as ‘bathtub’ models because each assumed zero surface recharge and constant head boundary conditions are set
on the entire model boundary. A formal calibration of the models was not carried out.
A rectangular 10 km x 50 km aquifer depressurisation zone was defined in the central part of each model, and a
time-varying specified head was applied to the Walloon Coal Measures within this area to imitate the effect of the
proposed groundwater pumping schedule. The predictive simulations involved a 40-year period (2013 to 2053) of aquifer
depressurisation during CSG extraction, followed by a 150-year period (2053 to 2203) of recovery. Non-measurable
reduction of baseflow contributions to rivers and streams was predicted.
Gladstone LNG Comet Ridge
The Gladstone LNG (GLNG) Comet Ridge groundwater model (Matrixplus, 2009) was developed to assess the potential
impacts of CSG extraction on piezometric head within the target and contact aquifers, and potential impacts on baseflow
in the Dawson River, stream tributaries and springs.
The model covers an area of approximately 83,705 km2 which is approximately 13 percent of the Surat region and
3.2 percent of the GAB. The model was constructed using MODFLOW with three layers to represent the Precipice
Sandstone aquifer (layer 1), Rewan Formation aquitard (layer 2), and the coal-bearing Bandanna Formation (layer 3).
The simulated inflow processes consisted of rainfall recharge, river losses and lateral boundary flow associated with
general head boundary conditions. The modelled outflow processes included outcrop seepage, river gains, well
extractions and lateral head-dependent boundary flows. Depressurisation of the target coal seams was simulated using
time-variant prescribed head boundary conditions.
The model review conducted by GHD (2010) for the QWC indicates that Schlumberger Water Services are currently
developing a second-generation 19-layer FEFLOW model for the GLNG Project.
APLNG groundwater model
The Australian Pacific LNG (APLNG) Project groundwater model (Worley Parsons, 2010) is the largest of the CSG
project models considered in this review. It covers approximately 37 percent of the Surat region and 9.1 percent of the
GAB, and covers an area of approximately 173,550 km2. It was constructed using FEFLOW and has 22 layers
representing the Cenozoic, Cretaceous and Jurassic hydrostratigraphic units from the ground surface to the top of the
Triassic confining beds. Eleven of the model layers are used to represent the Walloon Coal Measures, which contain the
target coal seam for gas extraction.

24 ▪ Review of groundwater models and modelling methodologies for the Great Artesian Basin © CSIRO 2011
The depressurisation schedule for the target coal seams, represented by layers 8, 12 and 16, was simulated using
time-variant prescribed head boundary conditions. Other simulated outflow processes included head-dependent
discharges to surface water courses and aggregated well extractions corresponding to 13,213 known pumping locations.
The simulated inflows consisted of rainfall recharge over the GAB recharge beds and leakage from surface water
courses.
A more detailed review of the APLNG groundwater model is given in GHD (2010).
Surat Gas Project groundwater model
A copy of Arrow Energy’s Surat Gas Project groundwater model report (SWS, 2010c) was not obtained for this review.
The information in this section is based on the review by GHD (2010) for the QWC, wherein the model is referred to as
the ‘Gladstone LNG Project model’. Only a brief summary of the information from the GHD report is presented in the
following paragraphs. The GHD report contained a map of the model geometry, which was manually digitised for this
review.
The Surat Gas Project model covers a large area of approximately 122,908 km2 and covers approximately 24 percent of
the Surat region and 6 percent of the GAB. It was developed in MODFLOW using 15 layers and 105,600 cells per layer,
consisting of 440 rows and 240 columns. The majority of the modelled area is covered by the APLNG Project model.
Modelled inflow processes evident from the GHD review included rainfall recharge and lateral boundary flows. Outflow
processes included head-dependent discharges to surface water courses and dewatered coal mine areas, and lateral
boundary outflows.
A steady-state calibration was conducted against 1995 water level data, and a transient calibration was conducted for the
period 1995 to 2010. No predictive simulations were presented.
3.4 Central Eromanga region
3.4.1 Synopsis of groundwater models
The Central Eromanga region contains two contemporary part-GAB groundwater models and one superseded part-GAB
model, and is approximately 98 percent covered by the GABtran model. The Cannington-Osborne borefield model (WMC,
2010) covers approximately 15 percent of the region in the north of the basin and the Olympic Dam borefield model
(Berry, 2005) covers approximately 14 percent of the region in the south-west. The superseded Ernest Henry Mine
(EHM) regional model (AGC Woodward-Clyde, 1995) covers approximately 7.1 percent of the Central Eromanga region
on the northern margin of the basin and approximately 30 percent of the Carpentaria region, but it produced inaccurate
predictions of mining impacts and is no longer considered to be reliable. See Table 3.4 for a list of the models and Figure
3.6 for their locations and boundary geometries. Additional information about the vertical extent, layer structure and
stratigraphic representation of each model is provided in Figure 3.7.
The Cannington-Osborne borefield model is considered to be unsuitable for the purposes of the Assessment because it
does not include any parts of the GAB recharge beds, it is calibrated assuming no surface recharge to the aquifer within
the model domain, and it covers approximately 15 percent of the Central Eromanga region and less than 6 percent of the
GAB. In addition, the model is largely replicated by the GABtran model at a regional scale. The Cannington-Osborne
model is expected to provide more accurate results in the vicinity of the mine borefields; however, lateral inflows across
the model boundaries are unlikely to be consistent with the regional flow directions and quantities simulated by GABtran.
In this case it would not be acceptable to use the models independently to obtain a single combined result. Recalibration
of either or both models in an attempt to match the boundary flows is considered to be impractical within the scope and
timeframe of the Assessment and might not be successful.
A similar conclusion was reached regarding the suitability of the Olympic Dam borefield model (ODEX5). It is generally
considered to be unsuitable for the purposes of the Assessment because the model does not contain any surface
recharge areas, which would prevent its use to simulate future climate scenarios. Simultaneous adjustment and
recalibration of the ODEX5 and GABtran models to achieve the required degree of flow matching between them is
considered to be impractical.

© CSIRO 2011 Review of groundwater models and modelling methodologies for the Great Artesian Basin ▪ 25
Table 3.4 Contemporary groundwater models within the Central Eromanga region
Groundwater model Assessment purpose Area coverage Jurisdiction Reference
Total area Percentage covered
State
Developer
km2 GAB CER
GABtran model Water resource 1,539,480 84% 98% AG ABARES Welsh (2006)
Cannington-Osborne borefield model
Borefield production 106,636 5.9% 15% QLD BHPB WMC (2010)
Olympic Dam borefield model ODEX5
Borefield production 195,599 11% 14% SA BHPB Berry (2005)
EHM regional model Dewatering 146,612 8.0% 7.1% QLD Xstrata AGC Woodward-Clyde (1995)
GAB – Great Artesian Basin, CER – Central Eromanga region, AG – Australian Government
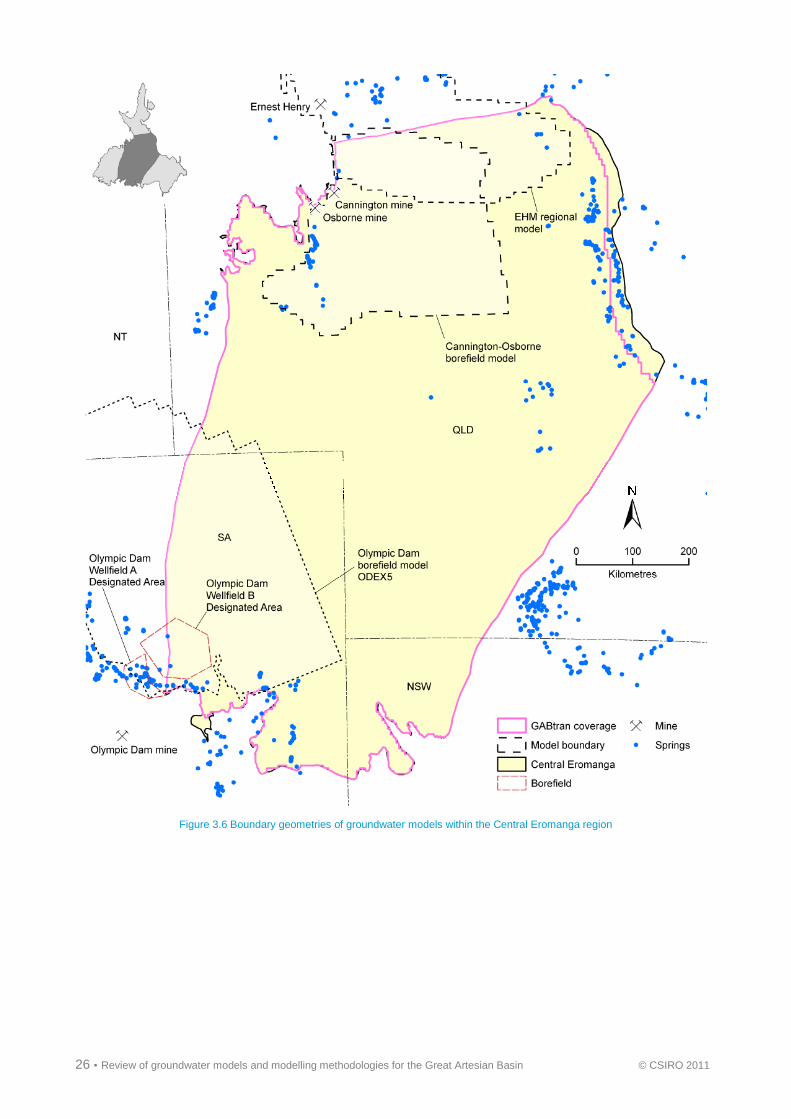
26 ▪ Review of groundwater models and modelling methodologies for the Great Artesian Basin © CSIRO 2011
Figure 3.6 Boundary geometries of groundwater models within the Central Eromanga region

© CSIRO 2011 Review of groundwater models and modelling methodologies for the Great Artesian Basin ▪ 27
Figure 3.7 Vertical extent and layering of groundwater models within the Central Eromanga region
(note: row shading corresponds to Figure 1.2)
3.4.2 Olympic Dam borefield model (ODEX5)
The Olympic Dam mining area is located in South Australia within a region of complex geology associated with adjoining
of the Eromanga, Arckaringa and Torrens basins and the Stuart Shelf (BHPB, 2009a). The primary water supply for
mining operations at Olympic Dam is acquired from two borefields that are located several hundred kilometres north-east
of the mine site within the Eromanga Basin (Figure 3.8). Mean annual extraction rates during 2008 to 2009 were reported
as 10.1 GL/year from Wellfield A and 1.7 GL/year from Wellfield B (BHBP, 2009b).
The first borefield groundwater model for the Olympic Dam operations incorporated Wellfield A and was known as
GABROX (AGC, 1984). It was superseded approximately ten years later by the GAB95 model (Berry and Armstrong,
1995) which was expanded to include Wellfield B. The GAB95 model, which is the basis for the current borefield model,
was updated and renamed ODEX1 in around 1997. Since then it has undergone several revisions and updates including
ODEX2, ODEX3 and ODEX5 (Berry, 2005).

28 ▪ Review of groundwater models and modelling methodologies for the Great Artesian Basin © CSIRO 2011
The ODEX5 model was developed as an update of the ODEX3 model. The update involved analysis and interpretation of
new geophysical data acquired for the prospective Wellfield C area, and re-parameterisation and recalibration of the
model in that area. The model grid straddles the Central and Western Eromanga regions, covering approximately
29 percent of the Western Eromanga region, 14 percent of the Central Eromanga region, and 11 percent of the GAB.
The model was constructed using the PMWIN interface for MODFLOW and consists of four layers representing
sediments:
• from the surface to Coorikianna Sandstone (layer 1 aquifer)
• Bulldog Shale and Cadna-owie Formation (layer 2 aquifer)
• Algebuckina, Namur, Adori and Hutton Sandstones (layer 3 aquifer)
• underlying impermeable sediments (layer 4 aquitard).
Layer 4 is reported as being insignificant to the model simulations (Berry, 2005).
All simulated inflow to the model domain is derived from lateral inflows associated with constant head and general head
boundary conditions on the perimeter of the model; there is no distributed vertical recharge. The simulated groundwater
outflow processes consist of:
• well extractions from the Olympic Dam wellfields
• petroleum industry wellfields and pastoral bores
• diffuse discharge at ground surface via constant head and general head boundary conditions
• head dependent spring discharges
• lateral boundary outflows.
The model was calibrated for the period 1996 to 2004 using eight groundwater hydrographs. Simulations of wellfield
extractive scenarios were conducted for 20-, 40- and 60-year periods commencing from 2011.
The ODEX5 groundwater model provides predictions of potential impacts on the GAB from proposed Olympic Dam
wellfield extractions. Though it has a large area, it covers less than 30 percent of the Western Eromanga region and only
around 14 percent of the Central Eromanga region. To be useful within the context of the Assessment, predictions of
future hydraulic heads from the ODEX5 model would need to be combined with predicted hydraulic heads from a larger
model such as GABtran. This approach is only valid if the flow distributions simulated by the models match along the
common boundaries, and the inter-aquifer flow volumes are consistent in both models. In general, the task of
simultaneously adjusting and recalibrating both models to achieve matching between the simulated heads and flows is
considered to be impractical within the means of the Assessment. The ODEX5 model also assumes no vertical recharge
from rainfall or surface water processes and would not be suitable for simulating future climate scenarios that are
represented by future recharge scenarios. For these reasons, the model is considered to be unsuitable for the purposes
of the Assessment.
3.4.3 Ernest Henry Mine regional groundwater model
The active area of the EHM regional groundwater model covers approximately 7 percent of the Central Eromanga region
and approximately 30 percent of the Carpentaria region. The model is therefore reviewed in Section 3.6.2 as part of the
Carpentaria region.
3.4.4 Cannington-Osborne borefield model
The Cannington and Osborne mines are located approximately 40 km apart on the north-west margin of the Central
Eromanga region in northern Queensland (Figure 3.6). Since the mid-1990s, a single groundwater model has been used
to assess the potential impacts on existing pastoral bores from production borefields that supply the mining operations.
The reported rates of extraction in 2010 were 1.9 GL/year from the Cannington borefield and 1.3 GL/year from the
Osborne borefield (WMC, 2010).
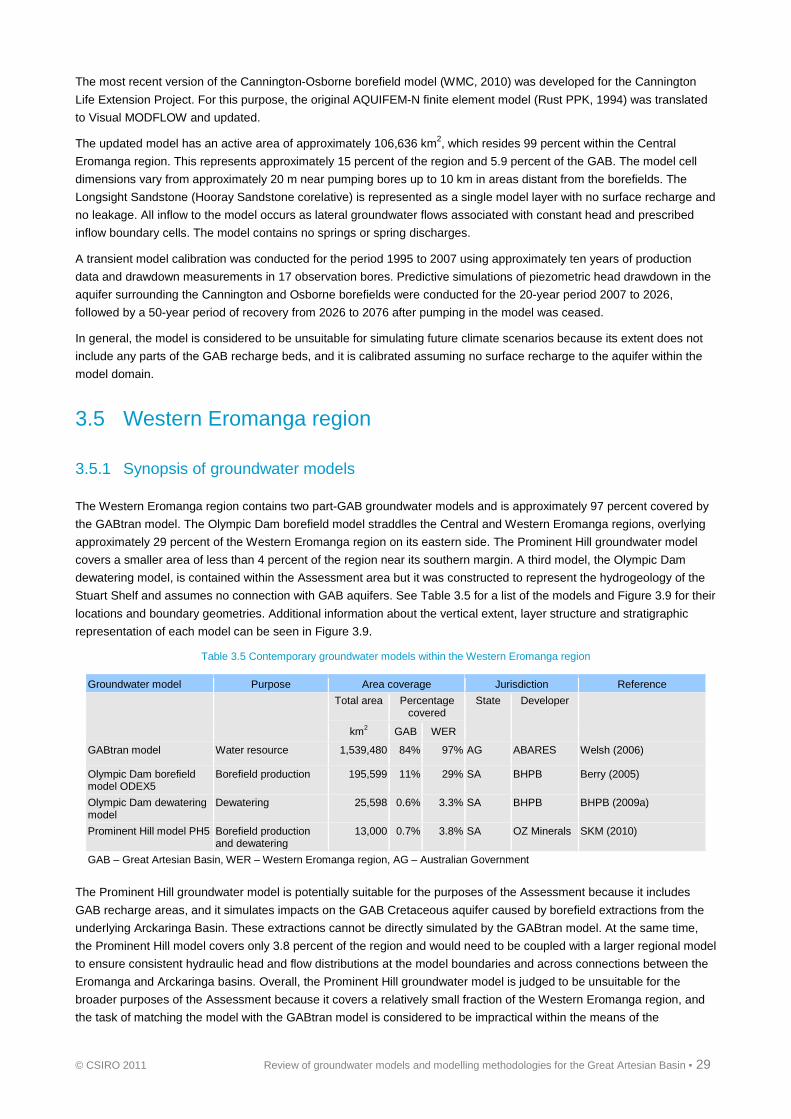
© CSIRO 2011 Review of groundwater models and modelling methodologies for the Great Artesian Basin ▪ 29
The most recent version of the Cannington-Osborne borefield model (WMC, 2010) was developed for the Cannington
Life Extension Project. For this purpose, the original AQUIFEM-N finite element model (Rust PPK, 1994) was translated
to Visual MODFLOW and updated.
The updated model has an active area of approximately 106,636 km2, which resides 99 percent within the Central
Eromanga region. This represents approximately 15 percent of the region and 5.9 percent of the GAB. The model cell
dimensions vary from approximately 20 m near pumping bores up to 10 km in areas distant from the borefields. The
Longsight Sandstone (Hooray Sandstone corelative) is represented as a single model layer with no surface recharge and
no leakage. All inflow to the model occurs as lateral groundwater flows associated with constant head and prescribed
inflow boundary cells. The model contains no springs or spring discharges.
A transient model calibration was conducted for the period 1995 to 2007 using approximately ten years of production
data and drawdown measurements in 17 observation bores. Predictive simulations of piezometric head drawdown in the
aquifer surrounding the Cannington and Osborne borefields were conducted for the 20-year period 2007 to 2026,
followed by a 50-year period of recovery from 2026 to 2076 after pumping in the model was ceased.
In general, the model is considered to be unsuitable for simulating future climate scenarios because its extent does not
include any parts of the GAB recharge beds, and it is calibrated assuming no surface recharge to the aquifer within the
model domain.
3.5 Western Eromanga region
3.5.1 Synopsis of groundwater models
The Western Eromanga region contains two part-GAB groundwater models and is approximately 97 percent covered by
the GABtran model. The Olympic Dam borefield model straddles the Central and Western Eromanga regions, overlying
approximately 29 percent of the Western Eromanga region on its eastern side. The Prominent Hill groundwater model
covers a smaller area of less than 4 percent of the region near its southern margin. A third model, the Olympic Dam
dewatering model, is contained within the Assessment area but it was constructed to represent the hydrogeology of the
Stuart Shelf and assumes no connection with GAB aquifers. See Table 3.5 for a list of the models and Figure 3.9 for their
locations and boundary geometries. Additional information about the vertical extent, layer structure and stratigraphic
representation of each model can be seen in Figure 3.9.
Table 3.5 Contemporary groundwater models within the Western Eromanga region
Groundwater model Purpose Area coverage Jurisdiction Reference
Total area Percentage covered
State
Developer
km2 GAB WER
GABtran model Water resource 1,539,480 84% 97% AG ABARES Welsh (2006)
Olympic Dam borefield model ODEX5
Borefield production 195,599 11% 29% SA BHPB Berry (2005)
Olympic Dam dewatering model
Dewatering 25,598 0.6% 3.3% SA BHPB BHPB (2009a)
Prominent Hill model PH5 Borefield production and dewatering
13,000 0.7% 3.8% SA OZ Minerals SKM (2010)
GAB – Great Artesian Basin, WER – Western Eromanga region, AG – Australian Government
The Prominent Hill groundwater model is potentially suitable for the purposes of the Assessment because it includes
GAB recharge areas, and it simulates impacts on the GAB Cretaceous aquifer caused by borefield extractions from the
underlying Arckaringa Basin. These extractions cannot be directly simulated by the GABtran model. At the same time,
the Prominent Hill model covers only 3.8 percent of the region and would need to be coupled with a larger regional model
to ensure consistent hydraulic head and flow distributions at the model boundaries and across connections between the
Eromanga and Arckaringa basins. Overall, the Prominent Hill groundwater model is judged to be unsuitable for the
broader purposes of the Assessment because it covers a relatively small fraction of the Western Eromanga region, and
the task of matching the model with the GABtran model is considered to be impractical within the means of the
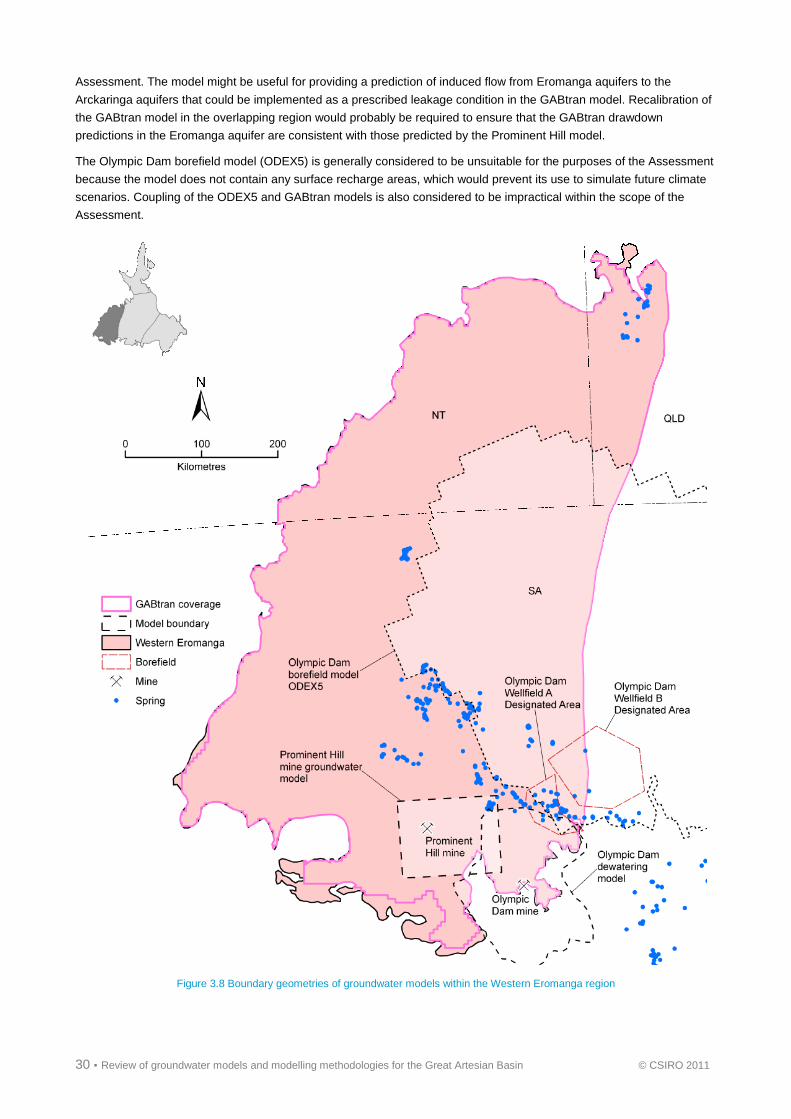
30 ▪ Review of groundwater models and modelling methodologies for the Great Artesian Basin © CSIRO 2011
Assessment. The model might be useful for providing a prediction of induced flow from Eromanga aquifers to the
Arckaringa aquifers that could be implemented as a prescribed leakage condition in the GABtran model. Recalibration of
the GABtran model in the overlapping region would probably be required to ensure that the GABtran drawdown
predictions in the Eromanga aquifer are consistent with those predicted by the Prominent Hill model.
The Olympic Dam borefield model (ODEX5) is generally considered to be unsuitable for the purposes of the Assessment
because the model does not contain any surface recharge areas, which would prevent its use to simulate future climate
scenarios. Coupling of the ODEX5 and GABtran models is also considered to be impractical within the scope of the
Assessment.
Figure 3.8 Boundary geometries of groundwater models within the Western Eromanga region

© CSIRO 2011 Review of groundwater models and modelling methodologies for the Great Artesian Basin ▪ 31
Figure 3.9 Vertical extent and layering of groundwater models within the Western Eromanga region
(note: row shading corresponds to Figure 1.2)
3.5.2 Olympic Dam borefield model (ODEX5)
The active model area of the Olympic Dam borefield model resides less than 50 percent within the Western Eromanga
region. The model is therefore reviewed in Section 3.4.2 as part of the Central Eromanga region.

32 ▪ Review of groundwater models and modelling methodologies for the Great Artesian Basin © CSIRO 2011
3.5.3 Olympic Dam Expansion Project dewatering model
The Olympic Dam Expansion Project dewatering model (BHBP, 2009a) was constructed with eight layers to represent
the hydrostratigraphy of the Stuart Shelf on the southern margin of the Western Eromanga region. The GAB is
represented as a boundary condition on the northern edge of the model but no impacts on the GAB due to the proposed
open cut dewatering have been predicted for simulations spanning more than 500 years (2007 to 2550). A steady-state
model calibration was conducted against 110 piezometric head observations from 1983, and a transient calibration was
conducted against 15 groundwater hydrographs for the period 1983 to 2007.
Groundwater recharge from rainfall infiltration is prescribed in five recharge zones and leakage from the tailings storage
facility is also simulated as prescribed recharge. Simulated discharge processes include surface seepage, representing
evaporation from beneath salt lakes, and groundwater pumping from bores.
An update of the dewatering model (SWS, 2010b) was released recently as part of the Olympic Dam Expansion Project
supplementary EIS (BHPB, 2011). The model update involved modification of the finite element mesh, layering and flow
boundaries; model recalibration; and re-running of the predictive scenarios and sensitivity analyses. Of significance, the
original constant head boundary condition representing the GAB aquifer was replaced by a drainage boundary condition
with the reference head set equal to ground surface elevation. This change now only permits groundwater outflow as
surface seepage in the area of potential connection with Eromanga aquifers. Thus, the revised conceptual
hydrogeological model assumes that there is no connection between the Stuart Shelf aquifer system and GAB within the
region of the modelling.
On the whole, the Olympic Dam Expansion Project dewatering model is considered to be unsuitable for the purposes of
the Assessment because it represents non-GAB aquifers, there is no recharge to GAB aquifers from the model, and the
predicted impact on the GAB from the proposed open cut dewatering is negligible.
3.5.4 Prominent Hill groundwater model (PH5)
The Prominent Hill copper-gold mine in South Australia is located in the southern part of the Western Eromanga region,
approximately 145 km north-west of the Olympic Dam mine and 645 km north-west of Adelaide. Commercial production
was commenced in 2009. The mine obtains its primary water supply from the Aries borefield, which is located in the
Arckaringa Basin, approximately 30 to 60 km south-east of the mine site. Ore extraction currently involves below-
watertable open cut operations, and the Ankata (Prominent Hill underground) mine is also under construction. The
proposed rate of future supply from the Aries borefield is approximately 9.5 GL/year.
The original Prominent Hill regional groundwater model, known as PH2 (Aquaterra, 2008), was developed to assess
potential impacts of the Aries borefield and proposed dewatering of the Prominent Hill open cut. Subsequent model
developments involved:
• PH3 (Aquaterra, 2009b) – vertical extension of the model by deepening its base to accommodate the
proposed underground mining operations
• PH4 (Aquaterra, 2009b) – lateral extension of the model domain to support the Prominent Hill Mining and
Rehabilitation Program
• PH5 (SKM, 2010) – addition of an extra model layer, adjustment of the model boundary conditions, and model
recalibration.
All model versions were developed using MODFLOW, and the most recent versions, PH4 and PH5, were implemented
using MODFLOW-SURFACT.
The PH5 model was constructed with six model layers. The uppermost model layer (layer 1) represents the Eromanga
aquifer and corresponds principally to the Cadna-owie Formation. The remaining five layers represent underlying non-
GAB hydrostratigraphic units that consist of the Stuart Range Formation aquitard (layer 2), the Boorthanna Formation
aquifer (layer 3 to layer 5), and the Proterozoic basement rocks (layer 6). The Stuart Range and Boorthanna Formations
belong to the Arckaringa Basin, which is considered to underlie the GAB in the modelled area.

© CSIRO 2011 Review of groundwater models and modelling methodologies for the Great Artesian Basin ▪ 33
The model grid consists of 500 rows, 650 columns and uniform 200 m x 200 m cells that cover a total area of 13,000 km2.
This represents approximately 3.8 percent of the Western Eromanga region and approximately 0.7 percent of the GAB.
Water balance components simulated by the model consisted of inflows from rainfall recharge, GAB spring contributions
to the local Eromanga aquifer, and lateral inflows associated with general head boundary conditions. The model
simulated outflows consisted of well extraction from the Aries borefield, groundwater evapotranspiration based on a 10 m
extinction depth, head-dependent seepage to the Prominent Hill open cut, and lateral outflows associated with general
head boundary conditions.
A steady-state model calibration was conducted using approximately 70 to 80 water level measurements corresponding
to pre-mining conditions in 2006. The transient calibration was conducted for the three-year period 2006 to 2009 using
approximately 96 groundwater hydrographs. Predictive simulations consisted of a ten-year mining period from 2009 to
2019, involving continuation of mine dewatering and borefield production, followed by a 100-year post-mining recovery
period from 2019 to 2119.
Based on the results of the predictive simulations it was concluded in the PH5 modelling report (SKM, 2010) that the
Aries Borefield is capable of meeting a demand of 9.5 GL/year for the life of the mine (until 2019) with no significant
difference in the simulated GAB spring flow during the proposed mining period and simulated post mining period.
Predicted impacts on hydraulic head in the Eromanga aquifer (layer 1) in 2019 are up to 50 m drawdown in the vicinity of
the Prominent Hill mine, around 10 m drawdown associated with the Aries Borefield, and less than 0.1 m drawdown at
the location of the modelled GAB springs. Thus, the current assessment of the Prominent Hill mine based on the
Prominent Hill groundwater model report considers that there will be no significant impact on the GAB as a result of
utilising groundwater sourced from the Arckaringa Basin aquifers.
The Prominent Hill groundwater model is potentially suitable for the purpose of the Assessment because it simulates
impacts on the GAB Cretaceous aquifer (Cadna-owie Formation) due to groundwater extractions from non-GAB aquifers
in the underlying Arckaringa Basin, which cannot be directly simulated by a GAB groundwater model such as GABtran.
On the other hand, the Prominent Hill groundwater model covers less than 4 percent of the Western Eromanga region
and any results generated by the model for the purposes of the Assessment would need to be integrated with results
from a larger regional model. Combining the simulated heads from two independent models to produce a single result is
only valid if the flows simulated by the two models are also matched, both along common lateral boundaries and
vertically between aquifer layers that are common to both models. While this task is theoretically feasible, a consistent
result cannot be guaranteed due to differences in the model designs and spatial resolutions, and it would require
adjustment and recalibration of both models that is likely to be impractical within the means of the Assessment.
3.6 Carpentaria region
3.6.1 Synopsis of groundwater models
The Carpentaria region contains three contemporary part-GAB groundwater models and one superseded part-GAB
model, and is approximately 46 percent covered by the GABtran model, which does not extend further north than
approximately 18 degrees south. The three contemporary models developed for the EHM and Mount Margaret project
use identical model domains that cover approximately 1.1 percent of the region. The superseded EHM regional model
(AGC Woodward-Clyde, 1995) covers approximately 30 percent of the region but it produced inaccurate predictions of
mining impacts and is no longer considered to be reliable. The models are listed in Table 3.6 and their locations and
boundary geometries are depicted in Figure 3.10. Additional information about the vertical extent, layer structure and
stratigraphic representation of each model is provided in Figure 3.11.

34 ▪ Review of groundwater models and modelling methodologies for the Great Artesian Basin © CSIRO 2011
Table 3.6 Contemporary groundwater models within the Carpentaria region
Groundwater model Assessment purpose Area coverage Jurisdiction Reference
Total area Percentage covered
State
Developer
km2 GAB CR
GABtran model Water resource 1,539,480 84% 46% AG ABARES Welsh (2006)
EHM regional model Dewatering 146,612 8% 30% QLD Xstrata AGC Woodward-Clyde (1995)
EHM sub-regional model Dewatering 4,679 0.2% 1.1% QLD Xstrata AGE (2010)
EHM underground mining model
Dewatering 4,679 0.2% 1.1% QLD Xstrata Itasca Denver (2011)
Mount Margaret Project model
Dewatering 4,679 0.2% 1.1% QLD Exco Resources
AGE (2009)
Cannington-Osborne borefield model
Borefield production 106,636 5.9% 0.4% QLD BHPB WMC (2010)
GAB – Great Artesian Basin, CR – Carpenteria region, AG – Australian Government
The EHM regional model was developed in the mid-1990s but it was superseded within a few years by the EHM
sub-regional model (AGE, 1999) and is no longer used. In retrospect, the model was found to have greatly under
estimated open cut inflows and over estimated regional groundwater drawdown compared to observational data
collected since the mid-1990s (I Callow (Xstrata), 2011, pers. comm.). At a regional scale, the EHM regional model was
superseded by the GABtran model, which uses a single model layer and similar grid cell dimensions. For these reasons,
the EHM regional model is considered to be unsuitable for the purposes of the Assessment and is not further considered
in this review.
The EHM sub-regional groundwater model (AGE, 2007) and the Mount Margaret groundwater model (AGE, 2009)
represent versions of the same model. The EHM sub-regional model was adopted for the Mount Margaret Project,
resulting in two models that differ only in the locations of the local grid refinements used to represent open cuts. The
Mount Margaret version of the model includes the EHM open cut and three open cuts proposed for the Mount Margaret
ore bodies. It has been used to assess potential cumulative impacts of future concurrent dewatering at both locations,
which are approximately 8 km apart. Although the models cover an area of approximately 4,679 km2, this represents only
approximately 1.1 percent of the Carpentaria region and 0.2 percent of the GAB. The EHM sub-regional model has been
calibrated against a significant amount of observational data from 1996 to 2009 (AGE, 2010). This data and the
calibrated hydraulic properties might be useful for reviewing and improving the performance of the GABtran model in this
region; however, the sub-region model domain is equivalent in area to around 190 (0.3 percent) of the active GABtran
model cells. More generally, the EHM sub-regional and Mount Margaret models are considered to be unsuitable for the
purposes of the Assessment. The model extent covers a very small fraction of the region, and lateral inflows and
outflows, which are not explicitly matched to regional flow directions and magnitudes, occur across more than 60 percent
of the model boundary.
The EHM underground mining model is a three dimensional, finite-element model of the EHM open cut and proposed
underground mining area that was developed by Itasca (HCItasca Denver, 2009; Itasca Denver, 2011). The model is
considered to be unsuitable for the purposes of the Assessment because of its specialised function, its development
using proprietary MINEDW software, and the relatively small portion of the region covered by the model.
Because the GABtran model covers less that 50 percent of the Carpentaria region it is also judged to be unsuitable for
the purposes of the Assessment. It is recommended that the model should be extended northward into Cape York.

© CSIRO 2011 Review of groundwater models and modelling methodologies for the Great Artesian Basin ▪ 35
Figure 3.10 Boundary geometries of groundwater models within the Carpentaria region

36 ▪ Review of groundwater models and modelling methodologies for the Great Artesian Basin © CSIRO 2011
Figure 3.11 Vertical extent and layering of groundwater models within the Carpentaria region
(note: row shading corresponds to Figure 1.2)
3.6.2 Ernest Henry Mine regional groundwater model
The EHM (copper and gold), located on the south-west margin of the Carpentaria region in northern Queensland, has
been operating since 1998. As a component of the original environmental impact study, a large regional groundwater
model was developed to assess the potential impacts from dewatering of the proposed open cut. The first version of the
EHM regional groundwater model (Rust PPK, 1995) was constructed using AQUIFEM-N; however, it was subsequently
translated to MODFLOW (AGC Woodward-Clyde, 1995) as part of a dewatering review.
It appears that the EHM regional model was not used for very long, and within a few years was replaced by a much
smaller sub-regional model (AGE, 1999), which covered approximately 3 percent of the regional model domain. In
retrospect, it was found that the EHM regional model had greatly underestimated groundwater inflow to the EHM open
cut, and significantly overestimated regional drawdown of aquifer pressure (I Callow (Xstrata), 2011, pers. comm.).
The EHM regional model domain covers a large area of approximately 146,612 km2, and overlaps approximately
30 percent of the Carpentaria region, 7.1 percent of the Central Eromanga region and 8 percent of the GAB. The model
was constructed with a single layer, representing the main Cretaceous aquifer (Gilbert River Formation), and the model
grid was designed with cell dimensions varying from 3 km up to 25 km.

© CSIRO 2011 Review of groundwater models and modelling methodologies for the Great Artesian Basin ▪ 37
Locally, the EHM regional model has been superseded by the EHM sub-regional model. At a regional scale, it has
effectively been superseded by the GABtran model, which also uses a single model layer and similar grid dimensions of
5 km x 5 km. For these reasons, the EHM regional model is not further considered in this review.
3.6.3 Cannington-Osborne borefield model
The domain of the Cannington-Osborne groundwater model resides less than 2 percent within the Carpentaria region.
The model is therefore reviewed in Section 3.4.4 as part of the Central Eromanga region.
3.6.4 Ernest Henry Mine sub-regional groundwater model
The first version of the EHM sub-regional groundwater model was developed by AGE (1999) to replace the much larger
EHM regional model (Section 3.6.2). The sub-regional model was re-conceptualised and updated a number of years later
(AGE, 2007) to achieve a better match between model performance and groundwater data collected during the
intervening period. The latest model version (AGE, 2010) represents a further update of the model using supplementary
groundwater data. The model has been used most recently to predict the potential impacts on regional groundwater from
proposed underground mining operations at the EHM.
The domain of the EHM sub-regional model is rectangular with approximate dimensions 60 km x 77 km (4620 km2) and
covers approximately 1.1 percent of the Carpentaria region and 0.2 percent of the GAB. The model was constructed
using MODFLOW with minimum cell dimensions of 50 m x 50 m in the area of the EHM open cut, increasing to a
maximum of 500 m x 500 m at a distance of several kilometres from the open cut. It contains two layers, with layer 1
representing the main Cretaceous aquifer (Gilbert River Formation) and layer 2 representing groundwater in the
underlying Proterozoic fractured rock aquifer.
The model simulated recharge processes consisting of rainfall recharge in areas of Proterozoic basement outcrop,
recharge leakage from beneath evaporation ponds, and lateral boundary in flows associated with prescribed head and
prescribed flow boundary conditions around approximately 60 percent of the model boundary. Modelled outflow
processes consisted of extraction from pastoral bores, open cut dewatering using wells, and groundwater seepage to the
open cut that was simulated using a drainage boundary condition.
A transient model calibration was performed for the period 1996 to 2009 using 34 hydrographs to fit the simulated
hydraulic head to the observed hydraulic head at those locations. The calibration period included open cut dewatering.
Simulations to predict potential impacts of future mining operations and mine closure involved continued dewatering of
the open cut from 2009 to 2011, a subsequent 12-year period (2011 to 2022) of underground mine dewatering below the
open cut, and a 100-year recovery period (2022 to 2122) to project the filling of the final mine void.
In general, the EHM sub-regional groundwater model is considered to be unsuitable for the purposes of the Assessment
because it covers a very small portion of the region, and more than 60 percent of the model boundary receives lateral
inflows and outflows associated with prescribed boundary conditions that are not explicitly matched to regional flow
directions and magnitudes. Supplementing the regional simulation results from a larger model (e.g. GABtran) with
simulation results from the EHM sub-regional model would require adjustment and recalibration of both models to
achieve flow matching between them. This is considered to be impractical within the scope of the Assessment.
It is noted that the 2007 version of the EHM sub-regional model (AGE, 2007) was also used for the Cloncurry Copper
Project EIS (AARC, 2009) to assess potential cumulative groundwater impacts from concurrent open cut dewatering at
the EHM mine and proposed Mount Margaret project (AGE, 2009). Further information about groundwater modelling for
the Mount Margaret project can be found in Section 3.6.6.
3.6.5 Ernest Henry Mine underground mining model
The EHM underground groundwater model was developed for Ernest Henry Mining by Itasca International Inc. (HCItasca
Denver, 2009) using their proprietary finite element software MINEDW. The model was designed to assess dewatering
requirements for underground mining below the EHM open cut, and was recently updated (Itasca Denver, 2011) to
incorporate additional geological and hydrological information obtained during the past few years. The model adopts the
38 ▪ Review of groundwater models and modelling methodologies for the Great Artesian Basin © CSIRO 2011
same boundary geometry as the EHM sub-regional model and covers an area of approximately 4620 km2 (Figure 3.10).
Despite this similarity, the finite element mesh is finely discretised in the vicinity of the open cut and underground mine
plan to provide a detailed numerical solution within a radial distance of around one kilometre from the open cut perimeter.
Element dimensions in the area of future underground mining are 30 m to 40 m. The model is three dimensional, which
allows layers to be discontinuous over the extent of the model domain, and results in different numbers of layers in
different locations. The current model version (Itasca Denver, 2011) has eight layers in areas that are most distant from
the open cut, 21-layers within and in the vicinity of the open cut, and 33-layers in the future underground mining area.
The increased vertical discretisation near the pit and proposed underground operations is used to improve the numerical
solution; it does not indicate a different stratigraphic sequence. Vertical element dimensions (layer thicknesses) in the
underground mining area are 20 m to 25 m. In total, the finite element mesh consists of 214,568 elements and 112,130
nodes.
The EHM underground groundwater model is highly specialised for assessing dewatering requirements for underground
mining and associated management of pit water. Outside of the immediate area of the open cut the model was
constructed and parameterised based on the pre-existing EHM sub-regional model (AGE, 2010) including model domain,
boundary conditions, recharge distribution and regional hydraulic properties (HCItasca Denver, 2009). Because of its
focused nature, its development using proprietary software and its minor coverage of the Carpentaria region, the model
is judged to be unsuitable for the purposes of the Assessment.
3.6.6 Mount Margaret project groundwater model
The Mount Margaret project is a proposed open cut mining development that forms part of Exco Resources’ Cloncurry
Copper project (AARC, 2009). The Mount Margaret ore bodies are located on the eastern margin of the Carpentaria
region in northern Queensland, approximately 8 km east of the EHM (Figure 3.10).
The pre-existing EHM sub-regional groundwater model (AGE, 2007) was used for the assessment of potential
groundwater impacts from dewatering of three open cut mine pits proposed for the Mount Margaret project (AGE, 2009).
The EHM sub-regional model was developed originally to assess the potential impacts on regional groundwater of
dewatering the EHM open cut. It was used for the Mount Margaret project with the permission of Ernest Henry Mining Pty
Ltd.
For the Mount Margaret project, the number of rows and columns in the EHM regional model were increased to achieve
cell dimensions of 50 m x 50 m in the region of the proposed Mount Margaret open cuts. No other changes were made to
the model structure or its parameters and calibration. Predictive simulations were run to estimate potential dewatering
volumes and regional drawdown of groundwater pressure in response to concurrent dewatering of the Mount Margaret
and Ernest Henry open cuts. The model calibration period was 1996 to 2006 and the predictive runs were conducted for
the period 2006 to 2020. Further information about the original EHM sub-regional model is contained in Section 3.6.4.

© CSIRO 2011 Review of groundwater models and modelling methodologies for the Great Artesian Basin ▪ 39
4 Summary, conclusions and recommendations
A summary table of the groundwater models reviewed is contained in Appendix A. The summary table includes areal
coverage and vertical extent of each model, and some general details regarding model construction. The GABtran model
(Welsh, 2006) is the only contemporary groundwater model that covers a significant fraction of each of the Assessment
regions, including 80 percent of the Surat region, 98 percent of the Central Eromanga region, 97 percent of the Western
Eromanga region and 46 percent of the Carpentaria region. Overall, the GABtran model covers 84 percent of the
Assessment area.
The largest contemporary part-GAB groundwater model is the Olympic Dam borefield model (ODEX5), which covers
approximately 11 percent of the Great Artesian Basin (GAB), including 14 percent of the Central Eromanga region and
29 percent of the Western Eromanga region. Six other part-GAB groundwater models individually cover between
1 percent and 10 percent of the GAB. The remaining twelve part-GAB models individually cover less than 1 percent of
the GAB.
For the purposes of the Assessment, a potentially useful model is one that is capable of simulating the impacts of future
climate and groundwater development. The key requirements for a useful part-GAB groundwater model are:
• inclusion of groundwater recharge areas
• coverage of the Assessment regions
• potential for coupling the model with a larger regional model such as GABtran.
If a part-GAB model contains no groundwater recharge areas then it cannot be used directly to simulate future climate
scenarios that are represented as a future variation of groundwater recharge. In these models, the sources of
groundwater recharge are external to the model domain and are represented implicitly by lateral inflows across the
model boundaries. It is not feasible to assess the potential impacts of future climate scenarios by adjusting the lateral
inflows, since there is no method to determine how the flows would change in space and time without coupling the model
to a larger scale model that includes the recharge areas. In this review, groundwater models that did not contain any
groundwater recharge areas are therefore judged to be unsuitable for the purposes of the Assessment.
Part-GAB models covering small fractions of the regions are also considered to be unsuitable for the purposes of the
Assessment. One percent of the Assessment area (17,957 km2) is equivalent in area to approximately 718 GABtran
model cells, which are each 25 km2. Part-GAB models are likely to be constructed with thousands to tens-of-thousands
of model cells, with cell dimensions of hundreds of metres and smaller in focus areas of the models. It follows that the
level of detail represented in those models cannot be directly translated or matched to the uniform 5 km x 5 km cell grid
used by the GABtran model.
The potential for coupling part-GAB groundwater models with the GABtran model is dependent on the particular
circumstance. Two situations are evident in this review:
1. Both models represent the same aquifer but over a different spatial extent, and at different levels of detail.
2. The part-GAB model includes aquifers that are not represented in the GABtran model, and impacts on the GAB
water resource are predicted as a result of extractions from those aquifers.
In the first case, the part-GAB model is likely to provide a better tool for assessing local impacts of development on GAB
aquifers; however, it can only produce results within the part-GAB model domain. If the GABtran model is used to assess
the impacts of the climate and development scenarios in the other parts of the region then there is a requirement that the
models should produce consistent results at their matching boundaries. For example, it is not valid to insert the hydraulic
head distribution computed by the part-GAB model within the head distribution computed by the GABtran model unless
the flows along the matching boundaries are also consistent. Similarly, it is not valid to superimpose the head drawdown
distributions from the part-GAB and GABtran models without ensuring that the boundary flows were matched. Coupling
the models in this way requires a formal modelling procedure for transferring flow or head conditions between the models,
including the ability to accommodate the differing grid geometries and model stress periods and time steps. It also
requires that both models are calibrated simultaneously. In general, the task of coupling small part-GAB models with the

40 ▪ Review of groundwater models and modelling methodologies for the Great Artesian Basin © CSIRO 2011
GABtran model in this way is judged to be impractical within the scope of the Assessment. For this reason, the part-GAB
models falling into this category are generally considered to be unsuitable for the purposes of the Assessment.
The second case arises if a part-GAB groundwater model projects impacts on the GAB due to groundwater extraction
from an aquifer that is not represented in the GABtran model. Examples in this review are the coal seam gas (CSG)
groundwater models and the Prominent Hill model. Because the extraction cannot be directly simulated by the GABtran
model, an alternate method is required to replicate the projected impact. Simply replacing one model result by the other
model result in the area of overlap is not a valid approach for the reasons discussed above. There is a requirement to
demonstrate consistent hydraulic head and flow responses in the aquifers that are common to both models. This involves
matching the lateral flows across the matching boundaries in those layers, as in the first case, and also matching the
distributed inter-aquifer leakage that allows the impact of extraction to propagate from one aquifer into the other. This
represents a complex modelling task that requires a formal procedure for transferring time-variant spatially-distributed
datasets between models with differing grid configurations and time stepping procedures.
If a part-GAB groundwater model is not suitable to be used directly for the Assessment, it might be possible to adapt the
GABtran model to use the hydraulic property values from the calibrated part-GAB model in the area of overlap, and
impose boundary conditions in GABtran that reflect water balance results from the part-GAB model (e.g. head-dependent
drainage rates). This is likely to entail regionalisation of the local property distributions to GABtran’s 5 km x 5 km grid.
The approach might achieve similar water balance responses to proposed future extraction, though the spatial patterns
of hydraulic head response should not be expected to closely match at the local scale due to the differences in the
spatial resolutions of the model grids and numerical solutions. Significant differences in the model responses might also
be evident if lateral boundary flows are an important component of the part-GAB model water balance. Ideally, the
GABtran model should be configured to replicate the local aquifer storage changes that are projected by the calibrated
part-GAB model.
4.1 Surat region
The Surat region is approximately 80 percent covered by the GABtran model. It contains at least eight contemporary
part-GAB models that individually cover between 0.2 percent and 37 percent of the region.
Six of the part-GAB models individually cover less than 2 percent of the region. They are considered to be unsuitable for
the purposes of the Assessment due to their small sizes relative to the Surat region. They consist of the Lower Namoi,
Lower Macquarie, Upper Condamine, Lower Gwydir, Dumaresq and Narrabri Coal project groundwater models.
The GABtran model provides the largest coverage of the region but it is unsuitable for simulating the impacts of proposed
CSG developments, which will involve large groundwater extractions from the GAB at depths below the base of the
GABtran model. It was established independently of this review (GHD, 2010) that none of the existing groundwater
models within the Surat region are suitable for assessing the cumulative impacts from multiple proposed and anticipated
CSG projects. The Queensland Water Commission (QWC) is currently developing a multi-layered groundwater model for
the Surat Cumulative Management Area to address this issue.
Collaboration between CSIRO and QWC has been established to facilitate consistency within the methods and results of
the Assessment and QWC modelling. For the purposes of the Assessment, it has been proposed to couple the GABtran
model with the QWC model by providing the inter-aquifer leakage distribution computed by the QWC model as a
distributed input at the base of the GABtran model. It is anticipated that this will require recalibration of the GABtran
model within the overlapping region.
4.2 Central Eromanga region
The Central Eromanga region is 98 percent covered by the GABtran model. It contains two contemporary part-GAB
groundwater models that in total cover approximately 29 percent of the region. The GABtran model is the only option for
simulating the proposed climate and development scenarios within the remaining 71 percent of the region.
The one-layer Cannington-Osborne borefield model covers approximately 15 percent of the region. It is considered to be
unsuitable for the purposes of the Assessment because its extent does not include any part of the GAB recharge beds,

© CSIRO 2011 Review of groundwater models and modelling methodologies for the Great Artesian Basin ▪ 41
and it is calibrated assuming no surface recharge to the aquifer within the model domain. Extractions from the
Cannington and Osborne borefields can be simulated directly using the GABtran model.
The four-layer Olympic Dam borefield model covers approximately 14 percent of the region. It is also considered to be
unsuitable for the purposes of the Assessment because it does not contain any groundwater recharge areas. For the
purposes of the Assessment, extractions from the Olympic Dam borefields can be simulated directly using GABtran.
4.3 Western Eromanga region
The Western Eromanga region is 98 percent covered by the GABtran model. It contains two part-GAB groundwater
models that predict impacts of mining developments on the GAB. Together, the two part-GAB models cover
approximately 33 percent of the region. The GABtran model is the only option for simulating the proposed climate and
development scenarios within the remaining 67 percent of the region.
The four-layer Olympic Dam borefield model covers approximately 29 percent of the region. It is considered to be
unsuitable for the purposes of the Assessment because it does not contain any groundwater recharge areas. For the
purposes of the Assessment, extractions from the Olympic Dam borefields can be simulated directly using GABtran.
The six-layer Prominent Hill groundwater flow model covers less than 4 percent of the region. It is considered to be
unsuitable for the purposes of the Assessment because of its relatively small size compared to the Western Eromanga
region and the disproportionate effort that would be required to couple it with the GABtran model. The Prominent Hill
model projects impacts of the GAB due to borefield extractions in the underlying Arckaringa Basin. These extractions
cannot be modelled directly using GABtran. It is theoretically possible that the inter-basin leakage predicted by the
Prominent Hill model could be used as an input to the GABtran model as an approximate method for simulating the water
balance impacts from the Prominent Hill borefield. However, differences in the model designs and spatial resolution
would require significant adjustments to each model, which will be impractical to achieve within the Assessment.
4.4 Carpentaria region
The Carpentaria region is 46 percent covered by the GABtran model. To be suitable for the purposes of the Assessment,
it is recommended that the GABtran model be extended northward within Cape York.
The region contains three contemporary part-GAB models that have identical model domains. The modelled area
represents approximately 1.1 percent of the region. A version of the GABtran model extended into Cape York is the only
option for simulating the proposed climate and development scenarios within the remaining 99 percent of the region.
The two-layer Ernest Henry Mine (EHM) sub-regional groundwater model and the Mount Margaret groundwater model
are versions of the same model that was developed to project the impacts of proposed dewatering of open cut and
underground mining. They are judged to be unsuitable for the purposes of the Assessment because of the small area
covered by the models, and the disproportionate effort that would be required to couple them with the GABtran model.
The three-dimensional EHM underground groundwater model is a specialised dewatering model that was developed
using proprietary MINEDW software. It features a fine mesh resolution within several kilometres of the Ernest Henry
open cut, but further away is based on the structure and hydraulic property distributions of the EHM sub-regional model.
Impacts from open cuts and underground mining at the Ernest Henry and Mount Margaret mines could be simulated
using the GABtran model by implementing head dependent flow conditions, or using open cut and underground mine
inflow rates simulated by the EHM sub-regional and the Mount Margaret models.
4.5 Conclusions
This review identifies contemporary groundwater models within the Assessment area from available public environmental
assessment reports and other private and unpublished reports assembled from a literature review. Key numerical
modelling of groundwater flow in the GAB began in the 1970s, and has been completed for a variety of purposes and
across a range of spatial scales during the past 4 decades. Generally, a groundwater model is designed for a unique

42 ▪ Review of groundwater models and modelling methodologies for the Great Artesian Basin © CSIRO 2011
purpose, and as such, it is developed in a specific manner to achieve specific goals. Models identified in this review were
developed as water resource assessment tools or as predictive tools for environmental impact assessments. The specific
choices made during conceptualisation of the groundwater system and model design (e.g. areal extent, layering,
boundary conditions) often constrain the application of a particular model for an alternative purpose.
For the purposes of the Assessment, a groundwater model must be capable of simulating impacts of future climate,
represented as future groundwater recharge, and groundwater development, represented as future groundwater
extraction. A key finding of this review is that the GABtran model meets these criteria better than other models across the
reporting regions. An equally important finding is that the GABtran model does not meet the criteria for some regions. For
the purposes of the Assessment, steps must be identified to address shortcomings of the GABtran model and achieve
the aim of the Assessment. A summary of the applicability of GABtran for each reporting region of the Assessment is
provided below, with recommendations where additional development of GABtran or alternative modelling is needed to
meet the purposes of the Assessment.
Surat region
• GABtran is capable of simulating the effects of future climate.
• GABtran is not capable of simulating the effects of groundwater development because extraction for CSG
production will originate from formations underlying the aquifers represented in GABtran.
• A collaboration has been established between CSIRO and QWC to develop consistency between the QWC
groundwater model and GABtran, considering that the models have different purposes.
Central Eromanga region
• GABtran is capable of simulating the effects of future climate.
• GABtran is capable of simulating the effects of groundwater development from the Cannington-Osborne and
Olympic Dam borefields.
Western Eromanga region
• GABtran is capable of simulating the effects of future climate.
• GABtran is capable of simulating the effects of groundwater development from the Olympic Dam borefield.
• GABtran is not capable of simulating the effects of groundwater development at the Prominent Hill mine
because extraction will originate from formations underlying the aquifers represented in GABtran.
• Simulated groundwater conditions at the Prominent Hill mine suggest interaction with GAB aquifers; however,
replicating this interaction in GABtran would require synchronised adjustment and recalibration of the
Prominent Hill groundwater model and GABtran, which will be impractical within the Assessment.
Carpentaria region
• GABtran is capable of simulating the effects of future climate.
• GABtran is capable of simulating the effects of groundwater development at the Ernest Henry and Mount
Margaret mines, following a comparison of parameterisation used in the fine-scale mine models and larger-
scale GABtran model.
4.6 Recommendations
The following recommendations are based on the information and conclusions presented in this review.

© CSIRO 2011 Review of groundwater models and modelling methodologies for the Great Artesian Basin ▪ 43
• The GABtran model should be adopted as the most suitable existing groundwater model for the purposes of
the Assessment, provided that appropriate methods for addressing key deficiencies with respect to the
Assessment can be developed.
• The Assessment has insufficient time and resources to extend the single-layer GABtran model to a multi-
layered groundwater flow model. The need, purpose and appropriate design of a new whole-of-GAB model
have not been established. Thus, the inherent deficiencies of modelling the GAB using a single model layer
should be accepted by the Assessment.
• In the Surat region, the GABtran model results should be coupled with the QWC’s Surat Cumulative
Management Area groundwater model results to enable simulation of development impacts due to
groundwater extraction in GAB aquifers below the base of the GABtran model, and specifically those aquifers
that are or will be impacted by CSG development.
• In the Carpentaria region, the spatial coverage of the GABtran model should be extended into Cape York such
that the extended GABtran model covers as much of the reporting region as is practical, excluding the Laura
Basin.
• With respect to the ability of the GABtran model to simulate the proposed future climate scenarios, the
significance of not including the recharge areas of the deepest artesian aquifers, the Adori and Hutton
Sandstones and their correlatives, should be identified, including a method for simulating future groundwater
recharge from these areas if it is determined to be significant for the purposes of the Assessment.
44 ▪ Review of groundwater models and modelling methodologies for the Great Artesian Basin © CSIRO 2011
References
AARC (2009) Exco Resources Limited Cloncurry Copper Project environmental impact statement. AustralAsian Resource Consultants on behalf on Exco Resources Ltd.
AGC (1984) Olympic Dam Water Supply, Wellfield A Investigation. Australian Groundwater Consultants report to Roxby Management Services.
AGC Woodward-Clyde (1995) Ernest Henry Mine dewatering review. AGC Woodward-Clyde report to Ernest Henry Mining, Perth.
AGE (1999) Development of a sub-regional groundwater model and predictive modelling, Ernest Henry Mine. Australasian Groundwater and Environmental Consultants report to Ernest Henry Mining.
AGE (2007) Borefield performance review and groundwater modelling, Ernest Henry Mine. Australasian Groundwater and Environmental Consultants report to Xstrata Copper - Ernest Henry Mining.
AGE (2009) Hydrological assessment for the Mount Margaret Project ore bodies. Appendix M - Hydrological Assessment Mt Margaret Area in: Cloncurry Copper Project Environmental Impact Statement. AustralAsian Resource Consultants on behalf of Exco Resources.
AGE (2010) Regional groundwater impacts of Ernest Henry Mine underground mining. Australasian Groundwater and Environmental Consultants report to Ernest Hemry Mining.
Aquaterra (2008) Prominent Hill mine regional groundwater model (PH2). Aquaterra report to Oxiana.
Aquaterra (2009a) Hydrogeological assessment. Part 2 in: Narabri Coal Mine Stage 2 Longwall Project environmental assessment, Volume 1 - Specialist consultant studies compendium. Aquaterra on behalf of Narrabri Coal Operations.
Aquaterra (2009b) Prominent Hill mine regional groundwater model (PH4). Numerical groundwater model - Appendix 14d in: Prominent Hill Copper-Gold Project mining and rehabilitation program 2009. Aquaterra on behalf of OZ Minerals.
Barnett BG and Muller J (2008) Upper Condamine Groundwater Model Calibration Report. A report to the Australian Government from the CSIRO Murray-Darling Basin Sustainable Yields Project, CSIRO, Australia.
Berry K (2005) Olympic Dam Expansion Studies: 2005 interim pre-feasibility study; Groundwater resource evaluation; Great Artesian Basin numerical flow model ODEX5. BHP Billiton.
Berry KA and Armstrong D (1995) Hydrogeological investigation and numerical modelling, Lake Eyre region, Great Artesian Basin. Western Mining Corporation, Report HYD T044.
Bilge H (2002) Lower Gwydir Valley groundwater model: groundwater flow model. Centre for Natural Resources, Department of Land and Water Conservation, NSW.
Bilge H (2007) Lower Macquarie groundwater flow model, model calibration and development (draft). Water Management Division, Department of Water and Energy, Parramatta, NSW.
BHPB (2009a) Stuart Shelf regional groundwater flow model. Appendix K6 in: Olympic Dam expansion draft environmental impact statement 2009. BHP Billiton.
BHPB (2009b) Olympic dam Great Artesian Basin wellfields report, 1 July 2008 - 30 June 2009. BHP Billiton.
BHPB (2011) Olympic Dam Expansion supplentary environmental impact statement 2011. BHP Billiton.
Chen D (2003) Dumaresq River groundwater model: Border Rivers, model development, calibration and use. Queensland Department of Natural Resources and Mines report to the Dumaresq-Barwon Border Rivers Commission.
CSIRO (2008) Water availability in the Murray-Darling Basin. Summary of a report to the Australian Government from the CSIRO Murray-Darling Basin Sustainable Yields Project. CSIRO, Australia.
CSIRO/GA (2011) Proposed project methodology. A report to the Australian Government from the CSIRO/GA Great Artesian Basin Water Resource Assessment. CSIRO Water for a Healthy Country Flagship, Australia.
Dent B, Merrick N, Milne-Home W, Kelly B and Yates D (2007) Groundwater knowledge and gaps in the Macquarie–Bogan catchments, Central West Management Area. National Centre for Groundwater Management, University of Technology Sydney.
GHD (2007) Narrabri Coal project groundwater assessment. Part 2 in: Narrabri Coal project environmental assessment, Volume 1 - Specialist consultant studies compendium. GHD on behalf of Narrabri Coal.
GHD (2010) Report for QWC 17-10 Surat: Basin groundwater modelling: Stage 1 model review (Draft). GHD report to Queensland Water Commission.

© CSIRO 2011 Review of groundwater models and modelling methodologies for the Great Artesian Basin ▪ 45
Giambastiani B, McCallum A, Andersen M, Kelly B and Acworth I (2009) A groundwater flow model of the Maules Creek catchment. Connected Waters, University of New South Wales. Viewed 10 May 2011. <http://www.connectedwaters.unsw.edu.au/downloads/Giambastiani_etal_2009_NWC_Canberra_Poster.pdf>.
Golder (2009a) Groundwater Assessment. Appendix 3.4 in: Queensland Curtis LNG Project environmental impact statement, Volume 3 - environmental impacts of the gas field component. Golder Associates on behalf of Queensland Gas Company.
Golder (2009b) Groundwater Assessment. Supplementary appendix 3.2 in: Queensland Curtis LNG Project environmental impact statement, Volume 3 - environmental impacts of the gas field component. Golder Associates on behalf of QGC - A BG Group business.
Habermehl MA and Lau JE (1997) Hydrogeology of the Great Artesian Basin, Australia. 1: 2,500,000 Map. Australian Geological Survey Organisation, Canberra.
HCItasca Denver (2009) Hydrological and geochemical analyses in support of the feasibility study of underground mining at Ernest Henry Mine. HCItasca Denver report to Xstrata Copper - Ernest Henry Mining.
Hopkins B (1996) Modelling the impacts of irrigation pumping from the Great Artesian Basin intake beds. Department of Land and Water Conservation, NSW.
Itasca Denver (2011) Groundwater flow model update and revised inflow predictions in support of underground mining at Ernest Henry Mine. Itasca Denver report to Xstrata Copper - Ernest Henry Mining.
Ivkovic KM-J (2006) Modelling groundwater-river interactions for assessing water allocation options. PhD thesis, Fenner School of Environment and Society, Australian National University. Viewed 26 July 2011, <https://digitalcollections.anu.edu.au/handle/1885/49342>.
Kelly B and Merrick N (2007) Groundwater knowledge and gaps in the Condamine Alliance Area. National Centre for Groundwater Management, University of Technology Sydney.
Kelly B, Merrick N, Dent B, Milne-Home W and Yates D (2007) Groundwater knowledge and gaps in the Namoi Catchment Management Area. National Centre for Groundwater Management, University of Technology Sydney.
Matrixplus (2009) Groundwater (deep). Appendix P2 in: GLNG environmental impact statement. Matrixplus on behalf of Santos.
Merrick NP (1986) Lower Namoi Valley groundwater model: short-term performance. Water Resources Commission, Hydrogeological Report No. 1986/4.
Merrick NP (1989) Lower Namoi Valley groundwater model. Heritage Computing report to NSW Department of Water Resources.
Merrick NP (1998a) Lower Namoi groundwater flow model: Calibration 1987–1994. Insearch Limited report to NSW Department of Land and Water Conservation.
Merrick NP (1998b) Lower Namoi Valley groundwater flow model: conversion to PMWIN software. Insearch Limited, Project C98/44/001.
Merrick NP (2001) Lower Namoi groundwater flow model, calibration 1980-1998. Insearch Limited report to Department of Land and Water Conservation, NSW.
Middlemis H, Merrick N and Ross J (2000) Murray-Darling Basin Commission groundwater flow modelling guidelines. Aquaterra Consulting Pty Ltd.
Milne-Home W, Merrick N, Kelly B, Dent B and Yates D (2007) Groundwater knowledge and gaps in the Border Rivers–Gwydir Catchment Management Area. National Centre for Groundwater Management, University of Technology Sydney.
Namoi catchment water study working group (2009) Terms of reference for Namoi water study. Viewed 10 May 2011. <http://www.namoicatchmentwaterstudy.com.au/client_images/966741.pdf>.
QWC (2010) Annual Report 2009–10. Queensland Water Commission.
Radke BM, Ferguson J, Cresswell RG, Ransley TR and Habermehl MA (2000) Hydrochemistry and implied hydrodynamics of the Cadna-owie – Hooray aquifer, Great Artesian Basin. Bureau of Rural Sciences, Canberra.
Rust PPK (1994) Cannington Project regional groundwater investigation for borefield development. Numerical Modelling. Rust PPK report to BHP Billiton, Townsville.
Rust PPK (1995) Groundwater. Appendix C in: Ernest Henry Project impact assessment study, Supplementary, Volume 3. RUST PPK on behalf of Ernest Henry Mining, Brisbane.
Seidel GE (1978) Hydraulic calibration of the GABHYD model of the Great Artesian Basin. Bureau of Mineral Resources, Geology and Geophysics Record 1978/12, Canberra.
SKM (2002) South-East Queensland Recycled Water Project – Darling Downs hydrological study. Groundwater modelling. Sinclair Knight Merz report to Brisbane City Council and the Southeast Queensland Regional Association of Councils.
46 ▪ Review of groundwater models and modelling methodologies for the Great Artesian Basin © CSIRO 2011
SKM (2010) Prominent Hill Mine groundwater model update (PH5). Sinclair Knight Merz on behalf of OZ Minerals.
SWS (2010a) Namoi Catchment Water Study, Independent expert phase 1 report. Schlumberger Water Services report to Department of Industry and Investment, New South Wales.
SWS (2010b) Olympic Dam EIS Project, Updates to Stuart Shelf regional groundwater flow model. Appendix F4 in: Olympic Dam Expansion supplementary environmental impact statement 2011. Schlumberger Water Services on behalf of BHP Billiton.
SWS (2010c) Groundwater modelling of the Surat Basin, Method of model construction. Schlumberger Water Services report to Arrow Energy Limited.
Ungemach P (1975) Great Artesian Basin groundwater project – explanatory note on digital model package, Great Artesian Basin simulation model (GABSIM). Bureau of Mineral Resources, Geology and Geophysics Record 1975/169, Canberra.
Welsh WD (2000) GABFLOW: A steady state groundwater flow model of the Great Artesian Basin. Bureau of Rural Sciences, Canberra.
Welsh WD (2006) Great Artesian Basin transient groundwater model. Bureau of Rural Sciences, Canberra.
Welsh WD (2007) Groundwater balance modelling with Darcy’s Law. PhD thesis, Fenner School of Environment and Society, The Australian National University. Viewed 28 November 2010 <http://thesis.anu.edu.au/public/adt-ANU20070703.165654/index.html>.
Welsh WD (2008) Border Rivers groundwater modelling: Dumaresq River. A report to the Australian Government from the CSIRO Murray-Darling Basin Sustainable Yields Project. CSIRO, Australia.
WMC (2010) Cannington borefield model update. Appendix R in: Cannington Life Extension Project environmental impact statement, Volume 2. Water Management Consultants on behalf of BHP Billiton Cannington.
Worley Parsons (2010) Ground water technical report - gas fields. Chapter 21 in: Australia Pacific LNG Project environmental impact statement, Volume 5 - attachments. Worley Parsons on behalf of Australia Pacific LNG.
© CSIRO 2011 Review of groundwater models and modelling methodologies for the Great Artesian Basin ▪ 47
Appendix A Selected summary of groundwater
models for the Great Artesian Basin
Appx Table 1 provides a selected summary of areal coverage, vertical extent and construction aspects of groundwater
models for the Great Artesian Basin.

48 ▪ Review of groundwater models and modelling methodologies for the Great Artesian Basin © CSIRO 2011
Appx Table 1 Selected model information
Model Owner Purpose Areal coverage Vertical extent
Construction
Juris
dict
ion
Total area
Percentage covered
Str
atig
raph
y
Cod
e
Met
hod
Spa
ce
Tim
e
Laye
rs
Act
ive
cells
(x
100
0)
Cel
l siz
e (k
m)
km2
(x 1000)
GAB SR CER WER CR
GABtran ABARES WRA AG 1,539 84% 80% 98% 97% 46% Cr MF FDM 2DH T 1 ~ 60 5
Olympic Dam ODEX5
BHP Billiton GBP SA 196 11% 0% 14% 29% 0% Ce, Cr, Ju, Tr
MF FDM Q3D T 4 U U
APLNG Origin- ConocoPhillips
CSG QLD 174 9.1% 37% 0% 0% 0% Ce, Cr, Ju, Tr
FF FEM Q3D T 22 366 3–12
EHM regional
Xstrata MDW QLD 147 8.0% 0% 7.1% 0% 30% Cr MF FDM 2DH T 1 2.5 3–25
Cannington LE
BHP Billiton GBP QLD 107 5.9% 0% 15% 0% 0.4% Cr MF FDM 2DH T 1 U 0.02–10
GLNG Comet Ridge
Santos and partners
CSG QLD 84 3.2% 13% 0% 0% 0% Ju, Tr. Pe
MF FDM Q3D T 3 U 1.35–
QCLNG QGC (BG Group)
CSG QLD 33 1.9% 7.5% 0% 0% 0% Ce, Cr, Ju
MF FDM Q3D T 18 1,146 0.25–
Olympic Dam dewatering
BHP Billiton MDW SA 26 0.6% 0% 0% 3.3% 0% Ce, Ca, Pr
FF FEM Q3D T 8 54 0.04–5
Prominent Hill PH5
Oz Minerals GBP, MDW
SA 13 0.7% 0% 0% 3.8% 0% Cr, Pe MF FDM Q3D T 6 1,950 0.2
Lower Namoi
OEH WRA NSW 5 0.3% 1.3% 0% 0% 0% Ce MF FDM Q3D T 3 < 4.5 2.5
Lower Gwydir
OEH WRA NSW 5 0.3% 1.1% 0% 0% 0% Ce MF FDM Q3D T 2 U 1
Lower Macquarie
OEH WRA NSW 4 0.2% 0.6% 0% 0% 0% Ce MF FDM Q3D T 4 < 158 0.5
EHM sub-regional
Xstrata MDW QLD 5 0.2% 0% 0% 0% 1.1% Cr, Pr MF FDM Q3D T 2 U 0.05–0.5
EHM underground
Xstrata MDW QLD 5 0.2% 0% 0% 0% 1.1% Cr, Pr MD FEM 3D T 33 215 0.03–
Mount Margaret
Exco Resources
MDW QLD 5 0.2% 0% 0% 0% 1.1% Cr, Pr MF FDM Q3D T 2 U 0.05–0.5
Upper Condamine
CSIRO WRA QLD 3 0.2% 0.6% 0% 0% 0% Ce MF FDM Q3D T 3 <178 1
Dumaresq Border Rivers
DERM WRA QLD 5 0.1% 0.4% 0% 0% 0% Ce MF FDM Q3D T 2 U 0.1–0.4
Narrabri Coal Stage 2
Whitehaven Coal
MDW NSW 2 0.04% 0.2% 0% 0% 0% Ce, Cr, Ju, Tr, Pe
MF FDM Q3D T 11 607 0.05–5
ABARES – Australian Bureau of Agricultural and Resource Economics and Sciences, BP – groundwater borefield production, Ca – Cambrian, CR – Carpentaria region, CER – Central Eromanga region, AG – Australian Government, Ce – Cenozoic, Cr – Cretaceous, CSG – coal seam gas extraction, DERM – Department of Environment and Resporce Management, FDM – finite difference method, FEM – finite element method, FF – FEFLOW, GAB – Great Artesian Basin, Ju – Jurassic, OEH – Office of Environment and Heritage (formerly Department of Environment, Climate Change and Water), MD – MINEDW finite element code, MDW – mine dewatering, MF – MODFLOW, PMWIN – Processing Modflow for Windows, Pe – Permian,

© CSIRO 2011 Review of groundwater models and modelling methodologies for the Great Artesian Basin ▪ 49
Recharge Discharge Calibration Simulations Reference
Net
ver
tical
Rai
nfal
l
Flo
od
Irrig
atio
n
Str
eam
Leak
age
Late
ral f
low
Eva
pora
tion
Str
eam
See
page
CS
G w
ells
Wel
ls
Spr
ings
Leak
age
Late
ral f
low
Ste
ady
Tra
nsie
nt
Tot
al
Ext
ract
ion
Rec
over
y
T2 T2 T2 T2 T1 N 1965–1999
2000–2050
Welsh (2006)
T1 T3
T2 T3 T1 T3
T3 U 1996–2004
2010–2550
2010–2050
2050–2550
Berry (1995)
T2 T3 T3 T1 T2 2009 2009–3069
2009–2069
2069–3069
Worley Parsons (2010)
T1 T2
T2 T1 1995 2009–2029
2009–2029
AGC Woodward-Clyde (1995)
T1 T2
T2 T1 1995 1995–2007
2007–2076
2007–2026
2026–2076
WMC (2010)
T2 T3 T3 T3 T1 T2 U 1995–2008
2009–2028
2009–2028
Matrixplus (2009)
T1 T1 N N 190 years
40 years
150 years
Golder (2009a)
T2 T2 T1 T3 T2 T3 1983 1983–2007
2010–2550
2010–2050
2050–2550
BHPB (2009) SWS (2010b)
T2 T3 T2 T2 T3 T2 T3 2006 2006–2009
2009–2119
2009–2019
2019–2119
SKM (2010)
T2 T2 T3 T3 T1 T3
T3 T2 U Y 1980–1998
Merrick (2001)
T2 T2 T3 T1 T2 T3 T2 T1 N 1986–1998
1998–2008
Bilge (2002)
T2 T2 T2 T3 T3 T3 T2 T3 U 1980–2003
2003–2016
Bilge (2007)
T2 T2 T1 T2
T3 T2 1996 1996–2009
2009–2122
2009–2022
2022–2122
AGE (2010)
T2 T2 T1 T2
T3 T2 1996 1996–2009
2009–2223
2009–2023
2023–2223
Itasca Denver (2011)
T2 T2 T1 T2
T3 T2 1996 1996–2009
2010–2020
2010–2020
AGE (2009)
T2 T3 T2 T3
T2 T3 U 1980–2001
111 years
Barnett and Muller (2008)
T2 T2 T3 T1 T2 T3 T2 T3 T1 Y 1960–1999
1960–1999
Chen (2003)
T2 T3 T3 T3 T3 Y 2007–2008
2010–2129
2010–2028
2029–2129
Aquaterra (2009b)
N – no, Pr – Proterozoic, Q3D – quasi-three dimensional, S – steady state, SR – Surat region, T – transient, Tr – Triassic, T1 – 1st type (Dirichlet) boundary condition, or prescribed head condition, T2 – 2nd type (Neumann) boundary condition, or prescribed flow condition, T3 – 3rd type (mixed) boundary condition, or head-dependent flow condition, U – unknown, WER – Western Eromanga region, WRA – water resource assessment, Y – yes, 2DH – two dimensional horizontal