Review of Economic Valuation of Nature Based Solutions in ...
33
This project has been funded by the European Union’s Horizon 2020 research and innovation programme under grant agreement No. 730243 Review of Economic Valuation of Nature Based Solutions in Urban Areas Marija Bockarjova & W.J. Wouter Botzen (UU) Deliverable 1.3 Part III May 2017
Transcript of Review of Economic Valuation of Nature Based Solutions in ...

This project has been funded by the European
Union’s Horizon 2020 research and innovation
programme under grant agreement No. 730243
Review of Economic Valuation of Nature Based Solutions in
Urban Areas
Marija Bockarjova & W.J. Wouter Botzen (UU)
Deliverable 1.3 Part III
May 2017

2
Table of Contents 1. Introduction .................................................................................................................................... 3
2. Method ............................................................................................................................................ 6
2.1 Literature search ....................................................................................................................... 6
2.2 Structure of the database ......................................................................................................... 7
2.3 Economic typology of valuation of nature ............................................................................... 8
2.4 Valuation method ................................................................................................................... 10
3. Main Findings ................................................................................................................................ 11
3.1 Meta-analysis studies ............................................................................................................. 11
3.2 Primary valuation studies ....................................................................................................... 13
4. Conclusions: Challenges and Perspectives ................................................................................... 16
Literature List .................................................................................................................................... 18
Meta and Review Studies: ............................................................................................................ 18
Primary Economic Valuation Studies: .......................................................................................... 19
APPENDIX .......................................................................................................................................... 27

3
1. Introduction
Following the European Commission (2015, p.24), nature-based solutions (NBS) can be defined as
actions inspired by, supported by, or copied from nature; both using and enhancing existing solutions
to challenges, as well as exploring more novel solutions. They are positive responses to societal
challenges, and can have the potential to simultaneously meet environmental, social and economic
objectives.
Nesshover (2017) positions NBS as an overarching concept that builds on, and supports, other closely
related concepts, such as the ecosystem approach, ecosystem services, ecosystem-based adaptation
and mitigation, green engineering and green and blue infrastructure. All of these concepts recognise
the importance of nature and imply that a systematic approach is needed to environmental
management that considers human actions and their consequences. A key feature of NBS is through
its focus on intervention tackling a societal problem, together with the impact such an intervention
brings along. By building upon these existing concepts, a common framework has been established in
the NATURVATION project to categorise NBS in various domains (ecological and landscape domains),
and in accordance with an ecosystem service classification. See the Appendix for the respective lists of
NBS domains and indicators. This framework is also used in this review of economic values of NBS,
which aims to link values to these classifications and service indicators as much as possible.
A recent report on NBS to climate change adaptation and mitigation (Kabisch et al., 2016b) highlights
the usefulness of applying NBS in an urban context. NBS are becoming more important in the presence
of growing urbanisation worldwide. At the same time, the high level of interconnectedness between
climate change, biodiversity and human health and well-being makes NBS more promising for
addressing urban challenges of today and the future. Important effects of urban green reported by
Kabisch et al. (2016b) are directly related to the regulating services of urban ecosystems, for example,
they may be responsible for temperature cooling effects between 0.5 and 7°C, with an average of 1°C
(Bowler et al., 2010). In particular, the cooling effects of green roofs on ambient air temperatures may
be up to 0.4 and 1.8°C depending on local circumstances, which can bring important economic benefits
to cities by limiting impacts from climate change (Naumann et al. 2011; Estrada et al., 2017).
Additional benefits of urban green surfaces pertain to ecosystem regulating as well as cultural services,
and include, among others, providing habitat for wildlife, retaining stormwater, improving air quality,
and providing space for urban agriculture and recreation. However there are also disadvantages of
urban green. Some of those may be found in the domain of socio-environmental realm, and include

4
ecological disservices such as allergic potential of plant pollens, increased amount of insects and
perceived unsafety of poorly illuminated urban green areas, as well as social inequality and (increased)
gentrification. The latter may be triggered by higher housing prices (both in terms of purchase and
rent) that reflect the value of natural amenities in urban areas (Brander en Koetse, 2011), which in turn
cause a chain of endogenous effects such as self-selection of urban residents and concentration of
higher-income residents near greener areas. This may hamper access of lower-income groups to
natural amenities, and thus social inequality in the ecological domain.
An assessment of the economic values of the potential advantages and disadvantages of particular
NBS can provide relevant insights into possible economic trade-offs that arise in implementing NBS in
cities as well as the economic feasibility of policies aimed at expanding NBS. However as Naumann et
al. (2011) pointed out, there is a lack of a systematic quantification of ecosystem service benefits in
projects involving ecosystem solutions, such as NBS for climate change. In particular, there exists a
large discrepancy between the quantification of costs and benefits of ecosystem service projects. On
the one hand, project costs generally appear to be well-defined and directly expressed in monetary
terms. On the other hand, project benefits of NBS are less clearly defined; often such benefits are not
assessed and if they are then benefits are often expressed in qualitative terms.
Multiple functions and benefits offered by NBS are of a long-term character and stretch to the social
and ecological domains (e.g. habitat protection, recreational opportunities). Creating awareness and
developing an evidence base of quantitative estimates of benefits connected to the introduction of
natural amenities remain critical issues for the assessment of policy and practical solutions aimed at
implementing NBS. A lack of monetary values for natural amenities prevents a comprehensive
assessment of project costs and benefits which may lead to sub-optimal policy decisions. This
highlights the need for assessing the benefits associated with natural solutions in a comprehensive
manner. For example, Raymond et al. (2017) provides an attempt at setting out a comprehensive
framework for the assessment of NBS interventions and their impacts.
The NATURVATION project aims at developing a comprehensive NBS assessment tool for urban areas.
Monetary values of NBS can be an important input for the development of such a tool in order to
enable assessment of the economic implications of NBS in relation to ecological and societal effects.
This deliverable report describes the review of economic values of NBS, for which the European
Commission’s definition of NBS was adopted. Economic valuation of natural ecosystems and their
services or goods has proven to be relevant for a number of reasons. To mention a few, economic
valuation can be used to make trade-offs comparable and therefore enable well-informed decisions

5
concerning nature and the creation of NBS. Moreover, assessing monetary values of NBS allows for
comparing different stocks of natural infrastructure and their services. Finally, a monetary value can
be used for communicating the importance of natural resources relative to other costs and benefits of
intended interventions. This report adds to the evidence base of NBS values on the junction of nature
and man-made infrastructure, economy and society.
In particular, the report describes a database on economic values of NBS which has been created on
the basis of a literature review (and is available online at www.naturvation.eu). This database
addresses existing knowledge gaps (Kabisch et al. 2016a) by linking reported economic values to
ecosystem services, ecological domains, landscape types and other relevant classifications. It can
therefore be used to inform science, policy and practice on various facets of NBS, for example the
economic values of particular ecosystem services and functions which NBS can fulfil. See Appendix for
summary tables describing the database. A next step in the NATURVATION project is a comprehensive
assessment of NBS impacts (see for example Raymond et al., 2017), for which the review in this report
provides input for the assessment of the economic values of these impacts.

6
2. Method
2.1 Literature search
The review of economic values of NBS focusses on both values of existing nature in cities and values of
particular NBS interventions, such as installing green roofs. There exists ample literature offering
various approaches to the assessment of economic values of services provided by natural ecosystems
or natural infrastructure. As a first step, we have reviewed qualitative and quantitative overview
publications, such as literature review articles and meta-analyses, respectively (see the literature list
below). Next, the search continued by looking into primary economic valuation studies of nature at
particular case study sites (listed separately below). We chose to search for papers that applied the
most commonly used methods for economic value assessment of environmental goods: namely, (i) the
revealed preference method, (ii) the stated preference method and (iii) the benefit transfer method.
The revealed preference method allows us to induce values of nature from observed data which is
based on market transactions and prices (which are housing prices in this case). The stated preference
method allows to elicit values of nature that are not directly traded on the market, but can be asked
for in a semi-experimental setting, which in turn permits collecting latent information on individual
preferences that otherwise would not be available. The benefit transfer method uses assessments and
values from other studies and applies them to a specific situation or object of valuation. Including all
these methods in our review thus allows us to obtain comprehensive insights into economic values of
nature and its services.
A selection of terms was used in order to search the body of literature for relevant publications on
economic valuation of nature and its services in cities, which included 3 main components: valuation
method, location, and the type of nature / service. The list of search terms used is shown in Table 1
below. The contents of the terms was selected on the basis of the concepts listed in overview papers
(such as Nesshover et al., 2017) as well as in individual publications. Combinations of these three types
of terms were used to search articles in publicly accessible databases, such as EVRI, ENVALUE, and the
search engines Google Scholar and Scopus. Moreover, articles for the review were selected by checking
cross-references in relevant articles. The database lists all papers that were found except a few in
which no monetary values were stated, and finally contains 105 papers and 255 value
entries/observations.
The review of economic values of NBS for the NATURVATION project consists of two phases. The
current report deals with the first phase, which consists of creating an open-access database of
Financial and Economic Values of NBS (FEVD), and an accompanying description of the database with

7
a qualitative literature review. In the second phase, the database will be refined for a quantitative
analysis of values in primary valuation papers, which will be carried out as a meta-analysis.
TABLE 1. SEARCH TERMS FOR THE LITERATURE REVIEW
Method Location Type of nature / service
Value
Valuation
Economic value
Stated preferences
Contingent valuation
Dichotomous choice
Choice experiment
Stated choice
Revealed preferences
Hedonic pricing
Housing prices
Urban
City / cities
Local
Community
Natural infrastructure
Green infrastructure
Blue infrastructure
Blue amenities
Terrestrial water
Watershed
Wetlands
Open space
Water assets
Water bodies
Canals
Lakes
Green
Greenbelt
Green roof
Garden
Park
Forest
Natural
Nature
Water
Water quality
Ecosystem
Ecosystem services
2.2 Structure of the database
The database is constructed as follows. It consists of three major blocks that describe: (i) bibliographic
reference variables, (ii) type of nature valued and coding according to variables relevant to the
NATURVATION project, and (iii) economic value, its units and the applied estimation method. As
identifications, FEVD contains an observation number and a paper number. Because some papers
reported multiple values, there are more observations in the database (n=255) than papers (n=105).
Bibliographic information entails author name(s) and year of publication. Full references to the
included studies are found in the list of literature below. Furthermore the database includes the time
span of data used in a particular study, and its geographical location (see Table 2). Where applicable,
the database also records the nearest town of data collection.

8
In the second block, the database includes text descriptions of the type of valued nature and its coding
following a conceptual framework developed within the NATURVATION project. Nature types were
thus coded in 9 categories from ecological domains (see Table A1), and 14 types of landscapes (see
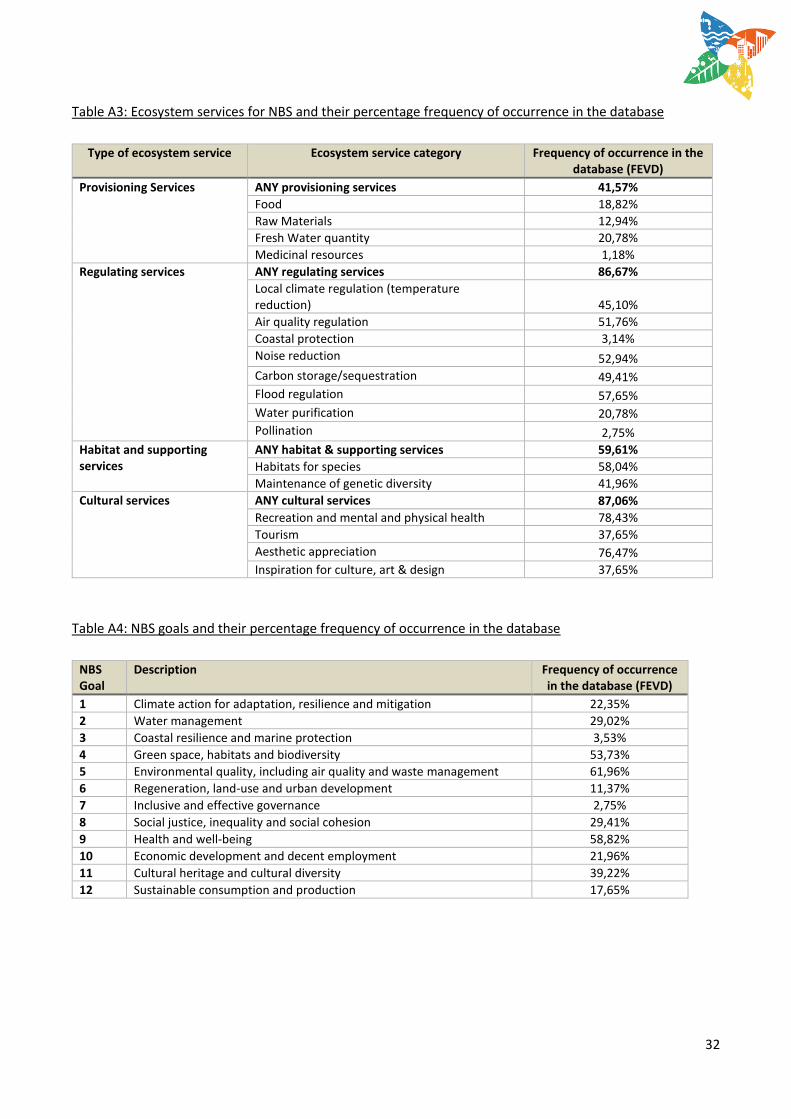
Table A2). Next, each entry to the database is characterised by the type of ecosystem service that it
provides. 4 main ecosystem service types are coded (provisioning, regulating, cultural, and habitat and
supporting services), as well as their sub-categories (see Table A3). Connected to ecosystem services
is the typology of economic values that distinguishes direct use value, indirect use value, non-use value
and option value (see Section 2.3 of this paper). FEVD also contains a coding of valued nature and its
services according to NBS goals that are derived from sustainability-related goals (see Table A4). Other
indicators that are included, where applicable, are the temporal and spatial scales of the valuation
study (see Table A5), as well as the agent type for which the valuation was conducted (see Table A6).
The final block of the database lists the values of nature and its services extracted from the collected
studies and their units. If a monetary unit was used, it also states the valuation year. For the units
valued, the database records its metrics (e.g. per ha, per ton, per entry) and payment frequency (per
month, per year, one-time payment). Average study housing prices and their monetary unit and year
are reported for values obtained with hedonic pricing models. Finally, the applied methods to obtain
the value of nature or its service are listed.
2.3 Economic typology of valuation of nature
The economic discipline uses a different typology of valuation when approaching value assessment
than ecology. In particular, this typology is different from functions such as the provisioning, regulating
and cultural functions typology used in ecology when natural resources or their benefits are assessed.
In connection to valuation of nature, Hein et al. (2006) provide a link between the ecological and
economic typologies of values and functions, as shown in Figure 1. While the three ecosystem services
as presented by Hein et al. (2006) do not coincide with the four ecosystem functions as used in this
project, it provides a useful framework for linking ecological services to economic value types. As an
aside, habitat and supporting services that are separately presented in our project framework, are part
of provisioning services as presented by Hein et al. (2006).
Figure 1 tells us that the economic value typology cuts a different cross-section when compared to
ecological function types. In value assessments the major distinction in economics is made between
use values, non-use values and option values (an explanation follows below). First, whereas the
economic value typology hinges on the utilitarian or usability principle of goods and services, the
ecological typology is directly related to the function types offered by natural ecosystems. Second, all

9
ecosystem functions have various economic values, be it direct use values, indirect use values, non-
use values or option values:
Direct use values arise from human direct utilization of ecosystems, through the sale or
consumption of a good, such as a piece of fruit or clean water. All production services, and some
cultural services (such as recreation) have direct use values.
Indirect use values stem from the indirect utilization of ecosystems, in particular through the
positive externalities that ecosystems bring. This reflects the type of benefits that regulation
services provide to society. For example, these are decreased flood risk or better climate
conditions.
Option values arise because even when people are unsure about their future demand for a
service, they are willing to pay to keep open the option of using a resource in the future, or to
avoid irreversible negative impacts on the resource (the latter is sometimes referred to as
quasioption value). This reflects some degree of risk aversion. Option values may be attributed
to all use and non-use values, and thus to all services supplied by an ecosystem. I.e. an option
value may presume the preservation of the service to be used in the future, be it a provisioning,
regulatory, cultural or habitat service, and it is independent of whether this service is being
utilised at present or not.
Non-use values are derived from attributes inherent to the ecosystem itself and can be
anthropocentric (like aesthetic beauty), as well as ecocentric (i.e. related to the notion that animal and
plant species may have a certain right to exist). Three sub-types of non-use value are distinguished and
reflect various motivations of stakeholders involved: existence value (based on utility derived from
knowing that something exists), altruistic value (based on utility derived from knowing that somebody
else benefits) and bequest value (based on utility gained from future improvements in the well-being
of one’s descendants).
While the different categories of economic value typology may sometimes be difficult to separate,
both conceptually and empirically, the above list is helpful because it can serve as a roadmap for
reviewing economic literature on nature assessment. Hence the FEVD also contains a coding of the
economic typology of the values included in the database.

10
Figure 1. Connection between ecosystem service types and economic values in value assessments.
Source: Hein et al. (2006)
2.4 Valuation method
With regards to methods that were selected for this review, it is important to reflect upon which values
each method can measure. Revealed preference studies, and hedonic pricing in particular1, are based
on actual observations of market exchanges, which are in this case housing prices based on sale
transactions. From these prices, and based on econometric inference, one aims to extract information
about household preferences towards the nature component of a house or its location. In particular,
for the purpose of this overview and the value of NBS, studies were selected that estimated the
relation between housing prices and natural amenities present in the vicinity of houses, while
controlling for other variables of influence on housing prices. Values of nature obtained by means of
this method reflect direct and indirect use values which are capitalized in the housing prices.
Methods that belong to the stated preferences domain are the contingent valuation method and the
(discrete) choice modelling method. These methods are particularly suitable for valuing goods and
services that are not directly traded on the market. They are based on willingness-to-pay or willingness-
to-accept measures, and usually ask individuals to state their preference (e.g. a maximum willingness-
1 The revealed preference method includes an array of methods such as market prices (direct valuation method) and travel costs, avoided costs and hedonic pricing (indirect valuation methods). The hedonic pricing method is mainly used in academic studies in recent decennia and is considered a state-of-the-art revealed preference method.

11
to-pay amount) in a hypothetical situation that involves such non-traded goods or services. For
example, individual preferences for an increase in municipal taxes that are expected to lead to better
water quality in public water bodies, or to more green on the streets. Such choices in turn reflect
personal preferences from which monetary values of nature and its services can be derived. Such
methods can elicit all economic values connected to NBS, namely direct and indirect use values, and
non-use and option values. However, in some settings, only a specific value can be elicited, such as
conservation of a natural park or a species, which would correspond to an option value. The benefit
transfer method borrows or applies values from existing studies to a particular situation or object of
valuation. Because original studies may differ in the applied assessment methods, benefit transfer
methods depend on the values and approaches used in the original studies.
In summary, an advantage of the stated preference techniques is that they can elicit a total value of
NBS, i.e. combined use, non-use and option value. A disadvantage is that they are based on
hypothetical choices, which may result in uncertainty of the value estimate. At the same time, while
hedonic price modelling can elicit a more refined estimate of only the direct and indirect use values of
NBS, its advantage is that it is based on real transactions. Given the particular advantages and
disadvantages of each method, we decided to include NBS values elicited by both methods in the
database and to record the method that was used in the original valuation study. Moreover, a number
of studies using the benefit transfer method are included.
3. Main Findings
3.1 Meta-analysis studies
First of all it has become clear from the review that a good basis exists of studies that elicited values
of a variety of ecosystem services and NBS in cities. An example is the meta-analyses of values of green
and blue open spaces in urban areas conducted by Brander & Koetse (2011). In a meta-analytic setting,
researchers collect studies that provide value estimates of the same good or service, and attempt at
explaining differences between studies based on a number of explanatory variables. For example,
Brander & Koetse (2011) examined the value of distance to the open space in urban areas expressed
in US dollars per 10m, and estimated how this value is dependent on study characteristics (type of
open space, functional form of estimated regression, distance at which and for which the estimate was
done) as well socio-economic and geographical characteristics (price level, population density and
location). Results of a meta-analysis can be used for benefit transfer purposes in which representative
values from the broader literature are applied to a particular case study site in cases where no good
location-specific value exists.

12
A great variety of values have already been collected by meta studies that report meta-values based
on multiple studies from multiple contexts and locations.. Just to name a few, a value of a hectare of
an urban forest is found to be about 1500 USD (Brander and Koetse, 2011), the recreational value of 1
hectare of coastal ecosystem is 4700 USD (Ghermandi and Nunes, 2013), a ton of sequestrated carbon
is at least 125 USD (van der Bergh and Botzen, 2014), and 1 m2 of green roofs is valued between 290
USD and 700 USD (Bianchini and Hewage, 2012). In some cases, the unit value of nature decreases
with its size and distance to the nature. Higher population density causes nature to be valued higher,
probably due to its relative scarcity. Interestingly, while studies which value solely blue amenities are
not great in number, the reviewed studies reveal that the presence of blue infrastructure per se has a
relatively high value. This is, for example, shown by Luttik (2000) who finds that property prices are
highest for houses located in the vicinity of, or overviewing water bodies; and by Brander et al. (2006)
who found that water quality improvements are valued the highest in wetland valuation studies.
Brander et al. (2013) analyse values for wetland ecosystems in a meta-analysis, and present a list of
values, depending on the service valued, and region. Overall, mean values are found to be 7,000 USD
per ha per year for flood control, 3,400 USD per ha per year for water supply and 5,800 USD per ha per
year for water quality services. It is important to notice here, that values found by Brander et al. (2013)
have a wide range, which implies caution should be taken in applying benefit transfer. As an
illustration, their own attempt at valuing wetland services worldwide resulted in a figure of 26.5 billion
USD per year, with a confidence interval between 20.2 and 4.7 billion USD on a yearly basis.
However, while meta-analyses can be very useful, most existing reviews and meta-analyses are limited
in that they report aggregated values for a certain size of blue or green nature, but do not satisfactorily
cover particular ecosystem functions. This hampers linking values of nature to its specific functions
which are useful for valuing specific NBS types in the framework of the NATURVATION project. Our
database aims to fill this gap, by trying to better link values to specific functions and NBS types.
13
3.2 Primary valuation studies
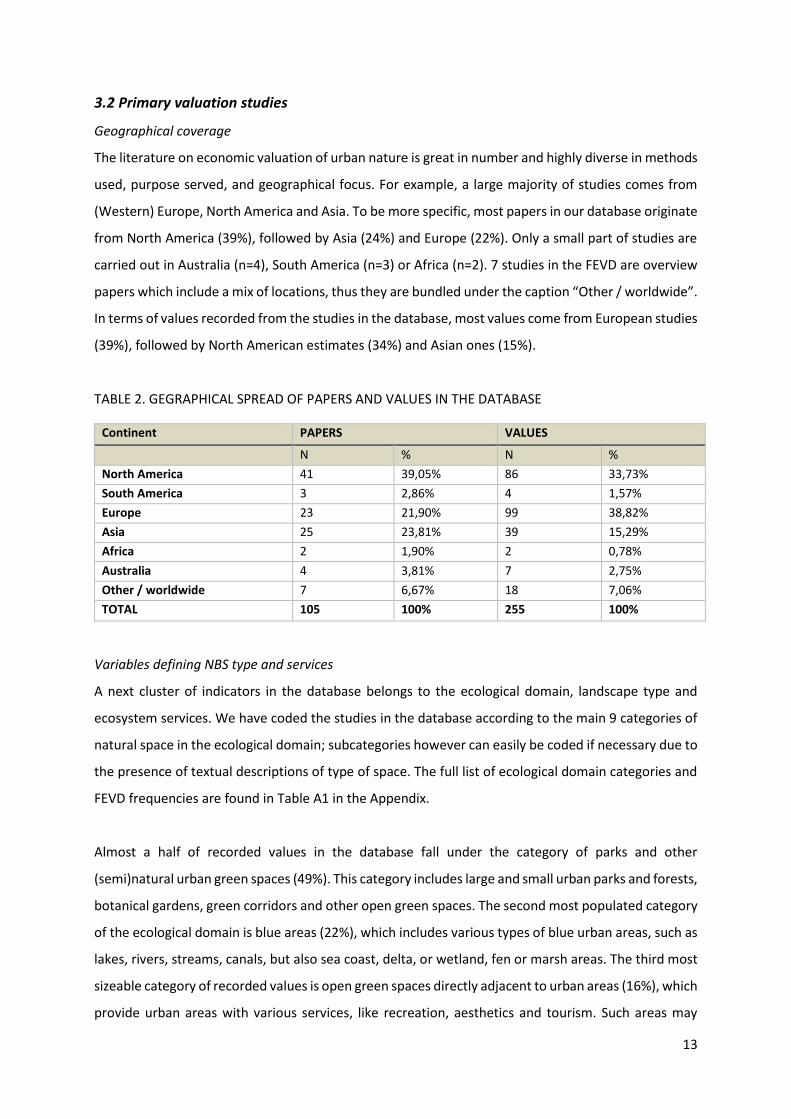
Geographical coverage
The literature on economic valuation of urban nature is great in number and highly diverse in methods
used, purpose served, and geographical focus. For example, a large majority of studies comes from
(Western) Europe, North America and Asia. To be more specific, most papers in our database originate
from North America (39%), followed by Asia (24%) and Europe (22%). Only a small part of studies are
carried out in Australia (n=4), South America (n=3) or Africa (n=2). 7 studies in the FEVD are overview
papers which include a mix of locations, thus they are bundled under the caption “Other / worldwide”.
In terms of values recorded from the studies in the database, most values come from European studies
(39%), followed by North American estimates (34%) and Asian ones (15%).
TABLE 2. GEGRAPHICAL SPREAD OF PAPERS AND VALUES IN THE DATABASE
Continent PAPERS VALUES
N % N %
North America 41 39,05% 86 33,73%
South America 3 2,86% 4 1,57%
Europe 23 21,90% 99 38,82%
Asia 25 23,81% 39 15,29%
Africa 2 1,90% 2 0,78%
Australia 4 3,81% 7 2,75%
Other / worldwide 7 6,67% 18 7,06%
TOTAL 105 100% 255 100%
Variables defining NBS type and services
A next cluster of indicators in the database belongs to the ecological domain, landscape type and
ecosystem services. We have coded the studies in the database according to the main 9 categories of
natural space in the ecological domain; subcategories however can easily be coded if necessary due to
the presence of textual descriptions of type of space. The full list of ecological domain categories and
FEVD frequencies are found in Table A1 in the Appendix.
Almost a half of recorded values in the database fall under the category of parks and other
(semi)natural urban green spaces (49%). This category includes large and small urban parks and forests,
botanical gardens, green corridors and other open green spaces. The second most populated category
of the ecological domain is blue areas (22%), which includes various types of blue urban areas, such as
lakes, rivers, streams, canals, but also sea coast, delta, or wetland, fen or marsh areas. The third most
sizeable category of recorded values is open green spaces directly adjacent to urban areas (16%), which
provide urban areas with various services, like recreation, aesthetics and tourism. Such areas may

14
include farm- or agricultural land, woodlands, fields, golf courses and other sizeable areas of nature in
the direct vicinity of urban areas. The fourth biggest category is external building greens (6%) mainly
consisting of values connected to green roofs in our database. Other categories are green areas for
water management (3%) including watersheds and urban drainage systems; urban green areas
connected to grey infrastructure (2%), including alleys and street trees, green parking lots or riverbank
green space; and derelict areas (1%).
According to the landscape classification (see the corresponding definitions and statistics in Table A2),
4 types that are most frequent in our database of valued nature are woodscape (37%), parkscape
(18%), waterscape (13%) and farmscape (12%). These are followed by riverscape (9%) and coastalscape
(7%). Note, that landscape categories are not exclusive. For example mixed blue and green landscapes
are coded in two categories; also areas with multiple landscapes like a national park received multiple
coding entries according to their constituent parts.
Ecosystem services were mostly coded in multiple categories, because most of the NBS valued offer
multiple services to the urban areas. Note here, that in most, but not all studies, valued or presumed
services were explicitly listed. If that was not the case, then the coding was left to the discretion of the
researcher, and the coding was done and checked by two researchers. In 41% of valued NBS,
provisioning services were present, in 87% of the cases regulating services and cultural services (not
necessarily the same cases) were present, and in 60% of the cases the ecosystem services were habitat
and supporting services.
The classification of NBS goals also often included multiple goals per valuation unit, because a single
kind of NBS may target multiple goals. This coding, in most cases, was to the discretion of the
researcher as few original studies mention such goals explicitly. Most frequently occurring goals in our
database are environmental quality, including air quality and waste management (62%), health and
well-being (59%), green space, habitat and biodiversity (54%), cultural heritage and cultural diversity
(39%), and water management (29%).
Furthermore, where possible, we have coded the spatial and temporal scales of NBS valuation.
Concerning the spatial scale, most (82%) of the valuations took place on a meso-level (metropolitan /
urban), and substantially less studies were conducted on the micro level (district / neighbourhood) or
sub-micro level (street / house), with 12% each. A few (5%) of the valuations were carried out on a
macro-level (national / global), which are mainly meta-analyses or similar kinds of valuations.

15
Various methods use various temporal scales to assess the value of nature. In most cases, methods
applied were using either immediate time frame (19%) or long-term time frame referring to values in
terms of periods of longer than 3 years (21%). The latter is due to studies that evaluated the total (or
discounted) value of a natural asset or its services by expressing it in present value terms. 7% and 9%
of the valuations, respectively, were valued in the short-term (weeks / months) or medium term period
(1-3 years).
Moreover, we have attempted to code the agent types for which the NBS valuation was conducted. 3
broad categories were identified, i.e. individuals (19%), households (57%) and groups / population of
a specified area (24%). The type of agent was to a large degree connected to the valuation method
used. So, hedonic pricing relates to household agents because such valuations are based on housing
prices. On the other hand, the stated preference method is mostly associated with individual agents
since most willingness-to-pay survey questions are asked to individuals. All of the identified agent
types belong to the private sector on a more aggregated level of categorisation.
Values of NBS in the database
A great variety of values have been collected and recorded in the database. The values are however
highly heterogeneous both in their magnitude and the unit of measurement. The latter applies to the
currency, the base year of measurement, the physical unit (e.g. per hectare, per tree, per meter of
distance), and the time unit (i.e. a recurring payment such as per year, or a one-time payment such as
total value of an asset or an entry price). This makes it difficult to provide a simple overview of the
values collected in the database. Nevertheless, we shall attempt to reflect on some values, per
ecological category.
Studies that apply hedonic price modelling (revealed preference method) use relatively homogeneous
and easily comparable value units, which are often expressed in % value change of property depending
on the presence of, or distance from, urban nature. We will first discuss these studies. In particular we
find that housing prices decrease on average by 2.11% as the distance to parks and natural green urban
areas (which make up a half of observations in the database) increases by 100m. An increase in
distance to urban blue areas is valued at about the same level, namely on average at 1.91% of a house
price. However, distance to peri-urban open space in our database is valued at about the half of the
latter, namely on average at 0.82% of the property price. Specific absolute monetary values depend
on the local currency and the level of local property prices. In most cases, the unit value of nature
decreases with its size and distance to the nature. Higher population density causes nature to be
valued higher, which is due to its higher relative scarcity.

16
Values of external building greens are presented in various units. For example, the discounted present
value of 1 m2 of green roofs is valued at between 290 USD and 700 USD (Bianchini and Hewage, 2012).
Other recorded values include discounted values per 1 m2 of various ecosystem services that green
roofs provide (ibid), such as air purification and recreation; or yearly values of ecosystem services per
1 m2, such as flood reduction and mitigation of the urban heat island effect.
Furthermore, a number of values of urban blue are estimated with the value or benefit transfer
method, and also resemble similar measurement units. Brander et al. (2006) estimate the value of
wetlands at 2800 USD per ha per year; Brander et al. (2007) estimate the recreational value of a coral
reef at 3725 USD per ha per year; and Ghermandi and Nunes (2013) estimate the recreational value of
a coastal area at 4700 USD per ha per year. Moreover, Brenner et al. (2010) estimate an array of values
of coastal areas, split by ecosystem service, which range from 20 USD per ha per year for soil formation
to 77000 USD per ha per year for disturbance regulation.
In sum, while the current overview of economic valuation studies on urban nature is by no means
complete and offers a selection of studies, it reveals a great variability in services valued and metrics
used in expressing the values. This is mainly due to differences in the valuation methods used and goals
of a particular study. It makes a simple comparison of values between and across studies difficult.
Nevertheless, the database presents a useful overview of the palette of values attached to urban
nature, valued at various circumstances, and for different purposes.
The meta-analysis to be conducted later on in the project for WP3 will aim to create consistent value
metrics for specific NBS types and functions. We are confident that this will be possible with a more
detailed categorization of studies in the current database in terms of aggregated NBS domains, like
green and blue. However, it remains to be seen whether sufficient individual estimates per function
exist for making a reliable more detailed link between values and functions for several NBS types.
4. Conclusions: Challenges and Perspectives
The current literature review of economic valuation studies on urban nature and the constructed
database offer an evidence base for deriving economic values of NBS based on a selection of studies
of economic values of nature in urban areas. These values were estimated with methods that are
widely used in the discipline of environmental economics which encompass the broad range of
economic value typologies from use and non-use values.

17
This overview and database fill the gap in the NBS-related literature in so far that we have gathered
academic studies focusing on a quantification and monetisation of nature and its benefits in an urban
context in relation to specific NBS domains and functions. Our selection reveals a large variability in
services valued and metrics used in expressing the values of nature and its services. This is mainly due
to differences in the valuation methods used and purposes served by a particular study. This
heterogeneity hampers making a congruent comparison of collected values between and across
studies. Notwithstanding, this review report and database aim to present a useful overview of a palette
of values attached to urban nature, valued at various circumstances, and for different purposes, which
can subsequently be used for benefit transfer purposes.
Economic values of urban nature present in the database cover a variety of landscapes, goals and
services. In terms of landscapes, most values are attributes to parkscape, woodscape and farmscape,
as well as to water surfaces such as waterscape, riverscape and coastalscape. Ecological domains
include urban parks and (semi)natural urban green areas, blue areas, peri-urban open space areas and
external building greens. Valued services are mainly (i) regulating services, including local climate
regulation, air quality regulation, noise reduction, carbon storage and water purification; and (ii)
cultural services, including recreation, tourism and aesthetics. Goals (to be) targeted by interventions
include environmental quality; green spaces; and health and well-being. Agents involved in nature
valuation are individuals, households and a group or population of a specified area.
The meta-analysis to be conducted later on in the NATURVATION project for WP3 will try to create
consistent value metrics for selected NBS types and functions. We are confident that this will be
possible in terms of aggregated NBS domains like green and blue, but a potential obstacle is that
perhaps insufficient individual estimates per function exists for making a reliable more detailed link
between values and functions for several NBS types.

18
Literature List
Estrada, F., Botzen, W.J.W., Tol, R. (2017). A global economic assessment of city policies to reduce
climate change impacts. Nature Climate Change (In press).
European Commission (2015) Towards an EU Research and Innovation policy agenda for Nature-Based
Solutions & Re-Naturing Cities. Final Report of the Horizon 2020 Expert Group on ‘Nature-Based
Solutions’ and Re-Naturing Cities. Directorate-General for Research and Innovation
Meta and Review Studies:
Bergh J. C. J. M. van den & W. J. W. Botzen (2014) A lower bound to the social cost of CO2 emissions.
Nature Climate Change 4: 253–258.
Bianchini F., Kasun Hewage (2012) Probabilistic social cost-benefit analysis for green roofs: A lifecycle
approach. Building and Environment 58: 152-162.
Bowler, D.E., Lisette Buyung-Ali, Teri M. Knight, Andrew S. Pullin (2010) Urban greening to cool towns
and cities: A systematic review of the empirical evidence. Landscape and Urban Planning 97(3): 147-
155.
Brander L., Roy Brouwer, Alfred Wagtendonk (2013) Economic valuation of regulating services
provided by wetlands in agricultural landscapes: A meta-analysis, Ecological Engineering 56: 89-96.
Brander LM, Koetse MJ. (2011) The value of urban open space: meta-analyses of contingent valuation
and hedonic pricing results. Journal of Environmental Management 92(10):2763-73.
Brander, L.M., Beukering van, P.,Cesar, H.S.J. (2007) The recreational value of coral reefs: a meta-
analysis. Ecological Economics 63: 209-218.
Brander, L.M., Florax, R.J.G.M. & Vermaat, J.E. (2006) The Empirics of Wetland Valuation: A
Comprehensive Summary and a Meta-Analysis of the Literature. Environmental and Resource
Economics 33: 223.
Ghermandi A., Paulo A.L.D. Nunes (2013) A global map of coastal recreation values: Results from a
spatially explicit meta-analysis, Ecological Economics 86: 1-15.
Gómez-Baggethun E., Barton D.N. (2013) Classifying and valuing ecosystem services for urban
planning. Ecological Economics 86: 235-245.
Haase, D., Larondelle, N., Andersson, E. et al. (2014) A Quantitative Review of Urban Ecosystem Service
Assessments: Concepts, Models, and Implementation. AMBIO 43:413.
Hein, L., Kris van Koppen, Rudolf S. de Groot, Ekko C. van Ierland (2006) Spatial scales, stakeholders
and the valuation of ecosystem services. Ecological Economics 57(2): 209-228.

19
Kabisch N., Jutta Stadler, Horst Korn and Aletta Bonn (2016b) Nature-based solutions to climate change
mitigation and adaptation in urban areas. German Federal Agency for Nature Conservation. BfN
Report 446.
Kabisch, N., N. Frantzeskaki, S. Pauleit, S. Naumann, M. Davis, M. Artmann, D. Haase, S. Knapp, H. Korn,
J. Stadler, K. Zaunberger, and A. Bonn (2016a) Nature-based solutions to climate change mitigation
and adaptation in urban areas: perspectives on indicators, knowledge gaps, barriers, and
opportunities for action. Ecology and Society 21(2):39
Naumann, S., G. Anzaldua, P. Berry, S. Burch, M. Davis, A. Frelih-Larsen, H. Sanders, and M. Gerdes.
(2011) Assessment of the potential of ecosystem-based approaches to climate change adaptation
and mitigation in Europe. Final report to the European Commission. Ecologic Institute, Berlin,
Germany and Environmental Change Institute, Oxford University Centre for the Environment,
Oxford, UK.
Nesshöver C., Assmuth T., Irvine K.N., Rusch G.M., Waylen K.A., Delbaere B., Haase D., Jones-Walters
L., Keune H., Kovacs E., Krauze K., Külvik M., Rey F., van Dijk J., Vistad O.I., Wilkinson M.E., Wittmer
H. (2017) The science, policy and practice of nature-based solutions: An interdisciplinary
perspective. Science of the Total Environment 579: 1215–1227.
Raymond, C.M., Berry, P., Breil, M., Nita, M.R., Kabisch, N., de Bel, M., Enzi, V., Frantzeskaki, N.,
Geneletti, D., Cardinaletti, M., Lovinger, L., Basnou, C., Monteiro, A., Robrecht, H., Sgrigna, G.,
Munari, L. and Calfapietra, C. (2017) An Impact Evaluation Framework to Support Planning and
Evaluation of Nature-based Solutions Projects. Report prepared by the EKLIPSE Expert Working
Group on Nature-based Solutions to Promote Climate Resilience in Urban Areas. Centre for Ecology
& Hydrology, Wallingford, United Kingdom. 82p.
Primary Economic Valuation Studies:
Alvarez, S.; Asci, S.; Vorotnikova, E. (2016) Valuing the Potential Benefits of Water Quality
Improvements in Watersheds Affected by Non-Point Source Pollution. Water 8: 112.
Anderson, S.T., West, S.E. (2006) Open space, residential property values, and spatial context. Regional
Science and Urban Economics 36: 773-789.
Anthon, S., Thorsen, B.J., Helles, F. (2005) Urban-fringe afforestation projects and taxable hedonic
values. Urban Forestry & Urban Greening 3(2): 79-91.
Barton D.N. (2002) The transferability of benefit transfer: contingent valuation of water quality
improvements in Costa Rica. Ecological Economics 42(1–2): 147-164.
Been, V., Voicu I. (2006) The Effect of Community Gardens on Neighboring Property Values, New York
University Law and Economics Working Papers. Paper 46.

20
Bengochea-Morancho, A. (2003) A hedonic valuation of urban green areas. Landscape and Urban
Planning 66: 35-41.
Bergstrom, J.C., Dillman, B.L., Stoll, J.R. (1985) Public environmental amenity benefits of private land:
the case of prime agricultural land. Southern Journal of Agricultural Economics 17: 139-149.
Bishop, K. (1992) Assessing the benefits of community forests: an evaluation of recreational use
benefits of two urban fringe woodlands. Journal of Environmental Planning and Management 35:
63-76.
Bolitzer, B., Netusil, N.R. (2000) The impact of open spaces on property values in Portland, Oregon.
Journal of Environmental Management 59: 185-193.
Bowker, J.M., Diychuck, D.D. (1994) Estimating the nonmarket benefits of agricultural land retention
in eastern Canada. Agricultural and Resource Economic Review 23: 218-225.
Breffle, W.S., Morey, E.R., Lodder, T.S. (1998) Using contingent valuation to estimate a
neighbourhood’s willingness to pay to preserve undeveloped urban land. Urban Studies 35: 715-
727. Brenner, J. Jimenez, J.Sarda, R.Garola, A. (2010) An assessment of the non-market value of the
ecosystem services provided by the Catalan coastal zone. Ocean & Coastal Management 53: 27-38.
Bueno, E.A., Ancog, R., Obalan, E. et al. (2016) Measuring Households’ Willingness to Pay for Water
Quality Restoration of a Natural Urban Lake in the Philippines. Environmental Processes 3(4): 875-
894.
Chau, C.K., M.S. Tse, K.Y. Chung (2010) A choice experiment to estimate the effect of green experience
on preferences and willingness-to-pay for green building attributes. Building and Environment
45(11): 2553-2561.
Chaudhry, P., Tewari, V.P., Singh, B. (2008) WTP vs WTA for assessing the recreational benefits of urban
forests: a case from a modern and planned city of a developing country. Forests, Trees and
Livelihoods 18(3): 215-231.
Chen W.Y. (2017) Environmental externalities of urban river pollution and restoration: A hedonic
analysis in Guangzhou (China). Landscape and Urban Planning 157: 170-179.
Chen, M. (2005) Evaluation of Environmental Services of Agriculture in Taiwan. National Taiwan
University, Taipei, Taiwan
Chen, W.Y., J Aertsens, I. Liekens, S. Broekx, L. de Nocker (2014) Impact of Perceived Importance of
Ecosystem Services and Stated Financial Constraints on Willingness to Pay for Riparian Meadow
Restoration in Flanders (Belgium). Environmental Management 54(2): 346-359
Chen, W.Y., Jim C.Y. (2012) Contingent valuation of ecotourism development in country parks in the
urban shadow. International Journal of Sustainable Development & World Ecology 19(1): 44-53.
Cho, Seong-Hoon, Neelam C. Poudyal, Roland K. Roberts (2008) Spatial analysis of the amenity value
of green open space. Ecological Economics 66: 403–416.

21
Chui, T.F.M., W.Y. Ngai (2016) Willingness to Pay for Sustainable Drainage Systems in a Highly
Urbanised City: a Contingent Valuation Study in Hong Kong. Water and Environment Journal 30(1-
2): 62-69.
Correll, M.R., Lillydahl, J.H., Singell, L.D. (1978) The effects of greenbelts on residential property values:
some findings on the political economy of open space. Land Economics 54: 207-217.
Czembrowski, P., Kronenberg J. (2016) Hedonic pricing and different urban green space types and sizes:
Insights into the discussion on valuing ecosystem services. Landscape and Urban Planning 146: 11-
19.
Dare, A.M., Ayinde, I.A., Shittu, A.M. (2015) Urban trees forest management in Abeokuta Metropolis,
Ogun State, Nigeria: An application of contingent valuation method. Management of Environmental
Quality: An International Journal 26(1): 72-83.
Dumenu, W.K. (2013) What are we missing? Economic value of an urban forest in Ghana. Ecosystem
Services 5: 137-142.
Ezebilo E. (2016) Willingness to Pay for Maintenance of a Nature Conservation Area: A Case of Mount
Wilhelm, Papua New Guinea. Asian Social Science 12(9): 149-161.
Fleischer, A., Tsur, Y. (2000) Measuring the recreational value of agricultural landscape. European
Review of Agricultural Economics 27, 385-398.
Fleischer, A., Tsur, Y. (2004) The Amenity Value of Agricultural Landscape and Rural/Urban Land
Allocation. Discussion Paper No. 5.04. The Center for Agricultural Economic Research, The Hebrew
University of Jerusalem, Jerusalem.
Frey, E., Palin, M., Walsh, P., Whitcraft, C. (2013). Spatial Hedonic Valuation of a Multi-use Urban
Wetland in Southern California. Agricultural and Resource Economics Review 42(2): 387-402.
Giergiczny, M., Jakub Kronenberg (2014) From Valuation to Governance: Using Choice Experiment to
Value Street Trees. AMBIO 43: 492–501.
Hanley, N.D., Wright, J.L. (1992) Valuing the environment: recent UK experience and an application to
Green Belt land. Journal of Environmental Planning and Management 35: 145-160.
Herath, S., Choumert, J. & Maier, G. (2015) The value of the greenbelt in Vienna: a spatial hedonic
analysis. The Annals of Regional Science 54: 349.
Ichihara, K., Cohen, J.P. (2011) New York City property values: what is the impact of green roofs on
rental pricing? Letters in Spatial and Resource Science 4: 21.
Jim, C.Y., Chen, W.Y. (2006) Recreation-amenity use and contingent valuation of urban greenspaces in
Guangzhou, China. Landscape and Urban Planning 75: 81-96.
Jin, J., Jiang, C., and LI, L. (2013) The economic valuation of cultivated land protection: A contingent
valuation study in Wenling City, China. Landscape and Urban Planning 119: 158-164.

22
Kenney, M. A., Wilcock, P. R., Hobbs, B. F., Flores, N. E. Martínez, D. C. (2012) Is Urban Stream
Restoration Worth It? Journal of the American Water Resources Association 48: 603–615.
Kim D-H, Ahn B-I, Kim E-G. (2016) Metropolitan Residents’ Preferences and Willingness to Pay for a Life
Zone Forest for Mitigating Heat Island Effects during Summer Season in Korea. Sustainability 8(11):
1155.
Kim, J.H., Kim, SN., Doh, S. (2015) The distance decay of willingness to pay and the spatial distribution
of benefits and costs for the ecological restoration of an urban branch stream in Ulsan, South Korea.
The Annals of Regional Science 54(3): 835-853.
Kim, Y., Johnson, R.L. (2002) The Impact of forests and forest management on neighboring property
values. Society and Natural Resources 15: 887-901.
Krieger, D. (1999) Saving Open Spaces: Public Support for Farmland Protection. Working Paper Series
WP 99e1. Center for Agriculture in the Environment, Northern Illinois University, Chicago.
Kwak, S.J., Yoo, S.H., Han, S.Y. (2003) Estimating the public’s value for urban forest in the Seoul
metropolitan area of Korea: a contingent valuation study. Urban Studies 40: 2207-2221.
Lantz, Peter v., C. Boxall, M. Kennedy, J. Wilson (2013) The Valuation of Wetland Conservation in an
Urban/peri Urban Watershed. Regional Environmental Change 13(5): 939-953
Larson, E.K., Perrings, C. (2013) The value of water-related amenities in an arid city: The case of the
Phoenix metropolitan area. Landscape and Urban Planning 109(1): 45-55.
Latinopoulos, D., Mallios, Z., Latinopoulos, P. (2016) Valuing the benefits of an urban park project: A
contingent valuation study in Thessaloniki, Greece. Land Use Policy 55: 130-141.
Leggett, C.G., Bockstael, N.E. (2000) Evidence of the Effects of Water Quality on Residential Land Prices.
Journal of Environmental Economics and Management 39(2): 121-144.
Leng, Z., Lei Y. (2011) Estimate the Forest Recreational Values of Zhangjiajie in China Using a Contingent
Valuation Method. Low Carbon Economy (2): 99-106.
Li, Y., He, L., Xu, W., Wang, H., He, Z. (2013) Using GIS and Hedonic in the modelling of spatial variation
of housing price in Xiamen city. International Review for Spatial Planning and Sustainable
Development 1(4): 29-42.
Lin, I.-H., Wu, C., De Sousa, C. (2013) Examining the economic impact of park facilities on neighboring
residential property values. Applied Geography 45: 322–331.
Lindsey, G., Knaap, G. (1999) Willingness to pay for urban greenway projects. Journal of the American
Planning Association 65, 297-313.
Lo, A.Y., Jim, C.Y. (2010) Willingness of residents to pay and motives for conservation of urban green
spaces in the compact city of Hong Kong. Urban Forestry & Urban Greening 9(2): 113-120.
Lockwood, M., Tracy, K. (1995) Nonmarket economic valuation of an urban recreation park. Journal of
Leisure Research 27: 155-167.

23
Luttik, J. (2000) The value of trees, water and open space as reflected by house prices in the
Netherlands. Landscape and urban planning 48(3): 161-167.
Lutzenhiser, M., Netusil, N.R. (2001) The effect of open spaces on a home’s sale price. Contemporary
Economic Policy 19: 291-298.
Machado, F.H., L.F. Silva, F.A. Dupas, A.P. Mattedi, F.E. Vergara (2014) Economic Assessment of Urban
Watersheds: Developing Mechanisms for Environmental Protection of the Feijão river, São Carlos -
SP, Brazil. Brazilian Journal of Biology 74(3).
Mahmoudi, P., Darla Hatton MacDonald, Neville D. Crossman, David M. Summers, John van der Hoek
(2012) Space matters: the importance of amenity in planning metropolitan growth. The Australian
Journal of Agricultural and Resource Economics 57: 38–59.
Majumdar, S., Deng, J., Zhang, Y., Pierskalla, C. (2011) Using contingent valuation to estimate the
willingness of tourists to pay for urban forests: A study in Savannah, Georgia. Urban Forestry &
Urban Greening 10(4): 275-280.
Mansfield, C., Pattanayak, S.K., McDow, W., McDonald, R., Halpin, P. (2005) Shades of green:
measuring the value of urban forests in the housing market. Journal of Forest Economics 11, 177-
199.
Maxwell, S. (1994) Valuation of Rural Environmental Improvements using Contingent Valuation
Methodology: a Case Study of the Marston Vale Community Forest Project. Journal of
Environmental Management 41(4): 385-399.
McPherson, E.G., Simpson, J.R., Pepper, P.J., Xiao, Q. (1999) Benefit-cost analysis of Modesto’s
municipal urban forest. Journal of Arboriculture 25 (5): 235–248.
Melichar, J., Kaprová K. (2012) Revealing preferences of Prague's homebuyers toward greenery
amenities: The empirical evidence of distance–size effect. Landscape and Urban Planning 109(1):
56-66.
Mell I.C., John Henneberry, Sigrid Hehl-Lange, Berna Keskin (2013) Promoting urban greening: Valuing
the development of green infrastructure investments in the urban core of Manchester, UK. Urban
Forestry & Urban Greening 12(3): 296–306.
Mohamed N., M.N. Shamsudin, A.N.A. Ghani, A. Radam, S. Kaffashi, N.N.R.N.A. Rahim, N.H. Bin Hassin
(2012) Willingness to Pay for Watershed Conservation at Hulu Langat, Selangor. Journal of Applied
Sciences 12: 1859-1864.
Mueller, J. M., W. Swaffar, E. A. Nielsen, A. E. Springer, S. M. Lopez (2013) Estimating the value of
watershed services following forest restoration Water Resources Research 49: 1773–1781.
Netusil, N. R., M. Kincaid, H. Chang (2014) Valuing water quality in urban watersheds: A comparative
analysis of Johnson Creek, Oregon, and Burnt Bridge Creek, Washington. Water Resources Research
50: 4254–4268.

24
Nilsson, P. (2015) The influence of urban and natural amenities on second home prices. Journal
Housing and the Built Environment 30(3): 427-450.
Palmquist, R.B. (1992) Valuing localized externalities. Journal of Urban Economics 31: 59-68.
Panduro, T.E., Veie, K.L. (2013) Classification and valuation of urban green spaces—A hedonic house
price valuation. Landscape and Urban Planning 120: 119-128.
Phaneuf, D., Smith, V., Palmquist, R., Pope, J. (2008) Integrating Property Value and Local Recreation
Models to Value Ecosystem Services in Urban Watersheds. Land Economics 84(3): 361-381.
Polyakov, M., J. Fogarty F. Zhang, R. Pandit, D.J. Pannell (2017) The Value of Restoring Urban Drains to
Living Streams. Water Resources and Economics 17: 42-55.
Ready, R.C., Berger, M.C., Blomquist, G.C. (1997) Measuring amenity benefits from farmland: hedonic
pricing vs. contingent valuation. Growth and Change 28 (4): 438-458.
Rosenberger, R.S., Needham, M.D., Morzillo, A.T., Moehrke, C. (2012) Attitudes, willingness to pay,
and stated values for recreation use fees at an urban proximate forest. Journal of Forest Economics
18(4): 271-281.
Rosenberger, R.S., Walsch, R.G. (1997) Nonmarket value of western valley Ranchland using contingent
valuation. Journal of Agricultural and Resource Economics 22: 296-309.
Sander H., Polasky, S., Haight R.G. (2010) The value of urban tree cover: A hedonic property price model
in Ramsey and Dakota Counties, Minnesota, USA. Ecological Economics 69(8): 1646-1656.
Sander, H.A., Polasky, S. (2009) The value of views and open space: Estimates from a hedonic pricing
model for Ramsey County, Minnesota, USA. Land Use Policy 26(3): 837-845.
Sander, H.A., Haight R.G. (2012) Estimating the economic value of cultural ecosystem services in an
urbanizing area using hedonic pricing. Journal of Environmental Management 113: 194–205.
Sander, H.A., Zhao, C. (2015) Urban Green and Blue: Who Values What and Where? Land Use Policy
42: 194-209.
Saphores, J.-D., Li, W. (2012) Estimating the value of urban green areas: A hedonic pricing analysis of
the single family housing market in Los Angeles, CA. Landscape and Urban Planning 104(3–4): 373-
387.
Sarvilinna, A., V. Lehtoranta, T. Hjerppe (2017) Are Urban Stream Restoration Plans Worth
Implementing? Environmental Management 59(1): 10-20
Sattout, E.J., Talhouk, S.N., Caligari, P.D.S. (2007) Economic value of cedar relics in Lebanon: An
application of contingent valuation method for conservation. Ecological Economics 61(2–3): 315-
322.
Scarpa, R., Hutchinson, W.G., Chilton, S.M., Buongiorno, J. (2000) Importance of forest attributes in
the willingness to pay for recreation: a contingent valuation study of Irish forests. Forest Policy and
Economics 1: 315-329.
25
Schläpfer F., Waltert F., Segura L., Kienast F. (2015) Valuation of landscape amenities: A hedonic pricing
analysis of housing rents in urban, suburban and periurban Switzerland. Landscape and Urban
Planning 141: 24-40.
Shang, Z., Che, Y., Yang, K., Jiang, Y. (2012) Assessing Local Communities’ Willingness to Pay for River
Network Protection: A Contingent Valuation Study of Shanghai, China. Int. J. Environ. Res. Public
Health 9: 3866-3882.
Smith, V.K., Poulos, C., Kim, H. (2002) Treating open space as an urban amenity. Resource and Energy
Economics 24: 107-129.
Stetler, K.M., Venn, T.J., Calkin, David E. (2010) The effects of wildfire and environmental amenities on
property values in northwest Montana, USA. Ecological Economics 69(11): 2233-2243.
Tajima, K. (2003) New estimates of the demand for urban green space: implications for valuing the
environmental benefits of Boston’s big dig project. Journal of Urban Affairs 25, 641-655.
Tao Z., Yan H., Zhan J. (2012) Economic Valuation of Forest Ecosystem Services in Heshui Watershed
using Contingent Valuation Method. Procedia Environmental Sciences 13: 2445-2450.
Tapsuwan, S., Ingram, G., Burton, M., Brennan, D. (2009) Capitalized amenity value of urban wetlands:
a hedonic property price approach to urban wetlands in Perth, Western Australia. Australian
Journal of Agricultural and Resource Economics 53: 527–545.
Tu, G., Abildtrup, J., Garcia, S. (2016) Preferences for urban green spaces and peri-urban forests: An
analysis of stated residential choices. Landscape and Urban Planning 148: 120-131.
Tyrvainen, L. (2001) Economic valuation of urban forest benefits in Finland. Journal of Environmental
Management 62: 75-92.
Tyrvainen, L., Vaananen, H. (1998) The economic value of urban forest amenities: an application of the
contingent valuation method. Landscape and Urban Planning 43: 105-118.
Vaughan, R.J. (1981) The value of urban open space. Research in Urban Economics 1: 103-130.
Votsis, A. (2017) Planning for green infrastructure: The spatial effects of parks, forests, and fields on
Helsinki's apartment prices. Ecological Economics, 132: 279-289.
Walsh P.J., Milon J.W., Scrogin D.O. (2011) The Spatial Extent of Water Quality Benefits in Urban
Housing Markets. Land Economics 87(4): 628-644.
Wang H., He J., Kim Y., Kamata T. (2013) Willingness-to-pay for water quality improvements in Chinese
rivers: An empirical test on the ordering effects of multiple-bounded discrete choices. Journal of
Environmental Management 131: 256-269.
Willis, K.G., Whitby, M.C. (1985) The value of Green Belt Land. Journal of Rural Studies 1: 147-162.
Windle, J., Cramb, R.A. (1993) Contingent Valuation as a Guide to Environmental Policy: An Application
to the Conservation of Natural Bushland in Brisbane. Economic Analysis and Policy 23(2): 139-149.

26
Xiao, Y., Li, Z., Webster C. (2016) Estimating the mediating effect of privately-supplied green space on
the relationship between urban public green space and property value: Evidence from Shanghai,
China. Land Use Policy 54: 439-447.
Zhao J., Liu Q., Lin L., Lv H., Wang Y. (2013) Assessing the comprehensive restoration of an urban river:
An integrated application of contingent valuation in Shanghai, China. Science of The Total
Environment 458–460: 517-526.

27
APPENDIX

28
Table A1: Ecological domains and how often they are valued in the database in absolute frequency (N) and as a percentage of total recorded values (%)
CATEGORY Subcategories Explanation Frequency (N)
Frequency (%)
(External)
building greens
ALL 16 6.30%
Green roofs Roof vegetation on thin substrate either with varying degrees of irrigation and management; vegetation established either artificially or by seeding or planning or naturally; can include perennials, grasses, small trees, rooftop farming, mosses, succulents, few herbs and grasses
Green walls or facades Including e.g. ground-based climbing plants intended for ornamental purposes or plants growing in façade-bound substrate (e.g. containers or textile-systems)
Balcony green Plants on balconies and terraces which are planted mostly in pots
Urban green
areas connected
to grey
infrastructure
ALL 5 1.97%
Alley and street trees/hedges/greens
Trees planted in alleys or along roads and paths, either solitary or in rows. Hedges along roads or paths. Non-tree, mostly shrubby or grassy verges along roads.
Railroad bank and tracks
Green space along railroads
House gardens Areas in the immediate vicinity of private houses cultivated mainly for ornamental purposes and/or non-commercial food production
Green playground/ school grounds
Green areas intended for playing or outdoor learning
Institutional green space
Green spaces surrounding public and private institutions and corporation buildings
Green parking lots Parking lots which are surrounded by or interspersed with trees, grass patches, flower beds, bushes, or other vegetation
Riverbank greens Green space sideways the rivers, streams and canals, usually with foot or bike paths
Parks and
(semi)natural
urban green
areas
ALL 125 49.21%
Large urban park or forest
Larger green (forested) area within a city intended for recreational use by urban population; can include different features such as trees, grassy areas, playgrounds, water bodies, ornamental beds, etc.
Pocket parks / neighbourhood green spaces
Small green areas around and between buildings which are vegetated by ornamental trees, shrubs, grass; often in residential areas, but also between other building types

29
Botanical garden Educational and ornamental areas planted with large diversity of plant species.
Green corridor Networks of linked landscape elements that provide ecological, recreational, and cultural benefits to the community
Allotments and
community
gardens
ALL 0 0.00%
Allotments Small garden parcels cultivated by different people, intended for non-commercial food production
Community gardens Areas which are collectively gardened by a community for food and recreation
Horticulture Land devoted to growing vegetables, flowers, berries, etc
Green indoor
areas
ALL 0 0.00%
Indoor vertical greeneries (walls and ceilings)
Including e.g. ground-based climbing plants intended for ornamental purposes or plants growing in façade-bound substrate (e.g. containers or textile-systems) inside of a building
Atrium Green area surround/enclosed in a building, planted mostly with ornamental plants
Blue areas ALL 56 22.05%
Lake/pond Natural and artificial standing water bodies containing freshwater with (semi)natural aquatic communities; banks are artificial/managed or natural
River/stream/canal/ estuary
Natural and artificial running water bodies containing freshwater (or in the case of estuaries, mixed fresh and saltwater) with (semi)natural aquatic communities; banks are artificial/managed or natural
Delta Landform at the mouth of a river formed by sediment deposits
Sea coast Contact areas between the sea and the land of different characteristics (e.g. sand beaches, cliffs, coastal dunes)
Wetland/bog/fen/ marsh
Areas with soil permanently or periodically saturated with water and characteristic flora and fauna
Green areas for
water
management
ALL 8 3.15%
Rain gardens Shallow, vegetated basins that collect and temporarily store rainwater runoff from rooftops, sidewalks, and streets or allow for its infiltration
Swales / filter strips Vegetated and gently sloped pit or shallow drainage channels for filtering surface runoff
Sustainable urban drainage systems
Systemic approach to manage drainage in and around properties, often combining green and grey components; can include e.g. green roofs, permeable surfaces, infiltration trenches, swales, detention basins, etc.
Derelict areas Abandoned and derelict spaces with growth of
Recently abandoned areas, construction sites, former industrial areas, etc. with spontaneously occurring pioneer or ruderal vegetation
3 1.18%

30
wilderness or green features
Open green (and blue) space directly adjacent to urban areas
Farmland, agricultural land, fields, woodlands, golf courses
Various sizeable plots of green (and blue) space that are directly adjacent to urban areas and can provide urban areas with various services, a.o. recreation, aesthetics and tourism.
41 16.14%
TOTAL 254 100%
Source: Adapted from Braquinho et al. 2015, Xing et al. 2017, Ecologic studies on GI and EbA/EbM, US EPA website on Green Infrastructure, and Ndubisi et
al 19952; Please refer to Braquinho et al. (2015) and the US EPA website on GI3 for photos to illustrate the majority of the subcategories listed in Table
2 F.Ndubisi, D.M.Terry, D.D.Niels, Environmentally sensitive areas: a template for developing greenway corridors. In: J.Fabos, J.Ahern (Eds.), Greenways: The Beginning of an International Movement, 1995, Elsevier, Amsterdam. 3 https://www.epa.gov/green-infrastructure/what-green-infrastructure

31
Table A2: Landscape domains and how often they are valued in the database in absolute frequency (N) and as a percentage of total recorded values (%)
Landscape Definition Frequency (N)
Frequency (%)
Coastalscape Coastal areas (built and wild) 18 7,06%
Riverscape River areas (natural and managed), riverbanks 22 8,63%
Waterscape Lakes, ponds, fountains, wetland (natural/managed/artificial) 32 12,55%
Soilscape Surface and subsurface soil 4 1,57%
Underscape Underground water bodies, bedrock 0 0,00%
Gardenscape Private gardens (domestic & commercial) 9 3,53%
Parkscape Public parks (may contain wooded areas, formally managed as public parks) and allotment gardens 47 18,43%
Woodscape Forested and wooded land (public and private land consisting entirely of forest area) 94 36,86%
Farmscape Farmland areas within or on boundaries of urban 31 12,16%
Roofscape Roof space – public, private, commercial (a sub-set of the builtscape, but critical for NBS which compete with other sustainability interventions , e.g. solar, white coatings, so kept separate) 11 4,31%
Builtscape Built fabric – walls/facades, paving, car parks, indoor green 7 2,75%
Streetscape Road infrastructure (including hedges, marginal land, roundabouts) 8 3,14%
Railscape Rail infrastructure (including marginal land, embankments) 0 0,00%
Barescape Abandoned and derelict land, buildings, infrastructure 5 1,96%
32
Table A3: Ecosystem services for NBS and their percentage frequency of occurrence in the database
Type of ecosystem service Ecosystem service category Frequency of occurrence in the database (FEVD)
Provisioning Services ANY provisioning services 41,57%
Food 18,82%
Raw Materials 12,94%
Fresh Water quantity 20,78%
Medicinal resources 1,18%
Regulating services ANY regulating services 86,67%
Local climate regulation (temperature reduction) 45,10%
Air quality regulation 51,76%
Coastal protection 3,14%
Noise reduction 52,94%
Carbon storage/sequestration 49,41%
Flood regulation 57,65%
Water purification 20,78%
Pollination 2,75%
Habitat and supporting services
ANY habitat & supporting services 59,61%
Habitats for species 58,04%
Maintenance of genetic diversity 41,96%
Cultural services ANY cultural services 87,06%
Recreation and mental and physical health 78,43%
Tourism 37,65%
Aesthetic appreciation 76,47%
Inspiration for culture, art & design 37,65%
Table A4: NBS goals and their percentage frequency of occurrence in the database
NBS Goal
Description Frequency of occurrence in the database (FEVD)
1 Climate action for adaptation, resilience and mitigation 22,35%
2 Water management 29,02%
3 Coastal resilience and marine protection 3,53%
4 Green space, habitats and biodiversity 53,73%
5 Environmental quality, including air quality and waste management 61,96%
6 Regeneration, land-use and urban development 11,37%
7 Inclusive and effective governance 2,75%
8 Social justice, inequality and social cohesion 29,41%
9 Health and well-being 58,82%
10 Economic development and decent employment 21,96%
11 Cultural heritage and cultural diversity 39,22%
12 Sustainable consumption and production 17,65%

33
Table A5: Spatial and temporal scales of NBS valuation and their absolute and percentage frequency of occurrence in the database.
Indicators
N %
SPATIAL SCALE
Macro Global/national 13 5,10%
Meso Metropolitan/urban 208 81,57%
Micro District/neighbourhood 31 12,16%
Sub-Micro Street/house 30 11,76%
TEMPORAL SCALE
Imediate Days/weeks 49 19,22%
Short-term Weeks/months 20 7,84%
Medium term 1-3 years 22 8,63%
Long-term Longer than 3 years 54 21,18%
Table A6: Agents for which the valuation is applied valuation and their absolute and percentage frequency of occurrence in the database.
AGENTS N %
individuals 48 18,82%
households 145 56,86%
group / population 62 24,31%
TOTAL 255 100%