Review of economic and livelihood benefits for ASAP ... · Review of economic and livelihood...
38
Review of economic and livelihood benefits for ASAP-supported investments IFAD Technical Report Keyword: Evaluation, Economic Development, Climate Change, Economics JEL: O. Economic Development, Innovation, Technological Change, and Growth -> O1 Economic Development -> O13 Agriculture • Natural Resources • Energy • Environment • Other Primary Products AUTHORS (alphabetical order): Ferrarese C. 1 , Mazzoli E. 2 , Rinaldi R. 3 , 2016. Review of economic and livelihood benefits for ASAP- supported investments. IFAD Publications, Rome, Italy. © 2016 by the International Fund for Agricultural Development (IFAD) The opinions expressed in this document are those of the authors and do not necessarily represent those of the International Fund for Agricultural Development (IFAD). The designations employed and the presentation of material in this article do not imply the expression of any opinion whatsoever on the part of IFAD concerning the legal status of any country, territory, city or area or of its authorities, or concerning the delimitation of its frontiers or boundaries. This publication or any part thereof may be reproduced without prior permission from IFAD, provided that the publication or extract therefrom reproduced is attributed to IFAD and the title of this publication is stated in any publication and that a copy thereof is sent to IFAD. 1 OpenEconomics - Independent Consultant- corresponding author [email protected] 2 IFAD - Economic and Financial Analysis Specialist 3 Stockholm Environment Institute (Associate) - Junior Researcher
Transcript of Review of economic and livelihood benefits for ASAP ... · Review of economic and livelihood...
Review of economic and livelihood benefits for ASAP-supported investments
IFAD Technical Report
Keyword: Evaluation, Economic Development, Climate Change, Economics
JEL: O. Economic Development, Innovation, Technological Change, and Growth -> O1 Economic
Development -> O13 Agriculture • Natural Resources • Energy • Environment • Other Primary
Products
AUTHORS (alphabetical order):
Ferrarese C.1, Mazzoli E.2, Rinaldi R.3, 2016. Review of economic and livelihood benefits for ASAP-
supported investments. IFAD Publications, Rome, Italy.
© 2016 by the International Fund for Agricultural Development (IFAD)
The opinions expressed in this document are those of the authors and do not necessarily represent
those of the International Fund for Agricultural Development (IFAD). The designations employed
and the presentation of material in this article do not imply the expression of any opinion
whatsoever on the part of IFAD concerning the legal status of any country, territory, city or area or
of its authorities, or concerning the delimitation of its frontiers or boundaries.
This publication or any part thereof may be reproduced without prior permission from IFAD,
provided that the publication or extract therefrom reproduced is attributed to IFAD and the title of
this publication is stated in any publication and that a copy thereof is sent to IFAD.
1 OpenEconomics - Independent Consultant- corresponding author [email protected] 2 IFAD - Economic and Financial Analysis Specialist 3 Stockholm Environment Institute (Associate) - Junior Researcher
Review of economic and livelihood benefits for ASAP-supported investments
- 1 -
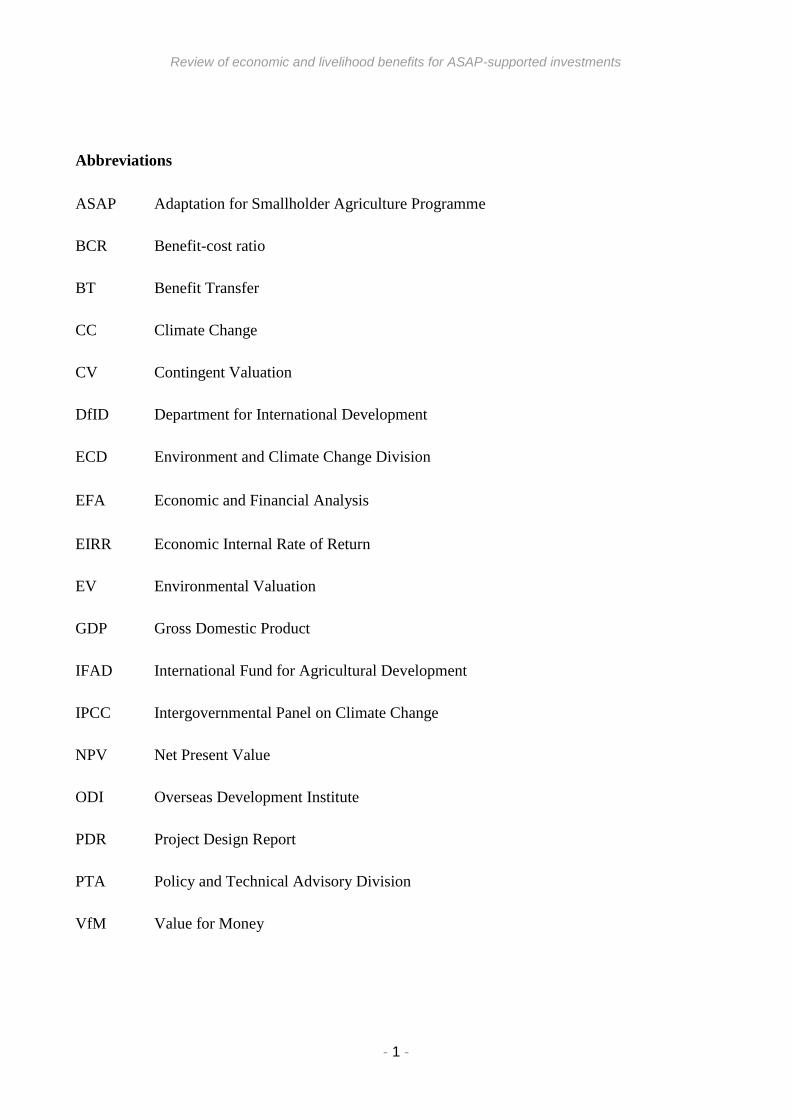
Abbreviations
ASAP Adaptation for Smallholder Agriculture Programme
BCR Benefit-cost ratio
BT Benefit Transfer
CC Climate Change
CV Contingent Valuation
DfID Department for International Development
ECD Environment and Climate Change Division
EFA Economic and Financial Analysis
EIRR Economic Internal Rate of Return
EV Environmental Valuation
GDP Gross Domestic Product
IFAD International Fund for Agricultural Development
IPCC Intergovernmental Panel on Climate Change
NPV Net Present Value
ODI Overseas Development Institute
PDR Project Design Report
PTA Policy and Technical Advisory Division
VfM Value for Money

Review of economic and livelihood benefits for ASAP-supported investments
- 2 -
Abstract
In the process of gathering numerical evidences about the economic, social and environmental
benefits induced by the Adaptation for Smallholder Agriculture Programme (ASAP), this work
proposes a technical and empirical review of 32 approved projects under the ASAP. Results are
integrated in the light of data gaps emerged from the original database, especially regarding the
assessment of environmental benefits.
ASAP financing guarantees an average return of $1.77 per dollar invested. Supporting evidences
came also from the analysis of the Economic Internal Rates of Return (EIRR), which reveals that
mean EIRR in each of the IFAD regions ranges between 15% and 35%. At global level, the analysis
suggests that climate change adaptation strategies contribute to GDP growth for about 22% of the
GDP total value that translates in a yearly growth by 1.2%. Expected outcomes vis-à-vis pre-
identified risks and climate variability measured running a Monte Carlo simulations are proved to
remain positive in most of the countries, with few exceptions were climate variability has bigger
effect on final results.
The conclusive part of this study suggests an extension in the scope of the analysis through minor
investments in primary data collection to validate and consolidate technical and empirical reviews.

Review of economic and livelihood benefits for ASAP-supported investments
- 3 -
Introduction
Since the inception of the Adaptation for Smallholder Agriculture Programme (ASAP) in
September 2012, a total of 36 ASAP-supported projects were approved by the IFAD Executive
Board, committing 100% of its approved finance on supporting the adaptation of poor smallholder
farmers to climate change4 (CC). Currently 15 of these projects have been implemented, disbursing
their first batches of financing and delivering intermediate results5.
An external Progress Review by the Overseas Development Institute (ODI)6 to evaluate the status
of ASAP found that ASAP’s impact has been strong in two areas. Firstly, the internal policy and
project design process within IFAD raised awareness and provided the basis for thorough
mainstreaming of climate change and a more structured approach to integrate the concept of
'resilience' in IFAD investment designs. Secondly, ASAP has created a strong internationally-
recognised brand on climate adaptation for rural smallholder farmers, combining IFAD’s existing
credibility on agriculture with strategic partnerships involving international institutions leading on
climate change in this field.
IFAD and DfID in the UK are now interested to gathering numerical evidences about the economic,
social and environmental benefits leveraged via ASAP projects. While data and partial assessments
are already available in individual project Economic and Financial Analysis (EFA), there seems to
be a lack in reporting expected returns per US dollar spent from the ASAP while providing an
overview of the benefits at country and regional level.
This work proposes, therefore, a review of economic and livelihood benefits for ASAP-supported
investments. This study makes use of the larger sample of ASAP-supported projects, so as to gather
evidences about the quantifiable economic returns and the value for money of the ASAP
programme at a broader global scale. The study also attempts to shed lights on the net incremental
benefits generated at farm/household level, so as on the indirect benefits imputable to ASAP at
different scales (job creation, impact on GDP, second-tier effects). Final results will be then tested
via sensitivity and risk analysis, in order to account for the long-term global outlook on CC.
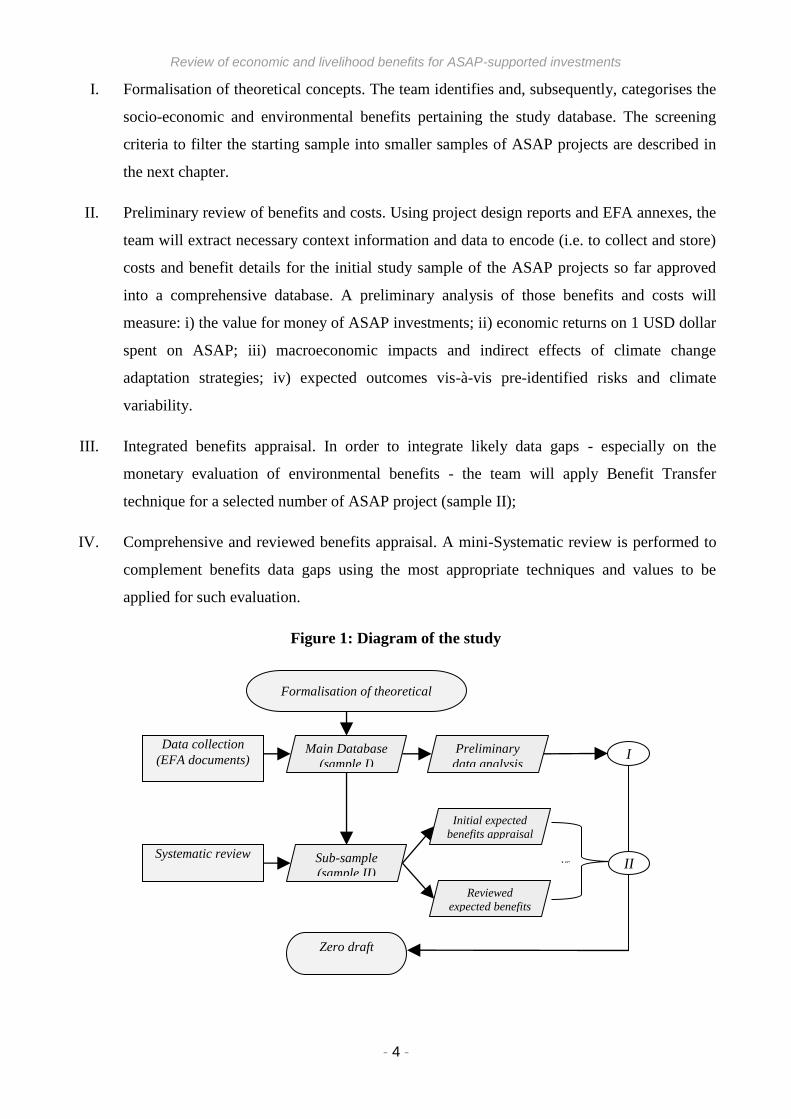
The approach can be described in five steps as follows:
4 Norman (2015) Food and livelihoods in a changing climate: the role of climate finance for agriculture. 5 Laganda (2016) ASAP Quarterly Newsletter - April 2016. 6 ODI (2015) Adaptation for Smallholder Agriculture Programme (ASAP) - Progress Review.
Review of economic and livelihood benefits for ASAP-supported investments
- 4 -
I. Formalisation of theoretical concepts. The team identifies and, subsequently, categorises the
socio-economic and environmental benefits pertaining the study database. The screening
criteria to filter the starting sample into smaller samples of ASAP projects are described in
the next chapter.
II. Preliminary review of benefits and costs. Using project design reports and EFA annexes, the
team will extract necessary context information and data to encode (i.e. to collect and store)
costs and benefit details for the initial study sample of the ASAP projects so far approved
into a comprehensive database. A preliminary analysis of those benefits and costs will
measure: i) the value for money of ASAP investments; ii) economic returns on 1 USD dollar
spent on ASAP; iii) macroeconomic impacts and indirect effects of climate change
adaptation strategies; iv) expected outcomes vis-à-vis pre-identified risks and climate
variability.
III. Integrated benefits appraisal. In order to integrate likely data gaps - especially on the
monetary evaluation of environmental benefits - the team will apply Benefit Transfer
technique for a selected number of ASAP project (sample II);
IV. Comprehensive and reviewed benefits appraisal. A mini-Systematic review is performed to
complement benefits data gaps using the most appropriate techniques and values to be
applied for such evaluation.
Figure 1: Diagram of the study
Formalisation of theoretical
concepts
Main Database
(sample I) Preliminary
data analysis
Systematic review
Data collection (EFA documents)
Sub-sample
(sample II)
Reviewed
expected benefits
analysis
Initial expected
benefits appraisal
Zero draft
VS.
I
II
Review of economic and livelihood benefits for ASAP-supported investments
- 5 -
This report will collect and present all the findings developed throughout the above-depicted
activities, describing the review exercise undertaken and presenting the economic and livelihood
benefits achieved through ASAP-supported investments in the considered samples.
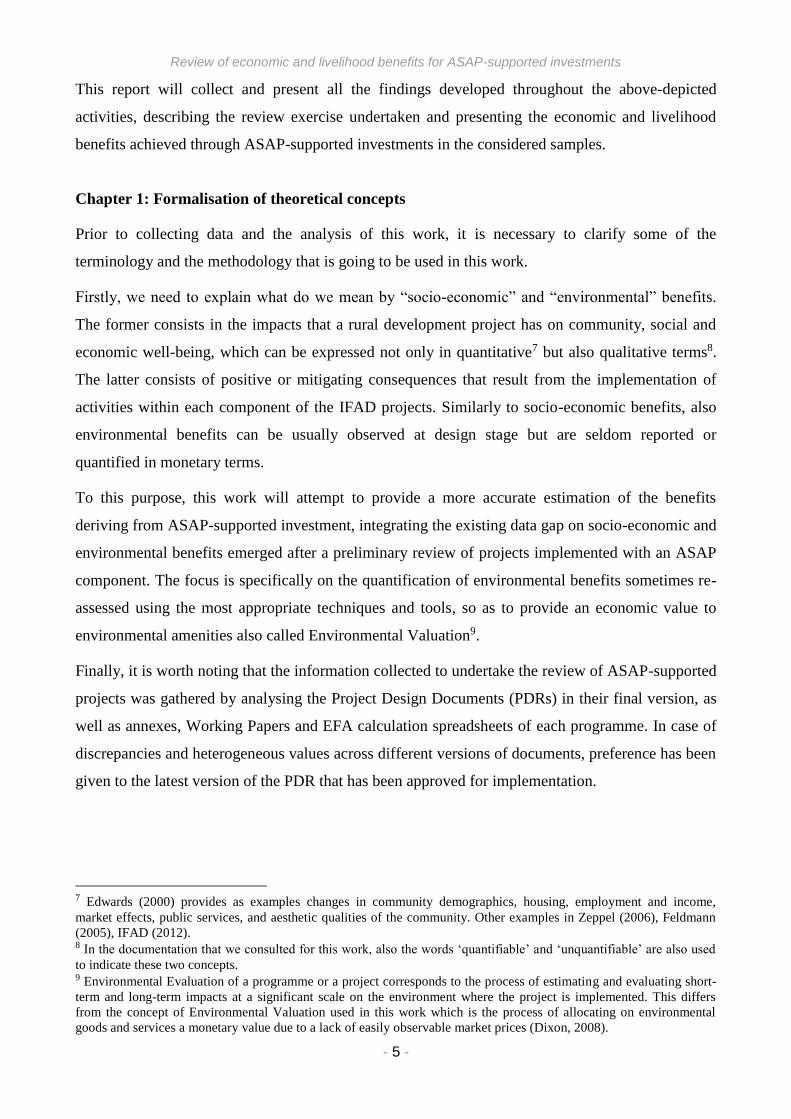
Chapter 1: Formalisation of theoretical concepts
Prior to collecting data and the analysis of this work, it is necessary to clarify some of the
terminology and the methodology that is going to be used in this work.
Firstly, we need to explain what do we mean by “socio-economic” and “environmental” benefits.
The former consists in the impacts that a rural development project has on community, social and
economic well-being, which can be expressed not only in quantitative7 but also qualitative terms8.
The latter consists of positive or mitigating consequences that result from the implementation of
activities within each component of the IFAD projects. Similarly to socio-economic benefits, also
environmental benefits can be usually observed at design stage but are seldom reported or
quantified in monetary terms.
To this purpose, this work will attempt to provide a more accurate estimation of the benefits
deriving from ASAP-supported investment, integrating the existing data gap on socio-economic and
environmental benefits emerged after a preliminary review of projects implemented with an ASAP
component. The focus is specifically on the quantification of environmental benefits sometimes re-
assessed using the most appropriate techniques and tools, so as to provide an economic value to
environmental amenities also called Environmental Valuation9.
Finally, it is worth noting that the information collected to undertake the review of ASAP-supported
projects was gathered by analysing the Project Design Documents (PDRs) in their final version, as
well as annexes, Working Papers and EFA calculation spreadsheets of each programme. In case of
discrepancies and heterogeneous values across different versions of documents, preference has been
given to the latest version of the PDR that has been approved for implementation.
7 Edwards (2000) provides as examples changes in community demographics, housing, employment and income,
market effects, public services, and aesthetic qualities of the community. Other examples in Zeppel (2006), Feldmann
(2005), IFAD (2012). 8 In the documentation that we consulted for this work, also the words ‘quantifiable’ and ‘unquantifiable’ are also used
to indicate these two concepts. 9 Environmental Evaluation of a programme or a project corresponds to the process of estimating and evaluating short-
term and long-term impacts at a significant scale on the environment where the project is implemented. This differs
from the concept of Environmental Valuation used in this work which is the process of allocating on environmental
goods and services a monetary value due to a lack of easily observable market prices (Dixon, 2008).

Review of economic and livelihood benefits for ASAP-supported investments
- 6 -
Description of samples
Sample I
The starting sample (Sample I) is formed by ASAP-supported projects that have been approved
and/or implemented within the last six years (2010-2015). The lack of data for four ASAP-
supported projects have reduced the initial sample size of 36 projects to 3210. Using PDRs and EFA
annexes, the team extracted necessary context information and data to encode (i.e. to collect and
store) into a comprehensive database that constitutes Sample I. This database collects socio-
economic and environmental benefits assessed at the design stage on a yearly basis and per
component discounted to the 2015 USD value; both for the project and for the ASAP financed part
of the project.
As per its mandate, IFAD operates in the rural areas of low-income countries, engaging with
farmers living in very different environmental, socioeconomic and cultural contexts. Jointly with
the ASAP, IFAD has intervened in the following regions: Asia and the Pacific (APR), East and
Southern Africa (ESA), Latin America and the Caribbean (LAC), Near East and North Africa
(NEN), and West Central Africa (WCA). In the stratification of the projects sample used for this
work, we preserved this geographical diversity also to allow any conclusion to not being distorted
by possible regional peculiarities (countries in green - Figure 2).
Figure 2: Geographical distribution of projects and programmes approved with ASAP component
10 See Annex I for the full list of projects with title, as well as country and region of the intervention.
Review of economic and livelihood benefits for ASAP-supported investments
- 7 -
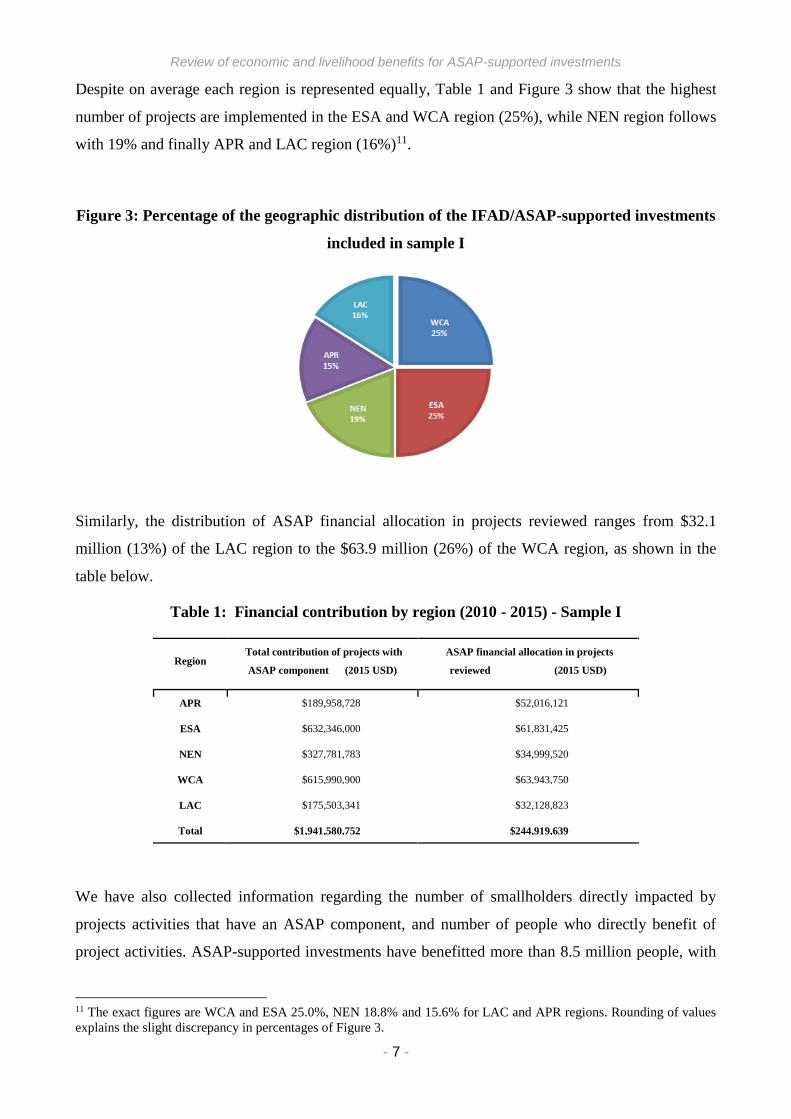
Despite on average each region is represented equally, Table 1 and Figure 3 show that the highest
number of projects are implemented in the ESA and WCA region (25%), while NEN region follows
with 19% and finally APR and LAC region (16%)11.
Figure 3: Percentage of the geographic distribution of the IFAD/ASAP-supported investments
included in sample I
Similarly, the distribution of ASAP financial allocation in projects reviewed ranges from $32.1
million (13%) of the LAC region to the $63.9 million (26%) of the WCA region, as shown in the
table below.
Table 1: Financial contribution by region (2010 - 2015) - Sample I
Region Total contribution of projects with
ASAP component (2015 USD)
ASAP financial allocation in projects
reviewed (2015 USD)
APR $189,958,728 $52,016,121
ESA $632,346,000 $61,831,425
NEN $327,781,783 $34,999,520
WCA $615,990,900 $63,943,750
LAC $175,503,341 $32,128,823
Total $1,941,580,752 $244,919,639
We have also collected information regarding the number of smallholders directly impacted by
projects activities that have an ASAP component, and number of people who directly benefit of
project activities. ASAP-supported investments have benefitted more than 8.5 million people, with
11 The exact figures are WCA and ESA 25.0%, NEN 18.8% and 15.6% for LAC and APR regions. Rounding of values
explains the slight discrepancy in percentages of Figure 3.
Review of economic and livelihood benefits for ASAP-supported investments
- 8 -
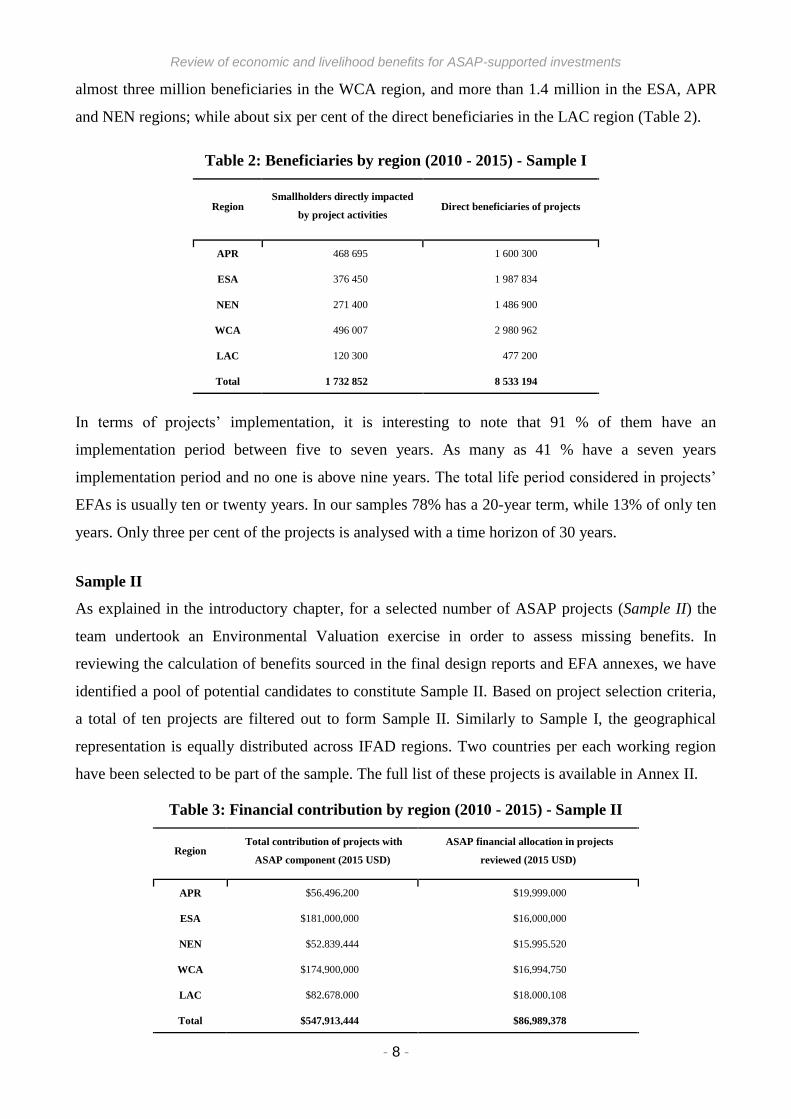
almost three million beneficiaries in the WCA region, and more than 1.4 million in the ESA, APR
and NEN regions; while about six per cent of the direct beneficiaries in the LAC region (Table 2).
Table 2: Beneficiaries by region (2010 - 2015) - Sample I
Region Smallholders directly impacted
by project activities Direct beneficiaries of projects
APR 468 695 1 600 300
ESA 376 450 1 987 834
NEN 271 400 1 486 900
WCA 496 007 2 980 962
LAC 120 300 477 200
Total 1 732 852 8 533 194
In terms of projects’ implementation, it is interesting to note that 91 % of them have an
implementation period between five to seven years. As many as 41 % have a seven years
implementation period and no one is above nine years. The total life period considered in projects’
EFAs is usually ten or twenty years. In our samples 78% has a 20-year term, while 13% of only ten
years. Only three per cent of the projects is analysed with a time horizon of 30 years.
Sample II
As explained in the introductory chapter, for a selected number of ASAP projects (Sample II) the
team undertook an Environmental Valuation exercise in order to assess missing benefits. In
reviewing the calculation of benefits sourced in the final design reports and EFA annexes, we have
identified a pool of potential candidates to constitute Sample II. Based on project selection criteria,
a total of ten projects are filtered out to form Sample II. Similarly to Sample I, the geographical
representation is equally distributed across IFAD regions. Two countries per each working region
have been selected to be part of the sample. The full list of these projects is available in Annex II.
Table 3: Financial contribution by region (2010 - 2015) - Sample II
Region Total contribution of projects with
ASAP component (2015 USD)
ASAP financial allocation in projects
reviewed (2015 USD)
APR $56,496,200 $19,999,000
ESA $181,000,000 $16,000,000
NEN $52,839,444 $15,995,520
WCA $174,900,000 $16,994,750
LAC $82,678,000 $18,000,108
Total $547,913,444 $86,989,378

Review of economic and livelihood benefits for ASAP-supported investments
- 9 -
Table 4: Beneficiaries by region (2010 - 2015) - Sample II
Region Smallholders directly impacted
by project activities
Direct beneficiaries of projects
APR 157 700 630 000
ESA 157 000 942 000
NEN 110 300 755 300
WCA 149 000 783 000
LAC 72 000 344 000
Total 644 000 3 454 300
Chapter 2: Preliminary review of benefits and costs
The results of the analysis conducted using Sample I database are presented in the following
sections. Firstly, we comment on the Value for Money (VfM) of the ASAP-supported investments
through the appraisal of benefit-cost ratios (BCR), Net Present Values (NPV) and Economic
Internal Rate of Return (EIRR). It follows an investigation about the macroeconomic impacts and
indirect effects of climate change adaptation strategies. A sensitivity analysis on expected outcomes
vis-à-vis pre-identified risks and climate variability concludes the preliminary review.
2.1. Value for money on ASAP-supported investments
Four elements can define the VfM of an investment: Economy, Efficiency, Effectiveness and
Equity. Economy implicates that inputs are at sufficient quality and appropriate cost. ‘How well’
inputs are converted into outputs is the efficiency; while effectiveness relates to ‘how well’ outputs
achieve a desired outcome (Barr and Christie, 2015; Jayasuriya, 2013). Many development agencies
and organisation include some or all of these elements in their definition in applying the VfM
concept to their work. Under this work, the DfID approach to VfM is adopted. Based on the first
three Es, but with the need to include Equity considerations throughout, VfM is “about maximising
the impact of each £ spent to improve poor people’s lives” (DfID, 2011 - pp. 2).
2.1.1. Benefit to Cost Ratio (BCR)
A first method identified to evaluate VfM of ASAP contribution, applying DfID definition, is the
BCR of ASAP-supported investments. BCR is a synthetic evaluation criterion of the acceptability

Review of economic and livelihood benefits for ASAP-supported investments
- 10 -
and - under specific and limited circumstances - preferability of a project12. The indicator is
calculated as the ratio of project benefits over project costs13. According to this criterion, a project is
worth the investment when BCR is greater than one.
This ratio owns some operational advantages and disadvantages to be taken into consideration.
Indeed, its application has a relevant inconvenience due to the high sensitivity of results to the cost
and benefit values included in the assessment of the ratio and it cannot be used as for the ranking of
projects. On a brighter note though, it would provide an initial idea about project feasibility and a
robust proxy measure of the returns generated by each dollar invested in the project. Hence, this
indicator is used so as to determine value contribution of ASAP component to the overall project
value.
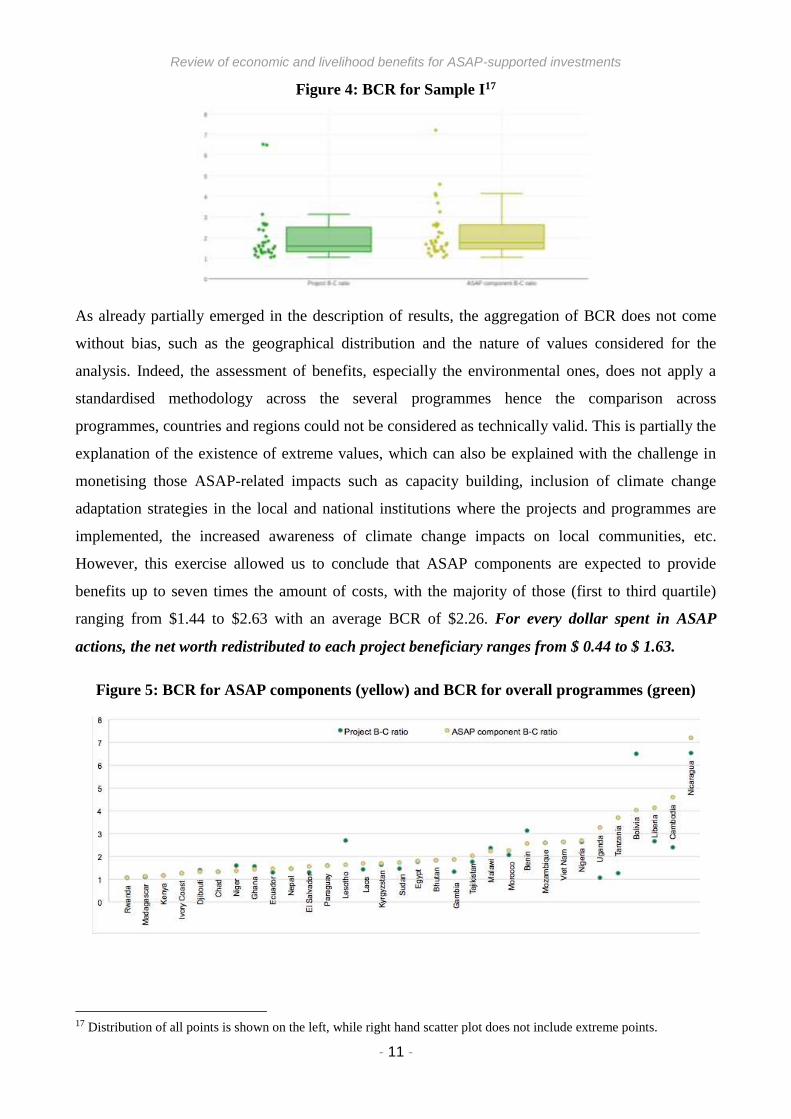
Results of the BCR analysis are presented in Figure 4. As shown in the leftward box-plot, for a
dollar spent in a project or programme that has an ASAP component, expected benefits will be
$1.59 and on average equals to $2.06; with a minimum BCR of $ 1.05, and maximum of $ 6.53 and
$ 6.49. Therefore, for every dollar invested in IFAD programmes, a net worth of $ 0.59 to $ 1.06
on average is generated and redistributed to project beneficiaries. Two of the ratios above 6.0
dollars – respectively calculated in the Bolivia14 and Nicaragua15 project - were considered outlier
and therefore excluded by the box plot16. On the right side of the graph, the BCR for each ASAP
component are represented as single entries as well as grouped in the box plot.
For ASAP alone, the median and average values are equal to $ 1.76 and $ 2.26 respectively, with
minimum value being $ 1.05 and maximum $ 7.21. The latter – as in the previous case – has been
considered as extreme value. The BCR review of the 32 ASAP-supported investments suggests
that investments are worth the costs and ASAP components slightly outperform the overall
investment in terms of worth generation and redistribution capacity.
12 See Hanley (1993) for more information. 13 This indicator should be calculated using the present values of both benefits and costs, discounted at an appropriate
discount rate. This indicator should be used jointly with others as, when used alone, it may give incorrect ranking
among independent projects and cannot be used for choosing among mutually exclusive alternatives. 14 ACCESSOS programme 15 Adapting to Markets and Climate Change Programme 16 Standard Deviation = 1.28; Variance = 1.64; Standard Error = 0.23.
Review of economic and livelihood benefits for ASAP-supported investments
- 11 -
Figure 4: BCR for Sample I17
As already partially emerged in the description of results, the aggregation of BCR does not come
without bias, such as the geographical distribution and the nature of values considered for the
analysis. Indeed, the assessment of benefits, especially the environmental ones, does not apply a
standardised methodology across the several programmes hence the comparison across
programmes, countries and regions could not be considered as technically valid. This is partially the
explanation of the existence of extreme values, which can also be explained with the challenge in
monetising those ASAP-related impacts such as capacity building, inclusion of climate change
adaptation strategies in the local and national institutions where the projects and programmes are
implemented, the increased awareness of climate change impacts on local communities, etc.
However, this exercise allowed us to conclude that ASAP components are expected to provide
benefits up to seven times the amount of costs, with the majority of those (first to third quartile)
ranging from $1.44 to $2.63 with an average BCR of $2.26. For every dollar spent in ASAP
actions, the net worth redistributed to each project beneficiary ranges from $ 0.44 to $ 1.63.
Figure 5: BCR for ASAP components (yellow) and BCR for overall programmes (green)
17 Distribution of all points is shown on the left, while right hand scatter plot does not include extreme points.

Review of economic and livelihood benefits for ASAP-supported investments
- 12 -
A regional representation of results, such as in Figure 6, provides a more detailed overview of the
VfM that each area of intervention can offer. Using as reference the ratios presented in the previous
figure, this chart denotes the same results
but with a regional view.
The LAC region in green shows values
that span from a BCR of $1.45 in the
Ecuador ASAP component to the $7.21 in
Nicaragua. The region in blue (NEN)
collects ratios between the $1.32 of
Djibouti to the Morocco’s project $2.27.
In the bottom left of the chart, the WCA
regional ratios are collected with figures
stretching from the Ivory Coast $1.25 to
the $4.14 of Liberia. The APR region is
represented in the bottom centre of the
chart with the BCR of the analysed countries scoping from $1.47 in Nepal to the $4.59 observed in
Cambodia. Finally, in the right-corner Rwanda $1.05 and Tanzanian $3.68 tidemark the BCRs of
the ESA region.
2.1.2. Net Present Value
Another key indicator for the assessment of the VfM of the ASAP-supported investments consists
of the Net Present Value (NPV) of socio-economic and environmental benefits, net of the project or
programme economic costs. The NPV is a profitability indicator, which synthesizes the net project
worth generated once all operating inputs and production factors have been repaid. The project
would be worth the investment when the NPV is greater than zero.
Similarly to the previous section, Figure 7 shows in a box-plot the range of values that characterises
the sample of 32 projects that include an ASAP component.
Figure 6: BCR for ASAP components divided by regions
Review of economic and livelihood benefits for ASAP-supported investments
- 13 -
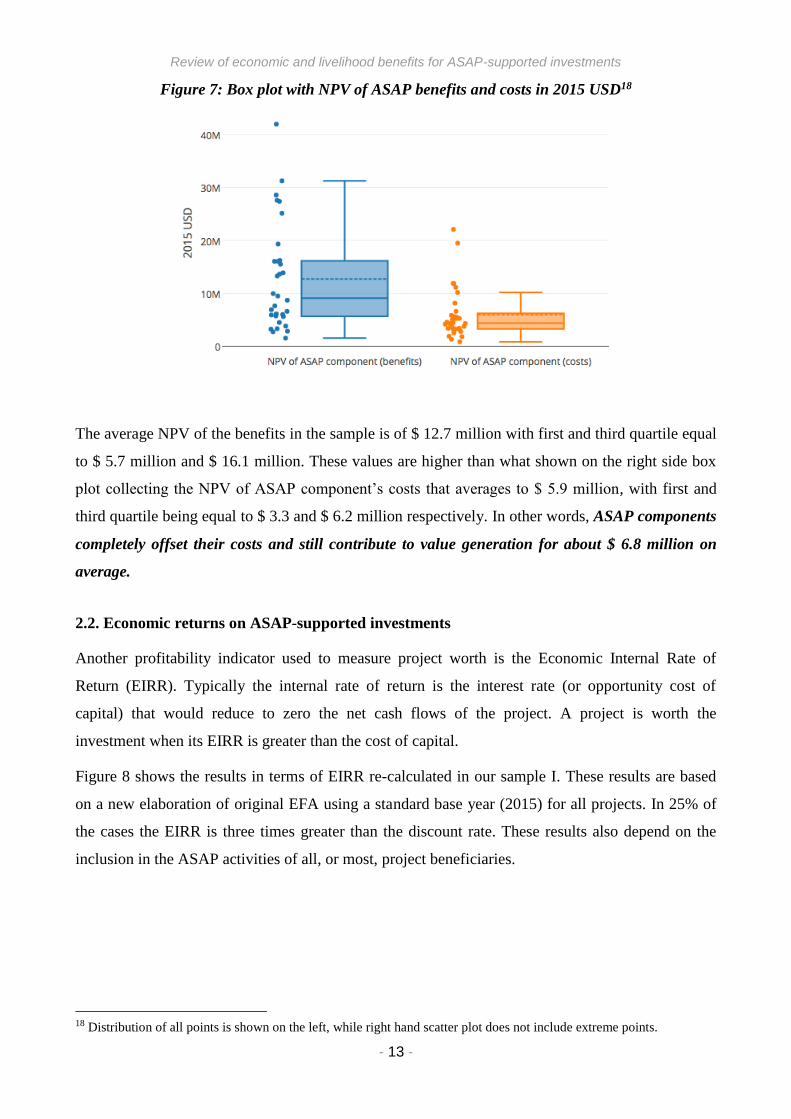
Figure 7: Box plot with NPV of ASAP benefits and costs in 2015 USD18
The average NPV of the benefits in the sample is of $ 12.7 million with first and third quartile equal
to $ 5.7 million and $ 16.1 million. These values are higher than what shown on the right side box
plot collecting the NPV of ASAP component’s costs that averages to $ 5.9 million, with first and
third quartile being equal to $ 3.3 and $ 6.2 million respectively. In other words, ASAP components
completely offset their costs and still contribute to value generation for about $ 6.8 million on
average.
2.2. Economic returns on ASAP-supported investments
Another profitability indicator used to measure project worth is the Economic Internal Rate of
Return (EIRR). Typically the internal rate of return is the interest rate (or opportunity cost of
capital) that would reduce to zero the net cash flows of the project. A project is worth the
investment when its EIRR is greater than the cost of capital.
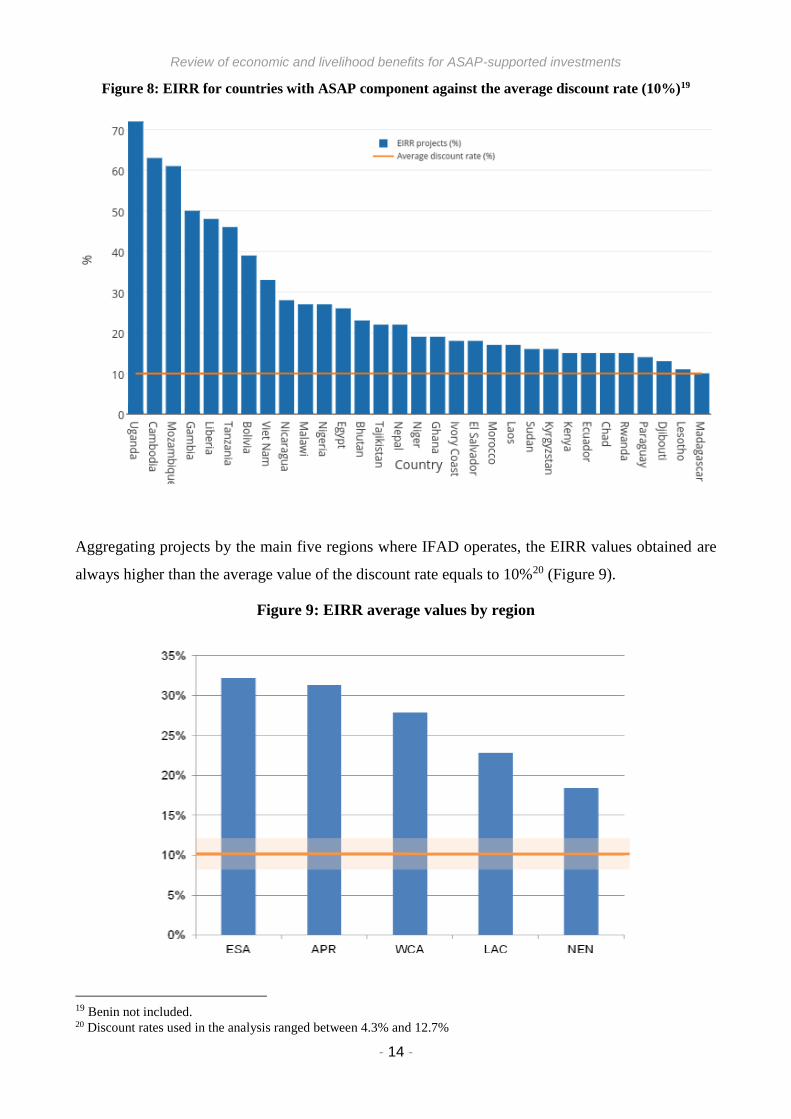
Figure 8 shows the results in terms of EIRR re-calculated in our sample I. These results are based
on a new elaboration of original EFA using a standard base year (2015) for all projects. In 25% of
the cases the EIRR is three times greater than the discount rate. These results also depend on the
inclusion in the ASAP activities of all, or most, project beneficiaries.
18 Distribution of all points is shown on the left, while right hand scatter plot does not include extreme points.
Review of economic and livelihood benefits for ASAP-supported investments
- 14 -
Figure 8: EIRR for countries with ASAP component against the average discount rate (10%)19
Aggregating projects by the main five regions where IFAD operates, the EIRR values obtained are
always higher than the average value of the discount rate equals to 10%20 (Figure 9).
Figure 9: EIRR average values by region
19 Benin not included. 20 Discount rates used in the analysis ranged between 4.3% and 12.7%

Review of economic and livelihood benefits for ASAP-supported investments
- 15 -
ESA and APR regions present the best average results, having EIRR values greater than 30%. The
lowest aggregate result is observed in the NEN region; however this remains well above the
discount rate threshold.
2.3. Macroeconomic impacts and indirect effects of climate change adaptation strategies
To measure programmes impacts on a larger scale, and to frame their effects within the
macroeconomic context of the several countries under analysis, we have also analysed the ratio
between costs and benefits in relation to the changes in the GDP of the area of intervention
following the implementation of such ASAP-supported actions. The rationale of such assessment
stands in the fact that countries with ASAP-supported interventions are enlisted in the second half
of the World ranking in terms of GDP per-capita; with eight out of the thirty-two countries21
actually positioned in the last percentile of the GDP ranking22. In particular, Ecuador can be
considered as the wealthiest country within the sample in terms of per-capita GDP ranking 101th,
while Malawi is positioned at the bottom (ranked 190th).
The value of GDP in the programme area has been estimated as the per-capita GDP23 multiplied by
the number of direct beneficiaries for the project. This value is compared against project economic
costs actualised to 2015 USD amounts, ASAP economic costs and the socio-economic benefits
(further split into Socio-economic benefits, ASAP socio-economic benefits and Total Benefits).
Only eight projects out of the entire sample have included environmental benefits in the analysis
and those few have been attributed to ASAP programme.
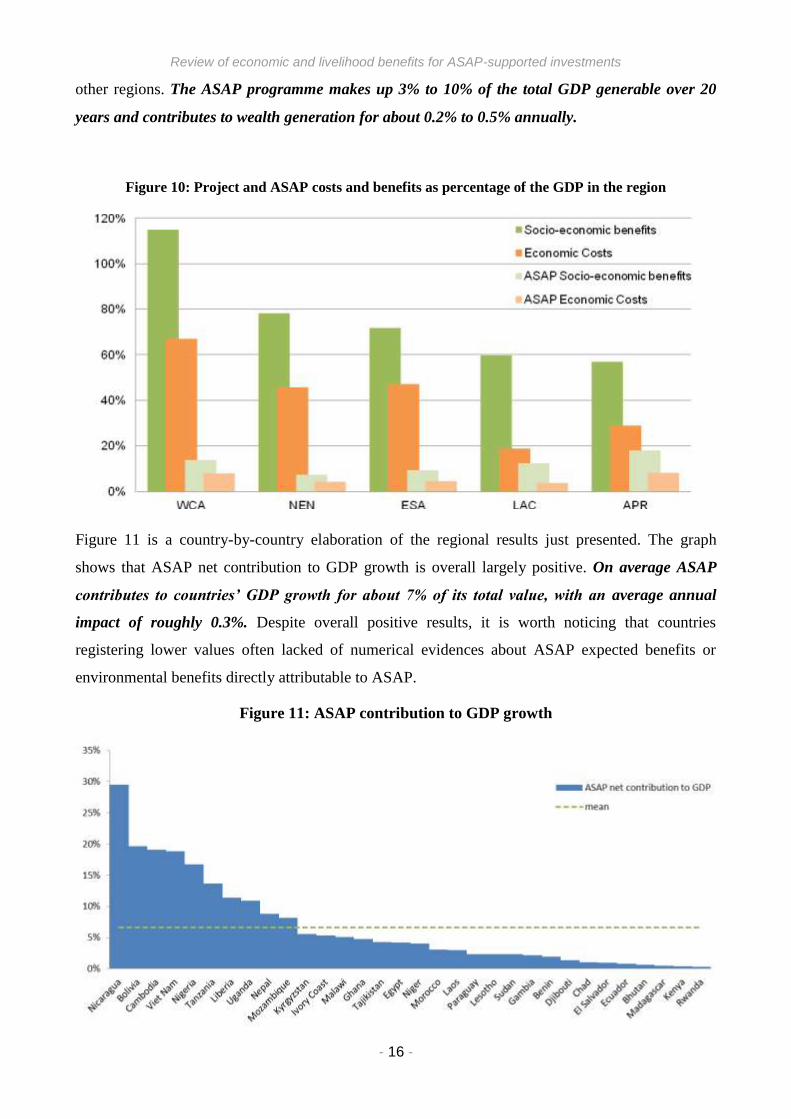
Figure 10 depicts the contribution of each cost/benefit category to the regional GDP. The latter has
been computed taking into consideration rural livelihoods and poverty aspects of IFAD’s target
groups. Final results represent aggregate figures to be considered over the lifetime of the investment
(i.e. 15-20 years).
The assessment proves IFAD programme to induce changes at macroeconomic level, therefore
contributing to GDP growth in all five regions. Total effects tend to be more pronounced in the
WCA region where yet a larger envelope has been invested over the last five years. Less
pronounced effects – yet positive – are witness in the APR region where total investments costs
have been reasonably lower than elsewhere. Nonetheless, investment net contribution to GDP
growth ranges between 25% and 48%, reaching up a net yearly contribution of 1.2% - 2.4%. As for
the impacts attributable to ASAP, the APR region shows a higher leverage capacity with respect to
21 Gambia, Liberia, Madagascar, Malawi, Mozambique, Niger, Rwanda, Uganda 22 Source: http://unstats.un.org/unsd/snaama/dnllist.asp 23 Ibid.
Review of economic and livelihood benefits for ASAP-supported investments
- 16 -
other regions. The ASAP programme makes up 3% to 10% of the total GDP generable over 20
years and contributes to wealth generation for about 0.2% to 0.5% annually.
Figure 10: Project and ASAP costs and benefits as percentage of the GDP in the region
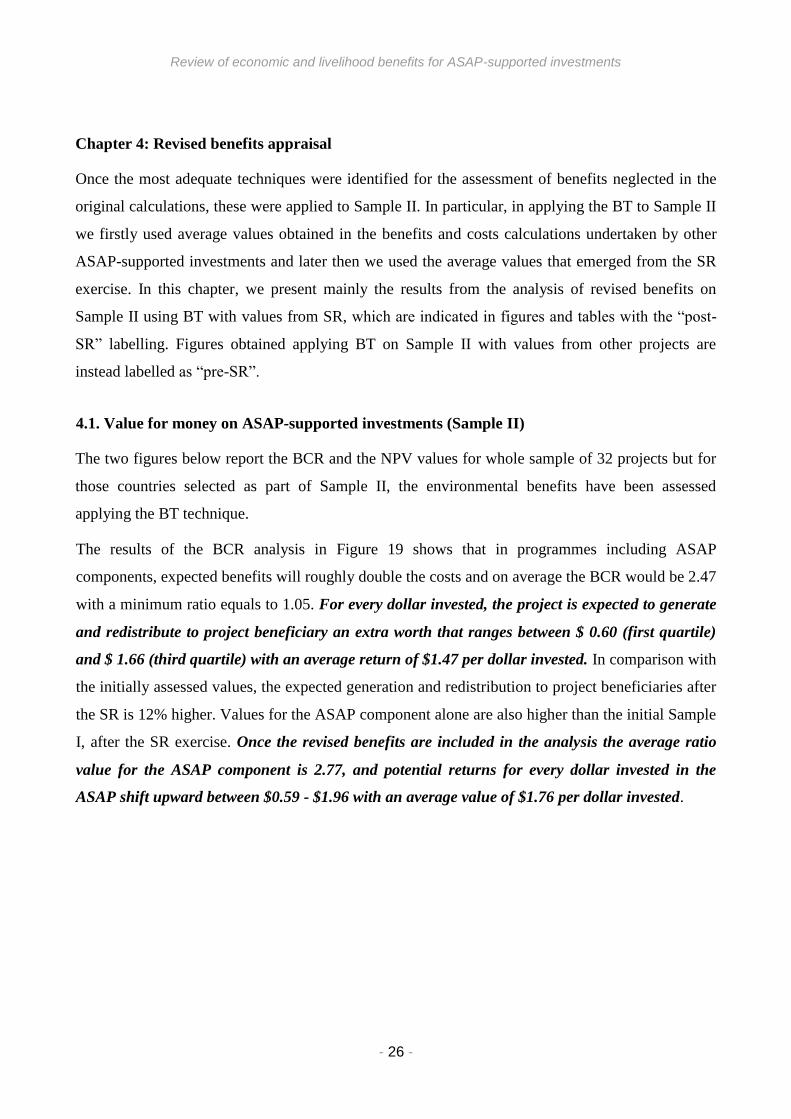
Figure 11 is a country-by-country elaboration of the regional results just presented. The graph
shows that ASAP net contribution to GDP growth is overall largely positive. On average ASAP
contributes to countries’ GDP growth for about 7% of its total value, with an average annual
impact of roughly 0.3%. Despite overall positive results, it is worth noticing that countries
registering lower values often lacked of numerical evidences about ASAP expected benefits or
environmental benefits directly attributable to ASAP.
Figure 11: ASAP contribution to GDP growth

Review of economic and livelihood benefits for ASAP-supported investments
- 17 -
2.4. Expected outcomes vis-à-vis ASAP pre-identified risks and climate variability
When estimating the expected outcomes deriving from the successful implementation of projects or
programmes with an ASAP component, it is necessary to take into consideration internal risks
linked to the technical implementation of interventions, or external factors such as the climate
variability. It is, therefore, necessary to evaluate effects that such risks and climate variability can
potentially have on the expected outcomes.
To this purpose, in order to factor in climate change externalities, we estimated changes in yields
and fall in benefits accordingly to likelihood of occurrence and variation in crop production under
long-term CC scenarios for each region. Source of scenarios is the report by IPCC Working Group
II: Impacts, Adaptation and Vulnerability24. Using the IPCC scenarios described in the box below,
we estimated for each region a probability distribution function and key parameters - i.e. mean and
standard deviation - to be linked to the socio-economic benefits expected by the programme.
Box 1: Regional simulation assumptions used for the analysis
● Sub Saharan Africa: Production benefit are linked to a normal distribution
function with mean equal to base scenario and standard deviation equal to 40% of
mean;
● North Africa: Production benefit related to a normal distribution function with
mean equal to base scenario and standard deviation equal to 35% of mean,
truncated at right of mean value;
● Asia: production benefit with a normal distribution with mean equal to base
scenario and standard deviation equal to 31% of mean, truncated at right of mean
value;
● Central and South America Production benefit with a normal distribution function
with mean equal to base scenario and standard deviation equal to 27% of mean,
truncated at right of mean value
Project impacts were assessed using the Monte Carlo simulation analysis25, which is a particularly
useful method for the enhancement of analysis’ robustness and reliability when facing uncertainty
around key project variables. In particular, uncertainty may hinge upon project estimates – caused
by a lack of reliable data regarding benefits and costs estimation – or more generally around the
24 See the report: http://www.ipcc.ch/ipccreports/tar/wg2/index.htm
25 Monte Carlo analysis technique consists in a randomization of key project variables accordingly to probability
functions attached to these variables. Through a mathematical algorithm, project outcomes are presented as a
distribution of possible results within a defined range of values.

Review of economic and livelihood benefits for ASAP-supported investments
- 18 -
existence of externalities and intangible effects (climate variability, carbon emission, pollution, etc.)
somewhat disregarded from the EFA.
A probability function based on the most probable value has been assumed for each of the variables
that are deemed to be critically important for the outcomes of the project and/or for different
combinations of such variables. Monte Carlo simulation would then allow for interaction and
randomization of these variable until defining a range of plausible values associated to the level of
probability to which the estimate is accurate (confidence level). The analysis is carried out
analysing the EIRR of ASAP component.
The following figures (Figure 12 to Figure 16) show set of EIRR values of the ASAP components
and their likelihood of occurrence, once allowing for changes in main variables and the climate
scenario.
WCA region presents positive and robust results with the set of EIRR values all above the discount
rate of 10%. The base case value for
the EIRR is 28% while the mean value
would attain 16%. The probability for
the rate of return of falling below 14%
is minimal as the 90% of probability
the EIRR would range between 14.8%
and 17.4%.
In APR region the base case value of the EIRR is 35%. After the simulation, this value would get to
a mean value of 26% and it is not
expected to exceed 23% or 29%,
respectively the minimum and
maximum values within likely
outcomes. Results in the region are
therefore proved to be resilient to key
changes among project variables.
Figure 12: ASAP expected EIRR for the WCA region
Figure 13: ASAP expected EIRR in APR region

Review of economic and livelihood benefits for ASAP-supported investments
- 19 -
In the ESA region, the base case value of EIRR is 32%. Once allowing for climate change
variability, hence decrease in yields and
productivity, the EIRR would fall to an
average value of 22%. Further, under no
circumstances final results are going to
be affected negatively by the changing
climate scenario, as also proven by the
threshold values of 18% and 26%,
respectively the minimum and maximum
outcomes experienced during the trials.
Slightly lower and still positive are results from the LAC region. The average expected EIRR is
23% but under climate change
simulations the mean value decreased
to 16%, with a lowest set to 13%.
Under the latter case, the mean value
despite being very close, it is still
above the threshold discount rate
(10%).
Finally, in the NEN region the base value of EIRR is 18%. Under the Monte Carlo simulation test
the mean value of the rate of return decreases
to 11%. Only in this region a change in key
variables and the internalisation of climate
variability and risks would result in an EIRR
equal to 9%, hence lower than the discount rate.
Figure 14: ASAP expected EIRR in the ESA region
Figure 15: ASAP expected EIRR in the LAC region
Figure 16: ASAP expected EIRR in the NEN region

Review of economic and livelihood benefits for ASAP-supported investments
- 20 -
An overview of Monte Carlo simulation results is provided in the following figure and table.
Figure 17: EIRR values, extremes and variability by region
For each region, the table below presents the base EIRR as well as mean, minimum and maximum
values, with 90% confidence interval shown in the last column on the right.
Table 5: Summary of Monte Carlo simulation results
Region Base EIRR (%) Mean EIRR (%) Min. EIRR
(%) Max EIRR (%) 90% confidence interval
WCA 28 16 13 19 14.8 – 17.4
APR 35 26 23 29 24.4 – 27.1
ESA 32 22 18 26 20.3 – 23.3
LAC 23 16 13 18 14.8 – 16.7
NEN 18 11 9 13 10.5 – 11.5

Review of economic and livelihood benefits for ASAP-supported investments
- 21 -
Chapter 3: Mini-systematic review to complement data
The data extrapolation process, necessary for the creation of the database used to undertake the
analysis results presented in the previous chapter, revealed the existence of so-called data gaps in
the estimation of benefits - mostly the environmental ones. To address this gap, a smaller sample
(Sample II) composed by ten projects, two from each IFAD region, have been selected. For each of
them, we identified the potential socio-economic and environmental benefits that could be
estimated in addition to those already assessed at the project design stage within the economic and
financial analysis (Table 6)
Table 6: Benefits estimated for Sample II to integrate the ASAP review database
Country IFAD Environmental benefits estimated Benefits not estimated in this review
Bolivia LAC (i) Implementation of activities specifically related to CC
adaptation such as soil conservation / water savings that
improve agricultural production locally. (ii) Harvest loss
reduction of loss due to climatic natural disasters through
EWS (iii) reduction in the fuelwood consumption by households
Empowering of households and other local
people involved in ASAP participatory
consultations and reference studies
Djibouti NEN Preservation of biodiversity especially marine species -
Ghana WCA Economic value of more efficient water use in water
management schemes, also in commercial value chains
-
Ivory Coast WCA (i) Reforestation; (ii) Adapting cultivation techniques to soil
degradation levels
-
Kenya ESA Environmental protection due to soil, water and environment conservation technologies
Social benefits in terms of food security and nutrition at the household scale, as some of
the production is used for household’s self-
consumption
Kyrgyzstan NEN (i) Increased area of land saved and land reclaimed; (ii) Increased value of nutrient recovery in the soil; and (iii)
increased moisture availability, water infiltration and
improved water quality in pastures through water supply and water harvesting structures.
-
Laos APR Introducing updated methods and technologies (mainly water
management and irrigation) that will upgrade the basis for
environmental-friendly and climate-oriented production.
The support to the technical line agencies
will improve the effectiveness of technical
services, including training on the good practices and CC adapted approaches.
Madagascar ESA Water savings from the irrigation schemes: (i) realize new
potential areas in irrigated areas, (ii) rehabilitation of existing
schemes to restore or improve and expand the water control, and (iii) develop perimeters spate (PEC: Périmètre
d'épandage de crues)
-
Nepal APR (i) Watershed development to agricultural development (ii)
intensification of terrace risers and bunds with forage plantations minimize surface runoff and soil erosion; (iii)
Collection of animal manure urine and its utilization for crop
production and in the preparation of bio-pesticides will minimize GHG emissions
Alternative income generating opportunities
for the poor have not been quantified in the economic analysis

Review of economic and livelihood benefits for ASAP-supported investments
- 22 -
Nicaragua LAC Environmental impact in economic terms of using sustainable
agricultural techniques, such as the use of "microryza" instead of chemical-based manure
-
A text analysis revealed that the integration of environmental benefits should be the preferred one.
In particular, focusing on three main thematic areas: carbon sequestration and biodiversity, soil
conservation and enhancement, water efficiencies and water quality / irrigation ameliorations. The
following step was the identification of the most appropriate techniques and methods to assess such
environmental benefits, as well as the average values extrapolated from a systematic review of the
literature, as well as past and current research work developed under IFAD stream of funding26. The
resulting techniques and methods, as well as values that they produced were applied to the
population constituting Sample II and a new analysis undertaken, similar to the previous chapter in
order to obtain a more comprehensive review of the benefits that ASAP-support investments
generate.
The Systematic Review (SR) is a methodology that synthesises existing evidence - mainly academic
literature but also other official publications, such as reports by globally recognised institutions and
organisations - following rigorous and objective guidelines under the fundamental principle of
transparency and independency applied throughout the process. This evidence-based framework
allows reaching robust and as extensive as possible conclusions on a specific research question in a
standardised manner (Collaboration for Environmental Evidence, 2013; Pullin and Stewart, 2006).
In practical terms, the application of this methodology consisted in the identification of an evidence
need, in our case common techniques and methods to adopt when calculating environmental
benefits related to biodiversity, soil and water preservation and directly attributable to ASAP related
activities. Once investigation questions are identified and the research strategy planned, the review
is conducted. This implies identifying keywords and main research tools to use for the review
purpose. Figure 18 shows the number of results obtained for each combination of keywords in
Google Scholar for each of the main area of interest.
26 For example, the "EFA and Environment methodological review", or the current “Learning Alliance” work by CIAT
and Duft University on developing a tool for the appraisal of costs and benefits for Integrated Agricultural System, the
former, and Climate Smart Agriculture, the latter.

Review of economic and livelihood benefits for ASAP-supported investments
- 23 -
Figure 18: Queries results in Google Scholar
Two additional sources of data were the Environmental Valuation Reference Inventory (EVRI)27
and the Web of Science Service for UK Education28, using the same combination of keywords.
Contingent Valuation (CV) is the most commonly used technique to evaluate environmental
amenities in the literature, according to our SR exercise. It is often employed in the economic
assessment of environmental benefits deriving from activities concerning biodiversity (Christie et
al., 2006; Ingraham and Foster, 2008; Loomis and White, 1996; Loureiro and Ojea, 2008;
Richardson and Loomis, 2009). It is a survey-based methodology through which various
hypothetical scenarios are presented to the individual in order to compute the access fees that
maximize financial revenues from visitors. A range of values for each of the use and/or non-use
values of environmental amenities are the results deriving from this methodology which requires
primary data collection.
Alternatively, whenever a collection of primary data is not possible, the Benefit Transfer (BT)
technique is used. It consists in monetary estimation of ecosystem services by utilizing information
included in the literature about economic assessments endeavoured in similar settings (Liu et al.,
2011; Bateman et al., 2011; Colombo et al., 2007; Shrestha et al., 2007).
The SR also supported us in the identification of average values to apply the BT for Sample II
assessing environmental benefits not originally assessed in the first place, as per table above
presented at the beginning of this chapter (Table 6).
27 https://www.evri.ca/ available in English, French and Spanish. 28 http://wok.mimas.ac.uk/

Review of economic and livelihood benefits for ASAP-supported investments
- 24 -
3.1 Biodiversity (and carbon sequestration)
The evidence-based review for techniques and values to estimate environmental and socio-
economic benefits related to biodiversity preservation also provided considerable information on
carbon sequestration, both in technical and monetary level.
According to the literature explored, in Latin and South America carbon savings from conservation
of already existing forests ranges on average from 3.15 to 8.67 tons of CO2eq Ha-1 year -1. At a
global scale, an average of 125 to 150 tCO2eq Ha-1 year -1 can be expected; as shown in Table 7.
For the integrated appraisal of benefits in Sample II, the average value of 6.67 t CO2eq Ha-1 year -1
is selected. The rationale behind the exclusion of the values deriving from global studies stays in the
rather too heterogeneous array of values behind these estimates.
Table 7: Carbon savings from conservation of already existing forests (tCO2-eq/Ha/yr)
The review also provided further indications on the yearly price per ton of CO2 equivalent that
should be considered in the economic estimations. As shown Table 8, the average price in the
studies that coincidentally took all place in the LAC region, is of about $2.54. However, for the
appraisal of benefits, we decided to use the average value commonly used in EFA’s estimations of
$4 per ton of CO2-eq for all programmes under analysis.
Table 8: Carbon price (2015 USD/tCO2-eq/yr)

Review of economic and livelihood benefits for ASAP-supported investments
- 25 -
As expected, the wide range of definitions for biodiversity and the approaches used to determine the
economic value was reflected in the results of the systematic review.
Table 9: Biodiversity species evaluation (2015 USD/Ha/yr)
Interestingly, the average yearly economic value of $239.95 per Ha of project area dedicated to
conservation and preservation of biodiversity is almost identical to the average Total Economic
Value that the systematic review revealed to be for forestry services, which equals $235.54/Ha/yr.
3.2 Soil and water
Those ASAP activities implemented towards soil conservation and enhancement, or water savings
measures and water quality amelioration are valued using the yearly average worth of $116.33/Ha.
This value derives from the combination of several studies that reported such amount to quantify in
monetary terms watershed protection, flood-control, soil-erosion control and protection of fishing
grounds (Gössling, 1999; Ruitenbeek, 1989; Adger et al., 1995; Pimentel et al., 1995).
In the case of water-only activities, the quantification of correlated benefits will be undertaken
using the average value of $30.00/Ha that emerged from a study by Bishop and Pagiola (2012)
regarding the Payment of Ecosystem Services for water provision in Costa Rica.
Review of economic and livelihood benefits for ASAP-supported investments
- 26 -
Chapter 4: Revised benefits appraisal
Once the most adequate techniques were identified for the assessment of benefits neglected in the
original calculations, these were applied to Sample II. In particular, in applying the BT to Sample II
we firstly used average values obtained in the benefits and costs calculations undertaken by other
ASAP-supported investments and later then we used the average values that emerged from the SR
exercise. In this chapter, we present mainly the results from the analysis of revised benefits on
Sample II using BT with values from SR, which are indicated in figures and tables with the “post-
SR” labelling. Figures obtained applying BT on Sample II with values from other projects are
instead labelled as “pre-SR”.
4.1. Value for money on ASAP-supported investments (Sample II)
The two figures below report the BCR and the NPV values for whole sample of 32 projects but for
those countries selected as part of Sample II, the environmental benefits have been assessed
applying the BT technique.
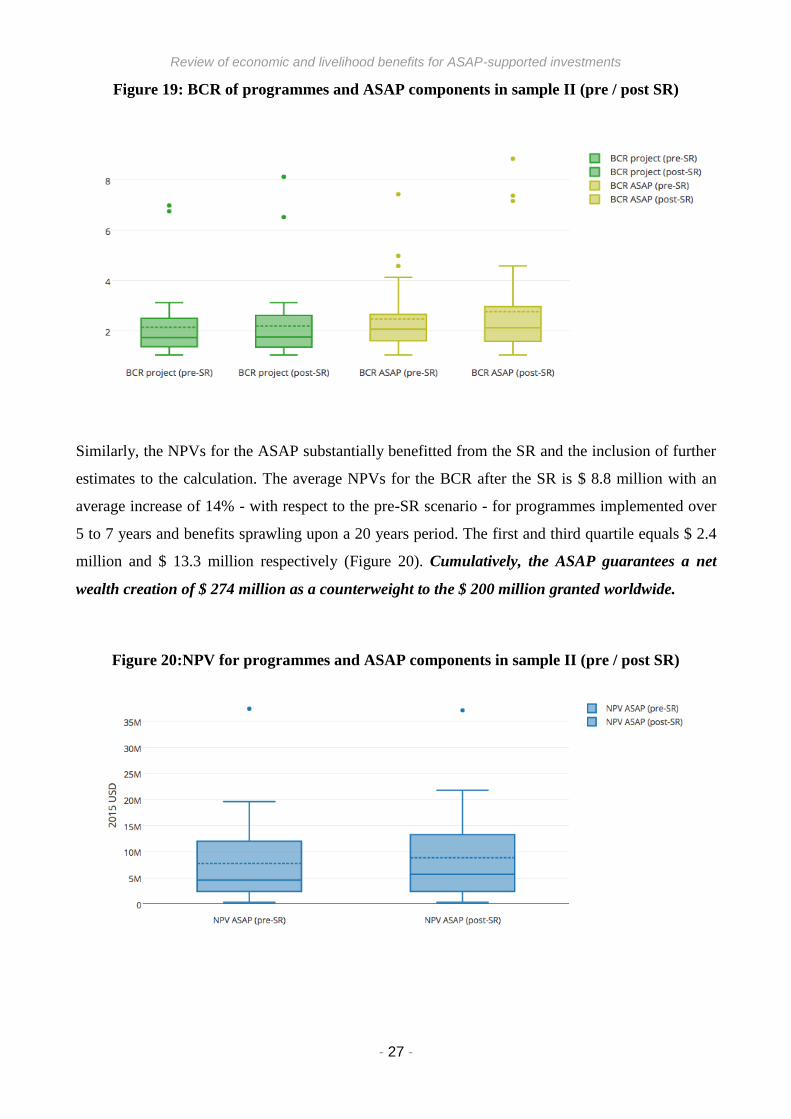
The results of the BCR analysis in Figure 19 shows that in programmes including ASAP
components, expected benefits will roughly double the costs and on average the BCR would be 2.47
with a minimum ratio equals to 1.05. For every dollar invested, the project is expected to generate
and redistribute to project beneficiary an extra worth that ranges between $ 0.60 (first quartile)
and $ 1.66 (third quartile) with an average return of $1.47 per dollar invested. In comparison with
the initially assessed values, the expected generation and redistribution to project beneficiaries after
the SR is 12% higher. Values for the ASAP component alone are also higher than the initial Sample
I, after the SR exercise. Once the revised benefits are included in the analysis the average ratio
value for the ASAP component is 2.77, and potential returns for every dollar invested in the
ASAP shift upward between $0.59 - $1.96 with an average value of $1.76 per dollar invested.
Review of economic and livelihood benefits for ASAP-supported investments
- 27 -
Figure 19: BCR of programmes and ASAP components in sample II (pre / post SR)
Similarly, the NPVs for the ASAP substantially benefitted from the SR and the inclusion of further
estimates to the calculation. The average NPVs for the BCR after the SR is $ 8.8 million with an
average increase of 14% - with respect to the pre-SR scenario - for programmes implemented over
5 to 7 years and benefits sprawling upon a 20 years period. The first and third quartile equals $ 2.4
million and $ 13.3 million respectively (Figure 20). Cumulatively, the ASAP guarantees a net
wealth creation of $ 274 million as a counterweight to the $ 200 million granted worldwide.
Figure 20:NPV for programmes and ASAP components in sample II (pre / post SR)
Review of economic and livelihood benefits for ASAP-supported investments
- 28 -
4.2. Economic returns on ASAP-supported investments (Sample II)
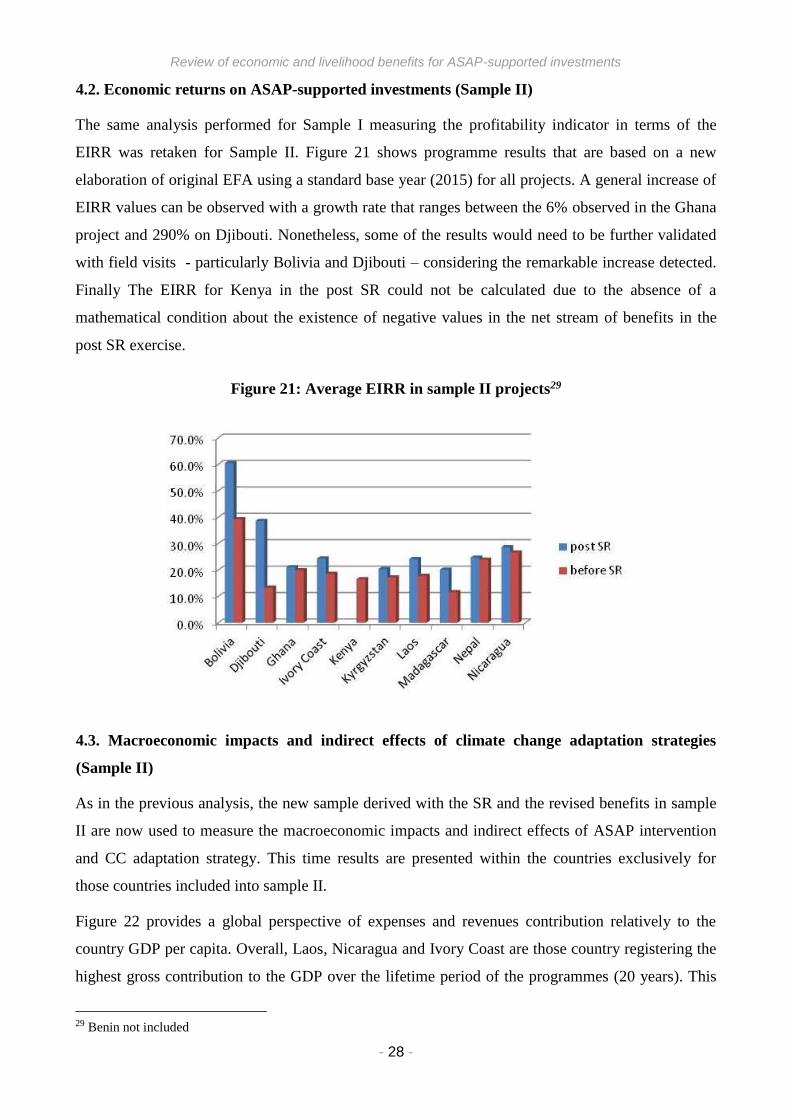
The same analysis performed for Sample I measuring the profitability indicator in terms of the
EIRR was retaken for Sample II. Figure 21 shows programme results that are based on a new
elaboration of original EFA using a standard base year (2015) for all projects. A general increase of
EIRR values can be observed with a growth rate that ranges between the 6% observed in the Ghana
project and 290% on Djibouti. Nonetheless, some of the results would need to be further validated
with field visits - particularly Bolivia and Djibouti – considering the remarkable increase detected.
Finally The EIRR for Kenya in the post SR could not be calculated due to the absence of a
mathematical condition about the existence of negative values in the net stream of benefits in the
post SR exercise.
Figure 21: Average EIRR in sample II projects29
4.3. Macroeconomic impacts and indirect effects of climate change adaptation strategies
(Sample II)
As in the previous analysis, the new sample derived with the SR and the revised benefits in sample
II are now used to measure the macroeconomic impacts and indirect effects of ASAP intervention
and CC adaptation strategy. This time results are presented within the countries exclusively for
those countries included into sample II.
Figure 22 provides a global perspective of expenses and revenues contribution relatively to the
country GDP per capita. Overall, Laos, Nicaragua and Ivory Coast are those country registering the
highest gross contribution to the GDP over the lifetime period of the programmes (20 years). This
29 Benin not included
Review of economic and livelihood benefits for ASAP-supported investments
- 29 -
time, the inclusion of the environmental benefits calculated thanks to the SR would in general
increase programmes’ contribution to GDP growth. The highest contribution attributable to the
environmental benefits are registered in Laos and Djibouti where somehow, programme activities
and literature review allowed for a more comprehensive understanding of environmental upsides
related to CC adaptation activities. Differently, where results are minimal there is space for a more
thorough and ad-hoc investigation as the SR has provided marginal evidence on the environmental
benefits related to some activities. Where properly estimated and substantiated by facts,
environmental benefits – hence ASAP relevance – remarkably increase the effectiveness and
contribution of ASAP investments to farmers livelihoods.
Figure 22: Programmes and ASAP categories’ values as percentage of GDP in the area of
intervention
Considering ASAP components alone, most countries have benefitted by the literature review and
the inclusion of environmental benefits, while few others have been slightly downgraded
(Nicaragua) to more conservative levels.
In particular, Djibouti, Kenya and Laos present the highest values of ASAP contribution to the GDP
growth with an increase of 36%, 33%, 21% respectively compared to the base case. After
environmental externalities are taken into account, ASAP contribution to GDP growth averages
the 22% of its total value - roughly the 1.2 % yearly – marking a notable increase with respect the
7% and the 0.3 % of the base case contribution.
Review of economic and livelihood benefits for ASAP-supported investments
- 30 -
Figure 23: ASAP contribution to GDP growth in the area of intervention
4.4. Expected outcomes vis-à-vis ASAP pre-identified risks and climate variability (Sample II)
The revision of the expected benefits has the main consequence of reducing the volatility and the
likelihood of some risks thus decreasing the width of the probability distributions with respect to
possible outcomes of IFAD - ASAP programmes.
Figure 23 presents the probability distribution and frequency of NPVs results under pre-identified
risks and climate variability, for the ASAP component alone (top graph) and the whole programme
(bottom graph). Generally, programmes tend to remain viable even in light of the changes brought
into the analysis. The majority of the curves’ bells and peaks are indeed centred in the right hand
side area of the graphs towards higher and more profitable results. Some other are instead more at
risk (Ghana, Ivory Coast, and Madagascar) as larger parts of the frequency bells crosses the zero
and extend towards more negative values. Despite an overall increase in programmes’ expected
results after the SR excise., this analysis proves that few of these countries are still at steak of the
climate variability and other risks. A successful implementation of programme activities and a
close monitoring of key variables are deemed necessary to reduce to the maximum extend the
likelihood of negative NPVs.

Review of economic and livelihood benefits for ASAP-supported investments
- 31 -
Figure 24: ASAP NPV (top) and whole programmes NPV (bottom) probability distribution
Conclusive remarks on accountability framework of economic and livelihood benefits for
ASAP-supported investments
This work presented a review of economic and livelihood benefits aimed at quantifying the socio-
economic and environmental benefits attributable to ASAP investments. In particular, the team
investigated a sample of 32 approved projects since 2010 which included ASAP components so as
to measure: i) the value for money of ASAP, ii) the economic returns on 1 USD dollar spent on
ASAP, iii) the macroeconomic impacts and indirect effects of climate change adaptation strategies,
and finally iv) the expected outcomes vis-à-vis pre-identified risks and climate variability. These
results are integrated in the light of data gaps, which appeared a relevant issue to overcome for the
calculation of environmental benefits.
Review of economic and livelihood benefits for ASAP-supported investments
- 32 -
A preliminary analysis of the whole sample confirmed the ASAP-support investments are
characterised by value for money with economic returns on each dollar invested in agriculture
smallholders adaptation to climate change. On average, for a project that is implemented between 5
to 7 years and undertaking an economic and financial analysis over a period of 20 years, for every
dollar invested, the project is expected to generate and redistribute to project beneficiary an extra
worth that ranges between $ 0.44 to $ 1.63 on average. A “representative” project with ASAP
component completely offsets its costs and still contributes to value generation for about $ 0.35
million on average on a yearly basis (NPV of $ 6.8 million).
A more in-depth analysis where data gaps about environmental benefit have been addressed via the
SR and BT techniques further validated the preliminary findings and has shown an increase of
roughly the 12% with respect to initially values. Once the revised benefits are included in the
analysis, the average ratio value for the ASAP component reaches 2.77, and potential returns for
every dollar invested in the ASAP shift upward between $0.59 - $1.96 with an average value of
$1.77 per dollar invested. Similarly, the NPVs for the ASAP substantially benefitted from the SR
and the inclusion of further estimates to the calculation. The average NPVs after the SR is $ 8.8
million with an average increase of 14% - with respect to the pre-SR scenario. Every year the ASAP
would redistribute the equivalent of $ 0.45 million while cumulatively guaranteeing a net wealth
creation of $ 274 million as a counterweight to the $ 200 million granted worldwide.
To estimate the macroeconomics impact of projects and programmes with an ASAP component, we
have analysed the ratio between costs and benefits in relation to the changes in the GDP of the area
of intervention. It was shown that on average the socio-economic benefits generated by the
implementation of such interventions correspond to half of the GDP estimated in the target areas.
ASAP alone – once environmental externalities are taken into account – would contribute the 22%
of the GDP total value over the 20 years’ time period, being responsible for the 1.2% of value added
formation in the area of intervention.
Finally, programmes’ results are tested to climate variability as predicted by the IPCC group by
estimating the changes in probability of crop production under long-term climate scenarios for
different regions. Generally, the analysis showed positive indicators for most countries, with some
proving resilience in spite of the changes and few others put at steak by the climate variability. A
successful implementation of programme activities and a close monitoring of key variables are
deemed necessary to reduce to the maximum extend the likelihood of negative NPVs.
Despite the evidence provided that ASAP-supported investments generate relevant economic and
livelihood benefits, a major challenge in performing this review has been the quantity and quality

Review of economic and livelihood benefits for ASAP-supported investments
- 33 -
data available to create the database used as input of our analysis. Furthermore, to validate and
consolidate results presented in the previous paragraph, it is strongly suggested to conduct a CV. It
is, therefore, suggested to compose a third sample with at least 2 virtuous ASAP project, whose
implementation is in an advanced state. For this sample, field visits should be arranged to collect
standardised evidences about ASAP impacts, consolidating the soundness of the results, i.e. their
scientific robustness. Furthermore, running a CV can be considered as the first step towards what
seems to be a necessary effort by analysts in estimating environmental benefits that are directly
generated by ASAP-supported investments, as well as review how valuations are undertaken in the
project cycle with follow up in mid-term and end-of-project.
To this purpose, it is suggested to conduct reviews of benefits generated by ASAP-supported
investments on a regular temporal basis. This has the twofold advantage of providing accountability
information to donors about the actions initiated by IFAD, as well as creating organisation know-
how as per the assessment of economic and financial feasibility of projects and programmes
towards a standardised manner of undertaking such task. Corollary to this, it is the creation of a
common database owned and managed by IFAD in which all information gathered, used and
generated within the EFA process, is stored in an organisational repository that will contribute
towards the efficiency and efficacy amelioration of investments supporting adaptation for
smallholder agriculture to incumbent challenges of climate change impacts.

Review of economic and livelihood benefits for ASAP-supported investments
- 34 -
Reference
Adger, W.N., Brown, K., Cervigni, R., Moran, D., 1995. Total Economic Value of Forests in Mexico.
Ambio 24, 286–296.
Barr, J., Christie, A., 2015. Improving the Practice of Value for Money Assessment. Centre for
Development Impact, Practice Paper.
Bateman, I.J., Mace, G.M., Fezzi, C., Atkinson, G., Turner, K., 2011. Economic analysis for ecosystem
service assessments. Environmental and Resource Economics 48, 177–218.
Bishop, J., Pagiola, S., 2012. Selling forest environmental services: market-based mechanisms for
conservation and development. Taylor & Francis.
Christie, M., Fazey, I., Cooper, R., Hyde, T., Kenter, J.O., 2012. An evaluation of monetary and non-
monetary techniques for assessing the importance of biodiversity and ecosystem services to people
in countries with developing economies. Ecological economics 83, 67–78.
Christie, M., Hanley, N., Warren, J., Murphy, K., Wright, R., Hyde, T., 2006. Valuing the diversity of
biodiversity. Ecological economics 58, 304–317.
Colombo, S., Calatrava-Requena, J., Hanley, N., 2006. Analysing the social benefits of soil conservation
measures using stated preference methods. Ecological Economics 58, 850–861.
DfID, 2011. DFID’s Approach to Value for Money (VfM). Department for International Development.
Dixon, J.A., 2008. Environmental Valuation: Challenges and Practices. A Personal View [WWW
Document]. URL
http://www.rff.org/files/sharepoint/Documents/08_Tropics_Conference/Tropics_Conference_Paper
s/Tropics_Conference_Dixon_Environmenal_Valuation.pdf (accessed 3.24.16).
Edwards, M., 2000. Community guide to development impact analysis. Madison, WI: University of
Wisconsin-Madison.
Feldmann, U., Dyck, V.A., Mattioli, R.C., Jannin, J., 2005. Potential Impact of Tsetse Fly Control
Involving the Sterile Insect Technique, in: Dyck, V.A., Hendrichs, J., Robinson, A.S. (Eds.), Sterile
Insect Technique. Springer Netherlands, pp. 701–723.
Gössling, S., 1999. Ecotourism: a means to safeguard biodiversity and ecosystem functions? Ecological
Economics 29, 303–320.
Hanley, N., 1993. Cost-benefit analysis and the environment. EE Publisher.

Review of economic and livelihood benefits for ASAP-supported investments
- 35 -
IFAD, 2012. Internal Guidelines for Economic and Financial Analysis of Rural Investment Projects at
IFAD. Rome, Italy.
Ingraham, M.W., Foster, S.G., 2008. The value of ecosystem services provided by the U.S. National
Wildlife Refuge System in the contiguous U.S. Ecological Economics 67, 608–618.
doi:10.1016/j.ecolecon.2008.01.012
Jayasuriya, D., 2013. What is Value for Money in aid programs? Dev policy Blog from the
Development Policy Centre. URL http://devpolicy.org/what-is-value-for-money-in-aid-programs-
20130819-1/ (Last accessed 07.07.2016).
Laganda, G., 2016. ASAP Quarterly Newsletter - April 2016 [WWW Document]. IFAD. URL
https://www.ifad.org/documents/10180/343a2ddc-4067-422c-b99c-1c326b01f76e (Last accessed
09.07.2016).
Liu, S.C., Trainer, M., Fehsenfeld, F.C., Parrish, D.D., Williams, E.J., Fahey, D.W., Hübler, G.,
Murphy, P.C., 1987. Ozone production in the rural troposphere and the implications for regional
and global ozone distributions. Journal of Geophysical Research: Atmospheres 92, 4191–4207.
Loomis, J.B., White, D.S., 1996. Economic benefits of rare and endangered species: summary and meta-
analysis. Ecological Economics 18, 197–206.
Loureiro, M.L., Ojea, E., 2008. Valuing local endangered species: the role of intra-species substitutes.
Ecological Economics 68, 362–369.
Norman, M., 2015. Food and livelihoods in a changing climate: the role of climate finance for
agriculture. ODI Working Paper 429.
ODI, 2015. Adaptation for Smallholder Agriculture Programme (ASAP) - Progress Review. Overseas
Development Institute (ODI).
Pimentel, D., Harvey, C., Resosudarmo, P., Sinclair, K., others, 1995. Environmental and economic
costs of soil erosion and conservation benefits. Science 267, 1117.
Richardson, D.S., 2000. Skill and relative economic value of the ECMWF ensemble prediction system.
Quarterly Journal of the Royal Meteorological Society 126, 649–667.
Shrestha, R., Rosenberger, R., Loomis, J., 2007. Benefit transfer using meta-analysis in recreation
economic valuation, in: Environmental Value Transfer: Issues and Methods. Springer, pp. 161–177.
Zeppel, H., 2006. Indigenous Ecotourism: Sustainable Development and Management. CABI.

Review of economic and livelihood benefits for ASAP-supported investments
- 36 -
Annex I: ASAP-supported investments for Sample I
The 32 ASAP-supported investments that have been included in the initial sample of this work are
reported in the table below. Project names are presented in the original language of preparation to
safeguard the meaning of project’s acronym.
COUNTRY REGION TITLE STATUS30
Benin WCA Projet d'Appui au Développement du Maraîchage au Bénin (PADMAR) Approved
Bhutan APR Commercial Agriculture and Resilient Livelihoods Enhancement Programme
(CARLEP) Approved
Bolivia LAC Programa de Adaptación para la Agricultura en Pequeña Escala (ACCESOS) Implementation
Cambodia APR Agricultural Services Programme for Innovations, Resilience and Extension (ASPIRE) Implementation
Chad WCA Projet d'Amélioration de la Résilience des Systèmes
Agricoles au Tchad (PARSAT)
Implementation
Djibouti NEN Programme to Reduce Vulnerability in Coastal Fishing Aras Implementation
Ecuador LAC Proyecto de Fortalecimiento de los Actores Rurales de la Economía Popular y Solidaria Approved
Egypt NEN Sustainable Agriculture Investments and Livelihoods (SAIL) Implementation
El Salvador LAC Rural Adelante - Programa Nacional de Transformación Económica Rural Approved
Gambia WCA National agricultural land and water management development project (NEMA) Approved
Ghana WCA Ghana Agriculture Sector Investment Programme (GASIP) Implementation
Ivory Coast WCA Projet d'Appui à la Production Agricole et à la commercialisation (PROPACOM) +
PROPACOM Extension Ouest
Implementation
Kenya ESA Climate Resilient Agricultural Livelihoods Programme (KCEP-CRAL) -> KCALP Implementation
Kyrgyzstan NEN Livestock and Market Development Programme II Implementation
Laos APR Adaptation to Climate Change in Southern Laos (ACCSL) Implementation
Lesotho ESA Wool and Mohair Production Project (WAMPP) Implementation
Liberia WCA Tree Crop Extension Project (TCEP) Approved
Madagascar ESA Project to Support Development in the Menabe and Melaky Regions - AD2M-Phase II Implementation
Malawi ESA Programme for Rural Irrigation Development (PRIDE) Approved
Morocco NEN Programme de Developpement Rural des Zones de Montagne (PDRZM) Implementation
Mozambique ESA Pro-Poor Value Chain Development Project in the Maputo and Limpopo Corridors (PROSUL)
Implementation
Nepal APR Adaptation for Smallholders in the Hilly Areas (ASHA) Implementation
Nicaragua LAC Adapting to changing markets and the effects of climate change Implementation
Niger WCA Programme de Promotion de l'Agriculture Familiale dans les régions de Maradi,
Tahoua et Zinder (PRODAF)
Implementation
Nigeria WCA Climate Change Adaptation and Agribusiness Support Programme (CASP) Implementation
30 As of December 2015
Review of economic and livelihood benefits for ASAP-supported investments
- 37 -
Paraguay LAC Project for Family and Indigenous Production Approved
Rwanda ESA Post-harvest and Agribusiness Support Project (PASP)
Implementation
Sudan NEN Livestock Marketing and Resilience Programme Implementation
Tajikistan NEN Livestock and Pasture Development II (LPDP II) Approved
Tanzania ESA Bagamoyo Sugar Outgrower and Community Development Programme (BSIASCDP) Approved
Uganda ESA Programme for the Restoration of Livelihoods in the Northern Region (PRELNOR) Implementation
Viet Nam APR Adaptation to Climate Change in the Mekong River Delta Region (AMD) Implementation
Annex II: ASAP-supported investments for Sample II
The following 10 countries were selected for Sample II
Country Region Environmental benefits estimated
Bolivia LAC (i) Implementation of activities specifically related to CC adaptation such as soil conservation / water
savings that improve agricultural production locally. (ii) Harvest loss reduction of loss due to climatic natural disasters through EWS (iii) reduction in the fuelwood consumption by households
Djibouti NEN Preservation of biodiversity especially marine species
Ghana WCA Economic value of more efficient water use in water management schemes, also in commercial value
chains
Ivory Coast WCA (i) Reforestation; (ii) Adapting cultivation techniques to soil degradation levels
Kenya ESA Environmental protection due to soil, water and environment conservation technologies
Kyrgyzstan NEN (i) Increased area of land saved and land reclaimed; (ii) Increased value of nutrient recovery in the soil;
and (iii) increased moisture availability, water infiltration and improved water quality in pastures through
water supply and water harvesting structures.
Laos APR Introducing updated methods and technologies (mainly water management and irrigation) that will
upgrade the basis for environmental-friendly and climate-oriented production.
Madagascar ESA Water savings from the irrigation schemes: (i) realize new potential areas in irrigated areas, (ii)
rehabilitation of existing schemes to restore or improve and expand the water control, and (iii) develop perimeters spate (PEC: Périmètre d'épandage de crues)
Nepal APR (i) Watershed development to agricultural development (ii) intensification of terrace risers and bunds with forage plantations minimize surface runoff and soil erosion; (iii) Collection of animal manure urine and its
utilization for crop production and in the preparation of bio-pesticides will minimize GHG emissions
Nicaragua LAC Environmental impact in economic terms of using sustainable agricultural techniques, such as the use of
"microryza" instead of chemical-based manure