Review helpfulness assessment_aug15
54
AN ARGUMENTATION MINING APPROACH TO REVIEW HELPFULNESS Kristien Verreydt August 11 th , 2015
-
Upload
kristien-verreydt -
Category
Engineering
-
view
84 -
download
0
Transcript of Review helpfulness assessment_aug15

AN ARGUMENTATION MINING APPROACH TO REVIEW HELPFULNESSKristien VerreydtAugust 11th, 2015

Motivations• Review voting behaviour of users is inconsistent and influenced by multiple biases• Bias towards helpfulness voting• Earlybird bias (Krishnamoorthy 2015)• Platform ranking bias• Big data bias• ...
• Unbiased system would allow objective review helpfulness assessment• Reviews with highest quality would be showed on top of the page and aid users in decision making• More commercial uses, e.g. real-time helpfulness information for reviewers when writing new posts (source?)

Hypotheses and contributions• Hypothesis version 1: a review is more helpful if its writing is of high quality
• Assumption 1: readability is a qualitative measure that has proven influence on review helpfulness. Adding a second qualitative measure would further improve the helpfulness scoring.
• Assumption 2: argumentative richness is a measure of review quality• Hypothesis version 2: as there is no unique measure distinguishing helpful vs. non-helpful reviews, review helpfulness assessment is ideally a hybrid system combining different feature sources (in concordance with findings by Krishnamoorthy 2015 and multiple others using combinations of feature sources)
• Contribution: by combining baseline features from existing literature with argumentation features, we obtain a more accurate helpfulness assessment system.

Features• Baseline features• Combination of review metadata and commonly accepted content features and/or stylometric features
• Argumentation features: • simple argumentative patterns;; lexicon-based approach• Argumentation connectives from Penn Discourse Treebank• Argumentation classes from Penn Discourse Treebank• (Prasad, Miltsakaki, Dinesh, Lee, Joshi, Robado, Webber 2007)
• Features not taken into account due to inaccessiblity• Reviewer reputation (although highly important in multiple works)• Product information (however, high level of uniformity of products in used datasets guaranteed by sources)

Baseline features• Rating
• Viswanathan, Mooney & Ghosh 2014 + multiple others• Extreme rating (1 & 5 vs. 2, 3 & 4)
• Cao, Duan & Gan 2011: 520 (extremity bias), Chua, Alton & Banerjee 2014• Review length in words
• Pan & Zhang 2011, Viswanathan, Mooney & Ghosh 2014• Average sentence length
• Viswanathan, Mooney & Ghosh 2014• First person• Second person• Polarity (= sentiment)
• Positivity bias• Quaschning, Pandelaere & Vermeir 2014: 136
• Negativity bias• Cao, Duan, Gan 2011: 518• Quaschning, Pandelaere & Vermeir 2014: 137• Wu, van der Heijden, Korfiatis 2014
• Subjectivity• Ghose & Ipeiriotis 2011, Krishnamoorthy 2015
• Readability • (SMOG, Flesch-Kincaid, Gunning-Fog, Coleman-Liau)• O’Mahony & Smyth 2010, Chua & Banerjee 2014

Evaluation setups• Literature baseline setups• Using selection of features in “baseline features”• Cf. next slide
• Complete baseline feature set• Using full list of baseline features
• Argumentation features• Using argumentation features and argumentation classes
• Best feature set• Baseline features + argumentation features
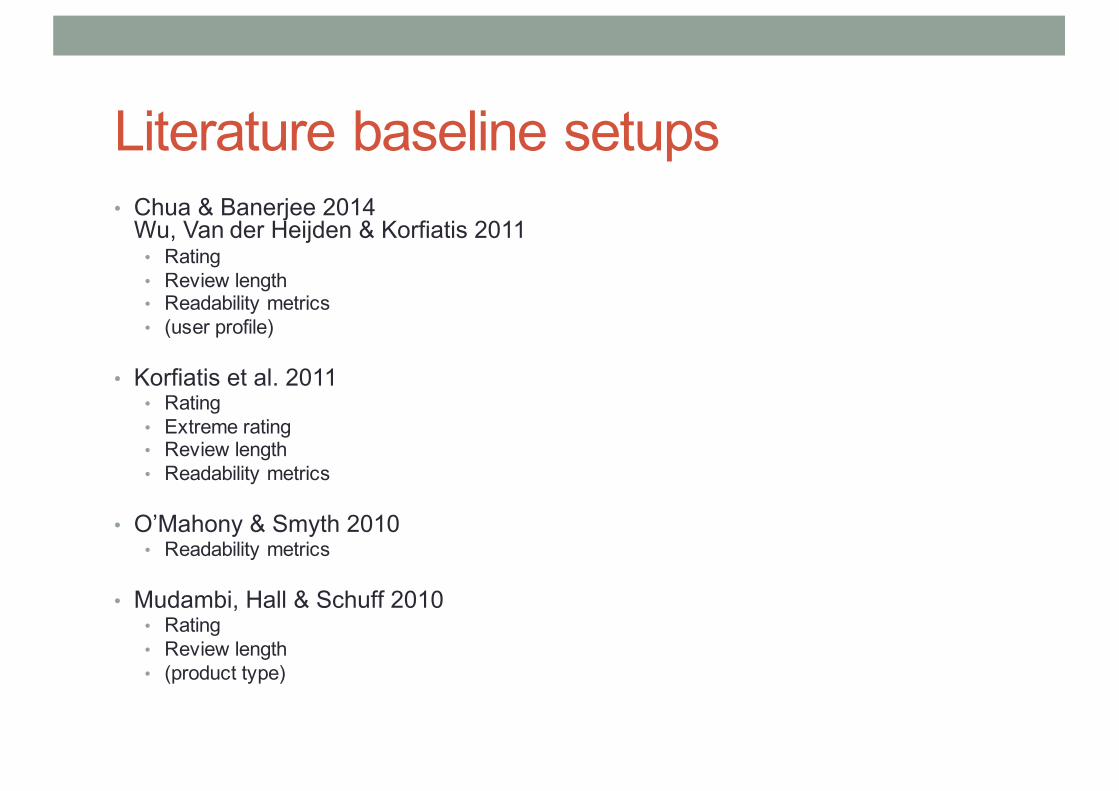
Literature baseline setups• Chua & Banerjee 2014Wu, Van der Heijden & Korfiatis 2011• Rating• Review length• Readability metrics• (user profile)
• Korfiatis et al. 2011• Rating• Extreme rating• Review length• Readability metrics
• O’Mahony & Smyth 2010• Readability metrics
• Mudambi, Hall & Schuff 2010• Rating• Review length• (product type)

Data• Multiple data sources• Assure generalizability over product type• Found in multiple works• e.g. O’Mahony 2010, Ngo-Ye & Sinha 2014
• Amazon product review data• Books, CDs and DVDs• Reviews selected randomly from Liu’s dataset
• Tripadvisor hotel data• Hotels• Reviews selected randomly from Wang’s dataset
• Yelp local businesses data• Restaurants, bars• Reviews selected randomly from Yelp Challenge dataset

AMAZON PRODUCT REVIEW DATAJindal & Liu, WSDM-2008

Data set• Amazon product reviews gathered by Jindal & Liu (UIC, 2008), consisting of > 5.8 million reviews• Books, CDs, DVDs (mostly “experience goods” according to the definition of Nelson 1970)• Random selection of 10 000 Amazon product reviews • 7818 voted as helpful and 2182 as unhelpful • omitted all reviews with less than 10 total votes (conform to Liu et al. 2008 and Krishnamoorthy 2015)
• using helpfulness threshold of 0.6 (6 out of 10 voted helpful) which performs best according to Ghose & Ipeiriotis 2012
• highly imbalanced data set requires data preprocessing

Preprocessing and classification parameters• ZeroR • SMO/SVM• RandomForest (proven to perform best for review classification)• Breiman 2001• O’Mahony, Cunningham & Smyth 2010
• 10-fold cross-validation
• Weka• Hall, Frank, Homes, Pfahringer, Reutemann & Witten 2009
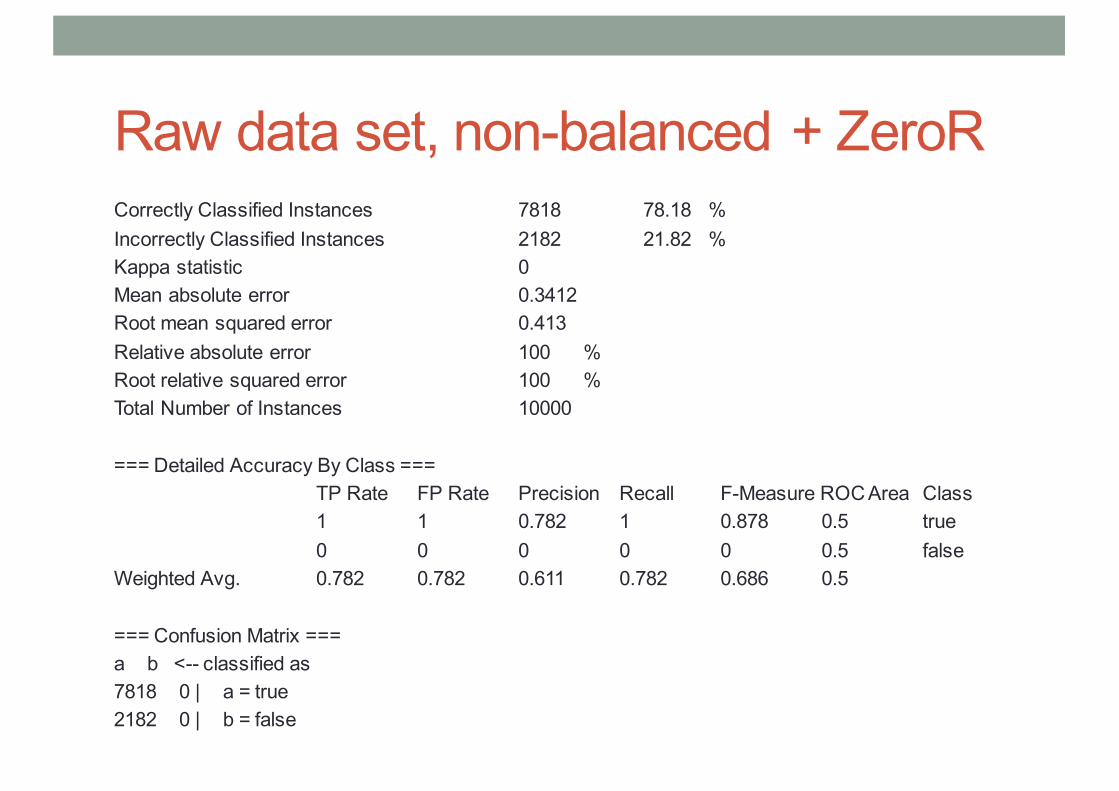
Raw data set, non-balanced + ZeroRCorrectly Classified Instances 7818 78.18 %Incorrectly Classified Instances 2182 21.82 %Kappa statistic 0 Mean absolute error 0.3412Root mean squared error 0.413 Relative absolute error 100 %Root relative squared error 100 %Total Number of Instances 10000
=== Detailed Accuracy By Class === TP Rate FP Rate Precision Recall F-Measure ROC Area Class 1 1 0.782 1 0.878 0.5 true 0 0 0 0 0 0.5 false
Weighted Avg. 0.782 0.782 0.611 0.782 0.686 0.5
=== Confusion Matrix === a b <-- classified as 7818 0 | a = true 2182 0 | b = false
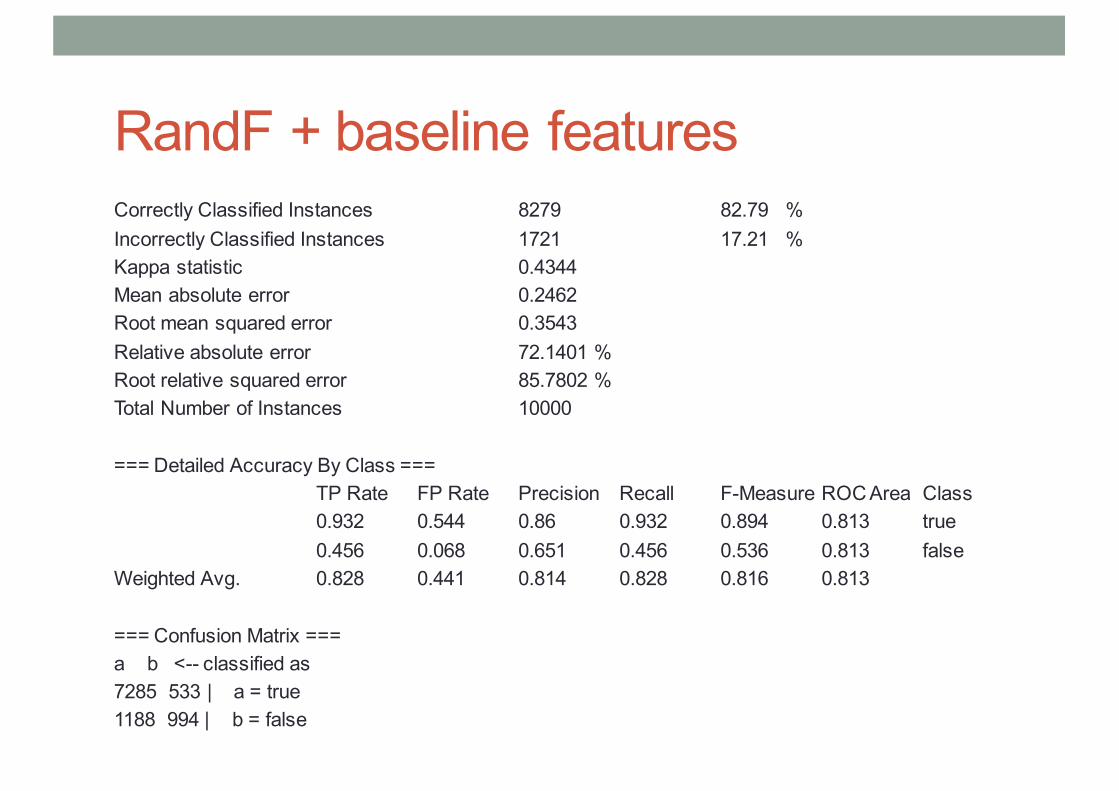
RandF + baseline featuresCorrectly Classified Instances 8279 82.79 %Incorrectly Classified Instances 1721 17.21 %Kappa statistic 0.4344Mean absolute error 0.2462Root mean squared error 0.3543Relative absolute error 72.1401 %Root relative squared error 85.7802 %Total Number of Instances 10000
=== Detailed Accuracy By Class === TP Rate FP Rate Precision Recall F-Measure ROC Area Class 0.932 0.544 0.86 0.932 0.894 0.813 true 0.456 0.068 0.651 0.456 0.536 0.813 false
Weighted Avg. 0.828 0.441 0.814 0.828 0.816 0.813
=== Confusion Matrix === a b <-- classified as 7285 533 | a = true 1188 994 | b = false

RandF + argumentationCorrectly Classified Instances 7859 78.59 %Incorrectly Classified Instances 2141 21.41 %Kappa statistic 0.1012Mean absolute error 0.314 Root mean squared error 0.4008Relative absolute error 92.0112 %Root relative squared error 97.047 %Total Number of Instances 10000
=== Detailed Accuracy By Class === TP Rate FP Rate Precision Recall F-Measure ROC Area Class 0.98 0.909 0.794 0.98 0.877 0.653 true 0.091 0.02 0.558 0.091 0.156 0.653 false
Weighted Avg. 0.786 0.715 0.743 0.786 0.72 0.653
=== Confusion Matrix === a b <-- classified as 7661 157 | a = true 1984 198 | b = false
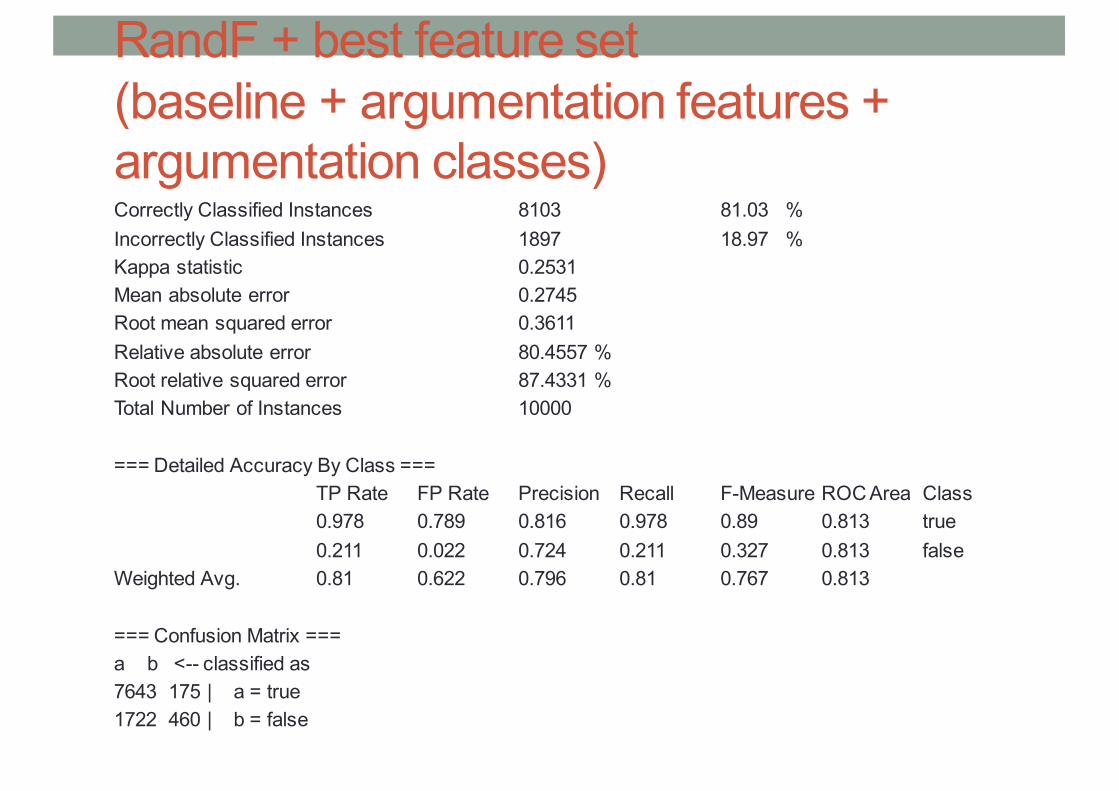
RandF + best feature set(baseline + argumentation features + argumentation classes)Correctly Classified Instances 8103 81.03 %Incorrectly Classified Instances 1897 18.97 %Kappa statistic 0.2531Mean absolute error 0.2745Root mean squared error 0.3611Relative absolute error 80.4557 %Root relative squared error 87.4331 %Total Number of Instances 10000
=== Detailed Accuracy By Class === TP Rate FP Rate Precision Recall F-Measure ROC Area Class 0.978 0.789 0.816 0.978 0.89 0.813 true 0.211 0.022 0.724 0.211 0.327 0.813 false
Weighted Avg. 0.81 0.622 0.796 0.81 0.767 0.813
=== Confusion Matrix === a b <-- classified as 7643 175 | a = true 1722 460 | b = false
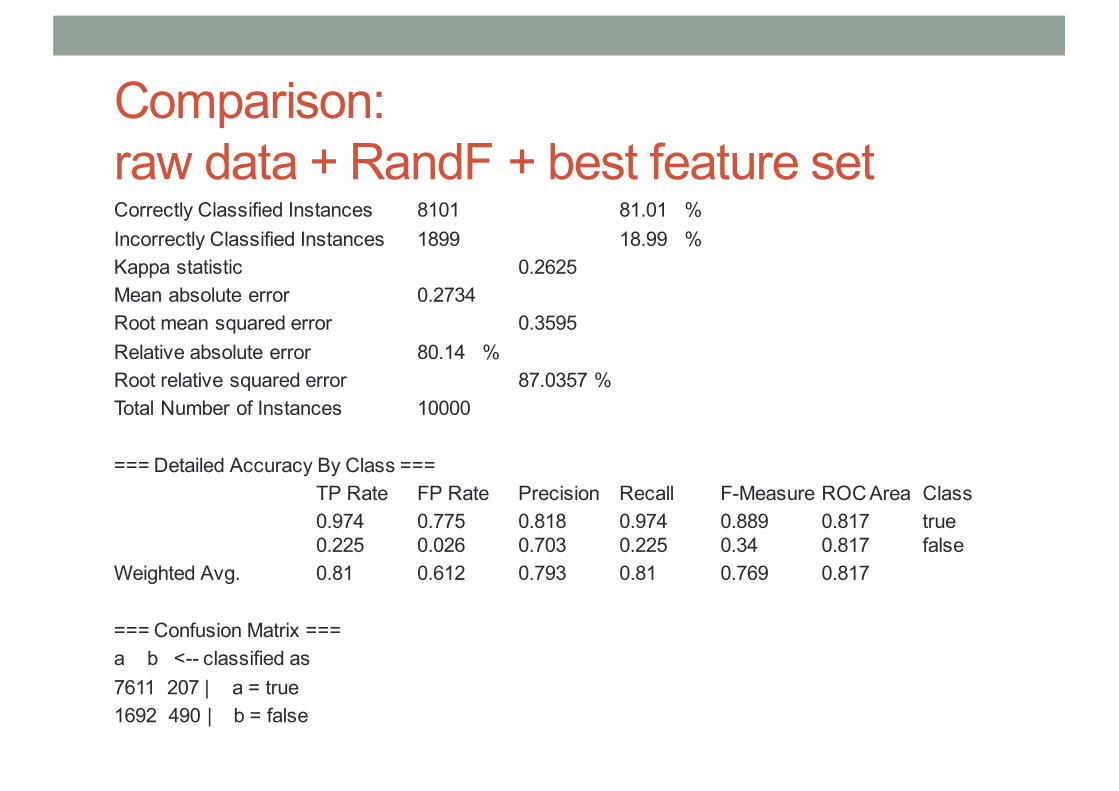
Comparison: raw data + RandF + best feature setCorrectly Classified Instances 8101 81.01 %Incorrectly Classified Instances 1899 18.99 %Kappa statistic 0.2625Mean absolute error 0.2734Root mean squared error 0.3595Relative absolute error 80.14 %Root relative squared error 87.0357 %Total Number of Instances 10000
=== Detailed Accuracy By Class === TP Rate FP Rate Precision Recall F-Measure ROC Area Class 0.974 0.775 0.818 0.974 0.889 0.817 true 0.225 0.026 0.703 0.225 0.34 0.817 false
Weighted Avg. 0.81 0.612 0.793 0.81 0.769 0.817
=== Confusion Matrix === a b <-- classified as 7611 207 | a = true 1692 490 | b = false

Comparison:SVM + best feature setCorrectly Classified Instances 12382 79.0021 %Incorrectly Classified Instances 3291 20.9979 %Kappa statistic 0.5802Mean absolute error 0.21 Root mean squared error 0.4582Relative absolute error 41.996 %Root relative squared error 91.6472 %Total Number of Instances 15673
=== Detailed Accuracy By Class === TP Rate FP Rate Precision Recall F-Measure ROC Area Class 0.853 0.273 0.757 0.853 0.802 0.79 true 0.727 0.147 0.833 0.727 0.776 0.79 false
Weighted Avg. 0.79 0.21 0.795 0.79 0.789 0.79
=== Confusion Matrix === a b <-- classified as 6669 1149 | a = true 2142 5713 | b = false

Literature baselineO’Mahony & Smyth 2010Readability• Correctly Classified Instances 12646 80.6865 %• Incorrectly Classified Instances 3027 19.3135 %• Kappa statistic 0.6139• Mean absolute error 0.2691• Root mean squared error 0.3734• Relative absolute error 53.8114 %• Root relative squared error 74.6883 %• Total Number of Instances 15673
=== Detailed Accuracy By Class ===TP Rate FP Rate Precision Recall F-Measure ROC Area Class0.879 0.265 0.767 0.879 0.82 0.858 true0.735 0.121 0.859 0.735 0.792 0.858 false
Weighted Avg. 0.807 0.193 0.814 0.807 0.806 0.858
• === Confusion Matrix ===• a b <-- classified as• 6874 944 | a = true• 2083 5772 | b = false

Literature baselineMudambi, Hall & Schuff 2010Rating + lengthCorrectly Classified Instances 13182 84.1064 %Incorrectly Classified Instances 2491 15.8936 %Kappa statistic 0.6822Mean absolute error 0.1871Root mean squared error 0.3514Relative absolute error 37.4299 %Root relative squared error 70.2842 %Total Number of Instances 15673
=== Detailed Accuracy By Class ===TP Rate FP Rate Precision Recall F-Measure ROC Area Class0.885 0.202 0.813 0.885 0.847 0.901 true0.798 0.115 0.874 0.798 0.834 0.901 false
Weighted Avg. 0.841 0.159 0.844 0.841 0.841 0.901
=== Confusion Matrix ===a b <-- classified as
6917 901 | a = true1590 6265 | b = false

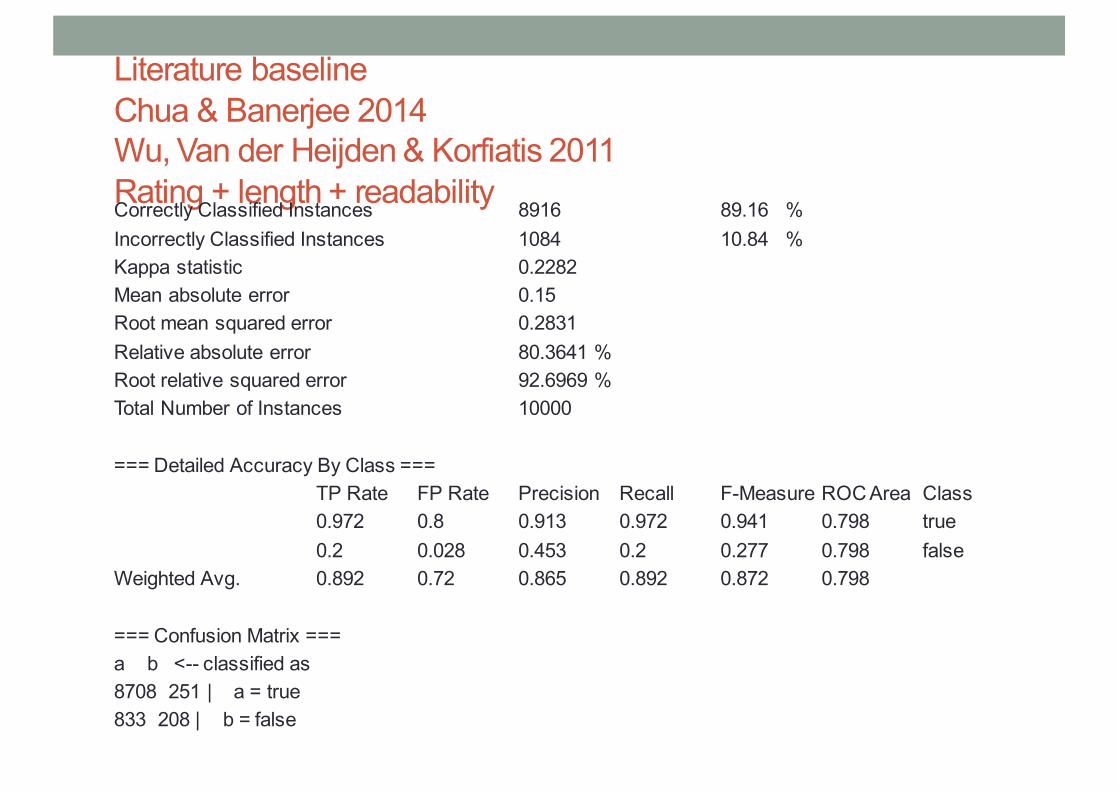
Literature baselineChua & Banerjee 2014Wu, Van der Heijden & Korfiatis 2011Rating + length + readabilityCorrectly Classified Instances 8220 82.2 %Incorrectly Classified Instances 1780 17.8 %Kappa statistic 0.4162Mean absolute error 0.2449Root mean squared error 0.3615Relative absolute error 71.7868 %Root relative squared error 87.5316 %Total Number of Instances 10000
=== Detailed Accuracy By Class === TP Rate FP Rate Precision Recall F-Measure ROC Area Class 0.927 0.555 0.857 0.927 0.891 0.799 true 0.445 0.073 0.631 0.445 0.522 0.799 false
Weighted Avg. 0.822 0.45 0.807 0.822 0.81 0.799
=== Confusion Matrix === a b <-- classified as 7250 568 | a = true 1212 970 | b = false

Literature baselineKorfiatis et al. 2011Rating + extreme rating + length + readabilityCorrectly Classified Instances 8226 82.26 %Incorrectly Classified Instances 1774 17.74 %Kappa statistic 0.4196Mean absolute error 0.2441Root mean squared error 0.3614Relative absolute error 71.5386 %Root relative squared error 87.4896 %Total Number of Instances 10000
=== Detailed Accuracy By Class === TP Rate FP Rate Precision Recall F-Measure ROC Area Class 0.927 0.551 0.858 0.927 0.891 0.8 true 0.449 0.073 0.631 0.449 0.525 0.8 false
Weighted Avg. 0.823 0.447 0.808 0.823 0.811 0.8
=== Confusion Matrix === a b <-- classified as 7246 572 | a = true 1202 980 | b = false

TRIPADVISOR DATA SETHongning Wang, Chi Wang, ChengXiang Zhai and JiaweiHan. Learning Online Discussion Structures by Conditional Random Fields. The 34th Annual International ACM SIGIR Conference (SIGIR'2011), P435-444, 2011

Data set• Tripadvisor hotel reviews gathered by Wang et al. (2011).• Mainly English-language reviews• Random selection of 10 000 Tripadvisor hotel reviews • 8959 voted as helpful and 1041 as unhelpful omitted all reviews with less than 10 total votes (conform to Liu et al. 2008 and Krishnamoorthy 2015)
• helpfulness threshold of 0.6• highly imbalanced data set requires data preprocessing• SMOTE at 750%
• same ML algorithms applied as for Amazon data• ZeroR, RandomForest, SMO/SVM

Raw data set, non-balanced + ZeroRCorrectly Classified Instances 8959 89.59 %Incorrectly Classified Instances 1041 10.41 %Kappa statistic 0 Mean absolute error 0.1866Root mean squared error 0.3054Relative absolute error 100 %Root relative squared error 100 %Total Number of Instances 10000
=== Detailed Accuracy By Class === TP Rate FP Rate Precision Recall F-Measure ROC Area Class 1 1 0.896 1 0.945 0.5 true 0 0 0 0 0 0.5 false
Weighted Avg. 0.896 0.896 0.803 0.896 0.847 0.5
=== Confusion Matrix === a b <-- classified as 8959 0 | a = true 1041 0 | b = false

SMOTE + RandF + baseline featuresCorrectly Classified Instances 8975 89.75 %Incorrectly Classified Instances 1025 10.25 %Kappa statistic 0.239Mean absolute error 0.1505Root mean squared error 0.2775Relative absolute error 80.6495 %Root relative squared error 90.8749 %Total Number of Instances 10000
=== Detailed Accuracy By Class === TP Rate FP Rate Precision Recall F-Measure ROC Area Class 0.979 0.806 0.913 0.979 0.945 0.81 true 0.194 0.021 0.521 0.194 0.283 0.81 false
Weighted Avg. 0.898 0.724 0.872 0.898 0.876 0.81
=== Confusion Matrix === a b <-- classified as 8773 186 | a = true 839 202 | b = false

SMOTE + RandF + argumentationCorrectly Classified Instances 8970 89.7 %Incorrectly Classified Instances 1030 10.3 %Kappa statistic 0.029 Mean absolute error 0.1779Root mean squared error 0.3019Relative absolute error 95.3354 %Root relative squared error 98.8725 %Total Number of Instances 10000
=== Detailed Accuracy By Class === TP Rate FP Rate Precision Recall F-Measure ROC Area Class 0.999 0.983 0.897 0.999 0.946 0.635 true 0.017 0.001 0.72 0.017 0.034 0.635 false
Weighted Avg. 0.897 0.88 0.879 0.897 0.851 0.635
=== Confusion Matrix === a b <-- classified as 8952 7 | a = true 1023 18 | b = false

RandF + best feature set(baseline + argumentation features + argumentation classes)Correctly Classified Instances 8987 89.87 %Incorrectly Classified Instances 1013 10.13 %Kappa statistic 0.0528Mean absolute error 0.162 Root mean squared error 0.2808Relative absolute error 86.8064 %Root relative squared error 91.9559 %Total Number of Instances 10000
=== Detailed Accuracy By Class === TP Rate FP Rate Precision Recall F-Measure ROC Area Class 1 0.969 0.899 1 0.946 0.792 true 0.031 0 0.889 0.031 0.059 0.792 false
Weighted Avg. 0.899 0.868 0.898 0.899 0.854 0.792
=== Confusion Matrix === a b <-- classified as 8955 4 | a = true 1009 32 | b = false

Comparison:SVM + best feature setCorrectly Classified Instances 14252 80.0359 %Incorrectly Classified Instances 3555 19.9641 %Kappa statistic 0.6004Mean absolute error 0.1996Root mean squared error 0.4468Relative absolute error 39.9297 %Root relative squared error 89.3641 %Total Number of Instances 17807
=== Detailed Accuracy By Class === TP Rate FP Rate Precision Recall F-Measure ROC Area Class 0.869 0.269 0.766 0.869 0.814 0.8 true 0.731 0.131 0.846 0.731 0.784 0.8 false
Weighted Avg. 0.8 0.2 0.806 0.8 0.799 0.8
=== Confusion Matrix === a b <-- classified as 7784 1175 | a = true 2380 6468 | b = false

Literature baselineO’Mahony & Smyth 2010Readability metricsCorrectly Classified Instances 15652 87.898 %Incorrectly Classified Instances 2155 12.102 %Kappa statistic 0.7578Mean absolute error 0.1999Root mean squared error 0.3097Relative absolute error 39.9748 %Root relative squared error 61.9444 %Total Number of Instances 17807
=== Detailed Accuracy By Class ===TP Rate FP Rate Precision Recall F-Measure ROC Area Class0.926 0.169 0.847 0.926 0.885 0.931 true0.831 0.074 0.918 0.831 0.872 0.931 false
Weighted Avg. 0.879 0.122 0.882 0.879 0.879 0.931
=== Confusion Matrix ===a b <-- classified as
8298 661 | a = true1494 7354 | b = false

Literature baselineMudambi, Hall & Schuff 2010Rating + review lengthCorrectly Classified Instances 15853 89.0268 %Incorrectly Classified Instances 1954 10.9732 %Kappa statistic 0.7804Mean absolute error 0.1272Root mean squared error 0.2946Relative absolute error 25.4463 %Root relative squared error 58.9152 %Total Number of Instances 17807
=== Detailed Accuracy By Class ===TP Rate FP Rate Precision Recall F-Measure ROC Area Class0.923 0.143 0.868 0.923 0.894 0.942 true0.857 0.077 0.916 0.857 0.886 0.942 false
Weighted Avg. 0.89 0.11 0.892 0.89 0.89 0.942
=== Confusion Matrix ===a b <-- classified as
8267 692 | a = true1262 7586 | b = false
Literature baselineChua & Banerjee 2014Wu, Van der Heijden & Korfiatis 2011Rating + length + readabilityCorrectly Classified Instances 8916 89.16 %Incorrectly Classified Instances 1084 10.84 %Kappa statistic 0.2282Mean absolute error 0.15 Root mean squared error 0.2831Relative absolute error 80.3641 %Root relative squared error 92.6969 %Total Number of Instances 10000
=== Detailed Accuracy By Class === TP Rate FP Rate Precision Recall F-Measure ROC Area Class 0.972 0.8 0.913 0.972 0.941 0.798 true 0.2 0.028 0.453 0.2 0.277 0.798 false
Weighted Avg. 0.892 0.72 0.865 0.892 0.872 0.798
=== Confusion Matrix === a b <-- classified as 8708 251 | a = true 833 208 | b = false

Literature baselineKorfiatis et al. 2011Rating + extreme rating + length + readabilityCorrectly Classified Instances 8908 89.08 %Incorrectly Classified Instances 1092 10.92 %Kappa statistic 0.226 Mean absolute error 0.1499Root mean squared error 0.283 Relative absolute error 80.3417 %Root relative squared error 92.6548 %Total Number of Instances 10000
=== Detailed Accuracy By Class === TP Rate FP Rate Precision Recall F-Measure ROC Area Class 0.971 0.8 0.913 0.971 0.941 0.798 true 0.2 0.029 0.445 0.2 0.276 0.798 false
Weighted Avg. 0.891 0.72 0.864 0.891 0.872 0.798=== Confusion Matrix === a b <-- classified as 8700 259 | a = true 833 208 | b = false

Literature baseline + argumentationCorrectly Classified Instances 8978 89.78 %Incorrectly Classified Instances 1022 10.22 %Kappa statistic 0.0437Mean absolute error 0.161 Root mean squared error 0.2809Relative absolute error 86.2995 %Root relative squared error 91.9768 %Total Number of Instances 10000
=== Detailed Accuracy By Class === TP Rate FP Rate Precision Recall F-Measure ROC Area Class 0.999 0.974 0.898 0.999 0.946 0.798 true 0.026 0.001 0.771 0.026 0.05 0.798 false
Weighted Avg. 0.898 0.873 0.885 0.898 0.853 0.798
=== Confusion Matrix === a b <-- classified as 8951 8 | a = true 1014 27 | b = false

YELP CHALLENGE DATA SEThttp://nl.yelp.be/dataset_challenge

Data set• Yelp reviews for local businesses (essentially restaurants) in 10 cities across 4 countries (cf. Yelp Challenge)• Mainly English-language reviews• Random selection of 10 000 Yelp reviews • Remark: Yelp data doesn’t have “total votes” information available• Solution: using a helpfulness threshold of 6 ‘helpful’ votes (cf. same threshold used by Visnawathan & Mooney 2014)
• 2623 helpful vs. 7377 non-helpful reviews, imbalanced with a tendency towards non-helpfulness (! other data sets were biased towards helpfulness)
• imbalanced data set requires data preprocessing• SMOTE at 175% to obtain a set of 14590 reviews (of which 7213 helpful and 7377 non-helpful)
• same ML algorithms applied as for Amazon and Tripadvisor data

Raw data set, non-balanced + ZeroRCorrectly Classified Instances 7377 73.77 %Incorrectly Classified Instances 2623 26.23 %Kappa statistic 0 Mean absolute error 0.387 Root mean squared error 0.4399Relative absolute error 100 %Root relative squared error 100 %Total Number of Instances 10000
=== Detailed Accuracy By Class ===TP Rate FP Rate Precision Recall F-Measure ROC Area Class0 0 0 0 0 0.499 true1 1 0.738 1 0.849 0.499 false
Weighted Avg. 0.738 0.738 0.544 0.738 0.626 0.499
=== Confusion Matrix ===a b <-- classified as0 2623 | a = true0 7377 | b = false

RandF + baseline featuresCorrectly Classified Instances 7775 77.75 %Incorrectly Classified Instances 2225 22.25 %Kappa statistic 0.3555Mean absolute error 0.2971Root mean squared error 0.3884Relative absolute error 76.754 %Root relative squared error 88.298 %Total Number of Instances 10000
=== Detailed Accuracy By Class === TP Rate FP Rate Precision Recall F-Measure ROC Area Class 0.408 0.091 0.614 0.408 0.49 0.801 true 0.909 0.592 0.812 0.909 0.858 0.801 false
Weighted Avg. 0.778 0.46 0.76 0.778 0.761 0.801
=== Confusion Matrix === a b <-- classified as 1071 1552 | a = true 673 6704 | b = false

RandF + argumentationCorrectly Classified Instances 7633 76.33 %Incorrectly Classified Instances 2367 23.67 %Kappa statistic 0.3003Mean absolute error 0.3087Root mean squared error 0.4004Relative absolute error 79.7616 %Root relative squared error 91.0338 %Total Number of Instances 10000
=== Detailed Accuracy By Class === TP Rate FP Rate Precision Recall F-Measure ROC Area Class 0.353 0.091 0.58 0.353 0.439 0.766 true 0.909 0.647 0.798 0.909 0.85 0.766 false
Weighted Avg. 0.763 0.501 0.741 0.763 0.742 0.766
=== Confusion Matrix === a b <-- classified as 927 1696 | a = true 671 6706 | b = false

RandF + best feature set(baseline + argumentation features + argumentation classes)Correctly Classified Instances 7728 77.28 %Incorrectly Classified Instances 2272 22.72 %Kappa statistic 0.3264Mean absolute error 0.302 Root mean squared error 0.3899Relative absolute error 78.0401 %Root relative squared error 88.6303 %Total Number of Instances 10000
=== Detailed Accuracy By Class === TP Rate FP Rate Precision Recall F-Measure ROC Area Class 0.368 0.083 0.611 0.368 0.459 0.794 true 0.917 0.632 0.803 0.917 0.856 0.794 false
Weighted Avg. 0.773 0.488 0.753 0.773 0.752 0.794=== Confusion Matrix === a b <-- classified as 964 1659 | a = true 613 6764 | b = false

Comparison:SMOTE + SVM + best feature setCorrectly Classified Instances 10704 73.3653 %Incorrectly Classified Instances 3886 26.6347 %Kappa statistic 0.4667Mean absolute error 0.2663Root mean squared error 0.5161Relative absolute error 53.2761 %Root relative squared error 103.2241 %Total Number of Instances 14590
=== Detailed Accuracy By Class ===TP Rate FP Rate Precision Recall F-Measure ROC Area Class0.681 0.215 0.756 0.681 0.717 0.733 true0.785 0.319 0.716 0.785 0.749 0.733 false
Weighted Avg. 0.734 0.268 0.736 0.734 0.733 0.733
=== Confusion Matrix ===a b <-- classified as
4913 2300 | a = true1586 5791 | b = false

Literature baselineO’Mahony & Smyth 2010ReadabilityCorrectly Classified Instances 11199 76.7581 %Incorrectly Classified Instances 3391 23.2419 %Kappa statistic 0.5347Mean absolute error 0.3088Root mean squared error 0.3972Relative absolute error 61.7758 %Root relative squared error 79.4372 %Total Number of Instances 14590
=== Detailed Accuracy By Class ===TP Rate FP Rate Precision Recall F-Measure ROC Area Class0.726 0.192 0.787 0.726 0.755 0.846 true0.808 0.274 0.751 0.808 0.779 0.846 false
Weighted Avg. 0.768 0.233 0.769 0.768 0.767 0.846
=== Confusion Matrix ===a b <-- classified as
5238 1975 | a = true1416 5961 | b = false

Literature baselineMudambi, Hall & Schuff 2010Rating + length• Correctly Classified Instances 11561 79.2392 %• Incorrectly Classified Instances 3029 20.7608 %• Kappa statistic 0.5841• Mean absolute error 0.2366• Root mean squared error 0.386 • Relative absolute error 47.3346 %• Root relative squared error 77.1975 %• Total Number of Instances 14590
• === Detailed Accuracy By Class ===• TP Rate FP Rate Precision Recall F-Measure ROC Area Class• 0.726 0.143 0.833 0.726 0.776 0.871 true• 0.857 0.274 0.762 0.857 0.807 0.871 false• Weighted Avg. 0.792 0.209 0.797 0.792 0.791 0.871
• === Confusion Matrix ===• a b <-- classified as• 5237 1976 | a = true• 1053 6324 | b = false

Literature baselineChua & Banerjee 2014Wu, Van der Heijden & Korfiatis 2011Rating + length + readabilityCorrectly Classified Instances 7630 76.3 %Incorrectly Classified Instances 2370 23.7 %Kappa statistic 0.3207Mean absolute error 0.3025Root mean squared error 0.4002Relative absolute error 78.1596 %Root relative squared error 90.9684 %Total Number of Instances 10000
=== Detailed Accuracy By Class === TP Rate FP Rate Precision Recall F-Measure ROC Area Class 0.395 0.106 0.569 0.395 0.467 0.774 true 0.894 0.605 0.806 0.894 0.848 0.774 false
Weighted Avg. 0.763 0.474 0.744 0.763 0.748 0.774
=== Confusion Matrix === a b <-- classified as 1037 1586 | a = true 784 6593 | b = false

Literature baselineKorfiatis et al. 2011Rating + extreme rating + length + readabilityCorrectly Classified Instances 7618 76.18 %Incorrectly Classified Instances 2382 23.82 %Kappa statistic 0.315 Mean absolute error 0.3029Root mean squared error 0.4001Relative absolute error 78.2751 %Root relative squared error 90.9582 %Total Number of Instances 10000
=== Detailed Accuracy By Class === TP Rate FP Rate Precision Recall F-Measure ROC Area Class 0.388 0.105 0.567 0.388 0.461 0.774 true 0.895 0.612 0.804 0.895 0.847 0.774 false
Weighted Avg. 0.762 0.479 0.742 0.762 0.746 0.774
=== Confusion Matrix === a b <-- classified as 1019 1604 | a = true 778 6599 | b = false

Literature baseline + argumentationCorrectly Classified Instances 7703 77.03 %Incorrectly Classified Instances 2297 22.97 %Kappa statistic 0.323 Mean absolute error 0.3041Root mean squared error 0.393 Relative absolute error 78.5809 %Root relative squared error 89.3427 %Total Number of Instances 10000
=== Detailed Accuracy By Class === TP Rate FP Rate Precision Recall F-Measure ROC Area Class 0.371 0.088 0.601 0.371 0.459 0.787 true 0.912 0.629 0.803 0.912 0.854 0.787 false
Weighted Avg. 0.77 0.487 0.75 0.77 0.75 0.787
=== Confusion Matrix === a b <-- classified as 973 1650 | a = true 647 6730 | b = false

SUMMARIES

Amazon product reviewsFeature set Precision
(true)Recall (true)
F1 (true)
Precision (false)
Recall (false)
F1 (false)
Precision (overall)
Recall (overall)
F1 (overall)
Baseline 0.854 0.91 0.881 0.904 0.845 0.874 0.879 0.878 0.877
Argumentation 0.818 0.958* 0.882 0.95* 0.788 0.861 0.884 0.873 0.872
Baseline + argumentation 0.874* 0.937 0.904* 0.933 0.865* 0.898* 0.903* 0.901* 0.901*
Tripadvisor hotel reviewsFeature set Precision
(true)Recall (true)
F1 (true)
Precision (false)
Recall (false)
F1 (false)
Precision (overall)
Recall (overall)
F1 (overall)
Baseline 0.911 0.946 0.928 0.943 0.907 0.925 0.927 0.927 0.927Argumentation 0.887 0.993* 0.937 0.991* 0.871 0.928 0.939 0.932 0.932
Baseline + argumentation 0.932* 0.987 0.958* 0.986 0.927* 0.955* 0.959* 0.957* 0.957*
Yelp restaurant reviewsFeature set Precision
(true)Recall (true)
F1 (true)
Precision (false)
Recall (false)
F1 (false)
Precision (overall)
Recall (overall)
F1 (overall)
Baseline 0.838 0.815 0.826 0.824 0.846 0.835 0.831 0.831 0.831
Argumentation 0.846* 0.837 0.841 0.842 0.851* 0.846 0.844 0.844 0.844
Baseline + argumentation 0.844 0.844* 0.844* 0.848* 0.847 0.848* 0.846* 0.846* 0.846*

AmazonFeature set Precision
(true)Recall (true)
F1 (true)
Precision (false)
Recall (false)
F1 (false)
Precision (overall)
Recall (overall)
F1 (overall)
Rating + length 0.813 0.885 0.847 0.874 0.789 0.834 0.844 0.841 0.841
Readability 0.767² 0.879² 0.735² 0.859 0.735 0.792² 0.814² 0.807² 0.806²Rating + length + readability 0.845 0.902 0.873 0.895 0.835 0.864 0.87 0.869 0.868
Rating + length + extremity + readability
0.846 0.906 0.875 0.9 0.836 0.867 0.873 0.871 0.871
Baseline 0.854 0.91 0.881 0.904 0.845 0.874 0.879 0.878 0.877
Argumentation 0.818 0.958* 0.882 0.95* 0.788 0.861 0.884 0.873 0.872
Baseline + argumentation 0.874* 0.937 0.904* 0.933 0.865* 0.898* 0.903* 0.901* 0.901*
TripadvisorFeature set Precision
(true)Recall (true)
F1 (true)
Precision (false)
Recall (false)
F1 (false)
Precision (overall)
Recall (overall)
F1 (overall)
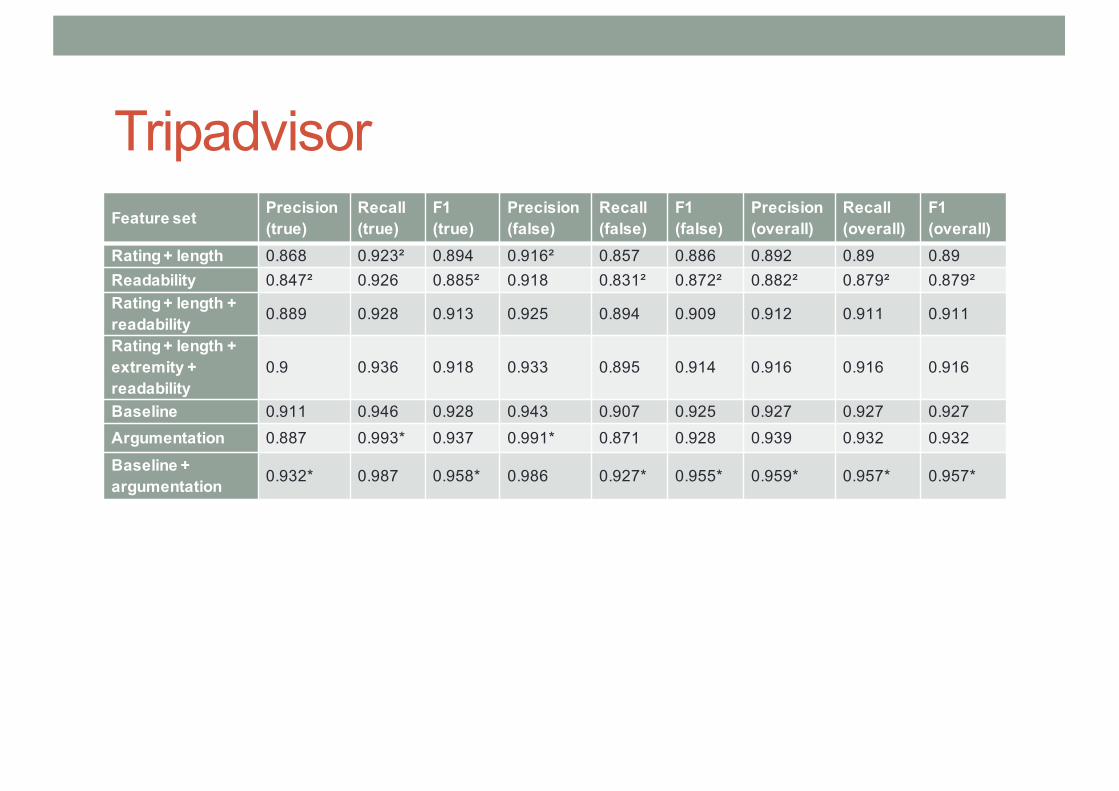
Rating + length 0.868 0.923² 0.894 0.916² 0.857 0.886 0.892 0.89 0.89Readability 0.847² 0.926 0.885² 0.918 0.831² 0.872² 0.882² 0.879² 0.879²Rating + length + readability 0.889 0.928 0.913 0.925 0.894 0.909 0.912 0.911 0.911
Rating + length + extremity + readability
0.9 0.936 0.918 0.933 0.895 0.914 0.916 0.916 0.916
Baseline 0.911 0.946 0.928 0.943 0.907 0.925 0.927 0.927 0.927Argumentation 0.887 0.993* 0.937 0.991* 0.871 0.928 0.939 0.932 0.932
Baseline + argumentation 0.932* 0.987 0.958* 0.986 0.927* 0.955* 0.959* 0.957* 0.957*

YelpFeature set Precision
(true)Recall (true)
F1 (true)
Precision (false)
Recall (false)
F1 (false)
Precision (overall)
Recall (overall)
F1 (overall)
Rating + length
ReadabilityRating + length + readability 0.569 0.395 0.467 0.806 0.894 0.848 0.744 0.763 0.748
Rating + length + extremity + readability
0.567 0.388 0.461 0.804 0.895 0.847 0.742 0.762 0.764
Baseline 0.614* 0.408* 0.49* 0.812* 0.909 0.858* 0.76* 0.778* 0.761*
Argumentation 0.58 0.353 0.439 0.798 0.909 0.85 0.741 0.763 0.742
Baseline + argumentation 0.611 0.368 0.459 0.803 0.917* 0.856 0.753 0.773 0.752
Literature baseline + argumentation 0.601 0.371 0.459 0.803 0.912 0..854 0.75 0.77 0.75

Consistency of features across data setsAmazon TripAdvisor Yelp
χ² Features χ² Features χ² Features
0.513856 rating** 0.438078 or* 0.618588 GUNNINGFOG*
0.47243 GUNNINGFOG* 0.428685 and* 0.595137 rating**
0.405208 and* 0.42335 firstPerson* 0.532395 firstPerson*
0.404248 or* 0.421913 alternative* 0.504787 and*
0.40027 firstPerson* 0.413293 as* 0.502168 or*
0.386429 so* 0.407441 so* 0.495847 alternative*
0.381606 as* 0.383919 for* 0.489856 as*
0.363766 for* 0.368221 GUNNINGFOG* 0.468742 for*
0.347706 alternative* 0.347912 secondPerson** 0.45175 so*
0.337667 secondPerson** 0.323835 comparison 0.416711 if

Limitations• One important feature not yet studied: topic relevance!• Features with proven impact excluded from our study due to inavailability: reviewer reputation, product type• Lexicon-based approach of argumentation mining, rather than “smart” argumentation mining/understanding. This is an interesting future research area.

Conclusions• The raw data is highly imbalanced due to the so-called helpfulness bias• SMOTE (260% for Amazon, 750% for Tripadvisor, 175% for Yelp) drastically improves the recall and precision of the falseclass (non-helpful reviews)• RandomForest is the best performing classifier for review helpfulness, as proven by literature.• Argumentation in itself gives good results, but doesn’t provide an overall better classification than baseline features (very comparable results)• A combination of argumentation features, classes, review metadata and basic stylometric features reaches the best performance with F1 over 0.9 for Amazon and Tripadvisor and over 0.8 for Yelp

Next steps• New tests with SMOTE• New tests with LibSVM• More advanced argumentation mining• Existing discourse parser• Implement our own
• Statistical significance of results (?)• Error analysis• Feedback