review designing better energy metrics for consumersdesigning better energy metrics for consumers...
14
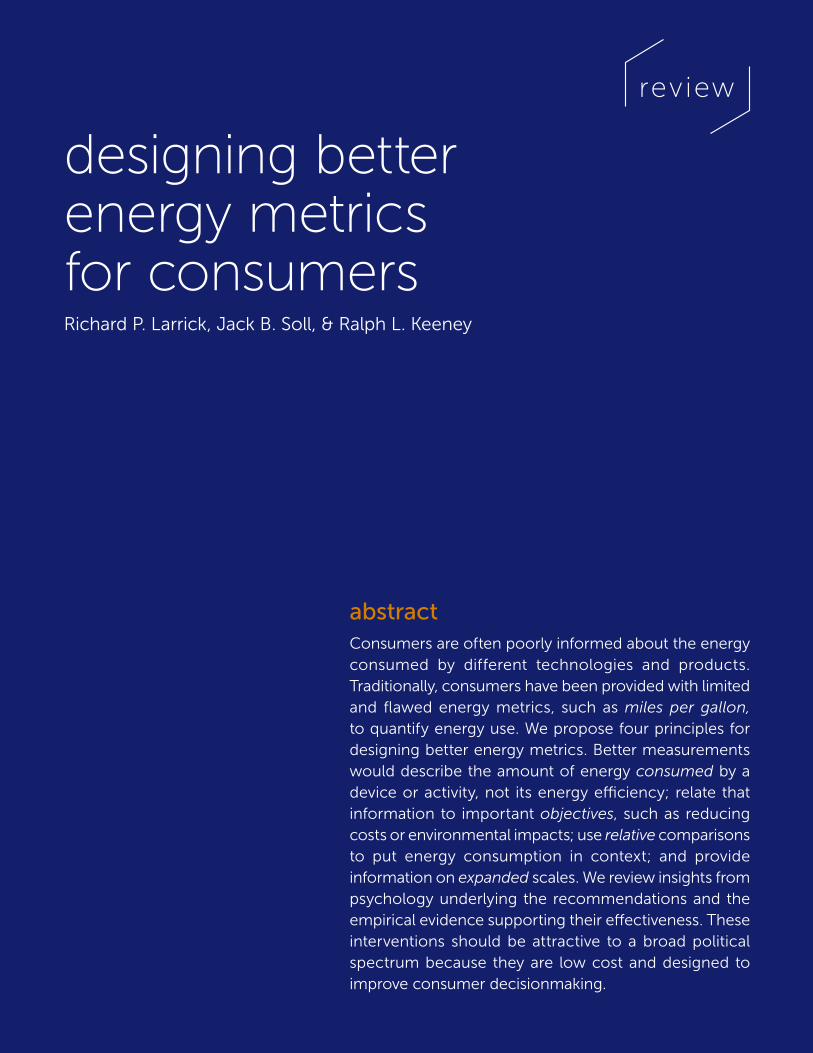
designing better energy metrics for consumers Richard P. Larrick, Jack B. Soll, & Ralph L. Keeney abstract Consumers are often poorly informed about the energy consumed by different technologies and products. Traditionally, consumers have been provided with limited and flawed energy metrics, such as miles per gallon, to quantify energy use. We propose four principles for designing better energy metrics. Better measurements would describe the amount of energy consumed by a device or activity, not its energy efficiency; relate that information to important objectives, such as reducing costs or environmental impacts; use relative comparisons to put energy consumption in context; and provide information on expanded scales. We review insights from psychology underlying the recommendations and the empirical evidence supporting their effectiveness. These interventions should be attractive to a broad political spectrum because they are low cost and designed to improve consumer decisionmaking. review
Transcript of review designing better energy metrics for consumersdesigning better energy metrics for consumers...
designing better energy metrics for consumersRichard P. Larrick, Jack B. Soll, & Ralph L. Keeney
abstractConsumers are often poorly informed about the energy consumed by different technologies and products. Traditionally, consumers have been provided with limited and flawed energy metrics, such as miles per gallon, to quantify energy use. We propose four principles for designing better energy metrics. Better measurements would describe the amount of energy consumed by a device or activity, not its energy efficiency; relate that information to important objectives, such as reducing costs or environmental impacts; use relative comparisons to put energy consumption in context; and provide information on expanded scales. We review insights from psychology underlying the recommendations and the empirical evidence supporting their effectiveness. These interventions should be attractive to a broad political spectrum because they are low cost and designed to improve consumer decisionmaking.
review
a publication of the behavioral science & policy association 63
Designing better energy metrics for consumers
Richard P. Larrick, Jack B. Soll, & Ralph L. Keeney
abstract. Consumers are often poorly informed about the energy
consumed by different technologies and products. Traditionally, consumers
have been provided with limited and flawed energy metrics, such as
miles per gallon, to quantify energy use. We propose four principles for
designing better energy metrics. Better measurements would describe
the amount of energy consumed by a device or activity, not its energy
efficiency; relate that information to important objectives, such as reducing
costs or environmental impacts; use relative comparisons to put energy
consumption in context; and provide information on expanded scales. We
review insights from psychology underlying the recommendations and
the empirical evidence supporting their effectiveness. These interventions
should be attractive to a broad political spectrum because they are low cost
and designed to improve consumer decisionmaking.
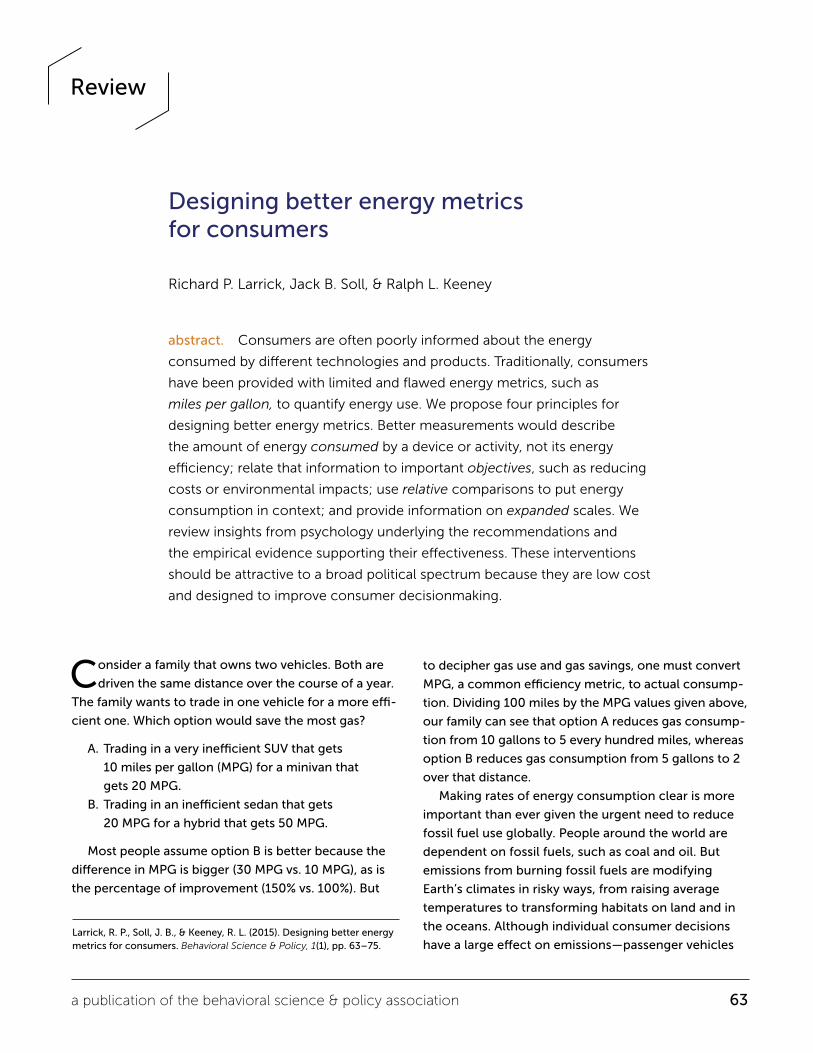
Consider a family that owns two vehicles. Both are
driven the same distance over the course of a year.
The family wants to trade in one vehicle for a more effi-
cient one. Which option would save the most gas?
A. Trading in a very inefficient SUV that gets
10 miles per gallon (MPG) for a minivan that
gets 20 MPG.
B. Trading in an inefficient sedan that gets
20 MPG for a hybrid that gets 50 MPG.
Most people assume option B is better because the
difference in MPG is bigger (30 MPG vs. 10 MPG), as is
the percentage of improvement (150% vs. 100%). But
to decipher gas use and gas savings, one must convert
MPG, a common efficiency metric, to actual consump-
tion. Dividing 100 miles by the MPG values given above,
our family can see that option A reduces gas consump-
tion from 10 gallons to 5 every hundred miles, whereas
option B reduces gas consumption from 5 gallons to 2
over that distance.
Making rates of energy consumption clear is more
important than ever given the urgent need to reduce
fossil fuel use globally. People around the world are
dependent on fossil fuels, such as coal and oil. But
emissions from burning fossil fuels are modifying
Earth’s climates in risky ways, from raising average
temperatures to transforming habitats on land and in
the oceans. Although individual consumer decisions
have a large effect on emissions—passenger vehicles Larrick, R. P., Soll, J. B., & Keeney, R. L. (2015). Designing better energy metrics for consumers. Behavioral Science & Policy, 1(1), pp. 63–75.
Review
64 behavioral science & policy | spring 2015
and residential electricity use account for nearly half
of the greenhouse gas emissions in the United States—
consumers remain poorly informed about how much
energy they consume.1–3 Behavioral research offers
many insights on how to inform people about their
energy consumption and how to motivate them to
reduce it.4 One arena in which this research could be
immediately useful is on product labels, where energy
requirements could be made clearer for consumers
faced with an abundance of choices.
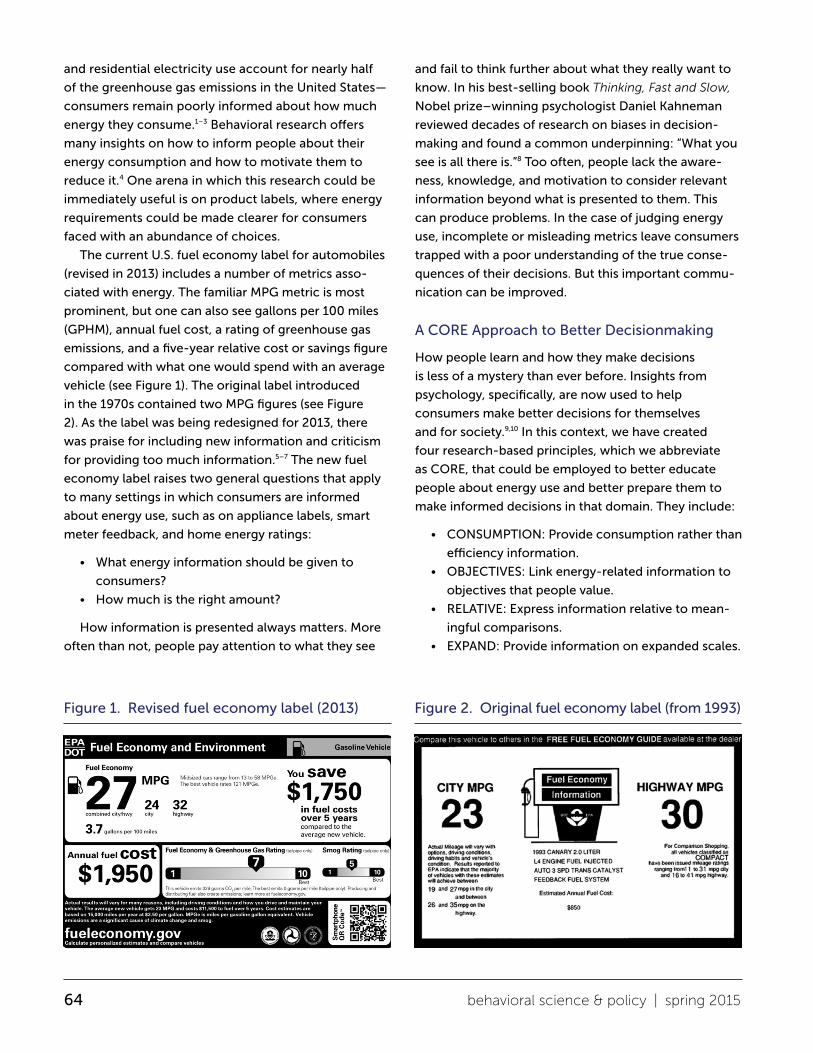
The current U.S. fuel economy label for automobiles
(revised in 2013) includes a number of metrics asso-
ciated with energy. The familiar MPG metric is most
prominent, but one can also see gallons per 100 miles
(GPHM), annual fuel cost, a rating of greenhouse gas
emissions, and a five-year relative cost or savings figure
compared with what one would spend with an average
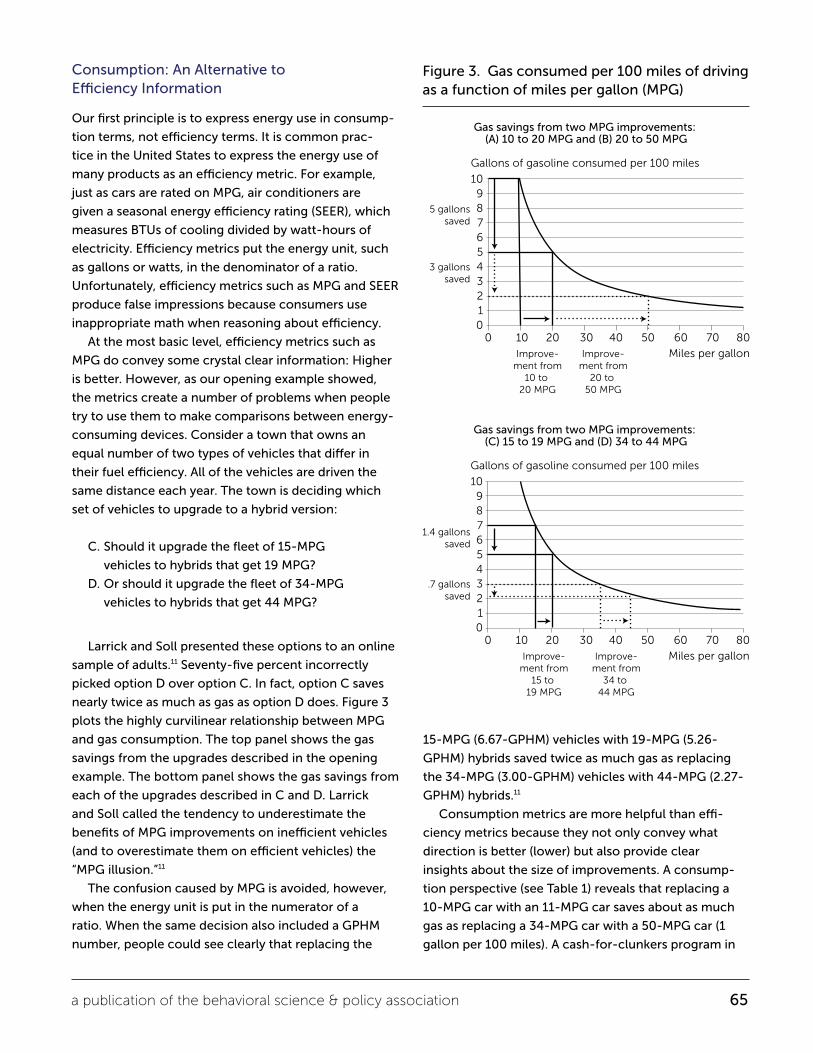
vehicle (see Figure 1). The original label introduced
in the 1970s contained two MPG figures (see Figure
2). As the label was being redesigned for 2013, there
was praise for including new information and criticism
for providing too much information.5–7 The new fuel
economy label raises two general questions that apply
to many settings in which consumers are informed
about energy use, such as on appliance labels, smart
meter feedback, and home energy ratings:
• What energy information should be given to
consumers?
• How much is the right amount?
How information is presented always matters. More
often than not, people pay attention to what they see
and fail to think further about what they really want to
know. In his best-selling book Thinking, Fast and Slow,
Nobel prize–winning psychologist Daniel Kahneman
reviewed decades of research on biases in decision-
making and found a common underpinning: “What you
see is all there is.”8 Too often, people lack the aware-
ness, knowledge, and motivation to consider relevant
information beyond what is presented to them. This
can produce problems. In the case of judging energy
use, incomplete or misleading metrics leave consumers
trapped with a poor understanding of the true conse-
quences of their decisions. But this important commu-
nication can be improved.
A CORE Approach to Better Decisionmaking
How people learn and how they make decisions
is less of a mystery than ever before. Insights from
psychology, specifically, are now used to help
consumers make better decisions for themselves
and for society.9,10 In this context, we have created
four research-based principles, which we abbreviate
as CORE, that could be employed to better educate
people about energy use and better prepare them to
make informed decisions in that domain. They include:
• CONSUMPTION: Provide consumption rather than
efficiency information.
• OBJECTIVES: Link energy-related information to
objectives that people value.
• RELATIVE: Express information relative to mean-
ingful comparisons.
• EXPAND: Provide information on expanded scales.
Figure 1. Revised fuel economy label (2013) Figure 2. Original fuel economy label (from 1993)
a publication of the behavioral science & policy association 65
Consumption: An Alternative to Efficiency Information
Our first principle is to express energy use in consump-
tion terms, not efficiency terms. It is common prac-
tice in the United States to express the energy use of
many products as an efficiency metric. For example,
just as cars are rated on MPG, air conditioners are
given a seasonal energy efficiency rating (SEER), which
measures BTUs of cooling divided by watt-hours of
electricity. Efficiency metrics put the energy unit, such
as gallons or watts, in the denominator of a ratio.
Unfortunately, efficiency metrics such as MPG and SEER
produce false impressions because consumers use
inappropriate math when reasoning about efficiency.
At the most basic level, efficiency metrics such as
MPG do convey some crystal clear information: Higher
is better. However, as our opening example showed,
the metrics create a number of problems when people
try to use them to make comparisons between energy-
consuming devices. Consider a town that owns an
equal number of two types of vehicles that differ in
their fuel efficiency. All of the vehicles are driven the
same distance each year. The town is deciding which
set of vehicles to upgrade to a hybrid version:
C. Should it upgrade the fleet of 15-MPG
vehicles to hybrids that get 19 MPG?
D. Or should it upgrade the fleet of 34-MPG
vehicles to hybrids that get 44 MPG?
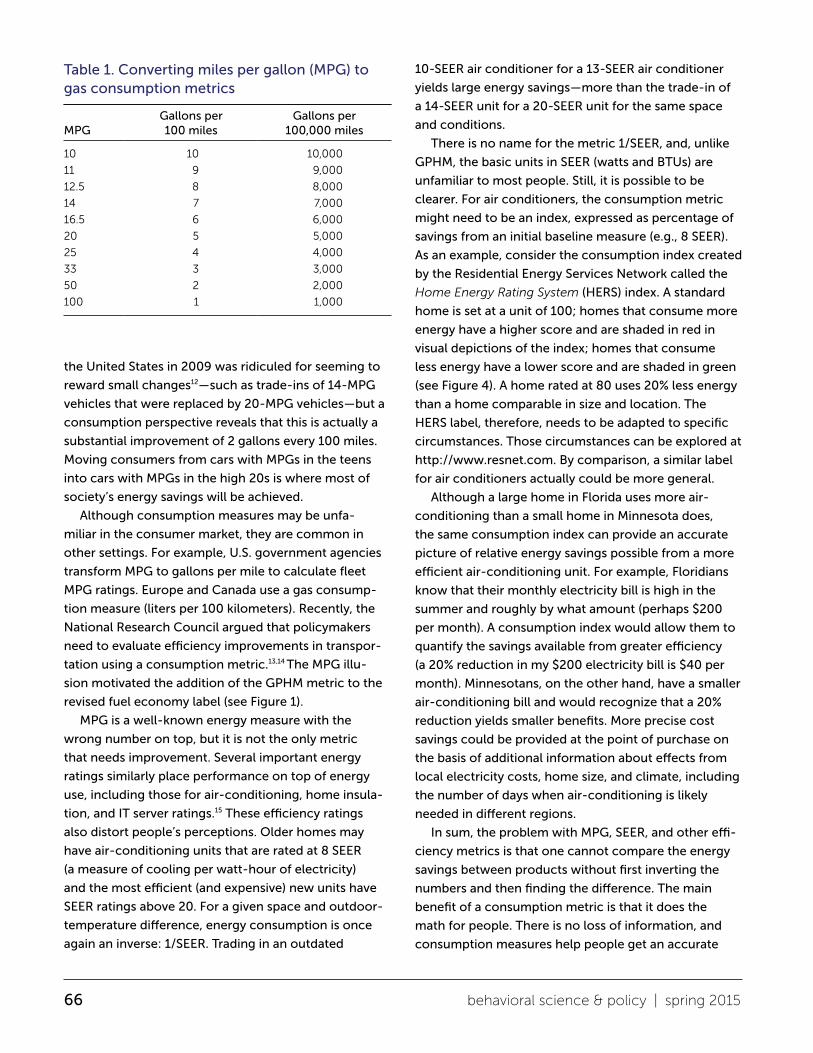
Larrick and Soll presented these options to an online
sample of adults.11 Seventy-five percent incorrectly
picked option D over option C. In fact, option C saves
nearly twice as much as gas as option D does. Figure 3
plots the highly curvilinear relationship between MPG
and gas consumption. The top panel shows the gas
savings from the upgrades described in the opening
example. The bottom panel shows the gas savings from
each of the upgrades described in C and D. Larrick
and Soll called the tendency to underestimate the
benefits of MPG improvements on inefficient vehicles
(and to overestimate them on efficient vehicles) the
“MPG illusion.”11
The confusion caused by MPG is avoided, however,
when the energy unit is put in the numerator of a
ratio. When the same decision also included a GPHM
number, people could see clearly that replacing the
15-MPG (6.67-GPHM) vehicles with 19-MPG (5.26-
GPHM) hybrids saved twice as much gas as replacing
the 34-MPG (3.00-GPHM) vehicles with 44-MPG (2.27-
GPHM) hybrids.11
Consumption metrics are more helpful than effi-
ciency metrics because they not only convey what
direction is better (lower) but also provide clear
insights about the size of improvements. A consump-
tion perspective (see Table 1) reveals that replacing a
10-MPG car with an 11-MPG car saves about as much
gas as replacing a 34-MPG car with a 50-MPG car (1
gallon per 100 miles). A cash-for-clunkers program in
Figure 3. Gas consumed per 100 miles of driving as a function of miles per gallon (MPG)
Gallons of gasoline consumed per 100 miles
Gas savings from two MPG improvements: (A) 10 to 20 MPG and (B) 20 to 50 MPG
Gas savings from two MPG improvements: (C) 15 to 19 MPG and (D) 34 to 44 MPG
109876543210
0 10 20 30 40 50 60 70 80
5 gallonssaved
3 gallonssaved
Improve-ment from
10 to 20 MPG
Improve-ment from
20 to 50 MPG
Miles per gallon
Gallons of gasoline consumed per 100 miles
109876543210
0 10 20 30 40 50 60 70 80
1.4 gallonssaved
.7 gallonssaved
Improve-ment from
15 to 19 MPG
Improve-ment from
34 to 44 MPG
Miles per gallon
66 behavioral science & policy | spring 2015
the United States in 2009 was ridiculed for seeming to
reward small changes12—such as trade-ins of 14-MPG
vehicles that were replaced by 20-MPG vehicles—but a
consumption perspective reveals that this is actually a
substantial improvement of 2 gallons every 100 miles.
Moving consumers from cars with MPGs in the teens
into cars with MPGs in the high 20s is where most of
society’s energy savings will be achieved.
Although consumption measures may be unfa-
miliar in the consumer market, they are common in
other settings. For example, U.S. government agencies
transform MPG to gallons per mile to calculate fleet
MPG ratings. Europe and Canada use a gas consump-
tion measure (liters per 100 kilometers). Recently, the
National Research Council argued that policymakers
need to evaluate efficiency improvements in transpor-
tation using a consumption metric.13,14 The MPG illu-
sion motivated the addition of the GPHM metric to the
revised fuel economy label (see Figure 1).
MPG is a well-known energy measure with the
wrong number on top, but it is not the only metric
that needs improvement. Several important energy
ratings similarly place performance on top of energy
use, including those for air-conditioning, home insula-
tion, and IT server ratings.15 These efficiency ratings
also distort people’s perceptions. Older homes may
have air-conditioning units that are rated at 8 SEER
(a measure of cooling per watt-hour of electricity)
and the most efficient (and expensive) new units have
SEER ratings above 20. For a given space and outdoor-
temperature difference, energy consumption is once
again an inverse: 1/SEER. Trading in an outdated
10-SEER air conditioner for a 13-SEER air conditioner
yields large energy savings—more than the trade-in of
a 14-SEER unit for a 20-SEER unit for the same space
and conditions.
There is no name for the metric 1/SEER, and, unlike
GPHM, the basic units in SEER (watts and BTUs) are
unfamiliar to most people. Still, it is possible to be
clearer. For air conditioners, the consumption metric
might need to be an index, expressed as percentage of
savings from an initial baseline measure (e.g., 8 SEER).
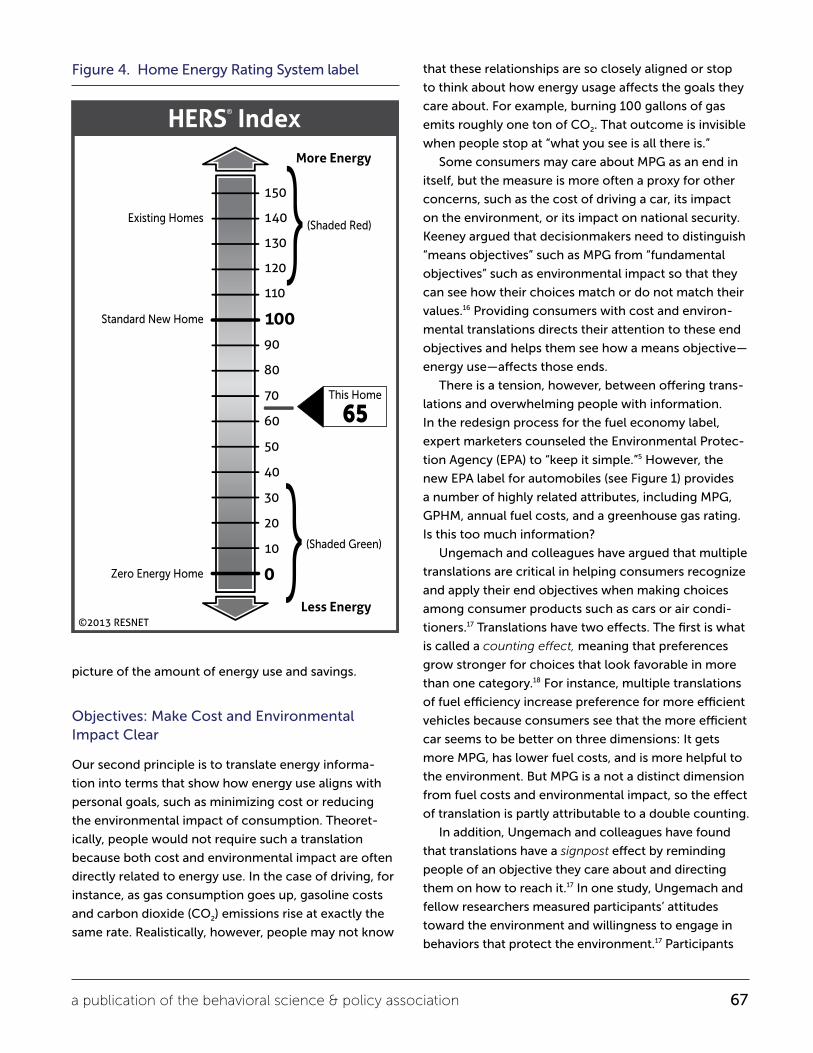
As an example, consider the consumption index created
by the Residential Energy Services Network called the
Home Energy Rating System (HERS) index. A standard
home is set at a unit of 100; homes that consume more
energy have a higher score and are shaded in red in
visual depictions of the index; homes that consume
less energy have a lower score and are shaded in green
(see Figure 4). A home rated at 80 uses 20% less energy
than a home comparable in size and location. The
HERS label, therefore, needs to be adapted to specific
circumstances. Those circumstances can be explored at
http://www.resnet.com. By comparison, a similar label
for air conditioners actually could be more general.
Although a large home in Florida uses more air-
conditioning than a small home in Minnesota does,
the same consumption index can provide an accurate
picture of relative energy savings possible from a more
efficient air-conditioning unit. For example, Floridians
know that their monthly electricity bill is high in the
summer and roughly by what amount (perhaps $200
per month). A consumption index would allow them to
quantify the savings available from greater efficiency
(a 20% reduction in my $200 electricity bill is $40 per
month). Minnesotans, on the other hand, have a smaller
air-conditioning bill and would recognize that a 20%
reduction yields smaller benefits. More precise cost
savings could be provided at the point of purchase on
the basis of additional information about effects from
local electricity costs, home size, and climate, including
the number of days when air-conditioning is likely
needed in different regions.
In sum, the problem with MPG, SEER, and other effi-
ciency metrics is that one cannot compare the energy
savings between products without first inverting the
numbers and then finding the difference. The main
benefit of a consumption metric is that it does the
math for people. There is no loss of information, and
consumption measures help people get an accurate
Table 1. Converting miles per gallon (MPG) to gas consumption metrics
MPGGallons per 100 miles
Gallons per 100,000 miles
10 10 10,000
11 9 9,000
12.5 8 8,000
14 7 7,000
16.5 6 6,000
20 5 5,000
25 4 4,000
33 3 3,000
50 2 2,000
100 1 1,000
a publication of the behavioral science & policy association 67
picture of the amount of energy use and savings.
Objectives: Make Cost and Environmental Impact Clear
Our second principle is to translate energy informa-
tion into terms that show how energy use aligns with
personal goals, such as minimizing cost or reducing
the environmental impact of consumption. Theoret-
ically, people would not require such a translation
because both cost and environmental impact are often
directly related to energy use. In the case of driving, for
instance, as gas consumption goes up, gasoline costs
and carbon dioxide (CO2) emissions rise at exactly the
same rate. Realistically, however, people may not know
that these relationships are so closely aligned or stop
to think about how energy usage affects the goals they
care about. For example, burning 100 gallons of gas
emits roughly one ton of CO2. That outcome is invisible
when people stop at “what you see is all there is.”
Some consumers may care about MPG as an end in
itself, but the measure is more often a proxy for other
concerns, such as the cost of driving a car, its impact
on the environment, or its impact on national security.
Keeney argued that decisionmakers need to distinguish
“means objectives” such as MPG from “fundamental
objectives” such as environmental impact so that they
can see how their choices match or do not match their
values.16 Providing consumers with cost and environ-
mental translations directs their attention to these end
objectives and helps them see how a means objective—
energy use—affects those ends.
There is a tension, however, between offering trans-
lations and overwhelming people with information.
In the redesign process for the fuel economy label,
expert marketers counseled the Environmental Protec-
tion Agency (EPA) to “keep it simple.”5 However, the
new EPA label for automobiles (see Figure 1) provides
a number of highly related attributes, including MPG,
GPHM, annual fuel costs, and a greenhouse gas rating.
Is this too much information?
Ungemach and colleagues have argued that multiple
translations are critical in helping consumers recognize
and apply their end objectives when making choices
among consumer products such as cars or air condi-
tioners.17 Translations have two effects. The first is what
is called a counting effect, meaning that preferences
grow stronger for choices that look favorable in more
than one category.18 For instance, multiple translations
of fuel efficiency increase preference for more efficient
vehicles because consumers see that the more efficient
car seems to be better on three dimensions: It gets
more MPG, has lower fuel costs, and is more helpful to
the environment. But MPG is a not a distinct dimension
from fuel costs and environmental impact, so the effect
of translation is partly attributable to a double counting.
In addition, Ungemach and colleagues have found
that translations have a signpost effect by reminding
people of an objective they care about and directing
them on how to reach it.17 In one study, Ungemach and
fellow researchers measured participants’ attitudes
toward the environment and willingness to engage in
behaviors that protect the environment.17 Participants
Figure 4. Home Energy Rating System label
(Shaded Red)
(Shaded Green)
Standard New Home
Existing Homes
Zero Energy Home
This Home
65
68 behavioral science & policy | spring 2015
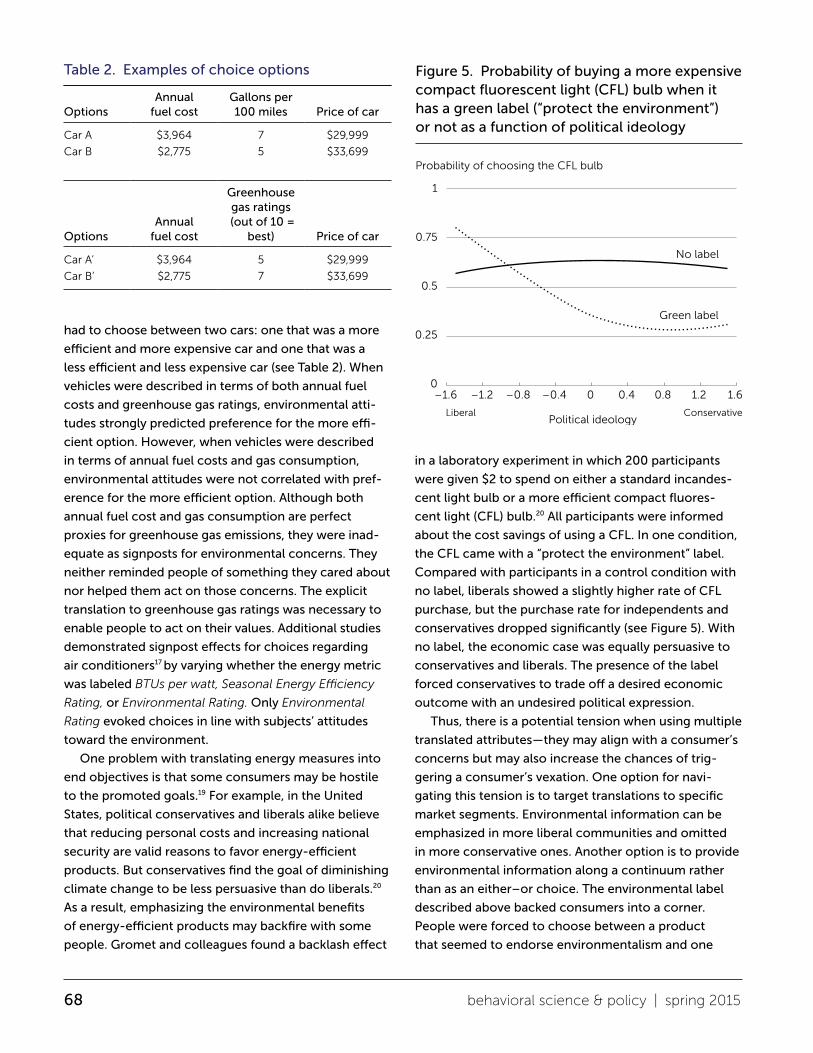
had to choose between two cars: one that was a more
efficient and more expensive car and one that was a
less efficient and less expensive car (see Table 2). When
vehicles were described in terms of both annual fuel
costs and greenhouse gas ratings, environmental atti-
tudes strongly predicted preference for the more effi-
cient option. However, when vehicles were described
in terms of annual fuel costs and gas consumption,
environmental attitudes were not correlated with pref-
erence for the more efficient option. Although both
annual fuel cost and gas consumption are perfect
proxies for greenhouse gas emissions, they were inad-
equate as signposts for environmental concerns. They
neither reminded people of something they cared about
nor helped them act on those concerns. The explicit
translation to greenhouse gas ratings was necessary to
enable people to act on their values. Additional studies
demonstrated signpost effects for choices regarding
air conditioners17 by varying whether the energy metric
was labeled BTUs per watt, Seasonal Energy Efficiency
Rating, or Environmental Rating. Only Environmental
Rating evoked choices in line with subjects’ attitudes
toward the environment.
One problem with translating energy measures into
end objectives is that some consumers may be hostile
to the promoted goals.19 For example, in the United
States, political conservatives and liberals alike believe
that reducing personal costs and increasing national
security are valid reasons to favor energy-efficient
products. But conservatives find the goal of diminishing
climate change to be less persuasive than do liberals.20
As a result, emphasizing the environmental benefits
of energy- efficient products may backfire with some
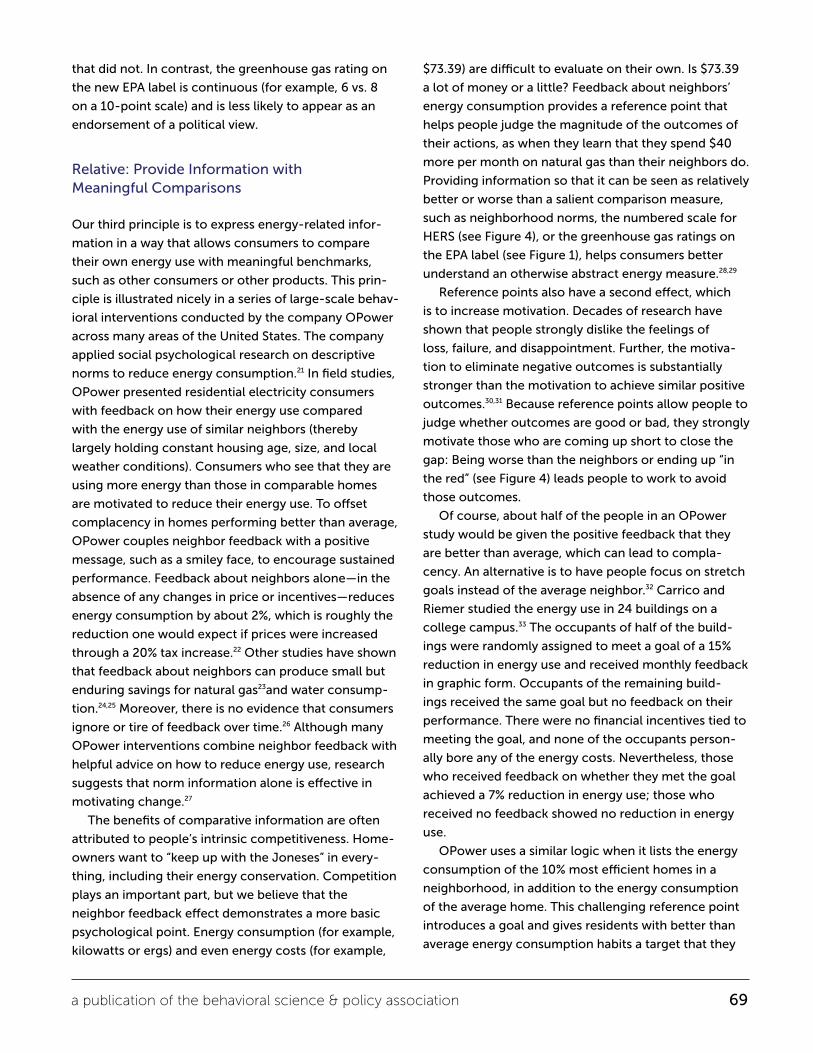
people. Gromet and colleagues found a backlash effect
in a laboratory experiment in which 200 participants
were given $2 to spend on either a standard incandes-
cent light bulb or a more efficient compact fluores-
cent light (CFL) bulb.20 All participants were informed
about the cost savings of using a CFL. In one condition,
the CFL came with a “protect the environment” label.
Compared with participants in a control condition with
no label, liberals showed a slightly higher rate of CFL
purchase, but the purchase rate for independents and
conservatives dropped significantly (see Figure 5). With
no label, the economic case was equally persuasive to
conservatives and liberals. The presence of the label
forced conservatives to trade off a desired economic
outcome with an undesired political expression.
Thus, there is a potential tension when using multiple
translated attributes—they may align with a consumer’s
concerns but may also increase the chances of trig-
gering a consumer’s vexation. One option for navi-
gating this tension is to target translations to specific
market segments. Environmental information can be
emphasized in more liberal communities and omitted
in more conservative ones. Another option is to provide
environmental information along a continuum rather
than as an either–or choice. The environmental label
described above backed consumers into a corner.
People were forced to choose between a product
that seemed to endorse environmentalism and one
Table 2. Examples of choice options
OptionsAnnual
fuel costGallons per 100 miles Price of car
Car A $3,964 7 $29,999
Car B $2,775 5 $33,699
OptionsAnnual
fuel cost
Greenhouse gas ratings
(out of 10 = best) Price of car
Car A’ $3,964 5 $29,999
Car B’ $2,775 7 $33,699
Figure 5. Probability of buying a more expensive compact fluorescent light (CFL) bulb when it has a green label (“protect the environment”) or not as a function of political ideology
Probability of choosing the CFL bulb
No label
Green label
1
0.75
0.5
0.25
0
Political ideologyLiberal Conservative
–1.6 –1.2 –0.8 –0.4 0 0.4 0.8 1.2 1.6
a publication of the behavioral science & policy association 69
that did not. In contrast, the greenhouse gas rating on
the new EPA label is continuous (for example, 6 vs. 8
on a 10-point scale) and is less likely to appear as an
endorsement of a political view.
Relative: Provide Information with Meaningful Comparisons
Our third principle is to express energy-related infor-
mation in a way that allows consumers to compare
their own energy use with meaningful benchmarks,
such as other consumers or other products. This prin-
ciple is illustrated nicely in a series of large-scale behav-
ioral interventions conducted by the company OPower
across many areas of the United States. The company
applied social psychological research on descriptive
norms to reduce energy consumption.21 In field studies,
OPower presented residential electricity consumers
with feedback on how their energy use compared
with the energy use of similar neighbors (thereby
largely holding constant housing age, size, and local
weather conditions). Consumers who see that they are
using more energy than those in comparable homes
are motivated to reduce their energy use. To offset
complacency in homes performing better than average,
OPower couples neighbor feedback with a positive
message, such as a smiley face, to encourage sustained
performance. Feedback about neighbors alone—in the
absence of any changes in price or incentives—reduces
energy consumption by about 2%, which is roughly the
reduction one would expect if prices were increased
through a 20% tax increase.22 Other studies have shown
that feedback about neighbors can produce small but
enduring savings for natural gas23and water consump-
tion.24,25 Moreover, there is no evidence that consumers
ignore or tire of feedback over time.26 Although many
OPower interventions combine neighbor feedback with
helpful advice on how to reduce energy use, research
suggests that norm information alone is effective in
motivating change.27
The benefits of comparative information are often
attributed to people’s intrinsic competitiveness. Home-
owners want to “keep up with the Joneses” in every-
thing, including their energy conservation. Competition
plays an important part, but we believe that the
neighbor feedback effect demonstrates a more basic
psychological point. Energy consumption (for example,
kilowatts or ergs) and even energy costs (for example,
$73.39) are difficult to evaluate on their own. Is $73.39
a lot of money or a little? Feedback about neighbors’
energy consumption provides a reference point that
helps people judge the magnitude of the outcomes of
their actions, as when they learn that they spend $40
more per month on natural gas than their neighbors do.
Providing information so that it can be seen as relatively
better or worse than a salient comparison measure,
such as neighborhood norms, the numbered scale for
HERS (see Figure 4), or the greenhouse gas ratings on
the EPA label (see Figure 1), helps consumers better
understand an otherwise abstract energy measure.28,29
Reference points also have a second effect, which
is to increase motivation. Decades of research have
shown that people strongly dislike the feelings of
loss, failure, and disappointment. Further, the motiva-
tion to eliminate negative outcomes is substantially
stronger than the motivation to achieve similar positive
outcomes.30,31 Because reference points allow people to
judge whether outcomes are good or bad, they strongly
motivate those who are coming up short to close the
gap: Being worse than the neighbors or ending up “in
the red” (see Figure 4) leads people to work to avoid
those outcomes.
Of course, about half of the people in an OPower
study would be given the positive feedback that they
are better than average, which can lead to compla-
cency. An alternative is to have people focus on stretch
goals instead of the average neighbor.32 Carrico and
Riemer studied the energy use in 24 buildings on a
college campus.33 The occupants of half of the build-
ings were randomly assigned to meet a goal of a 15%
reduction in energy use and received monthly feedback
in graphic form. Occupants of the remaining build-
ings received the same goal but no feedback on their
performance. There were no financial incentives tied to
meeting the goal, and none of the occupants person-
ally bore any of the energy costs. Nevertheless, those
who received feedback on whether they met the goal
achieved a 7% reduction in energy use; those who
received no feedback showed no reduction in energy
use.
OPower uses a similar logic when it lists the energy
consumption of the 10% most efficient homes in a
neighborhood, in addition to the energy consumption
of the average home. This challenging reference point
introduces a goal and gives residents with better than
average energy consumption habits a target that they
70 behavioral science & policy | spring 2015
currently fall short of and can aim for.
Research on self-set goals has also found beneficial
effects. In a study of 2,500 Northern Illinois homes,
Harding and Hsiaw found that homeowners who set
realistic goals for reducing their electricity use (goals
up to 15%) reduced their consumption about 11% on
average, which is substantially more than the reduc-
tions achieved by homeowners who set no goals or
who set unrealistically ambitious goals and abandoned
them.34
Of the many possible reference points that could be
used, which ones best help reduce energy consump-
tion? Focusing on typical numbers (such as neighbor
averages) helps consumers know where they stand;
deviating from the typical may motivate consumers to
explore why they are inferior or superior to others. As
we have noted, however, superiority can also lead to
complacency. If continued energy reduction is desired,
policymakers or business owners should identify a
realistic reference point that casts current levels of
consumption as falling short. Both realistic goals, say
a 10% reduction, and social comparisons to the best
performers, such as the 10% of neighbors who use
the least energy, create motivation for those already
performing better than average.
The most extreme form of relative comparison is
when all energy information is converted to a few
ranked categories, such as with a binary certification
system (for example, Energy Star certified or not) or
using a limited number of colors and letter grades (e.g.,
European Union energy efficiency labels).5,29,35 If used
alone, these simple rankings are likely to be effective
at changing behavior,29 but they may generate some
undesirable consequences. For example, ranked cate-
gories exaggerate the perceived difference between
two similar products that happen to fall on either side
of a threshold (for example, B vs. C or green vs. yellow)
and thereby distort consumer choice.29,35 Other chal-
lenges arise when there are multiple product catego-
ries, such as SUVs and compact vehicles—should an
efficient SUV be graded against all vehicles (and score
poorly) or against other SUVs (and score highly)? We
recommend that simple categories not be used alone
but rather be combined with richer information on
cost and energy consumption so that consumers can
make a decision that best fits their personal goals and
preferences.
Expand: Provide Information on Larger Scales
Our fourth principle is to express energy-related infor-
mation on expanded scales, which allows the impact of
a change to be seen over longer periods of time or over
greater use. For example, the cost of using an appli-
ance could be expressed as 30 cents per day, $109.50
per year, or $1,095 over 10 years. Fundamentally, these
expressions are identical. However, a growing body
of research shows that people pay more attention to
otherwise identical information if it is expressed on
expanded scales (such as cost over 10 years) rather than
contracted scales (cost per day). As a result, they are
more likely to choose options that look favorable on
the expanded dimensions.36–39 When people compare
two window air-conditioning units that differ in their
energy use, small scales such as cost per hour make
the differences look trivial—savings are within pennies
of each other (for example, 30 cents vs. 40 cents per
hour). Large scales such as cost per year, however,
reveal costs in the hundreds of dollars (e.g., $540 vs.
$720 per year). The problem of trivial costs raises ques-
tions about the benefits of smart meters. If real-time
energy and cost feedback are expressed in terms of
hourly consumption, for example, all energy use can
seem inconsequential.
A number of studies have shown that providing cost
information over an extended period of time, such as
the cost of energy over the expected lifetime operation
of a product, increases preferences for more expensive
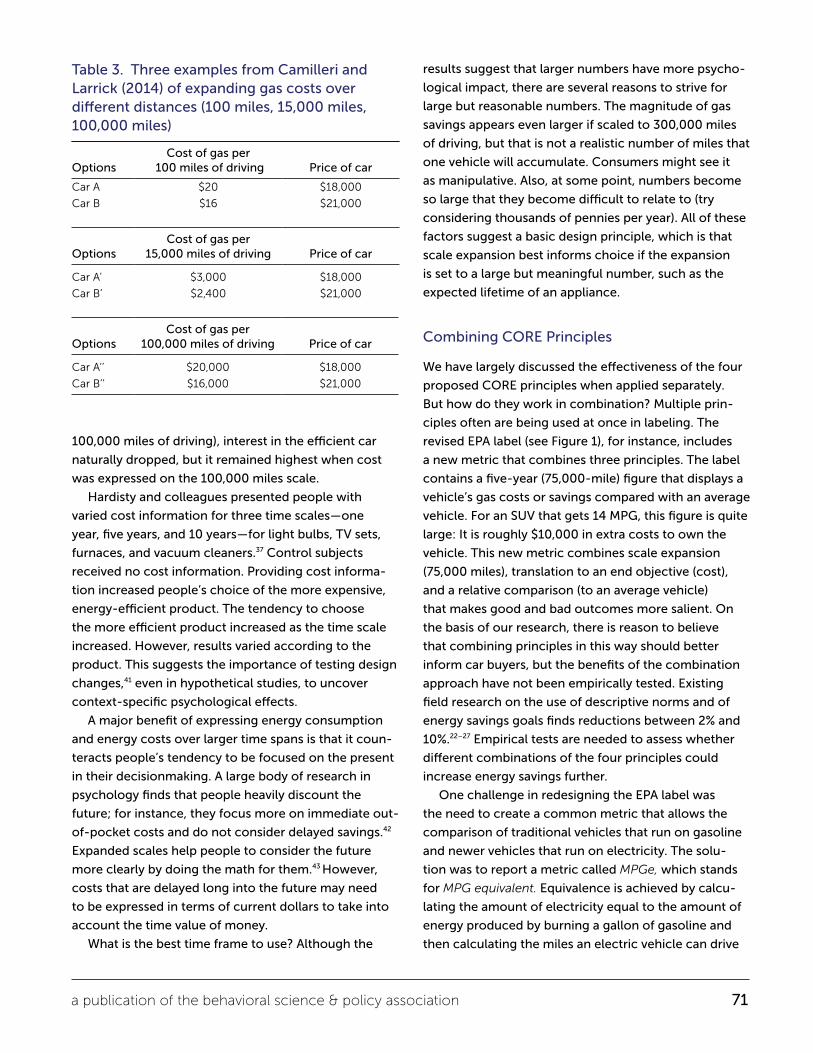
but more efficient products.37,38 Camilleri and Larrick
tested the benefits of scale expansion directly by giving
people (n = 424) hypothetical choices between six
pairs of cars in which a more efficient car cost more
than a less efficient car.40 Participants saw vehicle gas
consumption stated for one of three distances: 100
miles, which is the distance used to express consump-
tion on the EPA car label; 15,000 miles, which is the
distance used to express annual fuel costs on the EPA
car label; or 100,000 miles, which is roughly equivalent
to a car’s lifetime driving distance (see Table 3).
The researchers presented some participants with a
gas-consumption metric and others with a cost metric.
Participants were most likely to choose the efficient car
when they were given cost information (an end objec-
tive) and when it was scaled over 100,000 miles. In a
second study, when the gas savings from the efficient
car did not cover the difference in upfront price (over
a publication of the behavioral science & policy association 71
100,000 miles of driving), interest in the efficient car
naturally dropped, but it remained highest when cost
was expressed on the 100,000 miles scale.
Hardisty and colleagues presented people with
varied cost information for three time scales—one
year, five years, and 10 years—for light bulbs, TV sets,
furnaces, and vacuum cleaners.37 Control subjects
received no cost information. Providing cost informa-
tion increased people’s choice of the more expensive,
energy- efficient product. The tendency to choose
the more efficient product increased as the time scale
increased. However, results varied according to the
product. This suggests the importance of testing design
changes,41 even in hypothetical studies, to uncover
context-specific psychological effects.
A major benefit of expressing energy consumption
and energy costs over larger time spans is that it coun-
teracts people’s tendency to be focused on the present
in their decisionmaking. A large body of research in
psychology finds that people heavily discount the
future; for instance, they focus more on immediate out-
of-pocket costs and do not consider delayed savings.42
Expanded scales help people to consider the future
more clearly by doing the math for them.43 However,
costs that are delayed long into the future may need
to be expressed in terms of current dollars to take into
account the time value of money.
What is the best time frame to use? Although the
results suggest that larger numbers have more psycho-
logical impact, there are several reasons to strive for
large but reasonable numbers. The magnitude of gas
savings appears even larger if scaled to 300,000 miles
of driving, but that is not a realistic number of miles that
one vehicle will accumulate. Consumers might see it
as manipulative. Also, at some point, numbers become
so large that they become difficult to relate to (try
considering thousands of pennies per year). All of these
factors suggest a basic design principle, which is that
scale expansion best informs choice if the expansion
is set to a large but meaningful number, such as the
expected lifetime of an appliance.
Combining CORE Principles
We have largely discussed the effectiveness of the four
proposed CORE principles when applied separately.
But how do they work in combination? Multiple prin-
ciples often are being used at once in labeling. The
revised EPA label (see Figure 1), for instance, includes
a new metric that combines three principles. The label
contains a five-year (75,000-mile) figure that displays a
vehicle’s gas costs or savings compared with an average
vehicle. For an SUV that gets 14 MPG, this figure is quite
large: It is roughly $10,000 in extra costs to own the
vehicle. This new metric combines scale expansion
(75,000 miles), translation to an end objective (cost),
and a relative comparison (to an average vehicle)
that makes good and bad outcomes more salient. On
the basis of our research, there is reason to believe
that combining principles in this way should better
inform car buyers, but the benefits of the combination
approach have not been empirically tested. Existing
field research on the use of descriptive norms and of
energy savings goals finds reductions between 2% and
10%.22–27 Empirical tests are needed to assess whether
different combinations of the four principles could
increase energy savings further.
One challenge in redesigning the EPA label was
the need to create a common metric that allows the
comparison of traditional vehicles that run on gasoline
and newer vehicles that run on electricity. The solu-
tion was to report a metric called MPGe, which stands
for MPG equivalent. Equivalence is achieved by calcu-
lating the amount of electricity equal to the amount of
energy produced by burning a gallon of gasoline and
then calculating the miles an electric vehicle can drive
Table 3. Three examples from Camilleri and Larrick (2014) of expanding gas costs over different distances (100 miles, 15,000 miles, 100,000 miles)
OptionsCost of gas per
100 miles of driving Price of car
Car A $20 $18,000
Car B $16 $21,000
OptionsCost of gas per
15,000 miles of driving Price of car
Car A’ $3,000 $18,000
Car B’ $2,400 $21,000
OptionsCost of gas per
100,000 miles of driving Price of car
Car A’’ $20,000 $18,000
Car B’’ $16,000 $21,000
72 behavioral science & policy | spring 2015
on that amount of electricity. On the basis of the prin-
ciples we have proposed, this metric is a poor one. First,
it inherits all of the problems of MPG—it leads people
to underestimate the benefits of improving inefficient
vehicles and to overestimate the benefits of improving
efficient vehicles. Second, it completely obscures both
the cost and the environmental implications of the
energy source, which are buried in the denominator.
A better approach would be to express the cost and
environmental implications of the energy source over
a given distance of driving. This is not a trivial under-
taking because the cost and environmental implica-
tions of electricity vary widely across the United States
depending on regulation and the relative reliance on
coal, natural gas, hydropower, or other renewables to
produce electricity (to address this challenge, the U.S.
Department of Energy provides a zip code–based cost
and carbon calculator for all vehicles: http://www.afdc.
energy.gov/calc/). Despite the challenges, this infor-
mation would be more useful to consumers than the
confusing MPGe metric.
Although we have proposed the CORE principles
in the context of energy consumption information,
the same principles may be useful when providing
information about a wide range of consumer choices.
For example, the federal Affordable Care Act requires
chain restaurants to provide calorie information about
their menu items by the end of 2015. Although some
studies have found that calorie labeling reduces calorie
consumption,44 the results across studies have been a
mix of beneficial and neutral effects.45,46 The provision
of calorie information has a larger effect, however, if
a relative comparison is offered, such as when there is
a list of alternatives from high to low calorie;47 when
calorie counts are compared with recommended daily
calorie intake;48 or when calorie levels are expressed
using traffic light colors of green, yellow, and red.49
There is also limited evidence that translating calories
to another objective, the amount of exercise required
to burn an equivalent number of calories, also reduces
consumption.50,51 Although we know of no existing
studies testing it, the expansion principle might also be
of use in the food domain. For example, phone apps
that count calories consumed and burned in a given
day could provide estimates of weight loss or weight
gain if those same behaviors occurred over a month.
Dieters might be motivated by seeing a small number
scaled up to something relevant to an objective as
important as expected weight loss. Research exploring
how the principles influence choices in disparate
domains, such as energy consumption and obesity-
reduction projects, might be useful to both areas.
CORE can also be applied to more consumer
domains if the C is broadened from consumption to
include calculations of many kinds. MPG is a misleading
measure because its relationship to gas consumption
is highly nonlinear. A GPHM metric is helpful because it
does the math for consumers. There are other nonlinear
relationships that consumers face for which calcula-
tions would be helpful. Consumers systematically
underestimate the beneficial effects of compounding
on retirement savings52 and the detrimental effects of
compounding on unpaid credit card debt.53 Explicitly
providing these calculations is helpful in both cases.
A familiar product, sunscreen, also has a misleading
curvilinear relationship. Sunscreen is measured using
a sun-protection-factor (SPF) score that might range
in value from 15 to 100, which captures the number of
minutes a consumer could stay in the sun to achieve
the same level of sunburn that results from one minute
of unprotected exposure. A more meaningful number,
however, is the percentage of radiation blocked by the
sunscreen. This is calculated by subtracting 1/SPF from
1 and reveals the similarity of all sunscreens above 30
SPF. A 30-SPF sunscreen blocks 97% of UV radiation,
and a 50-SPF sunscreen blocks 98% of UV radiation.
Dermatologists consider any further differentiation
above 50-SPF pointless,54 and regulators in Japan,
Canada, and Europe cap SPF values at 50.55
When one is trying to make the most of the CORE
principles described above, it is important to consider
how much as well as what kind of information to
provide to help people choose. Too much information
can be overwhelming. Consider food nutrition labels.
They contain dozens of pieces of information that are
hard to evaluate and hard to directly translate to end
objectives such as minimizing weight gain or protecting
heart health. Thus, we believe that simplicity is also an
important principle when providing information (and
can be added as the first letter in a modified acronym,
SCORE). Simplicity is at odds with multiple transla-
tions. To reconcile this conflict, we propose the idea of
minimal coverage: striving to cover diverse end objec-
tives with a minimum of information. The revised EPA
label succeeds here. It is not too cluttered and conveys
a minimal set of distinct information (energy, costs,
a publication of the behavioral science & policy association 73
and greenhouse gas impacts) to allow consumers with
different values to recognize and act on objectives they
care about. Of course, a focus on one primary thing—
energy use—requires only a few possible translations.
Feasibility and Acceptability
Thanks to the best-selling 2008 book Nudge: Improving
Decisions About Health, Wealth, and Happiness by
Thaler and Sunstein,10 behavioral interventions to help
consumers are often termed nudges because they
encourage a change in behavior without restricting
choice. However, there has been recent debate over
both the ethics and the political feasibility of imple-
menting nudges to influence consumer behavior.
We believe it is useful to evaluate nudges in terms of
how they operate psychologically. Some nudges steer
behavior by tapping known psychological tenden-
cies that people have but are not aware of. Others try
to guide decisionmakers by improving their decision
processes. Perhaps the best known steering nudge is
the use of default options to influence choice. Deci-
sionmakers who are required to start with one choice
alternative, such as being enrolled in a company retire-
ment plan56 or being registered as an organ donor,57
tend to stick with the first alternative—the default—
when given the option to opt out. Consequently, those
who must opt out end up selecting the default option
at a much higher rate than those who must actively opt
in to get the same alternative. Defaults tap a number of
known psychological tendencies such as a bias for the
status quo and inertia, which people exhibit without
being aware they are doing so.58 Guiding nudges, on the
other hand, tend to offer information that consumers
care about and make it easy to use—examples include
informing credit card users that paying the minimum
each month will trap them in debt for 15 years and
double their total interest costs compared with paying
an amount that would allow them to pay off the debt in
three years.53
Two of the CORE principles we propose are guiding
nudges. Both consumption metrics and expanded
scales improve information processing by delivering
relevant, useful math. The two remaining principles,
however, both guide and steer. Translating energy to
costs and environmental impacts improves the deci-
sionmaking process by calling people’s attention to
objectives they care about and providing a signpost
for achieving them. The practice also taps into a basic
psychological tendency, counting, that makes effi-
cient options more attractive. The revised EPA label,
for instance, may encourage counting when it displays
multiple related benefits of efficient vehicles. Similarly,
relative comparisons improve information processing
by providing a frame of reference for evaluating other-
wise murky energy information. However, comparison
also taps into a powerful psychological tendency: the
desire to achieve good outcomes and the even stronger
desire to avoid bad ones. As we have explained, there
are many possible comparisons, such as the energy
used by an average neighbor or an energy reduction
goal, and no comparison is obviously the right one to
use.
We emphasize that although the CORE principles
we advance are designed to make energy information
more usable, they may not always yield stronger prefer-
ences for energy reduction. For example, consumption
metrics make clear that improvements on inefficient
technologies can yield large reductions in consump-
tion (and in costs and environmental impact). They
also make clear that large efficiency gains on already
efficient technologies, such as trading in a 50-MPG
hybrid for a 100-MPGe plug-in or a 16-SEER air-condi-
tioning unit for a 24-SEER air-conditioning unit, will
be very expensive but yield only small absolute savings
in energy and cost. If some car buyers who would
have bought a 16-MPG vehicle now see the benefits
of choosing a 20-MPG vehicle, other buyers may no
longer trade in their 30-MPG sedan for a 50-MPG
hybrid.59 An interesting empirical question is whether
other motivations, such as a strong interest in the
environment, will keep the already efficiency- minded
segment pushing toward the most efficient technolo-
gies for intrinsic reasons. Alternatively, consumers who
value environmental conservation may choose to shift
their attention from one technology to another (from
automobiles to household energy use, for instance)
once it is apparent they have achieved a low level of
energy consumption in the first technology.60
We recognize that better energy metrics can have
only limited impact. Better metrics can improve and
inform decisions and remind people of what they value,
but they may do little to change people’s attitudes
about energy or the environment. There is a growing
literature on political differences in environmental atti-
tudes and the motivations that lead people to be open
74 behavioral science & policy | spring 2015
to or resist energy efficiency as a solution to climate
change.19,20,61,62 An understanding of what motivates
people to be concerned with energy use complements
this article’s focus on how best to provide information.
In addition, better energy metrics will not influence
behavior as powerfully as policy levers such as raising
the Corporate Average Fuel Economy standards to 54.5
MPG, for example, or raising fossil fuel prices to reflect
their environmental costs. However, designing better
energy metrics is politically attractive because they
represent a low-cost intervention that focuses primarily
on informing consumers while preserving their freedom
to choose.
Even though the benefit of any given behavioral
intervention may be modest,22 pursuing and achieving
benefits from multiple interventions can have a large
impact as larger political and technological solutions
are pursued.4,63 Moreover, better energy metrics can
make future political and technological developments
more powerful. If cultural shifts produce greater
concern for the environment, or political shifts lead to
mechanisms that raise the cost of fossil fuels to reflect
their environmental impacts, a clear understanding of
energy consumption and its impacts would empower
consumers to respond more effectively to such
policy changes.
wedge to rapidly reduce US carbon emissions. PNAS: Proceedings of the National Academy of Sciences, USA, 106, 18452–18456.
5. Office of Transportation and Air Quality & National Highway Traffic Safety Administration. (2010). Environmental Protection Agency fuel economy label: Expert panel report (EPA-420-R-10-908). Retrieved from http://www.epa.gov/fueleconomy/label/420r10908.pdf
6. Hincha-Ownby, M. (2010). Consumers confused by proposed EPA car labels. Retrieved from http://www.mnn.com/green-tech/transportation/stories/consumers-confused-by-proposed-epa-car-labels
7. Doggett, S. (2011). EPA unveils smart new fuel economy labels. Retrieved from http://www.edmunds.com/autoobserver-archive/2011/05/epa-unveils-smart-new-fuel-economy-labels.html
8. Kahneman, D. (2011). Thinking, fast and slow. New York, NY: Farrar, Straus and Giroux.
9. Johnson, E. J., Shu, S.B., Dellaert, B. G. C., Fox, C.R., Goldstein, D.G., Haubl, G., . . . Weber, E. U. (2012). Beyond nudges: Tools of a choice architecture. Marketing Letters, 23, 487–504.
10. Thaler, R. H., & Sunstein, C. R. (2008). Nudge: Improving decisions about health, wealth, and happiness. New Haven, CT: Yale University Press.
11. Larrick, R. P., & Soll, J. B. (2008, June 20). The MPG illusion. Science, 320, 1593–1594.
12. Plumer, B. (2011, November 5). Was “cash for clunkers” a clunker? [Blog post]. Retrieved from http://www.washingtonpost.com/blogs/wonkblog/post/was-cash-for-clunkers-a-clunker/2011/11/04/gIQA42EhpM_blog.html
13. National Research Council. (2010). Technologies and approaches to reducing the fuel consumption of medium- and heavy-duty vehicles. Washington, DC: National Academies Press.
14. National Research Council. (2011). Assessment of fuel economy technologies for light-duty vehicles. Washington, DC: National Academies Press.
15. Larrick, R. P., & Cameron, K. W. (2011). Consumption-based metrics: From autos to IT. Computer, 44, 97–99.
16. Keeney, R. L. (1992). Value-focused thinking: A path to creative decision making. Cambridge, MA: Harvard University Press.
17. Ungemach, C., Camilleri, A. R., Johnson, E. J., Larrick, R. P., & Weber, E. U. (2014). Translated attributes as a choice architecture tool. Durham, NC: Duke University.
18. Weber, M., Eisenführ, F., & Von Winterfeldt, D. (1988). The effects of splitting attributes on weights in multiattribute utility measurement. Management Science, 34, 431–445.
19. Costa, D. L., & Kahn, M. E. (2013). Energy conservation “nudges” and environmentalist ideology: Evidence from a randomized residential electricity field experiment. Journal of the European Economic Association, 11, 680–702.
20. Gromet, D. M., Kunreuther, H., & Larrick, R. P. (2013). Political identity affects energy efficiency attitudes and choices. PNAS: Proceedings of the National Academy of Sciences, USA, 110, 9314–9319.
21. Schultz, P. W., Nolan, J., Cialdini, R., Goldstein, N., & Griskevicius, V. (2007). The constructive, destructive, and reconstructive power of social norms. Psychological Science, 18, 429–434.
22. Allcott, H. (2011). Social norms and energy conservation. Journal of Public Economics, 95, 1082–1095.
23. Ayres, I., Raseman, S., & Shih, A. (2013). Evidence from two large field experiments that peer comparison feedback can reduce residential energy usage. Journal of Law, Economics, and Organization, 29, 992–1022.
24. Ferraro, P. J., & Miranda, J. J. (2013). Heterogeneous treatment effects and mechanisms in information-based environmental
author affiliation
Larrick, Soll, and Keeney, Fuqua School of Business,
Duke University. Corresponding author’s e-mail:
References
1. Attari, S. Z., DeKay, M. L., Davidson, C. I., & de Bruin, W. B. (2010). Public perceptions of energy consumption and savings. PNAS: Proceedings of the National Academy of Sciences, USA, 107, 16054–16059.
2. Gillingham, K., Newell, R., & Palmer, K. (2006). Energy efficiency policies: A retrospective examination. Annual Review of Environment and Resources, 31, 161–192.
3. Gillingham, K., & Palmer, K. (2014). Bridging the energy efficiency gap: Policy insights from economic theory and empirical evidence. Review of Environmental Economics and Policy, 8, 18–38.
4. Dietz, T., Gardner, G. T., Gilligan, J., Stern, P. C., & Vandenbergh, M. P. (2009). Household actions can provide a behavioral
a publication of the behavioral science & policy association 75
policies: Evidence from a large-scale field experiment. Resource and Energy Economics, 35, 356–379.
25. Ferraro, P. J., Miranda, J. J., & Price, M. K. (2011). The persistence of treatment effects with norm-based policy instruments: Evidence from a randomized environmental policy experiment. American Economic Review, 101, 318–322.
26. Allcott, H., & Rogers, T. (in press). The short-run and long-run effects of behavioral interventions: Experimental evidence from energy conservation. American Economic Review.
27. Dolan, P., & Metcalfe, R. (2013). Neighbors, knowledge, and nuggets: Two natural field experiments on the role of incentives on energy conservation (CEP Discussion Paper CEPDP1222). London, United Kingdom: London School of Economics and Political Science, Centre for Economic Performance.
28. Hsee, C. K., Loewenstein, G. F., Blount, S., & Bazerman, M. H. (1999). Preference reversals between joint and separate evaluations of options: A review and theoretical analysis. Psychological Bulletin, 125, 576–590.
29. Newell, R. G., & Siikamaki, J. (2014). Nudging energy efficiency behavior: The role of information labels. Journal of the Association of Environmental and Resource Economists, 1, 555–598.
30. Kahneman, D., & Tversky, A. (1979). Prospect theory: An analysis of decision under risk. Econometrica, 47, 263–292.
31. Tversky, A., & Kahneman, D. (1991). Loss aversion in riskless choice: A reference-dependent model. Quarterly Journal of Economics, 106, 1039–1061.
32. Heath, C., Larrick, R. P., & Wu, G. (1999). Goals as reference points. Cognitive Psychology, 38, 79–109.
33. Carrico, A. R., & Riemer, M. (2011). Motivating energy conservation in the workplace: An evaluation of the use of group-level feedback and peer education. Journal of Environmental Psychology, 31, 1–13.
34. Harding, M., & Hsiaw, A. (2014). Goal setting and energy conservation. Journal of Economic Behavior and Organization, 107, 209–227.
35. Houde, S. (2014). How consumers respond to environmental certification and the value of energy information (NBER Working Paper w20019). Cambridge, MA: National Bureau of Economic Research.
36. Burson, K. A., Larrick, R. P., & Lynch, J. G., Jr. (2009). Six of one, half dozen of the other: Expanding and contracting numerical dimensions produces preference reversals. Psychological Science, 20, 1074–1078.
37. Hardisty, D. J., Shim, Y., & Griffin, D. (2014). Encouraging energy efficiency: Product labels activate temporal tradeoffs. Vancouver, British Columbia, Canada: University of British Columbia Sauder School of Business. Contact David Hardisty.
38. Kaenzig, J., & Wüstenhagen, R. (2010). The effect of life cycle cost information on consumer investment decisions regarding eco-innovation. Journal of Industrial Ecology, 14, 121–136.
39. Pandelaere, M., Briers, B., & Lembregts, C. (2011). How to make a 29% increase look bigger: The unit effect in option comparisons. Journal of Consumer Research, 38, 308–322.
40. Camilleri, A. R., & Larrick, R. P. (2014). Metric and scale design as choice architecture tools. Journal of Public Policy and Marketing, 33, 108–125.
41. Sunstein, C. R. (2011). Empirically informed regulation. University of Chicago Law Review, 78, 1349–1429.
42. Hardisty, D. J., & Weber, E. U. (2009). Discounting future green: Money versus the environment. Journal of Experimental Psychology: General, 138, 329–340.
43. Weber, E. U., Johnson, E. J., Milch, K. F., Chang, H., Brodscholl, J. C., & Goldstein, D. G. (2007). Asymmetric discounting in intertemporal choice: A query-theory account. Psychological Science, 18, 516–523.
44. Bollinger, B., Leslie, P., & Sorenson, A. (2011). Calorie posting
in chain restaurants. American Economic Journal: Economic Policy, 3, 91–128.
45. Kiszko, K. M., Martinez, O. D., Abrams, C., & Elbel, B. (2014). The influence of calorie labeling on food orders and consumption: A review of the literature. Journal of Community Health, 39, 1–22.
46. Sinclair, S. E., Cooper, M., & Mansfield, E. D. (2014). The influence of menu labeling on calories selected or consumed: A systematic review and meta-analysis. Journal of the Academy of Nutrition and Dietetics, 114, 1375–1388.
47. Liu, P. J., Roberto, C. A., Liu, L. J., & Brownell, K. D. (2012). A test of different menu labeling presentations. Appetite, 59, 770–777.
48. Roberto, C. A., Larsen, P. D., Agnew, H., Baik, J., & Brownell, K. D. (2010). Evaluating the impact of menu labeling on food choices and intake. American Journal of Public Health, 100, 312–318.
49. Thorndike, A. N., Sonnenberg, L., Riis, J., Barraclough, S., & Levy, D. E. (2012). A 2-phase labeling and choice architecture intervention to improve healthy food and beverage choices. American Journal of Public Health, 102, 527–533.
50. Bleich, S. N., Herring, B. J., Flagg, D. D., & Gary-Webb, T. L. (2012). Reduction in purchases of sugar-sweetened beverages among low-income Black adolescents after exposure to caloric information. American Journal of Public Health, 102, 329–335.
51. James, A., Adams-Huet, B., & Shah, M. (2014). Menu label displaying the kilocalorie content or the exercise equivalent: Effects on energy ordered and consumed in young adults. American Journal of Health Promotion, 29, 294–302.
52. McKenzie, C. R. M., & Liersch, M. J. (2011). Misunderstanding savings growth: Implications for retirement savings behavior. Journal of Marketing Research, 48(SPL), S1–S13.
53. Soll, J. B., Keeney, R. L., & Larrick, R. P. (2013). Consumer misunderstanding of credit card use, payments, and debt: Causes and solutions. Journal of Public Policy and Marketing, 32, 66–81.
54. Harris, G. (2011, June 14). F.D.A. unveils new rules about sunscreen claims. The New York Times. Retrieved from http://www.nytimes.com
55. EWG. (n.d.). What’s wrong with high SPF? Retrieved from http://www.ewg.org/2014sunscreen/whats-wrong-with-high-spf/
56. Thaler, R. H., & Benartzi, S. (2004). Save More Tomorrow™: Using behavioral economics to increase employee saving. Journal of Political Economy, 112, S164–S187.
57. Johnson, E. J., & Goldstein, D. (2003, November 21). Do defaults save lives? Science, 302, 1338–1339.
58. Smith, N. C., Goldstein, D. G., & Johnson, E. J. (2013). Choice without awareness: Ethical and policy implications of defaults. Journal of Public Policy and Marketing, 32, 159–172.
59. Allcott, H. (2013). The welfare effects of misperceived product costs: Data and calibrations from the automobile market. American Economic Journal: Economic Policy, 5, 30–66.
60. Truelove, H. B., Carrico, A. R., Weber, E. U., Raimi, K. T., & Vandenbergh, M. P. (2014). Positive and negative spillover of pro-environmental behavior: An integrative review and theoretical framework. Global Environmental Change, 29, 127–138.
61. Campbell, T., & Kay, A. C. (2014). Solution aversion: On the relation between ideology and motivated disbelief. Journal of Personality and Social Psychology, 107, 809–824.
62. Feinberg, M., & Willer, R. (2013). The moral roots of environmental attitudes. Psychological Science, 24, 56–62.
63. Pacala, S., & Socolow, R. (2004, August 13). Stabilization wedges: Solving the climate problem for the next 50 years with current technologies. Science, 305, 968–972.