REVIEW Addressing Central Nervous System (CNS) …drsmith/migrated/metx270/html/Reichel 2009... ·...
20
REVIEW Addressing Central Nervous System (CNS) Penetration in Drug Discovery: Basics and Implications of the Evolving New Concept by Andreas Reichel Research Pharmacokinetics, Global Drug Discovery, Bayer Schering Pharma, Mɒllerstrasse 178, D-13342 Berlin (phone: þ 493046811384; fax: þ 49 30 4689 1384; e-mail: [email protected]) Despite enormous efforts, achieving a safe and efficacious concentration profile in the brain remains one of the big challenges in central nervous system (CNS) drug discovery and development. Although there are multiple reasons, many failures are due to underestimating the complexity of the brain, also in terms of pharmacokinetics (PK). To this day, PK support of CNS drug discovery heavily relies on improving the blood–brain barrier (BBB) permeability in vitro and/or the brain/plasma ratio ( K p ) in vivo, even though neither parameter can be reliably linked to pharmacodynamic (PD) and efficacy readouts. While increasing BBB permeability may shorten the onset of drug action, an increase in the total amount in brain may not necessarily increase the relevant drug concentration at the pharmacological target. Since the traditional K p ratio is based on a crude homogenization of brain tissue, it ignores the compartmentalization of the brain and an increase favors non-specific binding to brain lipids rather than free drug levels. To better link exposure/PK to efficacy/PD and to delineate key parameters, an integrated approach to CNS drug discovery is emerging which distinguishes total from unbound brain concentrations. As the complex nature of the brain requires different compartments to be considered when trying to understand and improve new compounds, several complementary parameters need to be measured in vitro and in vivo, and integrated into a coherent model of brain penetration and distribution. The new paradigm thus concentrates on finding drug candidates with the right balance between free fraction in plasma and brain, and between rate and extent of CNS penetration. Integrating this data into a coherent model of CNS distribution which can be linked to efficacy will allow it to design compounds with an optimal mix in physicochemical, pharmacologic, and pharmacokinetic properties, ultimately mitigating the risk for failures in the clinic. Abbreviations A brain amount of compound in brain, corrected for intravascular content [mg/g brain] ADME absorption, distribution, metabolism, excretion AUC area under the concentration time curve, e.g., in plasma or in brain BBB blood-brain barrier CNS central nervous system CSF cerebrospinal fluid C u,brain unbound concenration in brain, surrogate for brain ISF levels [ng/ml] DMPK drug metabolism and pharmacokinetics ER b-a/a-b efflux ratio, e.g., in the MDCK-MDR1 permeation assay f u,brain fraction unbound in brain f u,plasma fraction unbound in plasma CHEMISTRY & BIODIVERSITY – Vol. 6 (2009) 2030 # 2009 Verlag Helvetica Chimica Acta AG, Zɒrich
Transcript of REVIEW Addressing Central Nervous System (CNS) …drsmith/migrated/metx270/html/Reichel 2009... ·...

REVIEW
Addressing Central Nervous System (CNS) Penetration in Drug Discovery:Basics and Implications of the Evolving New Concept
by Andreas Reichel
Research Pharmacokinetics, Global Drug Discovery, Bayer Schering Pharma, M�llerstrasse 178,D-13342 Berlin
(phone: þ493046811384; fax: þ4930 46891384; e-mail: [email protected])
Despite enormous efforts, achieving a safe and efficacious concentration profile in the brain remainsone of the big challenges in central nervous system (CNS) drug discovery and development. Althoughthere are multiple reasons, many failures are due to underestimating the complexity of the brain, also interms of pharmacokinetics (PK).
To this day, PK support of CNS drug discovery heavily relies on improving the blood–brain barrier(BBB) permeability in vitro and/or the brain/plasma ratio (Kp) in vivo, even though neither parametercan be reliably linked to pharmacodynamic (PD) and efficacy readouts. While increasing BBBpermeability may shorten the onset of drug action, an increase in the total amount in brain may notnecessarily increase the relevant drug concentration at the pharmacological target. Since the traditionalKp ratio is based on a crude homogenization of brain tissue, it ignores the compartmentalization of thebrain and an increase favors non-specific binding to brain lipids rather than free drug levels.
To better link exposure/PK to efficacy/PD and to delineate key parameters, an integrated approachto CNS drug discovery is emerging which distinguishes total from unbound brain concentrations. As thecomplex nature of the brain requires different compartments to be considered when trying to understandand improve new compounds, several complementary parameters need to be measured in vitro and invivo, and integrated into a coherent model of brain penetration and distribution.
The new paradigm thus concentrates on finding drug candidates with the right balance between freefraction in plasma and brain, and between rate and extent of CNS penetration. Integrating this data into acoherent model of CNS distribution which can be linked to efficacy will allow it to design compoundswith an optimal mix in physicochemical, pharmacologic, and pharmacokinetic properties, ultimatelymitigating the risk for failures in the clinic.
Abbreviations
Abrain amount of compound in brain, corrected for intravascular content [mg/g brain]ADME absorption, distribution, metabolism, excretionAUC area under the concentration time curve, e.g., in plasma or in brainBBB blood-brain barrierCNS central nervous systemCSF cerebrospinal fluidCu,brain unbound concenration in brain, surrogate for brain ISF levels [ng/ml]DMPK drug metabolism and pharmacokineticsER b-a/a-b efflux ratio, e.g., in the MDCK-MDR1 permeation assayfu,brain fraction unbound in brainfu,plasma fraction unbound in plasma
CHEMISTRY & BIODIVERSITY – Vol. 6 (2009)2030
� 2009 Verlag Helvetica Chimica Acta AG, Z�rich
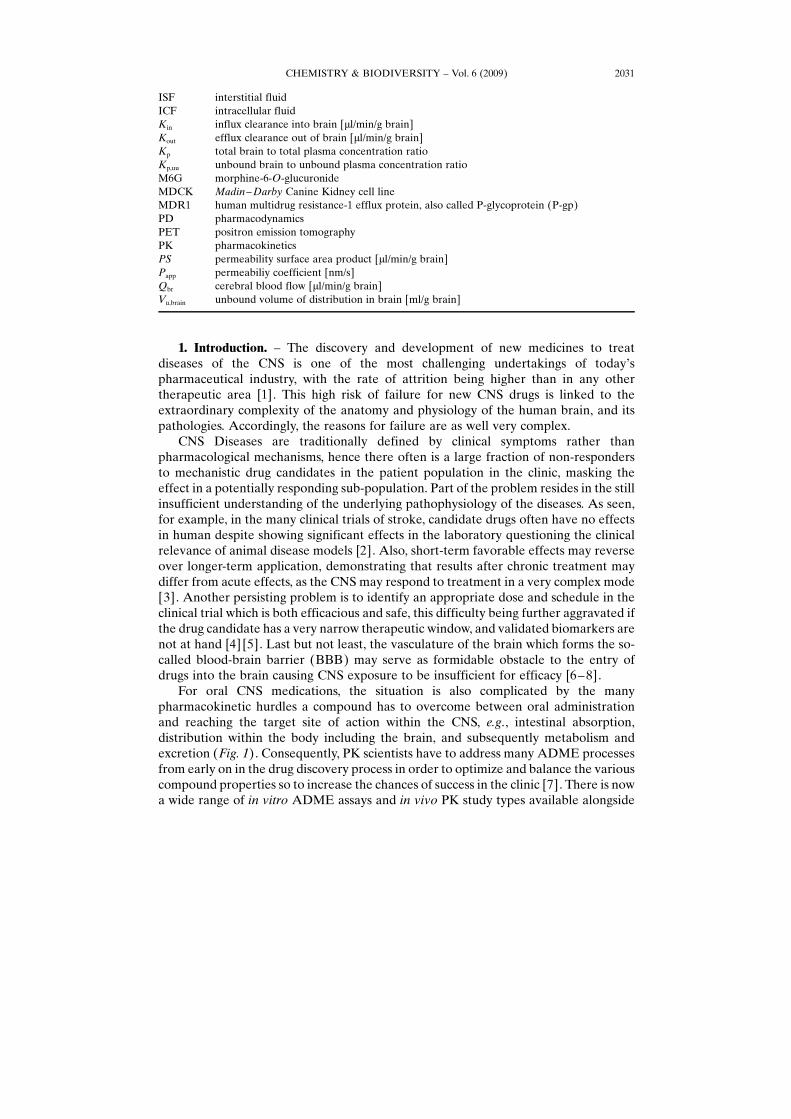
ISF interstitial fluidICF intracellular fluidKin influx clearance into brain [ml/min/g brain]Kout efflux clearance out of brain [ml/min/g brain]Kp total brain to total plasma concentration ratioKp,uu unbound brain to unbound plasma concentration ratioM6G morphine-6-O-glucuronideMDCK Madin–Darby Canine Kidney cell lineMDR1 human multidrug resistance-1 efflux protein, also called P-glycoprotein (P-gp)PD pharmacodynamicsPET positron emission tomographyPK pharmacokineticsPS permeability surface area product [ml/min/g brain]Papp permeabiliy coefficient [nm/s]Qbr cerebral blood flow [ml/min/g brain]Vu,brain unbound volume of distribution in brain [ml/g brain]
1. Introduction. – The discovery and development of new medicines to treatdiseases of the CNS is one of the most challenging undertakings of today�spharmaceutical industry, with the rate of attrition being higher than in any othertherapeutic area [1]. This high risk of failure for new CNS drugs is linked to theextraordinary complexity of the anatomy and physiology of the human brain, and itspathologies. Accordingly, the reasons for failure are as well very complex.
CNS Diseases are traditionally defined by clinical symptoms rather thanpharmacological mechanisms, hence there often is a large fraction of non-respondersto mechanistic drug candidates in the patient population in the clinic, masking theeffect in a potentially responding sub-population. Part of the problem resides in the stillinsufficient understanding of the underlying pathophysiology of the diseases. As seen,for example, in the many clinical trials of stroke, candidate drugs often have no effectsin human despite showing significant effects in the laboratory questioning the clinicalrelevance of animal disease models [2]. Also, short-term favorable effects may reverseover longer-term application, demonstrating that results after chronic treatment maydiffer from acute effects, as the CNS may respond to treatment in a very complex mode[3]. Another persisting problem is to identify an appropriate dose and schedule in theclinical trial which is both efficacious and safe, this difficulty being further aggravated ifthe drug candidate has a very narrow therapeutic window, and validated biomarkers arenot at hand [4] [5]. Last but not least, the vasculature of the brain which forms the so-called blood-brain barrier (BBB) may serve as formidable obstacle to the entry ofdrugs into the brain causing CNS exposure to be insufficient for efficacy [6– 8].
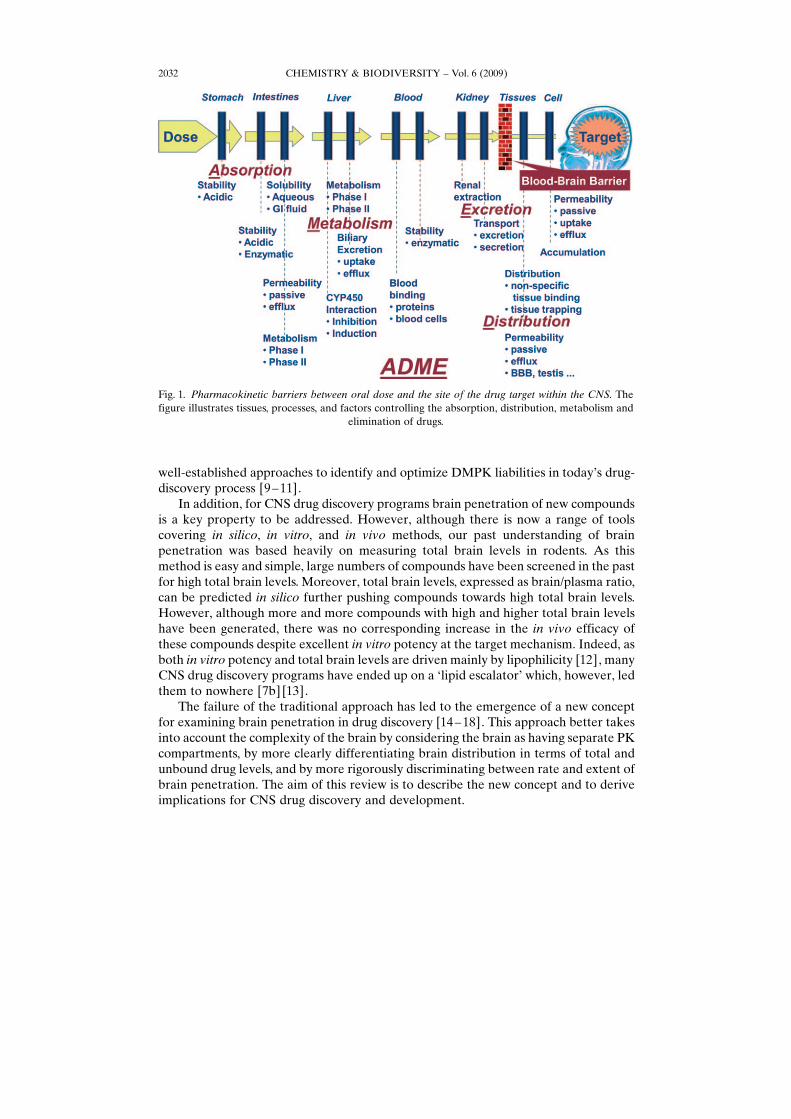
For oral CNS medications, the situation is also complicated by the manypharmacokinetic hurdles a compound has to overcome between oral administrationand reaching the target site of action within the CNS, e.g., intestinal absorption,distribution within the body including the brain, and subsequently metabolism andexcretion (Fig. 1). Consequently, PK scientists have to address many ADME processesfrom early on in the drug discovery process in order to optimize and balance the variouscompound properties so to increase the chances of success in the clinic [7]. There is nowa wide range of in vitro ADME assays and in vivo PK study types available alongside
CHEMISTRY & BIODIVERSITY – Vol. 6 (2009) 2031
well-established approaches to identify and optimize DMPK liabilities in today�s drug-discovery process [9 –11].
In addition, for CNS drug discovery programs brain penetration of new compoundsis a key property to be addressed. However, although there is now a range of toolscovering in silico, in vitro, and in vivo methods, our past understanding of brainpenetration was based heavily on measuring total brain levels in rodents. As thismethod is easy and simple, large numbers of compounds have been screened in the pastfor high total brain levels. Moreover, total brain levels, expressed as brain/plasma ratio,can be predicted in silico further pushing compounds towards high total brain levels.However, although more and more compounds with high and higher total brain levelshave been generated, there was no corresponding increase in the in vivo efficacy ofthese compounds despite excellent in vitro potency at the target mechanism. Indeed, asboth in vitro potency and total brain levels are driven mainly by lipophilicity [12], manyCNS drug discovery programs have ended up on a �lipid escalator� which, however, ledthem to nowhere [7b] [13].
The failure of the traditional approach has led to the emergence of a new conceptfor examining brain penetration in drug discovery [14 – 18]. This approach better takesinto account the complexity of the brain by considering the brain as having separate PKcompartments, by more clearly differentiating brain distribution in terms of total andunbound drug levels, and by more rigorously discriminating between rate and extent ofbrain penetration. The aim of this review is to describe the new concept and to deriveimplications for CNS drug discovery and development.
CHEMISTRY & BIODIVERSITY – Vol. 6 (2009)2032
Fig. 1. Pharmacokinetic barriers between oral dose and the site of the drug target within the CNS. Thefigure illustrates tissues, processes, and factors controlling the absorption, distribution, metabolism and
elimination of drugs.
2. Barriers and Compartments of the Brain. – 2.1. Barriers within the Brain. TheCNS is separated from the peripheral blood circulation by physiological barriers whichprovide a fully autonomous milieu for the cells within the CNS while maintaining aconstant supply with nutrients and removing waste. As CNS functions fundamentallyrely on a highly regulated flow of ions across and along neurons, the brain ISFenvironment requires a very tight control of its composition. The brain ISF is, therefore,effectively separated from the highly fluctuating fluid compartment of circulating blood[19] [20]. It is the existence of these barriers between the blood and the CNS whichimpede the accessibility to their cerebral targets for many drug molecules circulating inthe blood stream [21].
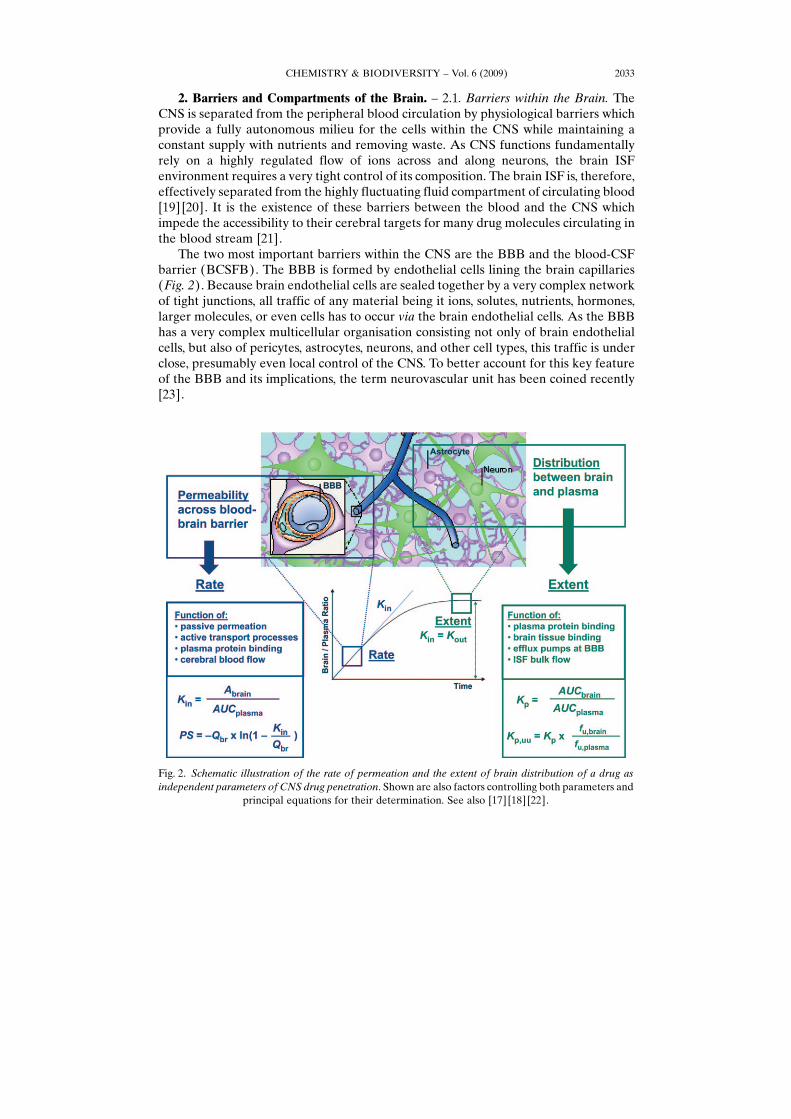
The two most important barriers within the CNS are the BBB and the blood-CSFbarrier (BCSFB). The BBB is formed by endothelial cells lining the brain capillaries(Fig. 2). Because brain endothelial cells are sealed together by a very complex networkof tight junctions, all traffic of any material being it ions, solutes, nutrients, hormones,larger molecules, or even cells has to occur via the brain endothelial cells. As the BBBhas a very complex multicellular organisation consisting not only of brain endothelialcells, but also of pericytes, astrocytes, neurons, and other cell types, this traffic is underclose, presumably even local control of the CNS. To better account for this key featureof the BBB and its implications, the term neurovascular unit has been coined recently[23].
Fig. 2. Schematic illustration of the rate of permeation and the extent of brain distribution of a drug asindependent parameters of CNS drug penetration. Shown are also factors controlling both parameters and
principal equations for their determination. See also [17] [18] [22].
CHEMISTRY & BIODIVERSITY – Vol. 6 (2009) 2033
Besides the BBB, there is another barrier which separates blood from CSF, i.e., theBCSFB. This barrier, which is located at the level of the choroid plexus, differs from theBBB in that its barrier function originates from the tight epithelium lining the ventriclerather than the endothelium as in the cerebral capillaries.
From a PK point of view, the brain vasculature has the following physiologicalparameters: in human, the capillary length is 650 km, the capillary volume is 1 ml, theluminal diameter is 3 mm, the mean distance is 40 mm, and the surface area is ca. 12 m2
approximating 100– 150 cm2/g brain [24]. Cerebral blood flow is ca. 0.5– 2 ml/min/gbrain in rat, resulting in transit time through the brain of only 5 s. The capillary volumeis ca. 11 ml/g brain, which is less than 1‰. In contrast, the fluid compartment of thebrain interstitial fluid amounts to ca. 20% of the brain parenchyma [17]. In the rat, ISFflows with a bulk flow rate of ca. 0.2 ml/min/g towards the CSF. The volume of CSF is ca.160 ml in human and 250 ml in rat, with the rate of CSF secretion being ca. 350 and2.1 ml/min, respectively [25]. The relative surface areas between BBB and BCSFB areestimated to be ca. 5000 :1, and the density of the capillaries within the brainparenchyma is so high (< 8 – 20 mm) that virtually every neuron is supplied by its owncapillary. Therefore, the BBB is generally viewed as having a much greater role than theBCSFB in the delivery of CNS medications to the brain [21] [26]. The impact of theBBB will be predominantly on the rate of CNS penetration, while the extent of brainpenetration into and the distribution of a drug within the brain depends on other factorsas discussed in the following section (Figs. 2 and 3).
2.2. Compartments within the Brain. The parenchyma of the brain has an extremelycomplex morphological structure, which also varies among the different brain regions.
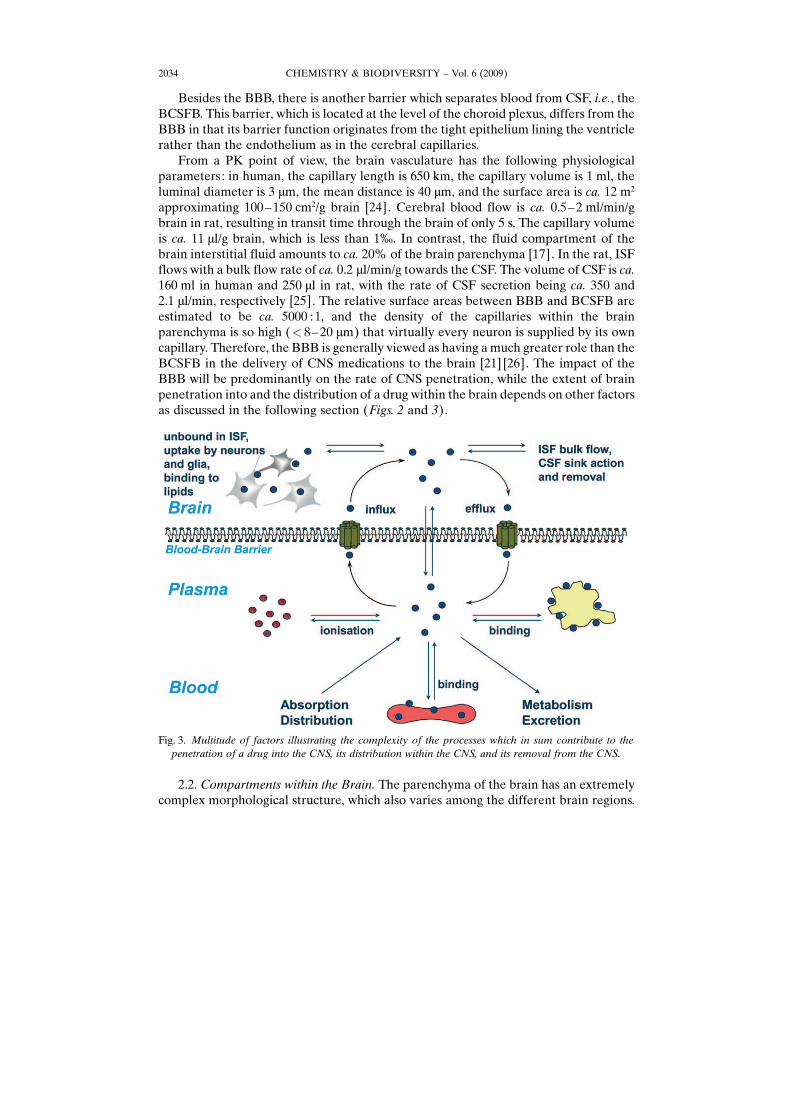
Fig. 3. Multitude of factors illustrating the complexity of the processes which in sum contribute to thepenetration of a drug into the CNS, its distribution within the CNS, and its removal from the CNS.
CHEMISTRY & BIODIVERSITY – Vol. 6 (2009)2034

The conception of brain distribution, however, benefits greatly from even consideringjust a few key PK compartments within the brain (Fig. 4), even though this seemsoverly simplistic from a physiological point of view. Nevertheless, the concept ofseparate but interrelated PK compartments within the brain has helped tremendouslyin rationalizing brain penetration and distribution in relation to drug efficacy, as brieflyillustrated with the example of morphine and its equipotent glucuronidated metabolites(Table 1).
Although morphine-6-O-glucuronide (M6G) has a much lower extent and slowerrate of brain penetration than morphine itself, it shows a similarly high central analgesicefficacy in rat [27] [31]. This is unexplained by the classic concept of CNS penetration,considering both the poor brain/plasma ratio of M6G of 0.069 as opposed to 0.54 formorphine [17], and the much lower rate of BBB permeation, expressed as permeabilitysurface area (PS) product with values for M6G of 0.11 as opposed to 3.5 ml/min/g brainfor morphine [28]. In spite of having similar affinity for the pharmacological target
Fig. 4. Principal pharmacokinetic compartments of the CNS, and the relation between bound andunbound concentrations in the compartments. The dark boxes illustrate parameters which can bemeasured in vitro and in vivo, and their relation to the concentration in these PK compartments. Thethree boxes at the bottom summarize the methods by which the parameters shown can be obtained: 1) invivo determination of the total brain to total plasma ratio Kp, the total amount of drug in brain Atotal,brain ,and total plasma concentrations Ctotal,plasma; 2) and 3) equilibrium dialysis of blood plasma and brainhomogenate giving the fraction unbound in plasma and brain, from which the unbound concentrations in
plasma Cu,plasma and brain Cu,brain from the in vivo study (1) can be derived.
CHEMISTRY & BIODIVERSITY – Vol. 6 (2009) 2035

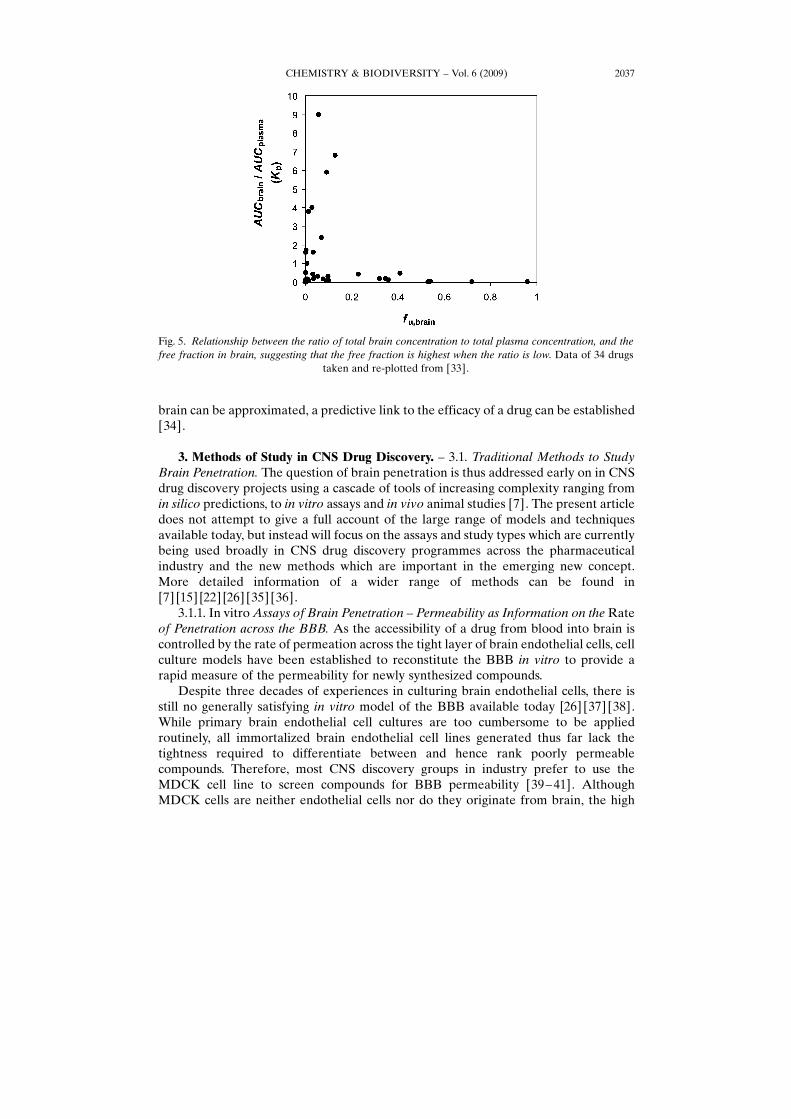
[32], according to the classic concept of brain penetration, M6G should actually showno in vivo efficacy at all. The contradiction can be dissolved, however, by delineatingthe unbound fraction of the drug in brain from total brain levels [27]. As the action ofboth morphine and M6G are driven through binding to m-opioid receptors located onneuronal cell surfaces, it is the free concentration of the drug in the brain ISFcompartment which elicits the drug action rather than the total amount of drug in thebrain. Indeed, although total brain levels of M6G are much lower than those ofmorphine, the exposure at site of the target receptor, i.e., the levels within the ISF, iseven higher for M6G (four-times those of morphine; see Table 1). Hence, the relevanteffect compartment is brain ISF and its drug levels are independent of and not capturedby total brain levels as indeed can be seen for many other CNS drugs as well (Fig. 5).
The delineation of compartments constituting total and free brain concentrations isa key to rationalize the efficacy of any drug binding to extracellular receptors, but isalso applicable to drugs binding to intracellular targets. As shown in Fig. 3, theconcentration in the brain ISF is regulated by at least five independent factors: 1) theplasma exposure which depends on total clearance and volume of distribution, 2)plasma protein binding which determines the unbound fraction of the drug available forbrain penetration, 3) BBB transport rates which determine the transfer of the drugbetween plasma and ISF resulting from passive diffusion, active uptake, or effluxtransport processes, 4) brain cellular vs. brain ISF partitioning and binding to receptors,and 5) elimination from CNS through brain metabolism and/or clearance of the drug bythe CSF.
It is thus obvious that the simple ratio of total brain to total plasma is too crude as tobe able to provide useful information as a single parameter. Indeed, the complexity ofthe processes controlling the drug concentrations in the PK compartments of the brainrequires input of several methods, each providing a defined piece of informationrequired to compile a more differentiated picture of the whereabouts of the drugmolecule within the CNS. Only if the concentrations in the effect compartment of the
CHEMISTRY & BIODIVERSITY – Vol. 6 (2009)2036
Table 1. CNS and Peripheral PK Parameters Describing the Pharmacokinetics of Morphine andMorphine-6-O-Glucuronide in Terms of Rate of Permeation across the BBB, Extent of Brain Penetration,and Distribution within the CNS, in Addition to Some of the Classic PK Parameters. Data compiled from
several sources [17] [27–30].
Morphine Morphine-6-O-glucuronide
PS [ml/min/g brain] 3.5 0.11Kp 0.54 0.07Kp,u 0.65 0.08Kp,uu 0.29 0.29Vu,brain [ml/g brain] 2.1 0.2AUC (ISF) [mm min] 79 336Conc. ratio [ISF]/[ICF] 1:4 125:1AUCplasma [mm min] 252 945VD,plasma [l/kg] 2.2 0.33CLplasma [ml/min/kg] 30 13Fu,plasma 0.83 0.86
brain can be approximated, a predictive link to the efficacy of a drug can be established[34].
3. Methods of Study in CNS Drug Discovery. – 3.1. Traditional Methods to StudyBrain Penetration. The question of brain penetration is thus addressed early on in CNSdrug discovery projects using a cascade of tools of increasing complexity ranging fromin silico predictions, to in vitro assays and in vivo animal studies [7]. The present articledoes not attempt to give a full account of the large range of models and techniquesavailable today, but instead will focus on the assays and study types which are currentlybeing used broadly in CNS drug discovery programmes across the pharmaceuticalindustry and the new methods which are important in the emerging new concept.More detailed information of a wider range of methods can be found in[7] [15] [22] [26] [35] [36].
3.1.1. In vitro Assays of Brain Penetration – Permeability as Information on the Rateof Penetration across the BBB. As the accessibility of a drug from blood into brain iscontrolled by the rate of permeation across the tight layer of brain endothelial cells, cellculture models have been established to reconstitute the BBB in vitro to provide arapid measure of the permeability for newly synthesized compounds.
Despite three decades of experiences in culturing brain endothelial cells, there isstill no generally satisfying in vitro model of the BBB available today [26] [37] [38].While primary brain endothelial cell cultures are too cumbersome to be appliedroutinely, all immortalized brain endothelial cell lines generated thus far lack thetightness required to differentiate between and hence rank poorly permeablecompounds. Therefore, most CNS discovery groups in industry prefer to use theMDCK cell line to screen compounds for BBB permeability [39– 41]. AlthoughMDCK cells are neither endothelial cells nor do they originate from brain, the high
CHEMISTRY & BIODIVERSITY – Vol. 6 (2009) 2037
Fig. 5. Relationship between the ratio of total brain concentration to total plasma concentration, and thefree fraction in brain, suggesting that the free fraction is highest when the ratio is low. Data of 34 drugs
taken and re-plotted from [33].

tightness of the monolayer results in permeability values which correlate well with invivo brain permeation, especially when transfected with the MDR1 efflux pump whichis highly active at the BBB in vivo [41] [42]. In addition to the permeabilitymeasurement, a so-called efflux ratio (ER; ratio of the permeability of both directions)is also determined allowing to identify and reject compounds with strong recognition byMDR1 [43].
Permeability assays using MDCK cells can be automated thus producing perme-ability data in a throughput, speed, and resolution sufficient to guide chemical synthesiscycles in lead optimization. Permeability data are suitable to rank compounds forpermeability and to exclude very poorly permeable compounds from in vivo studies asthey are unlikely to make progress. They also provide first hints on the involvement ofactive transport processes. Permeability data do not, however, provide any informationon the free concentrations to be achieved within the brain, as this is determined by thebinding properties of the compound in brain relative to blood and the magnitude of thecirculating levels in blood. Permeability data serve only one aspect of CNS penetration,i.e., rate, and thus must be supplemented by data containing information on the extentof brain penetration.
3.1.2. In vivo Study of Brain Penetration – Brain/Plasma Ratio as Information on theExtent of Penetration into Whole Brain. The most common method to study brainpenetration in vivo is the determination of the brain/plasma ratio in rodents. Typically,the test compound is dosed intraperitoneally (ip), subcutaneously (sc), or per os (po),and both plasma and brain are sampled at ca. 3 – 5 time points. Alternatively, thecompound is infused intravenously until steady state is assumed, and plasma and brainare sampled at one time point only, thereby reducing animal numbers. In all setups,brain tissue is homogenized and precipitated, and the total brain concentration of thecompound is determined (mostly by LC/MS) and related to its concentration in plasma.
While the measurement of brain concentrations allows to rank compoundsaccording to total brain levels (related to dose) and general CNS penetrability (relatedto plasma), these data do not provide reliable information on the concentration at thetarget site. Since the homogenization of the brain tissue destroys all tissue compart-ments, this method cannot provide information on compound levels in any specificeffect compartment, e.g., brain ISF or ICF. Furthermore, brain/plasma ratios aregenerally invariant to dose and thus cannot be related to dose – response data.
To circumvent this key limitation of the crude measurement of total levels in brain,sampling of CSF [44] [45] and/or brain microdialysis of ISF can be used [46]. However,both methods have their drawbacks, in particular practicability (microdialysis) andreliability (CSF sampling) which weaken their applicability in routine drug discovery[7] [18] [26].
3.2. New in vitro Methods to Complement the Traditional Study Repertory. Althoughin vivo techniques such as CSF sampling and brain microdialysis have been around formany years, it was not until in vitro methods have become available that the freefraction of compound in brain has begun to be studied more routinely in CNS drugdiscovery.
3.2.1. In vitro Binding Studies in Brain Homogenate or Brain Slices – UnboundConcentration in Brain as Surrogate Information on Brain Distribution. Maurer et al.[47] introduced a simple and elegant in vitro method to determine the free fraction in
CHEMISTRY & BIODIVERSITY – Vol. 6 (2009)2038

brain based on the equilibrium dialysis of the compound between buffer and brainhomogenate. The method can be performed in parallel with the estimation of the freefraction in plasma and is able to rapidly produce data on fu,brain and fu,plasma for a largenumber of compounds. These data allow it to assess the distribution behavior ofcompounds within the brain in vivo. As the brain ISF contains only a very low amountof proteins, fu,brain can be used directly to estimate unbound levels of a compound inbrain ISF. Noteworthy, there is a very poor correlation between fu,plasma and fu,brain
(Fig. 6), hence the free fraction in plasma is not a suitable surrogate for unbound brainconcentrations [48], the most likely reason being the very different lipid and protein,composition of plasma and brain, with plasma having twice as much protein, whilebrain has 20-fold more lipids [49].
Becker and Liu [50], and Friden et al. [51] developed an alternative in vitro methodto determine the brain free fraction by using a slice technique which, in contrast to thebrain homogenization method, maintains the cellular structure of the brain tissuethroughout the in vitro distribution study. The advantage of this more elaborate methodis that any differences between ISF and ICF concentrations can be captured in theresulting fu,brain values, while the more simple brain homogenate method is unable todistinguish between ISF and ICF levels. Fortunately, this assumption applies to themajority of cases so that the more cumbersome brain slice technique may be used onlyfor those compounds where transport processes at the level of brain cells move theequilibrium between ISF and ICF markedly away from unity, e.g., by strong activecellular uptake as seen for gabapentin [17] [18]. This kind of information can often bederived from circumstantial evidence residing in normal routine data. Recently, a high-throughput method for rapid screening of in vitro drug – brain homogenate binding hasbeen presented [52].
Fig. 6. Relationship between the free fraction in plasma, fu,plasma, and the free fraction in brain, fu,brain ,illustrating the differences in the extent of binding to plasma and brain tissue. Data of 34 drugs taken and
re-plotted from [33].
CHEMISTRY & BIODIVERSITY – Vol. 6 (2009) 2039
The above methods, which readily provide information on the free fraction of manycompounds in brain tissue in vitro, have filled an important gap in our understanding ofbrain penetration and distribution. They have been the essential missing link which nowallows routine access to the concentrations in a pharmacologically more relevant effectcompartment in the brain. Indeed, they have been the breakthrough needed to pave theway to routinely apply also for the drug discovery of CNS diseases the free drughypothesis which is most widely used to establish quantitative PK/exposure – PD/effectrelationships [53].
4. Integrated Approach to Study CNS Penetration in Drug Discovery. – The wealthof experiences gained especially during the last decade, together with the introductionof higher throughput in vitro equilibrium dialysis methods, has now led to significantadvances in our understanding of CNS penetration. This has culminated in a newconcept for rationalizing brain penetration which may not fall short of triggering a shiftin paradigm for CNS drug discovery.
The central component of the new concept is the clear differentiation between rate(of BBB permeation), extent (of brain penetration), and distribution (within theCNS). These three distinct but interdependent aspects of CNS penetration all have tobe examined and integrated into one coherent concept (Fig. 4 and later Fig. 9). Anumber of excellent articles have recently laid down the fundamental basis for this new,coherent approach to CNS penetration [14 – 18] which is briefly outlined in thefollowing.
It is a big asset of the new paradigm that it can be readily flanged onto currentpractices in drug discovery. Indeed, a number of currently used assays and studies aresimply complemented by some additional methods. The more radical change is the wayof how the data are being looked at, and how decision making is being guided.
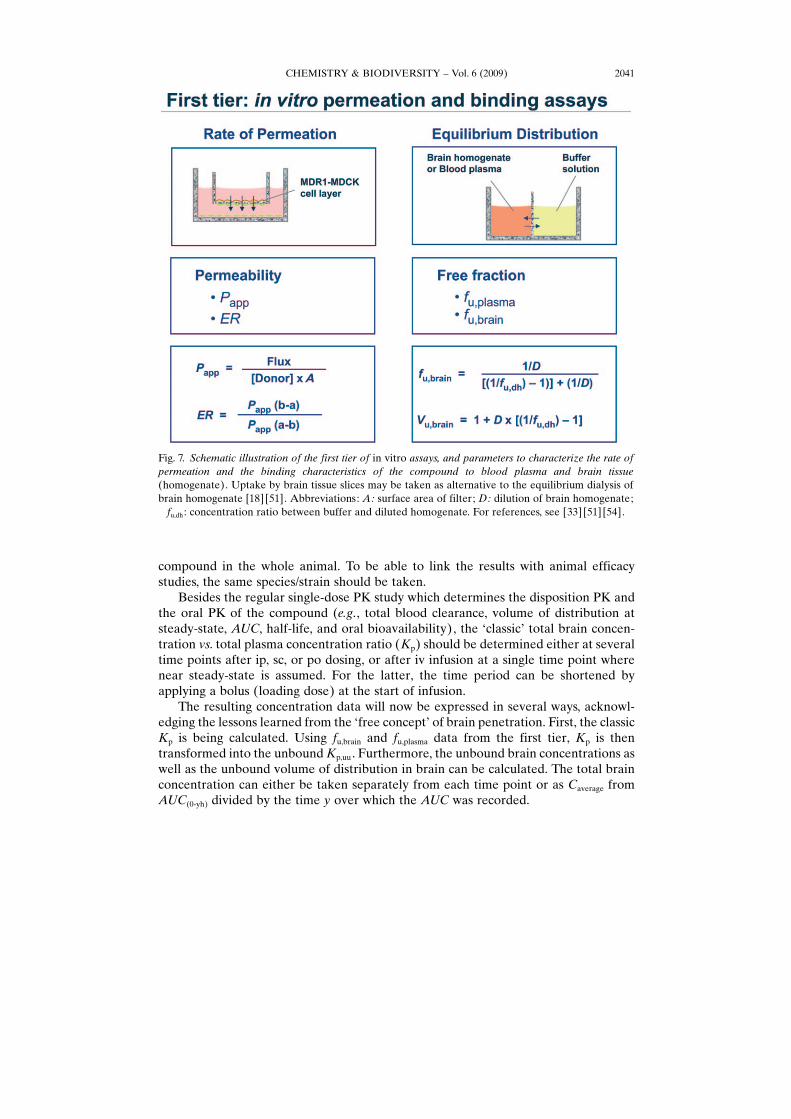
4.1. First Tier: in vitro Assays (Fig. 7). In line with regular procedures at the stage oflead compound characterization and optimization, a panel of in vitro ADME assays isrun, e.g., metabolic stability in liver microsomes, Caco-2 permeability, CYP inter-actions. In relation to CNS penetration, this in vitro panel is supplemented by threeassays: 1) permeability in MDCK-MDR1 cells (bidirectional format), and 2)equilibrium dialysis of blood plasma, and 3) of brain homogenate (from thepharmacological animal species).
The MDR1-MDCK cell data will be used to assess i) the general permeationbehavior of the compound in a cellular setup (Papp value), and ii) its susceptibility todrug efflux by MDR1 (ER). The first read-out can be taken as surrogate for the rate ofpermeation across the BBB and should ideally have a Papp value of >150 nm/s. Thesecond read-out is indicative of potential limitations in the brain penetration by drugefflux at the BBB and should ideally have an ER <3 [15] [39]. However, it needs to bekept in mind that these thresholds are not rigid and may well be modified in a runningproject, as a poor Papp or a high ER value may both be compensated for by otherproperties of the compound as shown below. For practical reasons, information on ERmay be taken alternatively from the bidirectional Caco-2 permeation assay, as in manyinstances this data is being determined on a routine basis in all drug discovery projects.
4.2. Second Tier: in vivo Studies (Fig. 8). Once a compound has demonstratedfavorable in vitro data, in vivo studies will follow to examine the behavior of the
CHEMISTRY & BIODIVERSITY – Vol. 6 (2009)2040
compound in the whole animal. To be able to link the results with animal efficacystudies, the same species/strain should be taken.
Besides the regular single-dose PK study which determines the disposition PK andthe oral PK of the compound (e.g., total blood clearance, volume of distribution atsteady-state, AUC, half-life, and oral bioavailability), the �classic� total brain concen-tration vs. total plasma concentration ratio (Kp) should be determined either at severaltime points after ip, sc, or po dosing, or after iv infusion at a single time point wherenear steady-state is assumed. For the latter, the time period can be shortened byapplying a bolus (loading dose) at the start of infusion.
The resulting concentration data will now be expressed in several ways, acknowl-edging the lessons learned from the �free concept� of brain penetration. First, the classicKp is being calculated. Using fu,brain and fu,plasma data from the first tier, Kp is thentransformed into the unbound Kp,uu . Furthermore, the unbound brain concentrations aswell as the unbound volume of distribution in brain can be calculated. The total brainconcentration can either be taken separately from each time point or as Caverage fromAUC(0-yh) divided by the time y over which the AUC was recorded.
CHEMISTRY & BIODIVERSITY – Vol. 6 (2009) 2041
Fig. 7. Schematic illustration of the first tier of in vitro assays, and parameters to characterize the rate ofpermeation and the binding characteristics of the compound to blood plasma and brain tissue(homogenate). Uptake by brain tissue slices may be taken as alternative to the equilibrium dialysis ofbrain homogenate [18] [51]. Abbreviations: A: surface area of filter; D: dilution of brain homogenate;
fu,dh : concentration ratio between buffer and diluted homogenate. For references, see [33] [51] [54].

4.3. Interpretation, Use, and Implication of Results (Fig. 9). While the classic Kp
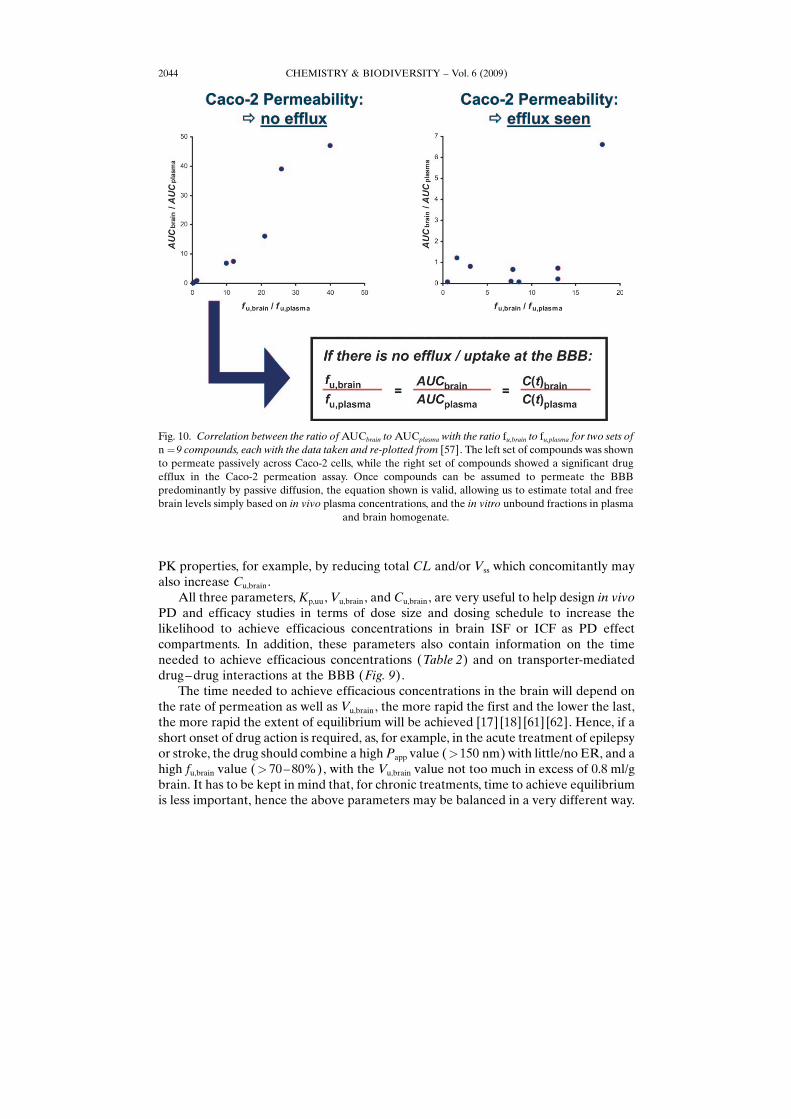
value seems to be driven predominantly by nonspecific binding to brain lipids andhence may just be an in vivo measure of lipophilicity [56], its unbound relative, Kp,uu, ismuch more useful. It is a measure of the extent of the distribution equilibrium of acompound between the unbound fractions in brain and in blood plasma. If the value isclose to unity, passive diffusion across the BBB can be assumed (or any influx beingoffset by efflux). This interpretation may be further supported by the in vitropermeability and efflux ratio data from the MDR1-MCDK or Caco-2 assay if available.In case the distribution between blood and brain is mainly determined by passivediffusion (i.e., Caco-2 ER <2 – 3), brain concentrations may be approximated directlyfrom plasma levels as illustrated in Fig. 10.
The unbound volume of distribution, Vu,brain , is an indicator for the distributionbehavior of a compound within the brain and is irrespective of the extent of equilibriumbetween brain and plasma, i.e., Kp and Kp,uu . Vu,brain is an apparent volume term which iscalculated by dividing the total amount of drug in brain (corrected for the amount in the
CHEMISTRY & BIODIVERSITY – Vol. 6 (2009)2042
Fig. 8. Schematic illustration of the second tier of the in vivo PK and brain exposure studies in rodents todetermine the principal PK parameters of a compound and its exposure in the brain. For calculation ofperipheral PK parameters, see, for example, [55]. Abbreviations: CL: clearance; Vss : volume ofdistribution at steady state; t1/2 : elimination half-life; AUC: area under the plasma concentration time
curve; F%: oral bioavailability.

cerebral vasculature) by the unbound concentration of the drug in brain (Fig. 9).Hence, Vu,brain does not describe a �real� volume and is interpreted in analogy to the�classic� Vss which is calculated from plasma concentration– time profiles obtained afteriv dosing. Vu,brain indicates whether a compound is distributed merely in ISF (e.g., M6Gwhose Vu,brain value corresponds to the volume of the ISF of ca. 0.2 ml/g brain),throughout the brain water space, i.e., into both ISF and ICF (Vu,brain ca. 0.8 ml/g brain),or has a tendency to nonspecifically bind to brain tissue (Vu,brain>0.8 ml/g brain).
As a third result, Cu,brain can be calculated for every time point where brain levelshave been determined by correcting the total concentration in brain with fu,brain [58].Cu,brain is often a measure of the pharmacologically relevant exposure within the brainand hence gives a key piece of information for the PD effect compartment. In contrastto Kp values which are dose-static, Cu,brain values can be used to interpret dose – responseresults from efficacy studies and hence to establish dose/exposure/effect, i.e., PK/PDrelationships [59], as exemplified for opioids including morphine and M6G by Kalvasset al. [34], and Bostrçm et al. [60]. Cu,brain Values not only depend on the free fractionsin brain and plasma but also on the compound�s peripheral PK profile, i.e., plasma AUCand in turn CL, Vss, and F%. Cu,brain can thus also be improved by optimizing these basic
CHEMISTRY & BIODIVERSITY – Vol. 6 (2009) 2043
Fig. 9. Interpretation and use of the brain PK parameters derived from both the first and second tier of invitro assays and in vivo studies. For further information, see also the excellent reviews of Hammarlund-
Udenaes et al. [17] [18].
PK properties, for example, by reducing total CL and/or Vss which concomitantly mayalso increase Cu,brain .
All three parameters, Kp,uu , Vu,brain , and Cu,brain, are very useful to help design in vivoPD and efficacy studies in terms of dose size and dosing schedule to increase thelikelihood to achieve efficacious concentrations in brain ISF or ICF as PD effectcompartments. In addition, these parameters also contain information on the timeneeded to achieve efficacious concentrations (Table 2) and on transporter-mediateddrug – drug interactions at the BBB (Fig. 9).
The time needed to achieve efficacious concentrations in the brain will depend onthe rate of permeation as well as Vu,brain , the more rapid the first and the lower the last,the more rapid the extent of equilibrium will be achieved [17] [18] [61] [62]. Hence, if ashort onset of drug action is required, as, for example, in the acute treatment of epilepsyor stroke, the drug should combine a high Papp value (>150 nm) with little/no ER, and ahigh fu,brain value (> 70 – 80%), with the Vu,brain value not too much in excess of 0.8 ml/gbrain. It has to be kept in mind that, for chronic treatments, time to achieve equilibriumis less important, hence the above parameters may be balanced in a very different way.
CHEMISTRY & BIODIVERSITY – Vol. 6 (2009)2044
Fig. 10. Correlation between the ratio of AUCbrain to AUCplasma with the ratio fu,brain to fu,plasma for two sets ofn ¼9 compounds, each with the data taken and re-plotted from [57]. The left set of compounds was shownto permeate passively across Caco-2 cells, while the right set of compounds showed a significant drugefflux in the Caco-2 permeation assay. Once compounds can be assumed to permeate the BBBpredominantly by passive diffusion, the equation shown is valid, allowing us to estimate total and freebrain levels simply based on in vivo plasma concentrations, and the in vitro unbound fractions in plasma
and brain homogenate.

Because a Kp,uu value <1 hints for active efflux at the BBB, Hammarlund-Udenaeset al. [17] [18] suggest to use this parameter also as indicator for potential transporter-mediated drug – drug interactions and inter-patient variability. For example, the Kp,uu
value of 0.48 of loperamide indicates the potential of a twofold increase in brain ISFafter blockade of efflux at the BBB [17], while total levels in brain may increase evenmore as suggested by the tenfold increase in Kp in P-gp knock-out mice [63]. Thiscontradiction is just an apparent one, because it is exactly this disconnection betweenunbound ISF concentrations and total brain levels which is central to the free conceptof brain penetration. This difference may also be at least part of the reason whyclinically relevant drug – drug interactions with MDR1 at the BBB are seen so sparsely[64] [65].
A very pragmatic but effective approach to elucidate the nature of potential effluxat the BBB has been proposed recently by Kalvass et al. [33], and Jeffrey andSummerfield [13]. The authors used a simple quadrant plot of ER vs. Kp,uu to suggestwhether passive diffusion or active efflux are dominating, and if significant efflux isseen, if P-gp or another efflux pump is likely to be involved in the brain penetration of acompound.
From a CNS project point of view, it is important to find compounds with the rightbalance of physicochemical, pharmacological, pharmacokinetic, and toxicologicalproperties. The presented concept may assist in finding an optimal balance of generalPK and relevant target exposure in relation to target affinity. For medicinal chemists,the working ranges of the CNS PK parameters, and their impact on the brainpenetration and distribution when changing them, are of particular interest during leadoptimization.
Looking at the data available thus far suggests that compounds seem to differ muchmore in terms of rate than in terms of extent of brain penetration. While permeabilityvaries as much as 20,000-fold, Kp and Kp,uu values vary only up to 400-fold and 150-fold,respectively [17]. Vu,brain Data obtained thus far range from near 0.2 (i.e., volume ofbrain ISF) to ca. 375 ml/g brain [17] [18].
Because permeability is a principal prerequisite for CNS penetration and variesmost, it is tempting to optimize compounds for a very high permeability using the rapidin vitro screens as described above. However, a normal-to-good permeability maysuffice well, and chemistry efforts should rather be focused on improving fu,brain , andhence Kp,uu and Cu,brain, as these two parameters have a much greater impact on thedesired pharmacological efficacy, even though the dynamic range of Kp,uu is the smallestof the CNS PK parameters. As stated above, permeability may be of lesser impor-tance during chronic administration schedules, and even poor permeants are ableelicit significant pharmacological effects in human as seen for M6G. Indeed, highspecific binding at the pharmacological target in the CNS and greater free fractions inbrain can counterbalance poor BBB permeation and/or extensive plasma proteinbinding.
As a very general guidance for an optimal PK target profile of CNS drugs, Kp,uu
should be close to 1, Papp >150 nm with little ER, and fu,brain should be such as to allowthe unbound concentrations in vivo to exceed the target affinity as determined in vitro.Kp Values may be recorded but should not be taken for decision making. Total CL andVss should be kept low enough as to provide a high plasma exposure. Note, increasing
CHEMISTRY & BIODIVERSITY – Vol. 6 (2009) 2045

Vss does not necessarily improve brain penetration in terms of levels in the PD effectcompartment.
The in vitro assays in the first tier are both capable and sufficient to guide structuralmodifications, to select compounds for further in vivo studies, and to diagnose in vivoresults. This advantage surely will have a very positive impact on the speed by which thenew concept of brain penetration is leveraged by many CNS drug discovery projects.
5. Summary and Outlook. – The complex structure of the CNS makes brainpenetration a very complex feature which cannot be rationalized on the basis of anysingle parameter. Although total brain concentrations are still the most commonmeasure of CNS exposure, it is now emerging that they are more an indication of highnonspecific binding to brain tissue rather than being pharmacologically relevantconcentrations. Neither total brain levels nor BBB permeability can be taken withoutconsidering the binding capacity of the brain tissue, when a link between exposure andefficacy is needed. The current paradigm of brain penetration is, therefore, changingtowards a more compartmentalized view which allows a better rationalization of thedistribution of compounds within the brain and makes use of brain compartmentswhich are more relevant pharmacological effects.
Central to the emerging new paradigm is a clear differentiation between rate andextent of brain penetration, and between total and unbound drug levels as parametersfor drug distribution within the brain. In attempting of a more holistic view, the conceptis able to resolve a number of apparently contradicting observations, e.g., why CNSeffects can be seen in the clinic, even though a CNS drug poorly permeates the BBB, issubstrate of efflux pumps, has low total brain levels, is poorly bound to brain tissue, orhas a very high plasma protein binding.
The new paradigm does not require to abandon traditional assays, but supplementsthem and views results in a more integrated fashion. The proposed methods andcombined interpretation of parameters is very much in analogy to conventional PK(Table 2) which will make it easy for the new paradigm to be accepted in running CNSdrug discovery programmes. However, it does ban the isolated, sole use of the popularbut misleading total brain-to-total plasma ratio from decision making. This is also animportant change which may make obsolete many in silico models, which predict thisparameter (often expressed as LogBB), and may ultimately shift computationchemistry efforts towards more structure-based modifications, which attempt toimprove those particular properties of a compound which show a clear link to thedesired effects [66].
The holistic concept of CNS penetration considers rate of permeation across theBBB, extent of brain penetration, and the intra-brain distribution of a CNS drug asdistinct but interrelated properties of a CNS drug, which have to be determined bydifferent in vitro and in vivo methods. Therefore, the integration of data from variousassays and studies is becoming a central part of the evolving paradigm in order todevelop quantitative relationships between dose, exposure, and efficacy.
The inclusion of data on receptor occupancy and biomarkers will enable betterstudy design and dose predictions, ultimately mitigating the risks associated with poorclinical efficacy and drug safety which are currently the main reasons why new drugcandidates fail in clinical trials [67]. Currently, there are also attempts to merge the
CHEMISTRY & BIODIVERSITY – Vol. 6 (2009)2046

presented concept of CNS penetration with the field of preclinical drug developmentand clinical PET [68 – 70] to make extrapolations from animal to human more realistic[71].
By integrating these data and technologies into PK/PD modeling and simulations, itwill be possible to generate a working understanding of the PK and PD of potentialdrug candidates in the human CNS [72]. Such an understanding will be paramount todefine PK parameters which are favorable for the desired indication, to guide thepreclinical development of the compound (e.g., dose selection for toxicity testing inhigher species, as well as first-in-man and therapeutic doses) and ultimately to increasethe chances for a successful phase-II study in human patients.
The growing emphasis on translational medicine to bridge the gap between CNSresearch and drug development, and the concerted application of new technologies, inparticular brain imaging, may not only accelerate the discovery and improve the successrate of new CNS drugs, but may also give a fresh boost to the motivation for CNS drugdevelopment which is still hampered by too many uncertainties.
REFERENCES
[1] M. N. Pangalos, L. E. Schechter, O. Hurko, Nat. Rev. Drug Discovery 2007, 6, 521.[2] E. F. Schmid, D. A. Smith, Drug Discovery Today 2007, 12, 998.[3] D. A. Dawson, G. Wadsworth, A. M. Palmer, Brain Res. 2001, 892, 344.[4] O. Hurko, J. L. Ryan, NeuroRx 2005, 2, 671.[5] I. Kola, Clin. Pharmacol. Ther. 2008, 83, 227.[6] W. M. Pardridge, NeuroRx 2005, 2, 3.[7] a) A. Reichel, Curr. Drug Metab. 2006, 7, 183; b) S. G. Summerfield, P. Jeffrey, Expert Opin. Drug
Discovery 2009, 4, 207.[8] R. Cecchelli, V. Berezowski, S. Lundquist, M. Culot, M. Renftel, M. P. Dehouck, L. Fenart, Nat. Rev.
Drug Discovery 2007, 6, 650.
CHEMISTRY & BIODIVERSITY – Vol. 6 (2009) 2047
Table 2. Conceptual Analogy of �Classic� PK and CNS PK of the New Concept of CNS Penetration andDistribution. The analogy relates to the principal considerations of rate, extent, and distribution, and isbased on the concept of unbound concentrations as being the driver for pharmacological drug actions.
�Classic� PK CNS PK
1) Rate �Elimination� clearance �Uptake� clearance
CL ¼ DoseAUCplasma
Kin ¼Abrain
AUCplasma
2) Extent Extent of oral bioavailability Extent of brain uptake
F ¼AUCpo
AUCivKp ¼
AUCbrain
AUCplasma
3) Distribution Concept of total vs. unbound concentrations
Vss, fu,plasma, cu,plasma Vu,brain, fu,brain, cu,brain
4) Half-life Half-life of elimination Half-life to equilibrium
T1=2;el ¼ln 2� Vss
CLT1=2;equ ¼
ln 2� Vu;brain
PS� fu;brain

[9] H. van De Waterbeemd, D. A. Smith, K. Beaumont, D. K. Walker, J. Med. Chem. 2001, 44, 1313.[10] S. A. Roberts, Curr. Opin. Drug Discovery Dev. 2003, 6, 66.[11] H. van de Waterbeemd, B. Testa, �Drug Bioavailability: Estimation of Solubility, Permeability,
Absorption and Bioavailability�, Wiley-VCH, Weinheim, 2008.[12] I. Martin, Drug Discovery Today 2004, 9, 161.[13] P. Jeffrey, S. G. Summerfield, Xenobiotica 2007, 37, 1135.[14] S. G. Summerfield, P. Jeffrey, Expert Opin. Drug Discovery 2006, 1, 595.[15] L. Di, E. H. Kerns, G. T. Carter, Expert Opin. Drug Discovery 2008, 3, 677.[16] X. Liu, C. Chen, B. J. Smith, J. Pharmacol. Exp. Ther. 2008, 325, 349.[17] M. Hammarlund-Udenaes, M. Friden, S. Syv�nen, A. Gupta, Pharm. Res. 2008, 25, 1737.[18] M. Hammarlund-Udenaes, U. Bredberg, M. Friden, Curr. Top. Med. Chem. 2009, 9, 148.[19] D. J. Begley, M. W. Brightman, Prog. Drug Res. 2003, 61, 39.[20] B. Zlokovic, Neuron 2008, 57, 178.[21] D. J. Begley, Acta Paediatr. Suppl. 2003, 92, 83.[22] U. Bickel, NeuroRx 2005, 2, 15.[23] E. Neuwelt, N. J. Abbott, L. Abrey, W. A. Banks, B. Blakley, T. Davis, B. Engelhardt, P. Grammas,
M. Nedergaard, J. Nutt, W. M. Pardridge, G. A. Rosenberg, Q. Smith, L. R. Drewes, Lancet Neurol.2008, 7, 84.
[24] N. J. Abbott, L. Rçnnb�ck, E. Hansson, Nat. Rev. Neurosci. 2006, 7, 41.[25] N. J. Abbott, Neurochem. Int. 2004, 45, 545.[26] N. J. Abbott, D. E. Dolman, A. K. Patabendige, Curr. Drug Metab. 2008, 9, 901.[27] F. Stain-Texier, G. Boschi, P. Sandouk, J. M. Scherrmann, Br. J. Pharmacol. 1999, 128, 917.[28] U. Bickel, O. P. Schumacher, Y.-S. Kang, K. Voigt, J. Pharmacol. Exp. Ther. 1996, 278, 107.[29] M. R. Bouw, R. Xie, K. Tunblad, M. Hammarlund-Udenaes, Br. J. Pharmacol. 2001, 134, 1796.[30] K. Tunblad, M. Hammarlund-Udenaes, E. N. Jonsson, Eur. J. Pharm. Sci. 2005, 24, 49.[31] D. Wu, Y.-S. Kang, U. Bickel, W. M. Pardridge, Drug Metab. Dispos. 1997, 26, 768.[32] G. W. Pasternak, R. J. Bodnar, J. A. Clark, C. E. Inturrisi, Life Sci. 1987, 41, 2845.[33] J. C. Kalvass, T. S. Maurer, G. M. Pollack, Drug Metab. Dispos. 2007, 35, 660.[34] J. C. Kalvass, E. R. Olson, M. P. Cassidy, D. E. Selley, G. M. Pollack, J. Pharmacol. Exp. Ther. 2007,
323, 346.[35] S. Nag, �Blood-brain Barrier: Biology and Research Protocols; Methods in Molecular Medicine�,
Humana Press, New York, 2003.[36] Q. R. Smith, Methods Mol. Med. 2003, 89, 193.[37] A. Reichel, D. J. Begley, N. J. Abbott, Methods Mol. Med. 2003, 89, 307.[38] P. Garberg, M. Ball, N. Borg, R. Cecchelli, L. Fenart, R. D. Hurst, T. Lindmark, A. Mabondzo, J. E.
Nilsson, T. J. Raub, D. Stanimirovic, T. Terasaki, J. O. Oberg, T. Osterberg, Toxicol. in Vitro 2005, 19,299.
[39] K. M. Mahar Doan, J. E. Humphreys, L. O. Webster, S. A. Wring, L. J. Shampine, C. J. Serabjit-Singh, K. K. Adkison, J. W. Polli, J. Pharmacol. Exp. Ther. 2002, 303, 1029.
[40] Q. Wang, J. D. Rager, K. Weinstein, P. S. Kardos, G. L. Dobson, J. Li, I. J. Hidalgo, Int. J. Pharm.2005, 288, 349.
[41] S. G. Summerfield, K. Read, D. J. Begley, T. Obradovic, I. J. Hidalgo, S. Coggon, A. V. Lewis, R. A.Porter, P. Jeffrey, J. Pharmacol. Exp. Ther. 2007, 322, 205.
[42] J. W. Polli, J. E. Humphreys, S. A. Wring, T. C. Burnette, K. D. Read, A. Hersey, D. Butina, L.Bertolotti, F. Pugnaghi, C. S. Serabjit-Singh, in �Progress in the Reduction, Refinement andReplacement of Animal Experimentation�, Ed. M. Balls, A. M. van Zeller, E. M. Halder, Elsevier,New York, 2000, p. 271.
[43] B. Feng, J. B. Mills, R. E. Davidson, R. J. Mireles, J. S. Janiszewski, M. D. Troutman, de S. M. Morais,Drug Metab. Dispos. 2008, 36, 268.
[44] D. D. Shen, A. A. Artru, K. K. Adkison, Adv. Drug Delivery Rev. 2004, 56, 1825.[45] J. L. Lin, Curr. Drug Metab. 2008, 9, 46.[46] M. Hammarlund-Udenaes, Adv. Drug Delivery Rev. 2000, 45, 283.[47] T. S. Maurer, D. B. DeBartolo, D. A. Tess, D. O. Scott, Drug Metab. Dispos. 2005, 33, 175.
CHEMISTRY & BIODIVERSITY – Vol. 6 (2009)2048
[48] X. Liu, K. van Natta, H. Yeo, O. Vilenski, P. Weller, P. Worboys, M. Monshouwer, Drug Metab.Dispos. 2009, 37, 787.
[49] W. S. Snyder, M. J. Cook, E. S. Nasser, L. R. Karhausen, G. P. Howells, I. H. Tipton, �Report of theTask Force on Reference Man�, Pergamon Press, Oxford, 1975.
[50] S. Becker, X. Liu, Drug Metab. Dispos. 2006, 34, 855.[51] M. Friden, A. Gupta, M. Antonsson, U. Bredberg, M. Hammarlund-Udenaes, Drug Metab. Dispos.
2007, 35, 1711; M. Friden, F. Ducrozet, B. Middleton, M. Antonsson, U. Bredberg, M. Hammarlund-Udenaes, Drug Metab. Dispos. 2009 (epub).
[52] H. Wan, M. Rehngren, F. Giordanetto, F. Bergstrçm, A. Tunek, J. Med. Chem. 2007, 50, 4606.[53] T. N. Tozer, M. Rowland, �Introduction to Pharmacokinetics and Pharmacodynamics: The
Quantitative Basis of Drug Therapy�, Lippincott Williams & Wilkins, Philadelphia, 2006.[54] S. G. Summerfield, A. J. Stevens, L. Cutler, M. del Carmen Osuna, B. Hammond, S. P. Tang, A.
Hersey, D. J. Spalding, P. Jeffrey, J. Pharmacol. Exp. Ther. 2006, 316, 1282.[55] M. Rowland, T. N. Tozer, �Clinical Pharmacokinetics: Concepts and Applications�, Lippincott
Williams & Wilkins, Philadelphia, 1995.[56] H. van de Waterbeemd, D. A. Smith, B. C. Jones, J. Comput.-Aided Mol. Des. 2001, 15, 273.[57] J. C. Kalvass, T. S. Maurer, Biopharm Drug Dispos. 2002, 23, 327.[58] J. M. Watson, S. Wright, A. J. Lucas, K. L. Clarke, J. Viggers, S. Cheetham, P. Jeffrey, R. A. Porter,
K. D. Read, Drug Metab. Dispos. 2009, 37, 753.[59] E. C. M. de Lange, P. G. M. Ravenstijn, D. Groenendaal, T. J. van Steeg, AAPS J. 2005, 7, E532.[60] E. Bostrçm, M. Hammarlund-Udenaes, U. S. Simonsson, Anesthesiology 2008, 108, 495.[61] X. Liu, B. J. Smith, C. Chen, E. Callegari, S. L. Becker, X. Chen, J. Cianfrogna, A. C. Doran, S. D.
Doran, J. P. Gibbs, N. Hosea, J. Liu, F. R. Nelson, M. A. Szewc, J. van Deusen, J. Pharmacol. Exp.Ther. 2005, 313, 1254.
[62] X. Liu, C. Chen, Curr. Opin. Drug Discovery Dev. 2005, 8, 505.[63] A. Doran, R. S. Obach, B. J. Smith, N. A. Hosea, S. Becker, E. Callegari, C. Chen, X. Chen, E. Choo,
J. Cianfrogna, L. M. Cox, J. P. Gibbs, M. A. Gibbs, H. Hatch, C. E. Hop, I. N. Kasman, J. Laperle, J.Liu, X. Liu, M. Logman, D. Maclin, F. M. Nedza, F. Nelson, E. Olson, S. Rahematpura, D. Raunig, S.Rogers, K. Schmidt, D. K. Spracklin, M. Szewc, M. Troutman, E. Tseng, M. Tu, J. W. van Deusen, K.Venkatakrishnan, G. Walens, E. Q. Wang, D. Wong, A. S. Yasgar, C. Zhang, Drug Metab. Dispos.2005, 33, 165.
[64] K. Linnet, T. B. Ejsing, Eur. Neuropsychopharmacol. 2008, 18, 157.[65] K. S. Fenner, M. D. Troutman, S. Kempshall, J. A. Cook, J. A. Ware, D. A. Smith, C. A. Lee, Clin.
Pharmacol. Ther. 2009, 85, 173.[66] S. A. Hitchcock, L. D. Pennington, J. Med. Chem. 2006, 49, 7559.[67] R. Frank, R. Hargreaves, Nat. Rev. Drug Discovery 2003, 2, 566.[68] S. G. Summerfield, A. J. Lucas, R. A. Porter, P. Jeffrey, R. N. Gunn, K. R. Read, A. J. Stevens, A. C.
Metcalf, M. C. Osuna, P. J. Kilford, J. Passchier, A. D. Ruffo, Xenobiotica 2008, 38, 1518.[69] S. Syv�nen, G. Blomquist, L. Appel, M. Hammarlund-Udenaes, B. Langstrçm, M. Bergstrçm, Eur. J.
Clin. Pharmacol. 2006, 62, 839.[70] S. Syv�nen, O. Lindhe, M. Palner, B. R. Kornum, O. Rahman, B. Langstrom, G. M. Knudsen, M.
Hammarlund-Udenaes, Drug Metab. Dispos. 2009, 37, 635.[71] R. J. Hargreaves, Clin. Pharmacol. Ther. 2008, 83, 349.[72] R. N. Upton, Clin. Exp. Pharmacol. Physiol. 2007, 34, 695.
Received January 21, 2009
CHEMISTRY & BIODIVERSITY – Vol. 6 (2009) 2049