Revenues to Governments from the Canadian Mineral · PDF file · 2012-02-10The...
22
1 ENTRANS Policy Research Group Revenues to Governments from the Canadian Mineral Sector 2002-2010 Prepared for the Mining Association of Canada by ENTRANS Policy Research Group Inc. July 4, 2011
Transcript of Revenues to Governments from the Canadian Mineral · PDF file · 2012-02-10The...
1
ENTRANS Policy Research Group
Revenues to Governments from the Canadian Mineral Sector
2002-2010
Prepared for the Mining Association of Canada by
ENTRANS Policy Research Group Inc.
July 4, 2011
2
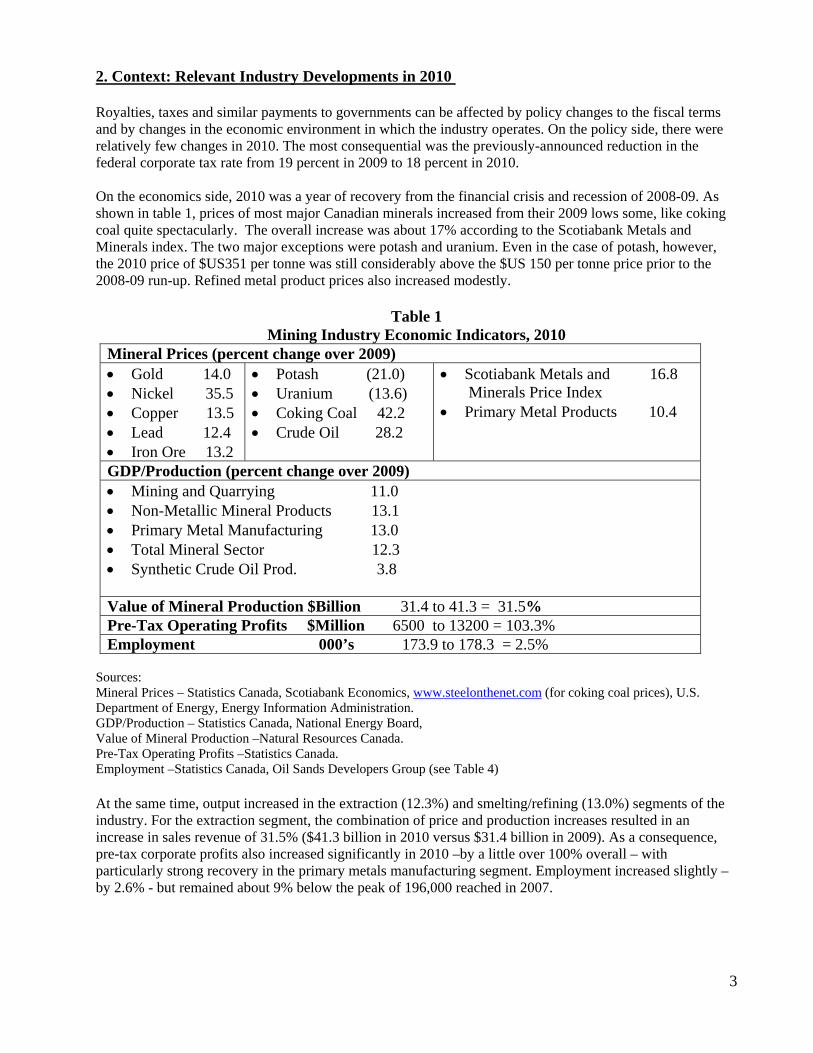
1. Introduction This report has been prepared by ENTRANS Policy Research Group for the Mining Association of Canada. The purpose is to quantify the revenues to federal and provincial governments from the Canadian mineral sector over the period 2002 to 2010. It is an update to earlier ENTRANS studies1. The information is derived from a variety of sources including Statistics Canada, the budget papers or public accounts of provincial governments, corporate financial statements and direct contacts with officials from provincial governments and industry associations. The report provides data on royalty and mining taxes paid to provincial governments by virtue of their ownership of the resources as well as on corporate income taxes paid by mineral sector companies to both the federal and provincial governments. It also includes an estimate of the personal income taxes paid by employees of mineral sector companies on their employment earnings. The definition of mineral sector used in this report covers both the extraction of minerals and their primary processing (e.g. smelting and refining). This definition reflects both the general reliance of domestic smelting and refining on the output of extraction activity and the fact that many of the companies involved in mining are integrated with both extraction and processing operations. In North American Industrial Classification System (NAICS) terms, the data presented in this report cover industry 212 (mining other than oil and gas), industry 327 (non-metallic mineral manufacturing) and industry 331 (primary metal manufacturing). This definition is referred to, somewhat inelegantly, as the mineral sector other than oil sands mining2. Oil sands mining is not, unfortunately, a separate NAICS industry. Rather, it is usually subsumed, for statistical purposes, under oil and natural gas extraction (industry 211). We have used a variety of sources – the surveys of members conducted by the Oil Sands Developers Group (OSDG) and the financial reports of companies involved in oil sands mining – to develop estimates of revenues to governments from the mineral sector including oil sands mining. It should be stressed, however, that the royalty and tax estimates for oil sands mining, although carefully constructed, are less solid than their counterparts from the other mineral industries. The revenues examined in this report are in the nature of direct royalty and tax payments by mining companies and their employees. The report does not include corporate income tax payments made by companies in industries that either supply services to the mining industry or are dependent upon the minerals sector for material inputs. Similarly, it does not include the personal income taxes paid by employees of such companies. Taxes levied by municipalities, such as property taxes, are also not included, although the reason here is more a practical one of data availability. Following a brief context-setting overview of industry developments in 2010, the report discusses the results in each of the following sections: • Royalties, Mining Taxes and Similar Payments to Governments • Corporate Income Taxes Paid to Governments • Personal Income Taxes Paid by Mineral Sector Employees • Summary of Revenues to Governments 1Mining Association of Canada, Revenues to Governments from the Canadian Mining Industry, March 2007; Revenues to Government from the Canadian Mining Industry: 2002-2006, May, 2008, Revenues to Government from the Canadian Mineral Sector: 2002-2008, June, 2009 and Revenues to Government from the Canadian Mineral Sector: 2002-2009, June 2010. All reports were prepared by ENTRANS Policy Research Group and are available through the Mining Association of Canada (see www.mining.ca ). 2 See Annex A for a description of the NAICS -defined industrial composition of the mineral sector. Although it extends beyond the mineral processing, the Fabricated Metal Products Manufacturing Industry (NAICS 332) can, for some purposes be combined with the mineral sector. Annex B provides the relevant revenues to governments estimates for this industry.
3
2. Context: Relevant Industry Developments in 2010 Royalties, taxes and similar payments to governments can be affected by policy changes to the fiscal terms and by changes in the economic environment in which the industry operates. On the policy side, there were relatively few changes in 2010. The most consequential was the previously-announced reduction in the federal corporate tax rate from 19 percent in 2009 to 18 percent in 2010. On the economics side, 2010 was a year of recovery from the financial crisis and recession of 2008-09. As shown in table 1, prices of most major Canadian minerals increased from their 2009 lows some, like coking coal quite spectacularly. The overall increase was about 17% according to the Scotiabank Metals and Minerals index. The two major exceptions were potash and uranium. Even in the case of potash, however, the 2010 price of $US351 per tonne was still considerably above the $US 150 per tonne price prior to the 2008-09 run-up. Refined metal product prices also increased modestly.
Table 1 Mining Industry Economic Indicators, 2010
Mineral Prices (percent change over 2009) • Gold 14.0 • Nickel 35.5 • Copper 13.5 • Lead 12.4 • Iron Ore 13.2
• Potash (21.0) • Uranium (13.6) • Coking Coal 42.2 • Crude Oil 28.2
• Scotiabank Metals and 16.8 Minerals Price Index
• Primary Metal Products 10.4
GDP/Production (percent change over 2009) • Mining and Quarrying 11.0 • Non-Metallic Mineral Products 13.1 • Primary Metal Manufacturing 13.0 • Total Mineral Sector 12.3 • Synthetic Crude Oil Prod. 3.8 Value of Mineral Production $Billion 31.4 to 41.3 = 31.5% Pre-Tax Operating Profits $Million 6500 to 13200 = 103.3% Employment 000’s 173.9 to 178.3 = 2.5%
Sources: Mineral Prices – Statistics Canada, Scotiabank Economics, www.steelonthenet.com (for coking coal prices), U.S. Department of Energy, Energy Information Administration. GDP/Production – Statistics Canada, National Energy Board, Value of Mineral Production –Natural Resources Canada. Pre-Tax Operating Profits –Statistics Canada. Employment –Statistics Canada, Oil Sands Developers Group (see Table 4)
At the same time, output increased in the extraction (12.3%) and smelting/refining (13.0%) segments of the industry. For the extraction segment, the combination of price and production increases resulted in an increase in sales revenue of 31.5% ($41.3 billion in 2010 versus $31.4 billion in 2009). As a consequence, pre-tax corporate profits also increased significantly in 2010 –by a little over 100% overall – with particularly strong recovery in the primary metals manufacturing segment. Employment increased slightly – by 2.6% - but remained about 9% below the peak of 196,000 reached in 2007.

4
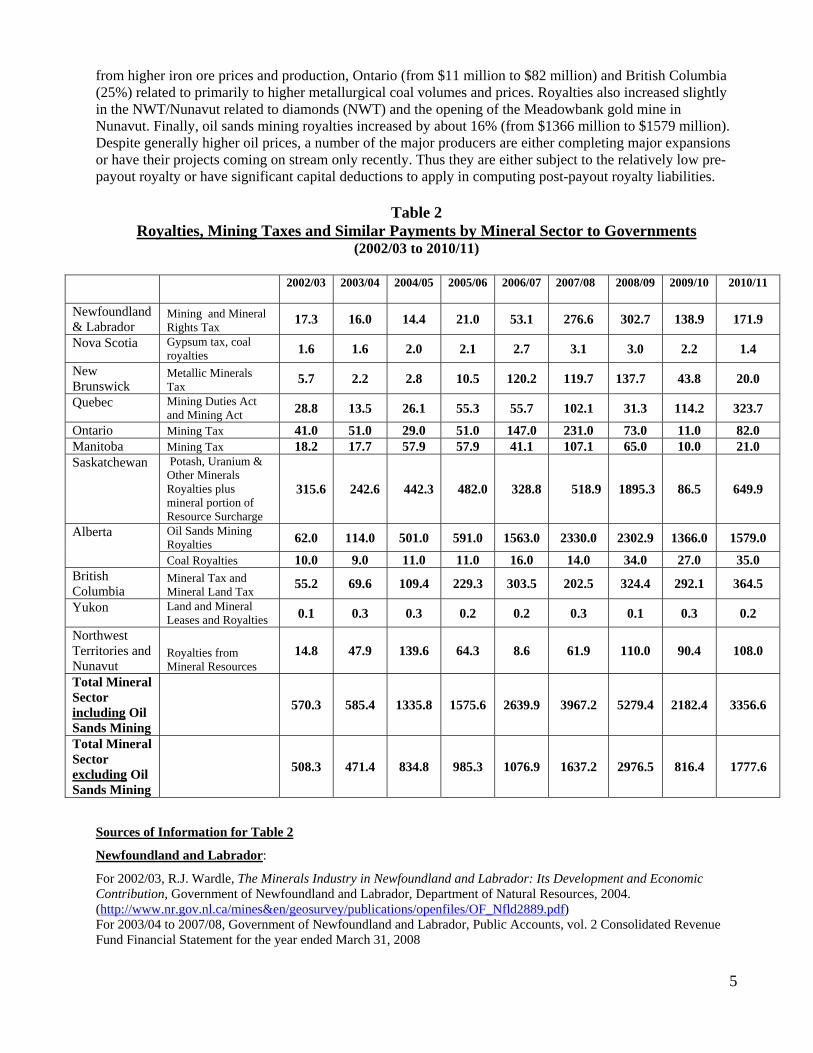
3. Royalties and Similar Payments to Governments Canadian mineral producers pay royalties, mining taxes or other similar charges to provincial governments in the latter’s capacity as owners of the mineral resource. Table 2 below provides, for each province and territory, data on royalties and similar payments to governments from mineral activities for the fiscal years 2002/03 to 2010/11. The information available covers all mining activity in Canada including metallic minerals, non-metallic minerals (e.g. potash, gypsum), sand and aggregates and crude oil from oil sands mining operations. As noted earlier, the data reflect, as far as possible, payments made to governments in their role as resource owner. In almost all circumstances, royalty and mining tax regimes allow for the recovery of many costs incurred. Excluded from the revenues are payments such as licensing fees, lease acquisition and retention charges, rentals etc. Although provinces typically show such payments as revenue, they are made in return for a service for which the province must assign resources. Because of the way information is reported, however, it is sometimes not possible to separate the revenues from fees from those from royalties/mining taxes. Over the period to from 2002 to 2008, royalty/mining tax payments grew from about $500 million in 2002/03 to $3.0 billion in 2008/09 for the mineral sector excluding oil sands mining. Including oil sands mining, the growth is even larger, from $600 million to $5.7 billion. This growth reflected a combination of higher commodity prices, higher effective royalty rates and, for some minerals, significant increases in production. Two jurisdictions –Alberta and Saskatchewan – were responsible for about three quarters of the increase. The 2009/10 figures show a major reversal of the trends and reflect the international recession in the latter part of 2008 and 2009 and the steep declines in most mineral prices. In 2009/10, overall royalty and mining tax payments to governments plummeted by over $3.5 billion or 61% compared to 2008/09. All jurisdictions except Quebec recorded reductions in royalties/mining tax receipts. Several of the reductions –for Newfoundland and Labrador, New Brunswick, Ontario and Manitoba – were extremely steep. Alberta and Saskatchewan experienced reductions which were both large in relative terms and significant contributors to the total result. For Alberta, oil sands mining royalties fell by almost $1.1 billion largely as a result of the drop in oil prices in early 2009 and higher capital and operating costs – the province’s profit sensitive royalty regime allows for the deduction of such expenses. For Saskatchewan, the steep decline in resource revenues was due to the collapse in both potash prices and volumes, exacerbated by a refund to producers of advanced royalty payments based on anticipated higher prices3 Royalty and mining tax revenues returned to more normal levels in 2010/11 - $3.4 billion overall and $1.8 billion excluding oil sands mining. The latter reflects a doubling of royalty revenue over 2009/10. About half the increase over 2009/10 is from Saskatchewan. Despite somewhat lower potash and uranium prices in 2010, potash volumes have increased to more normal levels. In addition, the 2009/10 revenues reflect the refund of royalties to the potash producers noted above. Royalty/mining tax revenues were, however, up in other major mineral producing provinces –Newfoundland and Labrador (24%) on the strength of higher iron ore prices and of nickel prices and volumes from the Voisey’s Bay operation, Quebec (184%) apparently
3Producers remit royalties to the Government of Saskatchewan on a quarterly basis. The payments are for expected sales over the upcoming quarter based on the producers’ expectations of prices, volumes and costs. Based on these expectations, the Government of Saskatchewan, in it’s 2009/10 Budget, estimated potash royalty receipts at $1927 million. In early 2009, however, both potash prices and sales volumes crashed with the result that potash revenues fell almost 60 percent. This, in combination with the resumption of same major capital projects later in the year resulted in a very large repayment of potash royalties. The 2009/10 number in Table 1 reflects a $204 million net repayment. The figure in the table is positive only because royalties from uranium and the revenues from the resource surcharge are slightly larger than the potash royalty repayment�.
5
from higher iron ore prices and production, Ontario (from $11 million to $82 million) and British Columbia (25%) related to primarily to higher metallurgical coal volumes and prices. Royalties also increased slightly in the NWT/Nunavut related to diamonds (NWT) and the opening of the Meadowbank gold mine in Nunavut. Finally, oil sands mining royalties increased by about 16% (from $1366 million to $1579 million). Despite generally higher oil prices, a number of the major producers are either completing major expansions or have their projects coming on stream only recently. Thus they are either subject to the relatively low pre-payout royalty or have significant capital deductions to apply in computing post-payout royalty liabilities.
Table 2
Royalties, Mining Taxes and Similar Payments by Mineral Sector to Governments (2002/03 to 2010/11)
2002/03 2003/04 2004/05 2005/06 2006/07 2007/08 2008/09
2009/10
2010/11
Newfoundland & Labrador
Mining and Mineral Rights Tax 17.3 16.0 14.4 21.0 53.1 276.6 302.7 138.9 171.9
Nova Scotia Gypsum tax, coal royalties 1.6 1.6 2.0 2.1 2.7 3.1 3.0 2.2 1.4
New Brunswick
Metallic Minerals Tax 5.7 2.2 2.8 10.5 120.2 119.7 137.7 43.8 20.0
Quebec Mining Duties Act and Mining Act 28.8 13.5 26.1 55.3 55.7 102.1 31.3 114.2 323.7
Ontario Mining Tax 41.0 51.0 29.0 51.0 147.0 231.0 73.0 11.0 82.0 Manitoba Mining Tax 18.2 17.7 57.9 57.9 41.1 107.1 65.0 10.0 21.0 Saskatchewan Potash, Uranium &
Other Minerals Royalties plus mineral portion of Resource Surcharge
315.6 242.6 442.3 482.0 328.8 518.9 1895.3 86.5 649.9
Alberta Oil Sands Mining Royalties 62.0 114.0 501.0 591.0 1563.0 2330.0 2302.9 1366.0 1579.0
Coal Royalties 10.0 9.0 11.0 11.0 16.0 14.0 34.0 27.0 35.0 British Columbia
Mineral Tax and Mineral Land Tax 55.2 69.6 109.4 229.3 303.5 202.5 324.4 292.1 364.5
Yukon Land and Mineral Leases and Royalties 0.1 0.3 0.3 0.2 0.2 0.3 0.1 0.3 0.2
Northwest Territories and Nunavut
Royalties from Mineral Resources
14.8 47.9 139.6 64.3 8.6 61.9 110.0 90.4 108.0
Total Mineral Sector including Oil Sands Mining
570.3 585.4 1335.8 1575.6 2639.9 3967.2 5279.4 2182.4 3356.6
Total Mineral Sector excluding Oil Sands Mining
508.3 471.4 834.8 985.3 1076.9 1637.2 2976.5 816.4 1777.6
Sources of Information for Table 2
Newfoundland and Labrador:
For 2002/03, R.J. Wardle, The Minerals Industry in Newfoundland and Labrador: Its Development and Economic Contribution, Government of Newfoundland and Labrador, Department of Natural Resources, 2004. (http://www.nr.gov.nl.ca/mines&en/geosurvey/publications/openfiles/OF_Nfld2889.pdf) For 2003/04 to 2007/08, Government of Newfoundland and Labrador, Public Accounts, vol. 2 Consolidated Revenue Fund Financial Statement for the year ended March 31, 2008

6
(http://www.fin.gov.nl.ca/ComptrollerGeneral/pubaccounts/2008/VolumeII-2007-08.pdf ). For 2008/09, 2009/10, and 2010/11 estimates are from Government of Newfoundland and Labrador, Budget, Estimates, Consolidated Revenue Fund, Statement II. See http://www.budget.gov.nl.ca/budget2011/ for the 2011 and earlier budgets. Nova Scotia: Government of Nova Scotia, Budget 2009 Estimates page 2.10 Consolidated Funds: Ordinary Revenue Items 68-72 inclusive for 2007/08 to 2010/11 and same citation in earlier budgets for 2002/03 to 2006/07. For the 2010/11 estimates see http://www.gov.ns.ca/finance/site-finance/media/finance/budget2011/Estimates_And_Supp_detail.pdf New Brunswick: For 2002/03 to 2005/06 the information was from Government of New Brunswick, Office of the Comptroller, Public Accounts, Volume 2, Supplementary Information, Statement 14 (http://www.gnb.ca/0087/pubacct/PA06v2.pdf) . For 2006/07 and 2007/08, Office of the Comptroller, Public Accounts for the Year ended March 31, 2008, Volume 1, Financial Statements to 2008 (http://www.gnb.ca/0087/pubacct/PA08v1e.pdf). For 2008/09 , 2009/10 and 2010/11 estimates, Department of Finance, Budget , Main Estimates, Comparative Statement of Estimated Gross Revenue, p205. For 2010/11 see http://www.gnb.ca/0160/budget/buddoc2011/ME2011-12.pdf . See also http://www.gnb.ca/0024/Fiscal_Update_2010-e.pdf , http://www.gnb.ca/0024/Fiscal_Update_2011-e.pdf and http://www.gnb.ca/0160/budget/buddoc2010/ME2010-11 Final.pdf Quebec: Government of Quebec revenues are from the Mining Duties Act (duties on sub-surface minerals) and the Mining Act (royalties on surface mineral substances) and associated revenues. The data in the table are final revised estimates provided in personal communication by the Direction de l’imposition minère, Ministère des ressources naturelles et faune. Note that the data in Table 1 are shown on a cash accounting basis. In 2008, the Ministère des resources naturelles et faune has recently moved, for public accounts purposes, to an accrual accounting for mining revenues. The estimates for 2008/09 to 2010/11 in this table have been provided on a cash accounting basis to facilitate comparison with the data from earlier years. Ontario: Information is provided, via personal communication, by the Mines and Minerals Division, Ministry of Northern Development and Mines. The estimate for 2010/11 is based on expected production. It excludes possible revenues from new diamond production activity because of insufficient data and need for confidential cost estimates from a single producer. This information may be available next year. Manitoba: Information obtained from Government of Manitoba Budgets, various years. Data are typically found in Estimates of Expenditure and Revenue: Detailed Estimates of Revenue Table or Revenue Estimates for Core Government and are the forecast for the year just ending at the time the budget is brought down (e.g. forecast for 2010/11 as of 2011 budget brought down on April 12, 2011) Electronically go to http://www.gov.mb.ca/finance/provincialbudgets.html for access the individual budgets. For the most recent estimates see http://www.gov.mb.ca/finance/budget11/papers/r_and_e.pdf Saskatchewan: The estimates in Table 1 cover both royalties on potash, uranium, coal and other (non-oil and gas) minerals and the portion of the Surcharge on Resource Corporations levied on these minerals. The Resource Surcharge is assessed on the sale value of potash, uranium, coal, other non-oil and gas minerals, crude oil; and natural gas. The surcharge rate as applied to non-oil and natural gas sales was 3.6% of sales until 2005 declining to 3.0% by 2008 and remaining at the rate until the present. The amount of this resource surcharge attributed to potash, uranium and other non-petroleum resources was calculated based on applying these rates to the value of mineral sales from these non renewable resources in each year. The value of mineral sales was obtained from the Saskatchewan Bureau of Statistics, Provincial Accounts. For 2010/11, for example, royalties on potash, uranium, coal and non-oil and gas minerals were $439.1 million. The total resource surcharge was $398.7million. The combined value of production of potash, uranium, coal, other non-oil and gas minerals in that year was $7027 million. Multiplying that number by 0.03 yields the portion of the surcharge levied on potash, uranium, coal and other non-oil and gas production of $210.8 million for total mineral revenues to the Saskatchewan government of $649.9million (439.1+210.8) For the royalty and total resource surcharge data see Government of Saskatchewan, Provincial Budgets 2002-03 to 2010/11, Estimates for the Fiscal Year, Sources of Revenue for the (refer to http://www.gov.sk.ca/finance/budget). The value of mineral sales data used to apportion the resource surcharge is from the Saskatchewan Bureau of Statistics, Provincial Accounts, Table 1 (see http://www.stats.gov.sk.ca/pea/)

7
Alberta: The Government of Alberta provides oil sands royalty data only for the aggregate of mining and in situ production (see http://www.finance.gov.ab.ca/publications/budget/. Royalties for oil sands mining for 2002/03 to 2008/09 are from Canadian Association of Petroleum Producers (CAPP), Statistical Handbook, Canada Oil Sands Expenditures: 1997-2009, Table 4.16b (see http://www.capp.ca/GetDoc.aspx?DocId=184463&DT=NTV) and are actually for calendar years. CAPP does not yet have an estimate for 2010 –it will not be available until August 2011. Also, from discussions with CAPP analysts, it appears that the oil sands mining royalty value for 2009 in Table 4.16b is incorrect. The chief reason is that the data do not accurately reflect the change to a bitumen basis for computing oil sands royalties introduced by Alberta government in January 2009. This value will be revised in subsequent editions of the Statistical Handbook. Following discussions with CAPP analysts, we have generated 2009 (2009/10) and 2010 (2010/11) estimates of Crown royalties from oil sands mining from information in the 2010 financial statements of companies involved in the four producing mining projects: Millennium (Suncor), Syncrude (Canadian Oil Sands Trust), Athabasca Oil Sands Project (Royal Dutch Shell) and Horizon (Canadian Natural Resources) . ENTRANS very much appreciates the assistance of Stephen Rodrigues of CAPP for his review of these estimates. Coal royalties in Alberta are available in the Budget Fiscal Plan Revenue tables which can be accessed at http://www.finance.alberta.ca/publications/budget/estimates/est2010/energy.pdf and http://www.finance.alberta.ca/publications/budget/budget2011/fiscal-plan-revenue.pdf British Columbia Information obtained from the Government of British Columbia, Ministry of Revenue and Small Business, Minerals, Oil and Gas Revenue Branch. (http://www.sbr.gov.bc.ca/business/Natural_Resources/Mineral_Tax/minrev_collected.pdf) Note that starting in 2008/09 the data were adjusted to reflect the introduction of a three month instalment accrual system. The Mineral Tax accounts for almost all the revenues. Coal accounted for about 40 percent of annual Mineral Tax revenues in the early 2000s. Since 2008-09, however, it has dominated the tax revenues accounting for roughly 80 % annually. Yukon: For 2002/03 and 2003/04, Yukon Government, Public Accounts, Comparative Schedule of Revenue, (http://www.finance.gov.yk.ca/ For 2004/05 to 2005/06, Yukon Government, Comparative Schedules of Revenues Schedule 2 for year ending March 31, 2006, page 2. See http://www.finance.gov.yk.ca/publications/budgets/budget05-06/2005-06pub_s01.pdf . For subsequent years see, Budgetary Income Summary by Source, Financial Information. Figures for 2009/10 are estimates and for 2010/11 are forecasts from Government of the Yukon, Budget 2010-2011, see http://www.finance.gov.yk.ca/pdf/budget/English_-_Financial_Information_2010-2011.pdf Nunavut and NWT: Information was provided by Indian and Northern Affairs Canada, Mineral Resources Directorate. Note that data for Nunavut and NWT are not provided separately to preserve confidentiality.

8
4. Corporate Income Taxes Paid to Governments Corporations in the mining industry pay corporate income taxes (CIT) to both the provincial and federal governments. Table 3 below summarizes information reported by Statistics Canada for the years 2002-2009 for the three industry components of the minerals sector. Historical estimates of CIT payable by oil sands mining operations were provided from surveys and related analysis undertaken for the Oil Sands Developers Group (OSDG) or its predecessor organization the Athabasca Regional Issues Working Group (RIWG). As indicated in the footnotes to Table 3, the 2010 values for mining (excluding oil and gas), non-metallic mineral products manufacturing and primary metals manufacturing are estimates derived from projecting the 2009 values forward using the 2009 to 2010 percentage change in the provision for current taxes from quarterly financial data. As estimates, they seem reasonably reliable. They are not, however, final recorded values compiled from tax returns. The final tax-return based data for 2010 will not be available until around March 2012. Also, the method for estimating corporate income tax for oil sands mining for 2010 is different from earlier years due to OSDG’s decision to abandon its survey of members in favour of a modelling based approach. As explained indicated in the footnotes to Table 3, we have taken the OSDG’s CIT model results for 2010 which cover all oil sands activity and apportioned them on the bases of the ratios of oil sands mining production to total oil sands production and of oil sands mining royalties paid to total oil sands royalties. Due to the recession and financial crisis which began the latter part of the 2008, CIT paid by the mineral sector declined from a decade-high $4.2 billion in 2007 to $3.2 billion in 2008. The declines were concentrated in the two manufacturing industries (non-metallic mineral products and primary metals) and oil sands. Tax collections exhibited a much more dramatic reduction in 2009 – to $1.1 billion –essentially to one-quarter of the tax revenues in 2008. The reductions in 2009 centred on the extraction segment of the industry and on oil sands where, according to the OSDG survey, corporate taxes were zero in 2009. The estimates for 2010 indicate corporate tax revenues of about $3.1 billion, similar to the 2008 level. They reflect the impact of higher commodity prices, increased production and improved profitability. All segments of the mineral sector contribute to the increase in CIT revenues suggesting that that the improvements in profitability were quite general. For the mineral sector excluding oil sands mining, about 65-70% of total corporate tax payments in any year accrue to the federal government. This percentage accords reasonably closely with the ratio of federal and the average of provincial statutory tax rates. The percentage is both typically a bit lower –around 62%- and more variable when oil sands mining revenues are included. In 2009, for example, which is the last year for actual numbers rather than estimates, the mining sector including oil sands contributed almost $660 million in corporate taxes to federal coffers and almost $450 million to provincial governments for a federal to total ratio of 60%.

9
Table 3
Corporate Taxes Paid by the Mineral Sector to Federal and Provincial Governments
(2002-2010 $ millions)
2002 2003 2004 2005 2006 2007 2008 2009 2010E
Mining (except oil and gas)
Federal Tax 245 268 495 536 806 866 909 324 611
Provincial Tax 97 83 209 245 352 478 636 223 420
Total Tax 342 351 703 781 1158 1344 1545 547 1031
Non-Metallic Mineral Manufacturing
Federal Tax 258 268 269 291 326 389 285 208 263
Provincial Tax 126 124 129 152 169 198 163 138 174
Total Tax 383 393 398 443 495 587 449 346 437
Primary Metal Manufacturing
Federal Tax 241 213 318 395 822 414 245 137 388
Provincial Tax 119 92 153 191 383 187 152 88 250
Total Tax 360 305 471 586 1205 601 397 225 638
Total for Mineral Sector (excluding Oil Sands Mining)
Federal Tax 744 749 1082 1222 1954 1669 1439 669 1262
Provincial Tax
342 299 491 588 904 863 951 449 844
Total Tax 1085 1049 1572 1810 2858 2532 2391 1118 2106
Oil Sands Mining
Federal Tax 203 529 278 280 476 887 550 0 577
Provincial Tax 92 195 92 303 671 794 264 0 385
Total Tax 295 724 370 583 1147 1681 814 0 962
Total for Mineral Sector (including Oil Sands Mining)
Federal Tax 947 1278 1360 1502 2430 2556 1989 669 1839
Provincial Tax
434 494 583 891 1575 1657 1215 449 1229
Total Tax 1380 1773 1943 2393 4005 4213 3204 1118 3068
Notes 1. Federal Tax includes corporate income taxes and certain other direct taxes such as the Large Corporation Tax in applicable years. The Provincial Tax data cover only corporate income tax. They do not include provincial capital taxes. 2. Numbers in italics are estimates

10
Sources: Non-Oil Sands Mining For the years 2003 to 2009, Statistics Canada, Financial and Taxation Statistics for Enterprises 2009(61-219X). For 2010, the estimates for total tax payable are derived by applying, for each industry segment, the percentage increase in current tax between 2009 and 2010 from Statistics Canada, Quarterly Financial Statistics for Enterprises (61-008X), to the total tax payable from 61-219X in 2009. The data from 61-008X for each industry segment –Mining and Quarrying (except oil and gas), Non-Metallic Mineral Products Manufacturing and Primary Metal Manufacturing - are obtained from special runs of the database purchased from Statistics Canada. The distribution between federal and provincial tax payable is estimated by applying the proportion of each in total tax payable in 2009 to the estimated total tax payable in 2010. Oil Sands Mining The estimates for both federal and provincial corporate income tax (CIT) were provided by Oil Sands Developers Group (OSDG) previously known as the Athabasca Regional Issues Working Group (RIWG). The estimates for 2002 to 2009 are from a survey of members conducted by a consultant (Nichols Applied Management) for OSDG/RIWG. The survey results were used by the consultant to develop projections of oil sands production, revenue employment and fiscal payments to governments. See their surveys for various years on the OSDG website (http://www.oilsandsdevelopers.ca/index.php/library/ ). The 2010 estimates are derived from a draft report prepared by Nichols Applied Management, Oil Sands Industry Development and Revenues to Government, for OSDG in January 2011, particularly page 8 and chart 4.2. The report, which is focussed primarily on forecasting future oil sands development and revenues, is available from the Oil Sands Developers Group. Unlike the data for previous years which are from surveys, the Nichols estimates for 2010 are modelling results. Further, they combine CIT estimates for both mining and in situ activity. To isolate the mining component, we pro-rated the Nichols estimates on the basis of both production (oil sands mining production to total oil sands production) and royalties (oil sands mining royalties to total oil sands royalties) and averaged the results.
5. Personal Income Taxes Paid by Mineral Sector Employees This section provides annual estimates of the personal income taxes paid by mineral sector employees to both the federal and provincial governments for the nine year period 2002-2010. It is important to note that the estimates provided below in Table 4 are not reported data. Rather they are estimates derived from statistical data. Unlike royalties and corporate income taxes, there is no reporting of the personal income tax paid by employees working in specific industries. To develop these estimates, it was necessary to combine calculated values of annual earnings, effective tax rates derived from tax filer data and data on industry-level employment. Each of these components is grounded on solid, available data. However, several assumptions must be accepted in combining this information. A further caveat is that all of the estimates provided in this table relate only to employees who work for enterprises directly involved in the mineral sector. The estimates do not include income taxes paid by employees from other companies providing goods or services to mining enterprises on a contract basis. Thus, for example, workers constructing mine shafts or removing overburden on a contract basis are not included in mining employment, but, rather are classified as employees of the construction industry. The main data ingredients for the calculations and the results are shown in Table 4. The computation begins with estimates, from Statistics Canada, of average annual earnings of employees in the four industry components of the mineral sector. For the period 2002-2010, average annual earnings were generally in the $40 000 to $50 000 range for non-metallic mineral product manufacturing (NMMP), in the upper $50 000 –lower $60 000 for primary metals manufacture and $50 000 to mid - $70 000 for mineral extraction. Earnings increased significantly for oil sands mining workers, from $74 000 in 2002 to $116,000 in 20104. The Canada Revenue Agency (CRA) publishes annual information on employment and other income earned, deductions, credits and federal and provincial income tax paid by tax filers in income ranges of $10,000. 4These figures may be an underestimate for oil sands mining workers. In the absence of information on the earnings of these workers, we are using the earnings of all oil and gas industry workers in Alberta as a proxy. See the notes Table 4.

11
Utilizing the relevant ranges, one can construct an approximate effective tax rate, defined as income tax paid as a percentage of total income, for both federal and provincial personal taxes. The assumption implicit in this approach is that, on average, an employee in each component of the mineral sector has the same “tax” characteristics – in terms of other income sources, RRSP contributions, personal deductions, etc - as all taxpayers in the relevant income range. The most recent CRA data on tax filers is for 2008. However, the calculations for the period 2002-2008 suggest that the effective rates for the various income ranges have not changed appreciably. Thus we have assumed in the calculations that the 2008 effective rates for given income ranges also apply to 2009 and 2010. Applying these calculated average tax rates to average earnings yields estimates of federal and provincial tax payments per employee. Multiplying these estimates by the number of employees (also from Statistics Canada except for the estimates for oil sands mining) generates estimates of total personal income taxes paid by employees of companies in the mineral sector. The calculations in Table 4 indicate that employees in the mineral sector including oil sands mining paid about $1.8 billion in personal income tax in 2009. This represents a decline of about $230 million from 2008. About 70 per cent of the payments are to the federal government reflecting, primarily, the difference in federal and provincial tax rates. The inclusion of oil sands mining tends to mask the 2009 decline in personal tax payments. For the non- oil sands segment, 2009 collections were about $300 million below those for 2008. The 2009 level was the lowest over the time period under consideration but there was a recovery in 2010. From Table 4, it is clear that the source of the 2009 decline in personal income tax collections was the significant reduction in employment. Overall, the sector lost about 20 000 jobs in 2009 (from 192,000 to 172,000). The reductions were particularly large in primary metal manufacturing (9,800 jobs). Personal income tax collected from the employees in the sector increased in 2010 relative to 2009 levels totalling about $2.0 billion including and $1.6 billion excluding oil sands mining. The main reason appears to be a modest rebound of about 4500 jobs (mostly in oil sands mining and primary metal manufacturing). The 2010 level of personal income tax revenues is, with oil sands mining included, back to the level of 2007, the last full year before the economic slowdown.

12
Table 4
Estimates of Personal Income Tax Revenues Paid by Employees of Companies Involved in the Mineral Sector
(2002-2010)
2002 2003 2004 2005 2006 2007 2008 2009 2010 Average Annual Wage ($) Mining (excl O&G) 54143 57823 60388 60853 60210 67612 70656 71384 75132 Primary Metals Man. 53375 54006 56714 58039 57550 62780 61599 59100 64936 NMMP* 41282 43930 43376 46198 47068 50017 52441 50379 48019 Oil Sands Mining 74986 78950 81276 83364 88096 92176 98122 106143 116479 Federal Tax Rates (%) Mining (excl O&G) 12.80 12.64 13.08 12.51 12.36 11.42 12.19 12.19 12.19 Primary Metals Man. 12.80 12.64 12.21 11.50 11.29 11.42 11.31 10.06 11.31 NMMP 11.47 11.32 10.82 10.03 9.73 10.18 10.06 10.06 8.46 Oil Sands Mining 14.26 14.36 13.66 13.96 14.06 13.41 15.65 15.38 15.38 Provincial Tax Rates (%) Mining (excl O&G) 4.47 4.37 4.86 4.99 4.94 4.76 4.98 4.98 4.98 Primary Metals Man. 4.47 4.37 4.50 4.62 4.56 4.76 4.60 4.29 4.60 NMMP 3.84 3.76 3.97 3.98 3.90 4.29 4.14 4.14 3.62 Oil Sands (Alberta) 6.11 6.20 5.98 6.18 6.29 5.94 7.01 6.60 6.60
Employment Mining (excl O&G) 47893 47391 45986 46689 48830 52877 58506 52429 52532 Primary Metals Man. 90322 85402 79703 78731 80681 78802 69107 59413 61098 NMMP 51423 51329 51403 51304 53701 52807 52707 48711 49687 Oil Sands 8374 8666 9286 9859 10863 11732 12000 13300 15000 Total 198012 192788 186378 186583 194075 196218 192320 173853 178317
Personal Income Taxes -Total Mineral Sector Excluding Oil Sands Mining ($MM) Federal 1192 1185 1156 1119 1134 1242 1263 1056 1132 Provincial 413 406 427 447 456 519 516 439 465 Total 1605 1591 1583 1566 1589 1761 1780 1495 1597
Personal Income Taxes -Total Mineral Sector Including Oil Sands Mining ($MM) Federal 1282 1283 1260 1233 1268 1387 1448 1273 1400 Provincial 451 449 472 498 516 583 599 532 581 Total 1733 1731 1732 1731 1784 1970 2046 1805 1981
Notes and Data Sources for Table 4 • NMMP is an acronym for the Non-Metallic Mineral Products Manufacturing Industry (NAICS code 327). • Mining (excluding oil and gas) refers to NAICS 212. Primary Metals Manufacturing refers to NAICS 331. • Average weekly earnings and employment data (other than for oil sands), from Statistics Canada, Employment,
Earnings and Hours, Cat 72-002 and Statistics Canada, CANSIM database, Tables 281-0024 and 281-0027. The employment and earnings data are for all employees and the earnings data include overtime. Annual average earnings are 52X average weekly earnings.
• Oil sands mining employment estimates to 2007 are from the Athabasca Regional Issues Working Group (RIWG) and, for 2008 to 2010, from the successor organization the Oil Sands Developers Group (OSDG). They reflect direct employment on oil sands projects in the Wood Buffalo Region (where all of the operational projects are located). For average weekly earnings for oil sands workers, a proxy, average weekly earnings in the oil and gas

13
industry in Alberta was used. This proxy is also obtained from Statistics Canada, CANSIM database, Table 281-0027. Employment information at http://www.oilsandsdevelopers.ca/wp-content/uploads/2009/03/OSDG-Fact-Sheet-Social.pdf indicated that the forecast employment by 2010 was 15,000. This latter figure was used as our estimate for 2010 employment.
• Effective tax rates are derived from Canada Revenue Agency (CRA), Final Statistics for the 2002 to 2008 tax years. See http://www.cra-arc.gc.ca/agency/stats/final-e.html . The effective tax rate is the ratio of net federal (or net provincial) taxes paid to total income assessed for the relevant income classes. The income class is determined by the average annual earnings. Since the most recent CRA data only provides personal tax filer information for 2008, the effective rates for 2009 and 2010 are assumed to be the same as 2008 (although they have been adjusted upwards to reflect higher income categories where necessary). The 2008 tax filer data, which were released in 2010, are at http://www.cra-arc.gc.ca/gncy/stts/gb08/pst/fnl/pdf/tbl2a-eng.pdf. The data for Alberta was used for the calculation of PIT paid by Alberta oil sands employees. The Alberta tables are located at http://www.cra-arc.gc.ca/gncy/stts/gb08/pst/fnl/html/t02ab-eng.html
• The tax estimates in the lower panel are calculated by multiplying average annual earnings by the relevant tax rate for the specific tax bracket then multiplying that result by the number of employees. These results produce total tax paid for each mining industry segment. The figures are then summed across the industry segments to produce the estimates for total personal income taxes paid by employees of mining companies.
• Note that the total Personal Income Tax paid in 2008 is revised slightly from the estimate provided in last year’s report due to the final personal tax rates being released by CRA for the 2008 tax year.
• Note that some estimates provided in last year’s report within the period from 2002-2004 have changed marginally due to some minor changes in the CANSIM historical data series for average annual earnings and sector level employment for these years. There were also minor revisions to estimates for 2008 and 2009
6. Summary of Revenues to Governments
This section aggregates the estimates from the previous sections to provide the total revenues received by governments from the mineral sector from the sources discussed above - i.e. royalties and mining taxes, corporate income taxes and personal income taxes. As in previous sections, the information is presented for the mineral sector excluding and including oil sands mining. The overall results are summarized in Table 5 and also portrayed in Charts 1 and 2 below.
Chart 1 Revenues to Governments by Component Sources and Total 2002-2010
Excludes Oil Sands Mining
0
1000
2000
3000
4000
5000
6000
7000
8000
2002 2003 2004 2005 2006 2007 2008 2009 2010
CITRoyaltiesPITTotal

14
Focussing first on the results in Chart 1 above and the upper panel of Table 5 which exclude oil sands mining, total annual payments to federal and provincial governments increased significantly from 2002 to 2008. By the latter year, they stood at about $7.1 billion or over double the 2002 value of $3.2 billion. Higher royalties/ mining taxes, which increased from $500 million to $3.0 billion, accounted for about 60 percent of the increase in total revenues to governments although corporate taxes also rose appreciably. As royalties and mining taxes accrue almost exclusively to provinces, their rapid increase was the chief reason for the increase in the provincial share of revenues from about 40% in 2002 to about 61% in 2008.
In 2009, the situation changed dramatically. As a result of the U.S. financial crisis and generally collapsing metals and potash prices, revenues to governments plummeted 52 percent, to $3.4 billion in 2009 from $7.1 billion in 2008. A $2.2 billion drop in royalties/mining taxes accounted for about 60% of the overall reduction. As noted earlier, all of the major mineral producing jurisdictions except Quebec recorded significant reductions in royalty/mining tax receipts. The most spectacular and consequential was Saskatchewan which went from $1.9 billion in 2008 to only $86 million largely because of the collapse of potash prices and the return of royalty overpayments to potash producers. However, corporate taxes also declined appreciably, by about $1 billion, and even personal income taxes fell by about 17% largely as a result of an employment contraction in the industry.
The inclusion of oil sands mining in the mineral sector adds substantial revenues but does not fundamentally change the narrative. By 2008, total revenues to government had climbed to over $10.5 billion, an almost threefold increase over 2002 of $3.7 billion. Almost 70% of this increase was associated with increases in royalties (from $580 million to $5.7 billion) of which the $2.3 billion increase in oil sands royalties was the largest contributor. Corporate taxes increased by about $1.8 billion (from $1.4 billion in 2002 to $3.2 billion in 2008). Oil sands mining activities were responsible for about $600 million of this increase. As the majority of the revenues from oil sands accrued to the Government of Alberta, the provincial share of revenues to governments from the mineral sector including oil sands mining was almost 70 percent in 2008, up from about 40 percent in 2002.
The results for 2010 indicate a recovery in the mineral sector excluding oil sands mining with overall revenues to government increasing $2.1 billion from the 2009 level to $5.5 billion. Royalty/mining tax and CIT collections were responsible in roughly equal parts for the increase.
Chart 2 Revenues to Governments by Component Sources and Total 2002-2010
Includes Oil Sands Mining
0
2000
4000
6000
8000
10000
12000
2002 2003 2004 2005 2006 2007 2008 2009 2010
CIT
Royalties
PIT
Total
15
The year 2009 was also a challenging time for oil sands mining as crude oil prices plummeted but then partially recovered. Several project expansions were put on hold. In previous sections, it was noted that estimated royalties from oil sands fell to $1.4 billion in 2009 from $2.3 billion in 2008 while corporate taxes for 2009 are estimated at zero, a drop of $500 million from 2008. So, defining the mineral sector to include oil sands mining – see chart 2 and the lower panel of table 5 - results in to just over a 50 percent drop in revenues to government, from $10.5 billion to about $5.1 billion. Royalties and corporate taxes declined by 59 and 65 percent respectively.
2010 was a recovery year, with overall revenues to governments rising significantly from their lows in 2009. Overall revenues from the mineral sector including oil sands mining increased by $3.3 billion to $8.4 billion. These levels are still well below the amounts reported in 2008 but it is clear that there is a recovery taking place. Corporate income tax was responsible for about 60% of the increase in the results including oil sands.
The estimates in table also suggest a general upward trend in the percentage of revenues going to provincial governments. This was particularly the case up to 2008 as the royalty/mining tax “take” increased sharply with rising commodity prices. The trend is less obvious over the past two years as both the royalty/mining tax and CIT systems have adjusted to the economic and financial turbulence. As of 2010, provinces receive 54% of the revenues (60% if oil sands mining is included), up from roughly 40% early in the decade.

16
Table 5: Revenues to Governments from the Mineral Sector 2002 - 2010
MINERAL SECTOR EXCLUDING OIL SANDS MINING 2002 2003 2004 2005 2006 2007 2008 2009 2010
$ millions Royalties/Mining Taxes 508 471 835 985 1077 1637 2977 816 1778
Corporate Income Tax 1085 1049 1572 1810 2858 2532 2391 1118 2106 Personal Income Tax 1605 1591 1583 1566 1589 1761 1780 1495 1597 TOTAL 3198 3111 3990 4361 5524 5930 7148 3429 5481 -of which federal 1951 1982 2378 2405 3097 2973 2812 1815 2502 -of which provincial 1247 1129 1612 1956 2427 2957 4336 1614 2979
• percent share 39.0 36.3 40.4 44.9 43.9 49.9 60.6 47.1 54.3
MINERAL SECTOR INCLUDING OIL SANDS MINING 2002 2003 2004 2005 2006 2007 2008 2009 2010 $ millions Royalties/Mining Taxes 570 586 1336 1576 2640 3967 5279 2182 3357
Corporate Income Tax 1380 1773 1943 2393 4005 4213 3204 1118 3068 Personal Income Tax 1733 1731 1732 1731 1784 1970 2046 1805 1981 TOTAL 3683 4090 5011 5700 8429 10150 10529 5105 8406 -of which federal 2244 2609 2760 2799 3707 4005 3547 2032 3347 -of which provincial 1439 1481 2251 2901 4722 6145 6982 3073 5059
• percent share 39.1 36.2 44.9 50.9 56.0 60.5 66.3 60.1 60.2 Notes: Most royalty estimates are provided on a fiscal year basis while the estimates for corporate and personal income taxes are for calendar (taxation) years. The federal share includes federal corporate income and capital taxes, federal personal income taxes paid by mining employees and mining royalties generated in the Northwest Territories and Nunavut. The provincial share includes all royalties and mining taxes to provinces and to the Yukon, provincial corporate income and provincial personal income taxes paid by mining employees.
Sources: Tables 2, 3 and 4 above

17
ANNEX A: INDUSTRIAL COMPOSITION OF THE MINERAL SECTOR For its corporate and personal tax estimates, this report relies heavily on financial and employment and earnings data generated by Statistics Canada. These data are organized by industry using the North American Industrial Classification System (NAICS). The objective of this annex is briefly to describe the NAICS industrial composition of the mineral sector as defined in this report. It also touches on the reasons for the somewhat different approaches to obtaining corporate and personal tax estimates for oil sands mining. NAICS Background5 NAICS was developed in the late 1990s by the statistical agencies of Canada, the United States and Mexico following the North American Free Trade Agreement. The current version reflects revisions and updates introduced in 2007. The NAICS system is organized as a numeric hierarchical code in which additional digits indicate further disaggregation. The one digit level – e.g. 3 for manufacturing, 4 for trade, 5 for a grouping of communications and financial services activities - is for highly aggregated information. The two digit level – e.g. 21 for mining, quarrying and oil and gas extraction industries, 31 to 33 for various broad categories of manufacturing, 61 for educational services – allows further disaggregation. Most familiar is the 3 digit level which, for example, breaks down manufacturing into 21 separate industries e.g.: Food Manufacturing (NAICS 311), Paper Manufacturing (NAICS 322), Computer and Electronics Manufacturing (NAICS 334). There are further disaggregations possible within the NAICS system to the 4th, 5th and for certain industries a 6th digit. For example, Food Manufacturing (NAICS 311) is further divided, to the four digit level, into animal food manufacturing, grain and oilseed milling, sugar and confectioneries, fruit and vegetable processing, dairy products, meat and meat products, seafood products, bakeries and other. The four and higher digit disaggregations are mostly for description. While some industrial data are available from various censuses (e.g. Census of Manufacturing) and specialty publications at the 4 digit level, annual time series data – in particular financial data - for industries are only reported at the 3 digit level. As indicated in the text, our NAICS definition of the mineral sector comprises NAICS 212 –Mining and Quarrying (except Oil and Gas), NAICS 327 -Non-Metallic Mineral Manufacturing and NAICS 331 –Primary Metal Manufacturing. This defines the mineral sector excluding oil sands mining. The report also provides data for the mineral sector including oil sands mining. As discussed below, however, oil sands mining is a subset of the oil and gas industry (NAICS 211) and the tax, employment and earnings data for this subset must be obtained by other means. The definition of mineral sector captures both the extraction (NAICS 212) and the smelting, refining and processing of minerals (NAICS 331 for metals and NAICS 327 for non-metals). The definition also addresses the assignment issue for integrated companies. The statistical unit for the financial data is the enterprise. Within the context of this report, an enterprise may operate a mine and a smelter (and either as separate corporations or as establishments). Statistics Canada determines the NAICS category for each of these sub-entities, then assigns the enterprise (and all of its data) to one industry based on the greatest value added –i.e. to NAICS 212 or NAICS 331/327 depending on whether the extraction or the smelting contributes more to net firm output.)
5 For additional information on NAICS, see Statistics Canada, North American Industrial Classification System 2007, http://www.statcan.gc.ca/subjects-sujets/standard-norme/naics-scian/2007/list-liste-eng.htm

18
Combining the extraction and smelting/refining industries ensures (or, at least, makes much more likely) that all of the data for integrated mining minerals companies are included. Table A1 below lists the 4 and 5 digit (and occasionally 6 digit) sub- components of, respectively, NAICS 212, NAICS 327 and NAICS 331. As can be seen, the mineral coverage of the NAICS extraction industry, which includes both established producers and junior exploration companies, is very complete. Similarly, the coverage of metal smelting and refining in NAICS 331 seems comprehensive. NAICS 327 (Non-Metallic Mineral Products Manufacturing) does appear to move somewhat far into fabrication and transformation (e.g. glass, clay products). It is, however, the smallest of the three industries and includes the important processing activity of cement and concrete products manufacturing. One mineral activity not included in this definition is support activities to mining. NAICS separately identifies industry 213 – Support Activities for Mining and Oil and Gas Extraction. At the 5 and 6 digit level, NAICS 213 covers a number of activities – contract drilling (for. prospecting, testing, etc) for metals and non-metals, excavation, pumping, overburden removal on a contract basis – which logically are associated with mining. Statistics Canada, however, does not report financial and employment/earnings data for NAICS 213. Instead, it groups the information for NAICS 213 with NAICS 211 (Oil and Gas Extraction) presumably because the bulk of support activities are related to oil and natural gas. As noted earlier, financial and employment/earnings data for oil sands mining are not available via Statistics Canada. Such data are provided only for the 3 digit industry Oil and Gas Extraction (NAICS 211 plus, as noted above, the support activities in NAICS 213). NAICS 211 is divided into only two sub-categories: conventional oil and gas extraction and non-conventional oil extraction. Oil sands mining is a subset of the latter, the other being in-situ extraction via (typically) drilling techniques (currently oil sands production is evenly split between mining and in situ methods). Because financial and employment/earnings data for oil sands mining are not available from Statistics Canada, we have used other sources to develop the estimates. As noted in the text (particularly the notes to tables), these include corporate annual reports and the surveys and analysis carried out for the Oil Sands Developers Group. It is important to underline, however, that the oil sands data in this report are estimates. Although carefully developed, they are not as robust as the data from Statistics Canada and provincial budgets. TABLE A1: SUB-COMPONENTS OF NAICS THREE DIGIT INDUSTRIES COMPRISING THE MINERAL SECTOR NAICS 212: MINING AND QUARRYING (EXCEPT OIL AND GAS) 2121 Coal Mining (including Bituminous, Sub-bituminous, Lignite) 2122 Metal Ore Mining
• 21221 Iron Ore Mining • 21222 Gold and Silver Ore Mining • 21223 Copper, Nickel, Lead and Zinc Ore Mining • 212291 Uranium Ore Mining • 212299 All Other Metal Ore Mining
19
2123 Non-Metallic Mineral Mining and Quarrying
• 21231 Stone Mining and Quarrying • 21232 Sand, Gravel, Clay and Ceramic and Refractory Mining and Quarrying • 212392 Diamond Mining • 212393 Salt Mining • 212394 Asbestos Mining • 212395 Gypsum Mining • 212396 Potash Mining • 212397 Peat Extraction • 212398 All Other Non-Metallic Mineral Mining and Quarrying
NAICS 327: NON-METALLIC MINERAL PRODUCTS MANUFACTURING 3271 Clay Product and Refractory Manufacturing
• 32711 Pottery, Ceramics and Plumbing Fixture Manufacturing • 32712 Clay Building Material and Refractory Manufacturing
3272 Glass and Glass Product Manufacturing 3273 Cement and Concrete Product Manufacturing
• 32731 Cement Manufacturing • 32732 Ready-Mix Concrete Manufacturing • 32733 Concrete Pipe, Brick and Block Manufacturing • 32739 Other Concrete Product Manufacturing
3274 Lime and Gypsum Product Manufacturing
• 32741 Lime Manufacturing • 32742 Gypsum Product Manufacturing
3279 Other Non-Metallic Mineral Product Manufacturing • 32791 Abrasive Product Manufacturing • 32799 All Other Non-Metallic Mineral Product Manufacturing
NAICS 331: PRIMARY METAL MANUFACTURING 3311 Iron and Steel Mills and Ferro-Alloy Manufacturing 3312 Steel Product Manufacturing from Purchased Steel
• 33121 Iron and Steel Pipes and Tubes Manufacturing from Purchased Steel • 33122 Rolling and Drawing of Purchased Steel (includes cold-rolled steel shape
manufacturing and steel wire drawing)
20
3313 Alumina and Aluminum Production and Processing
• 33131 Alumina and Aluminum Production and Processing (includes primary production and rolling, drawing, extruding and alloying)
3314 Non-Ferrous Metal (except Aluminum) Production and Processing • 33141 Non-Ferrous Metal (except Aluminum) Smelting and Refining • 33142 Copper Rolling, Drawing, Extruding and Alloying • 33149 Non-Ferrous Metal (except Copper and Aluminum) Rolling, Drawing, Extruding and
Alloying
3315 Foundries • 33151 Ferrous Metal Foundries (includes both iron and steel) • 33152 Non-Ferrous Metal Foundries (includes die-casting foundries)

21
ANNEX B: REVENUES TO GOVERNMENTS FROM THE FABRICATED METAL PRODUCT MANUFACTURING INDUSTRY (FMPM)
Although the Fabricated Metal Product Manufacturing Industry (NAICS 332) extends considerably beyond the usual boundaries of the mineral sector (see attachment), there are situations in which it is appropriate to note its additional contribution to revenues to governments from the sector. The purpose of this note is to provide estimates of the contribution of this industry to government coffers for the period 2005 -2010. These contributions are in the form of corporate income taxes and personal income taxes paid by employees in the industry – there are no royalty/mining tax payments by the Fabricated Metal Product Manufacturing Industry. The estimates for FMPM are provided in the following table. They are derived using the methodology and sources described in the ENTRANS report Revenues to Governments from the Mineral Sector, 2002-2010
Table B1: Estimates of Revenues to Governments from the Fabricated Metal Manufacturing Industry, 2005-2010
2005 2006 2007 2008 2009 2010 Corporate Income Tax ($ millions) • federal 601 705 674 726 528 542 • provincial 328 372 344 445 399 409 • total 928 1076 1018 1171 926 951 Personal Income Tax ($ millions except otherwise noted) • Annual Earnings $/empl 43139 43639 46971 49863 49048 48321 • Eff Tax Rates –federal % 10.03 9.73 8.97 8.34 8.34 8.34 • Eff Tax Rate Provincial % 3.98 3.90 3.87 3.56 3.56 3.56 • Employment 176068 179727 175091 171126 147808 144485 • PIT –federal 762 763 738 712 605 582 • PIT -provincial 302 306 318 304 258 248 • PIT -total 1064 1069 1056 1016 863 830
Revenues to Governments
• Federal 1363 1468 1412 1438 1133 1124 • Provincial 630 678 662 749 657 657 • Total 1993 2146 2074 2187 1789 1781
Up to 2008, the Fabricated Metal Manufacturing Industry contributed $2.0 to $2.2 billion annually in taxes split relatively evenly between CIT and PIT. In 2009-2010, however, there has been a noticeable reduction in tax revenues from this industry to about $1.8 billion annually. This decline seems to be related to a significant fall off in employment of 23,000 jobs in 2009.

22
Attachment: NAICS332 Fabricated Metal Product Manufacturing Component Sub-Industries
3321 Forging and Stamping
3322 Cutlery and Hand Tool Manufacturing 3323 Architectural and Structural Metals Manufacturing
• 33231 Plate Work and Fabricated Structural Product Manufacturing • 332311 Prefabricated Metal Building and Component Manufacturing • 332314 Concrete Reinforcing Bar Manufacturing • 332319 Other Plate Work and Fabricated Structural Product Manufacturing • 33232 Ornamental and Architectural Metal Products Manufacturing • 332321 Metal Window and Door Manufacturing • 332329 Other Ornamental and Architectural Metal Products Manufacturing
3324 Boiler, Tank and Shipping Container Manufacturing
• 33241 Power Boiler and Heat Exchanger Manufacturing • 33242 Metal Tank (Heavy Gauge) Manufacturing • 33243 Metal Can, Box and Other Metal Container (Light Gauge) Manufacturing
3325 Hardware Manufacturing 3326 Spring and Wire Product Manufacturing
• 332611 Spring (Heavy Gauge) Manufacturing • 332619 Other Fabricated Wire Product Manufacturing
3327 Machine Shops, Turned Product, and Screw, Nut and Bolt Manufacturing
• 33271 Machine Shops • 33272 Turned Product and Screw, Nut and Bolt Manufacturing
3328 Coating, Engraving, Heat Treating and Allied Activities 3329 Other Fabricated Metal Product Manufacturing
• 33291 Metal Valve Manufacturing • 332991 Ball and Roller Bearing Manufacturing • 332999 All Other Miscellaneous Fabricated Metal Product Manufacturing