Revenues and Expenditures for Public FINANCE TABLES
27
Revenues and Expenditures for Public Elementary and Secondary School Districts: FY 19 FINANCE TABLES November 2021 NCES 2021-304 U.S. DEPARTMENT OF EDUCATION A Publication of the National Center for Education Statistics at IES This report presents data on public elementary and secondary education revenues and expenditures at the local education agency (LEA) or school district level for fiscal year (FY) 2019. 1 Specifically, this report includes the following types of school district finance data: • revenue, current expenditure, 2 and capital outlay expenditure totals; • revenues by source; • current expenditures by function and object; and • revenues and current expenditures per pupil. School district finance expenditure functions include instruction, instructional staff support services, pupil support services, general administration, school administration, operations and maintenance, student transportation, other support services (such as business services), food services, and enterprise operations. Objects reported within a function include salaries, employee benefits, purchased services, supplies, and equipment. The finance data used in this report are from the School District Finance Survey (F-33), 3 a component of the Common Core of Data (CCD). The CCD is the primary National Center for Education Statistics (NCES) database on public elementary and secondary education in the United States. The F-33 survey consists of LEA-level finance data submitted annually to the U.S. Census Bureau (Census Bureau) by state education agencies (SEAs) in the 50 states and the District of Columbia. The tables and figures in this report present descriptive information on revenues and expenditures for FY 19. 4 Table 1 presents the revenues and current expenditures of the 100 largest school districts in the United States in order of their enrollment. Table 2 presents current expenditure detail of the two largest school districts by enrollment in each state by region, while table 3 presents median inflation-adjusted revenues and current expenditures per pupil by region and locale. Table 4 provides a comparison of independent charter school district per pupil finances to noncharter and “mixed” school district per pupil finances by state. (“Mixed” school districts include both noncharter and charter schools.) Tables 5 and 6 present federal and local revenues, respectively, by specific source of revenue and state. Table 7 presents total revenues per pupil by poverty quartile for each state. Table 8 provides capital outlay expenditure detail by state. The selected findings discussed within the report demonstrate the range of information available when using F-33 data and are not intended to emphasize any Suggested citation: Cornman, S.Q., Ampadu, O., Hanak, K., Howell, M., and Wheeler, S. (2021). Revenues and Expenditures for Public Elementary and Secondary School Districts: FY 19 (NCES 2021-304). U.S. Department of Education. Washington, DC: National Center for Education Statistics. Retrieved [date] from https://nces.ed.gov/pubsearch/pubsinfo.asp?pubid=2021304. For questions about content, contact Stephen Cornman at [email protected]. To view this report online, go to https://nces.ed.gov/pubsearch/pubsinfo.asp?pubid=2021304. This report was prepared in part under Interagency Agreement (IAA) No. ED-IES-14-J-0012 with the U.S. Census Bureau. Mention of trade names, commercial products, or organizations does not imply endorsement by the U.S. government.
Transcript of Revenues and Expenditures for Public FINANCE TABLES

Revenues and Expenditures for Public Elementary and Secondary School Districts: FY 19
FINANCE TABLES November 2021 NCES 2021-304 U.S. DEPARTMENT OF EDUCATION
A Publication of the National Center for Education Statistics at IES
This report presents data on public elementary and secondary education revenues and expenditures at the local education agency (LEA) or school district level for fiscal year (FY) 2019.1 Specifically, this report includes the following types of school district finance data:
• revenue, current expenditure,2 and capital outlay expenditure totals;
• revenues by source; • current expenditures by
function and object; and • revenues and current
expenditures per pupil.
School district finance expenditure functions include instruction, instructional staff support services, pupil support services, general administration, school administration, operations and maintenance, student transportation, other support services (such as business services), food services, and enterprise operations. Objects
reported within a function include salaries, employee benefits, purchased services, supplies, and equipment.
The finance data used in this report are from the School District Finance Survey (F-33),3 a component of the Common Core of Data (CCD). The CCD is the primary National Center for Education Statistics (NCES) database on public elementary and secondary education in the United States. The F-33 survey consists of LEA-level finance data submitted annually to the U.S. Census Bureau (Census Bureau) by state education agencies (SEAs) in the 50 states and the District of Columbia.
The tables and figures in this report present descriptive information on revenues and expenditures for FY 19.4 Table 1 presents the revenues and current expenditures of the 100 largest school districts in the United States in order of their enrollment.
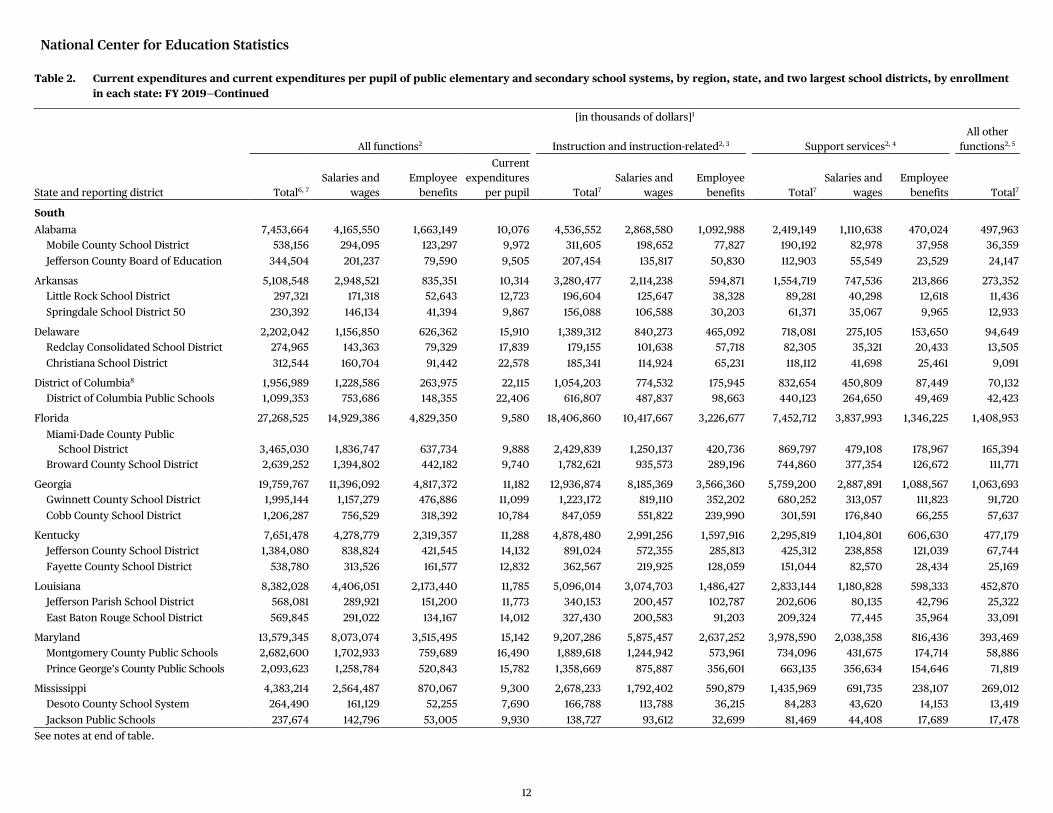
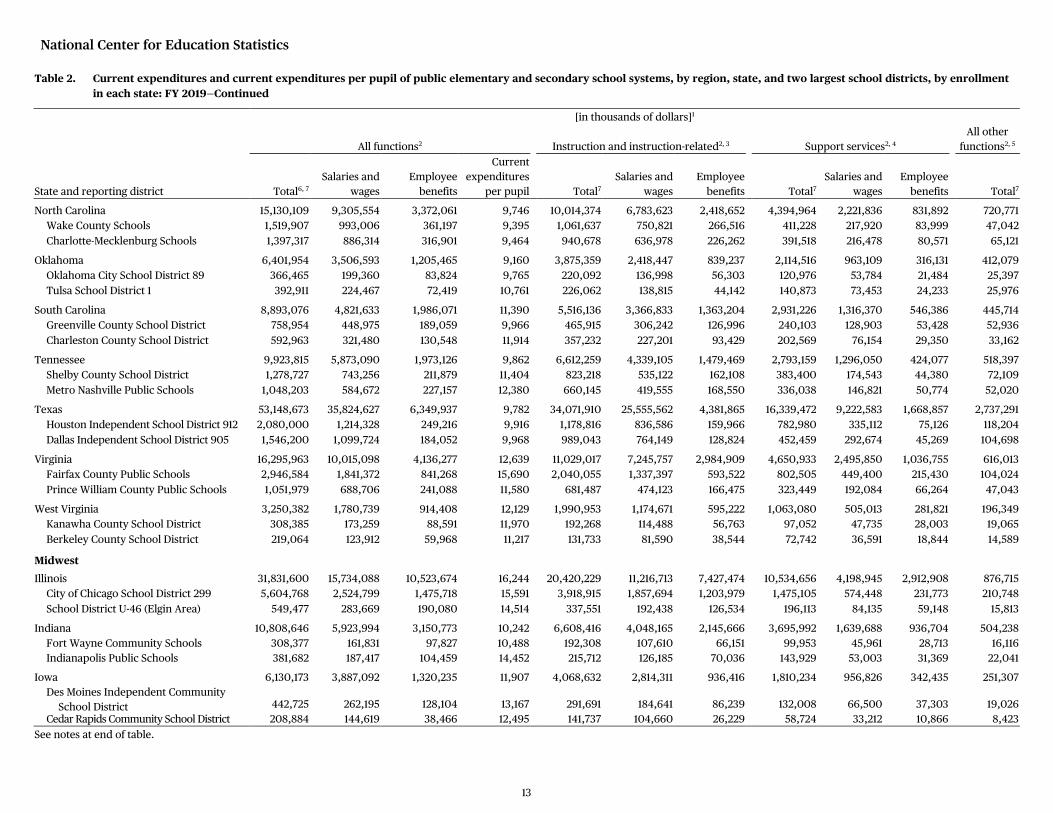
Table 2 presents current expenditure detail of the two largest school districts by enrollment in each state by region, while table 3 presents median inflation-adjusted revenues and current expenditures per pupil by region and locale. Table 4 provides a comparison of independent charter school district per pupil finances to noncharter and “mixed” school district per pupil finances by state. (“Mixed” school districts include both noncharter and charter schools.)
Tables 5 and 6 present federal and local revenues, respectively, by specific source of revenue and state. Table 7 presents total revenues per pupil by poverty quartile for each state. Table 8 provides capital outlay expenditure detail by state.
The selected findings discussed within the report demonstrate the range of information available when using F-33 data and are not intended to emphasize any
Suggested citation: Cornman, S.Q., Ampadu, O., Hanak, K., Howell, M., and Wheeler, S. (2021). Revenues and Expenditures for Public Elementary and Secondary School Districts: FY 19 (NCES 2021-304). U.S. Department of Education. Washington, DC: National Center for Education Statistics. Retrieved [date] from https://nces.ed.gov/pubsearch/pubsinfo.asp?pubid=2021304. For questions about content, contact Stephen Cornman at [email protected]. To view this report online, go to https://nces.ed.gov/pubsearch/pubsinfo.asp?pubid=2021304. This report was prepared in part under Interagency Agreement (IAA) No. ED-IES-14-J-0012 with the U.S. Census Bureau. Mention of trade names, commercial products, or organizations does not imply endorsement by the U.S. government.

2
particular issue(s). The data presented here should be interpreted with caution, especially with regard to school district-level comparisons.5
Whenever comparisons were made between FY 18 and FY 19 School Districts Finance Survey data, the FY 18 data were obtained from the Revenues and Expenditures for Public Elementary and Secondary School Districts: FY 18, Final Version 2a. (Updated tables for FY 18 can be found online at https://nces.ed.gov/ccd/ data_tables.asp.)
RELATED NCES REPORTS
Revenues and Expenditures for Public Elementary and Secondary School Districts: FY 18 (NCES 2020-308).
https://nces.ed.gov/pubsearch/ pubsinfo.asp?pubid=2020308
Revenues and Expenditures for Public Elementary and Secondary Education: FY 19 (NCES 2021-302). https://nces.ed.gov/pubsearch/ pubsinfo.asp?pubid=2021302
In addition, annual NCES school district finance reports going back to FY 98 can be found online at https://nces.ed.gov/ccd/ pub_pubdistricts.asp.
DATA
This report presents data from the FY 19 F-33 provisional (version 1a) data file with the FY 18 F-33 final (version 2a) data file for prior year comparisons. The student membership data used in this
report come from the CCD’s Local Education Agency Universe Survey data files for the corresponding school years (e.g., school year 2018–19 for the FY 19 School District Finance Survey data).
SEAs participate in the F-33 data collection voluntarily, following standard definitions for the data items they report.6 The Census Bureau conducts the data collection for the F-33 survey on behalf of NCES. SEAs report F-33 data for a variety of types of LEAs covering services that provide or support prekindergarten through high school for public education.
These LEAs include regular school districts, independent charter school districts, as well as a substantial number of administrative and operating LEAs that are unlike typical school districts (e.g., education service agencies that provide vocational and other specialized education services for school districts).
In FY 19, there were 19,700 school districts on the F-33 file in the 50 states and the District of Columbia. SEAs reported finance data for 18,815, or 95.5 percent, of school districts on the F-33 file.
For definitions of the finance terms used in this report and information about the FY 19 F-33 data collection, see the survey documentation:
Documentation for the NCES Common Core of Data School
Figure 1. Two highest current expenditures per pupil in each region out of the two largest enrollment school districts within each state: FY 19
$16,132
$16,543
$16,259
$19,355
$22,406
$22,578
$25,653
$28,004
0 10,000 20,000 30,000
Hawaii Department of Education, HI
Seattle School District 1, WA
Columbus City School District, OH
Cleveland City School District, OH
District of Columbia Public Schools, DC
Christina School District, DE
Boston City Schools, MA
New York City School District, NY
Current expenditures per pupil
Northeast South Midwest West
$
NOTE: Current expenditures include funds spent operating local public schools and local education agencies, including such expenses as salaries for school personnel, student transportation, school books and materials, and energy costs, but excluding capital outlay, interest on school debt, payments to private schools, and payments to public charter schools. Interschool system expenditures are excluded to prevent double counting. The ranking of two largest school districts in each state by enrollment excludes independent charter school districts.
SOURCE: U.S. Department of Education, National Center for Education Statistics, Common Core of Data (CCD), “School District Finance Survey (F-33),” fiscal year 2019 Provisional Version 1a.

3
District Finance Survey (F-33), School Year 2018–19 (Fiscal Year 2019) (NCES 2021-306). https://nces.ed.gov/ccd/pdf/2021 306_FY19F33_Documentation.pdf
In FY 19, current expenditures per pupil in the 100 largest public school districts by enrollment ranged from a low of $7,005 in Alpine School District, Utah to a high of $28,004 in New York City School District, New York (table 1). In addition to New York City School District and Boston City Schools, Massachusetts ($25,653) in the Northeast region, the two districts with the highest per pupil current expenditure in each region out of the two largest enrollment school districts within each state were Christina School District, Delaware ($22,578) and District of Columbia Public Schools, District of Columbia ($22,406) in the South; Cleveland City School District, Ohio ($19,355) and Columbus City School District, Ohio ($16,259) in the Midwest; and Seattle School District 1, Washington ($16,543) and Hawaii Department of Education, Hawaii ($16,132) in the West (table 2) (figure 1).
The national median of total revenues per pupil across all LEAs was $14,347 in FY 19, which represents an increase of 1.2 percent from FY 18, after adjusting for inflation7 (table 3). The national median of current expenditures per pupil among all LEAs was $12,162 in FY 19, an
Figure 2. Median current expenditures per pupil for states that reported data for public elementary and secondary independent charter school districts and noncharter and mixed school districts, by state: FY 19
$10,612
$8,536
$8,590
$11,523
$8,911
$13,191
$12,379
$23,183
$10,017
$6,820
$8,643
$12,061
$11,232
$15,820
$9,570
$13,107
$8,740
$13,079
$9,275
$16,735
$11,213
$8,689
$10,371
$7,940
$16,026
$14,175
$16,010
$17,695
$12,953
$9,278
$6,748
$14,721
$12,602
$10,178
$9,949
$13,363
$11,724
$21,078
$15,027
$22,406
$11,064
$9,226
$9,838
$11,624
$15,418
$17,645
$10,694
$12,171
$9,509
$10,425
$12,692
$20,280
$12,562
$10,310
$11,829
$9,987
$12,169
$15,911
$17,432
$11,437
$9,393
$10,452
$9,018
$14,200
0 5,000 10,000 15,000 20,000 25,000
Reporting states
Arizona
Arkansas
California
Colorado
Connecticut
Delaware
District of Columbia
Georgia
Idaho
Indiana
Louisiana
Maine
Massachusetts
Michigan
Minnesota
Mississippi
Missouri
Nevada
New Jersey
New Mexico
North Carolina
Ohio
Oklahoma
Oregon
Pennsylvania
Rhode Island
South Carolina
Tennessee
Texas
Utah
Washington
Current expenditures per pupil
Charter school districts Noncharter and mixed school districts
$
1
2
2
2
1 Reporting states includes only those states where data are available and reporting standards are met for both independent charter districts and noncharter and mixed school districts. 2 State funding or charter school policies exist within this state that may impact median current expenditures per pupil in independent charter school districts relative to noncharter and mixed school districts. NOTE: Charter school districts include local education agencies where all associated schools are charter schools. Noncharter and mixed school districts are school districts that have noncharter schools only and school districts that have both charter and noncharter schools, respectively. SOURCE: U.S. Department of Education, National Center for Education Statistics, Common Core of Data (CCD), “School District Finance Survey (F-33),” fiscal year 2019, Provisional Version 1a.

4
increase of 2.1 percent from FY 18. On a national basis, in the absence of any geographic cost adjustment, in FY 19 median current expenditures per pupil were $11,460 in cities, $13,622 in the suburbs, $11,172 in towns, and $12,375 in rural areas.
Median current expenditures per pupil in independent charter school districts were lower than median current expenditures per pupil in noncharter and mixed school districts in 23 out of the 31 states that met reporting standards for reporting finance data for independent charter school districts (table 4) (figure 2).
In FY 19, school districts received $60.0 billion from the federal government for public elementary and secondary education, which is an increase of 3.1 percent from the federal revenue received in FY 18, after adjusting for inflation (table 5; NCES 2021). In FY 19, Title I funds accounted for $14.6 billion, or 24.4 percent, of federal revenues for education, which is an increase of 0.4 percent from FY 18 after adjusting for inflation. Special education programs received $12.0 billion, or 20.0 percent, of federal education funding; child nutrition programs accounted for $17.1 billion, or 28.6 percent; and Impact Aid funds accounted for $1.8 billion, or 2.9 percent (derived from table 5) (figure 3).
Figure 3. Federal revenues received by local education agencies for public elementary and secondary education, by program: FY 19
Title I$14.6 billion
(U.S. Department of Education)
Special education$12.0 billion
(U.S. Department of Education)
Vocational education$0.6 billion
(U.S. Department of Education)
Child nutrition$17.1 billion
(U.S. Department of Agriculture)
Impact aid$1.8 billion
(U.S. Department of Education)
All other federal sources$13.8 billion
U.S. total for all reporting states: $60.0 billion(Federal agency administering program grants in parentheses)
NOTE: Child nutrition federal revenues include grants received under Child Nutrition Act programs (e.g., National School Lunch Act, School Breakfast Program, Special Milk Program). Special education federal revenues include revenues received under the Individuals with Disabilities Education Act (IDEA). Vocational education federal revenues include grants authorized by the Carl D. Perkins Career and Technical Improvement Act, as well as other grants directly related to vocational education. Title I revenues arise from Title I of the Elementary and Secondary Education Act of 1965 (ESEA), as reauthorized by the Every Student Succeeds Act (ESSA). The Impact Aid law (now Title VII of ESEA) provides assistance to local school districts with concentrations of children residing on Indian lands, military bases, low-rent housing properties, or other federal properties and, to a lesser extent, concentrations of children who have parents in the uniformed services or employed on eligible federal properties who do not live on federal property. “All other” federal revenues include federal grants for math and science, school safety, bilingual education, 21st Century Community Learning Centers programs, adult education, and other and unspecified federal revenues received through the state. “All other” also includes other federal revenues received directly by school districts, including federal grants for Indian education, Head Start, magnet schools, and gifted and talented programs, as well as all other direct federal grants. SOURCE: U.S. Department of Education, National Center for Education Statistics, Common Core of Data (CCD), “School District Finance Survey (F-33),” fiscal year 2019, Provisional Version 1a.
Figure 4. Percentage of total revenue from property taxes and
parent government contributions for public elementary and secondary school systems, by state: FY 19
NOTE: Property taxes include the tax revenues of “independent” school districts that are not fiscally and administratively dependent on another government entity. Parent government contributions include revenues for a dependent school system sourced from monies appropriated to that school system by its parent government. Most of these revenues are usually derived from property tax and other tax collections of the parent government; however, there are often nontax revenue contributions that parent governments transfer to their dependent school systems that cannot be isolated and reported separately from tax revenue contributions. SOURCE: U.S. Department of Education, National Center for Education Statistics, Common Core of Data (CCD), “School District Finance Survey (F-33),” fiscal year 2019, Provisional Version 1a.
5
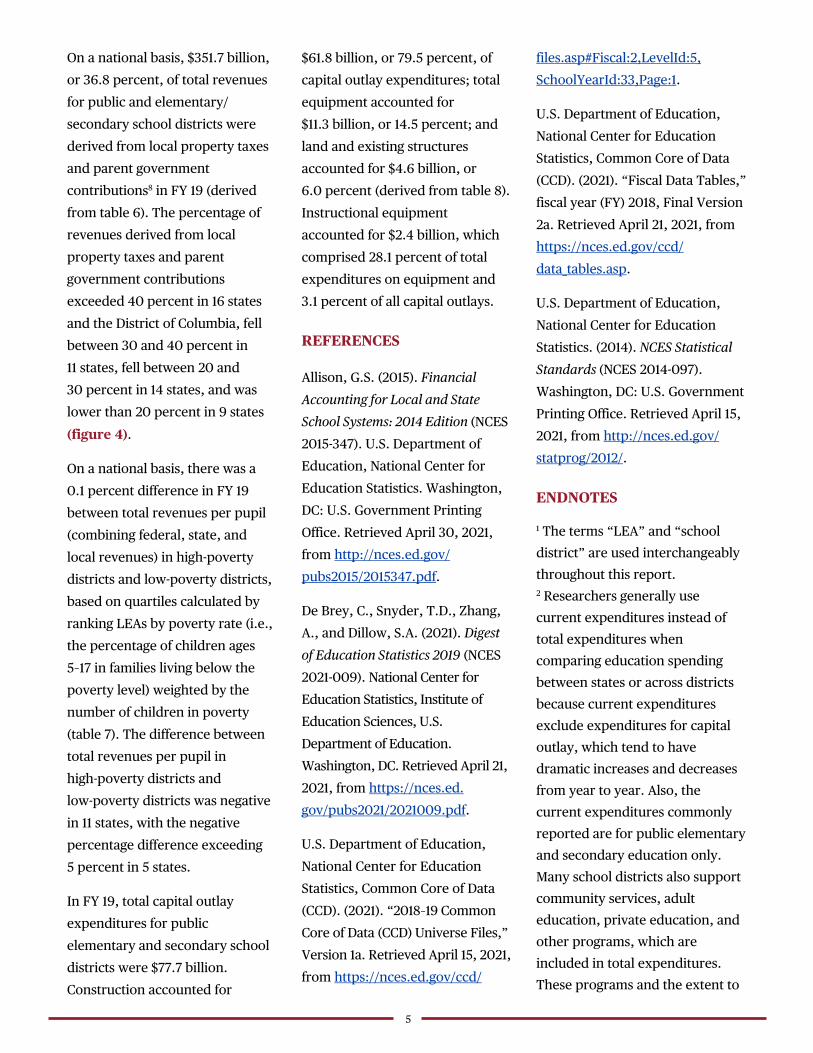
On a national basis, $351.7 billion, or 36.8 percent, of total revenues for public and elementary/ secondary school districts were derived from local property taxes and parent government contributions8 in FY 19 (derived from table 6). The percentage of revenues derived from local property taxes and parent government contributions exceeded 40 percent in 16 states and the District of Columbia, fell between 30 and 40 percent in 11 states, fell between 20 and 30 percent in 14 states, and was lower than 20 percent in 9 states (figure 4).
On a national basis, there was a 0.1 percent difference in FY 19 between total revenues per pupil (combining federal, state, and local revenues) in high-poverty districts and low-poverty districts, based on quartiles calculated by ranking LEAs by poverty rate (i.e., the percentage of children ages 5–17 in families living below the poverty level) weighted by the number of children in poverty (table 7). The difference between total revenues per pupil in high-poverty districts and low-poverty districts was negative in 11 states, with the negative percentage difference exceeding 5 percent in 5 states.
In FY 19, total capital outlay expenditures for public elementary and secondary school districts were $77.7 billion. Construction accounted for
$61.8 billion, or 79.5 percent, of capital outlay expenditures; total equipment accounted for $11.3 billion, or 14.5 percent; and land and existing structures accounted for $4.6 billion, or 6.0 percent (derived from table 8). Instructional equipment accounted for $2.4 billion, which comprised 28.1 percent of total expenditures on equipment and 3.1 percent of all capital outlays.
REFERENCES
Allison, G.S. (2015). Financial Accounting for Local and State School Systems: 2014 Edition (NCES 2015-347). U.S. Department of Education, National Center for Education Statistics. Washington, DC: U.S. Government Printing Office. Retrieved April 30, 2021, from http://nces.ed.gov/ pubs2015/2015347.pdf.
De Brey, C., Snyder, T.D., Zhang, A., and Dillow, S.A. (2021). Digest of Education Statistics 2019 (NCES 2021-009). National Center for Education Statistics, Institute of Education Sciences, U.S. Department of Education. Washington, DC. Retrieved April 21, 2021, from https://nces.ed. gov/pubs2021/2021009.pdf.
U.S. Department of Education, National Center for Education Statistics, Common Core of Data (CCD). (2021). “2018–19 Common Core of Data (CCD) Universe Files,” Version 1a. Retrieved April 15, 2021, from https://nces.ed.gov/ccd/
files.asp#Fiscal:2,LevelId:5, SchoolYearId:33,Page:1.
U.S. Department of Education, National Center for Education Statistics, Common Core of Data (CCD). (2021). “Fiscal Data Tables,” fiscal year (FY) 2018, Final Version 2a. Retrieved April 21, 2021, from https://nces.ed.gov/ccd/ data_tables.asp.
U.S. Department of Education, National Center for Education Statistics. (2014). NCES Statistical Standards (NCES 2014-097). Washington, DC: U.S. Government Printing Office. Retrieved April 15, 2021, from http://nces.ed.gov/ statprog/2012/.
ENDNOTES
1 The terms “LEA” and “school district” are used interchangeably throughout this report. 2 Researchers generally use current expenditures instead of total expenditures when comparing education spending between states or across districts because current expenditures exclude expenditures for capital outlay, which tend to have dramatic increases and decreases from year to year. Also, the current expenditures commonly reported are for public elementary and secondary education only. Many school districts also support community services, adult education, private education, and other programs, which are included in total expenditures. These programs and the extent to

6
which they are funded by school districts vary greatly both across and within states and school districts. 3 The term “F-33” is the form number utilized for the School District Finance Survey collection instrument. The School District Finance Survey is commonly called the F-33. 4 When reporting totals for a state, if information is missing for more than 20 percent of the school districts, NCES suppresses the totals for that state (NCES 2014). When reporting national totals, if information is missing for more than 15 percent of the school districts, NCES suppresses the national totals. For example, the national totals for the “Math and science” and “Bilingual education” federal revenue categories in table 5 of this report were suppressed because finances for these programs were reported as missing for over 15 percent of school districts nationally. At the state level, “Vocational education” revenues for New York and North Carolina in table 5 were suppressed because that federal revenue category was reported as missing for over 20 percent of school districts in those states. While some states were unable to report certain federal revenues within the program-specific categories as requested, finances missing from these categories were included in the “Other and unspecified federal revenues through state” and/or “Other federal revenues direct to school
districts” categories in table 5 as appropriate. 5 School district-level analyses and comparisons can be complicated by the variety of administrative structures that exist across the nation in school districts. States such as Florida, Maryland, Nevada, and West Virginia have large districts that serve entire counties and encompass all levels and types of public schools. School districts in other states may exist in small communities with only one school or in larger communities where all elementary schools are in one school district and all secondary schools are in another. In some states, all special education schools are administered by a few specific districts; in other states, each district may have all kinds of schools and programs. Additionally, some states have districts that perform specific administrative functions that support other districts (i.e., education service agencies). However, NCES does not currently have data that explain how much of services provided by special types of districts can be attributed to students enrolled in regular school districts. This variability in the types of school districts makes it difficult to compare expenditures across school districts. The analyses in this report do not take into account geographic cost differences across districts. 6 SEAs generally report LEA-level finance data in conformance with
Financial Accounting for Local and State School Systems: 2014 Edition (Allison 2015), the NCES handbook that provides guidance to SEAs and LEAs in establishing and maintaining their school financial accounting systems. 7 Whenever comparisons were made between FY 18 and FY 19 data, the FY 18 data were adjusted to FY 19 dollars. Inflation adjustments utilize the Consumer Price Index (CPI) published by the U.S. Department of Labor, Bureau of Labor Statistics. For comparability to fiscal education data, NCES adjusts the CPI from a calendar year to a school fiscal year basis (July through June). See Digest of Education Statistics 2019, table 106.70, https://nces.ed.gov/programs/ digest/d19/tables/dt19_106.70.asp, retrieved January 27, 2021. The FY 18 amount adjusted to FY 19 dollars is equal to the FY 18 amount multiplied by the 2018–19 CPI (253.268) and then divided by the 2017–18 CPI (248.126). 8 Property taxes include only the property tax revenues of independent school districts that are not fiscally and administratively dependent on another government entity. Parent government contributions are revenues for a dependent school system sourced from monies appropriated to that school system by its parent government (i.e., the city, county, or township government the school system is fiscally and administratively dependent on).

National Center for Education Statistics
7
Table 1. Total students, revenues by source, revenues per pupil, current expenditures, and current expenditures per pupil for the 100 largest public elementary and secondary school districts in the United States, by enrollment: FY 2018 and FY 2019
Total students
(fall member-
ship)1
Revenues by source
[in thousands of dollars] Revenues per pupil
Current expenditures [in thousands of dollars]
Current expenditures per pupil
Name of reporting district State Total Federal State Local
FY 18 (in
FY 19 dollars)2
FY 19 (in
FY 19 dollars)
Per-centage change
Total current3
Instruction and
instruction-related
FY 18 (in
FY 19 dollars)2
FY 19 (in
FY 19 dollars)
Per-centage change
New York City School District New York 960,484 $33,788,513 $1,959,483 $11,852,988 $19,976,042 $33,167 $35,179 6.1 $26,897,529 $20,240,098 $27,138 $28,004 3.2 Los Angeles Unified School District⁴ California 495,255 9,873,558 1,069,606 5,848,248 2,955,704 16,384 19,936 21.7 7,821,632 5,181,876 13,150 15,793 20.1 City of Chicago School District 299⁴ Illinois 359,476 6,643,153 691,325 2,303,111 3,648,717 17,786 18,480 3.9 5,604,768 3,918,915 14,427 15,591 8.1 Miami-Dade County Public School District⁴ Florida 350,434 3,907,249 451,377 1,175,143 2,280,729 10,983 11,150 1.5 3,465,030 2,429,839 9,740 9,888 1.5 Clark County School District⁴ Nevada 330,225 3,601,267 329,814 1,029,851 2,241,602 10,876 10,905 0.3 2,947,340 1,927,575 9,162 8,925 -2.6
Broward County School District⁴ Florida 270,978 2,917,311 330,416 1,100,761 1,486,134 10,475 10,766 2.8 2,639,252 1,782,621 9,639 9,740 1.0 Hillsborough County School District⁴ Florida 220,252 2,319,538 293,216 1,134,151 892,171 10,230 10,531 2.9 1,999,302 1,412,274 9,074 9,077 # Houston Independent School District 912⁴ Texas 209,772 2,889,281 324,848 417,277 2,147,156 12,766 13,773 7.9 2,080,000 1,178,816 9,702 9,916 2.2 Orange County Public Schools⁴ Florida 208,203 2,639,998 258,967 895,973 1,485,058 12,516 12,680 1.3 2,117,974 1,434,186 9,841 10,173 3.4 Palm Beach County School District⁴ Florida 192,533 2,431,148 217,917 606,930 1,606,301 12,533 12,627 0.8 1,995,850 1,385,490 10,371 10,366 -0.1
Fairfax County Public Schools Virginia 187,797 3,068,545 128,541 696,992 2,243,012 15,885 16,340 2.9 2,946,584 2,040,055 15,242 15,690 2.9 Hawaii Department of Education⁴ Hawaii 181,278 3,124,745 298,818 2,760,298 65,629 18,470 17,237 -6.7 2,924,319 1,793,132 15,558 16,132 3.7 Gwinnett County School District⁴ Georgia 179,758 2,174,582 150,077 1,025,006 999,499 11,823 12,097 2.3 1,995,144 1,223,172 10,506 11,099 5.6 Montgomery County Public Schools Maryland 162,680 3,336,163 122,677 925,208 2,288,278 21,734 20,508 -5.6 2,682,600 1,889,618 16,337 16,490 0.9 Wake County Schools North Carolina 161,784 1,604,813 105,390 970,675 528,748 9,409 9,919 5.4 1,519,907 1,061,637 9,082 9,395 3.4
Dallas Independent School District 905 Texas 155,119 2,219,554 334,912 218,562 1,666,080 12,939 14,309 10.6 1,546,200 989,043 10,161 9,968 -1.9 Charlotte-Mecklenburg Schools North Carolina 147,638 1,563,576 145,136 878,052 540,388 10,360 10,591 2.2 1,397,317 940,678 9,554 9,464 -0.9 Prince George’s County Public Schools⁴ Maryland 132,657 2,410,181 152,333 1,287,575 970,273 18,248 18,169 -0.4 2,093,623 1,358,669 15,651 15,782 0.8 Philadelphia School District Pennsylvania 132,520 3,605,815 355,468 1,661,857 1,588,490 26,576 27,210 2.4 2,124,676 1,001,769 16,375 16,033 -2.1 Duval County School District⁴ Florida 130,229 1,302,510 171,248 645,827 485,435 9,897 10,002 1.1 1,187,214 782,011 9,353 9,116 -2.5
Cypress-Fairbanks Independent School District 907 Texas 116,512 1,327,443 113,560 416,271 797,612 10,933 11,393 4.2 1,014,801 696,862 8,634 8,710 0.9 Baltimore County Public Schools Maryland 113,814 1,891,725 113,397 810,198 968,130 17,502 16,621 -5.0 1,653,293 1,097,723 14,415 14,526 0.8 Shelby County School District⁴ Tennessee 112,125 1,307,173 223,523 544,415 539,235 12,794 11,658 -8.9 1,278,727 823,218 11,273 11,404 1.2 Cobb County School District⁴ Georgia 111,854 1,428,994 84,135 549,114 795,745 12,252 12,776 4.3 1,206,287 847,059 10,583 10,784 1.9 Northside Independent School District 915 Texas 106,501 1,212,142 128,748 286,965 796,429 11,377 11,382 # 970,732 668,257 9,054 9,115 0.7
San Diego City Unified School District⁴ California 103,194 2,027,190 161,136 668,620 1,197,434 15,105 19,644 30.1 1,491,903 987,166 11,307 14,457 27.9 Polk County School District⁴ Florida 101,408 1,119,215 146,654 595,512 377,049 10,508 11,037 5.0 1,003,962 704,574 9,832 9,900 0.7 Pinellas County School District⁴ Florida 100,948 1,102,947 120,592 363,756 618,599 10,786 10,926 1.3 1,004,588 670,444 9,821 9,952 1.3 Dekalb County School District⁴ Georgia 99,166 1,383,737 119,568 556,239 707,930 13,361 13,954 4.4 1,253,086 821,366 12,046 12,636 4.9 Jefferson County School District Kentucky 97,936 1,479,791 141,051 608,017 730,723 15,152 15,110 -0.3 1,384,080 891,024 14,261 14,132 -0.9 See notes at end of table.

National Center for Education Statistics
8
Table 1. Total students, revenues by source, revenues per pupil, current expenditures, and current expenditures per pupil for the 100 largest public elementary and secondary school districts in the United States, by enrollment: FY 2018 and FY 2019—Continued
Total students
(fall member-
ship)1
Revenues by source
[in thousands of dollars] Revenues per pupil
Current expenditures [in thousands of dollars]
Current expenditures per pupil
Name of reporting district State Total Federal State Local
FY 18 (in
FY 19 dollars)2
FY 19 (in
FY 19 dollars)
Per-centage change
Total current3
Instruction and
instruction-related
FY 18 (in
FY 19 dollars)2
FY 19 (in
FY 19 dollars)
Per-centage change
Fulton County⁴ Georgia 94,491 1,389,273 81,352 384,950 922,971 13,915 14,703 5.7 1,127,515 719,888 11,860 11,933 0.6 Lee County School District⁴ Florida 94,410 1,083,759 127,919 318,525 637,315 10,954 11,479 4.8 911,720 594,388 9,880 9,657 -2.3 Denver School District 1⁴ Colorado 92,039 1,529,328 112,534 378,996 1,037,798 15,803 16,616 5.1 1,163,281 671,327 12,134 12,639 4.2 Prince William County Public Schools Virginia 90,843 1,266,254 67,590 539,709 658,955 13,700 13,939 1.7 1,051,979 681,487 11,736 11,580 -1.3 Albuquerque Public Schools⁴ New Mexico 89,788 1,072,664 114,897 757,050 200,717 11,719 11,947 1.9 887,004 545,702 9,218 9,879 7.2
Metro Nashville Public Schools⁴ Tennessee 84,667 1,212,827 127,516 315,521 769,790 13,392 14,325 7.0 1,048,203 660,145 12,248 12,380 1.1 Jefferson County School District No. R-1⁴ Colorado 84,646 1,079,752 44,892 433,249 601,611 11,235 12,756 13.5 908,285 550,923 9,959 10,730 7.8 Fort Worth Independent School District 905 Texas 84,510 989,632 118,825 352,237 518,570 11,762 11,710 -0.4 861,828 559,556 10,027 10,198 1.7 Anne Arundel County Public Schools⁴ Maryland 83,300 1,375,032 67,162 467,193 840,677 16,322 16,507 1.1 1,166,730 788,366 14,153 14,006 -1.0 Loudoun County Public Schools⁴ Virginia 81,906 1,286,828 27,154 371,846 887,828 15,269 15,711 2.9 1,227,456 862,880 14,502 14,986 3.3
Alpine School District Utah 81,715 709,831 35,490 419,320 255,021 8,430 8,687 3.0 576,475 413,963 6,784 7,055 4.0 Austin Independent School District 901⁴ Texas 80,032 1,709,746 124,487 90,377 1,494,882 19,342 21,363 10.4 844,178 520,840 10,536 10,548 0.1 Katy Independent School District 914 Texas 79,913 979,694 62,406 296,116 621,172 12,018 12,260 2.0 756,870 520,275 9,540 9,471 -0.7 Baltimore City Public Schools⁴ Maryland 79,297 1,691,994 162,921 953,404 575,669 19,459 21,337 9.7 1,259,867 854,806 16,121 15,888 -1.4 Greenville County School District⁴ South Carolina 76,158 957,121 65,609 471,322 420,190 12,301 12,568 2.2 758,954 465,915 9,913 9,966 0.5
Fort Bend Independent School District 907 Texas 76,122 861,776 68,770 252,005 541,001 11,170 11,321 1.4 714,575 459,296 9,593 9,387 -2.1 Milwaukee School District⁴ Wisconsin 75,431 1,202,208 183,476 717,319 301,413 16,615 15,938 -4.1 1,066,957 671,262 14,452 14,145 -2.1 Pasco County School Board⁴ Florida 75,048 778,523 76,345 416,604 285,574 10,197 10,374 1.7 665,650 427,798 8,872 8,870 # Davis County School District Utah 74,289 677,563 41,310 383,052 253,201 8,863 9,121 2.9 566,202 394,798 7,338 7,622 3.9 Brevard County School District⁴ Florida 73,734 786,947 76,659 347,175 363,113 10,536 10,673 1.3 673,211 467,819 9,024 9,130 1.2
Guilford County Schools North Carolina 72,950 774,726 89,639 446,715 238,372 10,232 10,620 3.8 736,495 480,469 9,809 10,096 2.9 Long Beach Unified School District California 72,935 1,205,677 107,709 782,564 315,404 15,608 16,531 5.9 960,887 666,252 12,364 13,175 6.6 Fresno Unified School District⁴ California 71,152 1,156,969 133,114 881,923 141,932 15,151 16,261 7.3 1,040,632 674,705 13,452 14,625 8.7 Virginia Beach City Public Schools⁴ Virginia 68,624 875,686 64,649 367,802 443,235 12,560 12,761 1.6 815,089 545,265 11,846 11,878 0.3 Osceola County School District⁴ Florida 68,554 788,507 89,366 364,800 334,341 10,773 11,502 6.8 606,107 424,246 8,580 8,841 3.1
Seminole County School District⁴ Florida 68,269 681,539 62,550 327,581 291,408 9,717 9,983 2.7 589,462 393,819 8,567 8,634 0.8 Douglas County School District Re 1⁴ Colorado 67,591 817,963 21,081 366,442 430,440 10,813 12,102 11.9 682,247 423,841 9,544 10,094 5.8 Washoe County School District⁴ Nevada 67,113 764,127 60,672 225,390 478,065 11,231 11,386 1.4 641,815 393,720 9,486 9,563 0.8 Aldine Independent School District 902 Texas 66,854 782,467 104,341 377,491 300,635 11,354 11,704 3.1 638,901 396,613 10,318 9,557 -7.4 Granite School District Utah 66,767 670,480 67,388 330,514 272,578 9,002 10,042 11.6 568,422 367,535 8,212 8,514 3.7 See notes at end of table.

National Center for Education Statistics
9
Table 1. Total students, revenues by source, revenues per pupil, current expenditures, and current expenditures per pupil for the 100 largest public elementary and secondary school districts in the United States, by enrollment: FY 2018 and FY 2019—Continued
Total students
(fall member-
ship)1
Revenues by source
[in thousands of dollars] Revenues per pupil
Current expenditures [in thousands of dollars]
Current expenditures per pupil
Name of reporting district State Total Federal State Local
FY 18 (in
FY 19 dollars)2
FY 19 (in
FY 19 dollars)
Per-centage change
Total current3
Instruction and
instruction-related
FY 18 (in
FY 19 dollars)2
FY 19 (in
FY 19 dollars)
Per-centage change
North East Independent School District 910 Texas 65,186 739,477 70,275 99,001 570,201 11,620 11,344 -2.4 603,295 399,255 9,179 9,255 0.8 Volusia County School District⁴ Florida 63,223 676,850 71,809 283,650 321,391 10,545 10,706 1.5 563,194 378,046 8,718 8,908 2.2 Elk Grove Unified School District⁴ California 63,100 870,167 61,857 616,202 192,108 12,508 13,790 10.2 792,375 544,125 11,386 12,557 10.3 Conroe Independent School District 902 Texas 62,837 677,820 44,566 154,707 478,547 10,470 10,787 3.0 534,224 352,614 8,553 8,502 -0.6 Mesa Unified School District Arizona 61,595 617,569 79,178 290,398 247,993 9,348 10,026 7.3 540,523 330,480 8,351 8,775 5.1
Chesterfield County Public Schools Virginia 61,552 726,164 41,754 350,221 334,189 11,430 11,798 3.2 624,288 436,238 10,091 10,142 0.5 Knox County School District⁴ Tennessee 60,854 585,069 54,688 228,426 301,955 9,463 9,614 1.6 563,307 374,513 9,034 9,257 2.5 Frisco Independent School District 905 Texas 60,182 706,680 23,319 88,898 594,463 11,630 11,742 1.0 514,844 357,159 8,223 8,555 4.0 Arlington Independent School District Texas 59,900 678,300 70,261 206,865 401,174 11,316 11,324 0.1 556,532 369,336 9,214 9,291 0.8 Howard County Public Schools Maryland 57,907 1,051,111 30,512 320,548 700,051 18,203 18,152 -0.3 931,371 671,994 15,918 16,084 1.0
El Paso Independent School District 902 Texas 57,315 651,290 85,791 331,275 234,224 10,817 11,363 5.0 567,724 373,725 9,894 9,905 0.1 Jordan School District Utah 56,176 484,645 27,991 270,901 185,753 8,194 8,627 5.3 405,543 276,858 6,790 7,219 6.3 Garland Independent School District 909 Texas 55,987 666,163 71,377 293,203 301,583 11,570 11,899 2.8 510,718 334,801 9,464 9,122 -3.6 Cherry Creek School District 5⁴ Colorado 55,839 756,696 28,630 341,544 386,522 12,742 13,551 6.4 652,650 466,826 11,044 11,688 5.8 Seattle School District 1 Washington 55,271 1,144,450 44,612 657,740 442,098 19,503 20,706 6.2 914,364 611,970 15,326 16,543 7.9
Clayton County School District Georgia 54,840 628,157 67,445 342,750 217,962 11,114 11,454 3.1 530,269 337,386 10,689 9,669 -9.5 Forsyth County-Winston Salem Schools North Carolina 54,707 546,292 62,955 340,246 143,091 9,847 9,986 1.4 540,502 379,155 9,706 9,880 1.8 Mobile County School District Alabama 53,967 585,972 79,975 334,434 171,563 10,497 10,858 3.4 538,156 311,605 9,698 9,972 2.8 Klein Independent School District 915 Texas 53,328 615,518 44,724 243,199 327,595 11,311 11,542 2.0 485,795 323,610 9,398 9,110 -3.1 Pasadena Independent School District 917 Texas 53,291 688,430 99,596 356,518 232,316 12,552 12,918 2.9 563,278 368,690 10,445 10,570 1.2
Omaha City School District 1 Nebraska 53,194 746,358 85,570 338,153 322,635 13,933 14,031 0.7 665,096 448,178 13,396 12,503 -6.7 Plano Independent School District 910 Texas 53,057 920,627 38,096 74,323 808,208 15,736 17,352 10.3 542,021 366,586 9,974 10,216 2.4 Corona Norco Unified School District California 53,002 715,896 37,910 467,514 210,472 12,902 13,507 4.7 617,884 422,656 11,208 11,658 4.0 San Francisco Unified School District⁴ California 52,498 1,182,117 46,051 423,188 712,878 17,306 22,517 30.1 904,446 637,955 13,495 17,228 27.7 Atlanta Public Schools⁴ Georgia 52,377 1,144,904 78,322 198,764 867,818 20,935 21,859 4.4 896,257 550,949 16,742 17,112 2.2
Lewisville Independent School District 902 Texas 52,218 705,789 39,650 70,601 595,538 12,496 13,516 8.2 494,316 331,649 9,989 9,466 -5.2 Henrico County Public Schools Virginia 51,523 659,450 47,124 283,288 329,038 12,105 12,799 5.7 529,023 352,535 10,157 10,268 1.1 Boston City Schools Massachusetts 51,433 1,463,463 82,318 395,652 985,493 31,238 28,454 -8.9 1,319,427 869,605 24,678 25,653 4.0 Cumberland County Schools North Carolina 50,879 504,008 74,055 316,600 113,353 9,483 9,906 4.5 487,820 329,948 9,175 9,588 4.5 Round Rock Independent School District 909 Texas 50,387 593,245 31,819 60,131 501,295 11,208 11,774 5.0 438,185 299,837 8,990 8,696 -3.3 See notes at end of table.

National Center for Education Statistics
10
Table 1. Total students, revenues by source, revenues per pupil, current expenditures, and current expenditures per pupil for the 100 largest public elementary and secondary school districts in the United States, by enrollment: FY 2018 and FY 2019—Continued
Total students
(fall member-
ship)1
Revenues by source
[in thousands of dollars] Revenues per pupil
Current expenditures [in thousands of dollars]
Current expenditures per pupil
Name of reporting district State Total Federal State Local
FY 18 (in
FY 19 dollars)2
FY 19 (in
FY 19 dollars)
Per-centage change
Total current3
Instruction and
instruction-related
FY 18 (in
FY 19 dollars)2
FY 19 (in
FY 19 dollars)
Per-centage change
Detroit Public Schools Community District Michigan 49,931 775,695 167,033 521,123 87,539 14,860 15,535 4.5 756,593 414,626 13,341 15,153 13.6 Wichita School District Kansas 49,885 686,934 75,461 483,334 128,139 13,698 13,770 0.5 590,236 355,141 11,914 11,832 -0.7 Charleston County School District⁴ South Carolina 49,769 939,765 68,141 291,187 580,437 18,237 18,883 3.5 592,963 357,232 11,788 11,914 1.1 Forsyth County School District Georgia 49,346 591,872 17,608 250,750 323,514 11,302 11,994 6.1 487,729 351,650 9,508 9,884 4.0 Manatee County School District⁴ Florida 49,301 605,012 58,234 183,022 363,756 11,315 12,272 8.5 505,260 333,176 9,377 10,248 9.3
District of Columbia Public Schools District of Columbia 49,065 1,526,358 132,899 0 1,393,459 31,928 31,109 -2.6 1,099,353 616,807 23,231 22,406 -3.5 San Bernardino City Unified School District⁴ California 49,005 824,781 85,655 649,547 89,579 14,521 16,831 15.9 770,072 500,221 13,338 15,714 17.8 Columbus City School District5 Ohio 48,925 941,998 93,582 250,633 597,783 19,103 19,254 0.8 795,467 470,382 15,782 16,259 3.0 San Antonio Independent School District 9074 Texas 48,745 670,947 140,838 224,834 305,275 13,973 13,764 -1.5 573,494 363,572 11,993 11,765 -1.9 Portland Public Schools⁴ Oregon 48,687 869,088 48,761 263,656 556,671 17,362 17,851 2.8 688,266 412,702 13,820 14,137 2.3 # Rounds to zero. 1 The student membership obtained from the Common Core of Data (CCD) fiscal district data collection may vary slightly from the student membership obtained from the CCD nonfiscal data collection. 2 Data have been adjusted to fiscal year 2019 dollars to account for inflation using the Consumer Price Index (CPI), which is published by the U.S. Department of Labor, Bureau of Labor Statistics. This price index measures the average change in inflation of a fixed market basket of goods and services purchased by consumers. 3 Current expenditures include funds spent operating local public schools and local education agencies, including such expenses as salaries for school personnel, student transportation, school books and materials, and energy costs, but excluding capital outlay, interest on school debt, payments to private schools, and payments to public charter schools. 4 The school district operates charter schools in addition to noncharter schools. 5 Revenues for Columbus City School District in Ohio have been adjusted in this table to eliminate double counting of state funding for independent charter school districts. Ohio accounts for state funding of independent charter school districts within both the revenues of those independent charter school districts and the revenues of the (noncharter) local school districts that charter school students reside in. SOURCE: U.S. Department of Education, National Center for Education Statistics, Common Core of Data (CCD), “School District Finance Survey (F-33),” fiscal year 2018, Final Version 2a and fiscal year 2019, Provisional Version 1a; Digest of Education Statistics 2019, retrieved January 27, 2021, from https://nces.ed.gov/programs/digest/d19/tables/dt19_106.70.asp.

National Center for Education Statistics
11
Table 2. Current expenditures and current expenditures per pupil of public elementary and secondary school systems, by region, state, and two largest school districts, by enrollment in each state: FY 2019
[in thousands of dollars]1
All functions2 Instruction and instruction-related2, 3 Support services2, 4 All other
functions2, 5
State and reporting district Total6, 7 Salaries and
wages Employee
benefits
Current expenditures
per pupil Total7 Salaries and
wages Employee
benefits Total7 Salaries and
wages Employee
benefits Total7 United States $657,443,206 $371,077,118 $161,563,463 $13,037 $427,767,919 $265,170,280 $115,224,029 $203,714,845 $94,656,115 $41,749,664 $25,960,442
Northeast
Connecticut 10,532,837 5,732,786 3,072,586 20,573 6,632,985 4,126,939 2,114,674 3,571,524 1,464,971 875,513 328,328 New Haven City Schools 403,241 198,389 124,421 19,134 258,488 146,835 93,469 127,040 43,668 25,958 17,713 Bridgeport City Schools 338,381 172,901 105,705 16,591 198,272 114,795 67,949 122,267 50,762 33,203 17,842
Maine 2,691,013 1,584,220 640,653 14,954 1,675,119 1,114,897 456,404 907,627 427,398 167,340 108,267 Portland City Schools 111,025 69,506 26,796 16,400 71,073 49,336 18,734 35,565 17,654 7,296 4,387 Lewiston City Schools 82,355 46,413 19,273 14,796 55,983 36,973 15,294 21,416 7,458 3,107 4,956
Massachusetts 16,925,219 10,439,518 4,220,571 17,785 11,448,642 7,693,332 3,301,840 4,982,834 2,406,993 853,253 493,743 Boston City Schools 1,319,427 813,384 316,580 25,653 869,605 600,906 255,035 395,936 189,904 56,446 53,886
Worcester 402,934 257,525 107,531 15,854 265,502 184,299 80,931 120,898 61,000 24,214 16,534
New Hampshire 2,965,030 1,575,301 763,669 16,660 1,949,193 1,169,799 569,832 943,731 379,414 185,568 72,106 Manchester City School District 178,046 94,446 48,045 13,167 127,262 76,302 38,961 44,960 15,956 7,894 5,824 Nashua City School District 160,500 92,196 40,131 14,293 107,067 67,416 29,809 48,672 22,655 9,601 4,761
New Jersey 28,558,567 15,291,321 8,307,646 20,371 17,546,996 10,438,346 5,741,715 10,109,695 4,551,137 2,486,717 901,876 Newark City School System 831,840 451,784 222,401 20,566 473,911 280,053 144,678 327,893 162,698 74,286 30,036 Jersey City School System 623,565 359,620 188,029 21,315 409,701 251,271 136,472 196,912 99,634 50,242 16,952
New York 64,263,892 34,169,099 18,105,212 23,806 46,131,611 26,859,760 14,753,819 16,797,199 6,442,595 3,250,473 1,335,082 New York City School District 26,897,529 12,535,679 7,773,759 28,004 20,240,098 10,629,339 6,920,333 6,079,998 1,401,137 849,925 577,433 Buffalo City School District 728,202 361,669 202,046 21,573 464,091 272,488 157,515 221,546 75,623 41,262 42,565
Pennsylvania 28,492,148 14,107,079 9,012,775 16,638 18,421,586 10,288,459 6,527,763 8,991,652 3,414,882 2,236,826 1,078,910 Philadelphia School District 2,124,676 815,269 552,376 16,033 1,001,769 547,028 356,986 552,560 234,079 168,260 570,347 Pittsburgh City School District 500,994 265,451 158,583 21,845 314,179 184,446 107,682 167,927 74,788 46,753 18,888
Rhode Island 2,444,185 1,398,770 646,914 17,056 1,518,432 1,001,492 447,446 860,837 394,321 198,615 64,916 Providence City Schools 413,461 222,906 117,066 17,260 240,470 159,195 76,873 155,260 63,078 40,039 17,731 Cranston City Schools 163,402 102,328 45,579 15,593 103,063 71,166 30,277 55,352 31,117 15,275 4,987
Vermont 1,754,500 974,741 444,724 20,019 1,115,503 677,606 319,780 586,979 282,003 118,953 52,018 Champlain Valley School District 78,566 48,816 21,928 18,447 51,687 33,767 16,050 24,416 13,992 5,422 2,463 Essex Westford School District 85,228 49,924 22,332 21,414 55,893 35,384 16,469 27,306 13,700 5,608 2,029 See notes at end of table.
National Center for Education Statistics
12
Table 2. Current expenditures and current expenditures per pupil of public elementary and secondary school systems, by region, state, and two largest school districts, by enrollment in each state: FY 2019—Continued
[in thousands of dollars]1
All functions2 Instruction and instruction-related2, 3 Support services2, 4 All other
functions2, 5
State and reporting district Total6, 7 Salaries and
wages Employee
benefits
Current expenditures
per pupil Total7 Salaries and
wages Employee
benefits Total7 Salaries and
wages Employee
benefits Total7
South Alabama 7,453,664 4,165,550 1,663,149 10,076 4,536,552 2,868,580 1,092,988 2,419,149 1,110,638 470,024 497,963 Mobile County School District 538,156 294,095 123,297 9,972 311,605 198,652 77,827 190,192 82,978 37,958 36,359 Jefferson County Board of Education 344,504 201,237 79,590 9,505 207,454 135,817 50,830 112,903 55,549 23,529 24,147
Arkansas 5,108,548 2,948,521 835,351 10,314 3,280,477 2,114,238 594,871 1,554,719 747,536 213,866 273,352 Little Rock School District 297,321 171,318 52,643 12,723 196,604 125,647 38,328 89,281 40,298 12,618 11,436 Springdale School District 50 230,392 146,134 41,394 9,867 156,088 106,588 30,203 61,371 35,067 9,965 12,933
Delaware 2,202,042 1,156,850 626,362 15,910 1,389,312 840,273 465,092 718,081 275,105 153,650 94,649 Redclay Consolidated School District 274,965 143,363 79,329 17,839 179,155 101,638 57,718 82,305 35,321 20,433 13,505 Christiana School District 312,544 160,704 91,442 22,578 185,341 114,924 65,231 118,112 41,698 25,461 9,091
District of Columbia8 1,956,989 1,228,586 263,975 22,115 1,054,203 774,532 175,945 832,654 450,809 87,449 70,132 District of Columbia Public Schools 1,099,353 753,686 148,355 22,406 616,807 487,837 98,663 440,123 264,650 49,469 42,423
Florida 27,268,525 14,929,386 4,829,350 9,580 18,406,860 10,417,667 3,226,677 7,452,712 3,837,993 1,346,225 1,408,953 Miami-Dade County Public School District 3,465,030 1,836,747 637,734 9,888 2,429,839 1,250,137 420,736 869,797 479,108 178,967 165,394 Broward County School District 2,639,252 1,394,802 442,182 9,740 1,782,621 935,573 289,196 744,860 377,354 126,672 111,771
Georgia 19,759,767 11,396,092 4,817,372 11,182 12,936,874 8,185,369 3,566,360 5,759,200 2,887,891 1,088,567 1,063,693 Gwinnett County School District 1,995,144 1,157,279 476,886 11,099 1,223,172 819,110 352,202 680,252 313,057 111,823 91,720 Cobb County School District 1,206,287 756,529 318,392 10,784 847,059 551,822 239,990 301,591 176,840 66,255 57,637
Kentucky 7,651,478 4,278,779 2,319,357 11,288 4,878,480 2,991,256 1,597,916 2,295,819 1,104,801 606,630 477,179 Jefferson County School District 1,384,080 838,824 421,545 14,132 891,024 572,355 285,813 425,312 238,858 121,039 67,744 Fayette County School District 538,780 313,526 161,577 12,832 362,567 219,925 128,059 151,044 82,570 28,434 25,169
Louisiana 8,382,028 4,406,051 2,173,440 11,785 5,096,014 3,074,703 1,486,427 2,833,144 1,180,828 598,333 452,870 Jefferson Parish School District 568,081 289,921 151,200 11,773 340,153 200,457 102,787 202,606 80,135 42,796 25,322 East Baton Rouge School District 569,845 291,022 134,167 14,012 327,430 200,583 91,203 209,324 77,445 35,964 33,091
Maryland 13,579,345 8,073,074 3,515,495 15,142 9,207,286 5,875,457 2,637,252 3,978,590 2,038,358 816,436 393,469 Montgomery County Public Schools 2,682,600 1,702,933 759,689 16,490 1,889,618 1,244,942 573,961 734,096 431,675 174,714 58,886 Prince George’s County Public Schools 2,093,623 1,258,784 520,843 15,782 1,358,669 875,887 356,601 663,135 356,634 154,646 71,819
Mississippi 4,383,214 2,564,487 870,067 9,300 2,678,233 1,792,402 590,879 1,435,969 691,735 238,107 269,012 Desoto County School System 264,490 161,129 52,255 7,690 166,788 113,788 36,215 84,283 43,620 14,153 13,419 Jackson Public Schools 237,674 142,796 53,005 9,930 138,727 93,612 32,699 81,469 44,408 17,689 17,478 See notes at end of table.
National Center for Education Statistics
13
Table 2. Current expenditures and current expenditures per pupil of public elementary and secondary school systems, by region, state, and two largest school districts, by enrollment in each state: FY 2019—Continued
[in thousands of dollars]1
All functions2 Instruction and instruction-related2, 3 Support services2, 4 All other
functions2, 5
State and reporting district Total6, 7 Salaries and
wages Employee
benefits
Current expenditures
per pupil Total7 Salaries and
wages Employee
benefits Total7 Salaries and
wages Employee
benefits Total7
North Carolina 15,130,109 9,305,554 3,372,061 9,746 10,014,374 6,783,623 2,418,652 4,394,964 2,221,836 831,892 720,771 Wake County Schools 1,519,907 993,006 361,197 9,395 1,061,637 750,821 266,516 411,228 217,920 83,999 47,042 Charlotte-Mecklenburg Schools 1,397,317 886,314 316,901 9,464 940,678 636,978 226,262 391,518 216,478 80,571 65,121
Oklahoma 6,401,954 3,506,593 1,205,465 9,160 3,875,359 2,418,447 839,237 2,114,516 963,109 316,131 412,079 Oklahoma City School District 89 366,465 199,360 83,824 9,765 220,092 136,998 56,303 120,976 53,784 21,484 25,397 Tulsa School District 1 392,911 224,467 72,419 10,761 226,062 138,815 44,142 140,873 73,453 24,233 25,976
South Carolina 8,893,076 4,821,633 1,986,071 11,390 5,516,136 3,366,833 1,363,204 2,931,226 1,316,370 546,386 445,714 Greenville County School District 758,954 448,975 189,059 9,966 465,915 306,242 126,996 240,103 128,903 53,428 52,936 Charleston County School District 592,963 321,480 130,548 11,914 357,232 227,201 93,429 202,569 76,154 29,350 33,162
Tennessee 9,923,815 5,873,090 1,973,126 9,862 6,612,259 4,339,105 1,479,469 2,793,159 1,296,050 424,077 518,397 Shelby County School District 1,278,727 743,256 211,879 11,404 823,218 535,122 162,108 383,400 174,543 44,380 72,109 Metro Nashville Public Schools 1,048,203 584,672 227,157 12,380 660,145 419,555 168,550 336,038 146,821 50,774 52,020
Texas 53,148,673 35,824,627 6,349,937 9,782 34,071,910 25,555,562 4,381,865 16,339,472 9,222,583 1,668,857 2,737,291 Houston Independent School District 912 2,080,000 1,214,328 249,216 9,916 1,178,816 836,586 159,966 782,980 335,112 75,126 118,204 Dallas Independent School District 905 1,546,200 1,099,724 184,052 9,968 989,043 764,149 128,824 452,459 292,674 45,269 104,698
Virginia 16,295,963 10,015,098 4,136,277 12,639 11,029,017 7,245,757 2,984,909 4,650,933 2,495,850 1,036,755 616,013 Fairfax County Public Schools 2,946,584 1,841,372 841,268 15,690 2,040,055 1,337,397 593,522 802,505 449,400 215,430 104,024 Prince William County Public Schools 1,051,979 688,706 241,088 11,580 681,487 474,123 166,475 323,449 192,084 66,264 47,043
West Virginia 3,250,382 1,780,739 914,408 12,129 1,990,953 1,174,671 595,222 1,063,080 505,013 281,821 196,349 Kanawha County School District 308,385 173,259 88,591 11,970 192,268 114,488 56,763 97,052 47,735 28,003 19,065 Berkeley County School District 219,064 123,912 59,968 11,217 131,733 81,590 38,544 72,742 36,591 18,844 14,589
Midwest Illinois 31,831,600 15,734,088 10,523,674 16,244 20,420,229 11,216,713 7,427,474 10,534,656 4,198,945 2,912,908 876,715 City of Chicago School District 299 5,604,768 2,524,799 1,475,718 15,591 3,918,915 1,857,694 1,203,979 1,475,105 574,448 231,773 210,748 School District U-46 (Elgin Area) 549,477 283,669 190,080 14,514 337,551 192,438 126,534 196,113 84,135 59,148 15,813
Indiana 10,808,646 5,923,994 3,150,773 10,242 6,608,416 4,048,165 2,145,666 3,695,992 1,639,688 936,704 504,238 Fort Wayne Community Schools 308,377 161,831 97,827 10,488 192,308 107,610 66,151 99,953 45,961 28,713 16,116 Indianapolis Public Schools 381,682 187,417 104,459 14,452 215,712 126,185 70,036 143,929 53,003 31,369 22,041
Iowa 6,130,173 3,887,092 1,320,235 11,907 4,068,632 2,814,311 936,416 1,810,234 956,826 342,435 251,307 Des Moines Independent Community School District 442,725 262,195 128,104 13,167 291,691 184,641 86,239 132,008 66,500 37,303 19,026 Cedar Rapids Community School District 208,884 144,619 38,466 12,495 141,737 104,660 26,229 58,724 33,212 10,866 8,423 See notes at end of table.

National Center for Education Statistics
14
Table 2. Current expenditures and current expenditures per pupil of public elementary and secondary school systems, by region, state, and two largest school districts, by enrollment in each state: FY 2019—Continued
[in thousands of dollars]1
All functions2 Instruction and instruction-related2, 3 Support services2, 4 All other
functions2, 5
State and reporting district Total6, 7 Salaries and
wages Employee
benefits
Current expenditures
per pupil Total7 Salaries and
wages Employee
benefits Total7 Salaries and
wages Employee
benefits Total7
Kansas 5,950,994 3,569,270 1,032,420 11,957 3,869,469 2,513,292 718,786 1,824,859 965,170 279,886 256,666 Wichita School District 590,236 363,789 129,862 11,832 355,141 245,933 88,877 208,059 106,688 38,090 27,036 Olathe Unified School District 233 351,644 218,005 71,021 11,713 226,718 157,845 52,103 110,948 55,407 16,569 13,978
Michigan 18,107,626 8,145,773 5,401,814 12,429 11,273,208 5,766,214 3,835,579 6,190,621 2,256,371 1,493,335 643,797 Detroit Public Schools Community District 756,593 333,863 179,273 15,153 414,626 228,176 123,565 302,282 95,898 50,912 39,685 Utica Comm School District 275,315 146,383 92,678 10,243 198,884 115,556 73,646 68,576 28,836 17,870 7,855
Minnesota 11,775,452 7,298,968 2,465,194 13,331 8,192,728 5,440,636 1,864,674 3,069,553 1,329,588 436,415 513,171 Anoka-Hennepin School District 11 502,696 330,327 108,220 12,955 373,290 254,703 86,790 109,980 51,979 14,107 19,426 St. Paul Public School District 599,459 387,336 150,068 16,251 420,953 274,430 109,535 150,851 76,260 26,334 27,655
Missouri 10,256,917 6,217,211 1,992,217 11,229 6,181,563 4,201,833 1,315,745 3,636,478 1,865,301 603,396 438,876 Springfield School District R-12 262,696 164,754 48,558 10,245 158,292 106,941 30,080 92,691 54,129 16,159 11,713 St. Louis Public Schools 329,958 161,100 79,369 15,126 173,553 110,985 53,872 139,817 49,183 23,285 16,588
Nebraska 4,154,150 2,436,824 904,898 12,736 2,713,591 1,809,216 677,446 1,264,951 566,134 206,839 175,608 Omaha City School District 1 665,096 375,175 158,448 12,503 448,178 289,602 121,598 187,161 76,456 33,148 29,757 Lincoln Public School District 1 494,320 311,905 106,171 11,764 327,767 223,851 73,305 146,038 81,155 29,132 20,515
North Dakota 1,593,722 959,543 354,528 13,999 1,013,880 679,473 258,118 463,179 233,309 82,965 116,663 Bismarck School District 1 161,433 104,269 39,404 12,221 108,948 74,616 28,399 42,861 23,806 8,954 9,624 Fargo School District 1 164,963 104,921 33,557 14,327 106,604 76,120 25,000 45,250 22,970 7,190 13,109
Ohio 22,523,580 12,668,559 4,932,852 13,294 14,154,833 8,809,390 3,274,645 7,647,169 3,502,180 1,498,053 721,578 Columbus City School District 795,467 463,174 197,442 16,259 470,382 291,927 118,104 296,935 156,605 72,399 28,150 Cleveland City School District 735,730 426,968 158,968 19,355 451,620 282,534 104,480 261,621 131,314 48,470 22,489
South Dakota 1,405,727 850,209 246,792 10,137 884,613 611,423 172,599 446,521 207,810 64,010 74,593 Sioux Falls School District 49-5 237,529 148,980 49,083 9,494 156,020 104,817 34,666 66,453 35,589 11,617 15,056 Rapid City Area School District 51-4 134,515 84,308 22,889 9,725 83,812 60,098 15,496 44,048 21,624 6,324 6,655
Wisconsin 10,730,869 5,884,201 2,600,605 12,487 6,896,349 4,324,695 1,869,567 3,448,071 1,390,479 667,281 386,449 Milwaukee School District 1,066,957 498,836 273,744 14,145 671,262 340,438 186,844 347,439 133,651 74,024 48,256 Madison Metropolitan School District 409,742 247,634 103,771 15,222 264,718 175,560 72,261 134,729 59,137 27,068 10,295 See notes at end of table.

National Center for Education Statistics
15
Table 2. Current expenditures and current expenditures per pupil of public elementary and secondary school systems, by region, state, and two largest school districts, by enrollment in each state: FY 2019—Continued
[in thousands of dollars]1
All functions2 Instruction and instruction-related2, 3 Support services2, 4 All other
functions2, 5
State and reporting district Total6, 7 Salaries and
wages Employee
benefits
Current expenditures
per pupil Total7 Salaries and
wages Employee
benefits Total7 Salaries and
wages Employee
benefits Total7 West Alaska 2,408,877 1,136,074 668,612 18,394 1,482,432 778,704 446,850 839,047 330,172 206,452 87,398 Anchorage School District 711,147 369,000 228,701 15,421 433,634 252,841 148,609 255,888 109,540 75,283 21,625 Matanuska Susitna Borough School District 282,217 141,784 82,032 14,989 169,353 97,254 56,104 105,994 41,839 24,717 6,870
Arizona 9,727,186 5,625,364 1,743,868 8,689 5,773,119 3,895,162 1,174,319 3,455,964 1,598,851 526,856 498,103 Mesa Unified School District 540,523 332,999 106,303 8,775 330,480 229,902 70,512 181,383 92,989 32,844 28,660 Chandler Unified School District 80 350,118 229,164 65,619 7,755 225,594 163,425 45,626 108,983 59,870 18,148 15,541
California 85,470,074 47,080,700 23,967,193 13,817 56,044,816 32,713,554 16,419,740 26,242,598 12,573,214 6,662,936 3,182,660 Los Angeles Unified School District 7,821,632 4,202,244 2,419,037 15,793 5,181,876 2,837,942 1,607,619 2,272,223 1,171,658 671,728 367,533 San Diego City Unified School District 1,491,903 809,742 531,984 14,457 987,166 553,504 365,573 441,971 233,527 153,072 62,766
Colorado 9,982,433 6,089,452 2,113,682 10,988 6,100,755 4,089,632 1,308,576 3,529,975 1,806,975 600,048 351,703 Denver School District 1 1,163,281 799,559 194,695 12,639 671,327 489,785 95,474 450,868 267,961 70,171 41,086 Jefferson County School District No. R-1 908,285 578,940 199,321 10,730 550,923 382,399 122,336 319,548 173,752 56,393 37,814
Hawaii 2,924,319 1,513,687 829,760 16,132 1,793,132 1,069,714 572,418 986,472 387,978 226,315 144,715 Hawaii Department of Education 2,924,319 1,513,687 829,760 16,132 1,793,132 1,069,714 572,418 986,472 387,978 226,315 144,715 Idaho 2,448,977 1,443,313 516,476 7,905 1,592,506 1,049,141 367,459 744,110 355,413 131,605 112,361 West Ada School District 2 274,041 169,481 57,389 6,816 184,578 128,346 42,919 78,791 37,202 12,794 10,672 Boise Independent School District 1 255,436 162,659 54,756 9,814 170,926 117,687 39,303 73,445 39,332 13,518 11,065
Montana 1,765,893 1,024,984 322,671 11,955 1,106,431 727,095 224,656 583,857 273,862 88,949 75,605 Billings Elem School District 2 115,375 72,877 25,558 10,074 80,439 55,601 19,234 34,936 17,276 6,323 0 Great Falls Elem School District 1 72,201 45,622 13,239 9,886 46,093 33,326 9,221 21,971 10,770 3,539 4,137
Nevada 4,511,595 2,624,312 1,083,685 9,158 2,884,606 1,834,938 750,579 1,445,644 744,770 313,712 181,345 Clark County School District 2,947,340 1,752,581 724,542 8,925 1,927,575 1,237,947 503,918 891,785 484,103 206,867 127,980 Washoe County School District 641,815 391,542 161,281 9,563 393,720 256,263 107,185 223,371 127,227 50,938 24,724
New Mexico 3,393,111 1,983,560 698,026 10,173 2,001,929 1,353,596 470,837 1,206,992 583,667 208,903 184,190 Albuquerque Public Schools 887,004 546,040 191,152 9,879 545,702 379,854 131,008 298,452 154,204 55,694 42,850 Las Cruces School District 232,780 140,909 52,380 9,423 142,398 95,947 36,028 77,046 40,486 14,630 13,336
Oregon 7,231,356 3,742,196 2,160,072 12,432 4,486,888 2,551,335 1,454,353 2,504,630 1,105,493 651,066 239,838 Portland Public Schools 688,266 388,565 180,226 14,137 412,702 257,101 121,177 256,447 122,679 54,374 19,117 Salem-Keizer Public Schools 503,698 270,885 166,656 12,038 339,370 196,560 118,875 147,861 72,681 46,860 16,467 See notes at end of table.

National Center for Education Statistics
16
Table 2. Current expenditures and current expenditures per pupil of public elementary and secondary school systems, by region, state, and two largest school districts, by enrollment in each state: FY 2019—Continued
[in thousands of dollars]1
All functions2 Instruction and instruction-related2, 3 Support services2, 4 All other
functions2, 5
State and reporting district Total6, 7 Salaries and
wages Employee
benefits
Current expenditures
per pupil Total7 Salaries and
wages Employee
benefits Total7 Salaries and
wages Employee
benefits Total7
Utah 5,338,183 3,061,379 1,366,637 7,885 3,601,522 2,179,982 977,315 1,480,522 757,747 342,955 256,139 Alpine School District 576,475 315,473 170,726 7,055 413,963 233,139 128,470 138,866 71,199 36,967 23,646 Davis County School District 566,202 326,376 154,344 7,622 394,798 232,756 112,067 145,596 81,420 37,149 25,808
Washington 16,026,532 9,746,272 3,703,907 14,255 10,623,653 6,887,481 2,557,968 4,846,816 2,665,565 1,051,393 556,063 Seattle School District 1 914,364 569,525 204,606 16,543 611,970 410,085 145,756 282,148 153,286 55,442 20,246 Lake Washington School District 414 406,089 248,651 90,433 13,238 282,049 183,602 65,435 111,700 63,058 24,064 12,340
Wyoming 1,528,251 882,548 396,859 16,221 984,253 615,480 272,006 496,469 250,388 115,783 47,529 Laramie County School District 1 220,906 127,272 57,709 15,435 142,679 88,975 39,041 71,140 36,251 17,122 7,087 Natrona County School District 1 193,778 112,633 58,159 14,480 132,571 80,832 40,812 55,575 30,091 16,069 5,632 1 Except current expenditures per pupil, which are presented in dollars. 2 Interschool system expenditures are excluded to prevent double counting. 3 Includes instruction and instructional staff support services current expenditures. 4 Includes student support services; operation and maintenance of plant; student transportation; general administration; school administration; and business, central, and other support services. 5 Includes food services and enterprise operations current expenditures. At the school district level, the amount also includes regional educational service agency (RESA) current expenditures made on behalf of the school district. 6 Current expenditures include funds spent operating local public schools and local education agencies, including such expenses as salaries for school personnel, student transportation, school books and materials, and energy costs, but excluding capital outlay, interest on school debt, payments to private schools, and payments to public charter schools. 7 In addition to salaries, wages, and employee benefits, the “Total” columns in this table include purchased services, supplies, and other miscellaneous current expenditures. 8 The “District of Columbia” totals include finances for public charter schools and other local education agencies in the District of Columbia not considered part of the District of Columbia Public Schools school district. NOTE: All local education agencies reported in the School District Finance Survey (F-33) are included within the national- and state-level amounts displayed in this table. For this table, the ranking of two largest school districts in each state by enrollment excludes independent charter school districts. SOURCE: US Department of Education, National Center for Education Statistics, Common Core of Data (CCD), “School District Finance Survey (F-33),” fiscal year 2019, Provisional Version 1a.

National Center for Education Statistics
17
Table 3. Amount and percentage change of median inflation-adjusted total revenues per pupil and current expenditures per pupil for public elementary and secondary school districts, by year, region, and locale code: FY 2018 and FY 2019
| Median inflation-adjusted total revenues per pupil
Median inflation-adjusted current expenditures1 per pupil
Region and locale code
FY 18 (in FY 19 dollars)2
FY 19 (in FY 19 dollars)
Percentage change
FY 18 (in FY 19 dollars)2
FY 19 (in FY 19 dollars)
Percentage change
United States $14,171 $14,347 1.2 $11,926 $12,162 2.0 City 12,284 12,666 3.1 11,078 11,460 3.4 Suburban 16,216 16,144 -0.4 13,594 13,622 0.2 Town 13,154 13,383 1.7 11,040 11,172 1.2 Rural 14,676 14,965 2.0 12,152 12,375 1.8
Northeast 21,451 21,948 2.3 18,262 18,675 2.3 City 17,632 18,204 3.2 15,504 16,033 3.4 Suburban 21,494 21,984 2.3 18,398 18,807 2.2 Town 21,065 21,380 1.5 17,998 18,302 1.7 Rural 22,552 23,295 3.3 18,765 19,487 3.8
South 11,647 11,947 2.6 10,189 10,342 1.5 City 11,574 11,711 1.2 10,363 10,348 -0.1 Suburban 11,444 11,687 2.1 9,869 9,910 0.4 Town 11,304 11,566 2.3 9,909 10,082 1.7 Rural 11,895 12,277 3.2 10,366 10,645 2.7
Midwest 14,039 14,131 0.7 11,594 11,687 0.8 City 11,990 11,925 -0.5 11,074 11,020 -0.5 Suburban 14,214 14,430 1.5 11,766 12,001 2.0 Town 13,533 13,529 # 11,110 11,133 0.2 Rural 14,559 14,636 0.5 11,881 11,988 0.9
West 13,671 13,982 2.3 11,816 12,252 3.7 City 11,255 12,561 11.6 10,011 11,433 14.2 Suburban 12,732 13,212 3.8 10,786 11,471 6.3 Town 13,326 13,917 4.4 11,330 11,822 4.3 Rural 16,145 16,838 4.3 13,923 14,480 4.0
# Rounds to zero.
1 Current expenditures include funds spent operating local public schools and local education agencies, including such expenses as salaries for school personnel, student transportation, school books and materials, and energy costs, but excluding capital outlay, interest on school debt, payments to private schools, payments to public charter schools, and nonelementary-secondary expenditures (such as adult education). 2 Data have been adjusted to fiscal year 2019 dollars to account for inflation using the Consumer Price Index (CPI), which is published by the U.S. Department of Labor, Bureau of Labor Statistics. This price index measures the average change in inflation of a fixed market basket of goods and services purchased by consumers. NOTE: Revenues for the Midwest region and the United States have been adjusted in this table to eliminate double counting of state funding for independent charter school districts. Ohio accounts for state funding of independent charter school districts within both the revenues of those independent charter school districts and the revenues of the (noncharter) local school districts that charter school students reside in. SOURCE: U.S. Department of Education, National Center for Education Statistics, Common Core of Data (CCD), “School District Finance Survey (F-33),” fiscal year 2018, Final Version 2a and fiscal year 2019, Provisional Version 1a; “Local Education Agency Universe Survey,” school year 2017–18, Final Version 2a and school year 2018–19, Provisional Version 1a; and Digest of Education Statistics 2019, retrieved January 27, 2021, from https://nces.ed.gov/programs/digest/d19/tables/dt19_106.70.asp.

National Center for Education Statistics
18
Table 4. Median current expenditures per pupil and numbers of districts and students for the states that have reported both public elementary and secondary noncharter school districts and independent charter school districts, by district type and state: FY 2019
Median current expenditures per pupil Number of districts by type Number of students1 by district type
Total Instruction and
instruction-related2 Support services3 Total Number reporting4 Total Number in reporting
districts4
State Independent
charter5 Noncharter and mixed6
Independent charter5
Noncharter and mixed6
Independent charter5
Noncharter and mixed6
Independent charter5
Noncharter and mixed6
Independent charter5
Noncharter and mixed6
Independent charter5
Noncharter and mixed6
Independent charter5
Noncharter and mixed6
Reporting states7 $10,612 $12,602 $6,204 $7,910 $4,021 $4,125 4,116 11,737 3,567 10,960 2,388,826 39,766,156 2,196,726 39,730,081
Alabama 9,828 ‡ 5,570 ‡ 3,796 ‡ 2 173 2 137 598 739,118 598 739,118 Arizona 8,536 10,178 4,607 5,722 3,435 3,891 441 248 423 219 207,970 911,455 207,737 910,148 Arkansas 8,590 9,949 4,813 6,284 3,758 3,043 27 252 27 234 18,883 476,408 18,883 476,018 California 11,523 13,363 6,912 8,513 4,031 4,279 1,045 1,066 936 960 511,608 5,613,762 487,515 5,612,684 Colorado 8,911 11,724 4,894 7,004 3,829 4,213 1 185 1 179 18,268 890,222 18,268 890,010
Connecticut 13,191 21,078 7,518 13,290 6,198 7,356 23 175 23 169 10,433 501,318 10,433 490,673 Delaware 12,379 15,027 7,235 9,861 5,030 4,457 25 19 23 19 16,086 122,319 16,086 122,319 District of Columbia 23,183 22,406 11,608 12,571 10,537 8,970 58 1 54 1 39,344 49,065 37,375 49,065 Georgia 10,017 11,064 5,690 7,127 3,606 3,170 29 187 29 179 31,090 1,735,939 31,090 1,735,093 Idaho 6,820 9,226 4,569 5,872 1,950 2,849 52 120 46 113 20,492 289,320 20,492 289,243
Illinois — 14,257 — 8,680 — 4,919 9 948 0 852 4,025 1,955,351 † 1,952,193 Indiana 8,643 9,838 4,682 5,935 3,382 3,459 104 311 103 295 49,813 1,005,538 49,813 1,004,705 Louisiana 12,061 11,624 6,659 7,055 4,790 3,887 123 81 118 76 68,866 642,369 68,866 641,472 Maine 11,232 15,418 6,556 9,253 4,799 5,111 9 204 9 191 2,453 177,231 2,453 177,214 Massachusetts 15,820 17,645 11,734 11,859 4,389 5,247 82 325 82 322 46,954 904,677 46,954 904,577
Michigan 9,570 10,694 5,036 6,917 4,133 3,213 301 597 290 537 146,653 1,310,226 145,194 1,310,029 Minnesota8 13,107 12,171 8,427 8,118 4,064 3,307 173 372 164 331 59,482 823,812 59,482 823,441 Mississippi 8,740 9,509 5,170 5,769 3,813 3,170 5 150 5 144 1,607 469,691 1,607 469,555 Missouri8 13,079 10,425 6,877 6,275 5,811 3,596 36 528 36 517 24,228 889,213 24,228 887,660 Nevada 9,275 12,692 4,867 7,507 4,039 4,682 2 19 2 18 43,845 448,795 43,845 448,735
New Hampshire — 19,259 — 12,075 — 6,379 27 165 0 161 3,934 174,038 † 169,653 New Jersey 16,735 20,280 9,207 12,817 6,608 7,039 88 598 87 564 52,038 1,349,897 51,853 1,349,170 New Mexico 11,213 12,562 5,600 6,942 4,380 4,862 52 95 51 89 14,340 319,197 14,340 318,845 New York — 22,947 — 15,629 — 6,739 292 767 0 682 146,438 2,552,997 † 2,551,508 North Carolina 8,689 10,310 5,378 6,680 3,019 2,975 200 125 184 122 110,464 1,442,033 110,402 1,441,838
Ohio 10,371 11,829 5,728 7,598 3,929 3,819 321 669 317 617 107,324 1,586,981 107,235 1,586,402 Oklahoma 7,940 9,987 4,872 5,893 2,816 3,277 30 515 30 512 38,425 660,466 38,425 660,161 Oregon8 16,026 12,169 9,343 7,593 6,119 4,180 19 180 19 177 4,307 576,549 4,307 575,324 Pennsylvania 14,175 15,911 8,246 9,846 5,413 4,672 180 575 177 500 143,259 1,569,262 142,523 1,569,038 Rhode Island 16,010 17,432 8,005 10,892 7,627 6,180 20 41 20 39 8,427 134,874 8,427 134,822 See notes at end of table.

National Center for Education Statistics
19
Table 4. Median current expenditures per pupil and numbers of districts and students for the states that have reported both public elementary and secondary noncharter school districts and independent charter school districts, by district type and state: FY 2019—Continued
Median current expenditures per pupil Number of districts by type Number of students1 by district type
Total Instruction and
instruction-related2 Support services3 Total Number reporting4 Total Number in reporting
districts4
State Independent
charter5 Noncharter and mixed6
Independent charter5
Noncharter and mixed6
Independent charter5
Noncharter and mixed6
Independent charter5
Noncharter and mixed6
Independent charter5
Noncharter and mixed6
Independent charter5
Noncharter and mixed6
Independent charter5
Noncharter and mixed6
South Carolina 17,695 11,437 14,296 6,934 3,243 3,826 2 98 2 83 28,704 752,080 28,704 751,467 Tennessee 12,953 9,393 5,586 6,289 7,120 2,546 1 146 1 142 449 1,005,860 449 1,005,049 Texas 9,278 10,452 5,364 6,515 3,383 3,390 183 1,026 179 1,022 316,869 5,116,602 316,869 5,115,041 Utah 6,748 9,018 4,316 5,847 2,088 2,540 116 42 113 41 78,299 598,732 78,299 598,470 Washington 14,721 14,200 7,520 9,165 5,456 4,533 12 310 12 295 3,352 1,120,929 3,352 1,119,511 Wisconsin ‡ 12,466 ‡ 7,934 ‡ 4,037 26 424 2 421 9,499 849,830 622 849,830 — Not available. † Not applicable. ‡ Reporting standards not met. Data were suppressed when the unweighted response rate was below 80 percent for a state or 85 percent for the reporting states total. 1 The student membership obtained from the Common Core of Data (CCD) fiscal district data collection may vary slightly from the student membership obtained from the CCD nonfiscal data collection. 2 Includes instruction and instructional staff support services current expenditures. 3 Includes student support services; operation and maintenance of plant; student transportation; general administration; school administration; business, central, and other support services. 4 Includes school districts that reported fiscal data greater than or equal to zero and student membership greater than zero. 5 All associated schools are charter schools. 6 Includes 11,222 school districts that have noncharter schools only (noncharter districts) and 515 school districts that have both charter and noncharter schools (mixed districts). Among these districts, 10,459 noncharter districts and 501 mixed districts reported data. 7 Reporting states include only the states that reported independent charter school districts. 8 State funding or charter school policies exist within this state that may impact median current expenditures per pupil in independent charter school districts relative to noncharter and mixed school districts. SOURCE: U.S. Department of Education, National Center for Education Statistics, Common Core of Data (CCD), “School District Finance Survey (F-33),” fiscal year 2019, Provisional Version 1a.

National Center for Education Statistics
20
Table 5. Federal revenues received by local education agencies for public elementary and secondary education, by program and state: FY 2019
[in thousands of dollars]
State Total Title I Special
education1 Math and
science2 School safety3
Vocational education4
Child nutrition5
Bilingual education6
Other and unspecified
federal revenues
through state7 Impact aid
Other federal revenues direct to
school districts8
United States9 $59,963,349 $14,637,855 $12,017,014 ‡ ‡ $579,330 $17,144,844 ‡ $8,881,543 $1,768,009 ‡
Alabama 868,475 ‡ ‡ ‡ ‡ ‡ ‡ ‡ ‡ ‡ ‡ Alaska 391,955 58,864 38,190 $8,955 $2,632 3,904 51,037 $968 34,547 152,189 $40,669 Arizona 1,424,444 292,583 167,162 28,976 17,293 22,440 369,306 10,685 279,919 220,486 15,594 Arkansas 621,306 158,642 137,707 19,479 7 7,175 199,179 3,602 68,563 — 26,952 California 8,414,469 1,972,841 1,938,374 221,227 1,240 50,023 2,246,043 136,355 1,283,121 156,811 408,434
Colorado 723,783 155,737 157,489 22,367 96 6,963 198,372 8,542 84,680 54,623 34,914 Connecticut 525,559 134,210 121,053 17,382 — 6,708 159,279 5,757 37,226 — 43,944 Delaware 159,757 51,206 33,740 — 34 3,855 49,938 — 20,984 — — District of Columbia 206,886 50,932 17,596 9,969 8,314 4,312 45,697 1,079 34,914 34,063 10 Florida 3,454,539 866,859 646,049 81,613 — 37,724 1,143,618 — 437,935 11,633 229,108
Georgia 1,892,524 562,432 331,270 55,228 ‡ 16,719 724,303 14,163 122,804 20,910 ‡ Hawaii 298,818 48,796 42,499 174 2,427 2,225 56,952 4,371 69,893 55,858 15,623 Idaho 264,580 59,266 53,787 8,984 4,614 3,359 76,783 1,914 36,616 8,399 10,858 Illinois 2,332,899 637,389 558,922 70,854 14,659 26,998 604,071 26,192 295,945 30,327 ‡ Indiana 1,031,343 271,882 261,581 5,547 343 11,037 341,117 ‡ 122,766 1,394 ‡
Iowa 501,868 97,680 130,534 14,239 405 4,723 144,187 4,738 91,179 389 13,794 Kansas 579,729 104,465 — — — 1,865 152,398 3,616 244,869 64,259 8,257 Kentucky 954,442 235,620 156,498 27,905 310 7,373 355,155 3,790 107,092 ‡ ‡ Louisiana 1,163,812 321,966 174,335 44,734 10,693 9,139 349,629 3,769 180,150 9,673 59,724 Maine 186,294 52,327 49,310 7,943 68 2,703 48,260 717 14,750 2,968 7,248
Maryland 907,252 217,843 200,847 29,190 — 7,689 269,127 9,367 63,989 18,564 90,636 Massachusetts 868,859 185,282 245,915 ‡ ‡ 12,053 194,597 ‡ 197,780 — ‡ Michigan 1,752,929 436,058 413,181 59,683 166 19,872 447,140 4,365 185,867 9,247 177,350 Minnesota 740,136 164,313 181,251 25,377 1,237 6,223 219,834 — 82,123 33,147 26,631 Mississippi 683,274 202,022 114,372 ‡ 5,585 5,702 239,723 1,381 76,699 2,467 ‡
Missouri 953,381 235,040 187,815 32,849 9,514 13,287 286,660 4,498 117,258 32,801 ‡ Montana 258,170 61,940 36,683 4,756 — 2,693 40,810 ‡ 19,115 84,027 8,146 Nebraska 331,243 68,911 75,278 6,031 ‡ 3,734 99,074 2,536 19,455 24,398 31,826 Nevada 469,065 135,940 76,765 10,707 3,109 6,470 143,983 6,482 64,083 7,602 13,924 New Hampshire 164,963 38,188 39,182 ‡ ‡ 3,610 28,980 ‡ 52,002 ‡ ‡
New Jersey 1,384,290 384,505 359,030 ‡ ‡ 10,521 382,064 ‡ 221,121 23,233 ‡ New Mexico 521,927 95,913 73,902 14,878 ‡ 3,162 2,486 4,730 137,187 113,567 76,102 New York 3,680,534 ‡ ‡ ‡ ‡ ‡ ‡ ‡ ‡ ‡ ‡ North Carolina 1,627,439 443,196 337,825 46,657 ‡ ‡ 526,677 14,292 77,516 20,927 160,349 North Dakota 195,994 39,809 31,920 7,857 3,334 2,506 26,621 503 15,916 32,951 34,577 See notes at end of table.
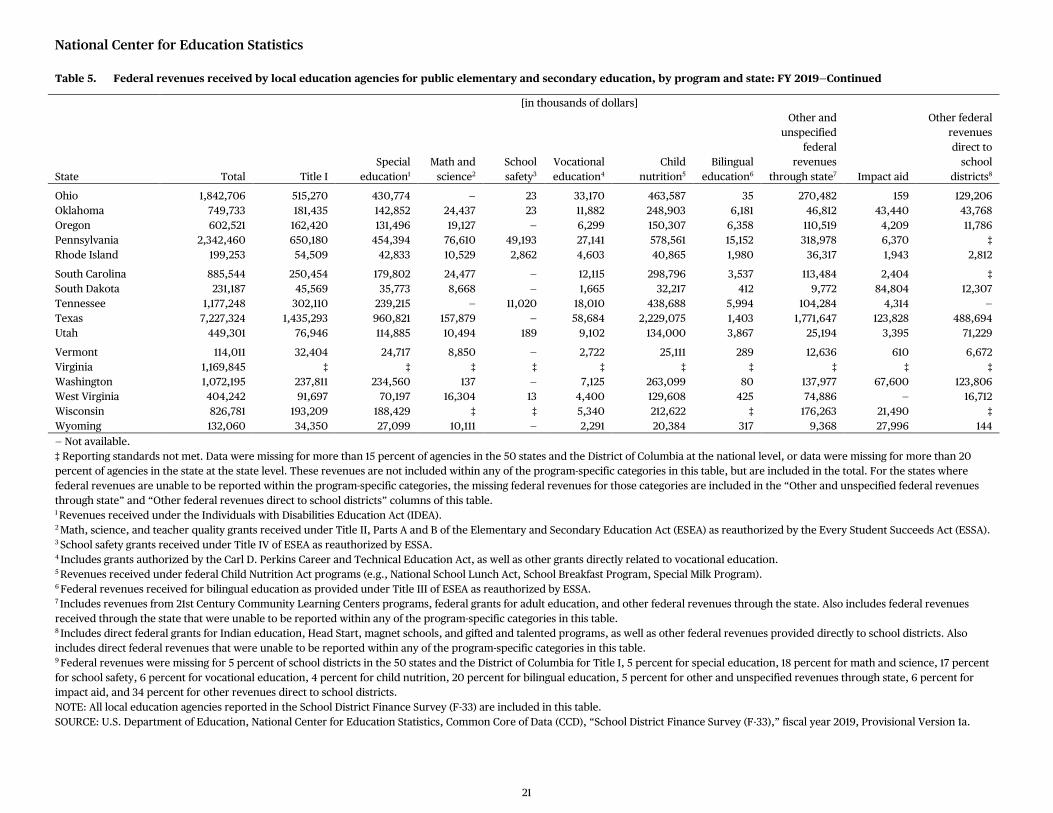
National Center for Education Statistics
21
Table 5. Federal revenues received by local education agencies for public elementary and secondary education, by program and state: FY 2019—Continued
[in thousands of dollars]
State Total Title I Special
education1 Math and
science2 School safety3
Vocational education4
Child nutrition5
Bilingual education6
Other and unspecified
federal revenues
through state7 Impact aid
Other federal revenues direct to
school districts8
Ohio 1,842,706 515,270 430,774 — 23 33,170 463,587 35 270,482 159 129,206 Oklahoma 749,733 181,435 142,852 24,437 23 11,882 248,903 6,181 46,812 43,440 43,768 Oregon 602,521 162,420 131,496 19,127 — 6,299 150,307 6,358 110,519 4,209 11,786 Pennsylvania 2,342,460 650,180 454,394 76,610 49,193 27,141 578,561 15,152 318,978 6,370 ‡ Rhode Island 199,253 54,509 42,833 10,529 2,862 4,603 40,865 1,980 36,317 1,943 2,812
South Carolina 885,544 250,454 179,802 24,477 — 12,115 298,796 3,537 113,484 2,404 ‡ South Dakota 231,187 45,569 35,773 8,668 — 1,665 32,217 412 9,772 84,804 12,307 Tennessee 1,177,248 302,110 239,215 — 11,020 18,010 438,688 5,994 104,284 4,314 — Texas 7,227,324 1,435,293 960,821 157,879 — 58,684 2,229,075 1,403 1,771,647 123,828 488,694 Utah 449,301 76,946 114,885 10,494 189 9,102 134,000 3,867 25,194 3,395 71,229
Vermont 114,011 32,404 24,717 8,850 — 2,722 25,111 289 12,636 610 6,672 Virginia 1,169,845 ‡ ‡ ‡ ‡ ‡ ‡ ‡ ‡ ‡ ‡ Washington 1,072,195 237,811 234,560 137 — 7,125 263,099 80 137,977 67,600 123,806 West Virginia 404,242 91,697 70,197 16,304 13 4,400 129,608 425 74,886 — 16,712 Wisconsin 826,781 193,209 188,429 ‡ ‡ 5,340 212,622 ‡ 176,263 21,490 ‡ Wyoming 132,060 34,350 27,099 10,111 — 2,291 20,384 317 9,368 27,996 144 — Not available. ‡ Reporting standards not met. Data were missing for more than 15 percent of agencies in the 50 states and the District of Columbia at the national level, or data were missing for more than 20 percent of agencies in the state at the state level. These revenues are not included within any of the program-specific categories in this table, but are included in the total. For the states where federal revenues are unable to be reported within the program-specific categories, the missing federal revenues for those categories are included in the “Other and unspecified federal revenues through state” and “Other federal revenues direct to school districts” columns of this table. 1 Revenues received under the Individuals with Disabilities Education Act (IDEA). 2 Math, science, and teacher quality grants received under Title II, Parts A and B of the Elementary and Secondary Education Act (ESEA) as reauthorized by the Every Student Succeeds Act (ESSA). 3 School safety grants received under Title IV of ESEA as reauthorized by ESSA. 4 Includes grants authorized by the Carl D. Perkins Career and Technical Education Act, as well as other grants directly related to vocational education. 5 Revenues received under federal Child Nutrition Act programs (e.g., National School Lunch Act, School Breakfast Program, Special Milk Program). 6 Federal revenues received for bilingual education as provided under Title III of ESEA as reauthorized by ESSA. 7 Includes revenues from 21st Century Community Learning Centers programs, federal grants for adult education, and other federal revenues through the state. Also includes federal revenues received through the state that were unable to be reported within any of the program-specific categories in this table. 8 Includes direct federal grants for Indian education, Head Start, magnet schools, and gifted and talented programs, as well as other federal revenues provided directly to school districts. Also includes direct federal revenues that were unable to be reported within any of the program-specific categories in this table. 9 Federal revenues were missing for 5 percent of school districts in the 50 states and the District of Columbia for Title I, 5 percent for special education, 18 percent for math and science, 17 percent for school safety, 6 percent for vocational education, 4 percent for child nutrition, 20 percent for bilingual education, 5 percent for other and unspecified revenues through state, 6 percent for impact aid, and 34 percent for other revenues direct to school districts. NOTE: All local education agencies reported in the School District Finance Survey (F-33) are included in this table. SOURCE: U.S. Department of Education, National Center for Education Statistics, Common Core of Data (CCD), “School District Finance Survey (F-33),” fiscal year 2019, Provisional Version 1a.

National Center for Education Statistics
22
Table 6. Total revenue, local revenue by source, and percentages of total revenue from property taxes and parent government contributions for public elementary and secondary school districts, by state: FY 2019
[in thousands of dollars] 1
State Total
revenue2 Total local
revenue Property taxes3
Percentage of total revenue
from property tax
Other taxes3, 4
Revenue from cities and counties Fees
Parent government
contributions
Percentage of total revenue
from parent government
contributions
Percentage of total revenue from
property taxes and parent government
contributions Other local
revenue5 United States $773,299,649 $351,709,054 $221,093,607 28.6 $10,457,675 $11,274,826 $15,748,763 $63,251,955 8.2 36.8 $29,882,228
Alabama 8,431,948 2,855,603 1,294,844 15.4 5,267 892,535 344,339 † † 15.4 318,618 Alaska 2,557,462 565,608 † † † 0 29,273 503,096 19.7 19.7 33,239 Arizona 11,544,366 4,471,412 3,422,198 29.6 0 295,351 312,779 0 0.0 29.6 441,084 Arkansas 5,762,118 2,219,282 498,674 8.7 1,385 15,805 166,426 † † 8.7 1,536,992 California 100,955,024 34,244,031 24,467,615 24.2 658,933 2,247,728 1,184,419 1,178,035 1.2 25.4 4,507,301
Colorado 12,433,259 6,285,283 5,131,026 41.3 10,560 28,554 542,899 † † 41.3 572,244 Connecticut 12,149,385 7,029,450 0 0.0 0 489,967 104,031 6,394,599 52.6 52.6 40,853 Delaware 2,419,233 662,178 625,276 25.8 0 0 17,673 † † 25.8 19,229 District of Columbia 2,577,124 2,370,238 † † † 921,662 18,078 1,370,149 53.2 53.2 60,349 Florida 31,675,060 16,016,503 12,525,128 39.5 1,054,688 0 1,222,031 † † 39.5 1,214,656
Georgia 22,740,394 10,533,712 6,764,878 29.7 2,045,292 483,844 562,546 † † 29.7 677,152 Hawaii 3,124,745 65,629 † † † 0 43,711 0 0.0 0.0 21,918 Idaho 2,853,744 699,818 584,203 20.5 0 105 43,013 † † 20.5 72,497 Illinois 37,092,884 20,372,951 17,816,752 48.0 0 322,422 652,543 † † 48.0 1,581,234 Indiana 13,606,511 4,079,397 2,921,256 21.5 2,855 327,427 335,727 † † 21.5 492,132
Iowa 7,267,433 2,929,365 2,387,121 32.8 185,213 4,543 179,364 † † 32.8 173,124 Kansas 6,889,523 1,881,070 1,205,409 17.5 0 133,634 156,035 † † 17.5 385,992 Kentucky 8,703,843 2,935,325 2,215,625 25.5 460,427 32,309 93,167 † † 25.5 133,797 Louisiana 9,320,699 4,141,314 1,749,305 18.8 2,001,891 65,257 62,147 0 0.0 18.8 262,714 Maine 3,052,929 1,662,150 847,504 27.8 0 19,426 42,907 723,497 23.7 51.5 28,816
Maryland 16,068,657 8,324,659 † † † 0 116,793 7,790,988 48.5 48.5 416,878 Massachusetts 19,106,756 10,719,394 0 0.0 0 1,511,567 451,809 8,439,600 44.2 44.2 316,418 Michigan 21,550,671 6,938,190 5,834,156 27.1 † 34,173 606,172 † † 27.1 463,689 Minnesota 14,328,623 4,153,302 2,641,119 18.4 0 245,208 610,291 † † 18.4 656,684 Mississippi 4,884,674 1,784,320 1,477,553 30.2 17,532 28,177 158,103 2,745 0.1 30.3 100,210
Missouri 12,118,746 7,281,878 4,592,850 37.9 251,797 267,268 448,230 † † 37.9 1,721,733 Montana 2,024,649 903,885 603,350 29.8 0 174,596 60,189 † † 29.8 65,750 Nebraska 4,650,340 2,817,544 2,298,225 49.4 204,863 43,833 161,295 † † 49.4 109,328 Nevada 5,407,804 3,078,728 1,334,795 24.7 6,010 3,214 38,239 † † 24.7 1,696,470 New Hampshire 3,274,308 2,102,546 1,691,249 51.7 0 180 51,516 321,215 9.8 61.5 38,386
New Jersey 31,994,290 16,972,081 14,575,138 45.6 0 332,469 644,702 1,083,904 3.4 48.9 335,868 New Mexico 4,107,107 798,456 633,208 15.4 0 1,954 58,517 † † 15.4 104,777 New York 76,162,667 42,242,579 19,708,311 25.9 34,481 285,074 455,030 18,528,698 24.3 50.2 3,230,985 North Carolina 16,211,083 4,519,625 † † † 322,847 266,766 3,459,638 21.3 21.3 470,374 North Dakota 1,869,592 651,327 468,101 25.0 0 45,590 74,924 † † 25.0 62,712 See notes at end of table.

National Center for Education Statistics
23
Table 6. Total revenue, local revenue by source, and percentages of total revenue from property taxes and parent government contributions for public elementary and secondary school districts, by state: FY 2019—Continued
[in thousands of dollars] 1
State Total
revenue2 Total local
revenue Property taxes3
Percentage of total revenue
from property tax
Other taxes3, 4
Revenue from cities and counties Fees
Parent government
contributions
Percentage of total revenue
from parent government
contributions
Percentage of total revenue from
property taxes and parent government
contributions Other local
revenue5
Ohio6 25,717,632 13,292,286 10,652,562 41.4 524,339 200,428 1,093,819 † † 41.4 821,138 Oklahoma 7,285,966 2,945,338 2,238,690 30.7 13,260 183,812 326,256 † † 30.7 183,320 Oregon 8,869,869 3,669,866 2,938,235 33.1 0 159,583 184,704 † † 33.1 387,344 Pennsylvania 33,562,538 18,588,114 14,478,226 43.1 2,658,170 68,486 454,354 † † 43.1 928,878 Rhode Island 2,682,112 1,333,888 120,974 4.5 0 92 30,564 1,168,409 43.6 48.1 13,849
South Carolina 11,016,969 4,703,118 3,553,495 32.3 282,990 315,407 258,360 † † 32.3 292,866 South Dakota 1,691,880 884,250 749,866 44.3 27,861 3,040 56,069 † † 44.3 47,414 Tennessee 10,807,124 4,646,422 70,607 0.7 0 471,074 530,171 3,399,004 31.5 32.1 175,566 Texas 69,481,473 37,955,370 34,335,523 49.4 0 110,696 1,265,173 0 0.0 49.4 2,243,978 Utah 6,502,748 2,472,948 1,989,009 30.6 145 7,012 224,979 † † 30.6 251,803
Vermont 1,946,446 61,944 178 # 212 1,277 24,852 † † # 35,425 Virginia 17,606,867 9,362,261 † † † 0 289,509 8,888,378 50.5 50.5 184,374 Washington 19,425,668 4,915,335 3,989,457 20.5 5,882 11,860 362,220 † † 20.5 545,916 West Virginia 3,573,071 1,180,412 1,105,806 30.9 1,486 1,919 23,645 † † 30.9 47,556 Wisconsin 12,416,424 5,690,071 4,049,501 32.6 0 27,302 289,710 0 0.0 32.6 1,323,558 Wyoming 1,795,211 698,598 506,609 28.2 2,136 136,119 18,694 † † 28.2 35,040 † Not applicable. # Rounds to zero. 1 Except the percentage of total revenue from property tax, the percentage of total revenue from parent government contributions, and the percentage of total revenue from property taxes and parent government contributions, which are expressed as percentages. 2 Interschool system transactions are excluded to prevent double counting. 3 The “Property taxes” and “Other taxes” columns only include the tax revenues of “independent” school districts that are not fiscally and administratively dependent on another government entity. “Dependent” school districts that are fiscally and administratively dependent on another government entity have their property tax revenues included in the “Parent government contributions” column of this table. 4 Includes revenues from all local nonproperty taxes, such as sales taxes and income taxes. 5 Includes revenues from sale of property, interest earnings, private contributions, and other miscellaneous local revenues not classified elsewhere. 6 Total revenues for Ohio have been adjusted in this table to eliminate double counting of state funding for independent charter school districts. Ohio accounts for state funding of independent charter school districts within both the revenues of those independent charter school districts and the revenues of the (noncharter) local school districts that charter school students reside in. SOURCE: U.S. Department of Education, National Center for Education Statistics, Common Core of Data (CCD), “School District Finance Survey (F-33),” fiscal year 2019, Provisional Version 1a.

National Center for Education Statistics
24
Table 7. Current expenditures per pupil of public elementary and secondary school systems, by poverty quartile and state: Fiscal year 2019
Current expenditures per pupil Percent difference
between high- and
low-poverty
districts2
Percent of students
excluded from the analysis
Percent of current
expenditures excluded from the analysis
All districts
Poverty quartile1
State Low-poverty
districts
Low-middle poverty districts
High-middle
poverty districts
High-poverty districts
United States $12,912 $13,062 $11,622 $14,167 $13,080 0.1 5.2 6.1
Alabama 10,077 9,969 9,900 10,152 10,551 5.5 0.1 0.1 Alaska 18,359 18,056 14,989 16,470 31,626 42.9 0.3 0.5 Arizona 8,741 8,277 8,797 9,121 9,727 14.9 18.9 18.4 Arkansas 10,140 9,708 10,358 10,083 10,919 11.1 3.8 5.4 California 13,445 12,766 13,602 14,629 13,935 8.4 8.8 11.3
Colorado 10,938 10,617 10,866 11,045 11,704 9.3 2.0 2.5 Connecticut 20,540 21,381 20,392 18,093 19,273 -10.9 4.9 5.1 Delaware 16,186 14,819 17,410 17,015 15,257 2.9 16.7 15.3 District of Columbia3 22,406 † † † † † 44.6 43.8 Florida 9,645 9,720 9,816 9,258 9,713 -0.1 0.7 0.0
Georgia 11,170 10,602 11,433 10,887 12,575 15.7 1.8 1.9 Hawaii3 16,132 † † † † † 0.0 0.0 Idaho 7,979 7,439 8,634 7,635 8,466 12.1 6.6 5.8 Illinois 15,838 16,543 14,641 13,565 15,505 -6.7 0.4 2.9 Indiana 10,284 9,632 10,639 10,546 12,284 21.6 5.1 4.7
Iowa4 11,271 10,626 11,480 12,227 11,694 9.1 0.1 5.4 Kansas 11,366 10,532 12,199 12,077 12,088 12.9 # 5.0 Kentucky 11,290 10,735 12,660 10,801 11,177 4.0 0.1 # Louisiana 11,767 11,685 11,319 11,795 13,085 10.7 11.0 11.2 Maine 14,789 14,882 14,741 14,545 14,902 0.1 5.0 6.0
Maryland 15,148 14,371 15,403 15,490 15,746 8.7 # 0.0 Massachusetts 17,766 17,323 17,510 16,179 23,154 25.2 8.4 8.5 Michigan 11,388 10,943 11,186 12,627 14,373 23.9 10.1 17.6 Minnesota 12,641 11,838 12,746 12,754 16,387 27.8 6.8 11.6 Mississippi 9,275 8,630 9,424 9,667 10,317 16.4 1.7 2.0
Missouri 10,773 10,908 10,336 10,082 12,002 9.1 3.3 7.2 Montana4 12,013 11,568 11,778 11,512 14,841 22.1 2.1 1.6 Nebraska 12,306 11,594 12,033 12,728 13,663 15.1 0.1 3.4 Nevada 9,344 10,334 † † 9,015 -14.6 9.0 7.1 New Hampshire 17,453 17,949 18,310 16,599 15,409 -16.5 4.7 0.1
New Jersey 19,838 20,067 19,121 19,936 19,981 -0.4 6.1 8.6 New Mexico 10,177 9,575 9,949 10,157 11,716 18.3 4.4 4.4 New York 25,155 23,717 22,446 † 26,868 11.7 5.8 0.4 North Carolina 9,857 9,576 9,941 9,930 10,309 7.1 7.2 6.2 North Dakota 13,461 12,448 12,756 14,225 16,733 25.6 1.2 5.0
Ohio 12,558 11,785 12,083 13,863 16,507 28.6 6.6 11.7 Oklahoma 9,307 8,710 9,453 10,214 9,960 12.5 5.8 4.3 Oregon 11,778 12,127 10,980 11,498 12,484 2.9 0.4 5.6 Pennsylvania4 16,308 16,456 16,300 16,037 15,881 -3.6 8.4 10.2 Rhode Island4 16,994 17,552 16,177 15,909 17,260 -1.7 7.1 7.5 See notes at end of table.
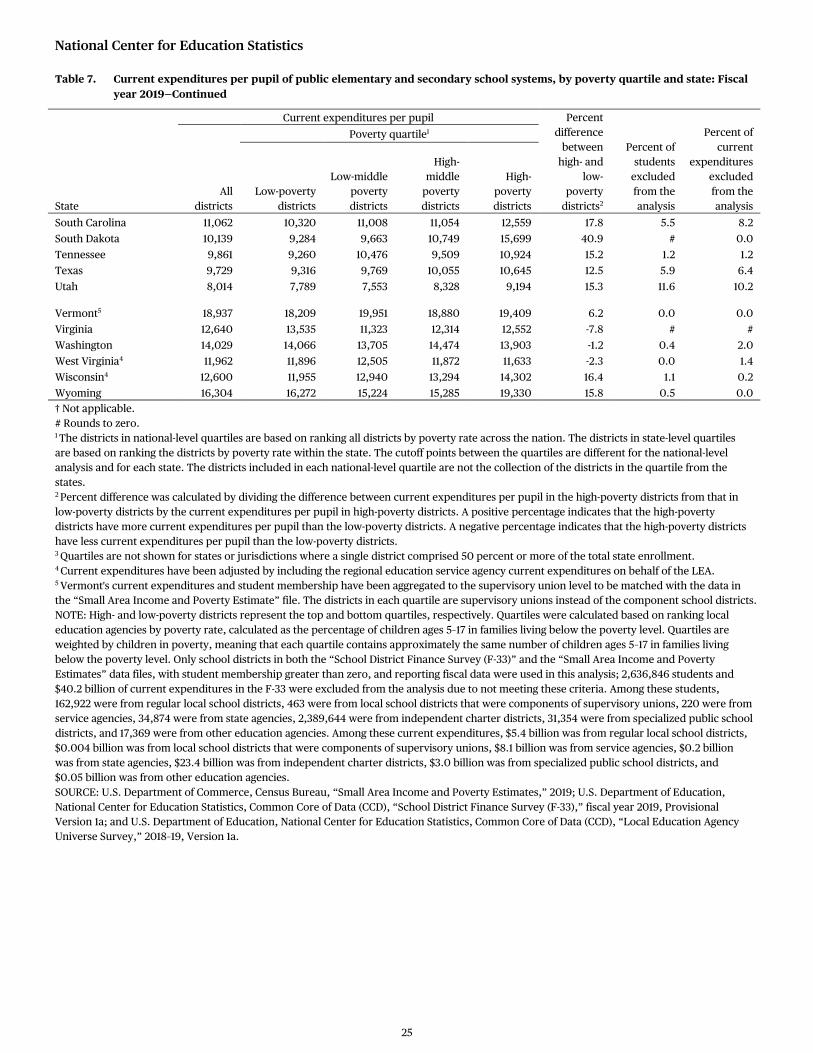
National Center for Education Statistics
25
Table 7. Current expenditures per pupil of public elementary and secondary school systems, by poverty quartile and state: Fiscal year 2019—Continued
Current expenditures per pupil Percent difference
between high- and
low-poverty
districts2
Percent of students
excluded from the analysis
Percent of current
expenditures excluded from the analysis
All districts
Poverty quartile1
State Low-poverty
districts
Low-middle poverty districts
High-middle
poverty districts
High-poverty districts
South Carolina 11,062 10,320 11,008 11,054 12,559 17.8 5.5 8.2 South Dakota 10,139 9,284 9,663 10,749 15,699 40.9 # 0.0 Tennessee 9,861 9,260 10,476 9,509 10,924 15.2 1.2 1.2 Texas 9,729 9,316 9,769 10,055 10,645 12.5 5.9 6.4 Utah 8,014 7,789 7,553 8,328 9,194 15.3 11.6 10.2
Vermont5 18,937 18,209 19,951 18,880 19,409 6.2 0.0 0.0 Virginia 12,640 13,535 11,323 12,314 12,552 -7.8 # # Washington 14,029 14,066 13,705 14,474 13,903 -1.2 0.4 2.0 West Virginia4 11,962 11,896 12,505 11,872 11,633 -2.3 0.0 1.4 Wisconsin4 12,600 11,955 12,940 13,294 14,302 16.4 1.1 0.2 Wyoming 16,304 16,272 15,224 15,285 19,330 15.8 0.5 0.0 † Not applicable. # Rounds to zero. 1 The districts in national-level quartiles are based on ranking all districts by poverty rate across the nation. The districts in state-level quartiles are based on ranking the districts by poverty rate within the state. The cutoff points between the quartiles are different for the national-level analysis and for each state. The districts included in each national-level quartile are not the collection of the districts in the quartile from the states. 2 Percent difference was calculated by dividing the difference between current expenditures per pupil in the high-poverty districts from that in low-poverty districts by the current expenditures per pupil in high-poverty districts. A positive percentage indicates that the high-poverty districts have more current expenditures per pupil than the low-poverty districts. A negative percentage indicates that the high-poverty districts have less current expenditures per pupil than the low-poverty districts. 3 Quartiles are not shown for states or jurisdictions where a single district comprised 50 percent or more of the total state enrollment. 4 Current expenditures have been adjusted by including the regional education service agency current expenditures on behalf of the LEA. 5 Vermont's current expenditures and student membership have been aggregated to the supervisory union level to be matched with the data in the “Small Area Income and Poverty Estimate” file. The districts in each quartile are supervisory unions instead of the component school districts. NOTE: High- and low-poverty districts represent the top and bottom quartiles, respectively. Quartiles were calculated based on ranking local education agencies by poverty rate, calculated as the percentage of children ages 5–17 in families living below the poverty level. Quartiles are weighted by children in poverty, meaning that each quartile contains approximately the same number of children ages 5–17 in families living below the poverty level. Only school districts in both the “School District Finance Survey (F-33)” and the “Small Area Income and Poverty Estimates” data files, with student membership greater than zero, and reporting fiscal data were used in this analysis; 2,636,846 students and $40.2 billion of current expenditures in the F-33 were excluded from the analysis due to not meeting these criteria. Among these students, 162,922 were from regular local school districts, 463 were from local school districts that were components of supervisory unions, 220 were from service agencies, 34,874 were from state agencies, 2,389,644 were from independent charter districts, 31,354 were from specialized public school districts, and 17,369 were from other education agencies. Among these current expenditures, $5.4 billion was from regular local school districts, $0.004 billion was from local school districts that were components of supervisory unions, $8.1 billion was from service agencies, $0.2 billion was from state agencies, $23.4 billion was from independent charter districts, $3.0 billion was from specialized public school districts, and $0.05 billion was from other education agencies. SOURCE: U.S. Department of Commerce, Census Bureau, “Small Area Income and Poverty Estimates,” 2019; U.S. Department of Education, National Center for Education Statistics, Common Core of Data (CCD), “School District Finance Survey (F-33),” fiscal year 2019, Provisional Version 1a; and U.S. Department of Education, National Center for Education Statistics, Common Core of Data (CCD), “Local Education Agency Universe Survey,” 2018–19, Version 1a.

National Center for Education Statistics
26
Table 8. Capital outlay expenditures for public elementary and secondary school districts, by state: FY 2019
[in thousands of dollars]
State Total capital
outlay Construction
Land and existing
structures Total
equipment1 Instructional
equipment All other
equipment Nonspecified
equipment2
United States $77,671,570 $61,754,923 $4,638,784 $11,277,863 $2,414,951 $8,580,366 $282,546
Alabama ‡ ‡ ‡ ‡ ‡ ‡ ‡ Alaska 125,159 70,035 37,069 18,055 3,410 14,645 0 Arizona 1,596,063 868,768 258,205 469,090 196,473 272,617 0 Arkansas 741,008 616,998 35,253 88,757 17,486 71,271 0 California 10,318,452 9,596,852 336,158 385,442 96,985 288,457 0
Colorado 1,863,594 1,315,546 246,250 301,798 70,211 231,587 0 Connecticut 729,510 672,809 0 56,701 26,519 30,022 160 Delaware 184,659 178,865 0 5,794 2,191 3,603 0 District of Columbia 476,215 427,643 21,103 27,469 7,936 19,350 183 Florida 2,627,573 1,795,854 161,611 670,108 0 670,108 0
Georgia 2,149,477 1,761,065 68,806 319,606 23,815 295,791 0 Hawaii 271,300 263,529 0 7,771 3,944 3,827 0 Idaho 192,117 139,942 0 52,175 10,364 41,811 0 Illinois 2,793,351 2,360,366 0 432,985 133,108 299,877 0 Indiana 2,234,345 1,515,314 199,352 519,679 42,501 348,432 128,746
Iowa 906,363 699,738 15,119 191,506 56,688 134,818 0 Kansas 992,652 719,610 32,721 240,321 128,547 111,774 0 Kentucky 811,454 643,800 12,090 155,564 45,805 109,759 0 Louisiana 544,760 441,728 26,919 76,113 18,601 57,512 0 Maine 213,292 175,400 75 37,817 7,103 30,714 0
Maryland 1,595,110 1,424,088 7,522 163,500 25,683 137,817 0 Massachusetts 1,113,900 514,185 436,943 162,772 104,957 56,604 1,211 Michigan 1,702,881 1,101,579 167,366 433,936 46,370 387,566 0 Minnesota 2,186,864 1,850,878 0 335,986 52,631 283,355 0 Mississippi 352,711 205,522 0 147,189 47,265 82,383 17,541
Missouri 1,026,063 788,824 85,190 152,049 24,999 127,050 0 Montana 318,207 241,110 16,697 60,400 3,029 53,767 3,604 Nebraska 514,093 227,713 196,513 89,867 27,668 62,199 0 Nevada 932,996 642,525 154,900 135,571 3,427 132,144 0 New Hampshire 208,907 154,711 11,144 43,052 15,568 27,484 0
New Jersey 1,443,565 1,138,814 101,723 203,028 38,834 164,194 0 New Mexico 576,633 392,889 52,119 131,625 27,346 104,279 0 New York ‡ ‡ ‡ ‡ ‡ ‡ ‡ North Carolina 1,489,124 1,175,019 55,954 258,151 26,086 226,781 5,284 North Dakota 218,963 160,457 5,198 53,308 11,530 41,778 0
Ohio 2,365,339 1,842,763 17,864 504,712 168,632 265,592 70,488 Oklahoma 820,208 435,145 251,866 133,197 32,250 100,947 0 Oregon 1,592,172 1,503,099 7,254 81,819 9,845 71,974 0 Pennsylvania 2,266,805 1,474,811 201,392 590,602 97,507 493,095 0 Rhode Island 63,708 27,771 6,039 29,898 17,814 12,084 0 See notes at end of table.
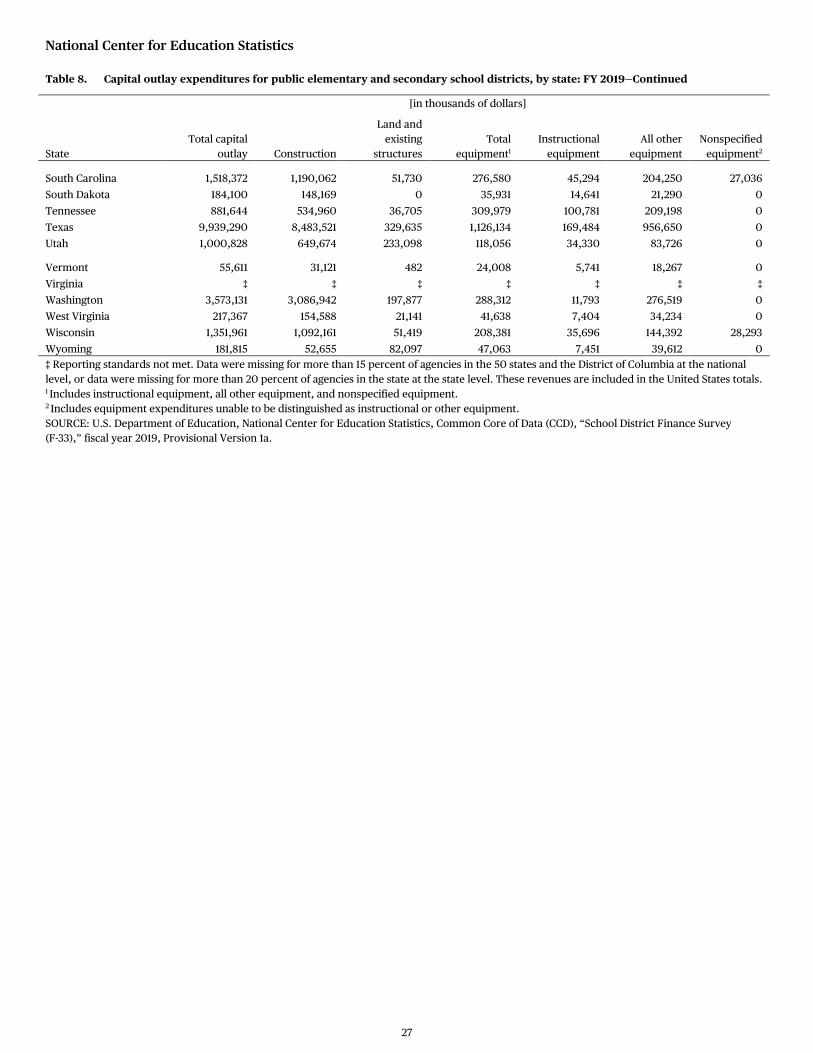
National Center for Education Statistics
27
Table 8. Capital outlay expenditures for public elementary and secondary school districts, by state: FY 2019—Continued
[in thousands of dollars]
State Total capital
outlay Construction
Land and existing
structures Total
equipment1 Instructional
equipment All other
equipment Nonspecified
equipment2
South Carolina 1,518,372 1,190,062 51,730 276,580 45,294 204,250 27,036 South Dakota 184,100 148,169 0 35,931 14,641 21,290 0 Tennessee 881,644 534,960 36,705 309,979 100,781 209,198 0 Texas 9,939,290 8,483,521 329,635 1,126,134 169,484 956,650 0 Utah 1,000,828 649,674 233,098 118,056 34,330 83,726 0
Vermont 55,611 31,121 482 24,008 5,741 18,267 0 Virginia ‡ ‡ ‡ ‡ ‡ ‡ ‡ Washington 3,573,131 3,086,942 197,877 288,312 11,793 276,519 0 West Virginia 217,367 154,588 21,141 41,638 7,404 34,234 0 Wisconsin 1,351,961 1,092,161 51,419 208,381 35,696 144,392 28,293 Wyoming 181,815 52,655 82,097 47,063 7,451 39,612 0 ‡ Reporting standards not met. Data were missing for more than 15 percent of agencies in the 50 states and the District of Columbia at the national level, or data were missing for more than 20 percent of agencies in the state at the state level. These revenues are included in the United States totals. 1 Includes instructional equipment, all other equipment, and nonspecified equipment. 2 Includes equipment expenditures unable to be distinguished as instructional or other equipment. SOURCE: U.S. Department of Education, National Center for Education Statistics, Common Core of Data (CCD), “School District Finance Survey (F-33),” fiscal year 2019, Provisional Version 1a.