· Revenue . Up : 5.4% . To . 7,455.6 . Profit after tax attributable to shareholders (Statutory)...
32
Appendix 4E, 30 June 2012 Page 1 Appendix 4E AGL Energy Limited ABN 74 115 061 375 Preliminary Final Report Results for announcement to the market for the year ended 30 June 2012 Extracts from this report for announcement to the market $A million Revenue Up 5.4% To 7,455.6 Profit after tax attributable to shareholders (Statutory) Down 79.4% To 114.9 Underlying Profit after tax attributable to shareholders Up 11.8% To 482.0 Dividends Amount per ordinary share Franked amount per ordinary share Final dividend 32.0¢ 32.0¢ Interim dividend 29.0¢ 29.0¢ Record date for determining entitlements to the final dividend: 5 September 2012 and payable on 27 September 2012. Brief explanation of Underlying Profit: Statutory Profit is prepared in accordance with the Corporations Act 2001 and the Australian Accounting Standards, which comply with the International Financial Reporting Standards. Statutory Profit after tax of $114.9 million included a net loss of $155.1 million after tax treated as significant items and a loss of $212.0 million after tax from the changes in the fair value of financial instruments. Excluding these items, the Underlying Profit was $482.0 million, up 11.8% on the prior corresponding period. Underlying Profit is reported to give information to shareholders that provides a greater understanding of the performance of AGL Energy Limited’s (AGL’s) operations. AGL believes Underlying Profit is useful as it removes significant items and timing mismatches between the fair value of derivatives and the underlying asset being hedged thereby facilitating a more representative comparison of financial performance between financial periods. AGL previously provided guidance that Underlying Profit for the year ended 30 June 2012 would be between $470 million and $500 million. This report should be read in conjunction with the AGL Financial Report 2012. For personal use only
Transcript of · Revenue . Up : 5.4% . To . 7,455.6 . Profit after tax attributable to shareholders (Statutory)...

Appendix 4E, 30 June 2012 Page 1
Appendix 4E
AGL Energy Limited ABN 74 115 061 375
Preliminary Final Report
Results for announcement to the market
for the year ended 30 June 2012 Extracts from this report for announcement to the market $A million Revenue Up 5.4% To 7,455.6 Profit after tax attributable to shareholders (Statutory)
Down 79.4% To 114.9
Underlying Profit after tax attributable to shareholders
Up 11.8% To 482.0
Dividends
Amount per
ordinary share
Franked amount per
ordinary share
Final dividend
32.0¢
32.0¢
Interim dividend
29.0¢
29.0¢
Record date for determining entitlements to the final dividend:
5 September 2012 and payable on 27 September 2012.
Brief explanation of Underlying Profit: Statutory Profit is prepared in accordance with the Corporations Act 2001 and the Australian Accounting Standards, which comply with the International Financial Reporting Standards. Statutory Profit after tax of $114.9 million included a net loss of $155.1 million after tax treated as significant items and a loss of $212.0 million after tax from the changes in the fair value of financial instruments. Excluding these items, the Underlying Profit was $482.0 million, up 11.8% on the prior corresponding period. Underlying Profit is reported to give information to shareholders that provides a greater understanding of the performance of AGL Energy Limited’s (AGL’s) operations. AGL believes Underlying Profit is useful as it removes significant items and timing mismatches between the fair value of derivatives and the underlying asset being hedged thereby facilitating a more representative comparison of financial performance between financial periods. AGL previously provided guidance that Underlying Profit for the year ended 30 June 2012 would be between $470 million and $500 million. This report should be read in conjunction with the AGL Financial Report 2012.
For
per
sona
l use
onl
y

AGL Energy Limited and Subsidiaries Management Discussion and Analysis For the year ended 30 June 2012
Appendix 4E, 30 June 2012 Page 2
Contents Page No.
1.0 Results overview 3
1.1 Significant items 4
1.2 Changes in fair value of derivative financial instruments 7
1.3 Prior period adjustment to retained earnings 8
2.0 Earnings per share 9
3.0 Dividend 9
4.0 Review of operations 10
4.1 Retail Energy 12
4.2 Merchant Energy 19
4.3 Upstream Gas 24
4.4 Energy Investments 27
4.5 Centrally managed expenses 28
5.0 Net finance costs 30
6.0 Income tax expense 30
7.0 Operating cash flow 31
8.0 Information on audits 32
For
per
sona
l use
onl
y

AGL Energy Limited and Subsidiaries Management Discussion and Analysis For the year ended 30 June 2012
Appendix 4E, 30 June 2012 Page 3
1. Results Overview The following tables reconcile Statutory Profit to Underlying Profit and Statutory Earnings before Interest and Tax (“EBIT”) to Operating EBIT. Year ended
30 June 2012 Year ended
30 June 2011
$m $m
Statutory Profit 114.9 558.7
Adjust for the following after tax items:
Significant items(1) 155.1 27.3
Changes in fair value of financial instruments(2) 212.0 (154.9)
Underlying Profit 482.0 431.1
(1) Section 1.1 (2) Section 1.2
Year ended
30 June 2012 Year ended
30 June 2011
$m $m
Statutory EBIT 201.4 819.1
Significant items 211.7 44.3
Change in fair value of financial instruments 304.6 (218.8)
Finance income included in Operating EBIT 12.7 11.9
Operating EBIT 730.4 656.5
Net finance costs (51.2) (37.4)
Underlying Profit before tax 679.2 619.1
Income tax expense (197.2) (188.0)
Underlying Profit 482.0 431.1
Underlying Profit and Operating EBIT are the Statutory Profit and Statutory EBIT respectively adjusted for significant items and changes in the fair value of financial instruments. AGL believes that Underlying Profit and Operating EBIT provide a better understanding of its financial performance and allows for a more relevant comparison of financial performance between financial periods. AGL believes Underlying Profit and Operating EBIT are useful as they:
• remove significant items that are material items of revenue or expense that are unrelated to the underlying performance of the business thereby facilitating a more representative comparison of financial performance between financial periods and;
• remove changes in the fair value of financial instruments recognised in the income
statement to remove the volatility caused by mismatches in valuing derivatives and the underlying asset differently.
Underlying Profit is presented with reference to the Australian Securities and Investment Commission Regulatory Guide 230 “Disclosing non-IFRS financial information” issued in December 2011. AGL’s policy for reporting Underlying Profit is consistent with this guidance and the Directors have had the consistency of the application of the policy reviewed by the external auditor of AGL.
For
per
sona
l use
onl
y

AGL Energy Limited and Subsidiaries Management Discussion and Analysis For the year ended 30 June 2012
Appendix 4E, 30 June 2012 Page 4
1.1 Significant Items Year ended
30 June 2012 Year ended
30 June 2011
Pre-tax PAT Pre-tax PAT
$m $m $m $m
Loy Yang acquisition (175.9) (174.3) - -
Other merger and acquisition related costs - - (17.3) (13.1)
Other redundancy, termination and restructuring costs
- - (27.0) (19.7)
Impairment of non-current assets (35.8) (26.6) - -
Tax items - 45.8 - 5.5
Total significant items (211.7) (155.1) (44.3) (27.3)
1.1.1 Loy Yang acquisition Current Year On 29 June 2012, AGL completed the acquisition of the remaining 67.46% of shares and loan notes issued by Great Energy Alliance Corporation Pty Ltd (GEAC) that it did not already own. As a result of the acquisition AGL now owns the 2,210 MW Loy Yang A power station and adjacent brown coal mine. The following items have been recognised as significant items in the period:
• Acquisition related costs of $21.8 million before tax and $19.3 million after tax were incurred in relation to advisor fees, redundancies and other transaction costs. AGL has received advice that there are strong arguments that no material stamp duty is payable. This position may be challenged and therefore a contingent liability has been disclosed in note 40 to the AGL Financial Report 2012.
• Before completing the GEAC acquisition, AGL’s 32.54% interest in GEAC was accounted
for as an equity investment. Under AASB 3 “Business Combinations”, the pre-existing equity interest is required to be remeasured at the acquisition date fair value with the resulting gain or loss recognised in the income statement. This accounting adjustment resulted in a $120.7 million revaluation loss.
• AASB 3 also requires that any amounts previously recognised in other
comprehensive income are recycled to the income statement to the extent they would ordinarily have been recycled to the income statement on a disposal event. AGL’s share of GEAC’s hedge reserve ($36.3 million loss as at date of acquisition) that has historically been accounted by AGL as part of the equity accounted investment has therefore been released from the hedge reserve and recorded in the income statement.
• Prior to completing the acquisition AGL purchased some of GEAC’s junior debt facilities. The facilities were purchased below par resulting in a gain on acquisition of $2.9 million before tax and $2.0 million after tax.
Prior Year Nil
For
per
sona
l use
onl
y

AGL Energy Limited and Subsidiaries Management Discussion and Analysis For the year ended 30 June 2012
Appendix 4E, 30 June 2012 Page 5
1.1.2 Other merger and acquisition related costs
Current Year Nil Prior Year Acquisition related costs of $17.3 million before tax and $13.1 million after tax were incurred on activities associated with submitting a bid for the privatisation of energy assets in New South Wales (NSW) and the acquisition of Mosaic Oil NL. 1.1.3 Other redundancy, termination and restructuring costs Current Year Nil Prior Year AGL undertook two major restructuring initiatives during the prior year. Firstly, the transitioning of substantial retail back office processes (mainly non-customer facing billing and sales fulfilment) to offshore service providers. This involved redundancy and restructuring costs of $8.0 million before tax. Secondly, as part of the annual budget cycle which commenced in March 2011, AGL identified a number of opportunities to improve operating efficiencies and organisational reporting lines. As a result, a number of employment positions became redundant. The one-off cost of implementing the restructure was $19.0 million before tax. The combined effect of the two initiatives for the period was $27.0 million before tax and $19.7 million after tax. 1.1.4 Impairment of non-current assets Current Year The carrying value associated with AGL’s Upstream Gas exploration and evaluation assets are reviewed at the end of each reporting period. The review completed as at 30 June 2012 resulted in impairment charges being recognised in relation to the following assets:
• ATP 1056P – Cooper Qld oil exploration During the period the results of a five-well oil drilling program were reviewed. The results in relation to four of the wells did not support commercial development with the resulting drilling and permit costs written off. This resulted in an impairment charge in the period of $21.8 million before tax and $15.2 million after tax; and
• Geothermal exploration During the period AGL reviewed the results of its geothermal exploration programs. The review concluded that none of the results to date were supportive of commercial development. This resulted in an impairment charge of $14.0 million before tax and $11.4 million after tax.
Prior Year Nil F
or p
erso
nal u
se o
nly

AGL Energy Limited and Subsidiaries Management Discussion and Analysis For the year ended 30 June 2012
Appendix 4E, 30 June 2012 Page 6
1.1.5 Tax items Current Year
• Changes to the Petroleum Resource Rent Tax (PRRT) Assessment Act 1987 extend the operation of the PRRT to onshore oil and gas projects from 1 July 2012. As the PRRT falls within the scope of AASB 112 “Income Taxes”, AGL is required to account for any associated deferred tax assets or deferred tax liabilities as at 30 June 2012. AGL has recognised a deferred tax asset as at 30 June 2012 of $53.4 million representing the difference between the PRRT starting base amount and the carrying value of the production permits to which the PRRT will apply.
• AGL has implemented a change to its current and prior year income tax treatment for
liabilities owed under various state and federal green product schemes. The liability has now been treated as incurred and deductible for tax purposes at the same time as it is recognised as an accounting liability. This change resulted in a charge to income tax expense of $7.6 million, a reduction in deferred tax assets of $54.8 million and a reduction in income tax provision of $47.2 million.
Prior Year As a result of retrospective changes to the tax consolidation legislation enacted in June 2010, AGL recognised a further tax benefit of $5.5 million relating to tax deductions which are available for the tax value allocated to certain derivative assets in place at the time of the merger/demerger transaction with Alinta Limited in October 2006. AGL received tax refunds of $72.4 million during the 2011 financial year.
For
per
sona
l use
onl
y

AGL Energy Limited and Subsidiaries Management Discussion and Analysis For the year ended 30 June 2012
Appendix 4E, 30 June 2012 Page 7
1.2 Changes in Fair Value of Derivative Financial Instruments AGL uses derivative financial instruments (“derivatives”), in large part, to manage electricity purchase price risks but also to manage its exposure to interest rates and foreign exchange rates arising in the normal course of business. AGL’s intention when transacting derivatives is to prudently manage the electricity price risk, interest rate risk and foreign exchange rate risk it faces. AGL considers this activity to be hedging in nature. Australian Accounting Standard AASB 139 ‘Financial Instruments: Recognition and Measurement’ (“AASB 139”) requires derivatives to be reported at fair value in the financial statements. Changes in the fair value of derivatives between reporting periods for “effective hedges” are recognised in equity as an adjustment to the hedge reserve. Changes in the fair value of derivatives between reporting periods for “ineffective hedges” are recognised in the income statement. AASB 139 considers derivatives to be effective hedges where the change in the fair value of the item being hedged and the change in the fair value of the derivative substantially offset each other. All other hedges are deemed to be ineffective hedges. In AGL’s view, AASB 139’s definition of an effective hedge results in an appropriate outcome for the interest rate and foreign exchange rate hedging activity currently undertaken by AGL. It does not however adequately address the more complex exposures from managing electricity price risk. This means that a material number of AGL’s electricity derivatives are not considered effective hedges under AASB 139. The change in fair value of derivatives reported in profit and loss for the year ended 30 June 2012 was a loss of $304.6 million before tax and $212.0 million after tax. For the year ended 30 June 2011 change in fair value of derivatives was a profit before tax of $218.8 million and $154.9 million after tax. A reconciliation of the statement of financial position movement in derivative balances to the amount included in the income statement for the year ended 30 June 2012 is presented in the following table: Net Assets (Liabilities)
30 June 2012 30 June 2011 Change
$m $m $m
Electricity derivative contracts 208.7 (89.7) 298.4
Interest rate swap and foreign currency derivative contracts (224.9) (148.5) (76.4)
Total net liabilities for derivative contracts (16.2) (238.2) 222.0
Change in derivative net liability 222.0
Premiums paid (169.5)
Equity accounted Loy Yang fair value 4.0
Premium roll off 165.4
Derivatives acquired (293.1)
Total change in fair value (71.2)
Recognised in equity hedge reserve 170.3
Recognised in borrowings 63.1
Recognised in income statement (304.6)
Total change in fair value (71.2)
For
per
sona
l use
onl
y

AGL Energy Limited and Subsidiaries Management Discussion and Analysis For the year ended 30 June 2012
Appendix 4E, 30 June 2012 Page 8
A reconciliation of the statement of financial position movement in derivative balances to the amount included in the income statement for the year ended 30 June 2011 is presented in the following table: Net Assets (Liabilities)
30 June 2011 30 June 2010 Change
$m $m $m
Electricity derivative contracts (89.7) (474.3) 384.6
Interest rate swap and foreign currency derivative contracts (148.5) (7.2) (141.3)
Total net liabilities for derivative contracts (238.2) (481.5) 243.3
Change in derivative net liability 243.3
Premiums paid (175.0)
Equity accounted Loy Yang fair value 5.8
Premium roll off 145.9
Total change in fair value 220.0
Recognised in equity hedge reserve 64.7
Recognised in borrowings (63.5)
Recognised in income statement 218.8
Total change in fair value 220.0
The two tables above serve to highlight that derivatives can create substantial volatility in AGL’s income statement. AGL believes this volatility does not reflect the underlying performance of the business and therefore, changes in fair value of derivatives recognised in the income statement should be excluded when calculating Underlying Profit. 1.3 Prior period adjustment to retained earnings During the year ended 30 June 2012 AGL completed Project Spectrum. Project Spectrum transferred AGL’s business customers onto the same SAP billing platform as its consumer customers (excluding 118,600 Powerdirect customers). This single SAP billing platform has materially enhanced the granularity of analysis that is able to be performed on customer balances. Using this enhanced capability, AGL undertook a comprehensive review of debtors, unbilled sales, creditors and unbilled distribution costs. This review highlighted that, in prior periods, AGL had consistently but incorrectly estimated period end distribution liabilities by using a methodology to accrue distribution charges based on an estimated number of days not yet billed by the relevant distributor in each state. AGL believed that this estimate fully accounted for invoices relating to the relevant period end that had yet to be received. However, this estimate has never fully accounted for invoices received after the relevant period end relating to distribution charges incurred prior to the period end. It has been impracticable to allocate the increased liability between opening balance liabilities arising from business acquisitions and increased expenses in prior periods. Accordingly, opening retained earnings for the year ended 30 June 2012 has been reduced by $79.9 million as a result of an increase in the opening distribution liability of $114.1 million and a net decrease in tax liabilities of $34.2 million.
For
per
sona
l use
onl
y

AGL Energy Limited and Subsidiaries Management Discussion and Analysis For the year ended 30 June 2012
Appendix 4E, 30 June 2012 Page 9
2. Earnings per Share Earnings per share (EPS) has been calculated on the profit after tax attributable to shareholders (Statutory) and the Underlying Profit adjusted for significant items and changes in the fair value of financial instruments. Further discussion on the reconciliation between Statutory Profit and Underlying Profit is contained in Section 1. Year ended
30 June 2012 Year ended
30 June 2011
$m $m
Statutory Profit 114.9 558.7
Adjust for the following after tax items:
Significant items 155.1 27.3
Changes in fair value of financial instruments 212.0 (154.9)
Underlying Profit 482.0 431.1
cents cents
EPS on Statutory Profit 23.8 118.5
EPS on Underlying Profit 100.0 91.4 The FY2011 Statutory EPS and Underlying EPS have been restated to reflect the bonus element of the rights issue completed in June 2012.
3. Dividend The Directors have declared a final dividend of 32.0 cents per share for the year on the expanded capital base, a 3.2% increase on the prior corresponding period’s final dividend of 31.0 cents per share. The final dividend will be paid on 27 September 2012. The record date to determine shareholders’ entitlements to the final dividend is 5 September 2012 and shares will commence trading ex-dividend on 30 August 2012. Before declaring the dividend the Directors satisfied themselves that:
• AGL’s assets exceeded its liabilities immediately before declaring the dividend and the excess was sufficient for the payment of the dividend;
• the payment of the dividend was fair and reasonable to AGL’s shareholders as a whole;
and • the payment of the dividend would not materially prejudice AGL’s ability to pay its
creditors. The final dividend will be fully franked. This will bring the annual dividend to 61.0 cents per share compared with 60.0 cents per share in the prior corresponding period. The AGL Dividend Reinvestment Plan (DRP) will be in operation. Shares will be allotted at a 1.5% discount to the simple average of the daily weighted average market price at which AGL’s ordinary shares are traded on the ASX during each of the 10 trading days commencing on 7 September 2012.
For
per
sona
l use
onl
y

AGL Energy Limited and Subsidiaries Management Discussion and Analysis For the year ended 30 June 2012
Appendix 4E, 30 June 2012 Page 10
4. Review of Operations The following review of operations focuses on Operating EBIT defined as EBIT before changes in fair value of financial instruments and significant items. AGL believes that Operating EBIT provides a better understanding of its financial performance by removing significant items and volatile changes in fair value of financial instrument accounting adjustments thereby facilitating a more relevant comparison of financial performance between financial periods. The following table reconciles Statutory EBIT to Operating EBIT Year ended
30 June 2012 Year ended
30 June 2011
$m $m
Statutory EBIT 201.4 819.1
Significant items 211.7 44.3
Change in fair value of financial instruments 304.6 (218.8)
Finance income included in Operating EBIT 12.7 11.9
Operating EBIT 730.4 656.5
Each segment section commences with a table reconciling Statutory EBIT with the Operating EBIT. Operating EBIT for the year ended 30 June 2012 was $730.4 million compared with $656.5 million for the prior corresponding period. The Statutory and Operating EBIT by segment is presented in the following table: EBIT EBIT
(Statutory) (Operating)
Year ended 30 June 2012
Year ended 30 June 2011
Year ended 30 June 2012
Year ended 30 June 2011
$m $m $m $m
Retail Energy 332.8 301.0 332.8 305.1
Merchant Energy 224.2 658.9 549.7 453.2
Upstream Gas (35.2) 14.3 0.6 14.3
Energy Investments (140.2) 35.6 24.5 40.5
Centrally managed expenses (180.2) (190.7) (177.2) (156.6)
EBIT 201.4 819.1 730.4 656.5
Depreciation and amortisation 173.9 148.0 173.9 148.0
EBITDA 375.3 967.1 904.3 804.5
Average funds employed 7,917.2 7,403.0 7,917.2 7,403.0
EBIT / Average funds employed 2.5% 11.1% 9.2% 8.9% Operating EBIT/Average funds employed increased 0.3 percentage points (ppts) due to a $73.9 million, or 11.3%, increase in Operating EBIT. Partially offsetting the positive impact of an increase in Operating EBIT was an increase in average funds employed of $514.2 million or 6.9%. The factors affecting Operating EBIT are explained in detail in Sections 4.1 to 4.5. Average funds employed increased due largely to investments in assets where the contribution to EBIT will not commence until the assets reach practical completion or gas production.
For
per
sona
l use
onl
y

AGL Energy Limited and Subsidiaries Management Discussion and Analysis For the year ended 30 June 2012
Appendix 4E, 30 June 2012 Page 11
As previously advised in its market release on 10 January 2012, AGL amended the basis for segmental analysis reporting. There has been no change to the aggregate reported profit in any prior periods, only movements between business units. The two main changes were:
• Business Customers (formerly Commercial and Industrial) transferred to Merchant Energy, previously reported in Retail Energy; and
• Some administration costs (mainly Finance & IT) reported in Centrally managed expenses, previously reported in the business units.
The following tables summarise the changes by segment:
Year ended 30 June 2011
Statutory EBIT
New Reporting Structure
Previous Reporting Structure
Retail Energy 301.0 367.2
Merchant Energy 658.9 585.5 Upstream Gas 14.3 13.6
Energy Investments 35.6 35.6
Centrally managed expenses (190.7) (182.8)
Total Statutory EBIT 819.1 819.1
Year ended 30 June 2011
Operating EBIT
New Reporting Structure
Previous Reporting Structure
Retail Energy 305.1 373.0
Merchant Energy 453.2 378.2 Upstream Gas 14.3 13.6
Energy Investments 40.5 40.5
Centrally managed expenses (156.6) (148.8)
Total Operating EBIT 656.5 656.5
For
per
sona
l use
onl
y
AGL Energy Limited and Subsidiaries Management Discussion and Analysis For the year ended 30 June 2012
Appendix 4E, 30 June 2012 Page 12
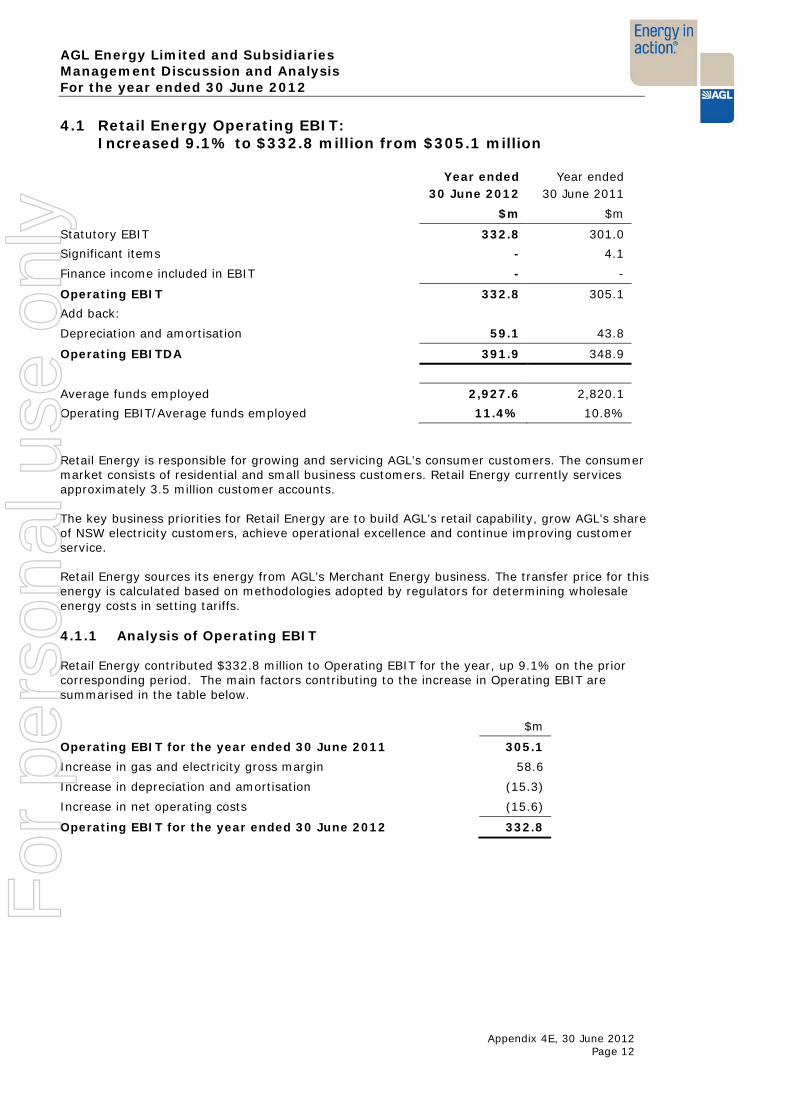
4.1 Retail Energy Operating EBIT: Increased 9.1% to $332.8 million from $305.1 million
Year ended
30 June 2012 Year ended
30 June 2011
$m $m
Statutory EBIT 332.8 301.0
Significant items - 4.1
Finance income included in EBIT - -
Operating EBIT 332.8 305.1
Add back:
Depreciation and amortisation 59.1 43.8
Operating EBITDA 391.9 348.9
Average funds employed 2,927.6 2,820.1
Operating EBIT/Average funds employed 11.4% 10.8% Retail Energy is responsible for growing and servicing AGL’s consumer customers. The consumer market consists of residential and small business customers. Retail Energy currently services approximately 3.5 million customer accounts. The key business priorities for Retail Energy are to build AGL’s retail capability, grow AGL’s share of NSW electricity customers, achieve operational excellence and continue improving customer service. Retail Energy sources its energy from AGL’s Merchant Energy business. The transfer price for this energy is calculated based on methodologies adopted by regulators for determining wholesale energy costs in setting tariffs. 4.1.1 Analysis of Operating EBIT Retail Energy contributed $332.8 million to Operating EBIT for the year, up 9.1% on the prior corresponding period. The main factors contributing to the increase in Operating EBIT are summarised in the table below. $m
Operating EBIT for the year ended 30 June 2011 305.1
Increase in gas and electricity gross margin 58.6
Increase in depreciation and amortisation (15.3)
Increase in net operating costs (15.6)
Operating EBIT for the year ended 30 June 2012 332.8
For
per
sona
l use
onl
y

AGL Energy Limited and Subsidiaries Management Discussion and Analysis For the year ended 30 June 2012
Appendix 4E, 30 June 2012 Page 13
4.1.1.1 Gross Margin Gross margin, excluding fees and charges, increased by $58.6 million, or 9.8% compared with the prior corresponding period. The following table shows gross margin by fuel type: Year ended
30 June 2012 $m
Year ended 30 June 2011
$m Movement
%
Electricity 437.4 388.1 12.7 Gas 217.1 207.8 4.5 Fees and charges 77.5 73.0 6.2 Total gross margin 732.0 668.9 9.4
Gross margin excluding fees and charges
654.5 595.9 9.8
Gross margin increases were primarily driven by regulatory and contract price increases in all states. The benefit of higher customer numbers in NSW was more than offset by a mild summer, particularly in Queensland. Gas volumes were lower in all states (down by 4.7% compared with the prior corresponding period), driven primarily by above average temperatures in Victoria and NSW in July and August 2011.
4.1.1.2 Depreciation and Amortisation
Depreciation and amortisation (D&A) increased by $15.3 million, or 34.9% compared with the prior corresponding period. Year ended
30 June 2012 $m
Year ended 30 June 2011
$m Movement
% NSW direct customer acquisition cost amortisation
(17.2) (2.1) 719.0
Other (41.9) (41.7) 0.5 Total D&A (59.1) (43.8) 34.9
The main driver of the increase in D&A was AGL’s project to grow its customer base in NSW to between 800,000 and 900,000 customers by 30 June 2014. During the period up until 30 June 2014 AGL will capitalise the direct cash costs incurred to acquire NSW customers. These costs will then be amortised over the expected benefit period (typically between two and three years).
For
per
sona
l use
onl
y

AGL Energy Limited and Subsidiaries Management Discussion and Analysis For the year ended 30 June 2012
Appendix 4E, 30 June 2012 Page 14
The following table outlines expenditure which has been capitalised for direct NSW electricity customer acquisition costs and also the amortisation profile:
Year ended 30 June 2012
$m
Year ended 30 June 2011
$m
Total Project to
date $m
Direct cash outlay 41.4 15.6 57.0 Amortised to the income statement
(17.2) (2.1) (19.3)
Net capitalised costs 24.2 13.5 37.7 Number of lead sales 214,822 95,959 Cost per lead sale $192.43 $162.93 Amortisation for the year ending: $m
30 June 2011 2.1 30 June 2012 17.2 30 June 2013 25.6 30 June 2014 11.9 30 June 2015 0.2 Total amortisation 57.0
In addition to the above capitalised costs, AGL estimates that it spent a further $8 per new NSW electricity customer on sales fulfilment activities. These costs have been incurred to process new customers onto AGL’s system and are consistent with prior corresponding period costs. Cost per lead sale increased to $192.43 compared with $162.93 for the corresponding period. The main driver of the increase was increased campaign expenditure due to the intensity of competition in the Retail market during the year.
For
per
sona
l use
onl
y

AGL Energy Limited and Subsidiaries Management Discussion and Analysis For the year ended 30 June 2012
Appendix 4E, 30 June 2012 Page 15
4.1.1.3 Net Operating Costs excluding Depreciation & Amortisation
Retail Energy’s net operating costs excluding D&A increased by $15.6 million, or 6.3%, during the year compared with the prior corresponding period. The following table includes the breakdown of the material increases in net operating costs:
Year ended
30 June 2012 $m
Year ended 30 June 2011
$m Movement
%
Labour and contractor services (128.7) (120.9) 6.5 Bad and doubtful debts (61.7) (58.4) 5.7 Campaigns and advertising (73.1) (60.9) 20.0 Other expenditure (76.6) (79.8) (4.0) Fees and charges 77.5 73.0 6.2 Net operating costs excluding D&A (262.6) (247.0) 6.3 Depreciation and amortisation (59.1) (43.8) 34.9 Net operating costs (321.7) (290.8) 10.6 Labour and contractor services costs increased by $7.8 million, or 6.5%, to $128.7 million. Labour and contractor services costs increased as a result of new customer connections and transfers, and additional costs to set up new customers onto AGL’s billing platform. Additional labour was also required to manage AGL’s brand and marketing campaigns throughout the year. Call centre labour costs were in line with the prior corresponding period despite higher call volumes as a result of higher customer numbers, bill enquiries and increased credit management. Labour rates increased in line with inflation. Bad and doubtful debt expenses increased by $3.3 million, or 5.7%, despite a larger increase in total consumer revenue by $541.1 million, or 14.8%, compared with the prior corresponding period. This was driven by improved credit collection techniques implemented during the year. Campaign and advertising expenditure increased by $12.2 million, or 20.0%, due to the intensity of competition in the Retail market during the year. AGL’s continued focus on retention activities and successful targeted sales campaigns allowed AGL to grow its market share in both gas and electricity customer numbers.
4.1.2 Dual Fuel Strategy Retail Energy continued to pursue its dual fuel strategy. AGL now services 1.62 million dual fuel customer accounts, compared with 1.47 million as at 30 June 2011, a 10.2% increase. F
or p
erso
nal u
se o
nly

AGL Energy Limited and Subsidiaries Management Discussion and Analysis For the year ended 30 June 2012
Appendix 4E, 30 June 2012 Page 16
4.1.3 Customer Profitability AGL uses gross margin per customer as its primary measure of customer profitability, with Operating EBIT/Sales used as a secondary measure.
4.1.3.1 Gross Margin per Customer
Year ended 30 June 2012
Year ended 30 June 2011
Movement
% Gross margin (excluding fees & charges)
$654.5m $595.9m 9.8
Average customer numbers 3,373,200 3,254,200 3.7 Consumer gross margin per customer
$194.03 $183.12 6.0
The increase in gross margin per customer was due to a rebalancing towards more cost reflective tariff structures for fixed and variable market based costs, as well as targeted retention and acquisition of higher value customer segments.
4.1.3.2 Operating EBIT / Sales Analysis As discussed at the beginning of this section, AGL has amended the basis for segmental analysis reporting. The analysis in this section and section 4.1.4.1 now excludes commercial and industrial customers (now reported in Section 4.2)
Year ended 30 June 2012
$m
Year ended 30 June 2011
$m Movement
% Electricity revenue 3,009.7 2,479.3 21.4
Gas revenue 1,118.0 1,111.8 0.6
Other fees and charges 77.5 73.0 6.2
Total revenue 4,205.2 3,664.1 14.8
Cost of sales (3,473.2) (2,995.2) 16.0
Gross margin 732.0 668.9 9.4
Operating costs (excl D&A) (340.1) (320.0) 6.3
Operating EBITDA 391.9 348.9 12.3
Depreciation and amortisation (59.1) (43.8) 34.9
Operating EBIT 332.8 305.1 9.1
Operating EBIT / Sales %
7.9% 8.3% -0.4ppts
Operating EBIT / Sales decreased slightly mainly due to the large increase in electricity network distribution costs compared with the prior corresponding period. As these costs are passed through to customers without an increase in Operating EBIT, Operating EBIT/Sales decreases.
For
per
sona
l use
onl
y

AGL Energy Limited and Subsidiaries Management Discussion and Analysis For the year ended 30 June 2012
Appendix 4E, 30 June 2012 Page 17
4.1.4 Operating Efficiency AGL focuses on net operating costs as a percentage of gross margin (excluding fees and charges) as the primary measure of operating efficiency. As a secondary measure, cost to serve is also analysed.
4.1.4.1 Net Operating Costs as a Percentage of Gross Margin Year ended
30 June 2012 $m
Year ended 30 June 2011
$m Movement
%
Net operating costs (321.7) (290.8) 10.6 Gross margin 732.0 668.9 9.4 Fees and charges (77.5) (73.0) 6.3 Gross margin less fees and charges 654.5 595.9 9.8
Net operating costs as percentage of gross margin (less fees and charges)
49.2% 48.8% 0.4 ppts
Net operating costs as a percentage of gross margin increased by 0.4 ppts. Gross margin (less fees and charges) increased by 9.8% primarily as a result of stronger pricing outcomes in the consumer market and higher customer numbers, partly offset by increases in electricity network costs. Net operating costs increased by 10.7% mainly due to higher advertising costs and targeted customer retention activities in all markets to counter higher industry competition and market churn.
4.1.4.2 Cost to Serve Analysis Year ended
30 June 2012 $
Year ended 30 June 2011
$ Movement
%
Net operating costs (321.7)m (290.8)m 10.6 Net operating cost per customer account (95.38) (89.34) 6.8
Cost to grow/retain (108.0)m (75.9)m 42.3 Cost to grow per account acquired/retained (82.94) (84.08) (1.4)
Cost to serve (213.7)m (214.9)m (0.6) Cost to serve per customer account (63.36) (66.01) (4.0)
Net operating cost per customer account for the year was $95.38, a 6.8% increase on the prior corresponding period. The increase in net operating costs is discussed in detail in section 4.1.1.3 The cost to grow/retain increased by 42.3% for the year. Highly competitive market conditions and the requirement to increase both acquisition and retention spend to grow market share have resulted in higher costs to grow and retain customers. Increases in amortisation charges in relation to the NSW electricity acquisition project also contributed to the increase.
For
per
sona
l use
onl
y

AGL Energy Limited and Subsidiaries Management Discussion and Analysis For the year ended 30 June 2012
Appendix 4E, 30 June 2012 Page 18
Customer numbers increased by 5.5%. Despite this, total cost to serve was $213.7 million, 0.6% lower than the prior corresponding period cost to serve of $214.9 million. This resulted in cost to serve per customer account falling 4%, from 66.01 to 63.36. During the year AGL implemented a call centre optimisation model which delivered a more consistent approach to call handling and resulted in service efficiencies including lower average call handling times, more calls answered within 30 seconds and higher first call resolution. AGL has also improved its on-line experience with more customers now transacting on-line including paperless billing and updating personal details.
4.1.5 Customer numbers High levels of competitor activity continued during the year. The following table1 provides a breakdown of customer numbers by state.
30 June 2012 30 June 2011 Movement Movement
(‘000) (‘000) (‘000) %
Electricity
Victoria 638 639 (1) -
South Australia 459 468 (9) (1.9)
New South Wales 620 468 152 32.5
Queensland 367 350 17 4.9
2,084 1,925 159 8.3
Gas
Victoria 487 473 14 3.0
South Australia 117 104 13 12.5
New South Wales 711 718 (7) (1.0)
Queensland 75 74 1 1.4
1,390 1,369 21 1.5
Total 3,474 3,294 180 5.5 Industry market churn across all markets increased by 0.3 ppts to 20.3% from 20.0% for the prior corresponding period. AGL churn across all markets remained well below the industry. It decreased to 15.4% for the year ended 30 June 2012 compared with 16.2% for the prior corresponding period. Industry NSW electricity market churn increased by 3.3 ppts from 14.1% to 17.4% for the prior corresponding period. Conversely, AGL NSW electricity market churn decreased by 1.4 ppts from 17.0% to 15.6%. The decrease in AGL’s overall churn rate was driven by strong product offers, the dual fuel strategy and the launch of interactive customer focussed tools such as AGL Energy On-line. 1. Includes 22,694 C&I customers at 30 June 2012 (20,638 at 30 June 2011) but does not include ActewAGL
customers. For
per
sona
l use
onl
y

AGL Energy Limited and Subsidiaries Management Discussion and Analysis For the year ended 30 June 2012
Appendix 4E, 30 June 2012 Page 19
4.2 Merchant Energy Operating EBIT: Increased 21.3% to $549.7 million from $453.2 million
Year ended
30 June 2012 Year ended
30 June 2011
$m $m
Statutory EBIT 224.2 658.9
Significant items 15.9 6.1
Finance income included in EBIT 1.0 1.2
Change in fair value of financial instruments 308.6 (213.0)
Operating EBIT 549.7 453.2
Add back:
Depreciation and amortisation 78.8 69.1
Operating EBITDA 628.5 522.3
Average funds employed 3,396.8 3,136.3
Operating EBIT/Average funds employed 16.2% 14.5% Merchant Energy is responsible for developing, operating and maintaining AGL’s power generation assets, developing AGL’s carbon strategy and managing the risks associated with the procurement and delivery of gas and electricity for AGL’s Wholesale and Retail portfolios. Merchant Energy also manages the relationship with AGL’s Business Customers. In addition to providing gas and electricity the business unit supplies beyond the meter services such as energy efficiency advice and broader carbon management services. The business uses financial hedges, bilateral contracts and physical generation to ensure adequacy of competitively priced supply. Generation assets include Australia’s largest privately owned and operated renewable portfolio and a pipeline of development opportunities that positions AGL to benefit from Australia’s Mandatory Renewable Energy Target. Merchant Energy is structured into four business units: Energy Portfolio Management, Merchant Operations, Business Customers and Power Development. The contribution of each business unit to Merchant Energy’s Operating EBIT and EBITDA is set out in the following table. Operating EBIT Operating EBITDA
Year ended 30 June 2012
Year ended 30 June 2011
Year ended 30 June 2012
Year ended 30 June 2011
$m $m $m $m
Energy Portfolio Management 540.4 428.7 551.4 439.2
Merchant Operations (118.8) (114.7) (65.5) (65.5)
Business Customers 94.1 90.4 108.2 99.8
Power Development 40.8 56.3 40.9 56.3
Sundry (6.8) (7.5) (6.5) (7.5)
Total Merchant Energy 549.7 453.2 628.5 522.3
For
per
sona
l use
onl
y
AGL Energy Limited and Subsidiaries Management Discussion and Analysis For the year ended 30 June 2012
Appendix 4E, 30 June 2012 Page 20
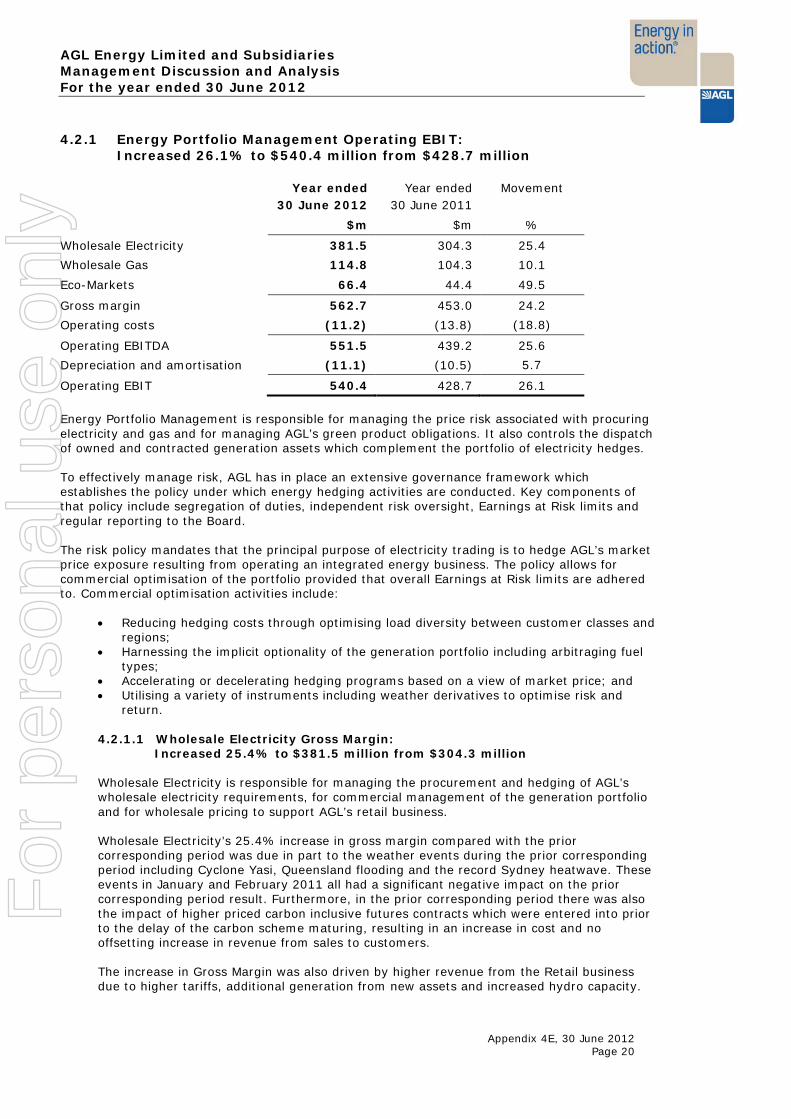
4.2.1 Energy Portfolio Management Operating EBIT:
Increased 26.1% to $540.4 million from $428.7 million Year ended
30 June 2012 Year ended
30 June 2011 Movement
$m $m %
Wholesale Electricity 381.5 304.3 25.4
Wholesale Gas 114.8 104.3 10.1
Eco-Markets 66.4 44.4 49.5
Gross margin 562.7 453.0 24.2
Operating costs (11.2) (13.8) (18.8)
Operating EBITDA 551.5 439.2 25.6
Depreciation and amortisation (11.1) (10.5) 5.7
Operating EBIT 540.4 428.7 26.1
Energy Portfolio Management is responsible for managing the price risk associated with procuring electricity and gas and for managing AGL’s green product obligations. It also controls the dispatch of owned and contracted generation assets which complement the portfolio of electricity hedges. To effectively manage risk, AGL has in place an extensive governance framework which establishes the policy under which energy hedging activities are conducted. Key components of that policy include segregation of duties, independent risk oversight, Earnings at Risk limits and regular reporting to the Board. The risk policy mandates that the principal purpose of electricity trading is to hedge AGL’s market price exposure resulting from operating an integrated energy business. The policy allows for commercial optimisation of the portfolio provided that overall Earnings at Risk limits are adhered to. Commercial optimisation activities include:
• Reducing hedging costs through optimising load diversity between customer classes and regions;
• Harnessing the implicit optionality of the generation portfolio including arbitraging fuel types;
• Accelerating or decelerating hedging programs based on a view of market price; and • Utilising a variety of instruments including weather derivatives to optimise risk and
return.
4.2.1.1 Wholesale Electricity Gross Margin: Increased 25.4% to $381.5 million from $304.3 million
Wholesale Electricity is responsible for managing the procurement and hedging of AGL’s wholesale electricity requirements, for commercial management of the generation portfolio and for wholesale pricing to support AGL’s retail business. Wholesale Electricity’s 25.4% increase in gross margin compared with the prior corresponding period was due in part to the weather events during the prior corresponding period including Cyclone Yasi, Queensland flooding and the record Sydney heatwave. These events in January and February 2011 all had a significant negative impact on the prior corresponding period result. Furthermore, in the prior corresponding period there was also the impact of higher priced carbon inclusive futures contracts which were entered into prior to the delay of the carbon scheme maturing, resulting in an increase in cost and no offsetting increase in revenue from sales to customers. The increase in Gross Margin was also driven by higher revenue from the Retail business due to higher tariffs, additional generation from new assets and increased hydro capacity.
For
per
sona
l use
onl
y

AGL Energy Limited and Subsidiaries Management Discussion and Analysis For the year ended 30 June 2012
Appendix 4E, 30 June 2012 Page 21
4.2.1.2 Wholesale Gas Gross Margin: Increased 10.1% to $114.8 million from $104.3 million
Wholesale Gas is responsible for sourcing and managing AGL’s gas supply and transportation portfolio to maximise wholesale price effectiveness for the Retail business. Wholesale Gas also supplies other retailers and internal and third party gas fired generators. The 10.1% increase in Gross Margin was driven by continuing solid performance from flexible gas portfolio in a depressed gas market. The increase in Gross Margin was partly offset by lower volumes in the residential customer segment resulting from milder weather conditions during July to September 2011.
4.2.1.3 Eco-Markets Gross Margin:
Increased 49.5% to $66.4 million from $44.4 million
Eco-Markets is responsible for managing the liabilities for both voluntary and mandatory green schemes. The largest of these schemes in which Eco-Markets participates is the Mandatory Renewable Energy Target which was split into the Small-scale Renewable Energy Scheme (SRES) and the Large-scale Renewable Energy Target (LRET) from 1 January 2011. The increase in gross margin compared with the prior corresponding period was due to effective portfolio management and increased renewable generation. The year also included a full twelve months of gross margin contribution from SRES compared with only six months in the prior corresponding period.
4.2.2 Merchant Operations Operating Expense: Increased 3.6% to $118.8 million from $114.7 million
Merchant Operations is responsible for managing and maintaining both AGL’s and third party generation assets. AGL’s thermal and renewable generation portfolio includes the 1,280 MW gas fired Torrens Island power station, the 150 MW gas fired Somerton power station and 795 MW of hydro generation. AGL also operates and receives the generation revenues from Wattle Point, Hallett 1, Hallett 2, Hallett 4, Hallett 5 and Oaklands wind farms (505 MW of capacity). Upon completion of the GEAC acquisition on 29 June 2012, Merchant Operations is also now responsible for managing and maintaining the 2,210 MW Loy Yang A power station and adjacent brown coal mine. Merchant Operations is largely a cost centre with all generation revenues and variable fuel costs included in the Energy Portfolio Management results. The increase in Merchant Operations expenses for the period was due to higher depreciation costs resulting from the completion of capital projects and costs associated with new plant brought on line.
During the year Victoria continued to experience significant rainfall resulting in dam levels at Dartmouth increasing from 64% as at 1 July 2011, to 86% as at 30 June 2012. Dam levels at both Eildon and Dartmouth have improved substantially over the last two years: Dam Storage Levels Year ended
30 June 2012 Year ended
30 June 2011 Year ended
30 June 2010
% % %
Dartmouth 86.0 64.0 33.0
Eildon 90.0 86.0 27.0
For
per
sona
l use
onl
y

AGL Energy Limited and Subsidiaries Management Discussion and Analysis For the year ended 30 June 2012
Appendix 4E, 30 June 2012 Page 22
4.2.3 Business Customers Operating EBIT: Increased 4.1% to $94.1 million from $90.4 million
Year ended 30 June 2012
Year ended 30 June 2011
Movement
$m $m %
Electricity gross margin 57.2 61.0 (6.2)
Gas gross margin 51.1 40.6 25.9
C&I Operations & Customer Services Expenses
(31.7) (30.7) (3.3)
Energy Services 31.6 28.9 9.3
Operating EBITDA 108.2 99.8 8.4
Depreciation and amortisation (14.1) (9.4) (50.0)
Operating EBIT 94.1 90.4 4.1
Business Customers manages AGL’s C&I gas and electricity customers, offering a unique proposition in the market, through an integrated sales and service model. The customer base provides an excellent channel to market for additional energy related services over and above basic energy supply. Business Customers generates revenue through:
• retention and acquisition of new gas and electricity customers;
• provision of energy services in demand-side management, efficiency and utilisation; and
• development and operation of customer based assets. In addition, Energy Services is responsible for assisting customers to make their businesses more sustainable and energy efficient through expertise in program maintenance, gas combustion, customer energy infrastructure, customer based asset development and energy efficiency related carbon benefits. It also manages the HC Extractions LPG facility. Electricity gross margin was 6.2% lower than the prior corresponding period due to contracting margins and lower volumes. Gas gross margin was 25.9% higher than the prior corresponding period due to the expiry of zero margin contracts. Energy Services margin increased with higher margin and volumes from the HC Extractions LPG facility. Increases in depreciation and amortisation were driven by the commissioning of the new C&I contract management system which is expected to result in significant customer relationship management benefits in the future.
For
per
sona
l use
onl
y

AGL Energy Limited and Subsidiaries Management Discussion and Analysis For the year ended 30 June 2012
Appendix 4E, 30 June 2012 Page 23
4.2.4 Power Development Operating EBIT:
Decreased 27.5% to $40.8 million from $56.3 million Power Development Operating EBIT consists of profits from developing wind farms, less operating expenses associated with the business unit. Development profits from the construction of wind farms are recognised on a percentage of completion basis. Development profits of $43.0 million were recognised in the year compared with $61.0 million in the prior corresponding period. The following table shows the development fees recognised for the various projects: Year ended
30 June 2012 Year ended
30 June 2011
$m $m
Hallett 2 0.6 2.0
Hallett 4 5.6 29.0
Hallett 5 30.0 -
Oaklands Hill 6.8 30.0
Total 43.0 61.0
Operating expenses were $2.2 million compared with $4.7 million for the prior corresponding period. During the prior year $2.7 million of expenses associated with the initially unsuccessful Solar Flagships bid were written off. On 12 June 2012, AGL was announced as the successful proponent in the solar photovoltaic (PV) category of the Commonwealth Government’s Solar Flagship Program independent reassessment process. Development will commence in 2012-13 with construction commencing in mid 2014 and commissioning in late 2015. On 14 May 2012, AGL announced the sale of Hallett 5 wind farm, which generated a $30.0 million development fee. AGL will continue to operate and maintain the facility, as well as retain the rights to all large-scale generation certificates (LGCs) and electricity output until 2036. Oaklands Hill wind farm achieved practical completion in February 2012. AGL will continue to operate and maintain the facility, and will take the electricity output and renewable energy certificates through offtake arrangements. Development of the Macarthur wind farm in a joint venture with Meridian Energy continues with completion scheduled for 2013. 4.2.5 Sundry:
Decreased 9.3% to $6.8 million from $7.5 million Merchant Energy Sundry includes overhead expenses for the business unit and costs associated with investigating the commercial viability of new ventures. It also includes the EBIT contribution from AGL Solar which was acquired on 25 July 2011, with operations beginning in Victoria and later adding a warehouse facility in Queensland. During the year AGL Solar increased installation capacity by 25% compared with the prior corresponding period to approximately 8,000 kW installed. This increased AGL’s market share so that it is now in the top five of individual solar sales and installation companies nationally (excluding aggregator companies).
For
per
sona
l use
onl
y

AGL Energy Limited and Subsidiaries Management Discussion and Analysis For the year ended 30 June 2012
Appendix 4E, 30 June 2012 Page 24
4.3 Upstream Gas Operating EBIT:
Decreased by 95.8% to $0.6 million from $14.3 million Year ended
30 June 2012 Year ended
30 June 2011
$m $m
Statutory EBIT (35.2) 14.3
Significant items 35.8 -
Operating EBIT 0.6 14.3
Add back:
Depreciation and amortisation 20.0 21.5
Operating EBITDA 20.6 35.8
Upstream Gas is responsible for AGL’s investments and operations in gas exploration, development and production tenements, development and operation of gas storage facilities, as well as for exploration and development of geothermal renewable energy sources. The portfolio is divided into two broad regions: (i) Queensland / South Australia; and (ii) New South Wales. The significant item expense of $35.8 million for the period (Nil for the prior corresponding period) related to impairment charges for oil and geothermal exploration assets. These charges are discussed in full in section 1.1.4. The following table provides a breakdown of the contributors to Operating EBIT and EBITDA: Operating EBIT Operating EBITDA
Year ended 30 June 2012
Year ended 30 June 2011
Year ended 30 June 2012
Year ended 30 June 2011
$m $m $m $m
Queensland / South Australia 5.7 16.2 15.6 27.8
New South Wales 1.5 4.2 11.0 13.6
Equity investments (0.1) (0.4) (0.1) (0.4)
Sundry (6.5) (5.7) (5.9) (5.2)
Total Upstream Gas 0.6 14.3 20.6 35.8
4.3.1 Queensland / South Australia Operating EBIT:
Decreased by 64.8% to $5.7 million from $16.2 million The Queensland / South Australia portfolio includes the Moranbah Gas Project (MGP) joint venture, the upstream elements of the North Queensland Energy (NQE) joint venture, conventional oil and gas interests in the Surat and Cooper/Eromanga Basins together with the Silver Springs gas storage project, the Galilee Basin and Spring Gully joint ventures and until 6 December 2011, AGL’s interests in the Cooper Basin (Innamincka) joint venture. Operating EBIT contribution from the combined MGP and NQE joint ventures was a loss of $2.8 million compared with $0.1 million profit in the prior corresponding period. Gas sales decreased by 2.9% to 6.6 PJ compared with 6.8 PJ in the prior corresponding period. Production in the current period was adversely affected by water management constraints as well as slower than expected field development. Operating expenses also increased driven by increased labour costs and environment and safety program costs.
For
per
sona
l use
onl
y

AGL Energy Limited and Subsidiaries Management Discussion and Analysis For the year ended 30 June 2012
Appendix 4E, 30 June 2012 Page 25
Operating EBIT contribution from Silver Springs operations, including gas storage, was $9.6 million compared with $16.7 million for the prior corresponding period. The lower EBIT contribution was mainly due to higher income received in the prior corresponding period associated with establishment of the gas storage operation. On 6 December 2011, AGL completed the sale of all its interests in PELs 101, 103 and 103A to Acer Energy for $6 million. Operating EBIT contribution for the period was a loss of $0.9 million compared with a loss of $0.3 million for the prior corresponding period. 4.3.2 New South Wales Operating EBIT: Decreased by 64.3% to $1.5 million from $4.2 million The New South Wales portfolio includes the Camden Gas Project, Sydney Basin (including Hunter Valley) exploration and Gloucester Basin development assets. Operating EBIT contribution from the Camden Gas Project was $1.5 million compared with $4.2 million in the prior corresponding period. Gas sales increased by 1.8% to 5.8 PJ compared with 5.7 PJ for the prior corresponding period. The lower EBIT contribution was driven by higher operating expenses in relation to well workover activity and water disposal costs. The prior corresponding period also included the recognition of $1.1 million of grant income. 4.3.3 Equity Investments Operating EBIT: Increased to ($0.1 million) from ($0.4 million) Equity Investments include AGL’s share investments in CSM Energy Limited (CSME) and Torrens Energy Limited (TEY). AGL has a 35% shareholding in CSME, an unlisted public company. The Operating EBIT contribution from this investment was a loss of $0.1 million compared with a loss of $0.2 million for the prior corresponding period. AGL has a 8.9% shareholding in TEY, a listed public company. In the prior corresponding period this investment was written-down to current market value resulting in a loss of $0.2 million. 4.3.4 Sundry Operating EBIT:
Decreased to ($6.5 million) from ($5.7 million) The Sundry category includes Upstream Gas’s overheads and, following the acquisition of Mosaic Oil on 20 October 2010, additional exploration interests in New Zealand. During the period AGL completed the sale of its 50% interest in PEP 51151 (Alton block, New Zealand) resulting in a loss before tax of $0.4 million.
For
per
sona
l use
onl
y

AGL Energy Limited and Subsidiaries Management Discussion and Analysis For the year ended 30 June 2012
Appendix 4E, 30 June 2012 Page 26
4.3.5 Gas Sales and Reserves Position The following table summarises the gas sales volume and associated revenue from each operating region during the period: AGL share of operations Year ended
30 June 2012 Year ended
30 June 2011 Movement
%
Gas sales volume (PJ)
Queensland / South Australia 6.6 6.8 (2.9)
New South Wales
5.8 5.7 1.8
Total gas sales 12.4 12.5 (0.1)
Sales revenue ($m) Queensland / South Australia 15.7 15.3 2.6
New South Wales 21.5 20.6 4.4
Total sales revenue 37.2 35.9 3.6
Average gas price ($/GJ) 3.00 2.87 4.5
AGL’s share of proved plus probable (2P) and proved plus probable plus possible (3P) natural gas reserves by project, including coal seam gas and conventional gas is summarised below: AGL share of gas reserves (PJ)
30 June 2012
30 June 2011
2P 3P 2P 3P
Gloucester (100%) 669 832 669 832
Moranbah (50%) 376 862 370 700
Camden (100%) 142 189 148 195
Hunter (100%) 142 271 142 271
Silver Springs (various) 61 158 65 137
Spring Gully (various) 8 10 8 10
Sub-Total 1,398 2,322 1,402 2,145
ATP 1103 back-in rights (50%) (1) 768 1,660 687 1,495
Total 2,166 3,982 2,089 3,640 (1) Under a 50-year project agreement that commenced in 2000, AGL has no effective exploration rights (or ongoing cost obligations) within exploration tenement ATP 1103 (previously designated ATP 364P) as these were assigned to Arrow Energy Limited. However, AGL is entitled to participate up to a 50% interest in any commercial development by contributing its share of past costs. Past costs are anticipated to be less than $0.05/GJ. Gas reserves for the Moranbah and ATP 1103 were reassessed by independent reserves auditor Netherland Sewell & Associates, Inc (NSAI) as at 31 December 2011. AGL’s entitlement of 2P reserves within the ATP increased by 81 PJ (11.8%) as a result of exploration and appraisal activities during the past 12 months. The estimates of gas reserves shown in the table above were prepared in accordance with the definitions and guidelines set out in the 2007 Petroleum Resources Management System approved by the Society of Petroleum Engineers. The information was compiled by Andrew Falkner, a full-time employee of AGL, who is qualified in accordance with ASX Listing Rule 5.11 and has consented to the form and context in which this table appears. Details of AGL’s Annual Reserves Assessment as at 30 June 2012 were released to the ASX on 22 August 2012.
For
per
sona
l use
onl
y

AGL Energy Limited and Subsidiaries Management Discussion and Analysis For the year ended 30 June 2012
Appendix 4E, 30 June 2012 Page 27
4.4 Energy Investments Operating EBIT: Decreased 39.5% to $24.5 million from $40.5 million
Year ended
30 June 2012 Year ended
30 June 2011
$m $m
Statutory EBIT (140.2) 35.6
Significant items 157.0 -
Finance income from Loy Yang investment 11.7 10.7
Change in fair value of financial instruments (Loy Yang) (4.0) (5.8)
Operating EBIT 24.5 40.5
Add back:
Depreciation and amortisation - -
Operating EBITDA 24.5 40.5
Significant item charges of $157.0 million relate to the accounting adjustments required to reflect AGL’s acquisition of the remaining 67.46% of GEAC. Further discussion on these adjustments in contained in section 1.1.1. The following table provides a further breakdown of the contributors to the Operating EBIT: Year ended
30 June 2012 Year ended
30 June 2011
$m $m
ActewAGL 28.0 29.8
Loy Yang (3.5) 10.7
Operating EBIT 24.5 40.5
4.4.1 ActewAGL (50% AGL Ownership) Operating EBIT:
Decreased 6.0% to $28.0 million from $29.8 million ActewAGL is a 50/50 partnership between AGL and Actew Corporation, an ACT Government owned enterprise. Established in 2000, it was the first utility joint venture in Australia between a private company and a publicly owned enterprise. AGL holds a 50% interest in ActewAGL’s retail business. ActewAGL Retail partnership contributed an equity share of profits of $28.0 million for the year compared with $29.8 million for the prior corresponding period. The 6% decrease in Operating EBIT contribution was driven by lower electricity volumes owing to milder than anticipated temperatures during the year, partially offset by higher gas consumption.
For
per
sona
l use
onl
y

AGL Energy Limited and Subsidiaries Management Discussion and Analysis For the year ended 30 June 2012
Appendix 4E, 30 June 2012 Page 28
4.4.2 Loy Yang Investment Operating EBIT:
Decreased to ($3.5) million from $10.7 million Operating EBIT of $(3.5) million comprised an equity share of losses of $15.2 million compared with $0.0 million for the prior corresponding period and interest income of $11.7 million compared with $10.7 million for the prior corresponding period. On 29 June 2012, AGL completed the acquisition of the remaining 67.46% of shares and loan notes issued by Great Energy Alliance Corporation Pty Ltd (GEAC) that it did not already own. As a result of the acquisition AGL now owns the 2,210 MW Loy Yang A power station and adjacent brown coal mine. The equity accounted operating EBIT contribution from Loy Yang relates to the period up to the completion of the acquisition. In future periods the Operating EBIT contribution of AGL’s 100% ownership of GEAC will be reported under the Merchant Energy segment. 4.4.3 Diamantina Power Station Joint Venture On 6 October 2011, AGL entered into a 50:50 joint venture with the APA Group to construct the Diamantina Power Station in Mt Isa. The joint venture did not contribute to Operating EBIT for the year ended 30 June 2012. 4.5 Centrally Managed Expenses:
Increased 13.2% to $177.2 million from $156.6 million Year ended
30 June 2012 Year ended
30 June 2011
$m $m
Statutory EBIT (180.2) (190.7)
Significant items 3.0 34.1
Operating EBIT (177.2) (156.6)
Add back:
Depreciation and amortisation 16.0 13.6
Operating EBITDA (161.2) (143.0)
The following table provides a more detailed breakdown of centrally managed expenses. Year ended
30 June 2012 Year ended
30 June 2011
$m $m
Labour (57.8) (50.8)
Office leases (17.6) (16.4)
Hardware and software costs (38.3) (36.2)
Consultants and contractor fees (12.6) (10.4)
Insurance premiums (10.0) (9.6)
Depreciation and amortisation (16.0) (13.6)
Other (24.9) (19.6)
Total (177.2) (156.6)
For
per
sona
l use
onl
y

AGL Energy Limited and Subsidiaries Management Discussion and Analysis For the year ended 30 June 2012
Appendix 4E, 30 June 2012 Page 29
Labour costs increased by $7.0 million, or 13.8%. Cash labour costs increased by $2.3 million with a number of positions transferring into corporate functions at the beginning of the financial year with offsetting decreases in business unit labour costs. The remaining $4.7 million increase related to movements in provisions associated with long service leave and employee incentives. Hardware and software costs increased by $2.1 million, or 5.8% compared with the prior corresponding period driven by increased investment in billing platforms, on-line capabilities and infrastructure expenditure. Consultant and contractor fees increased by $2.2 million, or 21.2% driven by centralisation of procurement services and increased tax advisory services. Depreciation and amortisation costs increased by $2.4 million, or 17.6% compared with the prior corresponding period driven by the commencement of depreciation charges in relation to recently completed IT projects. Other expenses increased by $5.3 million, or 27.0% including increases in land tax and centralisation of recruitment processes. AGL centrally manages a number of expense items, including information technology and office leases, to maximise operational efficiencies, minimise costs and optimise service levels across business divisions. While these costs would not be incurred but for the existence of the business units, they have not been formally reallocated because the management of these costs is the responsibility of various corporate functions. However, although not formally reallocated for the purposes of reporting Operating EBIT, a substantial proportion of the expenses can be attributed to the business units. The following tables provide further analysis of the centrally managed expenses incurred on behalf of business units during the years ended 30 June 2012 and 30 June 2011.
30 June 2012
Centrally Managed Expenses
$m
Reallocate Retail Energy
$m
Reallocate Merchant Energy
$m
Reallocate Upstream
Gas $m
Unallocated
$m
Labour (57.8) - - - (57.8)
Office leases (17.6) 8.7 5.5 0.9 (2.5)
Hardware and software costs (38.3) 26.8 7.7 - (3.8)
Consultants and contractor fees (12.6) 1.5 0.7 0.1 (10.3)
Insurance premiums (10.0) 3.4 4.8 1.8 -
Depreciation and amortisation (16.0) 11.2 3.2 - (1.6)
Other (24.9) 4.2 2.2 - (18.5)
Total (177.2) 55.8 24.1 2.8 (94.5)
30 June 2011
Centrally Managed Expenses
$m
Reallocate Retail Energy
$m
Reallocate Merchant Energy
$m
Reallocate Upstream
Gas $m
Unallocated
$m
Labour (50.8) - - - (50.8)
Office leases (16.4) 7.9 5.7 0.9 (1.9)
Hardware and software costs (36.2) 25.4 7.2 - (3.6)
Consultants and contractor fees (10.4) 1.7 1.4 - (7.3)
Insurance premiums (9.6) 3.3 4.6 1.7 -
Depreciation and amortisation (13.6) 9.5 2.7 - (1.4)
Other (19.6) 3.3 1.7 - (14.6)
Total (156.6) 51.1 23.3 2.6 (79.6)
For
per
sona
l use
onl
y

AGL Energy Limited and Subsidiaries Management Discussion and Analysis For the year ended 30 June 2012
Appendix 4E, 30 June 2012 Page 30
5. Net Finance Costs Increased 36.9% to $51.2 million from $37.4 million
Year ended
30 June 2012 Year ended
30 June 2011
$m $m
Statutory finance costs (83.9) (73.4)
Statutory finance income 45.4 47.9
Remove finance income included in EBITDA (12.7) (11.9)
Net financing costs (51.2) (37.4)
Net financing costs were $51.2 million compared with $37.4 million for the prior corresponding period. This $13.8 million increase in net financing costs was mainly due to additional financing facilities undertaken during the year. Average net debt for the year was $990.3 million compared with $667.0 million for the prior corresponding period. 6. Income Tax Expense
Underlying income tax increased 4.9% to $197.2 million from $188.0 million
Year ended
30 June 2012 Year ended
30 June 2011
$m $m
Statutory income tax expense (48.0) (234.9)
Income tax benefit from significant items (56.6) (17.0)
Income tax (benefit) / expense from
fair value movements (92.6) 63.9
Underlying tax expense (197.2) (188.0)
The underlying effective tax rate was 29.0% compared with 30.4% for the prior corresponding period.
For
per
sona
l use
onl
y

AGL Energy Limited and Subsidiaries Management Discussion and Analysis For the year ended 30 June 2012
Appendix 4E, 30 June 2012 Page 31
7. Operating Cash Flow
7.1 Reconciliation of Operating EBITDA to Statutory Cash Flow: The following table provides a reconciliation of Operating EBITDA to Statutory Cash Flow.
Year ended 30 June 2012
$m
Year ended 30 June 2011
$m Operating EBITDA 904.3 804.5
Equity accounted income (net of dividend received) 14.0 (6.0)
Accounting for onerous gas contract (20.9) (20.9)
Working capital movements
(Increase) / decrease in receivables (197.0) (42.3)
Net movement in green assets / liabilities 20.0 (94.1)
(Increase) / decrease in inventories (21.5) (30.4)
Increase / (decrease) in creditors 106.6 22.9
(Increase) / decrease in futures margin calls 29.8 30.0
Net derivative premiums paid / roll-offs (3.9) (29.2)
Net movement in GST recoverable / payable (7.8) 7.5
Other (23.1) (96.9) 9.2 (126.4)
Operating cash flow before interest, tax & significant items 800.5 651.2
Net finance costs paid (96.7) (39.3)
Income tax paid (180.8) (0.7)
Cash flow relating to significant items (56.5) (41.9)
Statutory net cash provided by operating activities 466.5 569.3
7.2 Underlying Operating Cash Flow before Interest and Tax: Increased 4.9% to $750.7 million from $715.3 million
The statutory net cash flow from operating activities does not take into account a number of material items that affect operating cash flow. AGL has made adjustments to take these items into consideration in calculating the underlying operating cash flow before interest and tax.
Year ended 30 June 2012
Year ended 30 June 2011
$m $m
Statutory net cash provided by operating activities 466.5 569.3
Cash flow relating to significant items 56.5 41.9
Increase / (decrease) in futures margin calls (29.8) (30.0)
Increase / (decrease) in net green position (20.0) 94.1
Underlying Operating Cash Flow 473.2 675.3
Net finance costs paid 96.7 39.3
Income tax paid 180.8 0.7
Underlying Operating Cash Flow before interest and tax
750.7 715.3
For
per
sona
l use
onl
y

AGL Energy Limited and Subsidiaries Management Discussion and Analysis For the year ended 30 June 2012
Appendix 4E, 30 June 2012 Page 32
7.2.1 Significant Items AGL incurred cash expenses in the year relating to redundancy, termination and restructuring costs as well as merger and acquisition related costs. These costs are explained in detail in Section 1.1. 7.2.2 Futures Margin Calls AGL posts deposits with the futures exchange at the inception of a futures contract in relation to electricity. Depending on market movements, AGL subsequently pays or receives cash. The net receipt for the year ended 30 June 2012 was $29.8 million compared with a receipt of $30.0 million for the prior corresponding period. 7.2.3 Net Green Position AGL purchases various green products to satisfy its green compliance obligations. As at 30 June 2012, AGL had paid $110.8 million for certificates relating to future obligations compared with $130.8 million in the prior corresponding period, a net decrease of $20.0 million. 8. Information on audits This report has been derived from the AGL Financial Report 2012 which has been prepared in accordance with AASB Standards, other AASB authoritative pronouncements and interpretations or other standards acceptable to ASX. This report, and the financial statements upon which the report is based, use the same accounting policies. This report does give a true and fair view of the matters disclosed. This report is based on financial statements that have been audited. The entity has a formally constituted Audit and Risk Management committee. The audit report, which is unqualified, is attached to the AGL Financial Report 2012 also released to the market on 22 August 2012.
Jeremy Maycock Chairman 22 August 2012
For
per
sona
l use
onl
y