Westar Energy’s 2013 Annual Transmission Revenue Requirement Meeting

B O N N E V I L L E P O W E R A D M I N I S T R A T I O N
2010 BPA Rate Case Wholesale Power Rate Initial Proposal
REVENUE REQUIREMENT STUDY
February 2009
WP-10-E-BPA-02

This page intentionally left blank.

WP-10-E-BPA-02 i
REVENUE REQUIREMENT STUDY
TABLE OF CONTENTS
Page
Commonly Used Acronyms ....................................................................................................... iv
1. INTRODUCTION ............................................................................................................1
2. SPENDING LEVEL DEVELOPMENT...........................................................................6 2.1 Development Process for WP-10 Initial Proposal Spending Levels ....................6
2.1.1 Regional Dialogue ....................................................................................6 2.1.2 Integrated Business Review ......................................................................7 2.1.3 Integrated Program Review ......................................................................7
2.2 Capital Funding .....................................................................................................9 2.2.1 Bonds Issued to the U.S. Treasury ............................................................9 2.2.2 Federal Appropriations ...........................................................................10 2.2.3 Third-Party Debt .....................................................................................11
2.3 Debt Optimization Program ................................................................................11
3. DEVELOPMENT OF REVENUE REQUIREMENTS .................................................14
4. GENERATION REVENUE REQUIREMENT .............................................................16 4.1 Revenue Requirement Format ............................................................................16
4.1.1 Income Statement....................................................................................17 4.1.2 Statement of Cash Flows ........................................................................24
4.2 Current Revenue Test .........................................................................................28 4.3 Revised Revenue Test .........................................................................................28 4.4 Repayment Test at Proposed Rates .....................................................................29
5. REVENUE REQUIREMENT LEGAL REQUIREMENTS AND POLICIES ..............31 5.1 Development of BPA’s Revenue Requirements .................................................31
5.1.1 Legal Requirements Governing the FCRPS Revenue Requirement.......31 5.1.2 Colville Settlement Act Credits ..............................................................34 5.1.3 The BPA Appropriations Refinancing Act .............................................35
5.2 Allocation of Federal Columbia River Power System (FCRPS) Costs ..............36 5.2.1 Section 4(h)(10)(C) Credit ......................................................................38 5.2.2 Equitable Allocation of Transmission Costs...........................................39
5.3 Repayment Requirements and Policies ...............................................................39
WP-10-E-BPA-02 ii
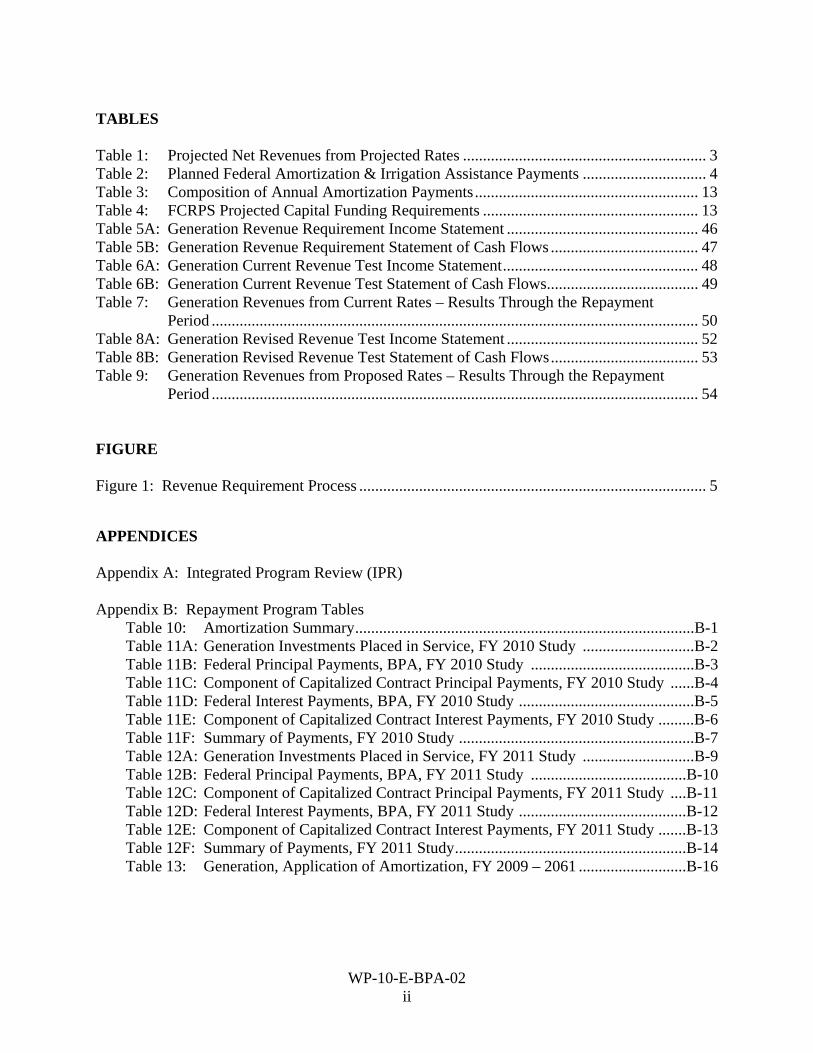
TABLES Table 1: Projected Net Revenues from Projected Rates ............................................................. 3 Table 2: Planned Federal Amortization & Irrigation Assistance Payments ............................... 4 Table 3: Composition of Annual Amortization Payments ........................................................ 13 Table 4: FCRPS Projected Capital Funding Requirements ...................................................... 13 Table 5A: Generation Revenue Requirement Income Statement ................................................ 46 Table 5B: Generation Revenue Requirement Statement of Cash Flows ..................................... 47 Table 6A: Generation Current Revenue Test Income Statement ................................................. 48 Table 6B: Generation Current Revenue Test Statement of Cash Flows ...................................... 49 Table 7: Generation Revenues from Current Rates – Results Through the Repayment
Period .......................................................................................................................... 50 Table 8A: Generation Revised Revenue Test Income Statement ................................................ 52 Table 8B: Generation Revised Revenue Test Statement of Cash Flows ..................................... 53 Table 9: Generation Revenues from Proposed Rates – Results Through the Repayment
Period .......................................................................................................................... 54 FIGURE Figure 1: Revenue Requirement Process ....................................................................................... 5
APPENDICES Appendix A: Integrated Program Review (IPR) Appendix B: Repayment Program Tables Table 10: Amortization Summary .....................................................................................B-1
Table 11A: Generation Investments Placed in Service, FY 2010 Study ............................B-2 Table 11B: Federal Principal Payments, BPA, FY 2010 Study .........................................B-3 Table 11C: Component of Capitalized Contract Principal Payments, FY 2010 Study ......B-4 Table 11D: Federal Interest Payments, BPA, FY 2010 Study ............................................B-5 Table 11E: Component of Capitalized Contract Interest Payments, FY 2010 Study .........B-6 Table 11F: Summary of Payments, FY 2010 Study ...........................................................B-7 Table 12A: Generation Investments Placed in Service, FY 2011 Study ............................B-9 Table 12B: Federal Principal Payments, BPA, FY 2011 Study .......................................B-10 Table 12C: Component of Capitalized Contract Principal Payments, FY 2011 Study ....B-11 Table 12D: Federal Interest Payments, BPA, FY 2011 Study ..........................................B-12 Table 12E: Component of Capitalized Contract Interest Payments, FY 2011 Study .......B-13 Table 12F: Summary of Payments, FY 2011 Study ..........................................................B-14 Table 13: Generation, Application of Amortization, FY 2009 – 2061 ...........................B-16
WP-10-E-BPA-02 iii
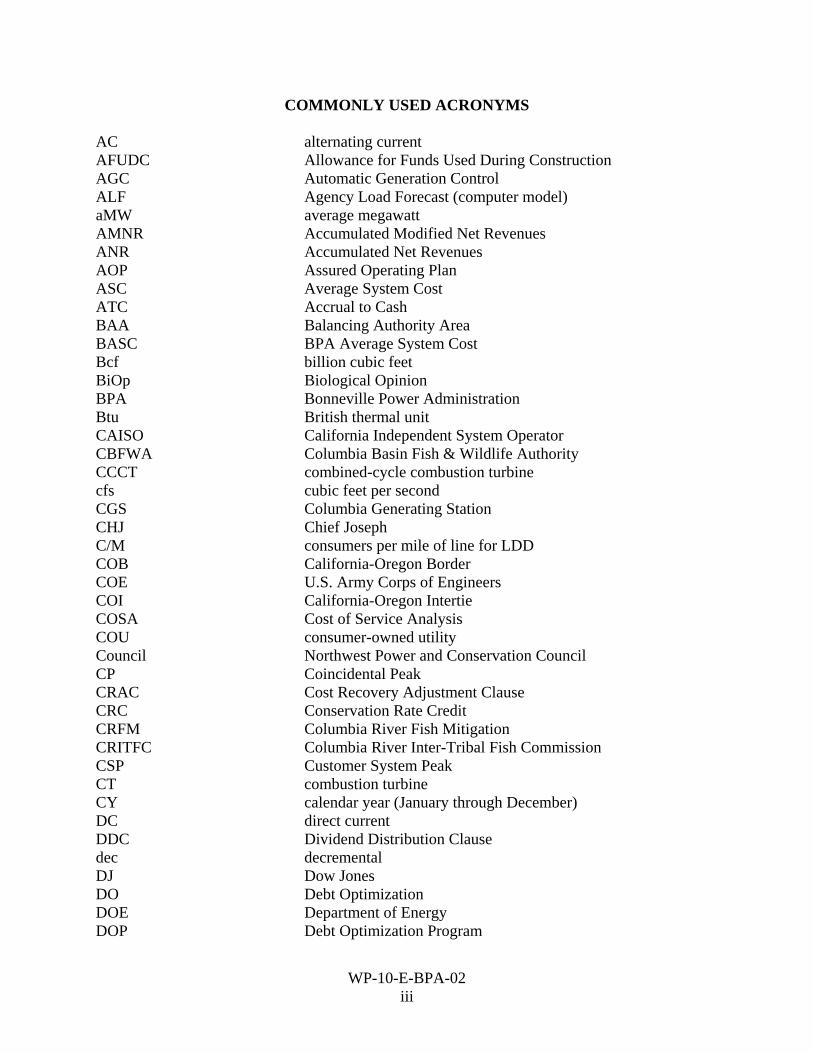
COMMONLY USED ACRONYMS AC alternating current AFUDC Allowance for Funds Used During Construction AGC Automatic Generation Control ALF Agency Load Forecast (computer model) aMW average megawatt AMNR Accumulated Modified Net Revenues ANR Accumulated Net Revenues AOP Assured Operating Plan ASC Average System Cost ATC Accrual to Cash BAA Balancing Authority Area BASC BPA Average System Cost Bcf billion cubic feet BiOp Biological Opinion BPA Bonneville Power Administration Btu British thermal unit CAISO California Independent System Operator CBFWA Columbia Basin Fish & Wildlife Authority CCCT combined-cycle combustion turbine cfs cubic feet per second CGS Columbia Generating Station CHJ Chief Joseph C/M consumers per mile of line for LDD COB California-Oregon Border COE U.S. Army Corps of Engineers COI California-Oregon Intertie COSA Cost of Service Analysis COU consumer-owned utility Council Northwest Power and Conservation Council CP Coincidental Peak CRAC Cost Recovery Adjustment Clause CRC Conservation Rate Credit CRFM Columbia River Fish Mitigation CRITFC Columbia River Inter-Tribal Fish Commission CSP Customer System Peak CT combustion turbine CY calendar year (January through December) DC direct current DDC Dividend Distribution Clause dec decremental DJ Dow Jones DO Debt Optimization DOE Department of Energy DOP Debt Optimization Program

WP-10-E-BPA-02 iv
DSI direct-service industrial customer or direct-service industry EAF energy allocation factor ECC Energy Content Curve EIA Energy Information Administration EIS Environmental Impact Statement EN Energy Northwest, Inc. (formerly Washington Public Power
Supply System) EPA Environmental Protection Agency EPP Environmentally Preferred Power EQR Electric Quarterly Report ESA Endangered Species Act F&O financial and operating reports FBS Federal Base System FCRPS Federal Columbia River Power System FCRTS Federal Columbia River Transmission System FERC Federal Energy Regulatory Commission FELCC firm energy load carrying capability FPA Federal Power Act FPS Firm Power Products and Services (rate) FY fiscal year (October through September) GAAP Generally Accepted Accounting Principles GARD Generation and Reserves Dispatch (computer model) GCL Grand Coulee GCPs General Contract Provisions GEP Green Energy Premium GI Generation Integration GRI Gas Research Institute GRSPs General Rate Schedule Provisions GSP Generation System Peak GSU generator step-up transformers GTA General Transfer Agreement GWh gigawatthour HLH heavy load hour HOSS Hourly Operating and Scheduling Simulator (computer model) HYDSIM Hydro Simulation (computer model) IDC interest during construction inc incremental IOU investor-owned utility IP Industrial Firm Power (rate) IPR Integrated Program Review IRP Integrated Resource Plan ISD incremental standard deviation ISO Independent System Operator JDA John Day kaf thousand (kilo) acre-feet kcfs thousand (kilo) cubic feet per second

WP-10-E-BPA-02 v
K/I kilowatthour per investment ratio for LDD ksfd thousand (kilo) second foot day kV kilovolt (1000 volts) kVA kilo volt-ampere (1000 volt-amperes) kW kilowatt (1000 watts) kWh kilowatthour LDD Low Density Discount LGIP Large Generator Interconnection Procedures LLH light load hour LME London Metal Exchange LOLP loss of load probability LRA Load Reduction Agreement m/kWh mills per kilowatthour MAE mean absolute error Maf million acre-feet MCA Marginal Cost Analysis MCN McNary Mid-C Mid-Columbia MIP Minimum Irrigation Pool MMBtu million British thermal units MNR Modified Net Revenues MOA Memorandum of Agreement MOP Minimum Operating Pool MORC Minimum Operating Reliability Criteria MOU Memorandum of Understanding MRNR Minimum Required Net Revenue MVAr megavolt ampere reactive MW megawatt (1 million watts) MWh megawatthour NCD non-coincidental demand NEPA National Environmental Policy Act NERC North American Electric Reliability Corporation NFB National Marine Fisheries Service (NMFS) Federal Columbia
River Power System (FCRPS) Biological Opinion (BiOp) NIFC Northwest Infrastructure Financing Corporation NLSL New Large Single Load NOAA Fisheries National Oceanographic and Atmospheric Administration
Fisheries (formerly National Marine Fisheries Service) NOB Nevada-Oregon Border NORM Non-Operating Risk Model (computer model) Northwest Power Act Pacific Northwest Electric Power Planning and Conservation
Act NPCC Northwest Power and Conservation Council NPV net present value NR New Resource Firm Power (rate) NT Network Transmission

WP-10-E-BPA-02 vi
NTSA Non-Treaty Storage Agreement NUG non-utility generation NWPP Northwest Power Pool OATT Open Access Transmission Tariff O&M operation and maintenance OMB Office of Management and Budget OTC Operating Transfer Capability OY operating year (August through July) PDP proportional draft points PF Priority Firm Power (rate) PI Plant Information PMA (Federal) Power Marketing Agency PNCA Pacific Northwest Coordination Agreement PNRR Planned Net Revenues for Risk PNW Pacific Northwest POD Point of Delivery POI Point of Integration or Point of Interconnection POM Point of Metering POR Point of Receipt Project Act Bonneville Project Act PS BPA Power Services PSC power sales contract PSW Pacific Southwest PTP Point to Point Transmission (rate) PUD public or people’s utility district RAM Rate Analysis Model (computer model) RAS Remedial Action Scheme Reclamation U.S. Bureau of Reclamation RD Regional Dialogue REC Renewable Energy Certificate REP Residential Exchange Program RevSim Revenue Simulation Model (component of RiskMod) RFA Revenue Forecast Application (database) RFP Request for Proposal RiskMod Risk Analysis Model (computer model) RiskSim Risk Simulation Model (component of RiskMod) RMS Remote Metering System RMSE root-mean squared error ROD Record of Decision RPSA Residential Purchase and Sale Agreement RTF Regional Technical Forum RTO Regional Transmission Operator SCADA Supervisory Control and Data Acquisition SCCT single-cycle combustion turbine Slice Slice of the System (product) SME subject matter expert

WP-10-E-BPA-02 vii
TAC Targeted Adjustment Charge TDA The Dalles Tcf trillion cubic feet TPP Treasury Payment Probability Transmission System Act Federal Columbia River Transmission System Act TRL Total Retail Load TRM Tiered Rate Methodology TS BPA Transmission Services UAI Unauthorized Increase UDC utility distribution company URC Upper Rule Curve USFWS U.S. Fish and Wildlife Service VOR Value of Reserves WECC Western Electricity Coordinating Council (formerly WSCC) WIT Wind Integration Team WPRDS Wholesale Power Rate Development Study WREGIS Western Renewable Energy Generation Information System WSPP Western Systems Power Pool

WP-10-E-BPA-02 viii
This page intentionally left blank.

WP-10-E-BPA-02 Page 1
1. INTRODUCTION 1
2
The purpose of this Study is to establish the revenues from wholesale power rates necessary to 3
recover, in accordance with sound business principles, the Federal Columbia River Power 4
System (FCRPS) costs associated with the production, acquisition, marketing, and conservation 5
of electric power. The generation revenue requirement includes recovery of the Federal 6
investment in hydro generation, fish and wildlife, and conservation costs; Federal agencies’ 7
operations and maintenance (O&M) expenses allocated to power; capitalized contract expenses 8
associated with non-Federal power suppliers such as Energy Northwest (EN); other power 9
purchase expenses, such as short-term power purchases; power marketing expenses; cost of 10
transmission services necessary for the sale and delivery of FCRPS power; and all other 11
generation-related costs incurred by the Administrator pursuant to law. 12
13
The cost evaluation period, as defined by the Federal Energy Regulatory Commission (FERC), is 14
the period extending from the last year for which historical information is available, through the 15
proposed rate approval period. The cost evaluation period for this rate filing includes Fiscal 16
Year (FY) 2009 as well as the proposed rate approval period (rate test period) of FYs 2010 and 17
2011. This Study for the rate test period FY 2010-2011 is based on generation revenue 18
requirements that include the results of generation repayment studies. This Study does not 19
include revenue requirements or a cost recovery demonstration for BPA’s transmission function. 20
21
This Study outlines the policies, forecasts, assumptions, and calculations used to determine 22
revenue requirements. Chapter 5 of this Study summarizes the legal requirements related to 23
revenue requirements and repayment studies. Volumes 1 and 2 of the Revenue Requirement 24
Study Documentation, WP-10-E-BPA-02A and WP-10-E-BPA-02B, respectively, contain key 25
WP-10-E-BPA-02 Page 2
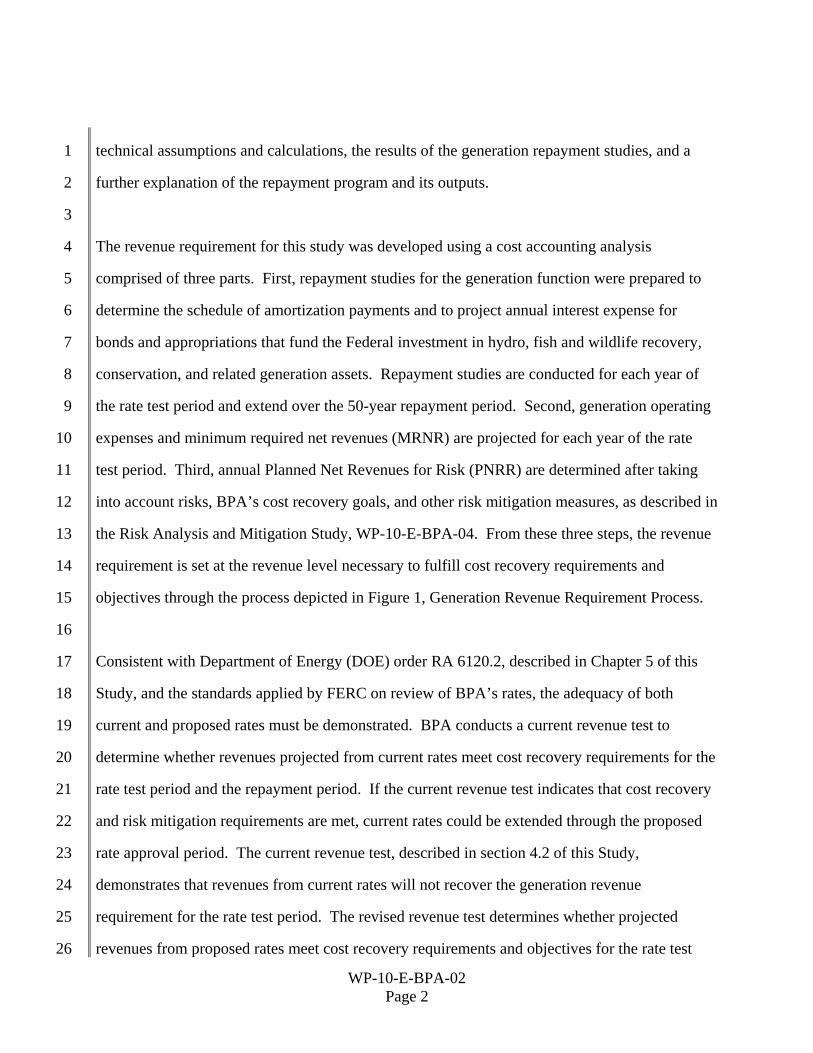
technical assumptions and calculations, the results of the generation repayment studies, and a 1
further explanation of the repayment program and its outputs. 2
3
The revenue requirement for this study was developed using a cost accounting analysis 4
comprised of three parts. First, repayment studies for the generation function were prepared to 5
determine the schedule of amortization payments and to project annual interest expense for 6
bonds and appropriations that fund the Federal investment in hydro, fish and wildlife recovery, 7
conservation, and related generation assets. Repayment studies are conducted for each year of 8
the rate test period and extend over the 50-year repayment period. Second, generation operating 9
expenses and minimum required net revenues (MRNR) are projected for each year of the rate 10
test period. Third, annual Planned Net Revenues for Risk (PNRR) are determined after taking 11
into account risks, BPA’s cost recovery goals, and other risk mitigation measures, as described in 12
the Risk Analysis and Mitigation Study, WP-10-E-BPA-04. From these three steps, the revenue 13
requirement is set at the revenue level necessary to fulfill cost recovery requirements and 14
objectives through the process depicted in Figure 1, Generation Revenue Requirement Process. 15
16
Consistent with Department of Energy (DOE) order RA 6120.2, described in Chapter 5 of this 17
Study, and the standards applied by FERC on review of BPA’s rates, the adequacy of both 18
current and proposed rates must be demonstrated. BPA conducts a current revenue test to 19
determine whether revenues projected from current rates meet cost recovery requirements for the 20
rate test period and the repayment period. If the current revenue test indicates that cost recovery 21
and risk mitigation requirements are met, current rates could be extended through the proposed 22
rate approval period. The current revenue test, described in section 4.2 of this Study, 23
demonstrates that revenues from current rates will not recover the generation revenue 24
requirement for the rate test period. The revised revenue test determines whether projected 25
revenues from proposed rates meet cost recovery requirements and objectives for the rate test 26

WP-10-E-BPA-02 Page 3
and repayment periods. The revised revenue test, contained in section 4.3 of this Study, 1
demonstrates that revenues from the proposed wholesale power rates recover generation costs in 2
the rate test period as well as over the ensuing 50-year repayment period. Rate test period costs 3
are projected to be recovered with a very high confidence level, meeting BPA’s 95 percent 4
probability standard that all U.S. Treasury payments in the generation function will be recovered 5
on time and in full through wholesale power rates for a two-year period. See the Risk Analysis 6
and Mitigation Study, WP-10-E-BPA-04. 7
8
Table 1 summarizes the revised revenue test and shows projected net revenues from proposed 9
rates for FY 2010-2011. These net revenues are the lowest level necessary to achieve BPA’s 10
cost recovery objectives, when combined with other risk mitigation tools, given hydro condition 11
uncertainty, market price volatility, and other risks. 12
13
Table 1: Projected Net Revenues from Projected Rates 14
($000s) 15
16 A B 17 FY 2010 FY 2011 18
Projected Revenues from Proposed Rates $2,994,386 $3,132,066 19 Projected Expenses 2,814,032 3,092,935 20 Net Revenues $184,354 $39,131 21
22
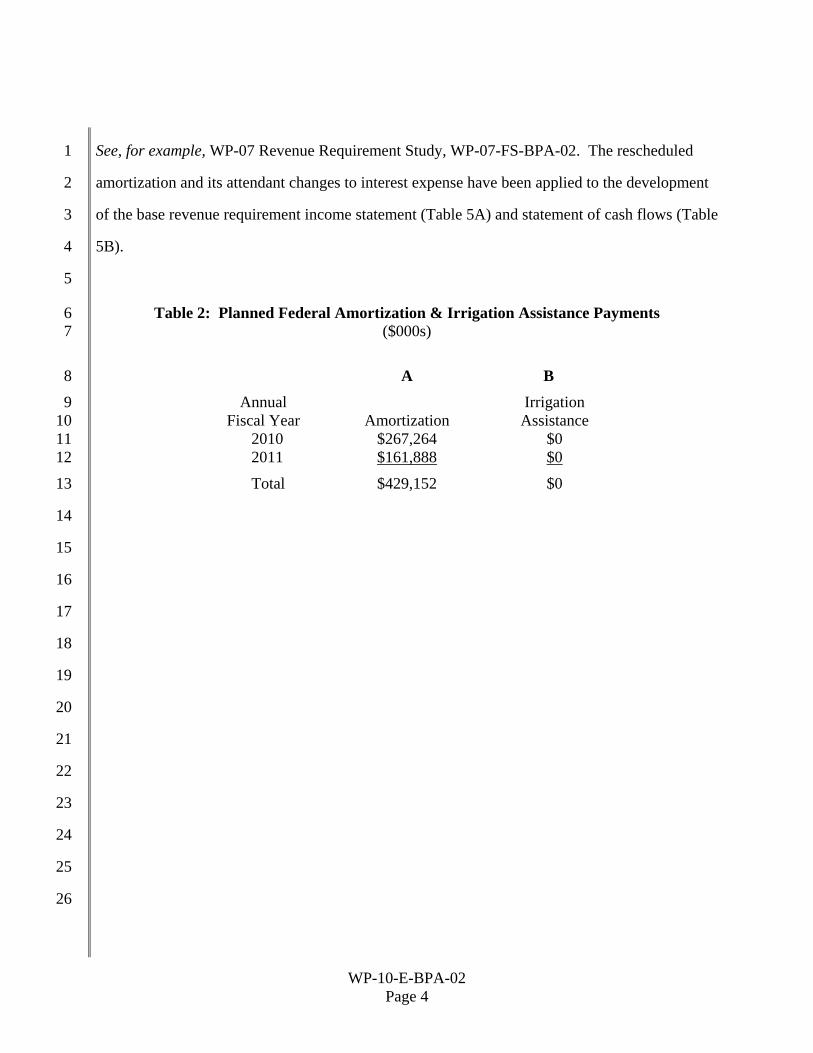
Table 2 shows planned generation amortization payments to the U.S. Treasury during the rate 23
test period and irrigation assistance payments that are due to be paid from power revenues. To 24
partially compensate for an unexpected and unintended cost shift between Slice and other 25
preference customers, it was necessary to shift $50 million in planned amortization from 26
FY 2011 to FY 2010. This was accomplished without changing the total amount planned for the 27
rate period. This reshaping amortization has been a longstanding practice in BPA rate proposals. 28
WP-10-E-BPA-02 Page 4
See, for example, WP-07 Revenue Requirement Study, WP-07-FS-BPA-02. The rescheduled 1
amortization and its attendant changes to interest expense have been applied to the development 2
of the base revenue requirement income statement (Table 5A) and statement of cash flows (Table 3
5B). 4
5
Table 2: Planned Federal Amortization & Irrigation Assistance Payments 6 ($000s) 7
A B 8 Annual Irrigation 9 Fiscal Year Amortization Assistance 10 2010 $267,264 $0 11 2011 $161,888 $0 12
Total $429,152 $0 13
14
15
16
17
18
19
20
21
22
23
24
25
26

WP-10-E-BPA-02 Page 5
Figure 1: Revenue Requirement Process 1
2
3
4
5
6
7
8
9
10
11
12
13
14
15
16
17
18
19
20
21
22
23
WP-10-E-BPA-02 Page 6
2. SPENDING LEVEL DEVELOPMENT 1
2
2.1 Development Process for WP-10 Initial Proposal Spending Levels 3
The development of specific program spending levels reflected in this Initial Proposal occurred 4
primarily in the Integrated Program Review (IPR), a sub-process of the Integrated Business 5
Review (IBR). The Integrated Business Review process was designed in response to the interest 6
expressed by participants in the Regional Dialogue process in having a long-term cost control 7
process that allows customers meaningful input. 8
9
2.1.1 Regional Dialogue 10
The Regional Dialogue process evolved out of an effort sponsored jointly by BPA and the 11
Northwest Power and Conservation Council (NPCC) to outline how BPA should market the 12
power generated by the FCRPS. The first phase addressed issues needing immediate resolution 13
for the post-2006 rate period and culminated in the Policy for Power Supply Role for Fiscal 14
Years 2007-2011 and record of decision (ROD) (Near-Term Policy and ROD), issued in 15
February 2005. The second phase addressed post-FY 2011 power service issues and culminated 16
in the Long-Term Regional Dialogue Final Policy and ROD issued in July 2007. 17
18
In the Long-Term Policy BPA committed to establish a regional cost review and cost control 19
process that would, among other things, address agency capital and expense levels in one forum 20
and examine major anticipated financial policy decisions that could affect rates. The process 21
would put an emphasis on rate period costs prior to rate cases and ensure regular access to clear 22
and transparent financial information and frequent opportunities for meaningful input into BPA 23
cost and program decisions during rate periods as well. After BPA conducted a public comment 24
period and held focus groups to obtain customer and constituent input on the structure of the 25
regional cost review process, BPA designed the IBR. 26

WP-10-E-BPA-02 Page 7
1
2.1.2 Integrated Business Review 2
Although the Long-Term Policy and ROD focus on post-FY 2011 issues, BPA chose to 3
implement the cost review process, now known as the IBR, as soon as practicable. The IBR was 4
first used in support of the WP-07 Supplemental rate case. It entails two processes, the IPR and 5
the Quarterly Business Review (QBR). The IPR was designed to create a centralized forum for 6
addressing and reviewing power and transmission proposed program spending levels prior to 7
inclusion in a rate case. The QBR is an ongoing forum designed to update and inform customers 8
and constituents of the current financials, cost trends, and emerging issues that could affect rates 9
in the future. 10
11
BPA will revisit the IBR process at least every five years to review whether it is meeting the 12
needs of BPA and its stakeholders. 13
14
2.1.3 Integrated Program Review 15
The IPR was designed to provide customers and constituents with an opportunity to examine, 16
understand, and comment on BPA’s cost projections for both power and transmission rate 17
proposals. BPA began the IPR for FY 2010-2011 program levels on May 15, 2008, with an 18
opening workshop containing an overview of all Power Services and Transmission Services 19
proposed spending levels through FY 2011. After completion of the opening workshop, a total 20
of eight days of technical workshops and one managerial level workshop were held through 21
July 30, 2008, on FY 2010-2011 Power Services program levels. These workshops were held to 22
discuss the projected spending levels and capital programs of the Columbia Generating Station 23
(CGS), U.S. Army Corps of Engineers (COE), U.S. Bureau of Reclamation (Reclamation), 24
conservation program, renewables program, fish and wildlife program, Power Services internal 25
operations, transmission purchases and ancillary services program, and BPA corporate costs. 26

WP-10-E-BPA-02 Page 8
While Federal and non-Federal debt management issues are not decided in the IPR, workshops 1
were held on these topics because BPA believes it is important for participants to understand the 2
implications of past debt management decisions and proposed capital spending levels. 3
4
Comments gathered in these forums included an early request by participants for additional 5
information about possible alternative program levels. On July 29, BPA released a “draft 6
report.” The draft report did not propose different spending levels for the FY 2010-2011 period, 7
although it did provide two illustrative scenarios for each program, one that explored the impacts 8
of a 10-percent increase and one that explored the impacts of a 10-percent decrease in proposed 9
program spending levels. This material was also presented and discussed at the July 30 10
workshop. 11
12
The public comment period ran from May 15, 2008, to August 15, 2008. Based on comments 13
received during the IPR process, BPA changed some forecasted program spending levels for the 14
WP-10 Initial Proposal. These changes included an $18 million reduction to Conservation 15
capital in FY 2010 and a $10 million reduction to Conservation capital in FY 2011. The 16
renewable rate credit, originally proposed to be zero in the initial IPR, has been increased to 17
$4 million in FY 2010 and $2.5 million in FY 2011. Many of the forecasts in the initial IPR 18
were not modified. However, BPA committed to an additional, abbreviated IPR process outside 19
of this rate proceeding during the spring of 2009 to review spending forecasts for FY 2010-2011, 20
considering any new information available at that time, and to update forecasts if necessary. The 21
result of that process will be reflected in the Final Proposal. 22
23
The IPR FY 2010-2011 Power and Transmission Program Levels Final Report, included in 24
Appendix A of this Study, describes in greater detail the outcomes of the IPR process. 25
26

WP-10-E-BPA-02 Page 9
2.2 Capital Funding 1
The forecast of FCRPS capital investments for FY 2010-2011 was updated in the IPR for the 2
WP-10 Initial Proposal. The following section reflects forecasts developed in the IPR with 3
inclusion of a 15 percent “lapse factor,” recognizing that timing of planned capital spending may 4
be stretched into the following rate period. The lapse factor was applied to all programs except 5
the Fish and Wildlife Program and CGS. FCRPS capital investments include COE, Reclamation, 6
and BPA capital investments as well as third-party resource investments for which debt is 7
secured by BPA (capitalized contracts). Projections of current FCRPS capital outlays are 8
$1,254 million for the cost evaluation period. These investments include: 9
• improvements and maintenance needed to increase reliability, safety, and 10
performance at the Columbia Generating Station nuclear plant (CGS); 11
• improvements and maintenance needed to improve reliability of the aging and 12
deteriorating Federal hydro system; 13
• increase in the renewable rate credit to reflect the expectation that utilities are 14
likely to need additional assistance in acquiring and using renewable resource 15
power to serve their retail loads; 16
• investment in conservation activities; and 17
• investment in capital equipment. 18
19
Table 4, which follows this section, provides a detailed breakout of investment projections for 20
the cost evaluation period, FY 2009 through 2011. This Study projects that no capital 21
investments will be funded from current revenues. 22
23
2.2.1 Bonds Issued to the U.S. Treasury 24
Bonds issued to the U.S. Treasury are the source of capital that will be used to finance 25
FY 2010-2011 BPA capital program investments and COE and Reclamation investments that 26

WP-10-E-BPA-02 Page 10
BPA has agreed to direct-fund under Section 2406 of P.L. No. 102-486, 16 U.S.C. § 839d-1. 1
These expenditures include a projection of $558.9 million split among BPA Fish and Wildlife 2
direct program investments ($328.7 million), conservation investments ($71.4 million), BPA 3
capital equipment ($28.8 million), and generating resource investments of the COE and 4
Reclamation ($328.7 million) during FY 2010-2011. 5
6
Interest rates on bonds issued by BPA to the U.S. Treasury are set at market interest rates 7
comparable to interest rates on securities issued by other agencies of the U.S. Government. 8
Interest rates on bonds projected to be issued are included in Chapter 6 of Volume 1 of the 9
Documentation, WP-10-E-BPA-02A. 10
11
2.2.2 Federal Appropriations 12
The revenue requirement study, in general, reflects that all COE and Reclamation capital 13
investments in the FCRPS will be financed by Federal appropriations unless they are 14
direct-funded by BPA. This Study includes projected appropriated investments totaling 15
$184 million during the rate period for COE fish and wildlife mitigation and recovery measures 16
through the Columbia River Fish Mitigation (CRFM) project. No other appropriations-financed 17
investments are forecast for the rate period. Capital investments funded by this source do not 18
become BPA’s obligation until placed in service. 19
20
The interest rate forecast for appropriated capital investments expected to be placed in service is 21
found in Chapter 6 of Volume 1 of the Documentation, WP-10-E-BPA-02A. Each new capital 22
investment is assigned a rate from the U.S. Treasury yield curve prevailing in the month prior to 23
the beginning of the fiscal year in which the new investment is placed in service. 24
25

WP-10-E-BPA-02 Page 11
To determine interest during construction for new capital investments, the prevailing U.S. 1
Treasury one-year rate for each fiscal year of construction is applied to the sum of the cumulative 2
expenditures made and interest during construction that has accrued prior to the end of the 3
subject fiscal year. See Study Chapter 5 and Documentation, WP-10-E-BPA-02A, Chapter 9. 4
5
2.2.3 Third-Party Debt 6
Third-party debt differs from U.S. Treasury debt in that entities other than BPA or U.S. Treasury 7
issue the debt. BPA’s promise to make payments serves as security for bonds or other debt that 8
the third party issues, resulting in wider market access and potentially more favorable interest 9
rates for the seller. Examples of acquisitions financed in this way include the Energy Northwest, 10
Inc. (EN) WNP-1, WNP-3, and CGS nuclear power projects, and the Lewis County Public 11
Utility District Hydroelectric project (Cowlitz Falls). This Study includes debt service on 12
$146.6 million in total projected CGS capital investments by EN to be financed by issuing bonds 13
in FY 2010 and 2011. Each new projected capital investment is assigned an interest rate from 14
the tax exempt municipal bond yield curve corresponding with the term of the bond, as shown in 15
Chapter 6 of Volume 1 of the Documentation, WP-10-E-BPA-02A. 16
17
2.3 Debt Optimization Program 18
After base power rates were filed for the FY 2002-2006 rate period, BPA instituted a Debt 19
Optimization Program (DOP) with EN as a means of replenishing Treasury borrowing authority. 20
Debt Optimization (DO) involves extending EN debt that has come due and using the cash flows 21
that would have gone to pay the EN debt to repay an equivalent amount of Federal debt. The 22
program has resulted in a considerable amount of Federal debt, primarily bonds issued to 23
Treasury but also some Congressional appropriations, being paid well in advance of the 24
amortization schedules established in the WP-02 rate filing. As the program continued during 25
the FY 2007-2009 rate period, this created additional advance amortization, compared to the 26

WP-10-E-BPA-02 Page 12
schedules that would have been established without DO, for the subsequent rate periods through 1
FY 2012. Effectively, the extension of EN debt into the FY 2013-2018 period has advanced the 2
repayment of Federal debt relative to the amount that otherwise would have been scheduled to be 3
paid in that period. BPA has committed to EN that it would follow this program, matching 4
dollar-for-dollar the repayment of Federal obligations in the same year in which EN debt has 5
been extended, absent dire financial circumstances that might cause some delay in the payment 6
of the advanced portion of the amortization. 7
8
Although DO actions may occur during the cost evaluation period, only EN debt refinancing 9
transactions completed through FY 2008 are incorporated in the development of this rate 10
proposal. However, in establishing amortization schedules for FY 2010-2011, EN bonds that 11
were refinanced in FY 2001-2002 more than 90 days in advance of their due dates, known as 12
advanced refundings, are taken into account in preparing repayment studies in order to fulfill the 13
commitment for the dollar-for-dollar repayment of Federal obligations. The total planned annual 14
amortization was derived through a two-phase repayment study procedure. A base level of 15
amortization was established for each year of the rate period as though EN advanced refundings 16
had not occurred. The additional amortization equivalent to the EN principal advance refinanced 17
in each year was then added to the base schedule. Table 3 shows the composition of the 18
resulting planned annual amortization payments. 19
20
21

WP-10-E-BPA-02 Page 13
($ in millions) A B CCapital Requirements for Revenue Producing Investments 2009 2010 2011
1 Corps & Bureau Additions/Replacements - Direct Funded 133.2 157.9 170.9
2 Corps & Bureau Additions/Replacements - Appropriations 1 - - - 3 PBL Capital Equipment 16.5 13.9 15.0
4 CGS: Additions/Replacements 2 27.7 92.0 54.6 5 Other Non - Federal - - -
6 Annual Capital Requirements for Revenue Producing Investments 177.4 263.7 240.4 7 Cumulative Capital Requirements for Rev Producing Investments 177.4 441.2 681.6
Capital Requirements for Non-Revenue Producing and Public Benefit Investments8 Energy Conservation 27.2 32.3 39.1 9 Fish Investment10 BPA Fish and Wildlife Investment 50.0 70.0 60.0 11 Corps & Bureau Fish Investment - Appropriations 110.0 88.0 96.0 12 Total Fish Investment 160.0 158.0 156.0 13 Other Third - Party - - -
14 Annual Capital Req. for Non-Rev. & Public Benefit Invests. 187.2 190.3 195.1 15 Cumulative Capital Req. for Non-Rev. & Public Benefit Invest. 187.2 377.5 572.6
16 ANNUAL FUNDING REQUIREMENTS FOR POWER 364.6 454.0 435.5 17 CUMULATIVE FUNDING REQUIREMENTS FOR POWER FOR THE RATE PERIOD 364.6 818.7 1,254.2
FOOTNOTES:1 Reflects plant in service, including IDC, not expenditures. 2 CGS new capital requirements were revenue-financed prior to FY 2002.
FY 2009 includes bond amounts for capital to be issued for Energy Northwest FY 2010.
Table 3: Composition of Annual Amortization Payments 1 ($000s) 2
A B C 3 Base Advanced Total 4 Fiscal Year Amortization Amortization Amortization 5 2010 $176,670 $ 38,500 $215,170 6 2011 $150,342 $ 70,000 $220,342 7 Total $327,012 $108,500 $435,512 8
9
Table 4: FCRPS Projected Capital Funding Requirements 10
11
12
13
14
15
16
17
18
19
20
21
22
23
24
25

WP-10-E-BPA-02 Page 14
3. DEVELOPMENT OF REVENUE REQUIREMENTS 1
2
Typically, repayment studies are performed as the first step in determining revenue requirements. 3
The studies establish a schedule of annual U.S. Treasury amortization for the rate test period and 4
the resulting interest payments. Each repayment study covers a rate test year and the ensuing 5
repayment period, which extends to the last year by which all outstanding and projected 6
obligations must be repaid. For power repayment studies that is 50 years. 7
8
In conducting the repayment studies, BPA includes as fixed inputs the annual debt service 9
payments associated with its capitalized contract obligations and the fixed annual payments 10
associated with long-term energy resource acquisition contracts. All outstanding and projected 11
generation repayment obligations for appropriated investments (including irrigation assistance) 12
and bonds issued to the U.S. Treasury are included to be scheduled for repayment. Funding for 13
replacements projected during the repayment period are also included in the repayment study, 14
consistent with the requirements of RA 6120.2. 15
16
Appropriations are scheduled to be repaid within the expected useful life of the associated 17
facility or 50 years, whichever is less. COE and Reclamation project replacements funded by 18
appropriations and placed in service in 1994 or later have repayment periods that are set at the 19
weighted average service life of all replacements going into service at that project in that year. 20
21
Bonds issued by BPA to the U.S. Treasury may include 3-year to 45-year terms, taking into 22
account the estimated average service lives for investments and prudent financing and cash 23
management factors. Some bonds are issued with a provision that allows the bond to be called 24
after a certain time, typically five years. Bonds may also be issued with no early call provision. 25
Early retirement of eligible bonds requires that BPA pay a bond premium to the U.S. Treasury. 26

WP-10-E-BPA-02 Page 15
In addition, the interest rate that BPA pays on callable bonds is higher than the interest rate on 1
non-callable bonds issued at the same time. 2
3
Bonds are issued to finance BPA conservation acquisition, the Fish and Wildlife Program, and 4
COE and Reclamation investments direct-funded by BPA, and are repaid within the terms and 5
conditions of each bond issued to the U.S. Treasury. Bonds to finance fish and wildlife capital 6
investments are issued with maturities not to exceed 15 years, the same period over which BPA 7
amortizes these capital investments. COE and Reclamation direct-funding bonds are issued with 8
maturities not to exceed 45 years. Conservation bonds are issued with maturities that are 9
consistent with the period over which BPA amortizes these capital investments. Currently, BPA 10
has three amortization schedules for conservation assets. Investments made prior to FY 2002, 11
referred to as the Conservation Legacy program, have a straight-line, 20-year amortization 12
period. Investments made from FY 2002 through FY 2006, known as Conservation 13
Augmentation investments, have a declining 10-year amortization period to be completed by 14
2011. Investments made beginning in FY 2007, known as Conservation Acquisition 15
investments, will have a straight-line five-year amortization period. See Administrator’s Record 16
of Decision, WP-07-A-02, section 4.4. 17
18
Based on these parameters, the repayment study establishes a schedule of planned amortization 19
payments and resulting interest expense by determining the lowest levelized debt service stream 20
necessary to repay all generation obligations within the required repayment period. 21
22
Further discussion of the repayment program and tables is included in Appendix B of this Study, 23
WP-10-E-BPA-02, and in Chapter 9 of Volume 2 of the Documentation, WP-10-E-BPA-02B. 24
Chapter 5 of this Study provides explanation of repayment policies and requirements. 25
26

WP-10-E-BPA-02 Page 16
4. GENERATION REVENUE REQUIREMENT 1
2
4.1 Revenue Requirement Format 3
For each year of a rate test period, BPA prepares two tables that constitute the process by which 4
revenue requirements are determined. The Income Statement includes projections of Total 5
Expenses, PNRR, and if necessary, an MRNR component. The Statement of Cash Flows shows 6
the analysis used to determine MRNR and the cash available for risk mitigation. 7
8
The Income Statement (Table 5A) displays the components of the annual revenue requirements, 9
which include Total Operating Expenses (Line 20), Net Interest Expense (Line 29), and Total 10
Planned Net Revenues (Line 33), which consist of MRNR (Line 31), and PNRR (Line 32). The 11
sum of these three major components is the Total Revenue Requirement (Line 34). 12
13
The amounts shown in Total Operating Expenses and Net Interest Expense are primarily 14
established outside the ratesetting process in the IPR. The MRNR (Line 31) results from an 15
analysis of the Statement of Cash-Flow (Table 5B). MRNR may be necessary to ensure that 16
revenue requirements are sufficient to cover all cash requirements, including annual amortization 17
of the Federal investment as determined in the power repayment studies and any other cash 18
requirements, such as irrigation assistance payments. 19
20
The Statement of Cash-Flow analyzes annual cash inflows and outflows. Cash provided by 21
Current Operations (Line 8), driven by the Non-Cash items shown in Lines 4, 5, 6, and 7, must 22
be sufficient to compensate for the difference between Cash Used for Capital Investments 23
(Line 14) and Cash from Treasury Borrowing and Appropriations (Line 21). If cash provided by 24
Current Operations is not sufficient, MRNR must be included in revenue requirements to 25
accommodate the shortfall, yielding at least zero annual Increase in Cash (Line 22). The MRNR 26

WP-10-E-BPA-02 Page 17
amounts shown on the Statement of Cash Flows (Line 2) are then incorporated in the Income 1
Statement (Line 27). 2
3
4.1.1 Income Statement 4
Below is a line-by-line description of the components in the Income Statement (Table 5A). 5
Volume 1 of the Documentation, WP-10-E-BPA-02A, provides additional information on the 6
development and use of the data contained in the tables. 7
8
Power System Generation Resources (Line 2). This category encompasses the costs 9
associated with power generated by Federal hydroelectric facilities operated by the COE and 10
Reclamation and power obtained through contracts for non-Federal resources and through energy 11
conservation. This category includes lines 3 through 11, described below. 12
13
Operating Generation Resources (Line 3). This category includes the operations and 14
maintenance expenses associated with power-producing resources including the CGS, 15
Reclamation, and COE, and the annual expenses associated with long-term contract generating 16
projects. 17
18
Operating Generation Settlement Payments (Line 4). A settlement agreement 19
between the Confederated Tribes of the Colville Reservation and the United States was signed in 20
2004 concerning the construction of Grand Coulee Dam. The Settlement Act (Public Law 21
103-436) ratifying the settlement agreement authorizes BPA to make annual payments to the 22
Tribes for the use of tribal lands for power production at the Columbia Basin project. 23
24
Non-Operating Generation (Line 5). This category includes the decommissioning 25
costs of the Trojan nuclear plant and the unfinished WNP-1 and WNP-3 nuclear plants. 26
WP-10-E-BPA-02 Page 18
1
Contracted Power Purchases (Line 6). This category includes short-term (balancing) 2
power purchases and hedging/mitigation. 3
4
Augmentation Power Purchases (Line 7). This category includes augmentation power 5
purchases, the DSI monetized power sale, and the PNCA headwater benefit. Augmentation 6
power purchase costs reflect the energy that BPA purchases in order to satisfy its obligation to 7
meet the load requirements for public utilities. The PNCA headwater benefit refers to the costs 8
associated with benefits BPA receives from storage projects in Canada. 9
10
Exchanges and Settlements (Line 8). This category represents the net benefits for 11
qualifying public utilities and IOUs that are calculated as part of the Residential Exchange 12
Program as well as the cost for operating the program. 13
14
Renewable Generation (Line 9). This category reflects the operating expenses of 15
several generating projects fueled by renewable energy resources such as wind, geothermal, 16
methane gas, solar, and “fish-friendly small hydro projects.” 17
18
Generation Conservation (Line 10). This category includes the cost of conservation 19
programs including Marketing Development, which are reimbursable contracts with equal and 20
offsetting revenues, Market Transformation, Legacy Conservation programs, Technology 21
Leadership, and Low-Income Weatherization. 22
23
24
WP-10-E-BPA-02 Page 19
Conservation and Renewable Discount (Line 11). This category includes credits paid 1
to qualifying BPA customers that have taken action to achieve cost-effective conservation and 2
renewable resource development in the region. 3
4
Transmission Acquisition and Ancillary Services (Line 12). This category includes 5
the annual expenses associated with Power Services’ Transmission Acquisition program. It 6
represents costs associated with services necessary to deliver energy from resources to markets 7
and loads. This includes transmission, ancillary services, and real power losses, as purchased 8
from BPA's Transmission Services business unit (TS) or non-Federal entities; TS embedded 9
costs for the facilities that integrate power from COE and Reclamation projects onto the 10
transmission system; and metering and communication requirements. 11
12
Power Non-Generation Operations (Line 13). This category reflects Power Services’ 13
internal costs associated with supporting the power function. It includes the costs of activities 14
such as generation oversight, weather and streamflow forecasting, system operations planning, 15
schedule planning, pre-scheduling, after-the-fact accounting of power transactions, power 16
billing, customer account executives and customer service support staff, development and 17
administration of power sales contracts, PS strategy development, PS financial reporting, 18
analysis and budgeting, risk management, and PS human resources management. 19
20
F&W/Environmental Requirements (Line 14). BPA funds projects designed to 21
protect, mitigate and enhance fish and wildlife affected by the FCRPS in a manner consistent 22
with the NPCC Columbia River Basin Fish and Wildlife Program, and to implement 23
commitments made pursuant to Biological Opinions (BiOps) issued by NOAA Fisheries and the 24
U.S. Fish and Wildlife Service regarding species listed under the Endangered Species Act. This 25
line item includes the expense portion of BPA’s Fish and Wildlife direct program, including staff 26
WP-10-E-BPA-02 Page 20
costs and operating expenses of fish and wildlife activities. These activities include measures to 1
implement the fish and wildlife mitigation consistent with the NPCC Fish and Wildlife Program 2
as well BiOps issued by the NOAA Fisheries (also known as the National Marine Fisheries 3
Service (NMFS)) for listed salmon and steelhead and the U.S. Fish and Wildlife Service 4
(USFWS) for listed bull trout and sturgeon. 5
6
General and Administrative/Shared Services (Line 15). This category represents the 7
allocated portion of BPA’s Corporate General and Administrative costs, which are allocated to 8
the business lines. Major functions besides the Executive Office are Corporate Communication, 9
Finance, Diversity, and Safety. This category also includes Shared Services and the Civil 10
Service Retirement System (CSRS) expense. Shared Services represents the costs for 11
information technology services, infrastructure and maintenance, building rent, maintenance and 12
security, mail services, personnel services, library and printing services, internal training, 13
purchasing, and furniture. CSRS reflects the costs for the unfunded liability of the Civil Service 14
Retirement and Disability Fund, the Employees Health Benefit Fund, and the Employees Life 15
Insurance Fund. 16
17
Other Income, Expenses, and Adjustments (Line 16). This category consists of the 18
annual cost of the Flexible PF Rate Program. 19
20
Non-Federal Debt Service (Line 17). This category consists of third-party debt service 21
or payment costs associated with capitalized contracts and other long-term, fixed contractual 22
obligations. Debt service costs associated with EN projects (WNP-1, CGS, and WNP-3) make 23
up the majority of these costs. Documentation, WP-10-E-BPA-02A, Chapter 9. 24
25
26
WP-10-E-BPA-02 Page 21
Depreciation (Line 18). Depreciation is the annual capital recovery expense associated 1
with FCRPS plant-in-service. Reclamation and COE (including Lower Snake River Fish and 2
Wildlife Compensation Plan (LSRCP)) plant, including assets for fish and wildlife recovery, is 3
depreciated by the straight-line method of calculation, using the composite service life of all 4
projects, 75 years. Capital equipment (office furniture and fixtures, data processing hardware 5
and software, and communications equipment) is also depreciated by the straight-line method 6
using the average service lives for the particular categories of capital investment. Id., Chapters 3 7
and 4. 8
9
Amortization (Line 19). Amortization is the annual capital recovery expense associated 10
with non-revenue-producing assets. Conservation investments are amortized over three different 11
periods, as described in Chapter 3. Legacy conservation investments prior to the FY 2002-2006 12
rate period are amortized using a straight-line, 20-year life. Conservation Augmentation 13
investments in the FY 2002-2006 period are amortized using a declining life method, with all 14
amortization being complete in FY 2011. Conservation Acquisition investments beginning in 15
FY 2007 are amortized using a straight-line, five-year life. Id. 16
17
Total Operating Expenses (Line 20). Total Operating Expenses is the sum of the above 18
expenses (Lines 2 through 15). 19
20
Interest on Appropriated Funds (Line 23). Interest on Appropriated Funds includes 21
interest on COE and Reclamation appropriations, as calculated in the generation repayment 22
studies. Id., Chapters 4 and 6. 23
24
Capitalization Adjustment (Line 24). Implementation of the Refinancing Act entailed 25
a change in capitalization on BPA’s financial statements. Outstanding appropriations were 26
WP-10-E-BPA-02 Page 22
reduced as a result of the refinancing by $2,142 million in the generation function. The 1
reduction is recognized annually over the remaining repayment period of the refinanced 2
appropriations. The annual recognition of this adjustment is based on the increase in annual 3
interest expense resulting from implementation of the Refinancing Act, as shown in repayment 4
studies for the year of the refinancing transaction (1997). The capitalization adjustment is 5
included on the income statement as a non-cash contra-expense. 6
7
Interest on Bonds Issued to U.S. Treasury (Line 25). Interest on long-term debt 8
includes interest on bonds that BPA issues to the U.S. Treasury to fund investments in capital 9
equipment, conservation, and fish and wildlife, and to fund Reclamation and COE investments 10
under the Energy Policy Act of 1992 (EPA-92) (P.L. No. 102-486, 1992 U.S. Code Cong. & 11
Admin. News, 106 Stat. 2776). The interest expense is calculated in the generation repayment 12
studies. Any payments of call premiums for bonds projected to be amortized are included in this 13
line. Documentation, WP-10-E-BPA-02A, Chapters 4 and 6. 14
15
Amortization of Capitalized Bond Premiums (Line 26). When a bond issued to the 16
U.S. Treasury is refinanced, any call premium resulting from early retirement of the original 17
bond is capitalized and included in the principal of the new bond. The capitalized call premium 18
is then amortized over the term of the new bond. The annual amortization is a non-cash 19
component of interest expense. 20
21
Allowance for Funds Used During Construction (AFUDC) (Line 27). AFUDC is a 22
credit against interest costs on long-term debt (Line 20). This reduction to gross interest reflects 23
an estimate of interest on the funds used during the construction period of facilities that have yet 24
to be placed in service. AFUDC is capitalized along with other construction costs and is 25
recovered through rates over the expected service life of the related plant as part of the 26

WP-10-E-BPA-02 Page 23
depreciation expense after the facilities are placed in service. AFUDC, which is calculated 1
outside the generation repayment studies, is associated with the COE and Reclamation capital 2
investments direct-funded by BPA and BPA capital equipment. 3
4
Interest Credit (Line 28). An interest income credit is also computed on the projected 5
year-end cash balance in the BPA fund attributable to Power Services that carries over into the 6
next year. Also included is an interest income credit calculated in the generation repayment 7
studies on funds to be collected during each year for payments of Federal interest and 8
amortization at the end of the fiscal year. Interest income is credited against bond interest. Id., 9
at Chapter 6. 10
11
Net Interest Expense (Line 29). Net Interest Expense is computed as the sum of Interest 12
on Appropriated Funds (Line 23), Capitalization Adjustment (Line 24), Interest on Bonds Issued 13
to U.S. Treasury (Line 25), Amortization of Capitalized Bond Premiums (Line 26), AFUDC 14
(Line 27), and Interest Credit (Line 28). 15
16
Total Expenses (Line 30). Total Expenses are the sum of Total Operating Expenses 17
(Line 20) and Net Interest Expense (Line 29). 18
19
Minimum Required Net Revenues (Line 31). MRNR, an input from Line 2 of the 20
Statement of Cash Flows (Table 5B), may be necessary to cover cash requirements in excess of 21
accrued expenses. An explanation of the method used for determining MRNR is included in 22
section 4.1.2. 23
24
Planned Net Revenues for Risk (PNRR) (Line 32). PNRR are the amount of net 25
revenues to be included in rates for financial risk mitigation. PNRR, starting reserves, the 26
WP-10-E-BPA-02 Page 24
cash-flow when non-cash expenses exceed cash payments, the CRAC, and other risk mitigation 1
tools are available to mitigate risk in FY 2007-2009, as discussed in the Risk Analysis and 2
Mitigation Study, WP-10-E-BPA-04. 3
4
Total Planned Net Revenues (Line 33). Total Planned Net Revenues is the sum of 5
Minimum Required Net Revenues (Line 27) and PNRR (Line 28). 6
7
Total Revenue Requirement (Line 30). Total Revenue Requirement is the sum of Total 8
Expenses (Line 31) and Total Planned Net Revenues (Line 32). 9
10
4.1.2 Statement of Cash Flows 11
Below is a line-by-line description of each of the components in the Statement of Cash Flows 12
(Table 5B). Volumes 1 and 2 of the Documentation, WP-10-E-BPA-02A and WP-10-E-BPA-13
02B, provide additional information related to the use and development of the data contained in 14
the table. 15
16
Minimum Required Net Revenues (Line 2). Determination of this line is a result of 17
annual cash inflows and outflows shown on the Statement of Cash Flows. MRNR may be 18
necessary so that the cash provided from operating activities will be sufficient to cover the 19
planned amortization and irrigation assistance payments (the difference between Lines 8 and 21) 20
without causing the Annual Increase (Decrease) in Cash (Line 22) to be negative. The MRNR 21
amount determined in the Statement of Cash Flows is incorporated in the Income Statement 22
(Line 31). 23
24
Depreciation and Amortization (Line 4). Depreciation and Amortization are from the 25
Income Statement (Table 5A), lines 18 and 19 respectively. They are included in computing 26

WP-10-E-BPA-02 Page 25
Cash Provided By Operating Activities (Line 8) because they are non-cash expenses of the 1
FCRPS. 2
3
Amortization of Capitalized Bond Premiums (Line 5). Amortization of capitalized 4
bond premiums is from the Income Statement (Table 5A, line 26). It is included in computing 5
Cash Provided By Operating Activities (Line 8) because it is a non-cash expense of the FCRPS. 6
7
Capitalization Adjustment (Line 6). Capitalization Adjustment is from the Income 8
Statement (Table 5A, Line 24). It is a non-cash contra-expense. 9
10
Accrual Revenues (Line 7). Accrual revenues are primarily associated with settlement 11
agreements reached in prior periods. The annual accrual revenues, which are part of the total 12
revenues recovering the FCRPS revenue requirement, are included here as a non-cash adjustment 13
to cash from current operations. 14
15
Cash Provided By Operating Activities (Line 8). Cash Provided By Current 16
Operations, the sum of Lines 2, 4, 5, 6, and 7, is available for the year to satisfy cash 17
requirements. 18
19
Investment in Federal Utility Plant (Including AFUDC) (Line 11). Investment in 20
Utility Plant represents the annual increase in additions to appropriated plant-in-service and to 21
capital expenditures for COE, Reclamation, and BPA construction work-in-progress funded by 22
bonds. Documentation, WP-10-E-BPA-02A, Chapter 4. 23
24
Investment in Conservation (Line 12). Investment in Conservation represents the 25
annual increase in capital expenditures associated with Conservation programs. Id. 26

WP-10-E-BPA-02 Page 26
Investment in Fish and Wildlife (Line 13). Investment in Fish and Wildlife represents 1
the annual increase in BPA’s capital expenditures to fund projects for the protection, mitigation 2
and enhancement of fish and wildlife affected by the FCRPS in a manner consistent with the 3
NPCC’s Columbia River Basin Fish and Wildlife Program and the BiOp issued by NMFS and 4
USFWS. 5
6
Cash Used for Investment Activities (Line 14). Cash Used for Investment Activities is 7
the sum of Lines 11, 12, and 13. 8
9
Increase in Treasury Debt (Line 16). This category reflects the new bonds issued by 10
BPA to the U.S. Treasury to fund capital equipment, conservation, and fish and wildlife capital 11
programs and to direct-fund Reclamation and COE investments under the EPA-92. Id., 12
Chapter 7. 13
14
Repayment of Treasury Debt (Line 17). This is BPA’s planned repayment of 15
outstanding bonds issued by BPA to the U.S. Treasury as determined in the generation 16
repayment studies. Id., Chapter 6. 17
18
Increase in Federal Construction Appropriations (Line 18). Increase in 19
Congressional Capital Appropriations represents Congressional appropriations projected to be 20
received during the year for COE and Reclamation capital projects. Id., Chapter 4. 21
22
Repayment of Federal Construction Appropriations (Line 19). Repayment of Capital 23
Appropriations represents projected amortization of outstanding COE and Reclamation 24
appropriations as determined in the generation repayment studies. Id., Chapter 6. 25
26

WP-10-E-BPA-02 Page 27
Payment of Irrigation Assistance (Line 20). Payment of Irrigation Assistance 1
represents the payment of appropriated capital construction costs of Reclamation irrigation 2
facilities that have been determined to be beyond the ability of the irrigators to pay and allocated 3
to generation revenues for repayment. Id., Chapter 9. 4
5
Cash Provided by Borrowing and Appropriations (Line 21). Cash Provided by 6
Borrowing and Appropriations is the sum of Lines 16 through 20. This is the net cash-flow 7
resulting from increases in cash from new long-term debt and capital appropriations and 8
decreases in cash from repayment of long-term debt and capital appropriations. 9
10
Annual Increase (Decrease) in Cash (Line 22). Annual Increase (Decrease) in Cash is 11
the sum of Lines 8, 14, and 21 and reflects the annual net cash-flow from current operations and 12
investing and financing activities. Revenue requirements are set to meet all projected annual 13
cash-flow requirements, as included on the Statement of Cash Flows. A decrease shown in this 14
line would indicate that annual revenues would be insufficient to cover the year’s cash 15
requirements. In such cases, Minimum Required Net Revenues are included to offset such 16
decrease. 17
18
Planned Net Revenues for Risk (PNRR) (Line 23). PNRR reflects the amounts 19
included in revenue requirements to meet BPA’s risk mitigation objectives from Table 5A, 20
Line 32. 21
22
Total Annual Increase (Decrease) in Cash (Line 24). Total Annual Increase 23
(Decrease) in Cash is the sum of Lines 22 and 23. It is the total annual cash that is projected to 24
be available to add to BPA’s cash reserves. 25
26
WP-10-E-BPA-02 Page 28
4.2 Current Revenue Test 1
Consistent with RA 6120.2, the continuing adequacy of existing rates must be tested annually. 2
The current revenue test, Tables 6 and 7, determines whether the revenues expected from current 3
rates can continue to meet cost recovery requirements, thus allowing the current rates to be 4
extended. Revenues at current rates can be found in the documentation of the Wholesale Power 5
Rate Development Study (WPRDS), WP-10-E-BPA-05A, section 5. The results of the current 6
revenue test demonstrate that current rates are inadequate to ensure cost recovery. 7
8
4.3 Revised Revenue Test 9
Consistent with RA 6120.2, the adequacy of proposed rates must be demonstrated. The revised 10
revenue test determines whether the revenues projected from proposed rates will meet cost 11
recovery requirements as well as BPA’s Treasury Payment Probability (TPP) standard for the 12
rate period. The revised revenue test was conducted using the base case forecast of revenues 13
under proposed rates. WPRDS Documentation, WP-10-E-BPA-05A, Section 5. The test also 14
included changes in expenses, such as Residential Exchange Benefits, which is an outcome of 15
the rate development process. See Figure 1. 16
17
BPA revised its estimate of the cost of the Residential Exchange Program to an annual average 18
$254.4 million because it is an outcome of the rate development process. Table 5A, which 19
serves as the starting point for the rate development process, included only the operations cost of 20
the program of approximately $2 million per year. This change was incorporated in the revised 21
revenue test, as it is the most current spending level forecast for that program. 22
23
For the rate test period, the demonstration of the adequacy of proposed rates is shown on 24
Tables 8A (Income Statement) and 8B (Cash-Flow Statement). Table 8B, Statements of Cash 25
Flows, tests the sufficiency of the resulting Net Revenues from Table 8A (Line 28) for making 26

WP-10-E-BPA-02 Page 29
the planned annual amortization and irrigation assistance payments and achieving the 1
Administrator’s financial objectives. This is demonstrated by the Annual Increase (Decrease) in 2
Cash (Line 22). The annual cash-flow (Line 22) must be at least zero to demonstrate the 3
adequacy of the projected revenues to cover all cash requirements. The results of the revised 4
revenue test demonstrate that proposed rates are adequate to fulfill the basic cost recovery 5
requirements and meet risk mitigation policy for the rate period of FY 2010-2011. 6
7
4.4 Repayment Test at Proposed Rates 8
Table 9 demonstrates whether projected revenues from proposed rates are adequate to meet the 9
cost recovery criteria of RA 6120.2 over the repayment period. The data are presented in a 10
format consistent with the revised revenue tests (Tables 8A and 8B) and separate accounting 11
analyses. The focal point of these tables is the Net Position (Column K), which is the amount of 12
funds provided by revenues that remain after meeting annual expenses requiring cash for the rate 13
period and repayment of the Federal investment. Thus, if the Net Position is zero or greater in 14
each of the years of the rate approval period through the repayment period, the projected 15
revenues demonstrate BPA’s ability to repay the Federal investment in the FCRPS within the 16
allowable time. As shown in Column K, the resulting Net Position is greater than zero for each 17
year of the rate approval period and in each year of the repayment period. 18
19
The historical data on this table have been taken from BPA’s separate accounting analysis. The 20
rate test period data have been developed specifically for this rate filing. The repayment period 21
data are presented consistent with the requirements of RA 6120.2. Typically, the revenue test 22
through the repayment period uses expenses from the last year of the rate period. In this case, 23
expenses for the CGS nuclear plant were normalized because it is on a two-year refueling cycle, 24
which results in low costs in the first year and high costs in the second year. FY 2011 is a 25
refueling year for CGS, which increases O&M costs for the facility and power purchase costs to 26

WP-10-E-BPA-02 Page 30
make up for the loss of generation during the refueling. The CGS outage in FY 2011 will be 1
unusually long due to a planned condenser tube replacement project, which will lengthen the 2
time CGS is out of service. The projection of these costs through the repayment period would 3
misrepresent the costs associated with the CGS refueling cycle. For the purposes of this revenue 4
test, these costs have been normalized by averaging FY 2011 CGS costs with FY 2010 CGS 5
costs to produce an average cost for the operation of CGS and for augmentation purchases to 6
make up for lost CGS generation. 7
8
9
10
11
12
13
14
15
16
17
18
19
20
21
22
23
24
25
26

WP-10-E-BPA-02 Page 31
5. REVENUE REQUIREMENT LEGAL REQUIREMENTS AND POLICIES 1
2
This chapter summarizes the following policies: 3
• The statutory framework that guides the development of BPA’s revenue requirements 4
and the allocation of FCRPS costs among the various users of the system. 5
• The repayment policies that BPA follows in the development of its revenue 6
requirement. 7
8
5.1 Development of BPA’s Revenue Requirements 9
BPA’s revenue requirements are governed by four main legislative acts: The Bonneville Project 10
Act of 1937, P.L. No. 75-329, 50 Stat. 731; the Flood Control Act of 1944, P.L. No. 78-534, 11
58 Stat. 890, amended 1977; the Federal Columbia River Transmission System Act 12
(Transmission System Act) of 1974, P.L. No. 93-454, 88 Stat. 1376; and the Pacific Northwest 13
Electric Power Planning and Conservation Act (Northwest Power Act), P.L. No. 96-501, 14
94 Stat. 2697. Other statutory provisions that guide the development of BPA’s revenue 15
requirements include the Federal Power Act, as amended by the Energy Policy Act of 1992 16
(EPA-92), P.L. No. 102-486, 106 Stat. 2776; the Colville Settlement Act, P.L. No. 103-436, 17
108 Stat. 4577; and the Omnibus Consolidated Rescissions and Appropriations Act of 1996, 18
P.L. No. 104-134, 110 Stat. 132. DOE Order “Power Marketing Administration Financial 19
Reporting,” RA 6120.2, issued by the Secretary of Energy, provides guidance to Federal power 20
marketing agencies regarding repayment of the Federal investment. 21
22
5.1.1 Legal Requirements Governing the FCRPS Revenue Requirement 23
BPA’s rates must be set in a manner that ensures revenue levels sufficient to recover fully BPA’s 24
costs. This requirement was first set forth in Section 7 of the Bonneville Project Act, 25
16 U.S.C. § 832f (amended 1977): 26

WP-10-E-BPA-02 Page 32
1 Rate schedules shall be drawn having regard to the recovery (upon the basis of the 2 application of such rate schedules to the capacity of the electric facilities of 3 Bonneville project) of the cost of producing and transmitting such electric energy, 4 including the amortization of the capital investment over a reasonable period of 5 years … 6
7
Development of the FCRPS revenue requirements is a critical component of meeting this 8
ratemaking directive. Section 9 of the Transmission System Act, 16 U.S.C, § 838g, also strongly 9
reflects this cost recovery principle, providing that rates be set: 10
11 [A]t levels to produce such additional revenues as may be required, in the aggregate 12 with all other revenues of the Administrator, to pay when due the principal of, 13 premiums, discounts, and expenses in connection with the issuance of and interest 14 on all bonds issued and outstanding pursuant to this Act, and amounts required to 15 establish and maintain reserve and other funds and accounts established in 16 connection therewith. 17
18
Similar guidelines are provided in Section 7 of the Northwest Power Act, 16 U.S.C. § 839e. 19
Section 7(a)(1), 16 U.S.C. § 839e(a)(1), provides: 20
The Administrator shall establish, and periodically review and revise, rates 21 for the sale and disposition of electric energy and capacity and for the 22 transmission of non Federal power. Such rates shall be established and, as 23 appropriate, revised to recover, in accordance with sound business 24 principles, the cost associated with the acquisition, conservation, and 25 transmission of electric power, including the amortization of the Federal 26 investment in the Federal Columbia River Power System (including 27 irrigation costs required to be repaid out of power revenues) over a 28 reasonable period of years and the other costs and expenses incurred by the 29 Administrator pursuant to this [Act] and other provisions of law. Such rates 30 shall be established in accordance with Sections 9 and 10 of the Federal 31

WP-10-E-BPA-02 Page 33
Columbia River Transmission System Act (16 U.S.C. § 838), Section 5 of 1 the Flood Control Act of 1944, and the provisions of this of this [Act]. 2
3
Section 7(n) of the Northwest Power Act provides additional guidance regarding cost recovery 4
for the FY 2010-2011 rate period, and preserves BPA’s ability to establish appropriate reserves 5
subsequent to FY 2006: 6
Notwithstanding any other provision of this section, rates established by the 7 Administrator, under this section shall recover costs for protection, 8 mitigation and enhancement of fish and wildlife, whether under the Pacific 9 Northwest Electric Power Planning and Conservation Act or any other Act, 10 not to exceed such amounts the Administrator forecasts will be expended 11 during the fiscal year 2002 2006 rate period, while preserving the 12 Administrator’s ability to establish appropriate reserves and maintain a high 13 Treasury payment probability for the subsequent rate period. 14
16 U.S.C. § 839e(n). 15
16
The Northwest Power Act also makes it clear that a primary purpose of confirmation of BPA 17
rates by FERC is to ensure that the revenue requirement is adequate to ensure timely 18
U.S. Treasury repayment. Section 7(a)(2), 16 U.S.C. § 839e(a)(2), provides: 19
Rates established under this section shall become effective only, except in 20 the case of interim rules as provided in subsection (i)(6) of this section, 21 upon confirmation and approval by the Federal Energy Regulatory 22 Commission upon a finding by the Commission, that such rates: 23
(A) are sufficient to assure repayment of the Federal investment in the 24 Federal Columbia River Power System over a reasonable number of 25 years after first meeting the Administrator’s other costs, 26
(B) are based upon the Administrator’s total system costs, and 27
WP-10-E-BPA-02 Page 34
(C) insofar as transmission rates are concerned, equitably allocate the 1 costs of the Federal transmission system between Federal and non 2 Federal power utilizing such system. 3
4
In addition to reiterating and clarifying the cost recovery principle, the Northwest Power Act 5
provided BPA supplementary authority to sell bonds to the U.S. Treasury to finance BPA’s new 6
conservation and renewable resource programs. See 16 U.S.C. § 838i. EPA-92 clarified BPA’s 7
authority to provide funds directly to COE and Reclamation for hydroelectric generation 8
additions, improvements, and replacements, as well as O&M expenses. See P.L. No. 102-486, 9
1992 U.S. Code Cong. & Admin. News, 106 Stat. 2776. Other provisions that have particular 10
relevance to the repayment of power costs can be found in the Reclamation Project Act of 1939 11
(codified as amended in scattered sections of 43 U.S.C.); the Grand Coulee Dam - Third 12
Powerplant Act of June 14, 1966, P.L. No. 89-448, 80 Stat. 200, authorizing construction of the 13
Grand Coulee Dam Third Powerhouse; and P.L. No. 89-561, 80 Stat. 707, Act of September 7, 14
1966, which partially amended P. L. No. 89-448. The costs associated with these projects and 15
programs, as well as the other costs incurred by the Administrator in furtherance of BPA’s 16
mission, are included in this Study. 17
18
5.1.2 Colville Settlement Act Credits 19
The Confederated Tribes of the Colville Reservation Grand Coulee Dam Settlement Act 20
approves and ratifies the Settlement Agreement entered into by the United States and the 21
Confederated Tribes of the Colville Reservation (Colville Tribes) related to the claims for a 22
portion of the revenues from Grand Coulee Dam, and directs BPA to carry out its obligations 23
under the settlement agreement. See P. L. No. 103-436, Nov. 2, 1994, 108 Stat. 4577. 24
25
WP-10-E-BPA-02 Page 35
The Settlement Agreement obligates BPA to make annual payments to the Colville Tribes. 1
Payments have been tied to both BPA’s average prices and the amount of annual generation from 2
Grand Coulee Dam. Under the Refinancing Act, part of the Omnibus Consolidated Rescissions 3
and Appropriations Act of 1996, P.L. No. 104-13, 110 Stat. 1321, BPA receives annual credits 4
from the U.S. Treasury against payments due the U.S. Treasury in order to defray a portion of 5
the costs of making payments to the Colville Tribes. Revenues credited to BPA associated with 6
the Settlement Agreement are $21.3 million in FY 2010 and $21.7 million in FY 2011. The 7
credits for the FY 2010-2011 rate period are forecast to be $4.6 million in each fiscal year. 8
9
5.1.3 The BPA Appropriations Refinancing Act 10
As in the prior rate period, BPA’s power rates for the FY 2010-2011 rate period will reflect the 11
requirements of the Refinancing Act, part of the Omnibus Consolidated Rescissions and 12
Appropriations Act of 1996, 16 U.S.C. § 838l, P.L. No. 104-134, 110 Stat. 1321, enacted in 13
April 1996. The Refinancing Act required that unpaid principal on FCRPS appropriations (old 14
capital investments) at the end of FY 1996 be reset at the present value of the principal and 15
annual interest payments BPA would make to the U.S. Treasury for these obligations absent the 16
Refinancing Act, plus $100 million. Id. at §838l(b)(I). The Refinancing Act also specifies that 17
the new principal amounts of the old capital investments be assigned new interest rates from the 18
U.S. Treasury yield curve prevailing at the time of the refinancing transaction. Id. at 19
§ 838l(a)(6)(A). 20
21
The Refinancing Act specifies that repayment periods on new principal amounts may not be 22
earlier than determined prior to the refinancing. Id. at §838l(d). 23
24
The Refinancing Act specifies that the prevailing U.S. Treasury yield curve will be used to 25
calculate interest during construction (IDC) and to assign interest rates to new capital 26

WP-10-E-BPA-02 Page 36
investments funded by appropriations. See 16 U.S.C. § 838l(f). New capital investments are 1
defined as capital investments funded by appropriations for a project placed in service after 2
September 30, 1996. Id. at § 838l(a)(3). The IDC in each fiscal year of construction for new 3
capital investments is the prevailing one-year U.S. Treasury rate. Id. at § 838l(f)(1). The IDC is 4
capitalized and included in the principal. After the plant is completed, the principal amount is 5
assigned an interest rate based on the U.S. Treasury yield curve prevailing in the year in which 6
the plant is placed in service. Id. at § 838l(g). 7
8
The U.S. Treasury rate for new capital investments prescribed in the Refinancing Act is: 9
[A] rate determined by the Secretary of the Treasury, taking into 10 consideration prevailing market yields, during the month preceding the 11 beginning of the fiscal year in which the [new investment] … is placed in 12 service, on outstanding interest bearing obligations of the United States with 13 periods to maturity comparable to the period between the beginning of the 14 fiscal year and the repayment date for the new capital investment. 15
16 U.S.C. § 838l(a)(6)(B). 16
17
The Refinancing Act also directed the Administrator to offer to provide assurance in new or 18
existing power, transmission, or related service contracts that the government would not increase 19
the repayment obligations in the future. See 16 U.S.C. § 838l(i). The Refinancing Act also 20
amends the Colville Settlement Act to modify the amount and timing of certain credits that BPA 21
takes against its annual cash transfers to U.S. Treasury. 22
23
5.2 Allocation of Federal Columbia River Power System (FCRPS) Costs 24
The individual generating projects comprising the FCRPS serve purposes in addition to power 25
production, including navigation, irrigation, recreation, and flood control. The total costs of 26
these Federal projects are generally allocated according to the purposes they serve. 27

WP-10-E-BPA-02 Page 37
1
For projects that provide power resources to the FCRPS, this allocation has generally been 2
accomplished pursuant to statutory direction. For example, Section 7 of the Bonneville Project 3
Act, 16 U.S.C. § 832f, requires that BPA’s rates be based, inter alia, on “an allocation of costs 4
made by the [Secretary of Energy,]” and, insofar as costs of the Bonneville Project were 5
concerned: 6
7
[T]he Secretary of Energy may allocate to the costs of electric facilities such 8 a share of the cost of facilities having joint value for the production of 9 electric energy and other purposes as the power development may fairly 10 bear as compared with other such purposes. 11
Id. 12
13
Similar allocations for projects constructed pursuant to various Reclamation laws have been 14
performed by the Secretary of the Interior under the authority of 43 U.S.C. § 485h(a)-(b). Cost 15
allocations for projects constructed by the COE have also been performed by the Secretary of the 16
Army and approved by the Federal Power Commission (the predecessor to FERC). 17
18
On a generic level, an attempt is made to allocate the specific cost of each feature of a 19
multi-purpose dam to the purpose it serves. For example, the costs of powerhouses, penstocks, 20
and other specific power-related facilities have been allocated to power, whereas the costs of 21
navigation locks have been allocated to navigation. More problematic are the joint-use costs that 22
remain unallocated after the specific costs identifiable to a single purpose have been allocated. 23
The joint-use formulas attempt to account for the relative benefits provided by each function, and 24
costs are allocated accordingly. 25
26
WP-10-E-BPA-02 Page 38
Thus, costs assigned to the power production functions include specific cost items whose sole 1
purpose is power production and the “power production share” of joint costs assigned to more 2
than one purpose. Both types of costs are included in BPA’s power revenue requirement. 3
4
5.2.1 Section 4(h)(10)(C) Credit 5
The Northwest Power Act provides that: 6
The Administrator shall use the Bonneville Power Administration fund and 7 the authorities available to the Administrator under [the Northwest Power 8 Act] and other laws administered by the Administrator to protect, mitigate, 9 and enhance fish and wildlife to the extent affected by the development and 10 operation of any hydroelectric project of the Columbia River and its 11 tributaries … 12
16 U.S.C. § 839b(h)(10)(A). 13
14
BPA is not obligated to reimburse the U.S. Treasury for the non-power portion of these fish and 15
wildlife costs. Such non-power costs are instead allocated to the various project purposes by the 16
BPA Administrator, in consultation with the COE and Reclamation, pursuant to 17
section 4(h)(10)(C) of the Northwest Power Act. 16 U.S.C. § 839b(h)(10)(C). This allocation to 18
various project purposes is intended to implement the principle that electric power consumers 19
bear no greater share of the costs of fish and wildlife mitigation than the power portion of the 20
project. 21
22
The legislative history of section 4(h)(10)(C) illustrates how the expenditures by the 23
Administrator for protection, mitigation, and enhancement of fish and wildlife at individual 24
Federal projects in excess of the portion allocable to electric consumers is to be treated as a 25
credit for electric consumers. See H.R. Rep. No. 976, 96th Cong., 2d Sess., pt. 2 at 45 (1980), 26
reprinted in 1980 U.S.C.C.A.N. 5989, 6011. This principle is satisfied by treating expenditures 27
WP-10-E-BPA-02 Page 39
on behalf of non-power purposes as other project costs. These amounts are regarded as having 1
been applied toward other project costs properly allocable to the power function and payable to 2
the U.S. Treasury. Thus, BPA receives a credit against its cash transfers to the U.S. Treasury for 3
expenditures attributable to other project purposes. The cost-sharing arrangements with the 4
Administration implement the section 4(h)(10)(C) directives. BPA’s initial funding of all the 5
costs for fish and wildlife has the advantage of avoiding the need for funding the non-power 6
portion of these costs through the annual appropriations process. 7
8
5.2.2 Equitable Allocation of Transmission Costs 9
In an order dated January 27, 1984, United States Department of Energy – Bonneville Power 10
Admin., 26 FERC 61,096 (1984), FERC directed BPA to, among other things, develop separate 11
repayment studies for the generation and transmission functions of the FCRPS. The purpose 12
of this requirement was to assist FERC in making the determination required under 13
section 7(a)(2)(C) of the Northwest Power Act (16 U.S.C. § 839e(a)(2)(C)) that transmission 14
costs be equitably allocated between Federal and non-Federal use of the transmission system. 15
This requirement has given BPA a 25-year history of conducting separate repayment studies for 16
the transmission and generation functions, which has enabled BPA to transition to a bifurcated 17
rate setting process with minimal change in repayment policy and development of the revenue 18
requirement. Consistent with the decision to conduct bifurcated hearings for the transmission 19
and generation functions beginning with the WP-02 proceeding, the Revenue Requirement Study 20
incorporates only the separate repayment study for the generation function of the FCRPS for 21
FY 2010-2011. 22
23
5.3 Repayment Requirements and Policies 24
The statutes do not include specific directives for scheduling repayment of the FCRPS capital 25
appropriations and bonds issued to the U.S. Treasury. The details of the repayment policy have 26
WP-10-E-BPA-02 Page 40
largely been established through administrative interpretation of statutory requirements, with 1
Congressional sanction. 2
3
There have been a number of changes in BPA’s repayment policy over the years concurrent with 4
expansion of the FCRPS and changing conditions. In general, current repayment criteria were 5
first approved by the Secretary of the Interior on April 3, 1963. These criteria were refined and 6
submitted to the Secretary and the Federal Power Commission (the predecessor agency to FERC) 7
in support of BPA’s rate filing in September 1965. 8
9
The repayment policy was presented to Congress for its consideration for the authorization of the 10
Grand Coulee Dam Third Powerhouse in June 1966. The underlying theory of repayment was 11
discussed in the House of Representatives’ Report related to this authorization, H.R. Rep. 12
No. 1409, 89th Cong., 2d Sess. 9-10 (1966). As stated in that report: 13
Accordingly, in a repayment study there is no annual schedule of capital 14 repayment. The test of the sufficiency of revenues is whether the capital 15 investment can be repaid within the overall repayment period established 16 for each power project, each increment of investment in the transmission 17 system, and each block of irrigation assistance. Hence, repayment may 18 proceed at a faster or slower pace from year-to-year as conditions change. 19
This approach to repayment scheduling has the effect of averaging the 20 year-to-year variations in costs and revenues over the repayment period. 21 This results in a uniform cost per unit of power sold, and permits the 22 maintenance of stable rates for extended periods. It also facilitates the 23 orderly marketing of power and permits Bonneville Power Administration’s 24 customers, which include both electric utilities and electro-process 25 industries, to plan for the future with assurance. 26
27
WP-10-E-BPA-02 Page 41
The Secretary of the Interior issued a statement of power policy on September 30, 1970, setting 1
forth general principles that reaffirmed the repayment policy as previously developed. The most 2
pertinent of these principles are set forth in the Department of the Interior (DOI) Manual, 3
Part 730, Chapter 1: 4
A. Hydroelectric power, although not a primary objective, will be 5 proposed to Congress and supported for inclusion in 6 multiple-purpose Federal projects when … it is capable of repaying 7 its share of the Federal investment, including operation and 8 maintenance costs and interest, in accordance with the law. 9
B. Electric power generated at Federal projects will be marketed at the 10 lowest rates consistent with sound financial management. Rates for 11 the sale of Federal electric power will be reviewed periodically to 12 assure their sufficiency to repay operating and maintenance costs 13 and the capital investment within 50 years with interest that more 14 accurately reflects the cost of money. 15
16
To achieve a greater degree of uniformity in a repayment policy for all DOI power marketing 17
agencies, of which BPA was one at the time, the Deputy Assistant Secretary issued a memo on 18
August 2, 1972, outlining: (1) a uniform definition of the commencement of the repayment 19
period for a particular project; (2) the method for including future replacement costs in 20
repayment studies; and (3) a provision that the investment or obligation bearing the highest 21
interest rate shall be amortized first, to the extent possible, while still complying with the 22
repayment period established for each increment of investment. 23
24
A further clarification of the repayment policy was outlined in a joint memo of January 7, 1974, 25
from the Assistant Secretary for Reclamation and Assistant Secretary for Energy and Minerals. 26
This memo states that in addition to meeting the overall objective of repaying the Federal 27
investment or obligations within the prescribed repayment periods, revenues shall be adequate, 28
WP-10-E-BPA-02 Page 42
except in unusual circumstances, to repay annually all costs for O&M, purchased power, and 1
interest. 2
3
On March 22, 1976, the DOI issued Chapter 4 of Part 730 of the DOI Manual to codify financial 4
reporting requirements for the DOI power marketing agencies. Included therein are standard 5
policies and procedures for preparing system repayment studies. 6
7
BPA and other former DOI power marketing agencies were transferred to the newly established 8
DOE on October 1, 1977. See DOE Organization Act, 42 U.S.C. § 7101 et seq. (1994). The 9
DOE has adopted the policies set forth in Part 730 of the DOI Manual by issuing Interim 10
Management Directive No. 1701 on September 28, 1977, which was subsequently replaced by 11
RA 6120.2 on September 20, 1979, as amended on October 1, 1983. 12
13
The repayment policy outlined in RA 6120.2, paragraph 12, provides that BPA’s total revenues 14
from all sources must be sufficient to: 15
16 (1) Pay all annual costs of operating and maintaining the Federal power system; 17 18 (2) Pay the cost each FY of obtaining power through purchase and exchange agreements, 19
the cost for transmission services, and other costs during the year in which such costs 20 are incurred; 21
22 (3) Pay interest each year on the unamortized portion of the commercial power 23
investment financed with appropriated funds at the interest rates established for each 24 generating project and for each annual increment of such investment in the BPA 25 transmission system, except that recovery of annual interest expense may be deferred 26 in unusual circumstances for short periods of time; 27
28
WP-10-E-BPA-02 Page 43
(4) Pay when due the interest and amortization portion on outstanding bonds sold to the 1 U.S. Treasury; 2
3 (5) Repay: 4
• each dollar of power investments and obligations in the FCRPS generating 5 projects within 50 years after the projects become revenue-producing (50 years 6 has been deemed a “reasonable period” as intended by Congress, except for the 7 Yakima-Chandler Project, which has a legislated amortization period of 66 years); 8
• each annual increment of transmission financed by Federal investments and 9 obligations within the average service life of such transmission facilities 10 (currently 40 years) or within a maximum of 50 years, whichever is less [BPA has 11 interpreted RA 6120.2 to require repayment of bonds sold to finance conservation 12 to be within the average service lives of these projects, currently estimated to be 13 five years, and for fish and wildlife facilities to be 15 years]; 14
• the Federally -financed amount of each replacement within its service life up to a 15 maximum of 50 years; and 16
17 (6) As required by P.L. No. 89-448, repay the portion of construction costs at Federal 18
reclamation projects that is beyond the repayment ability of the irrigators, and which 19 is assigned for repayment from commercial power revenues, within the same overall 20 period available to the irrigation water users for making their payments on 21 construction costs. 22
23
The typical repayment period for appropriated capital investments is 50 years from the year in 24
which the plant is placed in service. The Refinancing Act overrides provisions in RA 6120.2 25
related to determining interest during construction and assigning interest rates to Federal 26
investments financed by appropriations. This Refinancing Act also contains provisions on 27
repayment periods (due dates) for these investments. The Refinancing Act is discussed in 28
section 5.1.3. 29
30
Irrigation costs are repaid without interest. P.L. No. 89-448 authorizes the payment of irrigation 31

WP-10-E-BPA-02 Page 44
costs from revenues of the entire power system. This is consistent with the so-called “Basin 1
Account” concept. P.L. No. 89-561, approved on September 7, 1966, amended P.L. No. 89-448 2
to provide several limitations on the repayment of irrigation costs from power revenues. These 3
limitations are: 4
5 (1) the irrigation costs are to be paid from “net revenues” of the power system, with net 6
revenues defined as those revenues over and above the amount needed to cover power 7 costs and previously authorized irrigation payments; 8
9 (2) the construction of new Federal irrigation projects will be scheduled, i.e., deferred, if 10
necessary, so that the repayment of the irrigation costs from power revenues will not 11 require an increase in the BPA power rate level; and 12
13 (3) the total amount of irrigation costs to be repaid from power revenues shall not 14
average more than $30 million per year in any period of 20 consecutive years. 15
16
In addition, other sections within RA 6120.2 require that any outstanding deferred interest 17
payments must be repaid before any planned amortization payments are made. Also, repayments 18
are to be made by amortizing those Federal investments and obligations bearing the highest 19
interest rate first, to the extent possible, while still completing repayment of each increment of 20
Federal investment and obligation within its prescribed repayment period. 21
22

WP-10-E-BPA-02 Page 45
ADDITIONAL TABLES

WP-10-E-BPA-02 Page 46
Table 5A: Generation Revenue Requirement Income Statement
A B2010 2011
1 OPERATING EXPENSES2 POWER SYSTEM GENERATION RESOURCES3 OPERATING GENERATION 581,789 693,8044 OPERATING GENERATION SETTLEMENT PAYMENT 21,328 21,7545 NON-OPERATING GENERATION 2,618 2,7286 CONTRACTED POWER PURCHASES 71,235 57,1557 AUGMENTATION POWER PURCHASES 176,305 304,6108 EXCHANGES & SETTLEMENTS 2,421 1,4409 RENEWABLE GENERATION 45,588 45,938
10 GENERATION CONSERVATION 55,088 54,72211 CONSERVATION AND RENEWABLE DISCOUNT 32,000 32,00012 PS TRANSMISSION ACQUISITION AND ANCILLARY SERVICES 173,162 170,57013 POWER NON-GENERATION OPERATIONS 82,793 86,65014 F&W/USF&W/PLANNING COUNCIL/ENVIRONMENTAL REQUIREMENTS 263,541 270,61815 GENERAL AND ADMINISTRATIVE/SHARED SERVICES 67,475 68,34116 OTHER INCOME, EXPENSES AND ADJUSTMENTS 1,800 3,60017 NON-FEDERAL DEBT SERVICE 556,052 576,36518 DEPRECIATION 118,616 119,92119 AMORTIZATION 79,118 86,98920 TOTAL OPERATING EXPENSES 2,330,928 2,597,205
21 INTEREST EXPENSE:22 INTEREST23 APPROPRIATED FUNDS 222,131 208,67224 CAPITALIZATION ADJUSTMENT (45,937) (45,937)25 BONDS ISSUED TO U.S. TREASURY 49,849 68,31726 AMORTIZATION OF CAPITALIZED BOND PREMIUMS 185 18527 ALLOWANCE FOR FUNDS USED DURING CONSTRUCTION (10,800) (10,200)28 INTEREST CREDIT (49,605) (49,317)29 NET INTEREST EXPENSE 165,823 171,720
30 TOTAL EXPENSES 2,496,751 2,768,925
31 MINIMUM REQUIRED NET REVENUES 1/ 118,806 4,25432 PLANNED NET REVENUES FOR RISK 48,000 48,00033 PLANNED NET REVENUES, TOTAL (31+32) 166,806 52,254
34 TOTAL REVENUE REQUIREMENT 2,663,557 2,821,179
1/ SEE NOTE ON CASH FLOW STATEMENT
($000s)
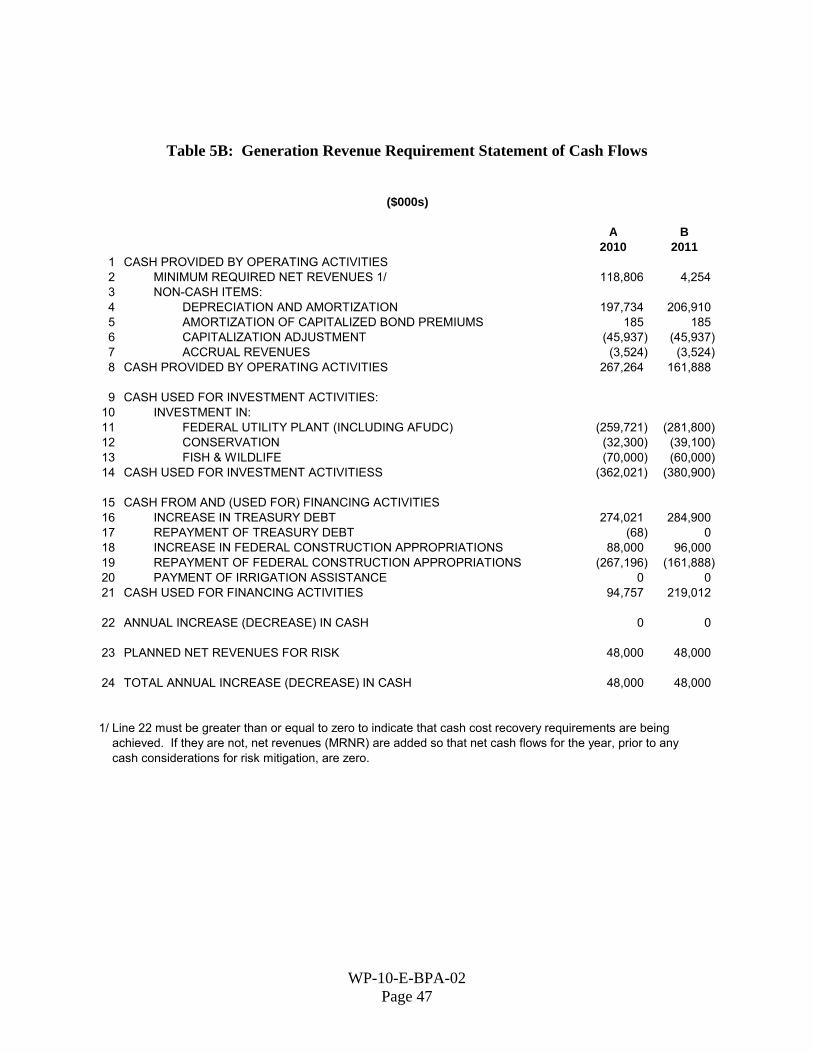
WP-10-E-BPA-02 Page 47
Table 5B: Generation Revenue Requirement Statement of Cash Flows
A B2010 2011
1 CASH PROVIDED BY OPERATING ACTIVITIES2 MINIMUM REQUIRED NET REVENUES 1/ 118,806 4,2543 NON-CASH ITEMS:4 DEPRECIATION AND AMORTIZATION 197,734 206,9105 AMORTIZATION OF CAPITALIZED BOND PREMIUMS 185 1856 CAPITALIZATION ADJUSTMENT (45,937) (45,937)7 ACCRUAL REVENUES (3,524) (3,524)8 CASH PROVIDED BY OPERATING ACTIVITIES 267,264 161,888
9 CASH USED FOR INVESTMENT ACTIVITIES:10 INVESTMENT IN:11 FEDERAL UTILITY PLANT (INCLUDING AFUDC) (259,721) (281,800)12 CONSERVATION (32,300) (39,100)13 FISH & WILDLIFE (70,000) (60,000)14 CASH USED FOR INVESTMENT ACTIVITIESS (362,021) (380,900)
15 CASH FROM AND (USED FOR) FINANCING ACTIVITIES16 INCREASE IN TREASURY DEBT 274,021 284,90017 REPAYMENT OF TREASURY DEBT (68) 018 INCREASE IN FEDERAL CONSTRUCTION APPROPRIATIONS 88,000 96,00019 REPAYMENT OF FEDERAL CONSTRUCTION APPROPRIATIONS (267,196) (161,888)20 PAYMENT OF IRRIGATION ASSISTANCE 0 021 CASH USED FOR FINANCING ACTIVITIES 94,757 219,012
22 ANNUAL INCREASE (DECREASE) IN CASH 0 0
23 PLANNED NET REVENUES FOR RISK 48,000 48,000
24 TOTAL ANNUAL INCREASE (DECREASE) IN CASH 48,000 48,000
1/ Line 22 must be greater than or equal to zero to indicate that cash cost recovery requirements are being achieved. If they are not, net revenues (MRNR) are added so that net cash flows for the year, prior to any cash considerations for risk mitigation, are zero.
($000s)

WP-10-E-BPA-02 Page 48
Table 6A: Generation Current Revenue Test Income Statement
A B2010 2011
1 REVENUES FROM PROPOSED RATES 2,784,447 2,884,560
2 OPERATING EXPENSES3 POWER SYSTEM GENERATION RESOURCES4 OPERATING GENERATION 581,789 693,8045 OPERATING GENERATION SETTLEMENT PAYMENT 21,328 21,7546 NON-OPERATING GENERATION 2,618 2,7287 CONTRACTED POWER PURCHASES 124,004 113,0008 AUGMENTATION POWER PURCHASES 176,580 304,8189 EXCHANGES & SETTLEMENTS 255,259 277,486
10 RENEWABLE GENERATION 45,588 45,93811 GENERATION CONSERVATION 55,088 54,72212 CONSERVATION AND RENEWABLE DISCOUNT 32,000 32,00013 PS TRANSMISSION ACQUISITION AND ANCILLARY SERVICES 173,162 170,57014 POWER NON-GENERATION OPERATIONS 82,793 86,65015 F&W/USF&W/PLANNING COUNCIL/ENVIRONMENTAL REQUIREMENTS 263,541 270,61816 GENERAL AND ADMINISTRATIVE/SHARED SERVICES 67,475 68,34117 OTHER INCOME, EXPENSES AND ADJUSTMENTS 1,800 3,60018 NON-FEDERAL DEBT SERVICE 556,052 576,36519 DEPRECIATION 118,616 119,92120 AMORTIZATION 79,118 86,98921 TOTAL OPERATING EXPENSES 2,636,810 2,929,303
22 INTEREST EXPENSE:23 INTEREST24 APPROPRIATED FUNDS 222,131 208,67225 CAPITALIZATION ADJUSTMENT (45,937) (45,937)26 BONDS ISSUED TO U.S. TREASURY 49,849 68,31727 AMORTIZATION OF CAPITALIZED BOND PREMIUMS 185 18528 ALLOWANCE FOR FUNDS USED DURING CONSTRUCTION (10,800) (10,200)29 INTEREST CREDIT (44,089) (30,665)30 NET INTEREST EXPENSE 171,339 190,372
31 TOTAL EXPENSES 2,808,149 3,119,675
32 NET REVENUES (23,702) (235,115)
($000s)

WP-10-E-BPA-02 Page 49
Table 6B: Generation Current Revenue Test Statement of Cash Flows
A B2010 2011
1 CASH PROVIDED BY OPERATING ACTIVITIES2 NET REVENUES (23,702) (235,115)3 NON-CASH ITEMS:4 DEPRECIATION AND AMORTIZATION 197,734 206,9105 AMORTIZATION OF CAPITALIZED BOND PREMIUMS 185 1856 CAPITALIZATION ADJUSTMENT (45,937) (45,937)7 ACCRUAL REVENUES (3,524) (3,524)8 CASH PROVIDED BY OPERATING ACTIVITIES 124,755 (77,482)
9 CASH USED FOR INVESTMENT ACTIVITIES:10 INVESTMENT IN:11 FEDERAL UTILITY PLANT (INCLUDING AFUDC) (259,721) (281,800)12 CONSERVATION (32,300) (39,100)13 FISH & WILDLIFE (70,000) (60,000)14 CASH USED FOR INVESTMENT ACTIVITIESS (362,021) (380,900)
15 CASH FROM AND (USED FOR) FINANCING ACTIVITIES16 INCREASE IN TREASURY DEBT 274,021 284,90017 REPAYMENT OF TREASURY DEBT (68) 018 INCREASE IN FEDERAL CONSTRUCTION APPROPRIATIONS 88,000 96,00019 REPAYMENT OF FEDERAL CONSTRUCTION APPROPRIATIONS (267,196) (161,888)20 PAYMENT OF IRRIGATION ASSISTANCE 0 021 CASH USED FOR FINANCING ACTIVITIES 94,757 219,012
22 ANNUAL INCREASE (DECREASE) IN CASH (142,509) (239,370)
($000s)
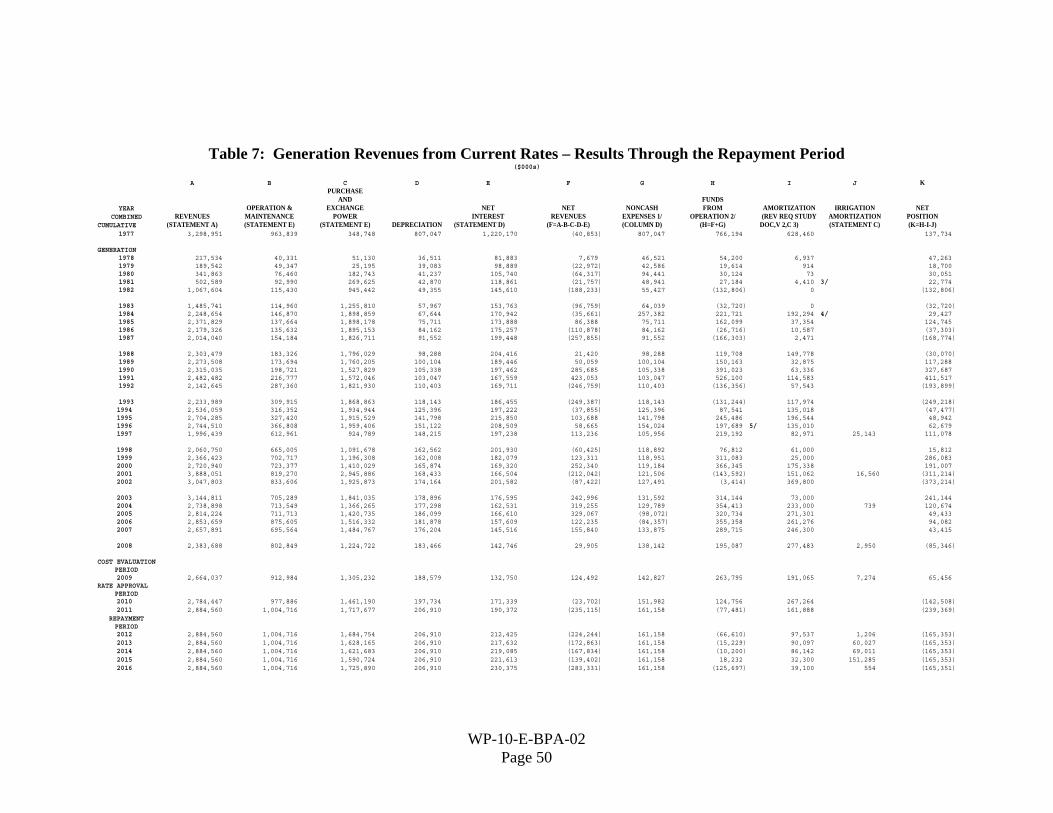
WP-10-E-BPA-02 Page 50
Table 7: Generation Revenues from Current Rates – Results Through the Repayment Period
A B C D E F G H I J KPURCHASE
AND FUNDSYEAR OPERATION & EXCHANGE NET NET NONCASH FROM AMORTIZATION IRRIGATION NET
COMBINED REVENUES MAINTENANCE POWER INTEREST REVENUES EXPENSES 1/ OPERATION 2/ (REV REQ STUDY AMORTIZATION POSITIONCUMULATIVE (STATEMENT A) (STATEMENT E) (STATEMENT E) DEPRECIATION (STATEMENT D) (F=A-B-C-D-E) (COLUMN D) (H=F+G) DOC,V 2,C 3) (STATEMENT C) (K=H-I-J)
1977 3,298,951 963,839 348,748 807,047 1,220,170 (40,853) 807,047 766,194 628,460 137,734
GENERATION1978 217,534 40,331 51,130 36,511 81,883 7,679 46,521 54,200 6,937 47,2631979 189,542 49,347 25,195 39,083 98,889 (22,972) 42,586 19,614 914 18,7001980 341,863 76,460 182,743 41,237 105,740 (64,317) 94,441 30,124 73 30,0511981 502,589 92,990 269,625 42,870 118,861 (21,757) 48,941 27,184 4,410 3/ 22,7741982 1,067,604 115,430 945,442 49,355 145,610 (188,233) 55,427 (132,806) 0 (132,806)
1983 1,485,741 114,960 1,255,810 57,967 153,763 (96,759) 64,039 (32,720) 0 (32,720)1984 2,248,654 146,870 1,898,859 67,644 170,942 (35,661) 257,382 221,721 192,294 4/ 29,4271985 2,371,829 137,664 1,898,178 75,711 173,888 86,388 75,711 162,099 37,354 124,7451986 2,179,326 135,632 1,895,153 84,162 175,257 (110,878) 84,162 (26,716) 10,587 (37,303)1987 2,014,040 154,184 1,826,711 91,552 199,448 (257,855) 91,552 (166,303) 2,471 (168,774)
1988 2,303,479 183,326 1,796,029 98,288 204,416 21,420 98,288 119,708 149,778 (30,070)1989 2,273,508 173,694 1,760,205 100,104 189,446 50,059 100,104 150,163 32,875 117,2881990 2,315,035 198,721 1,527,829 105,338 197,462 285,685 105,338 391,023 63,336 327,6871991 2,482,482 216,777 1,572,046 103,047 167,559 423,053 103,047 526,100 114,583 411,5171992 2,142,645 287,360 1,821,930 110,403 169,711 (246,759) 110,403 (136,356) 57,543 (193,899)
1993 2,233,989 309,915 1,868,863 118,143 186,455 (249,387) 118,143 (131,244) 117,974 (249,218)1994 2,536,059 316,352 1,934,944 125,396 197,222 (37,855) 125,396 87,541 135,018 (47,477)1995 2,704,285 327,420 1,915,529 141,798 215,850 103,688 141,798 245,486 196,544 48,9421996 2,744,510 366,808 1,959,406 151,122 208,509 58,665 154,024 197,689 5/ 135,010 62,6791997 1,996,439 612,961 924,789 148,215 197,238 113,236 105,956 219,192 82,971 25,143 111,078
1998 2,060,750 665,005 1,091,678 162,562 201,930 (60,425) 118,892 76,812 61,000 15,8121999 2,366,423 702,717 1,196,308 162,008 182,079 123,311 118,951 311,083 25,000 286,0832000 2,720,940 723,377 1,410,029 165,874 169,320 252,340 119,184 366,345 175,338 191,0072001 3,888,051 819,270 2,945,886 168,433 166,504 (212,042) 121,506 (143,592) 151,062 16,560 (311,214)2002 3,047,803 833,606 1,925,873 174,164 201,582 (87,422) 127,491 (3,414) 369,800 (373,214)
2003 3,144,811 705,289 1,841,035 178,896 176,595 242,996 131,592 314,144 73,000 241,1442004 2,738,898 713,549 1,366,265 177,298 162,531 319,255 129,789 354,413 233,000 739 120,6742005 2,814,224 711,713 1,420,735 186,099 166,610 329,067 (98,072) 320,734 271,301 49,4332006 2,853,659 875,605 1,516,332 181,878 157,609 122,235 (84,357) 355,358 261,276 94,0822007 2,657,891 695,564 1,484,767 176,204 145,516 155,840 133,875 289,715 246,300 43,415
2008 2,383,688 802,849 1,224,722 183,466 142,746 29,905 138,142 195,087 277,483 2,950 (85,346)
COST EVALUATIONPERIOD2009 2,664,037 912,984 1,305,232 188,579 132,750 124,492 142,827 263,795 191,065 7,274 65,456
RATE APPROVALPERIOD2010 2,784,447 977,886 1,461,190 197,734 171,339 (23,702) 151,982 124,756 267,264 (142,508)2011 2,884,560 1,004,716 1,717,677 206,910 190,372 (235,115) 161,158 (77,481) 161,888 (239,369)
REPAYMENTPERIOD2012 2,884,560 1,004,716 1,684,754 206,910 212,425 (224,244) 161,158 (66,610) 97,537 1,206 (165,353)2013 2,884,560 1,004,716 1,628,165 206,910 217,632 (172,863) 161,158 (15,229) 90,097 60,027 (165,353)2014 2,884,560 1,004,716 1,621,683 206,910 219,085 (167,834) 161,158 (10,200) 86,142 69,011 (165,353)2015 2,884,560 1,004,716 1,590,724 206,910 221,613 (139,402) 161,158 18,232 32,300 151,285 (165,353)2016 2,884,560 1,004,716 1,725,890 206,910 230,375 (283,331) 161,158 (125,697) 39,100 554 (165,351)
($000s)

WP-10-E-BPA-02 Page 51
Table 7 cont. A B C D E F G H I J K
PURCHASEAND FUNDS
OPERATION & EXCHANGE NET NET NONCASH FROM AMORTIZATION IRRIGATION NETREPAYMENT REVENUES MAINTENANCE POWER INTEREST REVENUES EXPENSES 1/ OPERATION 2/ (REV REQ STUDY AMORTIZATION POSITIONPERIOD (STATEMENT A) (STATEMENT E) (STATEMENT E) DEPRECIATION (STATEMENT D) (F=A-B-C-D-E) (COLUMN D) (H=F+G) DOC,V 2,C 3) (STATEMENT C) (K=H-I-J)2017 2,884,560 1,004,716 1,759,736 206,910 236,179 (322,982) 161,158 (165,348) 0 1 (165,349)2018 2,884,560 1,004,716 1,591,597 206,910 239,438 (158,101) 161,158 (467) 136,897 27,989 (165,353)2019 2,884,560 1,004,716 1,103,511 206,910 225,373 344,050 161,158 501,684 608,869 58,168 (165,353)2020 2,884,560 1,004,716 1,203,933 206,910 192,207 276,794 161,158 434,428 574,838 24,943 (165,353)2021 2,884,560 1,004,716 1,203,942 206,910 159,023 309,969 161,158 467,603 620,602 12,354 (165,353)
2022 2,884,560 1,004,716 1,203,933 206,910 122,414 346,587 161,158 504,221 654,989 14,585 (165,353)2023 2,884,560 1,004,716 1,204,343 206,910 87,569 381,022 161,158 538,656 690,757 13,252 (165,353)2024 2,884,560 1,004,716 1,245,472 206,910 61,326 366,137 161,158 523,771 673,710 15,414 (165,353)2025 2,884,560 1,004,716 1,354,938 206,910 13,679 304,318 161,158 461,952 613,405 13,900 (165,353)2026 2,884,560 1,004,716 1,354,714 206,910 (15,518) 333,737 161,158 491,371 635,570 21,154 (165,353)
2027 2,884,560 1,004,716 1,354,872 206,910 (46,006) 364,068 161,158 521,702 426,353 192,572 (97,222)2028 2,884,560 1,004,716 1,355,040 206,910 (62,177) 380,071 161,158 537,705 55,898 21,250 460,5572029 2,884,560 1,004,716 1,355,220 206,910 (62,173) 379,887 161,158 537,521 50,186 196,308 291,0272030 2,884,560 1,004,716 1,355,412 206,910 (62,168) 379,690 161,158 537,324 45,188 0 492,1362031 2,884,560 1,004,716 1,355,617 206,910 (62,163) 379,480 161,158 537,114 70,741 0 466,373
2032 2,884,560 1,004,716 1,355,837 206,910 (63,897) 380,995 161,158 538,629 36,816 0 501,8132033 2,884,560 1,004,716 1,356,071 206,910 (63,892) 380,755 161,158 538,389 72,599 0 465,7902034 2,884,560 1,004,716 1,356,321 206,910 (65,201) 381,814 161,158 539,448 53,078 0 486,3702035 2,884,560 1,004,716 1,356,588 206,910 (65,195) 381,541 161,158 539,175 53,600 0 485,5752036 2,884,560 1,004,716 1,356,875 206,910 (65,188) 381,248 161,158 538,882 63,788 0 475,094
2037 2,884,560 1,004,716 1,357,179 206,910 (65,766) 381,520 161,158 539,154 54,656 0 484,4982038 2,884,560 1,004,716 1,357,506 206,910 (65,758) 381,186 161,158 538,820 55,244 0 483,5762039 2,884,560 1,004,716 1,357,855 206,910 (65,750) 380,829 161,158 538,463 100,872 0 437,5912040 2,884,560 1,004,716 1,358,227 206,910 (68,254) 382,961 161,158 540,595 56,480 0 484,1152041 2,884,560 1,004,716 1,358,625 206,910 (68,245) 382,554 161,158 540,188 87,125 0 453,063
2042 2,884,560 1,004,716 1,359,050 206,910 (70,311) 384,195 161,158 541,829 162,806 0 379,0232043 2,884,560 1,004,716 1,359,505 206,910 (77,553) 390,983 161,158 548,617 104,460 0 444,1572044 2,884,560 1,004,716 1,359,990 206,910 (80,561) 393,505 161,158 551,139 136,311 0 414,8282045 2,884,560 1,004,716 1,360,509 206,910 (86,158) 398,584 161,158 556,218 73,402 0 510,5442046 2,884,560 1,004,716 1,361,063 206,910 (87,845) 399,716 161,158 557,350 45,674 0 514,232
2047 2,884,560 1,004,716 1,361,656 206,910 (87,831) 399,109 161,158 556,743 43,118 0 513,6252048 2,884,560 1,004,716 1,362,289 206,910 (87,816) 398,461 161,158 556,095 40,728 0 515,3672049 2,884,560 1,004,716 1,362,965 206,910 (87,800) 397,769 161,158 555,403 36,747 0 518,6562050 2,884,560 1,004,716 1,363,688 206,910 (87,783) 397,029 161,158 554,663 33,205 0 521,4582051 2,884,560 1,004,716 1,364,460 206,910 (87,765) 396,239 161,158 553,873 30,083 0 523,790
2052 2,884,560 1,004,716 1,365,284 206,910 (87,745) 395,395 161,158 553,029 27,321 0 525,7082053 2,884,560 1,004,716 1,366,165 206,910 (87,724) 394,493 161,158 552,127 42,785 0 509,3422054 2,884,560 1,004,716 1,367,108 206,910 (87,702) 393,529 161,158 551,163 43,358 0 507,8052055 2,884,560 1,004,716 1,368,114 206,910 (87,678) 392,498 161,158 550,132 43,962 0 506,1702056 2,884,560 1,004,716 1,369,189 206,910 (87,653) 391,398 161,158 549,032 44,597 0 504,435
2057 2,884,560 1,004,716 1,370,338 206,910 (87,626) 390,222 161,158 547,856 45,216 0 502,6402058 2,884,560 1,004,716 1,371,565 206,910 (87,597) 388,965 161,158 546,599 45,864 0 500,7352059 2,884,560 1,004,716 1,372,878 206,910 (87,566) 387,622 161,158 545,256 46,542 0 498,7142060 2,884,560 1,004,716 1,284,892 206,910 (89,647) 477,689 161,158 635,323 47,245 0 588,0782061 2,884,560 1,004,716 1,017,834 206,910 (95,962) 751,062 161,158 908,696 0 0 908,696
GENERATIONTOTALS 205,166,535 60,413,552 111,513,758 13,609,001 5,916,692 13,713,533 10,688,329 24,482,342 10,418,806 946,640 11,714,543
1/CONSISTS OF DEPRECIATION PLUS ANY ACCOUNTING WRITE-OFFS INCLUDED IN EXPENSES.
2/MAY INCLUDE ADJUSTMENTS FOR ACCRUAL REVENUES OR OTHER ACCRUAL TO CASH ADJUSTMENTS.
3/CONSISTS OF AMORTIZATION ($1,650) AND DEFERRAL PAYMENT ($2,760).
4/CONSISTS OF AMORTIZATION ($1,342) AND DEFERRAL PAYMENT ($190,952).
5/REDUCED BY $15,000 OF REVENUE FINANCING. 1

WP-10-E-BPA-02 Page 52
Table 8A: Generation Revised Revenue Test Income Statement
A B2010 2011
1 REVENUES FROM PROPOSED RATES 2,994,386 3,132,066
2 OPERATING EXPENSES3 POWER SYSTEM GENERATION RESOURCES4 OPERATING GENERATION 581,789 693,8045 OPERATING GENERATION SETTLEMENT PAYMENT 21,328 21,7546 NON-OPERATING GENERATION 2,618 2,7287 CONTRACTED POWER PURCHASES 124,004 113,0008 AUGMENTATION POWER PURCHASES 176,580 304,8189 EXCHANGES & SETTLEMENTS 265,857 266,293
10 RENEWABLE GENERATION 45,588 45,93811 GENERATION CONSERVATION 55,088 54,72212 CONSERVATION AND RENEWABLE DISCOUNT 32,000 32,00013 PS TRANSMISSION ACQUISITION AND ANCILLARY SERVICES 173,162 170,57014 POWER NON-GENERATION OPERATIONS 82,793 86,65015 F&W/USF&W/PLANNING COUNCIL/ENVIRONMENTAL REQUIREMENTS 263,541 270,61816 GENERAL AND ADMINISTRATIVE/SHARED SERVICES 67,475 68,34117 OTHER INCOME, EXPENSES AND ADJUSTMENTS 1,800 3,60018 NON-FEDERAL DEBT SERVICE 556,052 576,36519 DEPRECIATION 118,616 119,92120 AMORTIZATION 79,118 86,98921 TOTAL OPERATING EXPENSES 2,647,408 2,918,110
22 INTEREST EXPENSE:23 INTEREST24 APPROPRIATED FUNDS 222,131 208,67225 CAPITALIZATION ADJUSTMENT (45,937) (45,937)26 BONDS ISSUED TO U.S. TREASURY 49,849 68,31727 AMORTIZATION OF CAPITALIZED BOND PREMIUMS 185 18528 ALLOWANCE FOR FUNDS USED DURING CONSTRUCTION (10,800) (10,200)29 INTEREST CREDIT (48,804) (46,212)30 NET INTEREST EXPENSE 166,624 174,825
31 TOTAL EXPENSES 2,814,032 3,092,935
32 NET REVENUES 180,354 39,131
($000s)

WP-10-E-BPA-02 Page 53
Table 8B: Generation Revised Revenue Test Statement of Cash Flows
A B2010 2011
1 CASH PROVIDED BY OPERATING ACTIVITIES2 NET REVENUES 180,354 39,1313 NON-CASH ITEMS:4 DEPRECIATION AND AMORTIZATION 197,734 206,9105 AMORTIZATION OF CAPITALIZED BOND PREMIUMS 185 1856 CAPITALIZATION ADJUSTMENT (45,937) (45,937)7 ACCRUAL REVENUES (3,524) (3,524)8 CASH PROVIDED BY OPERATING ACTIVITIES 328,811 196,764
9 CASH USED FOR INVESTMENT ACTIVITIES:10 INVESTMENT IN:11 FEDERAL UTILITY PLANT (INCLUDING AFUDC) (259,721) (281,800)12 CONSERVATION (32,300) (39,100)13 FISH & WILDLIFE (70,000) (60,000)14 CASH USED FOR INVESTMENT ACTIVITIESS (362,021) (380,900)
15 CASH FROM AND (USED FOR) FINANCING ACTIVITIES16 INCREASE IN TREASURY DEBT 274,021 284,90017 REPAYMENT OF TREASURY DEBT (68) 018 INCREASE IN FEDERAL CONSTRUCTION APPROPRIATIONS 88,000 96,00019 REPAYMENT OF FEDERAL CONSTRUCTION APPROPRIATIONS (267,196) (161,888)20 PAYMENT OF IRRIGATION ASSISTANCE 0 021 CASH USED FOR FINANCING ACTIVITIES 94,757 219,012
22 ANNUAL INCREASE (DECREASE) IN CASH 61,547 34,876
($000s)

WP-10-FS-BPA-10 Page 54
Table 9: Generation Revenues from Proposed Rates – Results Through the Repayment Period A B C D E F G H I J K
PURCHASEAND FUNDS
YEAR OPERATION & EXCHANGE NET NET NONCASH FROM AMORTIZATION IRRIGATION NETCOMBINED REVENUES MAINTENANCE POWER INTEREST REVENUES EXPENSES 1/ OPERATION 2/ (REV REQ STUDY AMORTIZATION POSITION
CUMULATIVE (STATEMENT A) (STATEMENT E) (STATEMENT E) DEPRECIATION (STATEMENT D) (F=A-B-C-D-E) (COLUMN D) (H=F+G) DOC,V 2,C 3) (STATEMENT C) (K=H-I-J)1977 3,298,951 963,839 348,748 807,047 1,220,170 (40,853) 807,047 766,194 628,460 137,734
GENERATION1978 217,534 40,331 51,130 36,511 81,883 7,679 46,521 54,200 6,937 47,2631979 189,542 49,347 25,195 39,083 98,889 (22,972) 42,586 19,614 914 18,7001980 341,863 76,460 182,743 41,237 105,740 (64,317) 94,441 30,124 73 30,0511981 502,589 92,990 269,625 42,870 118,861 (21,757) 48,941 27,184 4,410 3/ 22,7741982 1,067,604 115,430 945,442 49,355 145,610 (188,233) 55,427 (132,806) 0 (132,806)
1983 1,485,741 114,960 1,255,810 57,967 153,763 (96,759) 64,039 (32,720) 0 (32,720)1984 2,248,654 146,870 1,898,859 67,644 170,942 (35,661) 257,382 221,721 192,294 4/ 29,4271985 2,371,829 137,664 1,898,178 75,711 173,888 86,388 75,711 162,099 37,354 124,7451986 2,179,326 135,632 1,895,153 84,162 175,257 (110,878) 84,162 (26,716) 10,587 (37,303)1987 2,014,040 154,184 1,826,711 91,552 199,448 (257,855) 91,552 (166,303) 2,471 (168,774)
1988 2,303,479 183,326 1,796,029 98,288 204,416 21,420 98,288 119,708 149,778 (30,070)1989 2,273,508 173,694 1,760,205 100,104 189,446 50,059 100,104 150,163 32,875 117,2881990 2,315,035 198,721 1,527,829 105,338 197,462 285,685 105,338 391,023 63,336 327,6871991 2,482,482 216,777 1,572,046 103,047 167,559 423,053 103,047 526,100 114,583 411,5171992 2,142,645 287,360 1,821,930 110,403 169,711 (246,759) 110,403 (136,356) 57,543 (193,899)
1993 2,233,989 309,915 1,868,863 118,143 186,455 (249,387) 118,143 (131,244) 117,974 (249,218)1994 2,536,059 316,352 1,934,944 125,396 197,222 (37,855) 125,396 87,541 135,018 (47,477)1995 2,704,285 327,420 1,915,529 141,798 215,850 103,688 141,798 245,486 196,544 48,9421996 2,744,510 366,808 1,959,406 151,122 208,509 58,665 154,024 197,689 5/ 135,010 62,6791997 1,996,439 612,961 924,789 148,215 197,238 113,236 105,956 219,192 82,971 25,143 111,078
1998 2,060,750 665,005 1,091,678 162,562 201,930 (60,425) 118,892 76,812 61,000 15,8121999 2,366,423 702,717 1,196,308 162,008 182,079 123,311 118,951 311,083 25,000 286,0832000 2,720,940 723,377 1,410,029 165,874 169,320 252,340 119,184 366,345 175,338 191,0072001 3,888,051 819,270 2,945,886 168,433 166,504 (212,042) 121,506 (143,592) 151,062 16,560 (311,214)2002 3,047,803 833,606 1,925,873 174,164 201,582 (87,422) 127,491 (3,414) 373,345 (376,759)
2003 3,144,811 705,289 1,841,035 178,896 176,595 242,996 131,592 314,144 73,000 241,1442004 2,738,898 713,549 1,366,265 177,298 162,531 319,255 129,789 354,413 233,000 739 120,6742005 2,814,224 711,713 1,420,735 186,099 166,610 329,067 (98,072) 320,734 271,301 49,4332006 2,853,659 875,605 1,516,332 181,878 157,609 122,235 (84,357) 355,358 261,276 94,0822007 2,657,891 695,564 1,484,767 176,204 145,516 155,840 133,875 289,715 246,300 43,415
2008 2,383,688 802,849 1,224,722 183,466 142,746 29,905 138,142 195,087 277,483 2,950 (85,346)
COST EVALUATIONPERIOD2009 2,664,037 912,984 1,305,232 188,579 132,750 124,492 142,827 263,795 191,065 7,274 65,456
RATE APPROVALPERIOD2010 2,994,386 977,886 1,471,789 197,734 166,624 180,353 151,982 328,811 267,264 61,5472011 3,132,066 1,004,716 1,706,485 206,910 174,825 39,130 161,158 196,764 161,888 34,876
REPAYMENTPERIOD2012 3,132,066 1,004,716 1,684,754 206,910 192,641 43,046 161,158 200,680 97,537 1,206 101,9372013 3,132,066 1,004,716 1,628,165 206,910 197,848 94,427 161,158 252,061 90,097 60,027 101,9372014 3,132,066 1,004,716 1,621,683 206,910 199,301 99,456 161,158 257,090 86,142 69,011 101,9372015 3,132,066 1,004,716 1,590,724 206,910 201,829 127,888 161,158 285,522 32,300 151,285 101,9372016 3,132,066 1,004,716 1,725,890 206,910 210,591 (16,041) 161,158 141,593 39,100 554 101,939
($000s)
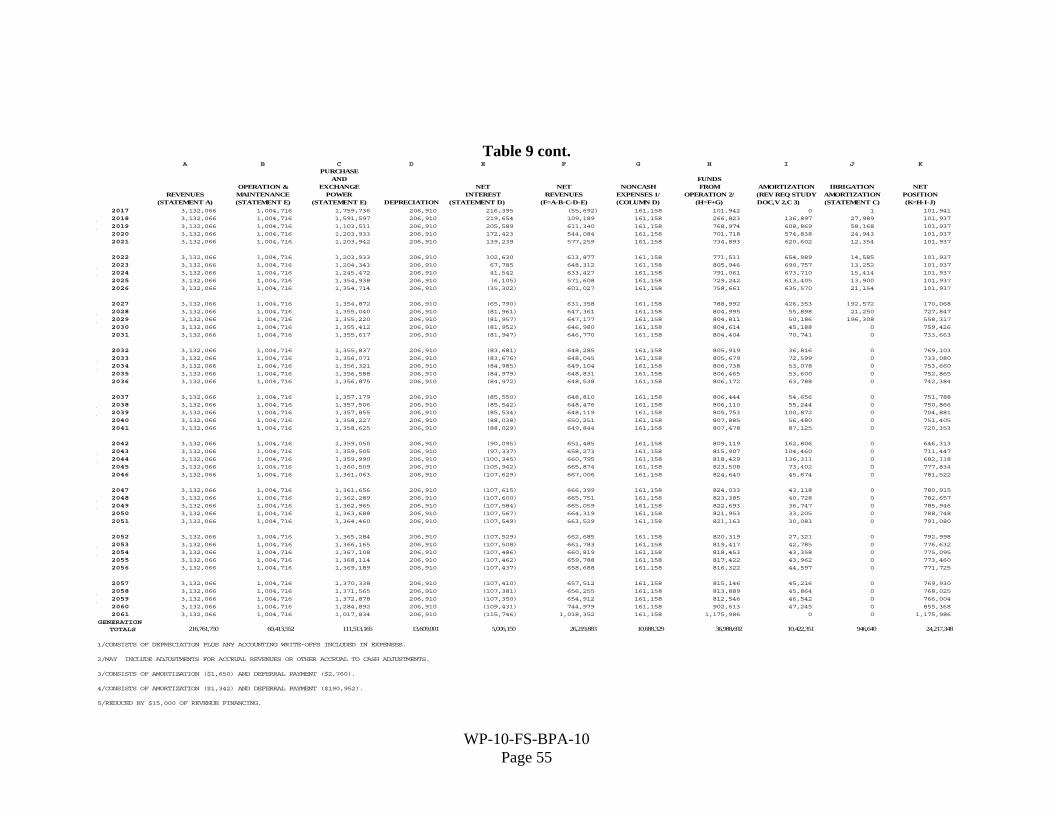
WP-10-FS-BPA-10 Page 55
Table 9 cont. A B C D E F G H I J K
PURCHASEAND FUNDS
OPERATION & EXCHANGE NET NET NONCASH FROM AMORTIZATION IRRIGATION NETREVENUES MAINTENANCE POWER INTEREST REVENUES EXPENSES 1/ OPERATION 2/ (REV REQ STUDY AMORTIZATION POSITION
(STATEMENT A) (STATEMENT E) (STATEMENT E) DEPRECIATION (STATEMENT D) (F=A-B-C-D-E) (COLUMN D) (H=F+G) DOC,V 2,C 3) (STATEMENT C) (K=H-I-J)2017 3,132,066 1,004,716 1,759,736 206,910 216,395 (55,692) 161,158 101,942 0 1 101,9412018 3,132,066 1,004,716 1,591,597 206,910 219,654 109,189 161,158 266,823 136,897 27,989 101,9372019 3,132,066 1,004,716 1,103,511 206,910 205,589 611,340 161,158 768,974 608,869 58,168 101,9372020 3,132,066 1,004,716 1,203,933 206,910 172,423 544,084 161,158 701,718 574,838 24,943 101,9372021 3,132,066 1,004,716 1,203,942 206,910 139,239 577,259 161,158 734,893 620,602 12,354 101,937
2022 3,132,066 1,004,716 1,203,933 206,910 102,630 613,877 161,158 771,511 654,989 14,585 101,9372023 3,132,066 1,004,716 1,204,343 206,910 67,785 648,312 161,158 805,946 690,757 13,252 101,9372024 3,132,066 1,004,716 1,245,472 206,910 41,542 633,427 161,158 791,061 673,710 15,414 101,9372025 3,132,066 1,004,716 1,354,938 206,910 (6,105) 571,608 161,158 729,242 613,405 13,900 101,9372026 3,132,066 1,004,716 1,354,714 206,910 (35,302) 601,027 161,158 758,661 635,570 21,154 101,937
2027 3,132,066 1,004,716 1,354,872 206,910 (65,790) 631,358 161,158 788,992 426,353 192,572 170,0682028 3,132,066 1,004,716 1,355,040 206,910 (81,961) 647,361 161,158 804,995 55,898 21,250 727,8472029 3,132,066 1,004,716 1,355,220 206,910 (81,957) 647,177 161,158 804,811 50,186 196,308 558,3172030 3,132,066 1,004,716 1,355,412 206,910 (81,952) 646,980 161,158 804,614 45,188 0 759,4262031 3,132,066 1,004,716 1,355,617 206,910 (81,947) 646,770 161,158 804,404 70,741 0 733,663
2032 3,132,066 1,004,716 1,355,837 206,910 (83,681) 648,285 161,158 805,919 36,816 0 769,1032033 3,132,066 1,004,716 1,356,071 206,910 (83,676) 648,045 161,158 805,679 72,599 0 733,0802034 3,132,066 1,004,716 1,356,321 206,910 (84,985) 649,104 161,158 806,738 53,078 0 753,6602035 3,132,066 1,004,716 1,356,588 206,910 (84,979) 648,831 161,158 806,465 53,600 0 752,8652036 3,132,066 1,004,716 1,356,875 206,910 (84,972) 648,538 161,158 806,172 63,788 0 742,384
2037 3,132,066 1,004,716 1,357,179 206,910 (85,550) 648,810 161,158 806,444 54,656 0 751,7882038 3,132,066 1,004,716 1,357,506 206,910 (85,542) 648,476 161,158 806,110 55,244 0 750,8662039 3,132,066 1,004,716 1,357,855 206,910 (85,534) 648,119 161,158 805,753 100,872 0 704,8812040 3,132,066 1,004,716 1,358,227 206,910 (88,038) 650,251 161,158 807,885 56,480 0 751,4052041 3,132,066 1,004,716 1,358,625 206,910 (88,029) 649,844 161,158 807,478 87,125 0 720,353
2042 3,132,066 1,004,716 1,359,050 206,910 (90,095) 651,485 161,158 809,119 162,806 0 646,3132043 3,132,066 1,004,716 1,359,505 206,910 (97,337) 658,273 161,158 815,907 104,460 0 711,4472044 3,132,066 1,004,716 1,359,990 206,910 (100,345) 660,795 161,158 818,429 136,311 0 682,1182045 3,132,066 1,004,716 1,360,509 206,910 (105,942) 665,874 161,158 823,508 73,402 0 777,8342046 3,132,066 1,004,716 1,361,063 206,910 (107,629) 667,006 161,158 824,640 45,674 0 781,522
2047 3,132,066 1,004,716 1,361,656 206,910 (107,615) 666,399 161,158 824,033 43,118 0 780,9152048 3,132,066 1,004,716 1,362,289 206,910 (107,600) 665,751 161,158 823,385 40,728 0 782,6572049 3,132,066 1,004,716 1,362,965 206,910 (107,584) 665,059 161,158 822,693 36,747 0 785,9462050 3,132,066 1,004,716 1,363,688 206,910 (107,567) 664,319 161,158 821,953 33,205 0 788,7482051 3,132,066 1,004,716 1,364,460 206,910 (107,549) 663,529 161,158 821,163 30,083 0 791,080
2052 3,132,066 1,004,716 1,365,284 206,910 (107,529) 662,685 161,158 820,319 27,321 0 792,9982053 3,132,066 1,004,716 1,366,165 206,910 (107,508) 661,783 161,158 819,417 42,785 0 776,6322054 3,132,066 1,004,716 1,367,108 206,910 (107,486) 660,819 161,158 818,453 43,358 0 775,0952055 3,132,066 1,004,716 1,368,114 206,910 (107,462) 659,788 161,158 817,422 43,962 0 773,4602056 3,132,066 1,004,716 1,369,189 206,910 (107,437) 658,688 161,158 816,322 44,597 0 771,725
2057 3,132,066 1,004,716 1,370,338 206,910 (107,410) 657,512 161,158 815,146 45,216 0 769,9302058 3,132,066 1,004,716 1,371,565 206,910 (107,381) 656,255 161,158 813,889 45,864 0 768,0252059 3,132,066 1,004,716 1,372,878 206,910 (107,350) 654,912 161,158 812,546 46,542 0 766,0042060 3,132,066 1,004,716 1,284,892 206,910 (109,431) 744,979 161,158 902,613 47,245 0 855,3682061 3,132,066 1,004,716 1,017,834 206,910 (115,746) 1,018,352 161,158 1,175,986 0 0 1,175,986
GENERATIONTOTALS 216,761,750 60,413,552 111,513,165 13,609,001 5,006,150 26,219,883 10,688,329 36,988,692 10,422,351 946,640 24,217,348
1/CONSISTS OF DEPRECIATION PLUS ANY ACCOUNTING WRITE-OFFS INCLUDED IN EXPENSES.
2/MAY INCLUDE ADJUSTMENTS FOR ACCRUAL REVENUES OR OTHER ACCRUAL TO CASH ADJUSTMENTS.
3/CONSISTS OF AMORTIZATION ($1,650) AND DEFERRAL PAYMENT ($2,760).
4/CONSISTS OF AMORTIZATION ($1,342) AND DEFERRAL PAYMENT ($190,952).
5/REDUCED BY $15,000 OF REVENUE FINANCING.

This page intentionally left blank.

APPENDIX A
INTEGRATED PROGRAM REVIEW
Appendix A

This page intentionally left blank.
Appendix A

Appendix A

Appendix A
Bonneville Power Administration Integrated Program Review
FY 2010-2011 Power and Transmission Program Levels
Final Report November 14, 2008
BONNEVILLE POWER ADMINISTRATION
1 Appendix A

Section 1
Background
and Summary of Decisions
2Appendix A
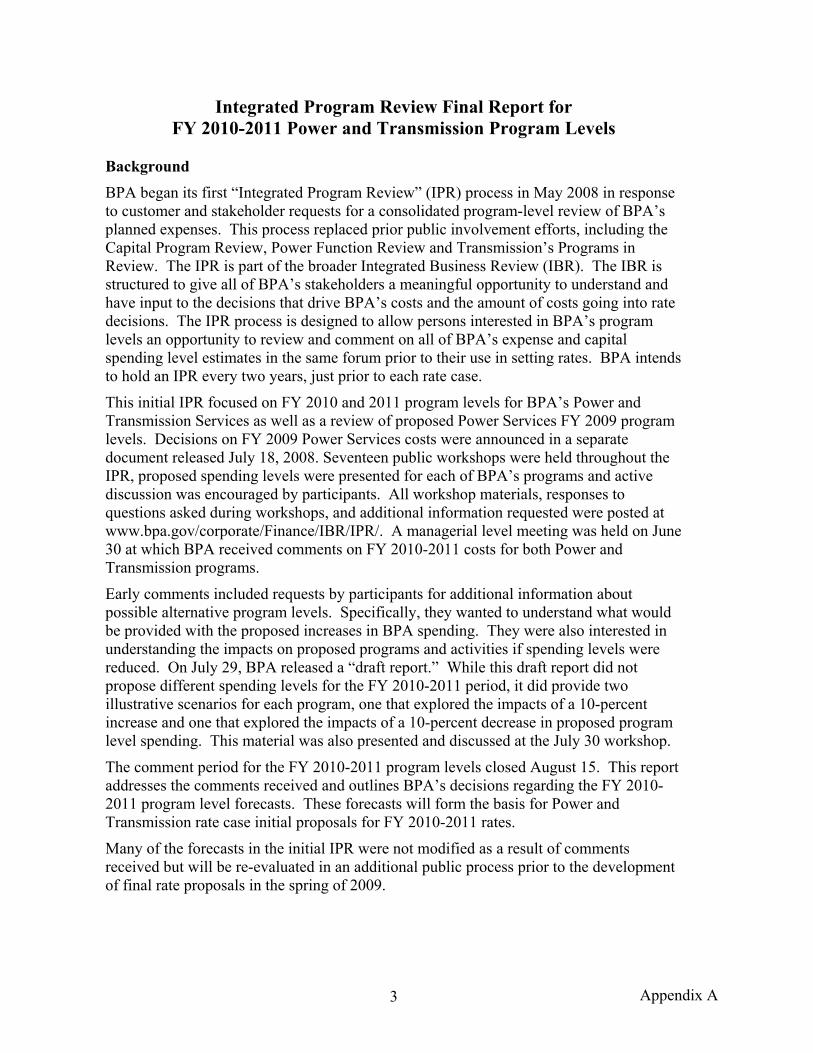
Integrated Program Review Final Report for FY 2010-2011 Power and Transmission Program Levels
Background BPA began its first “Integrated Program Review” (IPR) process in May 2008 in response to customer and stakeholder requests for a consolidated program-level review of BPA’s planned expenses. This process replaced prior public involvement efforts, including the Capital Program Review, Power Function Review and Transmission’s Programs in Review. The IPR is part of the broader Integrated Business Review (IBR). The IBR is structured to give all of BPA’s stakeholders a meaningful opportunity to understand and have input to the decisions that drive BPA’s costs and the amount of costs going into rate decisions. The IPR process is designed to allow persons interested in BPA’s program levels an opportunity to review and comment on all of BPA’s expense and capital spending level estimates in the same forum prior to their use in setting rates. BPA intends to hold an IPR every two years, just prior to each rate case.
This initial IPR focused on FY 2010 and 2011 program levels for BPA’s Power and Transmission Services as well as a review of proposed Power Services FY 2009 program levels. Decisions on FY 2009 Power Services costs were announced in a separate document released July 18, 2008. Seventeen public workshops were held throughout the IPR, proposed spending levels were presented for each of BPA’s programs and active discussion was encouraged by participants. All workshop materials, responses to questions asked during workshops, and additional information requested were posted at www.bpa.gov/corporate/Finance/IBR/IPR/. A managerial level meeting was held on June 30 at which BPA received comments on FY 2010-2011 costs for both Power and Transmission programs.
Early comments included requests by participants for additional information about possible alternative program levels. Specifically, they wanted to understand what would be provided with the proposed increases in BPA spending. They were also interested in understanding the impacts on proposed programs and activities if spending levels were reduced. On July 29, BPA released a “draft report.” While this draft report did not propose different spending levels for the FY 2010-2011 period, it did provide two illustrative scenarios for each program, one that explored the impacts of a 10-percent increase and one that explored the impacts of a 10-percent decrease in proposed program level spending. This material was also presented and discussed at the July 30 workshop.
The comment period for the FY 2010-2011 program levels closed August 15. This report addresses the comments received and outlines BPA’s decisions regarding the FY 2010-2011 program level forecasts. These forecasts will form the basis for Power and Transmission rate case initial proposals for FY 2010-2011 rates.
Many of the forecasts in the initial IPR were not modified as a result of comments received but will be re-evaluated in an additional public process prior to the development of final rate proposals in the spring of 2009.
3 Appendix A

Summary of Decisions BPA carefully reviewed and considered the 18 written comments and numerous oral comments on FY 2010-2011 program levels that were made during this public process. This report summarizes the comments and outlines BPA’s responses.
BPA received some comments that recommended specific program level decreases or increases; however, the majority of the comments received were general in nature. For example, suggestions were made that BPA lower program levels, that the impact of program level increases on rate payers be considered, and that BPA consider whether the proposed aggressive capital plan is achievable and necessary. BPA understands the concern over potential near-term rate impacts and joins customers and constituents in the desire to minimize the impact to rates. However, as discussed in the IPR workshops, the proposed program levels reflect a number of new requirements and other factors that are exerting pressure on our costs. BPA believes that not addressing these requirements will jeopardize its ability to provide reliable power services, as well as place other key obligations at considerable risk.
The major drivers of increased Power Services costs are related to: • Improvements and maintenance needed to increase reliability, safety and
performance at the Columbia Generating Station nuclear plant (CGS). • Improvements and maintenance needed to improve reliability in the aging and
deteriorating Federal hydro system. • New reliability standards. • New biological opinion requirements and the implementation of Memoranda of
Agreement (MOAs) with participating tribes. • The internal costs recovered in power rates (including costs in both Power
Services and Agency Services organizations) in 2008 are roughly the same as they were in 2001, seven years ago. Both inflationary pressures and the other drivers listed here require some increases in these costs.
The major drivers of increased Transmission Services costs are related to: • New mandatory requirements (reliability, environmental, tariff, etc.). • Integration of new wind resources into the BPA transmission system. • Increased demand for transmission capacity. • Need to sustain the aging Federal transmission assets. • Need to reinvest in historically underinvested areas, such as control house
buildings, access roads, etc. • Global competition for material. • As with Power, the internal costs both within Transmission and in Agency
Services that support Transmission Services are increasing in response to the drivers shown here and the growing Transmission infrastructure.
Drivers of Agency Services costs are largely the same as those for Power and Transmission. The cost increases in many of the Agency Services activities (such as Information Technology, General Counsel, Finance, Supply Chain, and Human Capital Management) are due to the need for increased support of Power and Transmission activities. Agency Services activities are integral to both continuing activities and the achievement of enhanced programmatic goals. In addition to its more traditional General
4Appendix A

and Administration activities, Agency Services also includes the centralized Technology Innovation and Confirmation (Research and Development) program. In keeping with a long-term plan outlined in the IPR and previous public involvement efforts, the Technology Innovation and Confirmation program is in the process of ramping up to a stable program size based on a percentage of BPA revenues.
BPA has considered the above cost drivers in light of the comments received and has made the following changes to proposed program spending levels:
For FY 2009:
• For Power and Agency Services internal operations, proposed levels have been reduced by 3 percent.
• The Conservation Rate Credit is reduced by $4 million.
• The capital investment forecast for Conservation is reduced by $10 million.
These changes result in a decrease of roughly $8 million from the FY 2009 Power Services spending levels shown in the initial IPR. In addition, the 3 percent reduction in Agency Services also produces a decrease of $5 million for Transmission.
For FY 2010-2011:
• Conservation capital will be reduced by $18 million in FY 2010 and $10 million in FY 2011. These forecasted reductions reflect further analysis and a revised estimate of what the program can achieve, including a ramp-up period to the expected program levels in FY 2010-2011.
• We have reestablished the renewable rate credit in the forecast. This credit was proposed to be zero in the initial IPR. It has been increased to $4 million for FY 2010 and $2.5 million for FY 2011. This increase reflects the expectation that utilities are likely to need additional assistance in acquiring and using renewable resource power to serve their retail loads.
• We have modified the planned Transmission Services Capital as follows:
Reshaped the timing of the I-5 corridor project to reflect a more likely and achievable schedule, and
Increased the “lapse factor” for transmission capital from 15 percent to 17 percent. (The lapse factor is an assumption that a percentage of planned capital investment will be delayed into the subsequent rate period.)
Note: The lapse factor for all other programs except fish and wildlife and CGS remains at 15 percent. No lapse factor was applied to fish and wildlife or CGS.
The impacts to depreciation and interest expense due to changes in capital investment have been estimated in tables in the Power and Transmission sections of this document, however the final amounts will be determined in the upcoming rate cases.
Additional Review The decisions on FY 2010-2011 program spending levels outlined here are based on the best information available. We believe that by next spring we should have additional
5 Appendix A

information that may cause revisions to some program levels for FY 2010-2011. Additional information will likely become available on the following topics:
• A better understanding of BPA’s role in the development of energy efficiency and renewable resources as a result of the Northwest Energy Efficiency Task Force activities, recommendations from the Northwest Power and Conservation Council’s 6th Power Plan which will establish new conservation targets for the region, and a public process BPA intends to hold to discuss its role in energy efficiency;
• Better understanding of the internal costs associated with the transition to new power contracts and rates in 2012;
• More clarity on fish and wildlife costs;
• Further work on Network Open Season planning;
• Further work on BPA’s asset planning and resource strategy resulting in improved estimates of realistically achievable capital spending; and
• Evaluation of the implications for BPA and the region of recent events in global financial markets and indications of a severe economic downturn.
The decisions outlined here will be the basis for our initial rate proposals. We intend to hold a subsequent, abbreviated program review next spring to reconsider the program levels in light of the increased information available at that time.
The following tables display the proposed spending levels for Power and Transmission Services by major categories. These estimates include Agency Services direct costs and allocations in support of each of the programs.
FY 2010-11 Power Expenses Summary
$ in Thousands a Initial IPR Final IPR Change Initial IPR Final IPR Change2 FY 2010 FY 2010 FY 2010 FY 2011 FY 2011 FY 2011
269,200 269,200 0 365,000 365,000 0280,700 280,700 0 296,461 296,461 0
31,889 31,889 0 32,343 32,343 0327,189 * * 404,795 * *221,426 * * 220,445 * *
41,588 45,588 4,000 43,438 45,938 250087,088 87,088 0 86,722 86,722 0
134,609 135,627 1,018 138,857 139,910 105315,598 15,598 0 16,071 16,071 0
176,393 * * 177,043 * *263,541 263,541 0 270,618 270,618 0204,001 * * 216,916 * *556,184 * * 577,064 * *177,657 * * 194,291 * *
25,746 25,746 0 28,082 28,082 02,812,809 1,154,977 5,018 3,068,146 1,281,145 3,553
Other – Colville Settlement, Non-Operating Total
Fish & Wildlife/USF&W/Planning CouncilAmortization/DepreciationNon-Federal Debt ServiceNet Interest Expense
Generation Conservation (including Internal OperationsPost-Retirement ContributionTransmission Purchases, Reserve/Ancillary
Long Term Generation ProgramPower Purchases incl DSI Monetized Power Residential Exchange Payments/Other Renewables (incl rate credit)
Power ProgramColumbia Generating Station O&M Corps & Reclamation O&M for Hydro
*These will be determined in the upcoming rate case.
6Appendix A
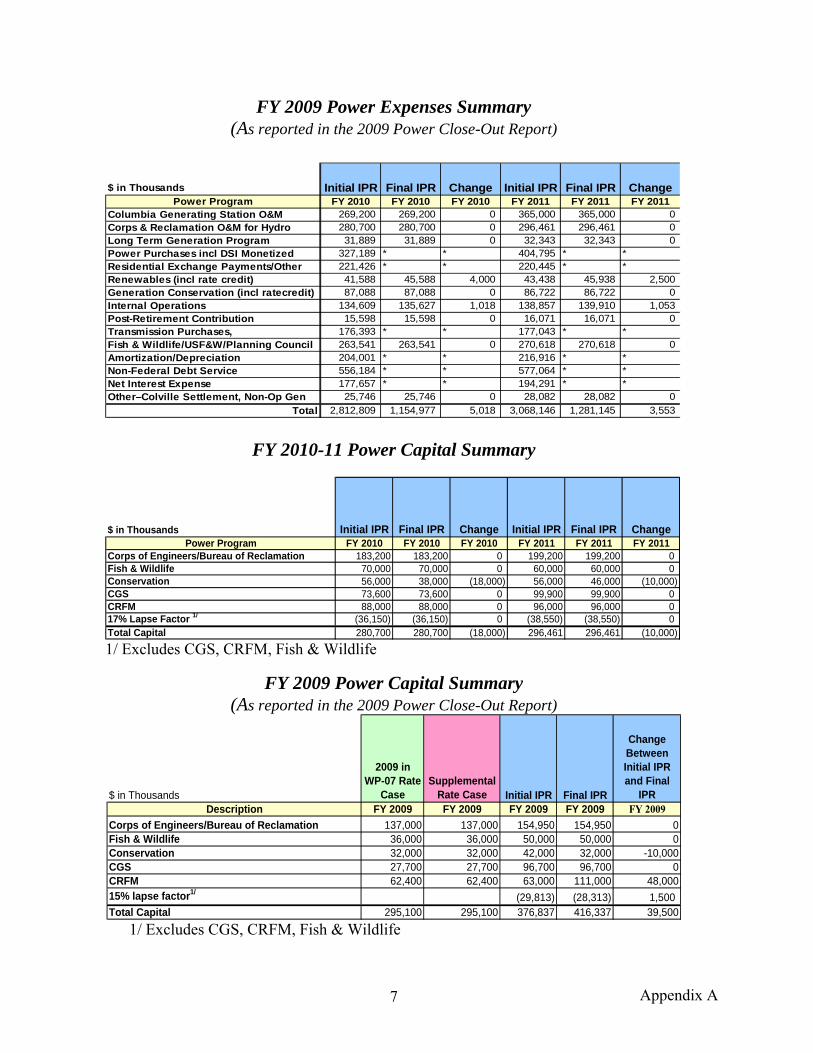
FY 2009 Power Expenses Summary (As reported in the 2009 Power Close-Out Report)
$ in Thousands Initial IPR Final IPR Change Initial IPR Final IPR Change
FY 2010 FY 2010 FY 2010 FY 2011 FY 2011 FY 2011269,200 269,200 0 365,000 365,000 0280,700 280,700 0 296,461 296,461 031,889 31,889 0 32,343 32,343 0
327,189 * * 404,795 * *221,426 * * 220,445 * *41,588 45,588 4,000 43,438 45,938 2,50087,088 87,088 0 86,722 86,722 0
134,609 135,627 1,018 138,857 139,910 1,05315,598 15,598 0 16,071 16,071 0
176,393 * * 177,043 * *263,541 263,541 0 270,618 270,618 0204,001 * * 216,916 * *556,184 * * 577,064 * *177,657 * * 194,291 * *25,746 25,746 0 28,082 28,082 0
2,812,809 1,154,977 5,018 3,068,146 1,281,145 3,553Other–Colville Settlement, Non-Op Gen
Total
Fish & Wildlife/USF&W/Planning CouncilAmortization/DepreciationNon-Federal Debt ServiceNet Interest Expense
Generation Conservation (incl ratecredit)Internal OperationsPost-Retirement ContributionTransmission Purchases,
Long Term Generation ProgramPower Purchases incl DSI Monetized Residential Exchange Payments/Other Renewables (incl rate credit)
Power ProgramColumbia Generating Station O&M Corps & Reclamation O&M for Hydro
FY 2010-11 Power Capital Summary
$ in Thousands Initial IPR Final IPR Change Initial IPR Final IPR ChangeFY 2010 FY 2010 FY 2010 FY 2011 FY 2011 FY 2011
183,200 183,200 0 199,200 199,200 070,000 70,000 0 60,000 60,000 056,000 38,000 (18,000) 56,000 46,000 (10,000)73,600 73,600 0 99,900 99,900 088,000 88,000 0 96,000 96,000 0
(36,150) (36,150) 0 (38,550) (38,550) 0280,700 280,700 (18,000) 296,461 296,461 (10,000)
Corps of Engineers/Bureau of ReclamationFish & WildlifeConservationCGSCRFM17% Lapse Factor 1/
Power Program
Total Capital
1/ Excludes CGS, CRFM, Fish & Wildlife
FY 2009 Power Capital Summary (As reported in the 2009 Power Close-Out Report)
$ in Thousands
2009 in WP-07 Rate
CaseSupplemental
Rate Case Initial IPR Final IPR
Change Between Initial IPR and Final
IPRDescription FY 2009 FY 2009 FY 2009 FY 2009 FY 2009
137,000 137,000 154,950 154,950 0Fish & Wildlife 36,000 36,000 50,000 50,000 0Conservation 32,000 32,000 42,000 32,000 -10,000CGS 27,700 27,700 96,700 96,700 0CRFM 62,400 62,400 63,000 111,000 48,00015% lapse factor1/ (29,813) (28,313) 1,500Total Capital 295,100 295,100 376,837 416,337 39,500
Corps of Engineers/Bureau of Reclamation
1/ Excludes CGS, CRFM, Fish & Wildlife
7 Appendix A
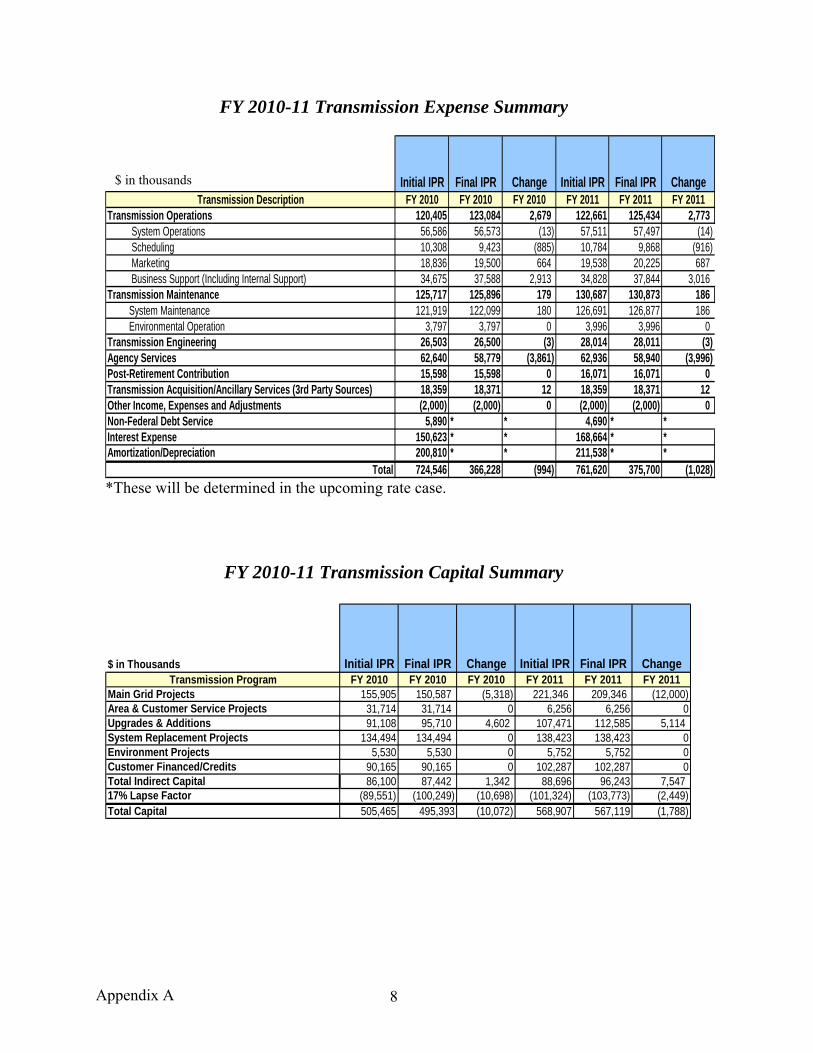
FY 2010-11 Transmission Expense Summary
Initial IPR Final IPR Change Initial IPR Final IPR ChangeFY 2010 FY 2010 FY 2010 FY 2011 FY 2011 FY 2011
120,405 123,084 2,679 122,661 125,434 2,77356,586 56,573 (13) 57,511 57,497 (14)10,308 9,423 (885) 10,784 9,868 (916)18,836 19,500 664 19,538 20,225 68734,675 37,588 2,913 34,828 37,844 3,016
125,717 125,896 179 130,687 130,873 186121,919 122,099 180 126,691 126,877 186
3,797 3,797 0 3,996 3,996 026,503 26,500 (3) 28,014 28,011 (3)62,640 58,779 (3,861) 62,936 58,940 (3,996)15,598 15,598 0 16,071 16,071 018,359 18,371 12 18,359 18,371 12(2,000) (2,000) 0 (2,000) (2,000) 0
5,890 * * 4,690 * *150,623 * * 168,664 * *200,810 * * 211,538 * *724,546 366,228 (994) 761,620 375,700 (1,028)
Transmission Description
Post-Retirement Contribution
Transmission Operations
Transmission Maintenance
System Operations Scheduling Marketing Business Support (Including Internal Support)
System Maintenance Environmental OperationTransmission EngineeringAgency Services
Amortization/DepreciationTotal
Transmission Acquisition/Ancillary Services (3rd Party Sources)Other Income, Expenses and AdjustmentsNon-Federal Debt ServiceInterest Expense
*These will be determined in the upcoming rate case.
$ in thousands
FY 2010-11 Transmission Capital Summary
$ in Thousands Initial IPR Final IPR Change Initial IPR Final IPR ChangeFY 2010 FY 2010 FY 2010 FY 2011 FY 2011 FY 2011
155,905 150,587 (5,318) 221,346 209,346 (12,000) 31,714 31,714 0 6,256 6,256 091,108 95,710 4,602 107,471 112,585 5,114
134,494 134,494 0 138,423 138,423 05,530 5,530 0 5,752 5,752 0
90,165 90,165 0 102,287 102,287 086,100 87,442 1,342 88,696 96,243 7,547
(89,551) (100,249) (10,698) (101,324) (103,773) (2,449) 505,465 495,393 (10,072) 568,907 567,119 (1,788)
Transmission ProgramMain Grid ProjectsArea & Customer Service Projects
Total Capital
Upgrades & AdditionsSystem Replacement ProjectsEnvironment Projects
Total Indirect Capital17% Lapse Factor
Customer Financed/Credits
8Appendix A

Response to General Comments Many of the comments received during the public comment period on the overall FY 2010-2011 program spending levels relate to BPA’s processes, rate levels and decision making rather than to specific programs. More broadly based comments are addressed below.
1. Potential rate increases, cost controls and a budget cap:
• Tacoma Power made the following comments: Potential Rate Increases: “The potential rate impact of the proposed agency-wide spending levels for FY 2010-2011 is alarming.” Cost Controls: “We urge BPA to further review areas under your control where costs could be reduced. Ensure the FY 2010-2011 cost proposal is being developed with the mindset for keeping costs in check and not funding unjustified projects and programs that appear on an organization’s ‘wish list.’ The budgets for each workgroup appear to be created as individual silos and there does not appear to be any cross-agency prioritization. . . . . (We) recommend BPA now perform some cross-agency prioritization and reduce these increases by not funding low-priority projects and scaling some of the others.” ….Budget Philosophy: “No funding goal (or percentage increase limit) seems to be established from one year to the next and the proposed FY 2010-2011 budget increases are substantial. BPA should exercise diligence to identify projects or program areas where costs could be reduced to offset some of the impacts of the known large cost drivers. . . . BPA should continue to look for creative ways to reduce the impacts from the primary cost drivers by confirming that these (power) funding levels are required. These Agency Services costs need to be reduced, rate of inflation or lower.”
• The Joint Public Power group made the following comments. “We suggested in our comments on the 2009 IPR comments that BPA adopt an overall spending limit . . . . BPA did not respond to our suggestion in closing out the FY2009 IPR process regarding the need for an overall budgetary cap. There is no evidence of an overall spending limit…BPA should guard against raising its cost structure to the point where it may have competitiveness problems if market energy prices decline in the future…BPA should take into account cost pressures faced by its customers. . . . If secondary revenues don’t stay high, BPA could easily be looking at a 20-25% (power) rate increase with the proposed budgets. Agency Services spending increases should be held to the rate of inflation.” “We would still like a response to the suggestion. . . . WAPA’s MOA with its utilities. . . could serve as a possible model …”
Response: BPA recognizes that utility customers have concern over the rate level that BPA establishes to recover its costs. Therefore, in the development phase of these proposed spending levels, BPA prioritized and outlined the programs and projects included in proposed spending. In its review, BPA did not employ a cost review standard for determining whether a project or program is justified or not, but rather, the resulting cost of a given project or program is driven by a rise in program requirements, including significant infrastructure improvement and obligations to meet new regulatory requirements. Such projects and programs are not the result of a
9 Appendix A

“wish list” but are the result of BPA meeting its federal public purpose. Program requirements cannot be met without increasing Power and Transmission spending, as well as spending in support organizations that play an integral role in accomplishing and completing the work. While it is likely these costs will result in some level of increase in Power and, possibly, Transmission rates, we believe this level of spending is necessary to avoid significant costs and/or reductions in long term reliability. We will, however, re-assess these program levels during FY 2009, prior to developing final rate proposals.
BPA has not developed an overall budgetary cap or established a requirement to hold increases to some level, such as the rate of inflation, and does not believe it is appropriate to do so. Setting arbitrary ceilings can be counter productive and result in decisions and program levels that have negative impacts over the long term that far outweigh short-term savings. In developing program levels, BPA uses an Integrated Financial Planning Process that charts the development, approval and implementation of program levels and cost estimates. This process links BPA’s internal spending level development and pre-rate development with the IPR, which allows for open public participation.
Within this framework, BPA believes it is important that the spending level development process include flexibility, allowing BPA to respond to changing circumstances and/or requirements. This flexibility was essential in determining the program levels proposed in the initial IPR for FY 2010-2011. In the development process, for example, BPA recognized that Power Services has effectively had a cap on Power internal operating costs and has been absorbing inflation for seven years. Despite the success of the Efficiency Project Improvement Processes (EPIP), which have helped BPA mitigate cost pressures in many areas, many costs actually have been deferred. This deferral has contributed to the cost pressure BPA now faces. These pressures are such that we can no longer successfully sustain flat costs while maintaining reliability and meeting other obligations. BPA also took into consideration the numerous new initiatives and drivers that are likely to require cost increases. While BPA certainly considers the impact of program levels on its customers, it also tries to find the right balance between low cost and the other “pillars” in its strategy to provide system reliability, environmental stewardship and regional accountability.
One comment suggested that an agreement such as the one that Western Area Power Marketing Administration’s Rocky Mountain and Upper Great Plains Region (WAPA) has with its utility customers could be used as a model for implementing more thorough customer involvement in the front end of the budget process. WAPA, Bureau of Reclamation, and the US Army Corps of Engineers (the Agencies) executed a memorandum of understanding regarding the Pick-Sloan Missouri Basin Program/Fryingpan-Arkansas Project Work Program Review (Program Review MOU) with three preference utility customer associations.
This Program Review MOU is intended to promote active participation, communication and coordination among the Agencies and the preference associations and identifies agreed-upon schedules and formats for the Agencies to provide financial and work program information. It provides for a Technical Committee and
10Appendix A

an Executive Committee, both made up of representatives from each of the Agencies and each of the customer associations. Under the MOU, the Agencies provide the preference associations the following information, in a specified format:
• Expense budgets compared to actual expenses for the completed year, with explanations for significant differences (e.g., +/- 10%);
• Annual expenses for two completed years, the current year, and five future years’ estimates, with explanations for significant differences;
• A list of cumulative capital expenditures, current year capital investments, and five future years’ estimates, including replacement projects;
• FTE for two prior years, current year, and five future years’ estimates;
• Comparison of indirects/overheads for two prior years, current year, and five future years’ estimates, with explanations of significant differences;
• Most current Construction and Rehabilitation Program 10-year Plan, plus reporting on significant projects that may impact the Power Repayment Study or be of interest to the Technical Committee;
• Current program status report, e.g., overview of critical issues, budget line items, proposed studies, plan or program changes since the last briefing, etc.; and
• As applicable, customer advanced funding and access to receipts funding separately from appropriations, revolving fund, etc.
The Technical Committee meets at least twice per year to review and exchange financial and cost data. The Agencies are supposed to respond timely to the issues raised by the preference associations over future spending activities within the limits of the Agencies’ authorities to disclose such information. Upon written notice, a preference association may request additional information and, subject to applicable federal law and regulations, shall have the right to review relevant records at the offices of the Agency. Disputes or disagreements regarding matters involving the Technical Committee may be referred to the Executive Committee for review, and disputes or disagreements regarding issues for the Executive Committee may be referred to the head of the Agency(ies). The appropriate Agency head shall respond to the issue within 20 working days.
BPA believes the Cost Review construct (now called the Integrated Business Review) described in the Regional Dialogue Policy provides all of BPA’s customers and constituents a high level of transparency, including most of the same type of financial information provided for review under the Program Review MOU, and much of it in greater detail. BPA considered a formal review process conceptually similar to the Program Review MOU, called the Cost Management Group (CMG), in the Regional Dialogue. The proposed CMG had a defined number of representatives of customer and non-customer interest groups participating. However, BPA found this was one of the major problems with the CMG. As stated in the Long-Term Regional Dialogue Record of Decision (ROD), “one of the CMG’s major stumbling blocks is it would represent a limited membership. While there are groups of stakeholders with similar relationships with BPA, they may have widely divergent interests and views of BPA
11 Appendix A

costs. . . . As NRU notes, ‘based on previous discussion and experience, it would likely be impossible to reach a broad based regional agreement regarding the size of the CMG and the proportionate representation between various stakeholder groups.’” (Regional Dialogue ROD, page 256)
The Program Review MOU provides for exchange of information that is restricted to the Agencies and the preference associations. However, as noted in the Regional Dialogue ROD, “excluding non-customers from the agency’s primary cost review process is contrary to BPA’s stewardship obligations because it would go a long way toward silencing non-customers. BPA needs to have the ability to receive input from constituent groups directly affected by cost decisions. These organizations can provide valuable input on the effect of spending increases and reductions. It is likely that the majority of the issues addressed in the renewables, conservation, and fish and wildlife spending, receive much non-customer attention because they affect or involve those who are doing the on-the-ground work in these areas. Creating separate forums for non-customers would result in a much more cumbersome and costly process and with little communication between the different interests. It is better, and more conducive to creating a collaborative process if all groups communicate with each other and with BPA, rather than just with BPA. . . . BPA’s process does include tribes, states, environmental groups, and other stakeholders as well as customers rather than limiting it to a few customer groups.” (Regional Dialogue ROD page 258)
Unlike the Program Review MOU, in the Regional Dialogue Policy BPA committed to a model which provides extensive opportunity for stakeholders as well as customers to review and give input to our forecasts of spending levels prior to finalizing them. This current IPR process is one part of the overall Integrated Business Review structure that BPA committed to in the Regional Dialogue. In IPR we have provided actual expenses, including indirects/overheads, for the prior two years, and forecasts for the current year and three additional years or through the upcoming rate period. For capital expenditures, we provided actuals for the prior two years and forecasts for the current year and five additional years. We also shared very detailed materials from various asset plans, including assessment of asset conditions and long-range capital plans. The level of detail provided in the IPR appears to be much greater than that provided under the Program Review MOU. For example, BPA provided at least eight full days of workshops and meetings on the FY 2010-2011 proposed costs, and hundreds of pages of materials, far in excess of the data called for in the Program Review MOU for most categories of costs.
The Quarterly Business Review (QBR) is the second part of the Integrated Business Review structure BPA committed to in the Regional Dialogue, and it is intended to be a forum to provide current financial forecasts, current financial results compared to forecasts, periodic updates to capital plans as they change, and information on upcoming issues that could have impact on future financial results. We will be holding the first such meeting in November. We have received input on the structure of those meetings and will solicit additional input.
In addition to information provided through the IPR and QBR processes, BPA, the Corps, and Reclamation, who manage the FCRPS hydrosystem assets through interagency Joint Operating Committees (JOCs), recognize the need for transparency
12Appendix A

and will meet with interested parties, stakeholders, and customers on an as needed basis. For example, the agencies now meet twice yearly with the Public Power Council to discuss the hydropower program financial (expense and capital budgets compared to actual costs, FTE, etc.) and operational performance (current and planned investment activities, critical maintenance accomplishments, etc.), as well as other related issues. BPA and the other agencies make a concerted effort to provide information and opportunity for customers and stakeholders to provide input.
We believe the IPR process BPA currently has and the QBR process that is being developed, though less formal than that provided by the Program Review MOU, will provide the information and transparency customers and other stakeholders are looking for, and we will continue to ask for input on how the process can be improved.
2. Levelizing Costs:
• Tacoma Power noted that “there seems to be a general theme of trying to get caught up on capital investment and maintenance. This has resulted in a front-loaded capital and maintenance program that significantly increases costs during the initial years of the program. We are asking that some levelizing take place over the next few years. . . .”
Response: As explained in the IPR workshops, the proposed capital investment levels are driven by in-depth assessments of needs through our asset management planning process and represent what BPA believes is critical to retaining reliable power generation and transmission. However, as suggested in comments, BPA has scrutinized its forecasts and made some revisions based on the recognition that the aggressive schedule for transmission and conservation capital investment may not be achievable. The final IPR levels reflect a revised schedule for one transmission capital project and an increased lapse factor applied to transmission capital (from 15 percent to 17 percent). Considering the probable need for a ramp-in period for the projected increase in conservation capital, the FY 2010-2011 conservation capital has been reduced by $18 million in FY 2010 and $10 million in FY 2011.
3. IPR Process:
• The Joint Public Power group made the following comments: A couple of changes would help in evaluating BPA’s proposals: first, BPA should provide alternative packages of spending proposals for evaluation. . . .BPA made a reasonable first start at this in . . . looking at the effects of a 10% cost decrease by function . . . , but more BPA departments need to emulate the detailed analysis that BPA Public Affairs did in taking a detailed look at the impacts of spending reductions. . . . It would be useful and good budgetary practice to have BPA present a formal business case for new incremental spending proposals where BPA would calculate the benefit and the rate of return associated with the incremental spending, so that the proposal could be better evaluated.
13 Appendix A

• Tacoma Power commented that there should be clear cost-benefit analysis performed and provided as part of the IPR process. . . . BPA must establish a reliable practice to control costs and should do so with significant input from its contractual customers through the IPR process.
Response: We appreciate feedback on our first agency wide IPR process. We expect the next full IPR process to begin in the spring of FY 2010 and will take these comments into account as we plan for that process.
We will also begin Quarterly Business Review (QBR) meetings this year and expect to use these meetings to provide updates of current expense and capital spending compared to forecasts, as well as to notify customers and constituents of current or upcoming issues that could impact BPA’s financial situation.
4. Tier 2 Product: • The Joint Public Power group noted that any costs associated with the
development of Tier 2 products should not be included in rates and paid for under the current subscription contracts.
Response: While we understand customer interest in this issue, this is a rate-making issue and should be addressed in the upcoming Power rate case rather than in the IPR forum. Structure of This Report
Sections 2 through 4 of this document focus on each of the program areas identified in the workshop process and provide detailed information for the following four issues:
1) The initial IPR spending levels compared with the FY 2007-2009 rate case average,
2) A short description of what is included in the associated costs, 3) Comments received on the program area, and 4) Final decisions on cost levels for the initial rate proposal, addressing comments
received.
Section 2 addresses Power Services costs, including the Fish and Wildlife Program, the Lower Snake River Compensation Plan, and Energy Efficiency/Conservation, which are fully direct-charged to Power Services. Section 3 addresses Transmission Services costs. The majority of Agency Services costs are addressed concurrently with the Power and Transmission programs they support. Section 4 addresses some remaining some Agency Services Programs as well as the Technology Innovation and Confirmation program, which impacts both Power and Transmission.
14Appendix A

Section 2
POWER SERVICES
15 Appendix A

The first two summary tables below provide the change in FY 2010-2011 expense and capital forecasts from the Initial IPR to the Final IPR. The third and fourth tables displays the FY 2009 expense and capital forecasts from the original FY 2007-2009 rate proposal, the initial IPR, and the Final FY 2009 Power IPR Report.
FY 2010-11 Power Expenses Summary
$ in Thousands a Initial IPR Final IPR Change Initial IPR Final IPR Change2 FY 2010 FY 2010 FY 2010 FY 2011 FY 2011 FY 2011
269,200 269,200 0 365,000 365,000 0280,700 280,700 0 296,461 296,461 0
31,889 31,889 0 32,343 32,343 0327,189 * * 404,795 * *221,426 * * 220,445 * *
41,588 45,588 4,000 43,438 45,938 2,50087,088 87,088 0 86,722 86,722 0
134,609 135,627 1,018 138,857 139,910 1,05315,598 15,598 0 16,071 16,071 0
176,393 * * 177,043 * *263,541 263,541 0 270,618 270,618 0204,001 * * 216,916 * *556,184 * * 577,064 * *177,657 * * 194,291 * *
25,746 25,746 0 28,082 28,082 02,812,809 1,154,977 5,018 3,068,146 1,281,145 3,553
Other–Colville Settlement, Non-Op GenTotal
Fish & Wildlife/USF&W/Planning CouncilAmortization/DepreciationNon-Federal Debt ServiceNet Interest Expense
Generation Conservation (incl ratecredit)Internal OperationsPost-Retirement ContributionTransmission Purchases, Reserve/Ancillary
Long Term Generation ProgramPower Purchases incl DSI Monetized Power Residential Exchange Payments/Other Renewables (incl rate credit)
Power ProgramColumbia Generating Station O&M Corps & Reclamation O&M for Hydro
*These will be determined in the upcoming rate case.
FY 2010-11 Power Capital Summary
$ in Thousands Initial IPR Final IPR Change Initial IPR Final IPR ChangeFY 2010 FY 2010 FY 2010 FY 2011 FY 2011 FY 2011
183,200 183,200 0 199,200 199,200 070,000 70,000 0 60,000 60,000 056,000 38,000 (18,000) 56,000 46,000 (10,000)73,600 73,600 0 99,900 99,900 088,000 88,000 0 96,000 96,000 0
(36,150) (36,150) 0 (38,550) (38,550) 0280,700 280,700 (18,000) 296,461 296,461 (10,000)Total Capital
ConservationCGSCRFM17% Lapse Factor 1/
Power ProgramCorps of Engineers/Bureau of ReclamationFish & Wildlife
1/ Excludes CGS, CRFM, Fish & Wildlife
16Appendix A
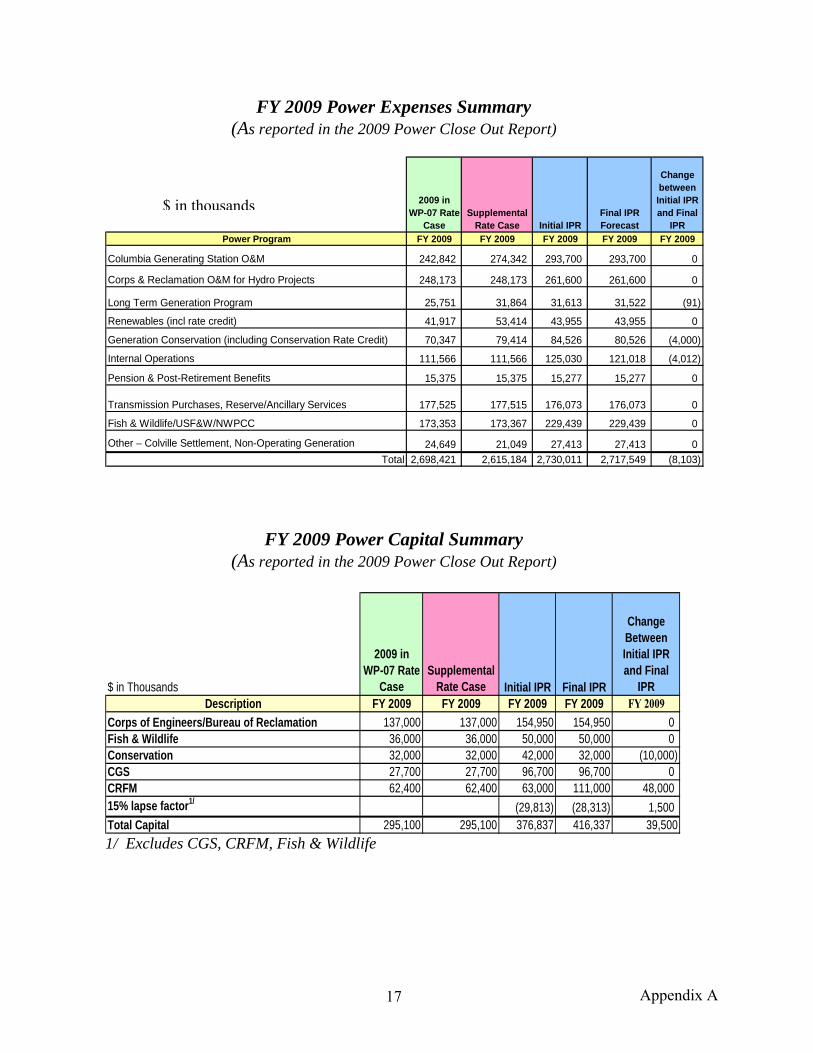
FY 2009 Power Expenses Summary (As reported in the 2009 Power Close Out Report)
2009 in WP-07 Rate
CaseSupplemental
Rate Case Initial IPRFinal IPR Forecast
Change between Initial IPR and Final
IPRPower Program FY 2009 FY 2009 FY 2009 FY 2009 FY 2009
Columbia Generating Station O&M 242,842 274,342 293,700 293,700 0
Corps & Reclamation O&M for Hydro Projects 248,173 248,173 261,600 261,600 0
Long Term Generation Program 25,751 31,864 31,613 31,522 (91)
Renewables (incl rate credit) 41,917 53,414 43,955 43,955 0
Generation Conservation (including Conservation Rate Credit) 70,347 79,414 84,526 80,526 (4,000)
Internal Operations 111,566 111,566 125,030 121,018 (4,012)
Pension & Post-Retirement Benefits 15,375 15,375 15,277 15,277 0
Transmission Purchases, Reserve/Ancillary Services 177,525 177,515 176,073 176,073 0
Fish & Wildlife/USF&W/NWPCC 173,353 173,367 229,439 229,439 0
Other – Colville Settlement, Non-Operating Generation 24,649 21,049 27,413 27,413 0Total 2,698,421 2,615,184 2,730,011 2,717,549 (8,103)
$ in thousands
FY 2009 Power Capital Summary (As reported in the 2009 Power Close Out Report)
$ in Thousands
2009 in WP-07 Rate
CaseSupplemental
Rate Case Initial IPR Final IPR
Change Between Initial IPR and Final
IPRDescription FY 2009 FY 2009 FY 2009 FY 2009 FY 2009
137,000 137,000 154,950 154,950 0Fish & Wildlife 36,000 36,000 50,000 50,000 0Conservation 32,000 32,000 42,000 32,000 (10,000)CGS 27,700 27,700 96,700 96,700 0CRFM 62,400 62,400 63,000 111,000 48,00015% lapse factor1/ (29,813) (28,313) 1,500Total Capital 295,100 295,100 376,837 416,337 39,500
Corps of Engineers/Bureau of Reclamation
1/ Excludes CGS, CRFM, Fish & Wildlife
17 Appendix A

A. COLUMBIA GENERATING STATION O&M $ millions
Expense FY 2010
Initial IPR Final IPR Change 269.2 269.2 0
FY 2011 Initial IPR Final IPR Change
365.0 365.0 0 Capital
FY 2010 Initial IPR Final IPR Change
73.6 73.6 0 FY 2011
Initial IPR Final IPR Change 99.9 99.9 0
BPA pays the costs of Energy Northwest’s Columbia Generating Station (CGS) nuclear power plant. Energy Northwest (EN) has continued to focus on equipment obsolescence, reliability and plant performance. EN management believes additional investments are necessary to improve safety, reliability and performance. The plant’s performance indicators have been low when measured against criteria set by the Institute of Nuclear Power Operations (INPO), but capacity factors have been good.
Comments Received: • Tacoma Power commented they are concerned with the proposed $27M increase
for 2010 and $123M increase for 2011... (and) request BPA to continue efforts to influence the reduction of the proposed CGS budget.
• The Joint Public Power Group made the following comments: EN should be aware of the importance of its Long Range Plan (LRP) for BPA ratemaking... It would be most effective if the results of the LRP could set a cap on spending in the years beyond the current budget year. Also, it would be very helpful if the timing of the LRP and the BPA IPR could be better synchronized so that BPA could have reliable information as BPA and the customers go into the IPR process. In addition, BPA and EN should further explore the costs and benefits of moving CGS financial reporting to BPA’s fiscal year.
Response: EN believes that the CGS program levels reflect the need to continue improvement efforts and ensure sustained high performance. The increased funding EN has identified for FY 2010-2011 is designed in general to address:
1) Deferred maintenance issues,
2) Equipment obsolescence and reliability, and
18Appendix A

3) Performance improvement initiatives.
These investments should result in improved overall performance of CGS.
BPA has discussed, and will continue to discuss, with EN the need for cost effective, safe, reliable operation of the Columbia Generating Station to benefit the ratepayers of the Northwest. Safety and reliability are paramount goals, but it is essential that we meet those goals in the most cost-effective way possible. BPA is concerned about the rapid rate of increase in costs for CGS operations. In conjunction with Energy Northwest management, a set of performance indicators has been developed. We are actively tracking these indicators on a quarterly basis and will make this information available to the public. This tracking should help ensure that these major increases in spending actually yield the improvements they are intended to produce.
EN management has also proposed to develop a long range plan with significantly increased rigor such that it would provide greater confidence to BPA and others that actual results will be consistent with the plan. We also understand the EN Board has hired independent counsel to evaluate CGS’s long range plans and budgets in terms of addressing significant station needs. We believe this is an appropriate step and encourage its continued implementation. We would be interested in working with the Board to see how we could benefit from the counsel of any independent review the Board undertakes. Finally, BPA is considering seeking independent counsel from individuals with significant nuclear plant executive management and operations experience in order to be able to complement our on-site Richland staff's experience. The focus of any contracted additional executive nuclear expertise will be to assure our budget review and oversight authority is executed in a manner that will promote the safe, reliable and cost-effective operation of CGS consistent with the project agreements. We also intend to continue to urge the EN Board to adopt the overarching principle we proposed to the Board last year. As stated below, this principle seeks to provide greater alignment throughout our organizations through focusing on the complementary nature of our missions. That principle is as follows:
“BPA and ENW are committed to long-term, safe, reliable operation of CGS accomplished at the lowest reasonable cost necessary to achieve those objectives. It is also our objective to integrate CGS with the Federal Columbia River Power System and to achieve optimum utilization of the resources of that system taken as a whole and to achieve efficient and economical operation of that system.”
BPA and customers have emphasized the importance of a credible Long Range Plan and the ability of EN to live to that plan. EN produced and updated an LRP in the spring of 2008 in conjunction with the FY 2009 budget. EN has committed to living within the costs identified in the plan, barring any unforeseen regulatory requirements. EN has revised its budget preparation cycle (long range plan) by advancing it by two months. This will allow time for meaningful customer review and input of the CGS budget before it is included in future IPR reviews. EN is exploring options for changing the EN fiscal year to coincide with BPA's fiscal years; however, it is not clear if the benefits of such a move would justify the costs. Decision: No change to the planned CGS expense or capital forecast for FY 2010-2011.
19 Appendix A

B. CORPS AND RECLAMATION O&M $ millions
Expense FY 2010
Initial IPR Final IPR Change 280.7 280.7 0
FY 2011 Initial IPR Final IPR Change
296.5 296.5 0
Capital FY 2010
Initial IPR Final IPR Change 183.2 183.2 0
FY 2011 Initial IPR Final IPR Change
199.2 199.2 0 BPA works with the U.S. Army Corps of Engineers and the Bureau of Reclamation to implement funding for both operations and maintenance (O&M) activities at 31 hydro electric facilities throughout the Northwest and to ensure implementation of all regionally cost-effective system refurbishments and enhancements. BPA’s Enterprise Process Improvement Project (EPIP) included a major asset management planning effort that included Federal hydro facilities. Significant drivers of change affecting Corps and Reclamation O&M include the Western Electricity Coordinating Council (WECC) and the North American Electric Reliability Council (NERC) compliance requirements, non routine extraordinary maintenance requirements, and Biological Opinion (BiOp) requirements. BPA expects O&M spending to rise at roughly the rate of inflation (except for non routine extraordinary maintenance activities such as the Grand Coulee Dam Third Powerhouse rehabilitation and other items mentioned above.)
Columbia River Fish Mitigation Project (CRFM) includes the power portion of investment funded by Corps of Engineers appropriations for investment on mitigation efforts for fish and wildlife on the Federal Columbia River dams. BPA becomes obligated to repay the power portion of the costs to the US Treasury at the time the investment is considered complete and placed into service. While the forecast of total investment from FY 2007 through 2011 has not changed significantly, the Corps provided an updated forecast reflecting a change in the expected timing for investment being placed into service, with less than forecast going into service in FY 2007 and considerably more expected in FY 2008 than forecast in the WP-07 rate case.
Comments Received: • The Joint Public Power group made the following comments: While improvement
is always possible, it appears that the Integrated Business Management Model developed by the Corps, Reclamation and BPA has resulted in a fairly rigorous asset-based planning and management program. . . . The ramp up of capital
20Appendix A
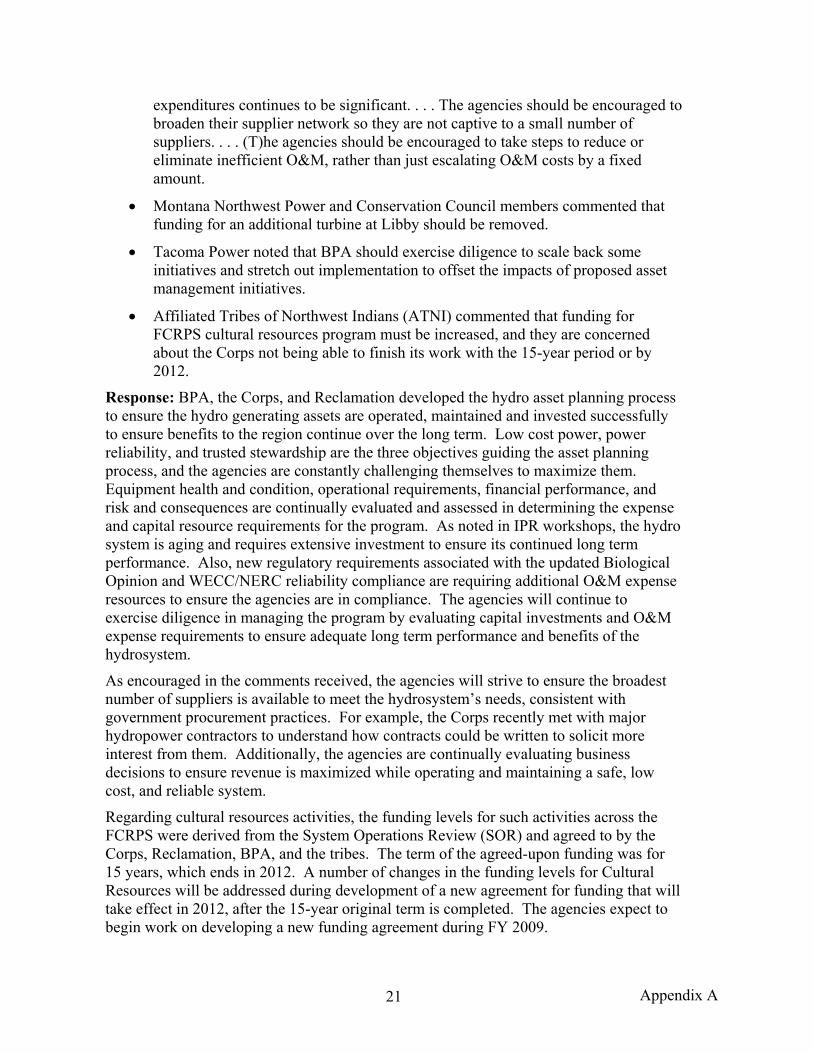
expenditures continues to be significant. . . . The agencies should be encouraged to broaden their supplier network so they are not captive to a small number of suppliers. . . . (T)he agencies should be encouraged to take steps to reduce or eliminate inefficient O&M, rather than just escalating O&M costs by a fixed amount.
• Montana Northwest Power and Conservation Council members commented that funding for an additional turbine at Libby should be removed.
• Tacoma Power noted that BPA should exercise diligence to scale back some initiatives and stretch out implementation to offset the impacts of proposed asset management initiatives.
• Affiliated Tribes of Northwest Indians (ATNI) commented that funding for FCRPS cultural resources program must be increased, and they are concerned about the Corps not being able to finish its work with the 15-year period or by 2012.
Response: BPA, the Corps, and Reclamation developed the hydro asset planning process to ensure the hydro generating assets are operated, maintained and invested successfully to ensure benefits to the region continue over the long term. Low cost power, power reliability, and trusted stewardship are the three objectives guiding the asset planning process, and the agencies are constantly challenging themselves to maximize them. Equipment health and condition, operational requirements, financial performance, and risk and consequences are continually evaluated and assessed in determining the expense and capital resource requirements for the program. As noted in IPR workshops, the hydro system is aging and requires extensive investment to ensure its continued long term performance. Also, new regulatory requirements associated with the updated Biological Opinion and WECC/NERC reliability compliance are requiring additional O&M expense resources to ensure the agencies are in compliance. The agencies will continue to exercise diligence in managing the program by evaluating capital investments and O&M expense requirements to ensure adequate long term performance and benefits of the hydrosystem.
As encouraged in the comments received, the agencies will strive to ensure the broadest number of suppliers is available to meet the hydrosystem’s needs, consistent with government procurement practices. For example, the Corps recently met with major hydropower contractors to understand how contracts could be written to solicit more interest from them. Additionally, the agencies are continually evaluating business decisions to ensure revenue is maximized while operating and maintaining a safe, low cost, and reliable system.
Regarding cultural resources activities, the funding levels for such activities across the FCRPS were derived from the System Operations Review (SOR) and agreed to by the Corps, Reclamation, BPA, and the tribes. The term of the agreed-upon funding was for 15 years, which ends in 2012. A number of changes in the funding levels for Cultural Resources will be addressed during development of a new agreement for funding that will take effect in 2012, after the 15-year original term is completed. The agencies expect to begin work on developing a new funding agreement during FY 2009.
21 Appendix A

Regarding the comment that there is no scientific basis for funding an additional turbine at Libby to support Kootenai River sturgeon, the Libby 6th unit was identified as a potential project for planning purposes only and was listed that way while describing the system asset planning process. There was no funding included in the plan for this work as it did not meet hydro capital investment criteria; it was merely identified as a potential project. If a decision were to be made that a 6th unit at Libby was necessary due to ESA considerations, funding would have to come by displacing other capital projects in the plan.
Decision: No change to the planned Corps and Bureau of Reclamation expense or capital forecast for FY 2010-2011.
C. LONG-TERM GENERATING PROGRAM $ millions
Expense FY 2010
Initial IPR Final IPR Change 31.9 31.9 0
FY 2011 Initial IPR Final IPR Change
32.3 32.3 0 This program consists of BPA’s long-term acquisition contracts for output from generating resources such as Cowlitz Falls, Billing Credits Generation, Wauna Co-generation project, Elwah Dam, Idaho Falls Bulb Turbine, and Clearwater Hatchery Generation. Most of the expenses associated with the long-term generating projects are based on energy production at the generating units and, therefore, are offset by revenues. There is little opportunity for improvement because prices are fixed by contract.
Comments Received: None
Decision: No change to the planned Long-Term Generation Project forecast for FY 2010-2011.
D. ENERGY EFFICIENCY & CONSERVATION $ millions
Expense FY 2010
Initial IPR Final IPR Change 87.1 87.1 0
FY 2011 Initial IPR Final IPR Change
86.7 86.7 0
22Appendix A

Capital FY 2010
Initial IPR Final IPR Change 56.0 38.0 18.0
FY 2011 Initial IPR Final IPR Change
56.0 46.0 10.0
(As reported in the 2009 Power Close Out Report)
FY 2009 Expense Original WP-07 Initial IPR Final IPR Change
70.3 84.5 80.5 (4.0) FY 2009 Capital
Original WP-07 Initial IPR Final IPR Change 32.0 42.0 32.0 (10.0)
BPA’s Energy Efficiency and Conservation program is designed to capture the anticipated 35 to 40 percent increase in public power’s share of the region’s conservation target in the FY 2010-2011 period (i.e., 70 aMW per year).
Comments Received:
• Idaho Conservation League commented that the IPR should include additional support for efficiency/conservation programs.
• Tacoma Power stated it does not support increases in conservation spending that would affect the Tier 1 rate.
• The Joint Public Power group raised a concern about spending increases. The region has been able to achieve conservation under current levels. They would be more comfortable with the spending if they knew what would be included in new long-term contracts.
• Columbia Inter-Tribal Fish Commission (CRITFC) supports full funding of conservation. BPA should expand conservation programs as much as possible.
Response: Tiered rates will not start until FY 2012, which is beyond the scope of this IPR. BPA’s post-2011 energy efficiency costs will be included in Tier 1 rates as outlined in the Final Long Term Regional Dialogue Policy (July 2007). That said, BPA has designed its proposed spending for energy efficiency to capture the anticipated 35 to 40 percent increase in public power’s share of the region’s conservation target in the FY 2010-2011 period (i.e., 70 aMW per year). It is uncertain what level of utility self-funding for conservation will occur during this time. Therefore, BPA’s proposed spending levels assumed that 20 percent (or 14 aMW/year) of public power’s share of the regional conservation target would be delivered by utilities using their own funds. BPA also proposes energy efficiency capital spending for this period to supplement utility funding under bilateral contract arrangements. The incentives customers have, including
23 Appendix A
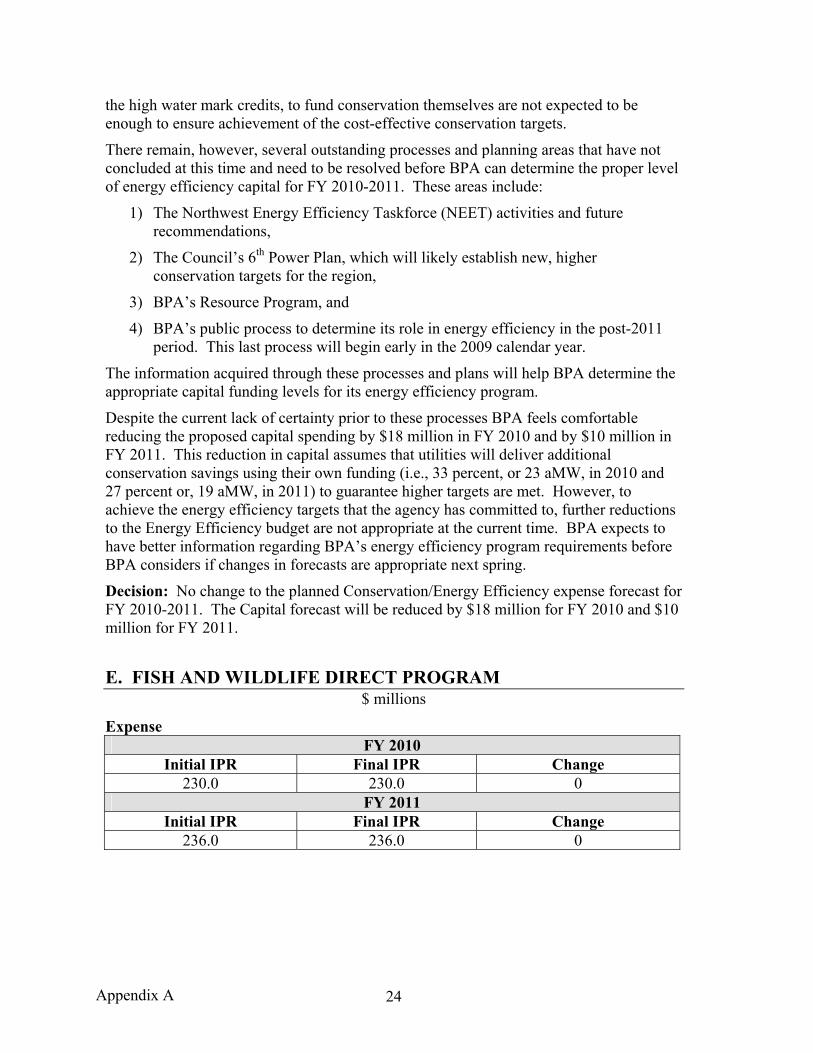
the high water mark credits, to fund conservation themselves are not expected to be enough to ensure achievement of the cost-effective conservation targets.
There remain, however, several outstanding processes and planning areas that have not concluded at this time and need to be resolved before BPA can determine the proper level of energy efficiency capital for FY 2010-2011. These areas include:
1) The Northwest Energy Efficiency Taskforce (NEET) activities and future recommendations,
2) The Council’s 6th Power Plan, which will likely establish new, higher conservation targets for the region,
3) BPA’s Resource Program, and
4) BPA’s public process to determine its role in energy efficiency in the post-2011 period. This last process will begin early in the 2009 calendar year.
The information acquired through these processes and plans will help BPA determine the appropriate capital funding levels for its energy efficiency program.
Despite the current lack of certainty prior to these processes BPA feels comfortable reducing the proposed capital spending by $18 million in FY 2010 and by $10 million in FY 2011. This reduction in capital assumes that utilities will deliver additional conservation savings using their own funding (i.e., 33 percent, or 23 aMW, in 2010 and 27 percent or, 19 aMW, in 2011) to guarantee higher targets are met. However, to achieve the energy efficiency targets that the agency has committed to, further reductions to the Energy Efficiency budget are not appropriate at the current time. BPA expects to have better information regarding BPA’s energy efficiency program requirements before BPA considers if changes in forecasts are appropriate next spring.
Decision: No change to the planned Conservation/Energy Efficiency expense forecast for FY 2010-2011. The Capital forecast will be reduced by $18 million for FY 2010 and $10 million for FY 2011.
E. FISH AND WILDLIFE DIRECT PROGRAM
$ millions
Expense FY 2010
Initial IPR Final IPR Change 230.0 230.0 0
FY 2011 Initial IPR Final IPR Change
236.0 236.0 0
24Appendix A
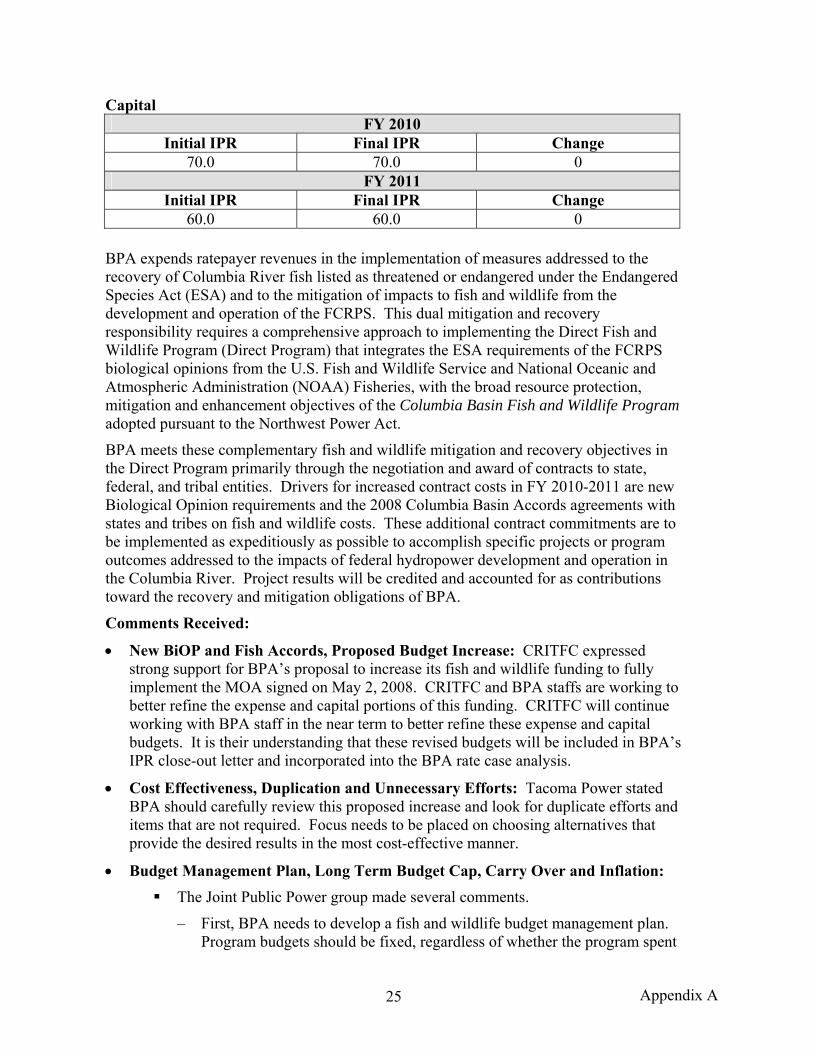
Capital FY 2010
Initial IPR Final IPR Change 70.0 70.0 0
FY 2011 Initial IPR Final IPR Change
60.0 60.0 0
BPA expends ratepayer revenues in the implementation of measures addressed to the recovery of Columbia River fish listed as threatened or endangered under the Endangered Species Act (ESA) and to the mitigation of impacts to fish and wildlife from the development and operation of the FCRPS. This dual mitigation and recovery responsibility requires a comprehensive approach to implementing the Direct Fish and Wildlife Program (Direct Program) that integrates the ESA requirements of the FCRPS biological opinions from the U.S. Fish and Wildlife Service and National Oceanic and Atmospheric Administration (NOAA) Fisheries, with the broad resource protection, mitigation and enhancement objectives of the Columbia Basin Fish and Wildlife Program adopted pursuant to the Northwest Power Act.
BPA meets these complementary fish and wildlife mitigation and recovery objectives in the Direct Program primarily through the negotiation and award of contracts to state, federal, and tribal entities. Drivers for increased contract costs in FY 2010-2011 are new Biological Opinion requirements and the 2008 Columbia Basin Accords agreements with states and tribes on fish and wildlife costs. These additional contract commitments are to be implemented as expeditiously as possible to accomplish specific projects or program outcomes addressed to the impacts of federal hydropower development and operation in the Columbia River. Project results will be credited and accounted for as contributions toward the recovery and mitigation obligations of BPA.
Comments Received:
• New BiOP and Fish Accords, Proposed Budget Increase: CRITFC expressed strong support for BPA’s proposal to increase its fish and wildlife funding to fully implement the MOA signed on May 2, 2008. CRITFC and BPA staffs are working to better refine the expense and capital portions of this funding. CRITFC will continue working with BPA staff in the near term to better refine these expense and capital budgets. It is their understanding that these revised budgets will be included in BPA’s IPR close-out letter and incorporated into the BPA rate case analysis.
• Cost Effectiveness, Duplication and Unnecessary Efforts: Tacoma Power stated BPA should carefully review this proposed increase and look for duplicate efforts and items that are not required. Focus needs to be placed on choosing alternatives that provide the desired results in the most cost-effective manner.
• Budget Management Plan, Long Term Budget Cap, Carry Over and Inflation: The Joint Public Power group made several comments.
– First, BPA needs to develop a fish and wildlife budget management plan. Program budgets should be fixed, regardless of whether the program spent
25 Appendix A

all funds in the previous year. Excepting BiOp and MOA commitments, the establishment of funding should not create a locked-in future expectation to the budgeted funds if they are not spent in the current fiscal year.
– Second, because of the risks that operational costs will be substantially higher than expected it is imperative that BPA establish and abide by a long-term budget for the Integrated Fish and Wildlife Program costs.
– Third, BPA stated it will make a decision on how to handle unspent funds as part of the development of a budget management plan for overall program budget management, and that it plans to develop the plan this summer. Customers would like BPA to set a timetable for definition of BPA funding requirements, completion of a budget management plan and a review process for customers and other stakeholders.
– Fourth, customers are uncomfortable with the automatic inflation adjustment and would like greater detail on how and when BPA plans to address the issue of a budget cap.
– Fifth, it is imperative that BPA not only consider the recommendations made by its customers, but take action to implement these recommendations. BPA needs to set a schedule for development and implementation of a budget management plan, to address how the Northwest Power and Conservation Council Program, Memoranda of Agreement with States and Tribes, a new biological opinion, and other elements of BPA’s fish and wildlife budget will be integrated and managed.
Program Review:
• The Joint Public Power group commented that customers would like to see BPA work closely with the Council to ensure a comprehensive program review that involves the Independent Scientific Review Panel. In particular, RM&E needs to undergo rigorous scrutiny. There are projects currently funded by ratepayer dollars that have little relation to the effects of hydropower construction and operation and should be funded through other sources or eliminated. The funding should be seen as comprehensive for both fish and wildlife and the proposed budget should not increase beyond its current limit.
• Washington Department of Fish and Wildlife commented that BPA should continue to support, and consider costs associated with funding the following projects: Pacific States Marine Fisheries, Commission Coded Wire Tag Project, the Smolt Monitoring Program, the Fish Passage Center, Comparative Survival Study, StreamNet, the Columbia Basin Fish & Wildlife Authority, and the Lower Snake River Compensation Program.
• Washington Governor’s Salmon Recovery Office commented that BPA should consider the needs of regional salmon recovery organizations in Washington. Greater funding would enable enhanced coordination to meet the needs of the 2008 BiOp and Columbia Basin Fish Accords.
26Appendix A

Science Review:
• The Joint Public Power group recommended that the current requirements for Independent Scientific Review Panel review should be continued for all projects funded by BPA. BPA has noted a commitment to ensuring independent science review, but needs to outline the process that guarantees this.
Economic Review:
• The Joint Public Power group supports the Independent Economic Advisory Board (IEAB) and request that it be adequately funded.
Cultural Resources:
• ATNI expressed concern whether BPA can provide more information on the cost components for how these cultural resources responsibilities (for BPA Fish and Wildlife Mitigation Program Projects) will be met for FY 2009 and elaborate on the tribal consultation/ coordination components related to these costs.
Mitigation Settlement of Southern Idaho and Albeni Falls:
• Idaho Department of Fish and Game proposed consideration of a settlement of the wildlife mitigation obligation for Southern Idaho and Albeni Falls. BPA should calculate a reasonable estimate of the value for the rate case so a settlement is not foreclosed.
Response: Because a new BiOP and Fish Accords exist, BPA has made a proposed spending increase for Fish and Wildlife Program implementation in FY 2010-2011, resulting in upward adjustment in funding from the current rate period to $230 million and $236 million, respectively. These proposed spending levels reflect the funding needed to implement both the new FCRPS Biological Opinion (BiOp) and the Columbia Basin Fish Accords (Accords) without reducing funding for other non-BiOp and/or non-Accord elements of the Program. While the proposed spending includes the funding necessary to meet Fish Accord commitments to individual Accord signatories, the spending is not broken down into individual components. In total the spending proposed is what BPA believes is necessary for meeting its individual Accord and BiOp commitments while not reducing funding for other elements of the Program.
Cost Effectiveness, Duplication and Unnecessary Efforts: BPA continues to place a premium on enhancing Fish and Wildlife Program performance and on managing and administering contract implementation to deliver project outcomes as biologically effective results – at the lowest cost and within budget. We see this as a two-pronged undertaking:
1) The Program itself must be firmly grounded in measurable performance expectations expressed as biological and environmental objectives; and
2) Projects must be designed around discrete work elements tailored to expected outcomes that are explicitly addressed to the Program’s performance objectives.
A durable and sustainable shift in Program emphasis is not an overnight undertaking; it is evolutionary, requiring the persistent attention of BPA Fish and Wildlife Division staff as well as buy in and commitment from other Fish and Wildlife Program partners such as the
27 Appendix A

Northwest Power and Conservation Council and the Fish and Wildlife co-managers. BPA will continue to examine and evaluate the current portfolio of effort to better spend existing resources even as we are developing additional projects to meet BiOp responsibilities and Accord commitments. The premise for existing, expanded, or newly initiated project commitments is the same: work supported by ratepayer funds will be evaluated on the basis of results that are a contribution toward explicit objectives. This is the basis of the performance construct upon which the Council has built the Program and BPA has based its BiOp actions.
Mitigation settlements for Southern Idaho and Albeni Falls: Mitigation settlements can be an effective strategy for meeting BPA’s wildlife responsibilities under the Northwest Power Act. Durable, workable settlement agreements require the participation of all affected sovereigns with jurisdictional or management authority over fish and wildlife resources in the area affected by the FCRPS and encompassed by the terms of settlement proposed. These sovereign interests need to be representative of the broad public interest in mitigation responsibilities of BPA, and serve as a surrogate for the affected resources, to whom the mitigation obligation is actually owed. These attributes can confound the likelihood and timing of successfully negotiated agreements, and make it difficult to project and incorporate cost-estimates into future Program levels and budget planning.
As a practical matter, any successfully concluded agreement would have to occur within the limitations of BPA’s financial flexibility. According to a recent BPA analysis (July 2008), BPA’s available Treasury borrowing authority could be fully utilized by 2016. We are not budgeting for a wildlife agreement at this time due to uncertainty about whether negotiations can be successfully concluded, and in recognition that a potential Idaho wildlife mitigation settlement must fit within the scope of BPA's limited borrowing authority. BPA continues to explore strategies for maximizing its current borrowing authority, as well as potential new alternatives that might be developed.
Budget Management Plan, Long Term Budget Cap, Carry Over and Inflation: BPA acknowledges that with the new BiOp and Fish Accords, and the related Program spending level increases in FY 2009, there are many new management implementation complexities. Although policies are being developed, important unanswered questions remain that will need to be addressed as we gain experience.
In coordination with the region, BPA will provide an opportunity for input and comment regarding the questions, issues, and policies surrounding the Fish and Wildlife proposed spending, including many of the comments proposed by BPA's customer representatives that will be considered in the development of this plan. Among the suggestions to be addressed in the plan are carry over of unspent funds, economic review, inflation and a long-term spending plan for the Integrated Fish and Wildlife Program. Science Review will be addressed in a separate document that is under development and will be provided to customers and other constituents for feedback.
BPA believes its future cost projections accurately reflect the range of impacts to the operation of the FCRPS related to implementation of both the new BiOp and Columbia Basin Fish Accords. Additional financial consequences relating potential outcomes associated with the BiOp litigation are too speculative to address at this time, and will be
28Appendix A

addressed as necessary in the future in base budgets. BPA has included adjustment clauses in rates in the past to address this risk, and will consider doing so in the future.
BPA customers commented that outside the BiOp and Accord commitments, unspent funds should not be carried forward nor made available for funding projects in the future. BPA believes that there is a potential for actual Fish and Wildlife Program spending to come in below the proposed spending in FY 2010, due to the ramp-up of the expanded program. This may occur because most of the new Fish Accord projects will not be in place before the end of the FY 2008 implementation period; under-spending is thus likely to continue into FY 2009 given the time needed to complete ISRP review and required permitting processes. Additionally, the FY 2009 spending projection reflects an assumption that actual expenditures for new work would occur at 75 percent of the full project budget.
This ramp-up assumption was applied for FY 2009; in actuality, many new projects have project-year budgets (the contract implementation period spans two fiscal years) that will spill into FY 2010, further extending the Program ramp-up period. BPA’s proposed $230 million spending in FY 2010 is reflective of the funding level necessary for meeting Fish Accord and BiOp commitments, while allowing for no reduction of funding for the other non-BiOp and/or non-Accord elements of the Program. Given the potential for a more protracted ramp-up of Program spending for new BiOp and Accord commitments than expected, BPA may choose to introduce a probability distribution around this proposed spending in the formal FY 2010-2011 rate case, to model the anticipated range of uncertainty of actual spending relative to the proposed of $230 million for FY 2010.
As part of its FY 2007-2009 project funding decision BPA decided it was reasonable to carry over $8.8 million in unspent funding from the previous rate period, so as not to create a "use-it-or-lose-it" incentive. For FY 2010-2011, as it relates to projects outside the BiOp/Accords, BPA will make a decision on how to handle unspent funds as part of the development of a spending management plan for overall Program implementation planning. BPA expects to complete development of this plan during the autumn of 2008 and will provide an opportunity for Council, customer and Program stakeholder input.
BPA's FY 2009 proposed spending does not reflect an adjustment for inflation; however, BPA has proposed an annual adjustment of 2.5 percent per year starting in FY 2010. BPA agrees that with the addition of an annual inflation adjustment, the Program budget in total could function as an overall funding commitment or cap. For example, BPA does not plan to allow the general carryover of unspent funds for the non-Accord portion of the Program; those dollars would be otherwise returned to ratepayers by being kept in BPA’s cash reserves. Conversely, if work can be implemented at lower than forecasted amount, flexibility from lower-than-expected contract costs may need to be used to cover potentially higher-than-forecasted needs of other projects. This approach, with the addition of the inflation adjustment, provides both flexibility and substantial certainty in making future project funding decisions within an overall established budget for FYs 2010-2011. However, longer-term, BPA’s commitment under the FCRPS BiOps is to specific performance requirements and not to specific work or a set amount of money.
Customers suggested that BPA look for potential ways to reduce funding of other projects where there are duplicative efforts and/or a lack of a clear FCRPS mitigation nexus. BPA
29 Appendix A
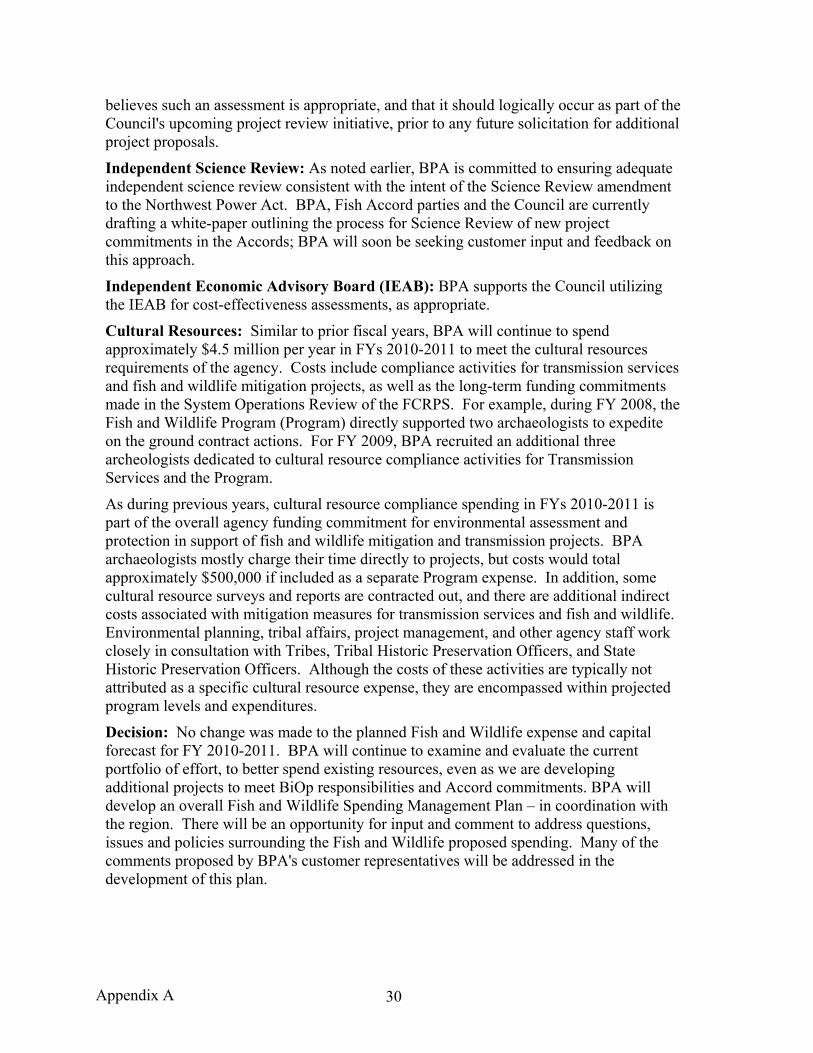
believes such an assessment is appropriate, and that it should logically occur as part of the Council's upcoming project review initiative, prior to any future solicitation for additional project proposals.
Independent Science Review: As noted earlier, BPA is committed to ensuring adequate independent science review consistent with the intent of the Science Review amendment to the Northwest Power Act. BPA, Fish Accord parties and the Council are currently drafting a white-paper outlining the process for Science Review of new project commitments in the Accords; BPA will soon be seeking customer input and feedback on this approach.
Independent Economic Advisory Board (IEAB): BPA supports the Council utilizing the IEAB for cost-effectiveness assessments, as appropriate.
Cultural Resources: Similar to prior fiscal years, BPA will continue to spend approximately $4.5 million per year in FYs 2010-2011 to meet the cultural resources requirements of the agency. Costs include compliance activities for transmission services and fish and wildlife mitigation projects, as well as the long-term funding commitments made in the System Operations Review of the FCRPS. For example, during FY 2008, the Fish and Wildlife Program (Program) directly supported two archaeologists to expedite on the ground contract actions. For FY 2009, BPA recruited an additional three archeologists dedicated to cultural resource compliance activities for Transmission Services and the Program.
As during previous years, cultural resource compliance spending in FYs 2010-2011 is part of the overall agency funding commitment for environmental assessment and protection in support of fish and wildlife mitigation and transmission projects. BPA archaeologists mostly charge their time directly to projects, but costs would total approximately $500,000 if included as a separate Program expense. In addition, some cultural resource surveys and reports are contracted out, and there are additional indirect costs associated with mitigation measures for transmission services and fish and wildlife. Environmental planning, tribal affairs, project management, and other agency staff work closely in consultation with Tribes, Tribal Historic Preservation Officers, and State Historic Preservation Officers. Although the costs of these activities are typically not attributed as a specific cultural resource expense, they are encompassed within projected program levels and expenditures.
Decision: No change was made to the planned Fish and Wildlife expense and capital forecast for FY 2010-2011. BPA will continue to examine and evaluate the current portfolio of effort, to better spend existing resources, even as we are developing additional projects to meet BiOp responsibilities and Accord commitments. BPA will develop an overall Fish and Wildlife Spending Management Plan – in coordination with the region. There will be an opportunity for input and comment to address questions, issues and policies surrounding the Fish and Wildlife proposed spending. Many of the comments proposed by BPA's customer representatives will be addressed in the development of this plan.
30Appendix A
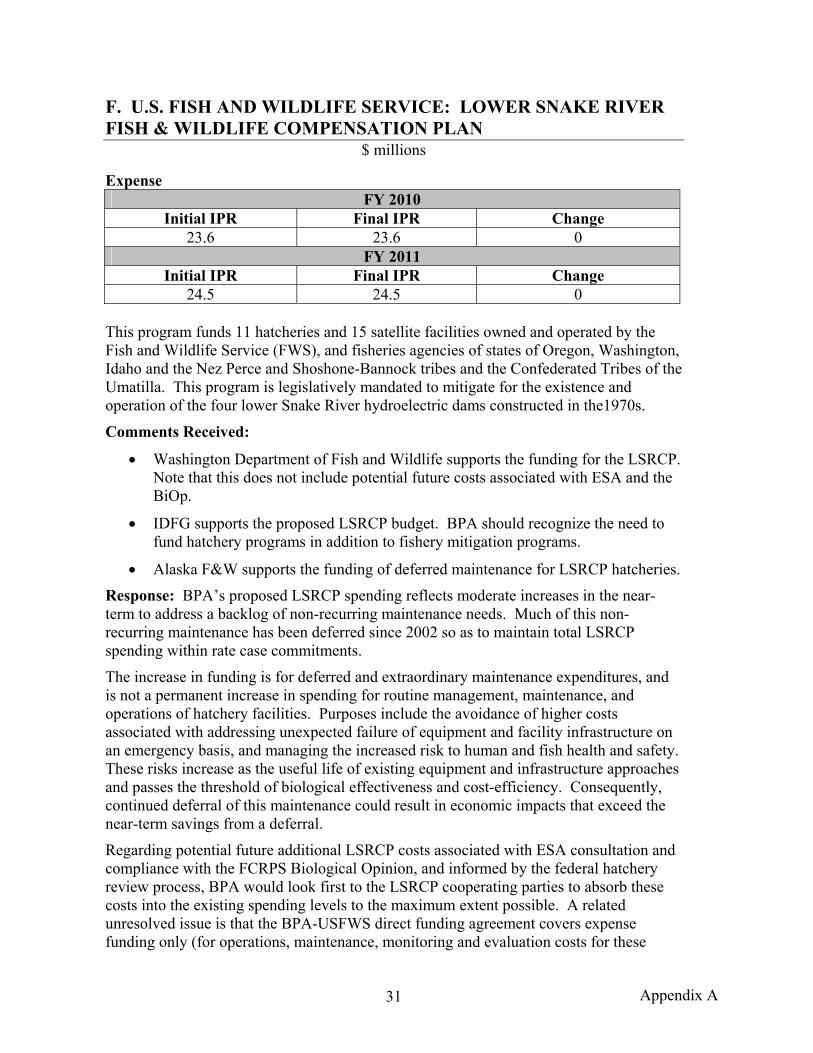
F. U.S. FISH AND WILDLIFE SERVICE: LOWER SNAKE RIVER FISH & WILDLIFE COMPENSATION PLAN
$ millions Expense
FY 2010 Initial IPR Final IPR Change
23.6 23.6 0 FY 2011
Initial IPR Final IPR Change 24.5 24.5 0
This program funds 11 hatcheries and 15 satellite facilities owned and operated by the Fish and Wildlife Service (FWS), and fisheries agencies of states of Oregon, Washington, Idaho and the Nez Perce and Shoshone-Bannock tribes and the Confederated Tribes of the Umatilla. This program is legislatively mandated to mitigate for the existence and operation of the four lower Snake River hydroelectric dams constructed in the1970s.
Comments Received:
• Washington Department of Fish and Wildlife supports the funding for the LSRCP. Note that this does not include potential future costs associated with ESA and the BiOp.
• IDFG supports the proposed LSRCP budget. BPA should recognize the need to fund hatchery programs in addition to fishery mitigation programs.
• Alaska F&W supports the funding of deferred maintenance for LSRCP hatcheries.
Response: BPA’s proposed LSRCP spending reflects moderate increases in the near-term to address a backlog of non-recurring maintenance needs. Much of this non-recurring maintenance has been deferred since 2002 so as to maintain total LSRCP spending within rate case commitments.
The increase in funding is for deferred and extraordinary maintenance expenditures, and is not a permanent increase in spending for routine management, maintenance, and operations of hatchery facilities. Purposes include the avoidance of higher costs associated with addressing unexpected failure of equipment and facility infrastructure on an emergency basis, and managing the increased risk to human and fish health and safety. These risks increase as the useful life of existing equipment and infrastructure approaches and passes the threshold of biological effectiveness and cost-efficiency. Consequently, continued deferral of this maintenance could result in economic impacts that exceed the near-term savings from a deferral.
Regarding potential future additional LSRCP costs associated with ESA consultation and compliance with the FCRPS Biological Opinion, and informed by the federal hatchery review process, BPA would look first to the LSRCP cooperating parties to absorb these costs into the existing spending levels to the maximum extent possible. A related unresolved issue is that the BPA-USFWS direct funding agreement covers expense funding only (for operations, maintenance, monitoring and evaluation costs for these
31 Appendix A

hatcheries). To the extent that major capital investments may become necessary, there is no funding source at this time.
The relationship between mitigation and conservation hatchery purposes, and the appropriate mix of production to support both, is beyond the scope of the IPR. However, BPA’s funding responsibilities should naturally relate to activities necessary for mitigating the effects of the federal hydrosystem on fish populations. Consequently, to the extent that hatchery purposes can be segmented, BPA’s responsibilities would encompass FCRPS mitigation, and not harvest augmentation.
The region continues to debate the efficacy and relative impacts of artificial production on the long-term fitness and reproductive success of native and wild stocks. Supplementation hatcheries which are operated for the purpose of rebuilding salmonid populations which have historically been depressed due to FCRPS impacts are supported at levels reflected in BPA’s Fish and Wildlife Program budget commitments. Future funding for hatchery infrastructure, including expansion or reprogramming of existing capacity, will be informed by the outcome of the ongoing hatchery review process.
Decision: No change to the planned Lower Snake River Compensation Program forecast of expense and capital.
G. RENEWABLE RESOURCES
$ millions Expense
FY 2010 Initial IPR Final IPR Change
41.6 45.6 4.0 FY 2011
Initial IPR Final IPR Change 43.4 45.9 2.5
BPA’s goal for renewable resources is to ensure the development of its share of cost-effective regional renewable resources at the least possible cost to BPA ratepayers. BPA’s share will be based on the regional load growth (about 40 percent) of its Public Utility customers. BPA will cover its share through power acquired by BPA from renewable resources to serve its public customers and/or renewable resources acquired by publics with or without financial assistance by BPA.
Comments Received:
• The Idaho Conservation League commented that BPA should restore renewable facilitation and use a portion to begin looking for reasonable investments in renewable resources.
• Tacoma Power stated that BPA should not increase the budget for renewable resources.
• The Joint Public Power group opposes BPA’s proposal to completely remove the renewable option from the Conservation Rate Credit. They suggest that it be
32Appendix A

ramped down gradually from $6 million today to $2 million by 2011. The renewable option should be extended to support small projects like customer-owned solar PV and it should also cover the purchase of Environmentally Preferred Power. BPA should continue to offer the $559/kw credit for solar PV. Renewable Northwest Project commented that $4 million is inadequate to meet customer needs for new renewables. BPA should continue its leadership by taking a broader approach to renewables.
• CRTIFC supports full funding of renewable resource programs. Response: Comments received reflect opposing views, some suggesting that BPA should increase renewable resource spending and others suggesting BPA should not increase renewable spending. Joint comments submitted by the Public Power Council, Industrial Customers of Northwest Utilities, Northwest Requirements Utilities, Northwest Generating Company and the Public Generating Pool noted that some utilities may continue to need assistance in procuring renewable resource generation in the short-term and that the signing parties opposed BPA's proposal to completely remove the Renewable Option from the Conservation Rate Credit. The joint comments suggested decreasing the Renewable Option funding levels from $6 million to $4 million in 2010 and $2.5 million in 2011. The joint comments also suggested that the Renewable Option should continue to support small-scale customer-owned renewable projects and allow the purchase of Environmentally Preferred Power. Decision: BPA agrees that utilities will likely need additional assistance in acquiring and using renewable generation to serve their loads. Therefore, BPA will include in its FY 2010-2011 initial rate proposal, $4 million in 2010 and $2.5 million in 2011 for the Renewable Option to the Conservation Rate Credit. H. POWER INTERNAL COSTS/ POST-RETIREMENT BENEFITS
$ millions
Expense FY 2010
Initial IPR Final IPR Change 150.2 151.2 1.0
FY 2011 Initial IPR Final IPR Change
154.9 155.9 1.0
(As reported in the 2009 Power Close Out Report)
FY 2009 Expense Original WP-07 Initial IPR Final IPR Change
126.9 140.3 136.3 4.0
Internal Operations includes Agency Services that provide support to the programs and organizations within Power Services and are either allocated to Power Services, or direct-charged to Power Services, as well as the internal operating costs of Power Services itself.
33 Appendix A

Although programs have increased in scope and responsibility, as stated earlier, Power Services has effectively had a cap on power costs for seven years and the internal operations costs in 2008 are virtually the same as they were in 2001. The deferral of costs creates cost pressures such that Power can no longer sustain flat costs. Increases over the 2001-2008 levels are necessary for FY 2009 through 2011 because of greater wind integration efforts than expected, greater-than-expected costs for Regional Dialogue contract and tiered rates work, greater-than-planned resource acquisition efforts, and increased IT, Supply Chain, Legal, Financial and other activities necessary to achieve the programs describe above.
Re-organizations that were not reflected in initial IPR numbers are reflected in the final IPR numbers. These reorganizations resulted in greater efficiencies and a more accurate allocation of Business Support function costs. The result is a slight shift in allocated costs of $1 million from Transmission internal costs to Power internal costs.
There was no change in Post-Retirement Benefits.
Decision: No change to total Agency Internal Operating Costs other than $1 million shift in allocation from Transmission to Power. COST DECISIONS TO BE MADE AS PART OF THE RATE CASE The following section provides information on areas for which the costs will be determined in the FY 2010-2011 rate proposal. They have been included in the IPR to provide an opportunity for participants to understand the basis for these costs. I. POWER PURCHASES, INCLUDING MONETIZED BENEFITS
TO DSIS $ millions
FY 2010 Initial IPR Final IPR Change
327.2 * 0 FY 2011
Initial IPR Final IPR Change 404.8 * 0
* Power Purchases, including monetized benefits to DSIs, will be determined in the Final Rate Proposal.
34Appendix A

J. TRANSMISSION PURCHASES, RESERVE/ANCILLARY SERVICES
$ millions
FY 2010 Initial IPR Final IPR Change
176.4 * 0 FY 2011
Initial IPR Final IPR Change 177.0 * 0
* Transmission Purchases and Reserve and Ancillary Services will be determined in the appropriate rate cases. K. RESIDENTIAL EXCHANGE PROGRAM
$ millions
FY 2010 Initial IPR Final IPR Change
221.4 * 0 FY 2011
Initial IPR Final IPR Change 220.5 * 0
* Residential Exchange benefits will be determined in the Final Rate Proposal. L. TOTAL NET INTEREST, AMORTIZATION/DEPRECIATION
AND NON-FEDERAL DEBT SERVICE $ millions
Net Interest FY 2010
Initial IPR Final IPR Change Power 177.7 176.1* (1.6)
FY 2011 Initial IPR Final IPR Change
Power 194.3 192.0* (2.3) Amortization/Depreciation
FY 2010 Initial IPR Final IPR Change
Power 204.0 197.5* (6.5) FY 2011
Initial IPR Final IPR Change Power 216.9 208.1* (8.8)
35 Appendix A
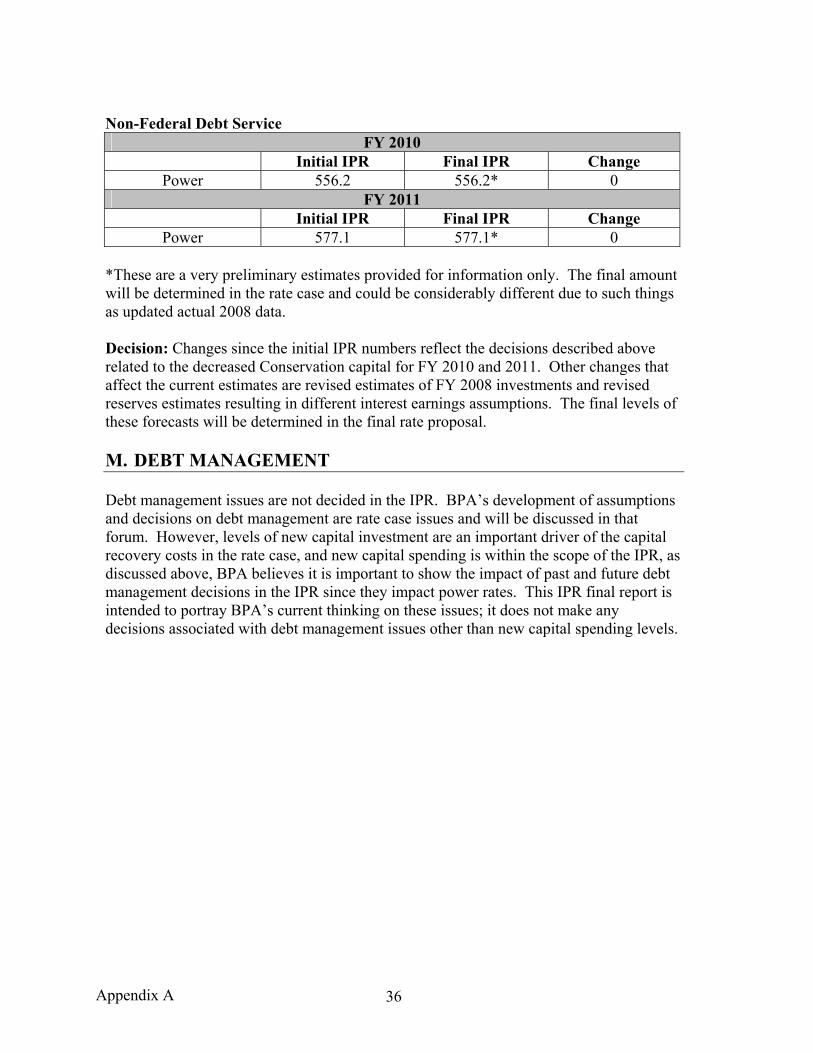
Non-Federal Debt Service
FY 2010 Initial IPR Final IPR Change
Power 556.2 556.2* 0 FY 2011
Initial IPR Final IPR Change Power 577.1 577.1* 0
*These are a very preliminary estimates provided for information only. The final amount will be determined in the rate case and could be considerably different due to such things as updated actual 2008 data. Decision: Changes since the initial IPR numbers reflect the decisions described above related to the decreased Conservation capital for FY 2010 and 2011. Other changes that affect the current estimates are revised estimates of FY 2008 investments and revised reserves estimates resulting in different interest earnings assumptions. The final levels of these forecasts will be determined in the final rate proposal. M. DEBT MANAGEMENT Debt management issues are not decided in the IPR. BPA’s development of assumptions and decisions on debt management are rate case issues and will be discussed in that forum. However, levels of new capital investment are an important driver of the capital recovery costs in the rate case, and new capital spending is within the scope of the IPR, as discussed above, BPA believes it is important to show the impact of past and future debt management decisions in the IPR since they impact power rates. This IPR final report is intended to portray BPA’s current thinking on these issues; it does not make any decisions associated with debt management issues other than new capital spending levels.
36Appendix A

Section 3
TRANSMISSION
37 Appendix A
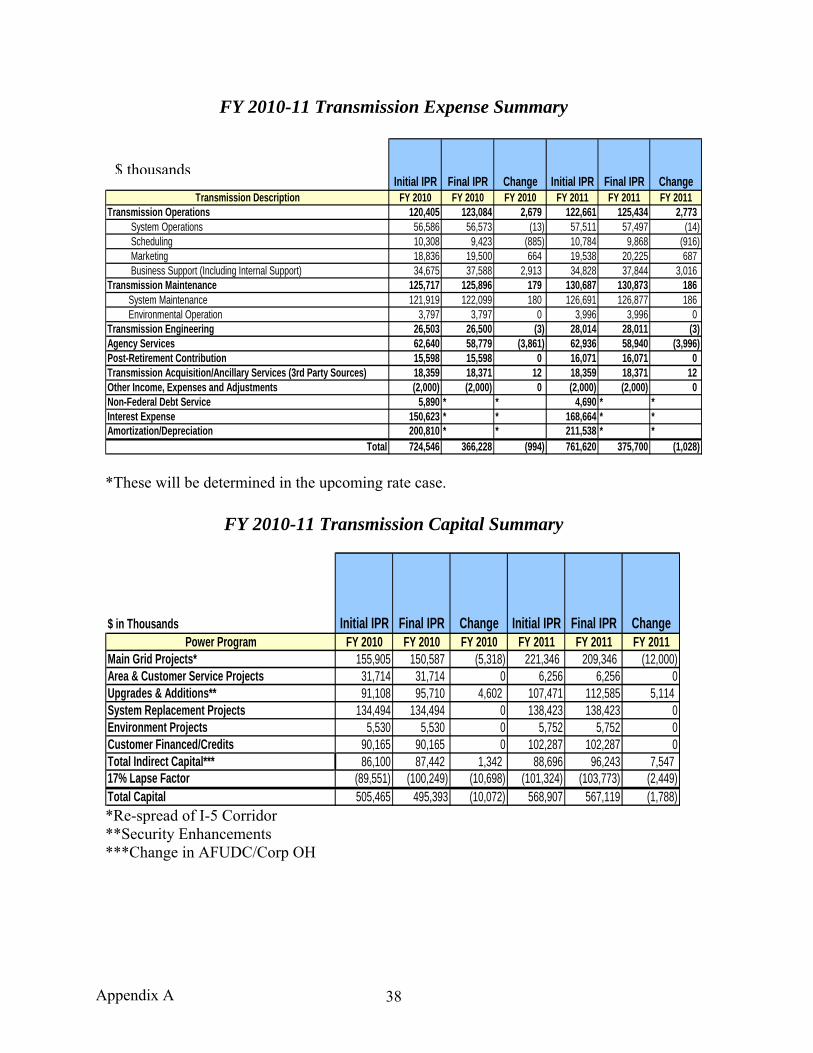
FY 2010-11 Transmission Expense Summary
Initial IPR Final IPR Change Initial IPR Final IPR ChangeFY 2010 FY 2010 FY 2010 FY 2011 FY 2011 FY 2011
120,405 123,084 2,679 122,661 125,434 2,77356,586 56,573 (13) 57,511 57,497 (14)10,308 9,423 (885) 10,784 9,868 (916)18,836 19,500 664 19,538 20,225 68734,675 37,588 2,913 34,828 37,844 3,016
125,717 125,896 179 130,687 130,873 186121,919 122,099 180 126,691 126,877 186
3,797 3,797 0 3,996 3,996 026,503 26,500 (3) 28,014 28,011 (3)62,640 58,779 (3,861) 62,936 58,940 (3,996)15,598 15,598 0 16,071 16,071 018,359 18,371 12 18,359 18,371 12(2,000) (2,000) 0 (2,000) (2,000) 0
5,890 * * 4,690 * *150,623 * * 168,664 * *200,810 * * 211,538 * *724,546 366,228 (994) 761,620 375,700 (1,028)
Amortization/DepreciationTotal
Transmission Acquisition/Ancillary Services (3rd Party Sources)Other Income, Expenses and AdjustmentsNon-Federal Debt ServiceInterest Expense
System Maintenance Environmental OperationTransmission EngineeringAgency Services
Transmission Description
Post-Retirement Contribution
Transmission Operations
Transmission Maintenance
System Operations Scheduling Marketing Business Support (Including Internal Support)
$ thousands
*These will be determined in the upcoming rate case.
FY 2010-11 Transmission Capital Summary
$ in Thousands Initial IPR Final IPR Change Initial IPR Final IPR ChangeFY 2010 FY 2010 FY 2010 FY 2011 FY 2011 FY 2011
155,905 150,587 (5,318) 221,346 209,346 (12,000) 31,714 31,714 0 6,256 6,256 091,108 95,710 4,602 107,471 112,585 5,114
134,494 134,494 0 138,423 138,423 05,530 5,530 0 5,752 5,752 0
90,165 90,165 0 102,287 102,287 086,100 87,442 1,342 88,696 96,243 7,547
(89,551) (100,249) (10,698) (101,324) (103,773) (2,449) 505,465 495,393 (10,072) 568,907 567,119 (1,788)
Power ProgramMain Grid Projects*Area & Customer Service ProjectsUpgrades & Additions**System Replacement ProjectsEnvironment ProjectsCustomer Financed/CreditsTotal Indirect Capital***17% Lapse FactorTotal Capital *Re-spread of I-5 Corridor **Security Enhancements ***Change in AFUDC/Corp OH
38Appendix A

A. TRANSMISSION OPERATIONS $ millions
Expense FY 2010
Initial IPR Final IPR Change 120.4 123.1 2.7
FY 2011 Initial IPR Final IPR Change
122.7 125.4 2.8
Transmission Operations consists of four separate programs: Systems Operations; Transmission Scheduling; Transmission Marketing; and Business Support.
• System Operations include technical operations, substation operations, control center support, and power system dispatching.
• The Scheduling program includes expenses for reservations, pre-scheduling, real-time scheduling, scheduling after-the-fact (ATF), and technical support.
• The Marketing program contains expenses for transmission sales, contract management, and marketing business strategy and assessment.
• Business support includes expenses for logistics services, aircraft services, and the Agency Services costs that provide support to the programs and organizations within Transmission Services and are direct-charged to Transmission.
• Although programs have increased in scope and responsibility, the internal operations costs have been held virtually flat for seven years. Increases reflect the IT, Supply Chain, Legal, Financial and other activities necessary to achieve the programs described above.
Changes in this area are strictly shifts from other areas. Increases of $3.9 million in FY 2010 and $4.0 million in FY 2011 are a result of costs related to Office of Workers’ Compensation being moved from Transmission Agency Services to Transmission Operations. This increase is somewhat offset as a result of reorganizations that were not reflected in the initial IPR and are reflected in the final IPR. These reorganizations result in a slight shift in allocated costs of $1 million from Transmission internal costs to Power internal costs.
B. TRANSMISSION MAINTENANCE: SYSTEM MAINTENANCE AND ENVIRONMENTAL OPERATIONS
$ millions
Expense FY 2010
Initial IPR Final IPR Change 125.7 125.8 0.1
FY 2011 Initial IPR Final IPR Change
130.7 130.8 0.1
39 Appendix A
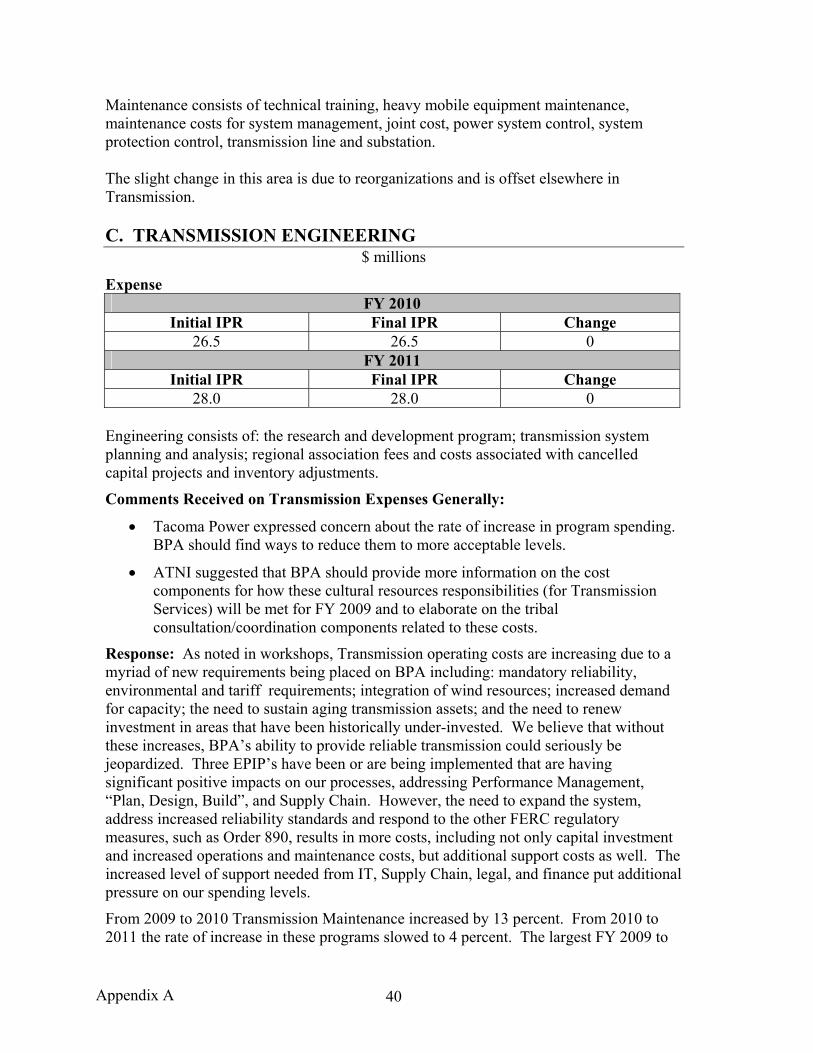
Maintenance consists of technical training, heavy mobile equipment maintenance, maintenance costs for system management, joint cost, power system control, system protection control, transmission line and substation. The slight change in this area is due to reorganizations and is offset elsewhere in Transmission. C. TRANSMISSION ENGINEERING
$ millions
Expense FY 2010
Initial IPR Final IPR Change 26.5 26.5 0
FY 2011 Initial IPR Final IPR Change
28.0 28.0 0 Engineering consists of: the research and development program; transmission system planning and analysis; regional association fees and costs associated with cancelled capital projects and inventory adjustments.
Comments Received on Transmission Expenses Generally:
• Tacoma Power expressed concern about the rate of increase in program spending. BPA should find ways to reduce them to more acceptable levels.
• ATNI suggested that BPA should provide more information on the cost components for how these cultural resources responsibilities (for Transmission Services) will be met for FY 2009 and to elaborate on the tribal consultation/coordination components related to these costs.
Response: As noted in workshops, Transmission operating costs are increasing due to a myriad of new requirements being placed on BPA including: mandatory reliability, environmental and tariff requirements; integration of wind resources; increased demand for capacity; the need to sustain aging transmission assets; and the need to renew investment in areas that have been historically under-invested. We believe that without these increases, BPA’s ability to provide reliable transmission could seriously be jeopardized. Three EPIP’s have been or are being implemented that are having significant positive impacts on our processes, addressing Performance Management, “Plan, Design, Build”, and Supply Chain. However, the need to expand the system, address increased reliability standards and respond to the other FERC regulatory measures, such as Order 890, results in more costs, including not only capital investment and increased operations and maintenance costs, but additional support costs as well. The increased level of support needed from IT, Supply Chain, legal, and finance put additional pressure on our spending levels.
From 2009 to 2010 Transmission Maintenance increased by 13 percent. From 2010 to 2011 the rate of increase in these programs slowed to 4 percent. The largest FY 2009 to
40Appendix A

FY 2010 increases in Transmission Maintenance are in the areas of Non-Electric Maintenance and Right-Of-Way (ROW) Maintenance.
Non-Electric Maintenance is increasing due to the implementation of the Facilities Asset Management Plan. The Facilities Asset Management Plan specifies a program of addressing the deferred maintenance on BPA's non-electric facilities identified during recent condition assessments. This has been an area that BPA has historically cut back spending but this work can no longer be deferred. The Facilities Asset Management Plan will bring BPA’s facilities up to acceptable maintenance levels over the next 6 to 7 years with a focus in FY 2010 and 2011 on addressing critical deficiencies impacting personnel safety and transmission operations. Examples of critical life safety projects include the installation of lighted exit signs, emergency egress lighting, and panic hardware on doors. The program also places priority on addressing reliability issues on facility systems and equipment that are inadequate or have exhibited failures such as failing HVACs and roofs vital to the protection of the transmission equipment.
With the ROW Maintenance program, the primary driver for this sub-program is WECC/NERC compliance. The newly developed standards went into place in June 2007, making compliance with NERC’s regulations for controlling vegetation along transmission line rights-of-way mandatory. BPA experienced a tree contact in 2007 and another in June of 2008. We provided our mitigation plans to WECC, noting that we were confident we could maintain compliance with the standards. As the largest transmission owner in the Pacific Northwest and a critical partner in the Western Interconnection, BPA understands the serious consequences vegetation threats pose. We take full responsibility for ensuring the reliability of our transmission grid, and we are taking unprecedented measures to identify and remove vegetation threats along our transmission lines to ensure we are in strict compliance with the vegetation standards systemwide. As a result, our expenses for right-of-way maintenance need to increase.
For Transmission Operations, the overall increase from FY 2009 to FY 2010 was 5 percent. From FY 2010 to FY 2011 the increase was less than inflation.
The drivers for the increases in Transmission Operations are:
• Mandatory reliability compliance; documentation and reporting have increased substantially.
• Increased workload to support wind integration.
• Increased demand for transmission capacity.
• Increased training needs due to constant influx of new equipment types, models, and technologies.
The increased funding will be used to:
• Provide tools to manage the system, e.g., automate remedial action scheme (RAS) arming, voltage control, and short-term wind forecasting.
• Increase management of conditional firm initiatives.
• Increase dynamic scheduling capability.
41 Appendix A
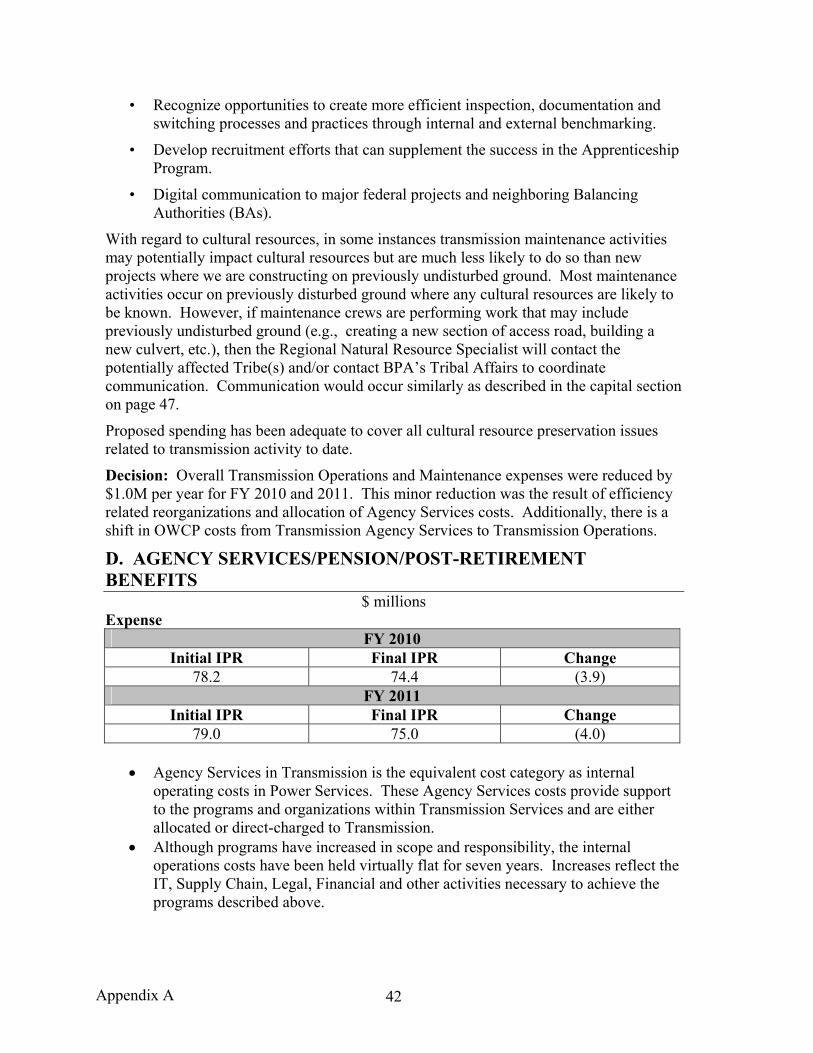
• Recognize opportunities to create more efficient inspection, documentation and switching processes and practices through internal and external benchmarking.
• Develop recruitment efforts that can supplement the success in the Apprenticeship Program.
• Digital communication to major federal projects and neighboring Balancing Authorities (BAs).
With regard to cultural resources, in some instances transmission maintenance activities may potentially impact cultural resources but are much less likely to do so than new projects where we are constructing on previously undisturbed ground. Most maintenance activities occur on previously disturbed ground where any cultural resources are likely to be known. However, if maintenance crews are performing work that may include previously undisturbed ground (e.g., creating a new section of access road, building a new culvert, etc.), then the Regional Natural Resource Specialist will contact the potentially affected Tribe(s) and/or contact BPA’s Tribal Affairs to coordinate communication. Communication would occur similarly as described in the capital section on page 47.
Proposed spending has been adequate to cover all cultural resource preservation issues related to transmission activity to date.
Decision: Overall Transmission Operations and Maintenance expenses were reduced by $1.0M per year for FY 2010 and 2011. This minor reduction was the result of efficiency related reorganizations and allocation of Agency Services costs. Additionally, there is a shift in OWCP costs from Transmission Agency Services to Transmission Operations.
D. AGENCY SERVICES/PENSION/POST-RETIREMENT BENEFITS
$ millions Expense
FY 2010 Initial IPR Final IPR Change
78.2 74.4 (3.9) FY 2011
Initial IPR Final IPR Change 79.0 75.0 (4.0)
• Agency Services in Transmission is the equivalent cost category as internal
operating costs in Power Services. These Agency Services costs provide support to the programs and organizations within Transmission Services and are either allocated or direct-charged to Transmission.
• Although programs have increased in scope and responsibility, the internal operations costs have been held virtually flat for seven years. Increases reflect the IT, Supply Chain, Legal, Financial and other activities necessary to achieve the programs described above.
42Appendix A

• Decreases of $3.9 million in FY 2010 and $4.0 million in FY 2011 are as a result of costs related to Office of Workers’ Compensation being moved from Transmission Agency Services to Transmission Operations.
Decision: No change to Agency Services Costs other than to reflect moving the OWCP costs from Transmission Agency Services to Transmission Operations. E. TRANSMISSION CAPITAL
$ millions
FY 2010 Initial IPR Final IPR Change
505.5 495.4 (10.1) FY 2011
Initial IPR Final IPR Change 568.9 567.1 (1.8)
Transmission capital is made up of four categories: Main Grid, Area and Customer Service, Upgrades and Additions, and Environment. Main Grid consists of major network reinforcements including McNary-John Day, Big Eddy and I-5 corridor. Area and Customer Service projects, and Upgrades and Additions assure that BPA meet’s reliability standards and contractual obligations to its customers for serving load. The Capital Environment program addresses regulatory and liability issues at facilities likely to be adversely affected by water and environmental resources.
Comments Received:
• The Joint Public Power group appreciated the development of an asset management program to set priorities based on condition and risk.
• Tacoma Power commented that too much is planned in the early years of the construction program. Cost levelizing should be performed over the next few years. Given the shortage of line construction personnel, we question if the work can actually be accomplished or that BPA will pay premium prices for labor.
• The Joint Public Power group supports BPA’s efforts to make investments needed for reliability. Investments should not be made unnecessarily. Given the large increases in the capital program, BPA should delay projects in future periods if it can be done without significant risk to reliability or load service.
• CRITFC does not support any reductions that reduce system reliability.
• PPC renews its request to meet with Transmission Services regarding its capital budget prior to that budget’s inclusion in the OMB budget.
Response: As noted in IPR workshops, the transmission capital forecast represents increases that are necessary to meet several important pressures. The forecast is based on in-depth evaluation, assessment and prioritization as part of asset management planning.
43 Appendix A

Several comments indicate concerns that the capital program is front-loaded. The primary concern is the rate impact in FY 2010-2011; some utility customers would like it levelized to defer some costs out to FY 2012-2013. A secondary issue is Transmission’s ability to staff the significant increase in work and the accompanying costs associated with contracting work out. There were concerns that the present labor shortage for line construction personnel will not only make it difficult to complete the capital program, but also the market premium for contract labor will push the capital program up.
Given the significant increase in the forecasted capital program and the labor shortage concerns raised in comment, it may be that more of a ramp-up period will be required. A larger lapse factor than proposed in the initial IPR forecast would recognize that possibility. The application of a 17-percent lapse factor, increased from the 15-percent lapse factor in the initial IPR, to the FY 2010-2011 period and reshaping the timing of the I-5 corridor project to reflect a more likely and achievable schedule has the affect of levelizing the program to some extent. It is expected that in 2012 and beyond there would be no lapse factor applied. In addition, the revenue requirement impacts of the capital program (depreciation, non-federal debt service, and net interest expense) in 2010 and 2011 are primarily from the 2008-2009 rate period. Likewise, the 2010 and 2011 capital program impacts the 2012 and 2013 capital program. Transmission is currently looking at a number of ways to supplement and outsource needed human and construction resources. Major supply contracts for material and labor are being implemented. Coordination of projects with neighboring utilities will be required to maintain overall competitive pricing for the region.
Line construction personnel continue to be in high demand throughout the western U.S. BPA has joined a consortium of utilities in the West to examine best practices for construction employees, engineers, and materials. All three are in high demand and given our multi-year work plans we anticipate working through many resources to ramp-up accordingly. In addition, since we are planning our asset management programs for 3-5 years, we will be able to give contractors ample time to spread their workload to achieve the necessary upgrades.
Contract labor prices remain competitive in the Northwest. Since we currently have four major contract suppliers, we hope to maintain competitive pricing. Currently much of our work is done with in-house labor supplemented with crew members from contractors. Engineering, Procurement and Construction (EPC) or turnkey contracts will also be used to meet the high demand of construction labor. As we monitor all bid awards against in-house labor costs we will strive to contain our overall costs.
As mentioned in the June 30th technical workshop on Transmission’s Asset Plan, Transmission is in catch-up mode, due to aging infrastructure and the capital program is filled with time critical investments, e.g. wood pole, spacers and breaker replacement programs, which make it very difficult to levelize the capital program.
Based on an assessment of FY 2009 new projects, one half of new starts are replacement projects needed to support the aging infrastructure. The other half of our new starts are nondiscretionary; nondiscretionary projects which include emergency replacements, mandatory replacements/upgrades/additions, and tariff generated projects.
44Appendix A
These time critical projects are defined for FY 2009 capital as follows:
• Replace critical failed equipment or operational function. Funding needed to replace failed equipment and for operational functions that is critical to the reliable operation of the BPA transmission system. Examples include: failure of a power transformer; failure of a line protective relay; failure of station or communication batteries; major component failure of a Remedial Action Scheme; failure of a transmission line circuit; failure of a control system like SCADA.
• Mandatory replacements /upgrades/additions. Funding for projects to mitigate violations or resolve non-compliance or prevent non-compliance of federal law, including regulatory requirements or standards, such as FERC, NERC, environmental, and OSHA. The project submittal identifies the statute, requirement, or standard, including the specific section or clause,that applies and states why the project must start in the fiscal year in which it is reviewed.
• Tariff Generated Projects. Funding for projects in response to a Transmission Service Request, Generation Interconnection Request or Line/Load Interconnection Request made pursuant to BPA’s OATT (Tariff).
1) 100% Customer Financed/BPA owned Projects: Funding for all customer-financed projects with executed agreement. The project submittal identifies the specific customer agreement that applies and states why the project must start in the fiscal year in which it is reviewed.
2) Network Open Season Projects: Funding for projects developed in response to the Network Open Season. The project submittal identifies the specific customer agreements that apply, the PTSA (contract) conditions have been satisfied and states why the project must start in the fiscal year in which it is reviewed.
3) NT Projects: Projects required to accommodate current NT load and forecasted NT load growth. The project submittal identifies the specific customer agreement that applies and states why the project must start in the fiscal year in which it is reviewed.
In response to earlier customer requests to meet with Transmission Services regarding its proposed capital spending prior to the development of the Federal budget, the Agency held the Capital Planning Review as an interim step aimed at giving the stakeholders a consolidated view of and input into BPA’s capital investments. To accomplish this, BPA combined the capital review processes for the Power Services and Transmission Services. Through the Capital Planning Review, BPA involved stakeholders in capital management decisions, giving stakeholders the opportunity to influence how the agency makes capital investments that affect future power and transmission rates. Proposed spending estimates were presented for a five-year period (in response to customer comments that a longer horizon is necessary for capital). All capital projects were addressed including projects that have not yet been approved (new starts) and capital investments that are expected to be placed into service during the upcoming rate period.
As previously noted, BPA held extensive discussions with customers and other stakeholders to develop approaches to provide regional transparency and accountability
45 Appendix A
for BPA cost management efforts. As a result, BPA initiated a new process this year for regional stakeholders to engage BPA on planned program spending levels that will form the basis for input to both Power Services and Transmission Services rate setting. The overall process is the Integrated Business Review (IBR) which consists of two major sub-processes: 1) the IPR and 2) the Quarterly Business Review (QBR).
For Cultural Resources, once a transmission project is in the final planning stages and we are ready to begin the environmental work, BPA sends written notification to each of the potentially affected tribes. We typically follow up with phone calls to the Cultural Resources Manager, Natural Resources Manager, and THPO. In the notification we offer formal consultation and by phone call, offer to meet at the staff level to discuss the proposed project and any issues they might have. If more than one tribe may be impacted, we typically request that one tribe represent the affected tribes as the lead tribe. Ongoing discussions are conducted with the lead Tribe which has the responsibility to inform the other tribes of any issues. The Project Manager, Environmental Lead, Tribal Account Executive (and others as appropriate) will meet periodically at the staff level to keep tribal staff informed (we send them letters as well, to keep them informed) and offer to meet with any tribal council members, as tribal staff deem appropriate.
During the estimating phase, BPA’s Tribal Affairs provides an estimate of costs, typically for tribal monitoring during construction, which is included in the approved capital project proposal. The lead Tribe may share with us any cultural resource issues around the proposed project route and we try to make adjustments to avoid cultural resource sites. At times, we may uncover cultural resources that neither BPA nor a tribe was aware of (e.g., Decatur Island burial site), at which point work is stopped. BPA must then assess what is appropriate and required to preserve the resource. Any needed funding amounts goes back through the capital budget group, but in every case money is added to mitigate for cultural resource preservation (e.g., in the case of Decatur Island, over $1.5 million was added to the capital project proposal). BPA’s relationship with tribes in the Pacific Northwest is important and is conducted on a government-to-government level, which ensures that matters such as cultural resource preservation is respected. Project Managers, Environmental Leads and Tribal Affairs work proactively with all potentially affected tribes on any proposed Transmission project.
Decision: BPA believes that the forecasts for capital investment do not include any “unnecessary” work, and that the schedule is based on sound assessment and prioritization of the work that is necessary. However, as suggested in comments, BPA has reviewed the timelines for its capital Transmission programs. BPA has determined that the timing of the I-5 Corridor project as proposed in the initial IPR is likely too optimistic and that an adjustment to the schedule is appropriate. For that reason, the large investment planned for FY 2011 will be moved to FY 2012. Additionally, in recognition of the difficulty in implementing such a large increase in the capital program, as pointed out in comments, the 15-percent lapse factor applied to all Transmission capital in the initial IPR forecasts has been increased to 17 percent for all Transmission capital.
46Appendix A

COST DECISIONS TO BE MADE AS PART OF THE RATE CASE The following section provides information on areas for which the costs will be determined in the FY 2010-2011 rate proposal. They have been included in the IPR to provide an opportunity for participants to understand the basis for these costs. F. TRANSMISSION ACQUISITION AND ANCILLARY SERVICES
$ millions
FY 2010 Initial IPR Final IPR Change
18.4 18.4* 0
FY 2011 Initial IPR Final IPR Change
18.4 18.4* 0 Includes 3rd party only * The actual amount will be determined in the Final Rate Proposal.
G. TOTAL NET INTEREST, AMORTIZATION/DEPRECIATION AND NON-FEDERAL DEBT SERVICE
$ millions
Net Interest FY 2010
Initial IPR Final IPR Change Transmission 150.6 151.1*
FY 2011 Initial IPR Final IPR Change
Transmission 168.7 168.6* Amortization/Depreciation
FY 2010 Initial IPR Final IPR Change
Transmission 200.8 200.8* 0 FY 2011
Initial IPR Final IPR Change Transmission 211.5 211.5* 0
47 Appendix A
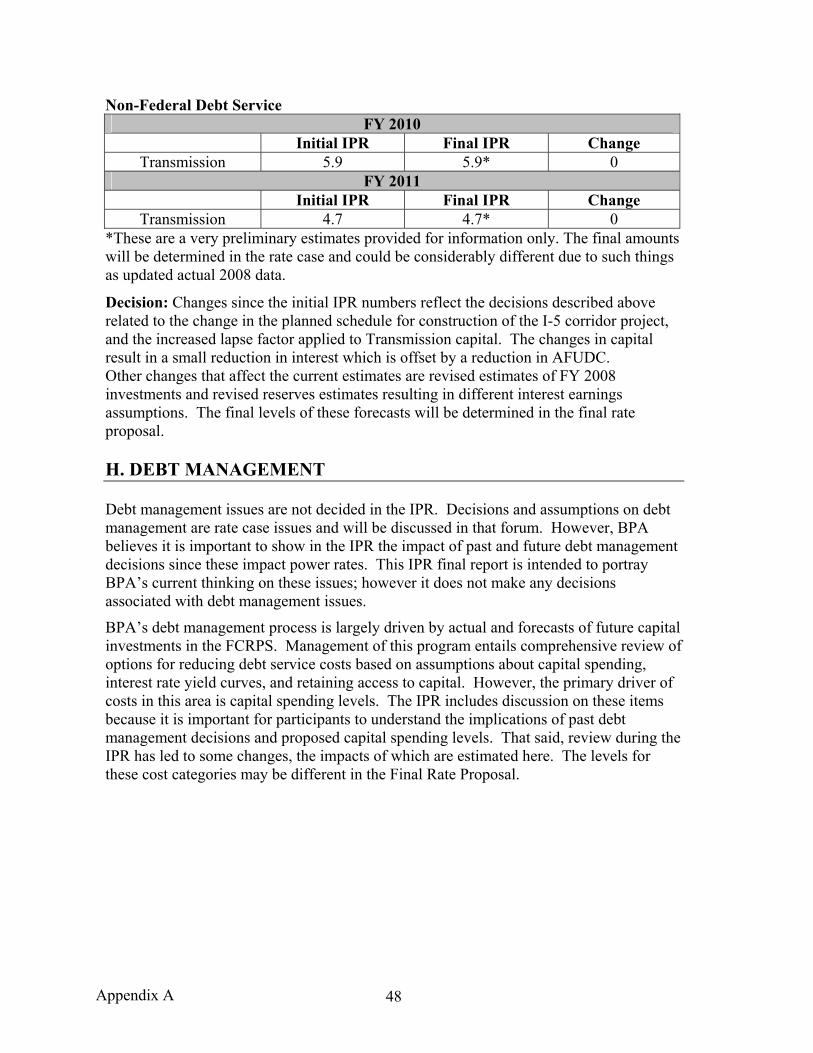
Non-Federal Debt Service FY 2010
Initial IPR Final IPR Change Transmission 5.9 5.9* 0
FY 2011 Initial IPR Final IPR Change
Transmission 4.7 4.7* 0 *These are a very preliminary estimates provided for information only. The final amounts will be determined in the rate case and could be considerably different due to such things as updated actual 2008 data.
Decision: Changes since the initial IPR numbers reflect the decisions described above related to the change in the planned schedule for construction of the I-5 corridor project, and the increased lapse factor applied to Transmission capital. The changes in capital result in a small reduction in interest which is offset by a reduction in AFUDC. Other changes that affect the current estimates are revised estimates of FY 2008 investments and revised reserves estimates resulting in different interest earnings assumptions. The final levels of these forecasts will be determined in the final rate proposal. H. DEBT MANAGEMENT Debt management issues are not decided in the IPR. Decisions and assumptions on debt management are rate case issues and will be discussed in that forum. However, BPA believes it is important to show in the IPR the impact of past and future debt management decisions since these impact power rates. This IPR final report is intended to portray BPA’s current thinking on these issues; however it does not make any decisions associated with debt management issues.
BPA’s debt management process is largely driven by actual and forecasts of future capital investments in the FCRPS. Management of this program entails comprehensive review of options for reducing debt service costs based on assumptions about capital spending, interest rate yield curves, and retaining access to capital. However, the primary driver of costs in this area is capital spending levels. The IPR includes discussion on these items because it is important for participants to understand the implications of past debt management decisions and proposed capital spending levels. That said, review during the IPR has led to some changes, the impacts of which are estimated here. The levels for these cost categories may be different in the Final Rate Proposal.
48Appendix A

Section 4 AGENCY SERVICES
49 Appendix A

AGENCY SERVICES Agency Services include direct program support costs as well as general and administrative costs. These activities are integral to and in support of the work described in the Power and Transmission sections. The costs are distributed to and embedded in the Power and Transmission costs.
Some of the larger programs and their drivers are:
• Supply Chain’s spending is driven by the programmatic levels of Transmission O&M and construction, Fish and Wildlife, Energy Efficiency, Technology Innovation, and Workplace Services (non-electric facilities build, repair and maintenance), and the agency’s supplemental labor force and contract services requirements.
• General Counsel supports BPA programs through legal advice and representation.
• Internal Audit supports governance and serves BPA managers through audits, reviews, analyses, and other services.
• ColumbiaGrid was created to promote regional transmission planning in response to Federal Energy Regulatory Commission (FERC) Order 890.
• Finance provides general accounting and financial reporting, cash management, Treasury and third- party financing, accounts payable and receivable services, rate case revenue requirement development and support, financial planning, Agency budget development and support and Agency cost management support.
• Information Technology proposed spending reflects implementation of system enhancements to meet emerging business requirements and to support efficiencies in organizations across the Agency; implementing changes due to mandatory regulation such as Federal Information Security Management Act and OMB Circular A123; and maintaining the reliability of hardware through maintenance and refresh.
• The Security and Emergency Response program is designed to ensure the protection of BPA’s workforce, physical and electronic assets and support the reliability of BPA’s operations and services to the Pacific Northwest.
• HCM’s proposed spending reflects both the significant EPIP savings and the resources to deliver the full range of HCM activities including labor relations, employee relations, hiring and recruiting, training, benefits, personnel policy development and management, etc.
• Workplace Services consists of facilities (HQ and Ross O&M and non-electric facilities including field office facilities), leases, space management, office services, printing and mail services.
Comments Received:
• Tacoma Power commented that BPA should not initiate any R&D before customers can review the projects. Customers should be involved in the Technology Confirmation/Innovation Council and have access to reports.
50Appendix A

• Tacoma Power also noted that total internal agency costs are increasing by 39.3%. BPA should review these costs and find ways to reduce them to more acceptable levels (inflation or less).
• The Joint Public Power group commented that [Agency Services] spending increases should be held to the rate of inflation.
Response: Regarding Agency Services costs in general: Many of the Efficiency Project Improvement Program (EPIP) savings have been achieved in Agency Services, including Human Capital Management, Information Technology, and Public Affairs. Several of the EPIPs also recommended process improvements that resulted in the consolidation of many functions (from the Business Units to Agency Services), including Supply Chain, Metering and Billing, Load Forecasting, and Contract Administration. Finance also experienced a consolidation of business and management support from Power and Transmission to a central group. These consolidations have lead to a change to Agency Services costs, making them appear higher than if consolidation had not occurred.
Power and Transmission programs and projects are significant drivers of Agency Services costs. Growth in existing programs and/or new initiatives has resulted in increased demand for Agency Services supporting activities. Some of the most significant power and transmission program changes and their impacts on Agency Services are:
• Supply Chain’s spending is driven by the programmatic levels of Transmission O&M and construction, Fish and Wildlife, Energy Efficiency, Technology Innovation, Workplace Services (non-electric facilities build, repair and maintenance), and the agency’s supplemental labor force and contract services requirements. The FY 2010 and FY 2011 proposed spending estimates have fully incorporated the efficiency savings from the Supply Chain and Plan-Design-Build EPIPs resulting from the Work Planning and Scheduling System and the “80 percent stable work plan” for transmission. Other pressures are the redesign of inventory and purchasing processes, internal controls, and performance to ensure compliance with Agency Master Lease initiative.
• Workplace Services consists of facilities (HQ and Ross O&M and asset management), leases, space management, office services, printing, and mail services. The overall trend for Workplace Services’ base program is to stay level with the exception of the new facilities asset management program. Condition assessments conducted as part of Facilities Asset Management (FAM) plan determine current risk exposure. Increased proposed funding is included to address backlog of facilities-related deferred maintenance.
• Information Technology spending was reduced before all of the efficiencies needed to support the reductions were completed; realization of the efficiencies requires expenditure of expense dollars. Pressures include:
– Capital projects implement business units Enterprise Process Improvement Program initiatives which provide business units with savings while IT funds ongoing expense support tail. Expense support tails need to be funded as capital projects are approved. Provide automated solutions to support wind integration
51 Appendix A

– Providing automated solutions to support Regional Dialogue.
– Responding to emerging cyber threats (e.g. spam filters, whole disk encryption to protect Personal Identifying Information)
– Introducing and leveraging emerging technologies (e.g. hierarchical storage, virtualization/multi-cores, IPv6)
• General Counsel’s forecast is driven by increased need for legal services in transmission due to increased investments and Transmission Service Agreements, resumptions of the Residential Exchange Program (REP) with attendant legal review, increases in Fish and Wildlife programs, new reliability standards, and compliance requirements.
• Customer Support Services program levels reflect new workload associated with implementation of increasingly complex Regional Dialogue contracts, the necessity of administering existing power subscription agreements in parallel with preparing for implementing Regional Dialogue contracts, and increased BPA data and forecasting requirements for loads, resources and REP, all requiring enhancements to billing, contracts and load forecasting systems. The impacts of specific initiatives such as WREGIS, FERC Order 890 implementation, Resource Program, etc., are not specifically known, but are expected to be addressed within the forecasted levels of FTE and budgets.
• Finance’s expense level as increased primarily due to the consolidation of staff from Power and Transmission. FY 2010-2011 cost increases are slightly higher than inflation to allow for increased financing and accounting support of growing Power and Transmission activities. Finance provides general accounting and financial reporting, cash management, Treasury and third- party financing, accounts payable and receivable services, rate case revenue requirement development and support, financial planning, Agency budget development and support and Agency cost management support.
• Growth in the Security and Emergency Response program is limited to capital spending as security has increased at Headquarters and field sites. This program is designed to ensure the protection of BPA’s workforce, physical and electronic assets and support the reliability of BPA’s operations and services to the Pacific Northwest.
No comments were received in the IPR process concerning the Northwest Power and Conservation Council proposed spending agreement. The Council’s proposal for FY 2010 is the same, $9.683 million, as presented in the IPR workshop. The Council’s proposal for FY2011 is $9.934 million, which is $73 thousand higher than the IPR workshop. The Council received no comment on the proposed spending agreement during the Council’s public process.
The proposed Agency Services program levels are essential to the accomplishment of business unit and agency initiatives.
Regarding BPA's Technology Innovation program, the Research and Development (R&D) program is driven by a strategic need to focus on solutions to technology related
52Appendix A

53
business challenges. Our research agenda is described in a set of publicly available technology roadmaps easily accessed from this link on BPA's home page (http://www.bpa.gov/corporate/business/innovation/). As they become available, research results are also posted to that web page.
Customer review of our research agenda, as expressed in our technology roadmaps, is welcome at any time. Roadmaps are updated periodically to address changes in the current state of technology and changes in BPA's business challenges. Comments on our roadmaps should be addressed to BPA Technology Innovation Office - DE-3, PO Box 3621, Portland Oregon 97208-3621.
We are considering a means for customer involvement in our Technology Confirmation / Innovation Council. To that end we have met with the executive leadership of several utilities including Tacoma Power. To date, no utility has expressed an interest in helping guide BPA's R&D agenda. We will continue to explore means of more fully engaging customers. Terry Oliver, BPA's Chief Technology Innovation Officer, is available to brief any party on our R&D effort. Please contact your BPA Account Executive. Decision: No change to Agency Services total program levels as presented in the IPR workshops and as reflected in the Council’s proposed spending agreement.
Appendix A

This page intentionally left blank.

APPENDIX B
REPAYMENT PROGRAM TABLES
Appendix BPage B-1

This page intentionally left blank.
Appendix BPage B-2
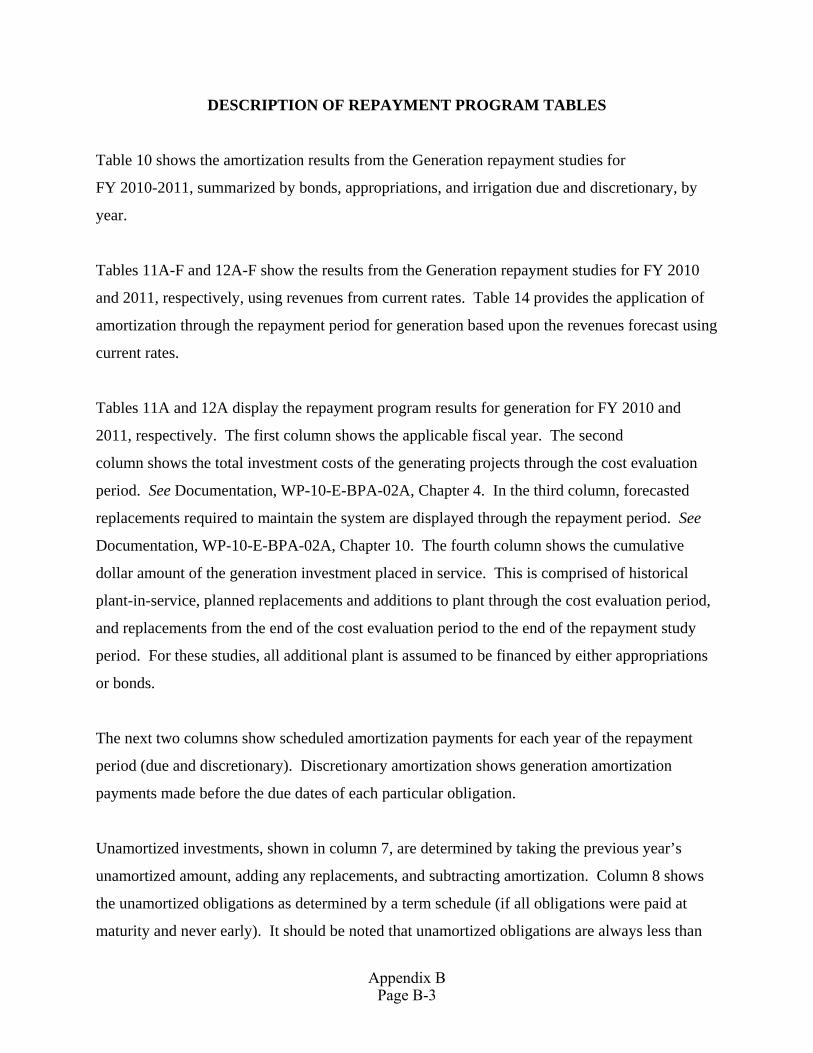
DESCRIPTION OF REPAYMENT PROGRAM TABLES
Table 10 shows the amortization results from the Generation repayment studies for
FY 2010-2011, summarized by bonds, appropriations, and irrigation due and discretionary, by
year.
Tables 11A-F and 12A-F show the results from the Generation repayment studies for FY 2010
and 2011, respectively, using revenues from current rates. Table 14 provides the application of
amortization through the repayment period for generation based upon the revenues forecast using
current rates.
Tables 11A and 12A display the repayment program results for generation for FY 2010 and
2011, respectively. The first column shows the applicable fiscal year. The second
column shows the total investment costs of the generating projects through the cost evaluation
period. See Documentation, WP-10-E-BPA-02A, Chapter 4. In the third column, forecasted
replacements required to maintain the system are displayed through the repayment period. See
Documentation, WP-10-E-BPA-02A, Chapter 10. The fourth column shows the cumulative
dollar amount of the generation investment placed in service. This is comprised of historical
plant-in-service, planned replacements and additions to plant through the cost evaluation period,
and replacements from the end of the cost evaluation period to the end of the repayment study
period. For these studies, all additional plant is assumed to be financed by either appropriations
or bonds.
The next two columns show scheduled amortization payments for each year of the repayment
period (due and discretionary). Discretionary amortization shows generation amortization
payments made before the due dates of each particular obligation.
Unamortized investments, shown in column 7, are determined by taking the previous year’s
unamortized amount, adding any replacements, and subtracting amortization. Column 8 shows
the unamortized obligations as determined by a term schedule (if all obligations were paid at
maturity and never early). It should be noted that unamortized obligations are always less than
Appendix BPage B-3
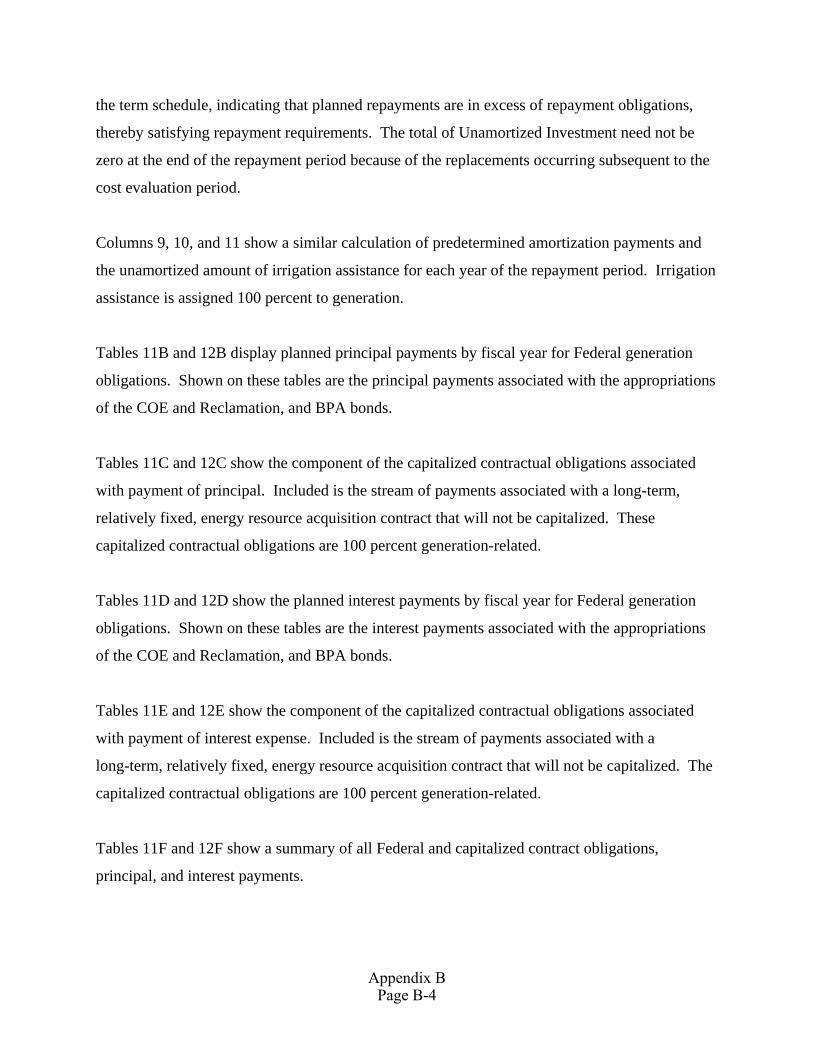
the term schedule, indicating that planned repayments are in excess of repayment obligations,
thereby satisfying repayment requirements. The total of Unamortized Investment need not be
zero at the end of the repayment period because of the replacements occurring subsequent to the
cost evaluation period.
Columns 9, 10, and 11 show a similar calculation of predetermined amortization payments and
the unamortized amount of irrigation assistance for each year of the repayment period. Irrigation
assistance is assigned 100 percent to generation.
Tables 11B and 12B display planned principal payments by fiscal year for Federal generation
obligations. Shown on these tables are the principal payments associated with the appropriations
of the COE and Reclamation, and BPA bonds.
Tables 11C and 12C show the component of the capitalized contractual obligations associated
with payment of principal. Included is the stream of payments associated with a long-term,
relatively fixed, energy resource acquisition contract that will not be capitalized. These
capitalized contractual obligations are 100 percent generation-related.
Tables 11D and 12D show the planned interest payments by fiscal year for Federal generation
obligations. Shown on these tables are the interest payments associated with the appropriations
of the COE and Reclamation, and BPA bonds.
Tables 11E and 12E show the component of the capitalized contractual obligations associated
with payment of interest expense. Included is the stream of payments associated with a
long-term, relatively fixed, energy resource acquisition contract that will not be capitalized. The
capitalized contractual obligations are 100 percent generation-related.
Tables 11F and 12F show a summary of all Federal and capitalized contract obligations,
principal, and interest payments.
Appendix BPage B-4

Table 13 lists by year through the 50-year repayment period the application of the generation
amortization payments, consistent with the revised repayment studies, by project. The projected
annual amortization payments on the generation obligations are identified by the project name,
in-service date, due date, and interest rate. The amount of the obligation is shown as both the
original gross amount due and the net amount after all prior amortization payments.
Appendix BPage B-5
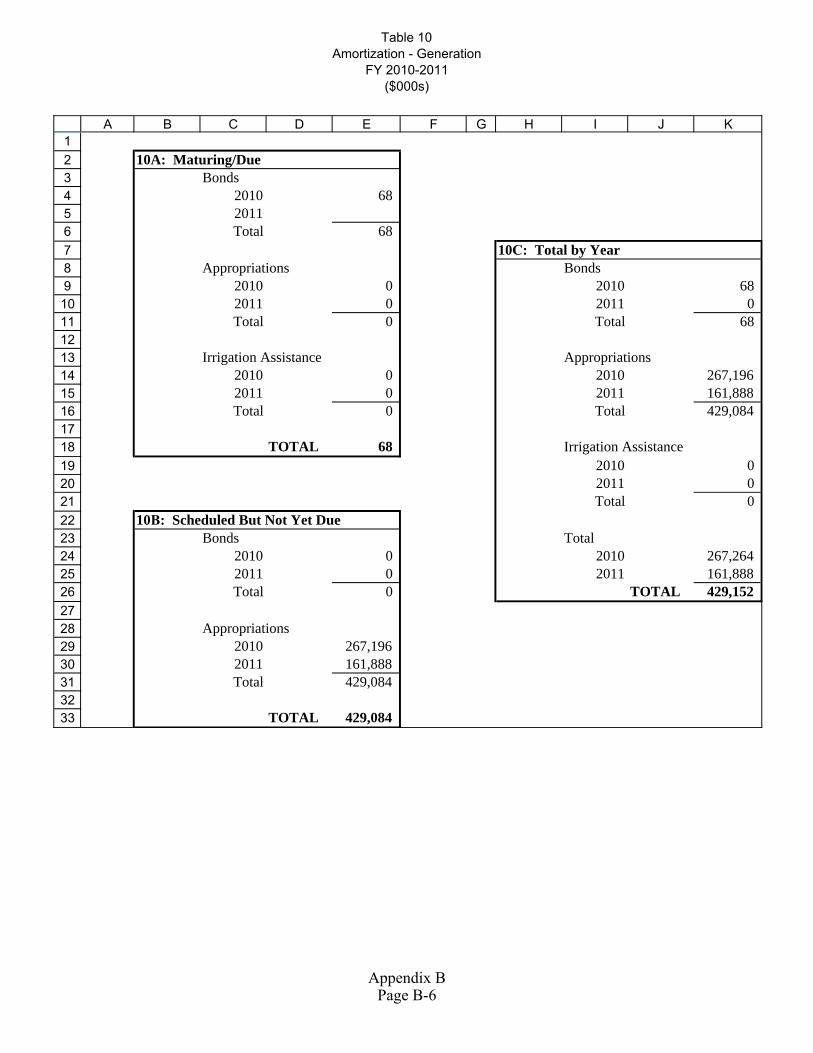
Table 10Amortization - Generation
FY 2010-2011($000s)
123456789101112131415161718192021222324252627282930313233
A B C D E F G H I J K
10A: Maturing/DueBonds
2010 682011Total 68
10C: Total by YearAppropriations Bonds
2010 0 2010 682011 0 2011 0Total 0 Total 68
Irrigation Assistance Appropriations2010 0 2010 267,1962011 0 2011 161,888Total 0 Total 429,084
TOTAL 68 Irrigation Assistance2010 02011 0Total 0
10B: Scheduled But Not Yet DueBonds Total
2010 0 2010 267,2642011 0 2011 161,888Total 0 TOTAL 429,152
Appropriations2010 267,1962011 161,888Total 429,084
TOTAL 429,084
Appendix BPage B-6

Tabl
e 11
A:
Gen
erat
ion
Inve
stm
ents
Pla
ced
in S
ervi
ce F
Y 2
010
($00
0s)
1 2 3 4 5 6 7 8 9 10 11 12 13 14 15 16 17 18 19 20 21 22 23 24 25 26 27 28 29 30 31 32 33 34 35 36 37 38 39 40 41 42 43 44 45 46 47
AB
CD
EF
GH
IJ
K
Fisc
al Y
ear
Initi
al P
roje
ctR
epla
cem
ents
Cum
ulat
ive
Am
ount
in
Serv
ice
Due
A
mor
tizat
ion
Dis
cret
iona
ry
Am
ortiz
atio
nU
nAm
ortiz
ed
Inve
stm
ent
Term
Inve
stm
ent
Sche
dule
Cum
ulat
ive
Am
ount
in
Seriv
ceA
mor
tizat
ion
Una
mor
tized
A
mou
nt20
0933
3,15
2-
4,47
0,37
692
,990
10,0
754,
367,
311
5,41
7,60
368
3,69
07,
274
676,
416
2010
362,
021
126,
180
4,95
8,57
768
267,
196
4,58
8,24
85,
656,
219
690,
632
-68
3,35
820
11-
117,
932
5,07
6,50
9-
161,
888
4,54
4,29
25,
584,
034
697,
198
-68
9,92
420
12-
110,
125
5,18
6,63
492
,800
2,44
44,
559,
174
5,42
3,12
870
0,67
41,
206
692,
194
2013
-10
2,83
25,
289,
466
70,0
0018
,067
4,57
3,93
95,
315,
960
720,
467
60,0
2765
1,96
020
14-
103,
207
5,39
2,67
365
,850
34,0
254,
577,
271
5,32
8,44
375
7,99
753
,500
635,
990
2015
-10
3,60
15,
496,
274
32,3
0024
,991
4,62
3,58
15,
279,
744
763,
104
125,
899
515,
198
2016
-10
3,99
35,
600,
267
--
4,72
7,57
45,
381,
033
768,
498
41,4
5247
9,14
020
17-
104,
447
5,70
4,71
4-
-4,
832,
021
5,41
9,35
480
3,75
11
514,
392
2018
-10
4,96
15,
809,
675
-13
7,30
04,
799,
683
5,47
9,11
085
4,93
827
,989
537,
590
2019
-10
5,53
25,
915,
207
40,0
0057
2,21
64,
292,
998
5,45
9,87
086
5,84
058
,168
490,
324
2020
-10
6,15
46,
021,
361
30,0
0055
6,36
93,
812,
783
5,45
7,19
588
7,09
824
,943
486,
639
2021
-10
6,82
76,
128,
188
-62
5,52
43,
294,
087
5,48
0,17
492
6,30
512
,354
513,
492
2022
-10
7,54
56,
235,
733
-66
7,59
32,
734,
039
5,51
9,99
096
5,35
414
,585
537,
956
2023
-95
,731
6,33
1,46
4-
706,
061
2,12
3,70
95,
442,
708
994,
434
13,2
5255
3,78
420
24-
85,3
586,
416,
822
50,0
0064
8,43
61,
510,
630
5,47
0,79
81,
036,
240
15,4
1458
0,17
620
25-
76,2
076,
493,
029
70,0
0053
8,60
697
8,23
25,
237,
515
1,05
6,27
713
,900
586,
313
2026
-68
,142
6,56
1,17
10
634,
190
412,
184
5,06
9,47
01,
089,
505
21,1
5459
8,38
720
27-
61,0
376,
622,
208
-73
,540
399,
681
5,01
9,39
61,
121,
733
192,
572
438,
043
2028
-54
,710
6,67
6,91
8-
54,7
1039
9,68
14,
857,
906
1,15
5,11
9-
471,
429
2029
-49
,119
6,72
6,03
7-
49,1
1939
9,68
14,
649,
604
1,19
9,91
6-
516,
226
2030
-44
,228
6,77
0,26
5-
44,2
2839
9,68
14,
690,
718
1,22
9,87
9-
546,
189
2031
-39
,875
6,81
0,14
030
,000
39,8
7536
9,68
14,
688,
241
1,25
9,84
2-
576,
152
2032
-36
,033
6,84
6,17
3-
36,0
3336
9,68
14,
517,
761
1,30
4,63
9-
620,
949
2033
-51
,481
6,89
7,65
420
,000
51,4
8134
9,68
14,
269,
913
1,34
5,06
3-
661,
373
2034
-51
,949
6,94
9,60
3-
51,9
4934
9,68
14,
321,
862
1,38
5,48
7-
701,
797
2035
-52
,461
7,00
2,06
4-
52,4
6134
9,68
14,
326,
109
1,41
4,69
4-
731,
004
2036
-52
,957
7,05
5,02
19,
681
52,9
5734
0,00
04,
378,
802
1,44
3,24
3-
759,
553
2037
-53
,494
7,10
8,51
5-
53,4
9434
0,00
04,
359,
760
1,47
1,95
1-
788,
261
2038
-54
,070
7,16
2,58
5-
54,0
7034
0,00
04,
394,
982
1,50
1,26
1-
817,
571
2039
-54
,684
7,21
7,26
945
,000
54,6
8429
5,00
04,
449,
666
1,53
0,57
2-
846,
882
2040
-55
,280
7,27
2,54
9-
55,2
8029
5,00
04,
502,
189
1,56
4,40
7-
880,
717
2041
-55
,911
7,32
8,46
030
,000
55,9
1126
5,00
04,
549,
349
1,59
8,24
3-
914,
553
2042
-56
,577
7,38
5,03
710
5,00
056
,577
160,
000
4,60
5,05
21,
632,
937
-94
9,24
720
43-
53,3
027,
438,
339
50,0
0053
,302
110,
000
4,50
0,87
61,
667,
632
-98
3,94
220
44-
50,2
207,
488,
559
85,0
0050
,220
25,0
004,
467,
809
1,70
0,57
3-
1,01
6,88
320
45-
47,3
747,
535,
933
25,0
0047
,374
(0)
4,41
2,36
61,
733,
514
-1,
049,
824
2046
-44
,703
7,58
0,63
60
44,7
03(0
)4,
428,
221
1,76
6,61
3-
1,08
2,92
320
47-
42,2
017,
622,
837
(0)
42,2
01(0
)4,
401,
106
1,80
6,33
8-
1,12
2,64
820
48-
39,8
627,
662,
699
-39
,862
(0)
4,44
0,96
81,
846,
221
-1,
162,
531
2049
-35
,966
7,69
8,66
50
35,9
66(0
)4,
432,
934
1,88
6,10
4-
1,20
2,41
420
50-
32,4
997,
731,
164
032
,499
(0)
4,37
8,82
61,
909,
360
-1,
225,
670
2051
-29
,444
7,76
0,60
8(0
)29
,444
(0)
4,29
9,33
51,
932,
775
-1,
249,
085
2052
-26
,740
7,78
7,34
8(0
)26
,740
(0)
4,31
2,14
81,
957,
121
-1,
273,
431
2053
-41
,875
7,82
9,22
3(0
)41
,875
(0)
4,27
8,43
71,
988,
437
-1,
304,
747
Inve
stm
ent P
lace
d in
Ser
vice
Irrig
atio
n A
ssis
tanc
e

Table 11A: G
eneration Investments P
laced in Service FY
2010 ($000s)
12
AB
CD
EF
GH
IJ
K
Fiscal YearInitial Project
Replacem
ents
Cum
ulative A
mount in
ServiceD
ue A
mortization
Discretionary
Am
ortizationU
nAm
ortized Investm
entTerm
Investment
Schedule
Cum
ulative A
mount in
SerivceA
mortization
Unam
ortized A
mount
Investment Placed in Service
Irrigation Assistance
4849505152535455
2054-
42,4367,871,659
042,436
(0)4,068,374
2,019,753-
1,336,0632055
-43,028
7,914,687(0)
43,028(0)
3,654,6962,051,069
-1,367,379
2056-
43,6497,958,336
(0)43,649
(0)3,195,803
2,075,263-
1,391,5732057
-44,255
8,002,591(0)
44,255(0)
3,072,5032,075,263
-1,391,573
2058-
44,8908,047,481
(0)44,890
(0)2,956,015
2,075,263-
1,391,5732059
-45,553
8,093,034-
45,553(0)
2,898,3612,075,263
-1,391,573
2060-
-8,093,034
--
(0)2,596,760
2,075,263-
1,391,573T
otal$695,173
$3,260,637-
$943,689$7,149,345
--
$683,690-

Table 11B: Generation Federal Principal Payments FY 2010 ($000s)
123456789101112131415161718192021222324252627282930313233343536373839404142434445464748495051525354
A B C D E F G H I
Fiscal Year BPA Bonds
Corps of Engineers
Appropriations
Bureau of Reclamation
AppropriationsIrrigation
Amortization2009 92,990 10,075 - 7,2742010 68 266,346 850 -2011 - 161,888 - -2012 92,800 2,444 - 1,2062013 70,000 18,067 - 60,0272014 65,850 26,280 7,745 53,5002015 32,300 - 24,991 125,8992016 - - - 41,4522017 - - - 12018 - 125,838 11,462 27,9892019 40,000 362,458 209,758 58,1682020 30,000 365,403 190,966 24,9432021 152,960 392,412 80,151 12,3542022 18,761 648,832 - 14,5852023 - 706,061 - 13,2522024 50,000 567,450 80,986 15,4142025 215,952 376,693 15,961 13,9002026 - 634,113 76 21,1542027 - 73,540 - 192,5722028 - 54,710 - -2029 - 49,119 (0) -2030 - 44,228 - -2031 30,000 39,875 - -2032 - 36,033 - -2033 20,000 51,481 - -2034 - 51,949 - -2035 - 52,461 - -2036 9,681 52,957 - -2037 - 53,494 - -2038 - 54,070 - -2039 45,000 54,684 - -2040 - 55,280 - -2041 30,000 55,911 - -2042 105,000 56,577 - -2043 50,000 53,302 - -2044 85,000 50,220 - -2045 25,000 47,374 0 -2046 - 44,703 0 -2047 - 42,201 0 -2048 - 39,862 - -2049 - 35,966 - -2050 - 32,499 - -2051 - 29,444 (0) -2052 - 26,740 - -2053 - 41,875 - -2054 - 42,436 - -2055 - 43,028 0 -2056 - 43,649 - -2057 - 44,255 0 -2058 - 44,890 (0) -2059 - 45,553 - -2060 - (0) - -Total $1,261,362 $6,208,726 $622,946 $683,690
Appendix BPage B-9
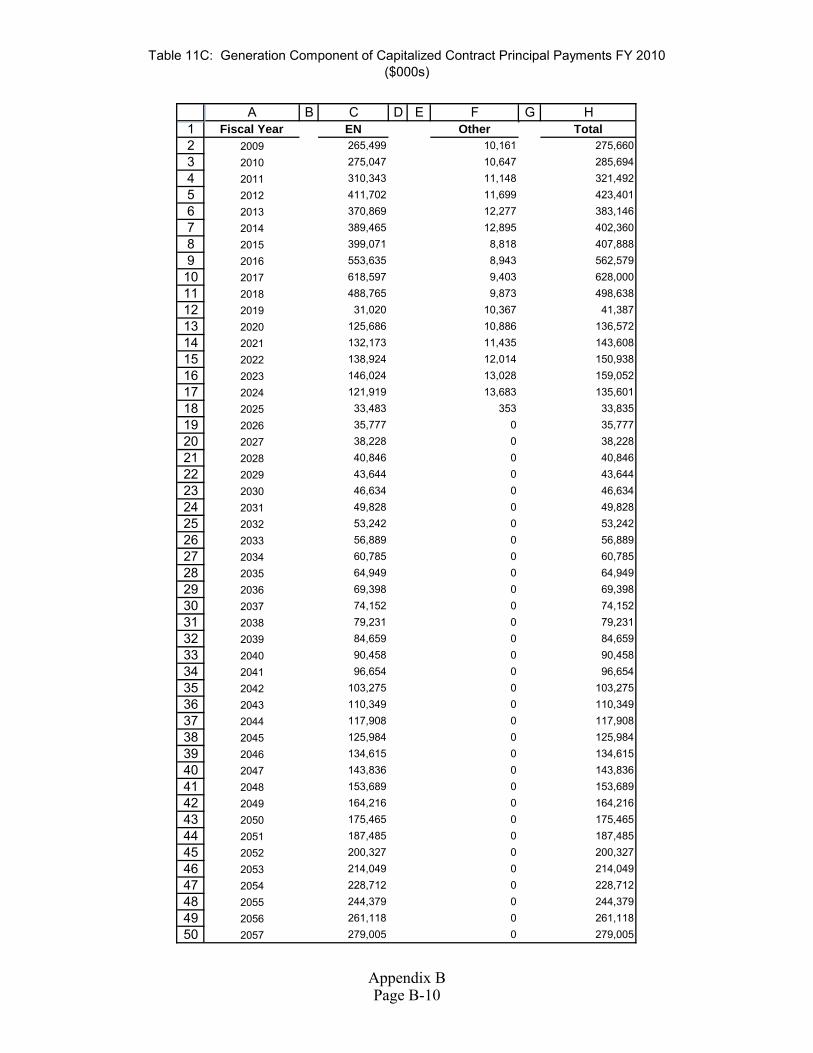
Table 11C: Generation Component of Capitalized Contract Principal Payments FY 2010 ($000s)
1234567891011121314151617181920212223
A B C D E F G HFiscal Year EN Other Total
2009 265,499 10,161 275,6602010 275,047 10,647 285,6942011 310,343 11,148 321,4922012 411,702 11,699 423,4012013 370,869 12,277 383,1462014 389,465 12,895 402,3602015 399,071 8,818 407,8882016 553,635 8,943 562,5792017 618,597 9,403 628,0002018 488,765 9,873 498,6382019 31,020 10,367 41,3872020 125,686 10,886 136,5722021 132,173 11,435 143,6082022 138,924 12,014 150,9382023 146,024 13,028 159,0522024 121,919 13,683 135,6012025 33,483 353 33,8352026 35,777 0 35,7772027 38,228 0 38,2282028 40,846 0 40,8462029 43,644 0 43,6442030 46 634 0 46 63423
242526272829303132333435363738394041424344454647484950
2030 46,634 0 46,6342031 49,828 0 49,8282032 53,242 0 53,2422033 56,889 0 56,8892034 60,785 0 60,7852035 64,949 0 64,9492036 69,398 0 69,3982037 74,152 0 74,1522038 79,231 0 79,2312039 84,659 0 84,6592040 90,458 0 90,4582041 96,654 0 96,6542042 103,275 0 103,2752043 110,349 0 110,3492044 117,908 0 117,9082045 125,984 0 125,9842046 134,615 0 134,6152047 143,836 0 143,8362048 153,689 0 153,6892049 164,216 0 164,2162050 175,465 0 175,4652051 187,485 0 187,4852052 200,327 0 200,3272053 214,049 0 214,0492054 228,712 0 228,7122055 244,379 0 244,3792056 261,118 0 261,1182057 279,005 0 279,005
Appendix BPage B-10

Table 11C: Generation Component of Capitalized Contract Principal Payments FY 2010 ($000s)
1A B C D E F G H
Fiscal Year EN Other Total51525354
2058 298,117 0 298,1172059 318,538 0 318,5382060 250,970 0 250,970Total $9,509,627 $177,628 $9,687,254
Appendix BPage B-11
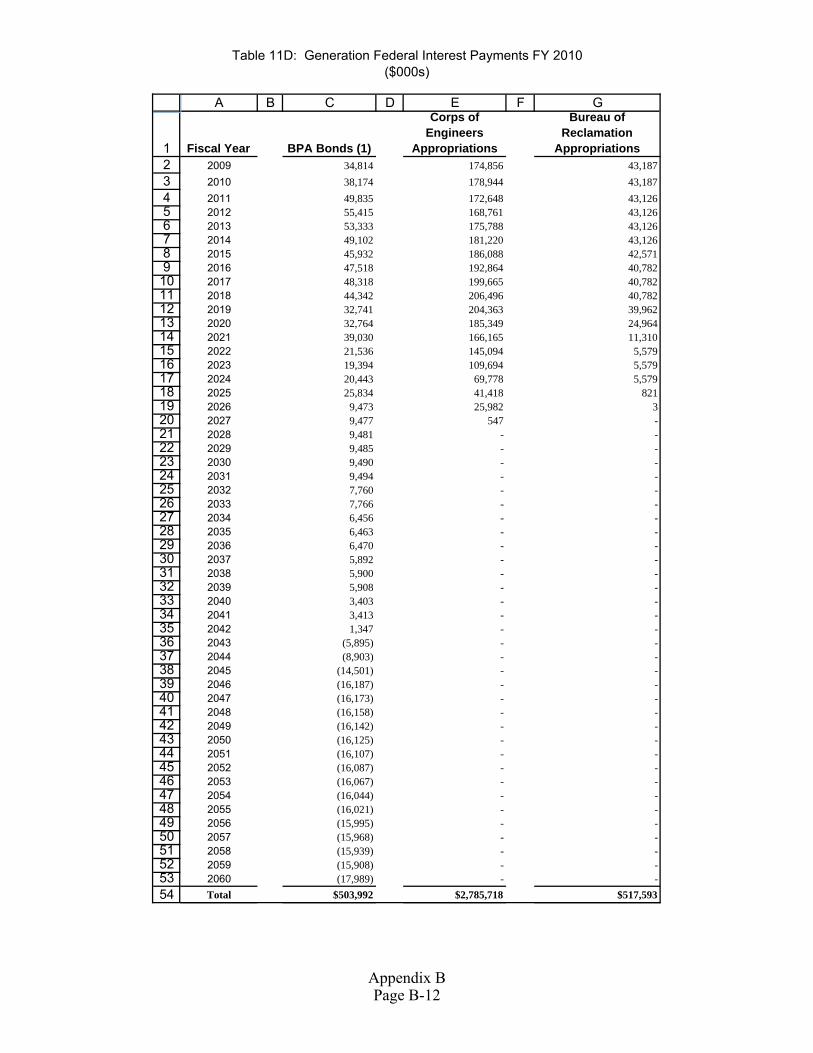
Table 11D: Generation Federal Interest Payments FY 2010 ($000s)
123456789101112131415161718192021222324252627282930313233343536373839404142434445464748495051525354
A B C D E F G
Fiscal Year BPA Bonds (1)
Corps of Engineers
Appropriations
Bureau of Reclamation
Appropriations2009 34,814 174,856 43,1872010 38,174 178,944 43,1872011 49,835 172,648 43,1262012 55,415 168,761 43,1262013 53,333 175,788 43,1262014 49,102 181,220 43,1262015 45,932 186,088 42,5712016 47,518 192,864 40,7822017 48,318 199,665 40,7822018 44,342 206,496 40,7822019 32,741 204,363 39,9622020 32,764 185,349 24,9642021 39,030 166,165 11,3102022 21,536 145,094 5,5792023 19,394 109,694 5,5792024 20,443 69,778 5,5792025 25,834 41,418 8212026 9,473 25,982 32027 9,477 547 -2028 9,481 - -2029 9,485 - -2030 9,490 - -2031 9,494 - -2032 7,760 - -2033 7,766 - -2034 6,456 - -2035 6,463 - -2036 6,470 - -2037 5,892 - -2038 5,900 - -2039 5,908 - -2040 3,403 - -2041 3,413 - -2042 1,347 - -2043 (5,895) - -2044 (8,903) - -2045 (14,501) - -2046 (16,187) - -2047 (16,173) - -2048 (16,158) - -2049 (16,142) - -2050 (16,125) - -2051 (16,107) - -2052 (16,087) - -2053 (16,067) - -2054 (16,044) - -2055 (16,021) - -2056 (15,995) - -2057 (15,968) - -2058 (15,939) - -2059 (15,908) - -2060 (17,989) - -Total $503,992 $2,785,718 $517,593
Appendix BPage B-12

Table 11E: Generation Component of Capitalized Contract Interest PaymentsFY 2010 ($000s)
123456789
101112131415161718192021222324
A B C D E F G
Fiscal Year EN Other Total2009 279,794 8,765 288,5592010 262,160 8,198 270,3582011 246,592 7,534 254,1262012 233,262 6,977 240,2392013 217,509 6,378 223,8872014 192,429 5,750 198,1792015 156,582 5,209 161,7912016 137,501 4,763 142,2632017 106,375 4,301 110,6762018 68,071 3,816 71,8872019 35,279 3,307 38,5862020 33,675 2,772 36,4472021 27,194 2,211 29,4052022 20,435 1,621 22,0552023 13,331 991 14,3222024 81,768 341 82,1082025 303,250 9 303,2592026 301,104 0 301,1042027 298,810 0 298,8102028 296,360 0 296,3602029 293,742 0 293,7422030 290,944 0 290,9442031 287,955 0 287,955
252627282930313233343536373839404142434445464748495051525354
2032 284,761 0 284,7612033 281,348 0 281,3482034 277,702 0 277,7022035 273,805 0 273,8052036 269,642 0 269,6422037 265,194 0 265,1942038 260,441 0 260,4412039 255,362 0 255,3622040 249,935 0 249,9352041 244,137 0 244,1372042 237,941 0 237,9412043 231,321 0 231,3212044 224,248 0 224,2482045 216,690 0 216,6902046 208,615 0 208,6152047 199,986 0 199,9862048 190,766 0 190,7662049 180,915 0 180,9152050 170,388 0 170,3882051 159,141 0 159,1412052 147,123 0 147,1232053 134,282 0 134,2822054 120,562 0 120,5622055 105,901 0 105,9012056 90,237 0 90,2372057 73,499 0 73,4992058 55,615 0 55,6152059 36,505 0 36,5052060 16,087 0 16,087Total $9,646,271 $72,943 $9,719,214
Appendix BPage B-13

Table 11F: GenerationSummary of Payments
FY 2010 ($000s)
1
23456789
10111213141516171819202122232425262728293031323334353637383940414243444546474849505152535455
A B C D E F G
Fiscal YearGeneration
Payment
Capitalized Contracts Payment
Total Principal Payment
Generation Payment
Capitalized Contracts Payment
Total Interest Payment
2009 110,339 275,660 385,999 252,858 288,559 288,5592010 267,264 285,694 552,958 260,305 270,358 530,6632011 161,888 321,492 483,380 265,609 254,126 519,7352012 96,450 423,401 519,851 267,302 240,239 507,5412013 148,094 383,146 531,239 272,247 223,887 496,1352014 153,375 402,360 555,735 273,448 198,179 471,6272015 183,190 407,888 591,078 274,592 161,791 436,3832016 41,452 562,579 604,030 281,164 142,263 423,4272017 1 628,000 628,001 288,765 110,676 399,4422018 165,289 498,638 663,927 291,620 71,887 363,5072019 670,384 41,387 711,771 277,065 38,586 315,6502020 611,312 136,572 747,884 243,076 36,447 279,5242021 637,878 143,608 781,485 216,504 29,405 245,9092022 682,178 150,938 833,116 172,209 22,055 194,2642023 719,313 159,052 878,365 134,667 14,322 148,9892024 713,850 135,601 849,451 95,800 82,108 177,9082025 622,506 33,835 656,341 68,073 303,259 371,3322026 655,344 35,777 691,120 35,458 301,104 336,5622027 266,112 38,228 304,340 10,024 298,810 308,8342028 54,710 40,846 95,556 9,481 296,360 305,8412029 49,119 43,644 92,763 9,485 293,742 303,2272030 44,228 46,634 90,862 9,490 290,944 300,4342031 69,875 49,828 119,703 9,494 287,955 297,4492032 36,033 53,242 89,275 7,760 284,761 292,5212033 71,481 56,889 128,370 7,766 281,348 289,1142034 51,949 60,785 112,734 6,456 277,702 284,1582035 52,461 64,949 117,410 6,463 273,805 280,2682036 62,638 69,398 132,036 6,470 269,642 276,1122037 53,494 74,152 127,646 5,892 265,194 271,0862038 54,070 79,231 133,301 5,900 260,441 266,3402039 99,684 84,659 184,343 5,908 255,362 261,2702040 55,280 90,458 145,738 3,403 249,935 253,3392041 85,911 96,654 182,565 3,413 244,137 247,5502042 161,577 103,275 264,852 1,347 237,941 239,2882043 103,302 110,349 213,651 -5,895 231,321 225,4262044 135,220 117,908 253,128 -8,903 224,248 215,3452045 72,374 125,984 198,358 -14,501 216,690 202,1902046 44,703 134,615 179,318 -16,187 208,615 192,4272047 42,201 143,836 186,037 -16,173 199,986 183,8132048 39,862 153,689 193,551 -16,158 190,766 174,6082049 35,966 164,216 200,182 -16,142 180,915 164,7722050 32,499 175,465 207,964 -16,125 170,388 154,2632051 29,444 187,485 216,928 -16,107 159,141 143,0342052 26,740 200,327 227,067 -16,087 147,123 131,0362053 41,875 214,049 255,924 -16,067 134,282 118,2162054 42,436 228,712 271,148 -16,044 120,562 104,5172055 43,028 244,379 287,406 -16,021 105,901 89,8812056 43,649 261,118 304,767 -15,995 90,237 74,2412057 44,255 279,005 323,259 -15,968 73,499 57,5312058 44,890 298,117 343,006 -15,939 55,615 39,6762059 45,553 318,538 364,091 -15,908 36,505 20,5982060 0 250,970 250,970 -17,989 16,087 -1,902Total $8,776,724 $9,687,254 $18,463,979 $3,807,302 $9,719,214 $13,273,658
Principal Interest
Appendix BPage B-14

Tabl
e 12
A:
Gen
erat
ion
Inve
stm
ents
Pla
ced
in S
ervi
ce F
Y 2
010
($00
0s)
1 2 3 4 5 6 7 8 9 10 11 12 13 14 15 16 17 18 19 20 21 22 23 24 25 26 27 28 29 30 31 32 33 34 35 36 37 38 39 40 41 42 43 44 45
AB
CD
EF
GH
IJ
K
Fisc
al Y
ear
Initi
al P
roje
ctR
epla
cem
ents
Cum
ulat
ive
Am
ount
in
Serv
ice
Due
A
mor
tizat
ion
Dis
cret
iona
ry
Am
ortiz
atio
nU
nAm
ortiz
ed
Inve
stm
ent
Term
Inve
stm
ent
Sche
dule
Cum
ulat
ive
Am
ount
in
Seriv
ceA
mor
tizat
ion
Una
mor
tized
A
mou
nt20
0933
3,15
2-
4,47
0,37
692
,990
10,0
754,
367,
311
5,41
7,60
368
3,69
07,
274
676,
416
2010
362,
021
-4,
832,
397
6826
7,19
64,
462,
068
5,53
0,03
969
0,63
2-
683,
358
2011
380,
900
120,
494
5,33
3,79
1-
161,
888
4,80
1,57
45,
841,
316
697,
198
-68
9,92
420
12-
112,
517
5,44
6,30
892
,800
4,73
74,
816,
555
5,68
2,80
270
0,67
41,
206
692,
194
2013
-10
5,06
65,
551,
374
70,0
0020
,097
4,83
1,52
35,
577,
868
720,
467
60,0
2765
1,96
020
14-
105,
449
5,65
6,82
365
,850
20,2
924,
850,
831
5,59
2,59
375
7,99
769
,011
635,
990
2015
-10
5,85
25,
762,
675
32,3
00-
4,92
4,38
35,
546,
145
763,
104
151,
285
515,
198
2016
-10
6,25
15,
868,
926
39,1
00-
4,99
1,53
45,
610,
592
768,
498
554
479,
140
2017
-10
6,71
55,
975,
641
--
5,09
8,24
95,
651,
181
803,
751
151
4,39
220
18-
107,
240
6,08
2,88
1-
136,
897
5,06
8,59
25,
713,
216
854,
938
27,9
8953
7,59
020
19-
107,
824
6,19
0,70
540
,000
568,
869
4,56
7,54
65,
696,
268
865,
840
58,1
6849
0,32
420
20-
108,
460
6,29
9,16
530
,000
544,
838
4,10
1,16
85,
695,
899
887,
098
24,9
4348
6,63
920
21-
109,
147
6,40
8,31
2-
620,
602
3,58
9,71
35,
721,
198
926,
305
12,3
5451
3,49
220
22-
109,
881
6,51
8,19
3-
654,
989
3,04
4,60
65,
763,
350
965,
354
14,5
8553
7,95
620
23-
97,8
106,
616,
003
-69
0,75
72,
451,
659
5,68
8,14
799
4,43
413
,252
553,
784
2024
-87
,212
6,70
3,21
550
,000
623,
710
1,86
5,16
15,
718,
091
1,03
6,24
015
,414
580,
176
2025
-77
,863
6,78
1,07
870
,000
543,
405
1,32
9,61
95,
486,
464
1,05
6,27
713
,900
586,
313
2026
-69
,622
6,85
0,70
00
635,
570
763,
671
5,25
9,89
91,
089,
505
21,1
5459
8,38
720
27-
62,3
636,
913,
063
-42
6,35
339
9,68
15,
211,
151
1,12
1,73
319
2,57
243
8,04
320
28-
55,8
986,
968,
961
-55
,898
399,
681
5,05
0,84
91,
155,
119
-47
1,42
920
29-
50,1
867,
019,
147
-50
,186
399,
681
4,84
3,61
41,
199,
916
-51
6,22
620
30-
45,1
887,
064,
335
-45
,188
399,
681
4,88
5,68
81,
229,
879
-54
6,18
920
31-
40,7
417,
105,
076
30,0
0040
,741
369,
681
4,88
4,07
71,
259,
842
-57
6,15
220
32-
36,8
167,
141,
892
-36
,816
369,
681
4,71
4,38
01,
304,
639
-62
0,94
920
33-
52,5
997,
194,
491
20,0
0052
,599
349,
681
4,46
7,65
01,
345,
063
-66
1,37
320
34-
53,0
787,
247,
569
-53
,078
349,
681
4,52
0,72
81,
385,
487
-70
1,79
720
35-
53,6
007,
301,
169
-53
,600
349,
681
4,52
6,11
41,
414,
694
-73
1,00
420
36-
54,1
077,
355,
276
9,68
154
,107
340,
000
4,57
9,95
71,
443,
243
-75
9,55
320
37-
54,6
567,
409,
932
-54
,656
340,
000
4,56
2,07
71,
471,
951
-78
8,26
120
38-
55,2
447,
465,
176
-55
,244
340,
000
4,59
8,47
31,
501,
261
-81
7,57
120
39-
55,8
727,
521,
048
45,0
0055
,872
295,
000
4,65
4,34
51,
530,
572
-84
6,88
220
40-
56,4
807,
577,
528
-56
,480
295,
000
4,70
8,06
81,
564,
407
-88
0,71
720
41-
57,1
257,
634,
653
30,0
0057
,125
265,
000
4,75
6,44
21,
598,
243
-91
4,55
320
42-
57,8
067,
692,
459
105,
000
57,8
0616
0,00
04,
813,
374
1,63
2,93
7-
949,
247
2043
-54
,460
7,74
6,91
950
,000
54,4
6011
0,00
04,
710,
356
1,66
7,63
2-
983,
942
2044
-51
,311
7,79
8,23
085
,000
51,3
1125
,000
4,67
8,38
01,
700,
573
-1,
016,
883
2045
-48
,402
7,84
6,63
225
,000
48,4
02(0
)4,
623,
965
1,73
3,51
4-
1,04
9,82
420
46-
45,6
747,
892,
306
045
,674
(0)
4,62
5,84
11,
766,
613
-1,
082,
923
2047
-43
,118
7,93
5,42
4(0
)43
,118
(0)
4,59
9,64
31,
806,
338
-1,
122,
648
2048
-40
,728
7,97
6,15
2-
40,7
28(0
)4,
640,
371
1,84
6,22
1-
1,16
2,53
120
49-
36,7
478,
012,
899
036
,747
(0)
4,63
3,11
81,
886,
104
-1,
202,
414
2050
-33
,205
8,04
6,10
40
33,2
05(0
)4,
579,
716
1,90
9,36
0-
1,22
5,67
020
51-
30,0
838,
076,
187
(0)
30,0
83(0
)4,
500,
864
1,93
2,77
5-
1,24
9,08
5
Inve
stm
ent P
lace
d in
Ser
vice
Irrig
atio
n A
ssis
tanc
e

Table 12A: G
eneration Investments P
laced in Service FY
2010 ($000s)
12
AB
CD
EF
GH
IJ
K
Fiscal YearInitial Project
Replacem
ents
Cum
ulative A
mount in
ServiceD
ue A
mortization
Discretionary
Am
ortizationU
nAm
ortized Investm
entTerm
Investment
Schedule
Cum
ulative A
mount in
SerivceA
mortization
Unam
ortized A
mount
Investment Placed in Service
Irrigation Assistance
4647484950515253545556
2052-
27,3218,103,508
(0)27,321
(0)4,514,258
1,957,121-
1,273,4312053
-42,785
8,146,293(0)
42,785(0)
4,481,4571,988,437
-1,304,747
2054-
43,3588,189,651
043,358
(0)4,272,316
2,019,753-
1,336,0632055
-43,962
8,233,613(0)
43,962(0)
3,985,7522,051,069
-1,367,379
2056-
44,5978,278,210
(0)44,597
(0)3,354,395
2,075,263-
1,391,5732057
-45,216
8,323,426(0)
45,216(0)
3,229,6642,075,263
-1,391,573
2058-
45,8648,369,290
(0)45,864
03,111,916
2,075,263-
1,391,5732059
-46,542
8,415,832-
46,5420
3,053,0092,075,263
-1,391,573
2060-
47,2458,463,077
-47,245
02,796,402
2,075,263-
1,391,5732061
--
8,463,077-
-0
2,594,1512,075,263
-1,391,573
Total
$1,076,073$3,249,780
-$982,789
$7,480,288-
-$683,690
-

Table 12B: Generation Federal Principal Payments FY 2010 ($000s)
12345678910111213141516171819202122232425262728293031323334353637383940414243444546474849505152535455
A B C D E F G H I
Fiscal Year BPA Bonds
Corps of Engineers
Appropriations
Bureau of Reclamation
AppropriationsIrrigation
Amortization2009 92,990 10,075 - 7,2742010 68 266,346 850 -2011 - 161,888 - -2012 92,800 4,737 - 1,2062013 70,000 20,097 - 60,0272014 65,850 20,292 - 69,0112015 32,300 - - 151,2852016 39,100 - - 5542017 - - - 12018 - 92,700 44,197 27,9892019 40,000 397,261 171,608 58,1682020 30,000 355,560 189,278 24,9432021 - 500,613 119,989 12,3542022 - 654,989 - 14,5852023 41,397 649,360 - 13,2522024 390,968 201,755 80,986 15,4142025 174,258 439,147 - 13,9002026 76,850 542,760 15,961 21,1542027 - 426,277 76 192,5722028 - 55,898 - -2029 - 50,186 - -2030 - 45,188 - -2031 30,000 40,741 - -2032 - 36,816 - -2033 20,000 52,599 - -2034 - 53,078 - -2035 - 53,600 - -2036 9,681 54,107 - -2037 - 54,656 - -2038 - 55,244 - -2039 45,000 55,872 - -2040 - 56,480 - -2041 30,000 57,125 - -2042 105,000 57,806 - -2043 50,000 54,460 - -2044 85,000 51,311 - -2045 25,000 48,402 0 -2046 - 45,674 0 -2047 - 43,118 0 -2048 - 40,728 - -2049 - 36,747 - -2050 - 33,205 - -2051 - 30,083 (0) -2052 - 27,321 - -2053 - 42,785 - -2054 - 43,358 - -2055 - 43,962 0 -2056 - 44,597 - -2057 - 45,216 0 -2058 - 45,864 (0) -2059 - 46,542 - -2060 - 47,245 - -2061 - - - -Total $1,546,262 $6,293,869 $622,946 $683,690
Appendix BPage B-17
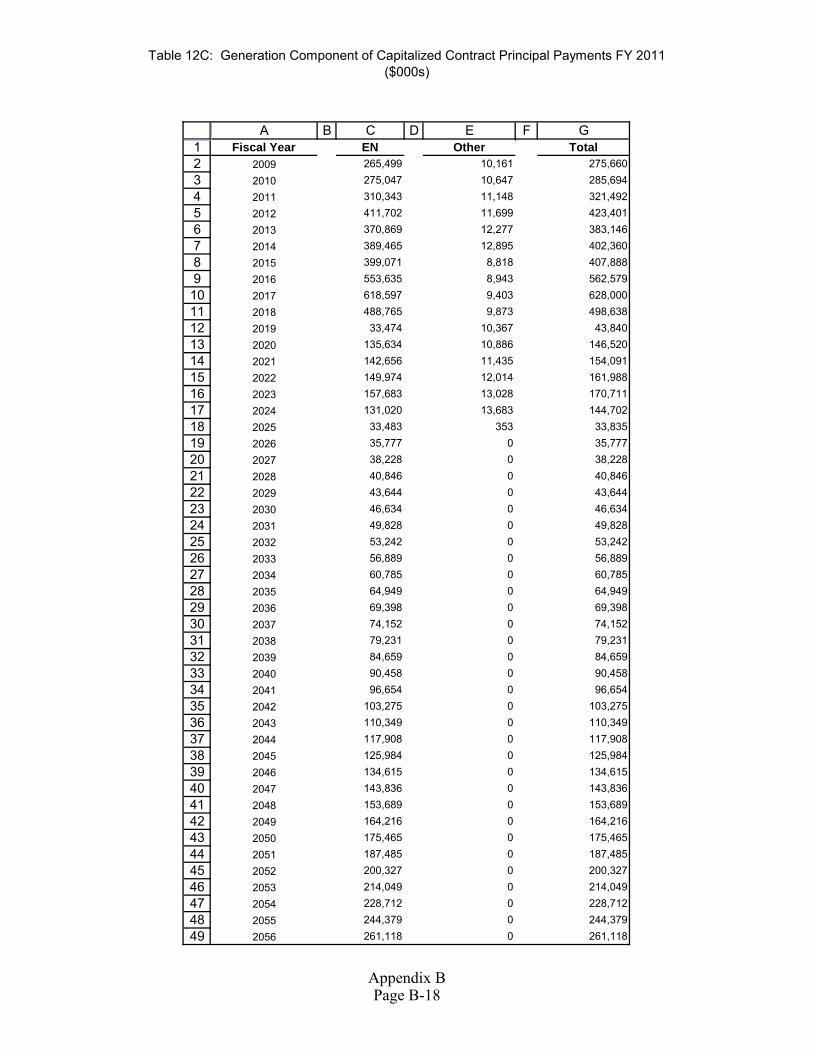
Table 12C: Generation Component of Capitalized Contract Principal Payments FY 2011 ($000s)
123456789
10111213141516171819202122
A B C D E F GFiscal Year EN Other Total
2009 265,499 10,161 275,6602010 275,047 10,647 285,6942011 310,343 11,148 321,4922012 411,702 11,699 423,4012013 370,869 12,277 383,1462014 389,465 12,895 402,3602015 399,071 8,818 407,8882016 553,635 8,943 562,5792017 618,597 9,403 628,0002018 488,765 9,873 498,6382019 33,474 10,367 43,8402020 135,634 10,886 146,5202021 142,656 11,435 154,0912022 149,974 12,014 161,9882023 157,683 13,028 170,7112024 131,020 13,683 144,7022025 33,483 353 33,8352026 35,777 0 35,7772027 38,228 0 38,2282028 40,846 0 40,8462029 43 644 0 43 64422
232425262728293031323334353637383940414243444546474849
2029 43,644 0 43,6442030 46,634 0 46,6342031 49,828 0 49,8282032 53,242 0 53,2422033 56,889 0 56,8892034 60,785 0 60,7852035 64,949 0 64,9492036 69,398 0 69,3982037 74,152 0 74,1522038 79,231 0 79,2312039 84,659 0 84,6592040 90,458 0 90,4582041 96,654 0 96,6542042 103,275 0 103,2752043 110,349 0 110,3492044 117,908 0 117,9082045 125,984 0 125,9842046 134,615 0 134,6152047 143,836 0 143,8362048 153,689 0 153,6892049 164,216 0 164,2162050 175,465 0 175,4652051 187,485 0 187,4852052 200,327 0 200,3272053 214,049 0 214,0492054 228,712 0 228,7122055 244,379 0 244,3792056 261,118 0 261,118
Appendix BPage B-18

Table 12C: Generation Component of Capitalized Contract Principal Payments FY 2011 ($000s)
1A B C D E F G
Fiscal Year EN Other Total505152535455
2057 279,005 0 279,0052058 298,117 0 298,1172059 318,538 0 318,5382060 250,970 0 250,9702061 0Total $9,564,322 $177,628 $9,741,949
Appendix BPage B-19

Table 12D: Generation Federal Interest Payments FY 2011 ($000s)
12345678910111213141516171819202122232425262728293031323334353637383940414243444546474849505152535455
A B C D E F G
Fiscal Year BPA Bonds (1)Corps of Engineers Appropriations (2)
Bureau of Reclamation
Appropriations2009 34,814 174,856 43,1872010 38,174 178,944 43,1872011 59,200 164,396 43,1262012 73,980 166,467 43,1262013 71,898 173,756 43,1262014 67,667 179,441 43,1262015 64,497 185,137 43,1262016 66,083 192,314 43,1262017 64,684 199,518 43,1262018 60,707 206,753 43,1262019 49,164 207,396 39,9622020 49,361 186,302 27,6912021 47,780 168,233 14,1582022 47,780 140,203 5,5792023 49,893 103,245 5,5792024 61,045 65,850 5,5792025 25,102 58,904 8212026 15,608 39,201 8212027 8,967 16,171 32028 8,971 - -2029 8,975 - -2030 8,980 - -2031 8,985 - -2032 7,251 - -2033 7,256 - -2034 5,947 - -2035 5,953 - -2036 5,960 - -2037 5,382 - -2038 5,390 - -2039 5,398 - -2040 2,894 - -2041 2,903 - -2042 837 - -2043 (6,405) - -2044 (9,413) - -2045 (15,010) - -2046 (16,697) - -2047 (16,683) - -2048 (16,668) - -2049 (16,652) - -2050 (16,635) - -2051 (16,617) - -2052 (16,597) - -2053 (16,576) - -2054 (16,554) - -2055 (16,530) - -2056 (16,505) - -2057 (16,478) - -2058 (16,449) - -2059 (16,418) - -2060 (18,499) - -2061 (24,814) - -Total $741,286 $2,807,085 $531,576
Appendix BPage B-20

Table 12E: Generation Component of Capitalized Contract Interest Payments FY 2011 ($000s)
123456789
1011121314151617181920212223242526
A B C D E F GFiscal Year EN Other Total
2009 279,794 8,765 288,5592010 262,160 8,198 270,3582011 247,339 7,534 254,8732012 236,251 6,977 243,2282013 220,499 6,378 226,8772014 195,418 5,750 201,1682015 159,572 5,209 164,7802016 140,490 4,763 145,2532017 109,365 4,301 113,6662018 71,061 3,816 74,8772019 38,268 3,307 41,5752020 36,533 2,772 39,3062021 29,518 2,211 31,7292022 22,188 1,621 23,8092023 14,479 991 15,4702024 82,272 341 82,6132025 303,250 9 303,2592026 301,104 0 301,1042027 298,810 0 298,8102028 296,360 0 296,3602029 293,742 0 293,7422030 290,944 0 290,9442031 287,955 0 287,9552032 284,761 0 284,7612033 281,348 0 281,34826
2728293031323334353637383940414243444546474849505152535455
2033 281,348 0 281,3482034 277,702 0 277,7022035 273,805 0 273,8052036 269,642 0 269,6422037 265,194 0 265,1942038 260,441 0 260,4412039 255,362 0 255,3622040 249,935 0 249,9352041 244,137 0 244,1372042 237,941 0 237,9412043 231,321 0 231,3212044 224,248 0 224,2482045 216,690 0 216,6902046 208,615 0 208,6152047 199,986 0 199,9862048 190,766 0 190,7662049 180,915 0 180,9152050 170,388 0 170,3882051 159,141 0 159,1412052 147,123 0 147,1232053 134,282 0 134,2822054 120,562 0 120,5622055 105,901 0 105,9012056 90,237 0 90,2372057 73,499 0 73,4992058 55,615 0 55,6152059 36,505 0 36,5052060 16,087 0 16,0872061 0 0 0Total $9,679,523 $72,943 $9,752,466
Appendix BPage B-21

Table 12F: Generation Summary of Payments FY 2011 ($000s)
1
23456789
1011121314151617181920212223242526272829303132333435363738394041424344454647484950515253545556
A B C D E F G
Fiscal YearGeneration
PaymentCapitalized Contracts
PaymentTotal Principal
Payment Generation PaymentCapitalized Contracts
PaymentTotal Interest
Payment2009 110,339 275,660 385,999 252,858 288,559 288,5592010 267,264 285,694 552,958 260,305 270,358 530,6632011 161,888 321,492 483,380 266,721 254,873 521,5952012 98,743 423,401 522,144 283,573 243,228 526,8012013 150,124 383,146 533,270 288,780 226,877 515,6572014 155,153 402,360 557,513 290,233 201,168 491,4022015 183,585 407,888 591,473 292,761 164,780 457,5412016 39,654 562,579 602,233 301,523 145,253 446,7752017 1 628,000 628,001 307,327 113,666 420,9932018 164,886 498,638 663,524 310,586 74,877 385,4632019 667,037 43,840 710,878 296,521 41,575 338,0962020 599,781 146,520 746,301 263,355 39,306 302,6612021 632,956 154,091 787,047 230,171 31,729 261,9002022 669,574 161,988 831,562 193,562 23,809 217,3712023 704,009 170,711 874,720 158,717 15,470 174,1882024 689,124 144,702 833,826 132,474 82,613 215,0872025 627,305 33,835 661,140 84,827 303,259 388,0862026 656,724 35,777 692,501 55,630 301,104 356,7342027 618,925 38,228 657,152 25,142 298,810 323,9522028 55,898 40,846 96,744 8,971 296,360 305,3312029 50,186 43,644 93,830 8,975 293,742 302,7172030 45,188 46,634 91,822 8,980 290,944 299,9242031 70,741 49,828 120,569 8,985 287,955 296,9402032 36,816 53,242 90,058 7,251 284,761 292,0122033 72,599 56,889 129,488 7,256 281,348 288,6042034 53,078 60,785 113,863 5,947 277,702 283,6482035 53,600 64,949 118,549 5,953 273,805 279,7582036 63,788 69,398 133,186 5,960 269,642 275,6022037 54,656 74,152 128,808 5,382 265,194 270,5762038 55,244 79,231 134,475 5,390 260,441 265,8312039 100,872 84,659 185,531 5,398 255,362 260,7602040 56,480 90,458 146,938 2,894 249,935 252,8292041 87,125 96,654 183,779 2,903 244,137 247,0402042 162,806 103,275 266,081 837 237,941 238,7782043 104,460 110,349 214,809 -6,405 231,321 224,9162044 136,311 117,908 254,219 -9,413 224,248 214,8352045 73,402 125,984 199,386 -15,010 216,690 201,6802046 45,674 134,615 180,289 -16,697 208,615 191,9182047 43,118 143,836 186,954 -16,683 199,986 183,3032048 40,728 153,689 194,417 -16,668 190,766 174,0982049 36,747 164,216 200,963 -16,652 180,915 164,2622050 33,205 175,465 208,670 -16,635 170,388 153,7532051 30,083 187,485 217,567 -16,617 159,141 142,5242052 27,321 200,327 227,648 -16,597 147,123 130,5262053 42,785 214,049 256,834 -16,576 134,282 117,7062054 43,358 228,712 272,070 -16,554 120,562 104,0082055 43,962 244,379 288,340 -16,530 105,901 89,3712056 44,597 261,118 305,715 -16,505 90,237 73,7322057 45,216 279,005 324,220 -16,478 73,499 57,0212058 45,864 298,117 343,980 -16,449 55,615 39,1662059 46,542 318,538 365,080 -16,418 36,505 20,0882060 47,245 250,970 298,215 -18,499 16,087 -2,4112061 0 0 0 -24,814 0 -24,814Total $9,146,767 $9,741,949 $18,888,717 $4,079,947 $9,752,466 $13,579,555
Principal Interest
Appendix BPage B-22
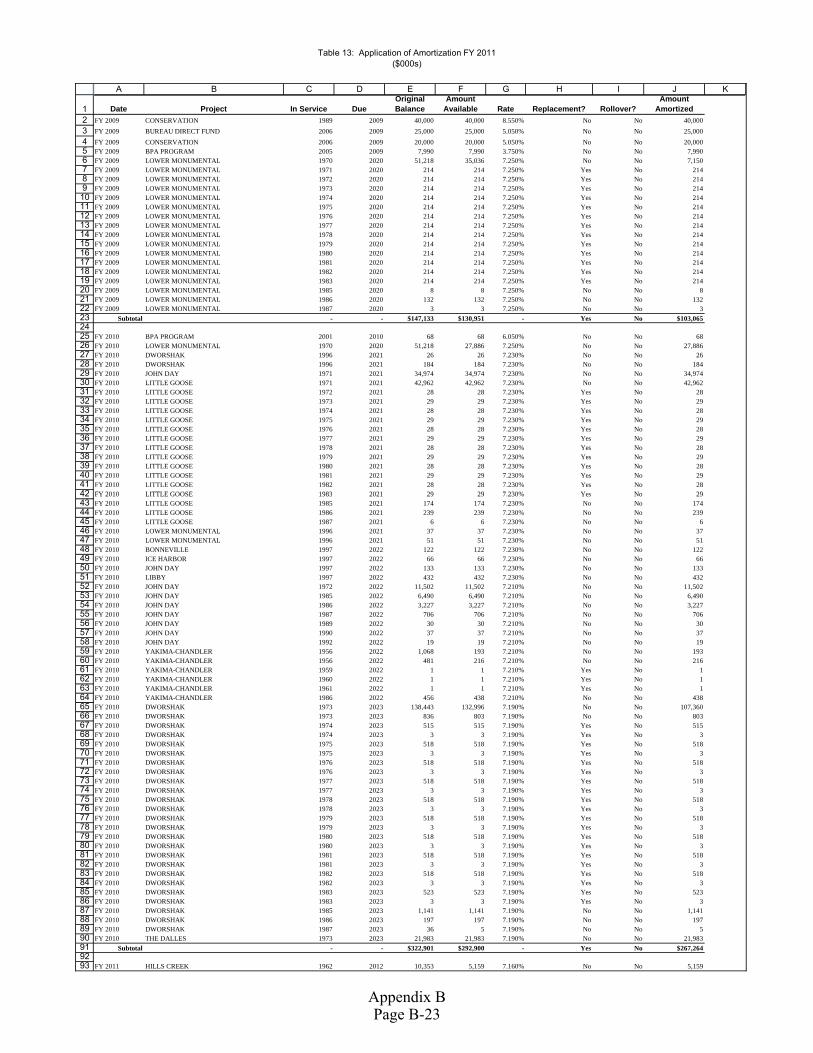
Table 13: Application of Amortization FY 2011($000s)
123456789
101112131415161718192021222324252627282930313233343536373839404142
A B C D E F G H I J K
Date Project In Service DueOriginal Balance
Amount Available Rate Replacement? Rollover?
Amount Amortized
FY 2009 CONSERVATION 1989 2009 40,000 40,000 8.550% No No 40,000FY 2009 BUREAU DIRECT FUND 2006 2009 25,000 25,000 5.050% No No 25,000FY 2009 CONSERVATION 2006 2009 20,000 20,000 5.050% No No 20,000FY 2009 BPA PROGRAM 2005 2009 7,990 7,990 3.750% No No 7,990FY 2009 LOWER MONUMENTAL 1970 2020 51,218 35,036 7.250% No No 7,150FY 2009 LOWER MONUMENTAL 1971 2020 214 214 7.250% Yes No 214FY 2009 LOWER MONUMENTAL 1972 2020 214 214 7.250% Yes No 214FY 2009 LOWER MONUMENTAL 1973 2020 214 214 7.250% Yes No 214FY 2009 LOWER MONUMENTAL 1974 2020 214 214 7.250% Yes No 214FY 2009 LOWER MONUMENTAL 1975 2020 214 214 7.250% Yes No 214FY 2009 LOWER MONUMENTAL 1976 2020 214 214 7.250% Yes No 214FY 2009 LOWER MONUMENTAL 1977 2020 214 214 7.250% Yes No 214FY 2009 LOWER MONUMENTAL 1978 2020 214 214 7.250% Yes No 214FY 2009 LOWER MONUMENTAL 1979 2020 214 214 7.250% Yes No 214FY 2009 LOWER MONUMENTAL 1980 2020 214 214 7.250% Yes No 214FY 2009 LOWER MONUMENTAL 1981 2020 214 214 7.250% Yes No 214FY 2009 LOWER MONUMENTAL 1982 2020 214 214 7.250% Yes No 214FY 2009 LOWER MONUMENTAL 1983 2020 214 214 7.250% Yes No 214FY 2009 LOWER MONUMENTAL 1985 2020 8 8 7.250% No No 8FY 2009 LOWER MONUMENTAL 1986 2020 132 132 7.250% No No 132FY 2009 LOWER MONUMENTAL 1987 2020 3 3 7.250% No No 3
Subtotal - - $147,133 $130,951 - Yes No $103,065 FY 2010 BPA PROGRAM 2001 2010 68 68 6.050% No No 68FY 2010 LOWER MONUMENTAL 1970 2020 51,218 27,886 7.250% No No 27,886FY 2010 DWORSHAK 1996 2021 26 26 7.230% No No 26FY 2010 DWORSHAK 1996 2021 184 184 7.230% No No 184FY 2010 JOHN DAY 1971 2021 34,974 34,974 7.230% No No 34,974FY 2010 LITTLE GOOSE 1971 2021 42,962 42,962 7.230% No No 42,962FY 2010 LITTLE GOOSE 1972 2021 28 28 7.230% Yes No 28FY 2010 LITTLE GOOSE 1973 2021 29 29 7.230% Yes No 29FY 2010 LITTLE GOOSE 1974 2021 28 28 7.230% Yes No 28FY 2010 LITTLE GOOSE 1975 2021 29 29 7.230% Yes No 29FY 2010 LITTLE GOOSE 1976 2021 28 28 7.230% Yes No 28FY 2010 LITTLE GOOSE 1977 2021 29 29 7.230% Yes No 29FY 2010 LITTLE GOOSE 1978 2021 28 28 7.230% Yes No 28FY 2010 LITTLE GOOSE 1979 2021 29 29 7.230% Yes No 29FY 2010 LITTLE GOOSE 1980 2021 28 28 7.230% Yes No 28FY 2010 LITTLE GOOSE 1981 2021 29 29 7.230% Yes No 29FY 2010 LITTLE GOOSE 1982 2021 28 28 7.230% Yes No 28FY 2010 LITTLE GOOSE 1983 2021 29 29 7 230% Y N 2942
434445464748495051525354555657585960616263646566676869707172737475767778798081828384858687888990919293
FY 2010 LITTLE GOOSE 1983 2021 29 29 7.230% Yes No 29FY 2010 LITTLE GOOSE 1985 2021 174 174 7.230% No No 174FY 2010 LITTLE GOOSE 1986 2021 239 239 7.230% No No 239FY 2010 LITTLE GOOSE 1987 2021 6 6 7.230% No No 6FY 2010 LOWER MONUMENTAL 1996 2021 37 37 7.230% No No 37FY 2010 LOWER MONUMENTAL 1996 2021 51 51 7.230% No No 51FY 2010 BONNEVILLE 1997 2022 122 122 7.230% No No 122FY 2010 ICE HARBOR 1997 2022 66 66 7.230% No No 66FY 2010 JOHN DAY 1997 2022 133 133 7.230% No No 133FY 2010 LIBBY 1997 2022 432 432 7.230% No No 432FY 2010 JOHN DAY 1972 2022 11,502 11,502 7.210% No No 11,502FY 2010 JOHN DAY 1985 2022 6,490 6,490 7.210% No No 6,490FY 2010 JOHN DAY 1986 2022 3,227 3,227 7.210% No No 3,227FY 2010 JOHN DAY 1987 2022 706 706 7.210% No No 706FY 2010 JOHN DAY 1989 2022 30 30 7.210% No No 30FY 2010 JOHN DAY 1990 2022 37 37 7.210% No No 37FY 2010 JOHN DAY 1992 2022 19 19 7.210% No No 19FY 2010 YAKIMA-CHANDLER 1956 2022 1,068 193 7.210% No No 193FY 2010 YAKIMA-CHANDLER 1956 2022 481 216 7.210% No No 216FY 2010 YAKIMA-CHANDLER 1959 2022 1 1 7.210% Yes No 1FY 2010 YAKIMA-CHANDLER 1960 2022 1 1 7.210% Yes No 1FY 2010 YAKIMA-CHANDLER 1961 2022 1 1 7.210% Yes No 1FY 2010 YAKIMA-CHANDLER 1986 2022 456 438 7.210% No No 438FY 2010 DWORSHAK 1973 2023 138,443 132,996 7.190% No No 107,360FY 2010 DWORSHAK 1973 2023 836 803 7.190% No No 803FY 2010 DWORSHAK 1974 2023 515 515 7.190% Yes No 515FY 2010 DWORSHAK 1974 2023 3 3 7.190% Yes No 3FY 2010 DWORSHAK 1975 2023 518 518 7.190% Yes No 518FY 2010 DWORSHAK 1975 2023 3 3 7.190% Yes No 3FY 2010 DWORSHAK 1976 2023 518 518 7.190% Yes No 518FY 2010 DWORSHAK 1976 2023 3 3 7.190% Yes No 3FY 2010 DWORSHAK 1977 2023 518 518 7.190% Yes No 518FY 2010 DWORSHAK 1977 2023 3 3 7.190% Yes No 3FY 2010 DWORSHAK 1978 2023 518 518 7.190% Yes No 518FY 2010 DWORSHAK 1978 2023 3 3 7.190% Yes No 3FY 2010 DWORSHAK 1979 2023 518 518 7.190% Yes No 518FY 2010 DWORSHAK 1979 2023 3 3 7.190% Yes No 3FY 2010 DWORSHAK 1980 2023 518 518 7.190% Yes No 518FY 2010 DWORSHAK 1980 2023 3 3 7.190% Yes No 3FY 2010 DWORSHAK 1981 2023 518 518 7.190% Yes No 518FY 2010 DWORSHAK 1981 2023 3 3 7.190% Yes No 3FY 2010 DWORSHAK 1982 2023 518 518 7.190% Yes No 518FY 2010 DWORSHAK 1982 2023 3 3 7.190% Yes No 3FY 2010 DWORSHAK 1983 2023 523 523 7.190% Yes No 523FY 2010 DWORSHAK 1983 2023 3 3 7.190% Yes No 3FY 2010 DWORSHAK 1985 2023 1,141 1,141 7.190% No No 1,141FY 2010 DWORSHAK 1986 2023 197 197 7.190% No No 197FY 2010 DWORSHAK 1987 2023 36 5 7.190% No No 5FY 2010 THE DALLES 1973 2023 21,983 21,983 7.190% No No 21,983
Subtotal - - $322,901 $292,900 - Yes No $267,264 FY 2011 HILLS CREEK 1962 2012 10,353 5,159 7.160% No No 5,159
Appendix BPage B-23

Table 13: Application of Amortization FY 2011($000s)
1
A B C D E F G H I J K
Date Project In Service DueOriginal Balance
Amount Available Rate Replacement? Rollover?
Amount Amortized
949596979899
100101102103104105106107108109110111112113114115116117118119120121122123124125126127128129130131132133134
FY 2011 HILLS CREEK 1974 2012 13 13 7.160% Yes No 13FY 2011 HILLS CREEK 1977 2012 13 13 7.160% Yes No 13FY 2011 HILLS CREEK 1978 2012 13 13 7.160% Yes No 13FY 2011 HILLS CREEK 1979 2012 13 13 7.160% Yes No 13FY 2011 HILLS CREEK 1980 2012 13 13 7.160% Yes No 13FY 2011 HILLS CREEK 1981 2012 13 13 7.160% Yes No 13FY 2011 HILLS CREEK 1982 2012 13 13 7.160% Yes No 13FY 2011 HILLS CREEK 1983 2012 13 13 7.160% Yes No 13FY 2011 ICE HARBOR 1973 2012 1 1 7.160% Yes No 1FY 2011 DWORSHAK 1973 2023 138,443 25,636 7.190% No No 25,636FY 2011 THE DALLES 1974 2024 7,268 7,268 7.170% No No 7,268FY 2011 LIBBY 1975 2025 54,644 48,138 7.160% No No 1,348FY 2011 LOWER GRANITE 1975 2025 119,237 117,645 7.160% No No 117,645FY 2011 LOWER GRANITE 1976 2025 510 510 7.160% Yes No 510FY 2011 LOWER GRANITE 1977 2025 510 510 7.160% Yes No 510FY 2011 LOWER GRANITE 1978 2025 510 510 7.160% Yes No 510FY 2011 LOWER GRANITE 1979 2025 510 510 7.160% Yes No 510FY 2011 LOWER GRANITE 1980 2025 510 510 7.160% Yes No 510FY 2011 LOWER GRANITE 1981 2025 510 510 7.160% Yes No 510FY 2011 LOWER GRANITE 1982 2025 510 510 7.160% Yes No 510FY 2011 LOWER GRANITE 1983 2025 510 510 7.160% Yes No 510FY 2011 LOWER GRANITE 1985 2025 328 328 7.160% No No 328FY 2011 LOWER GRANITE 1986 2025 215 215 7.160% No No 215FY 2011 LOWER GRANITE 1987 2025 8 8 7.160% No No 8FY 2011 LOWER GRANITE 1995 2025 96 96 7.160% No No 96
Subtotal - - $334,777 $208,678 - Yes No $161,888 FY 2012 CONSERVATION 1998 2012 52,800 52,800 5.600% No No 52,800FY 2012 CONSERVATION 2007 2012 20,000 20,000 4.130% No Yes 20,000FY 2012 FISH, WILDLIFE 2008 2012 20,000 20,000 3.444% No No 20,000FY 2012 LIBBY 1975 2025 54,644 46,790 7.160% No No 4,737
Subtotal - - $147,444 $139,590 - No Yes $97,537 FY 2013 FISH, WILDLIFE 1998 2013 60,000 60,000 6.100% No No 60,000FY 2013 CONSERVATION 2008 2013 10,000 10,000 3.701% No No 10,000FY 2013 LIBBY 1975 2025 54,644 42,054 7.160% No No 20,097
Subtotal - - $124,644 $112,054 - No No $90,097 FY 2014 BPA PROGRAM 1999 2014 950 950 5.900% No No 950FY 2014 CONSERVATION 2009 2014 27,200 27,200 3.660% No No 27,200FY 2014 CONSERVATION 1998 2014 37,700 37,700 3.600% No Yes 37,700
135136137138139140141142143144145146147148149150151152153154155156157158159160161162163164165166167168169170171172173174175176177178179180181182183184185186
, , ,FY 2014 LIBBY 1975 2025 54,644 21,956 7.160% No No 20,292
Subtotal - - $120,494 $87,806 - No Yes $86,142 FY 2015 CONSERVATION 2010 2015 32,300 32,300 4.930% No No 32,300
Subtotal - - $32,300 $32,300 - No No $32,300 FY 2016 CONSERVATION 2011 2016 39,100 39,100 5.560% No No 39,100
Subtotal - - $39,100 $39,100 - No No $39,100 FY 2018 COLUMBIA BASIN - 3RD PWR HOUSE 1975 2025 47,328 36,690 7.160% No No 36,690FY 2018 COLUMBIA BASIN - 3RD PWR HOUSE 1975 2025 8,702 7,435 7.160% No No 7,435FY 2018 LIBBY 1975 2025 54,644 1,665 7.160% No No 1,665FY 2018 COLUMBIA BASIN 1996 2026 72 72 7.150% No No 72FY 2018 ICE HARBOR 1985 2026 21 21 7.150% No No 21FY 2018 LIBBY 1976 2026 153,432 153,432 7.150% No No 79,604FY 2018 LIBBY 1977 2026 1,465 1,465 7.150% Yes No 1,465FY 2018 LIBBY 1978 2026 1,465 1,465 7.150% Yes No 1,465FY 2018 LIBBY 1979 2026 1,465 1,465 7.150% Yes No 1,465FY 2018 LIBBY 1980 2026 1,465 1,465 7.150% Yes No 1,465FY 2018 LIBBY 1981 2026 1,465 1,465 7.150% Yes No 1,465FY 2018 LIBBY 1982 2026 1,465 1,465 7.150% Yes No 1,465FY 2018 LIBBY 1983 2026 1,465 1,465 7.150% Yes No 1,465FY 2018 LIBBY 1985 2026 518 518 7.150% No No 518FY 2018 LIBBY 1986 2026 283 283 7.150% No No 283FY 2018 LIBBY 1987 2026 2 2 7.150% No No 2FY 2018 LIBBY 1989 2026 1 1 7.150% No No 1FY 2018 MCNARY 1996 2026 74 74 7.150% No No 74FY 2018 MCNARY 1996 2026 277 277 7.150% No No 277
Subtotal - - $275,609 $210,725 - Yes No $136,897 FY 2019 FISH, WILDLIFE 2007 2019 20,000 20,000 5.690% No Yes 20,000FY 2019 FISH, WILDLIFE 2006 2019 20,000 20,000 5.070% No Yes 20,000FY 2019 COLUMBIA BASIN - 3RD PWR HOUSE 1976 2026 41,330 41,330 7.150% No No 41,330FY 2019 COLUMBIA BASIN - 3RD PWR HOUSE 1976 2026 8,037 8,037 7.150% No No 8,037FY 2019 ICE HARBOR 1976 2026 20,472 20,472 7.150% No No 20,472FY 2019 ICE HARBOR 1976 2026 228 228 7.150% No No 228FY 2019 LIBBY 1976 2026 153,432 73,828 7.150% No No 73,828FY 2019 CHIEF JOSEPH 1977 2027 30,512 30,512 7.150% No No 30,512FY 2019 BONNEVILLE 1977 2027 15,670 15,670 7.150% No No 15,670FY 2019 COLUMBIA BASIN - 3RD PWR HOUSE 1977 2027 42,764 42,764 7.150% No No 42,764FY 2019 COLUMBIA BASIN - 3RD PWR HOUSE 1977 2027 7,964 7,964 7.150% No No 7,964FY 2019 LOST CREEK 1977 2027 13,505 13,413 7.150% No No 13,413FY 2019 LOST CREEK 1978 2027 58 58 7.150% Yes No 58FY 2019 LOST CREEK 1979 2027 60 60 7.150% Yes No 60FY 2019 LOST CREEK 1980 2027 60 60 7.150% Yes No 60FY 2019 LOST CREEK 1981 2027 60 60 7.150% Yes No 60FY 2019 LOST CREEK 1982 2027 60 60 7.150% Yes No 60FY 2019 LOST CREEK 1983 2027 60 60 7.150% Yes No 60FY 2019 LOST CREEK 1985 2027 12 12 7.150% No No 12FY 2019 LOST CREEK 1986 2027 6 6 7.150% No No 6FY 2019 LOST CREEK 1987 2027 4 4 7.150% No No 4FY 2019 CHIEF JOSEPH 1978 2028 75,669 75,669 7.150% No No 75,669
Appendix BPage B-24

Table 13: Application of Amortization FY 2011($000s)
1
A B C D E F G H I J K
Date Project In Service DueOriginal Balance
Amount Available Rate Replacement? Rollover?
Amount Amortized
187188189190191192193194195196197198199200201202203204205206207208209210211212213214215216217218219220221222223224225226227
FY 2019 COLUMBIA BASIN - 3RD PWR HOUSE 1978 2028 42,399 42,399 7.150% No No 42,399FY 2019 COLUMBIA BASIN - 3RD PWR HOUSE 1978 2028 7,896 7,896 7.150% No No 7,896FY 2019 LITTLE GOOSE 1978 2028 49,578 49,578 7.150% No No 49,578FY 2019 LITTLE GOOSE 1985 2028 47 47 7.150% No No 47FY 2019 LOWER GRANITE 1978 2028 40,611 40,611 7.150% No No 40,611FY 2019 CHIEF JOSEPH 1985 2029 16,372 16,372 7.150% No No 16,372FY 2019 CHIEF JOSEPH 1986 2029 5,363 5,363 7.150% No No 5,363FY 2019 CHIEF JOSEPH 1987 2029 3,036 3,036 7.150% No No 3,036FY 2019 CHIEF JOSEPH 1988 2029 2,722 2,722 7.150% No No 2,722FY 2019 CHIEF JOSEPH 1989 2029 2,227 2,227 7.150% No No 2,227FY 2019 CHIEF JOSEPH 1990 2029 4,505 4,505 7.150% No No 4,505FY 2019 COLUMBIA BASIN - 3RD PWR HOUSE 1979 2029 84,118 84,118 7.150% No No 5,552FY 2019 COLUMBIA BASIN - 3RD PWR HOUSE 1979 2029 15,666 15,666 7.150% No No 15,666FY 2019 LIBBY 1994 2029 286 152 7.150% No No 152FY 2019 LOWER GRANITE 1994 2029 3,543 1,551 7.150% No No 1,551FY 2019 LOWER MONUMENTAL 1979 2029 40,669 40,669 7.150% No No 40,669FY 2019 LOWER MONUMENTAL 1985 2029 256 256 7.150% No No 256
Subtotal - - $769,257 $687,435 - Yes Yes $608,869 FY 2020 FISH, WILDLIFE 2007 2020 30,000 30,000 5.210% No Yes 30,000FY 2020 CHIEF JOSEPH 1979 2029 60,079 60,079 7.150% No No 60,079FY 2020 COLUMBIA BASIN - 3RD PWR HOUSE 1979 2029 84,118 78,566 7.150% No No 78,566FY 2020 DWORSHAK 1995 2030 218 218 7.150% No No 218FY 2020 HUNGRY HORSE 1995 2030 536 536 7.150% Yes No 536FY 2020 HUNGRY HORSE 1995 2030 1,198 1,195 7.150% Yes No 1,195FY 2020 LIBBY 1995 2030 15 15 7.150% Yes No 15FY 2020 LIBBY 1995 2030 41 41 7.150% No No 41FY 2020 LIBBY 1995 2030 94 94 7.150% Yes No 94FY 2020 BONNEVILLE - 2ND POWER HOUSE 1981 2031 40,964 40,964 7.150% No No 40,964FY 2020 BONNEVILLE - 2ND POWER HOUSE 1981 2031 455 455 7.150% No No 455FY 2020 CHIEF JOSEPH 1996 2031 27 27 7.150% Yes No 27FY 2020 BONNEVILLE 1996 2031 22 22 7.150% No No 22FY 2020 COLUMBIA BASIN 1996 2031 109 109 7.150% No No 109FY 2020 COLUMBIA BASIN 1996 2031 251 251 7.150% No No 251FY 2020 DWORSHAK 1996 2031 6 6 7.150% No No 6FY 2020 DWORSHAK 1996 2031 203 203 7.150% No No 203FY 2020 ICE HARBOR 1996 2031 78 78 7.150% No No 78FY 2020 LOST CREEK 1996 2031 31 31 7.150% No No 31FY 2020 LOWER GRANITE 1996 2031 206 206 7.150% No No 206FY 2020 BONNEVILLE - 2ND POWER HOUSE 1982 2032 203,535 203,535 7.150% No No 203,535FY 2020 BONNEVILLE - 2ND POWER HOUSE 1982 2032 2,264 2,264 7.150% No No 2,264
228229230231232233234235236237238239240241242243244245246247248249250251252253254255256257258259260261262263264265266267268269270271272273274275276277278279
, , ,FY 2020 CHIEF JOSEPH 1997 2032 166 166 7.150% No No 166FY 2020 BONNEVILLE 1997 2032 518 518 7.150% No No 518FY 2020 MCNARY 1997 2032 30 30 7.150% No No 30FY 2020 BONNEVILLE - 2ND POWER HOUSE 1985 2033 9,138 9,138 7.150% No No 9,138FY 2020 BONNEVILLE - 2ND POWER HOUSE 1986 2033 30,578 30,578 7.150% No No 30,578FY 2020 BONNEVILLE - 2ND POWER HOUSE 1987 2033 2,801 2,801 7.150% No No 2,801FY 2020 BONNEVILLE - 2ND POWER HOUSE 1988 2033 1,271 1,271 7.150% No No 1,271FY 2020 BONNEVILLE - 2ND POWER HOUSE 1989 2033 1,232 1,232 7.150% No No 1,232FY 2020 BONNEVILLE - 2ND POWER HOUSE 1990 2033 1,588 1,588 7.150% No No 1,588FY 2020 COLUMBIA BASIN - 3RD PWR HOUSE 1984 2033 13,192 13,192 7.150% No No 4,034FY 2020 COLUMBIA BASIN - 3RD PWR HOUSE 1984 2033 3,160 3,160 7.150% No No 3,160FY 2020 COLUMBIA BASIN - 3RD PWR HOUSE 1985 2033 2,060 2,060 7.150% No No 2,060FY 2020 COLUMBIA BASIN - 3RD PWR HOUSE 1985 2033 41,772 41,772 7.150% No No 41,772FY 2020 COLUMBIA BASIN - 3RD PWR HOUSE 1985 2033 107 107 7.150% No No 107FY 2020 COLUMBIA BASIN - 3RD PWR HOUSE 1986 2033 1,851 1,851 7.150% No No 1,851FY 2020 COLUMBIA BASIN - 3RD PWR HOUSE 1986 2033 15,538 15,538 7.150% No No 15,538FY 2020 COLUMBIA BASIN - 3RD PWR HOUSE 1987 2033 1,730 1,730 7.150% No No 1,730FY 2020 COLUMBIA BASIN - 3RD PWR HOUSE 1987 2033 14,439 14,439 7.150% No No 14,439FY 2020 COLUMBIA BASIN - 3RD PWR HOUSE 1988 2033 2,294 2,294 7.150% No No 2,294FY 2020 COLUMBIA BASIN - 3RD PWR HOUSE 1988 2033 4,351 4,351 7.150% No No 4,351FY 2020 COLUMBIA BASIN - 3RD PWR HOUSE 1989 2033 10,902 10,902 7.150% No No 10,902FY 2020 COLUMBIA BASIN - 3RD PWR HOUSE 1990 2033 6,383 6,383 7.150% No No 6,383
Subtotal - - $589,551 $583,996 - Yes Yes $574,838 FY 2021 BONNEVILLE - 2ND POWER HOUSE 1983 2033 62,409 62,409 7.150% No No 62,409FY 2021 BONNEVILLE - 2ND POWER HOUSE 1983 2033 694 694 7.150% No No 694FY 2021 COLUMBIA BASIN - 3RD PWR HOUSE 1983 2033 712 712 7.150% No No 712FY 2021 COLUMBIA BASIN - 3RD PWR HOUSE 1983 2033 13,003 13,003 7.150% No No 13,003FY 2021 COLUMBIA BASIN - 3RD PWR HOUSE 1984 2033 16,965 16,965 7.150% No No 16,965FY 2021 COLUMBIA BASIN - 3RD PWR HOUSE 1984 2033 13,192 9,158 7.150% No No 9,158FY 2021 LOWER SNAKE F AND W 1983 2033 30,983 9,472 7.150% No No 9,472FY 2021 JOHN DAY 1995 2035 22 22 7.150% No No 22FY 2021 JOHN DAY 1995 2035 52 52 7.150% No No 52FY 2021 JOHN DAY 1995 2035 121 121 7.150% No No 121FY 2021 LOWER SNAKE F AND W 1985 2035 47,921 47,921 7.150% No No 47,921FY 2021 LOWER MONUMENTAL 1996 2036 264 264 7.150% Yes No 264FY 2021 LOWER SNAKE F AND W 1987 2037 72,536 72,536 7.150% No No 72,536FY 2021 LIBBY 1988 2038 18,043 14,781 7.150% No No 14,781FY 2021 LOWER SNAKE F AND W 1988 2038 805 805 7.150% No No 805FY 2021 LITTLE GOOSE 1995 2040 17 17 7.150% No No 17FY 2021 LITTLE GOOSE 1995 2040 450 450 7.150% No No 450FY 2021 LITTLE GOOSE 1995 2040 733 733 7.150% Yes No 733FY 2021 LOWER SNAKE F AND W 1990 2040 1,557 1,557 7.150% No No 1,557FY 2021 ICE HARBOR 1996 2041 371 371 7.150% Yes No 371FY 2021 LOWER SNAKE F AND W 1991 2041 4,411 4,411 7.150% No No 4,411FY 2021 LOWER SNAKE F AND W 1993 2043 71,632 71,632 7.150% No No 71,632FY 2021 BONNEVILLE - 2ND POWER HOUSE 1994 2044 5,700 5,700 7.150% No No 5,700FY 2021 CHIEF JOSEPH 1994 2044 4,280 4,017 7.150% No No 4,017FY 2021 COLUMBIA BASIN - 3RD PWR HOUSE 1994 2044 12,631 12,631 7.150% No No 12,631FY 2021 LOWER SNAKE F AND W 1994 2044 4,722 4,722 7.150% No No 4,722FY 2021 BONNEVILLE - 2ND POWER HOUSE 1995 2045 3,791 3,791 7.150% No No 3,791FY 2021 CHIEF JOSEPH 1995 2045 147 147 7.150% No No 147
Appendix BPage B-25

Table 13: Application of Amortization FY 2011($000s)
1
A B C D E F G H I J K
Date Project In Service DueOriginal Balance
Amount Available Rate Replacement? Rollover?
Amount Amortized
280281282283284285286287288289290291292293294295296297298299300301302303304305306307308309310311312313314315316317318319320
FY 2021 CHIEF JOSEPH 1995 2045 562 562 7.150% No No 562FY 2021 CHIEF JOSEPH 1995 2045 712 712 7.150% Yes No 712FY 2021 CHIEF JOSEPH 1995 2045 784 784 7.150% No No 784FY 2021 BONNEVILLE 1995 2045 243 243 7.150% No No 243FY 2021 BONNEVILLE 1995 2045 410 410 7.150% Yes No 410FY 2021 BONNEVILLE 1995 2045 440 440 7.150% Yes No 440FY 2021 COLUMBIA BASIN 1995 2045 287 287 7.150% Yes No 287FY 2021 COLUMBIA BASIN 1995 2045 2,511 2,453 7.150% No No 2,453FY 2021 DETROIT-BIG CLIFF 1995 2045 38 38 7.150% No No 38FY 2021 DWORSHAK 1995 2045 1,162 1,162 7.150% No No 1,162FY 2021 COLUMBIA RIVER FISH MITIGATION 1995 2045 43,343 39,282 7.150% No No 39,282FY 2021 HUNGRY HORSE 1995 2045 6,190 6,190 7.150% No No 6,190FY 2021 JOHN DAY 1995 2045 37 37 7.150% No No 37FY 2021 JOHN DAY 1995 2045 608 608 7.150% No No 608FY 2021 JOHN DAY 1995 2045 7,653 7,653 7.150% Yes No 7,653FY 2021 LOOKOUT POINT-DEXTER 1995 2045 80 39 7.150% No No 39FY 2021 LOOKOUT POINT-DEXTER 1995 2045 33 33 7.150% No No 33FY 2021 LOST CREEK 1995 2045 94 94 7.150% No No 94FY 2021 LOWER MONUMENTAL 1995 2045 41 41 7.150% No No 41FY 2021 LOWER MONUMENTAL 1995 2045 99 99 7.150% No No 99FY 2021 LOWER MONUMENTAL 1995 2045 624 624 7.150% No No 624FY 2021 LOWER MONUMENTAL 1995 2045 1,122 1,122 7.150% Yes No 1,122FY 2021 MCNARY 1995 2045 16 16 7.150% No No 16FY 2021 ALBENI FALLS 1995 2045 443 443 7.150% No No 443FY 2021 ALBENI FALLS 1995 2045 531 531 7.150% No No 531FY 2021 ALBENI FALLS 1995 2045 1,105 1,105 7.150% No No 1,105FY 2021 BOISE 1996 2046 442 442 7.150% No No 442FY 2021 BOISE 1996 2046 656 656 7.150% No No 656FY 2021 BONNEVILLE - 2ND POWER HOUSE 1996 2046 376 376 7.150% No No 376FY 2021 CHIEF JOSEPH 1996 2046 3 3 7.150% Yes No 3FY 2021 CHIEF JOSEPH 1996 2046 4 4 7.150% Yes No 4FY 2021 CHIEF JOSEPH 1996 2046 355 355 7.150% No No 355FY 2021 CHIEF JOSEPH 1996 2046 729 729 7.150% No No 729FY 2021 BONNEVILLE 1996 2046 18 18 7.150% No No 18FY 2021 BONNEVILLE 1996 2046 18 18 7.150% No No 18FY 2021 BONNEVILLE 1996 2046 80 80 7.150% No No 80FY 2021 BONNEVILLE 1996 2046 109 109 7.150% No No 109FY 2021 BONNEVILLE 1996 2046 142 142 7.150% No No 142FY 2021 BONNEVILLE 1996 2046 223 223 7.150% No No 223FY 2021 BONNEVILLE 1996 2046 751 751 7.150% No No 751FY 2021 BONNEVILLE 1996 2046 1,322 1,322 7.150% Yes No 1,322
321322323324325326327328329330331332333334335336337338339340341342343344345346347348349350351352353354355356357358359360361362363364365366367368369370371372
, , ,FY 2021 COLUMBIA BASIN 1996 2046 426 426 7.150% No No 426FY 2021 COLUMBIA BASIN 1996 2046 368 368 7.150% No No 368FY 2021 GREEN PETER-FOSTER 1996 2046 26 26 7.150% No No 26FY 2021 DWORSHAK 1996 2046 3 3 7.150% Yes No 3FY 2021 DWORSHAK 1996 2046 4 4 7.150% Yes No 4FY 2021 DWORSHAK 1996 2046 46 46 7.150% No No 46FY 2021 COLUMBIA RIVER FISH MITIGATION 1996 2046 2,431 2,431 7.150% No No 2,431FY 2021 HILLS CREEK 1996 2046 28 28 7.150% No No 28FY 2021 HUNGRY HORSE 1996 2046 15 15 7.150% No No 15FY 2021 HUNGRY HORSE 1996 2046 2 2 7.150% No No 2FY 2021 LITTLE GOOSE 1996 2046 10 10 7.150% No No 10FY 2021 LITTLE GOOSE 1996 2046 10 10 7.150% No No 10FY 2021 LITTLE GOOSE 1996 2046 211 211 7.150% No No 211FY 2021 LITTLE GOOSE 1996 2046 241 241 7.150% No No 241FY 2021 LITTLE GOOSE 1996 2046 520 520 7.150% Yes No 520FY 2021 LITTLE GOOSE 1996 2046 3,909 3,909 7.150% Yes No 3,909FY 2021 LOST CREEK 1996 2046 24 24 7.150% No No 24FY 2021 LOWER GRANITE 1996 2046 9 9 7.150% Yes No 9FY 2021 LOWER GRANITE 1996 2046 625 625 7.150% No No 625FY 2021 LOWER MONUMENTAL 1996 2046 10 10 7.150% No No 10FY 2021 LOWER SNAKE F AND W 1996 2046 12,085 12,085 7.150% No No 12,085FY 2021 MCNARY 1996 2046 619 619 7.150% No No 619FY 2021 THE DALLES 1996 2046 1,991 1,991 7.150% No No 1,991FY 2021 BOISE 1997 2047 2,272 2,266 7.150% No No 2,266FY 2021 CHIEF JOSEPH 1997 2047 657 657 7.150% No No 657FY 2021 BONNEVILLE 1997 2047 161 161 7.150% No No 161FY 2021 COUGAR 1997 2047 26 26 7.150% No No 26FY 2021 COLUMBIA BASIN 1997 2047 3,393 3,393 7.150% No No 3,393FY 2021 DWORSHAK 1997 2047 7,588 7,588 7.150% No No 7,588FY 2021 HUNGRY HORSE 1997 2047 111 111 7.150% No No 111FY 2021 ICE HARBOR 1997 2047 67 67 7.150% No No 67FY 2021 JOHN DAY 1997 2047 179 179 7.150% No No 179FY 2021 LIBBY 1997 2047 660 660 7.150% No No 660FY 2021 LITTLE GOOSE 1997 2047 1 1 7.150% No No 1FY 2021 LOWER GRANITE 1997 2047 677 677 7.150% No No 677FY 2021 LOWER SNAKE F AND W 1997 2047 2,173 2,173 7.150% No No 2,173FY 2021 MINIDOKA 1997 2047 50,911 50,911 7.150% No No 50,911FY 2021 ALBENI FALLS 1997 2047 431 431 7.150% No No 431FY 2021 ALBENI FALLS 2011 2056 120,494 120,494 6.780% Yes No 98,358
Subtotal - - $675,974 $642,738 - Yes No $620,602 FY 2022 ALBENI FALLS 2011 2056 120,494 22,136 6.780% Yes No 22,136FY 2022 ALBENI FALLS 2012 2057 112,517 112,517 6.780% Yes No 112,517FY 2022 ALBENI FALLS 2013 2058 105,066 105,066 6.780% Yes No 105,066FY 2022 ALBENI FALLS 2014 2059 105,449 105,449 6.780% Yes No 105,449FY 2022 ALBENI FALLS 2015 2060 105,852 105,852 6.780% Yes No 105,852FY 2022 ALBENI FALLS 2016 2061 106,251 106,251 6.780% Yes No 106,251FY 2022 ALBENI FALLS 2017 2062 106,715 106,715 6.780% Yes No 97,717
Subtotal - - $762,344 $663,986 - Yes No $654,989 FY 2023 DWORSHAK 1973 2023 138,443 -0 7.190% No No -0FY 2023 BUREAU DIRECT FUND 2011 2056 170,850 170,850 6.930% No No 41,397
Appendix BPage B-26
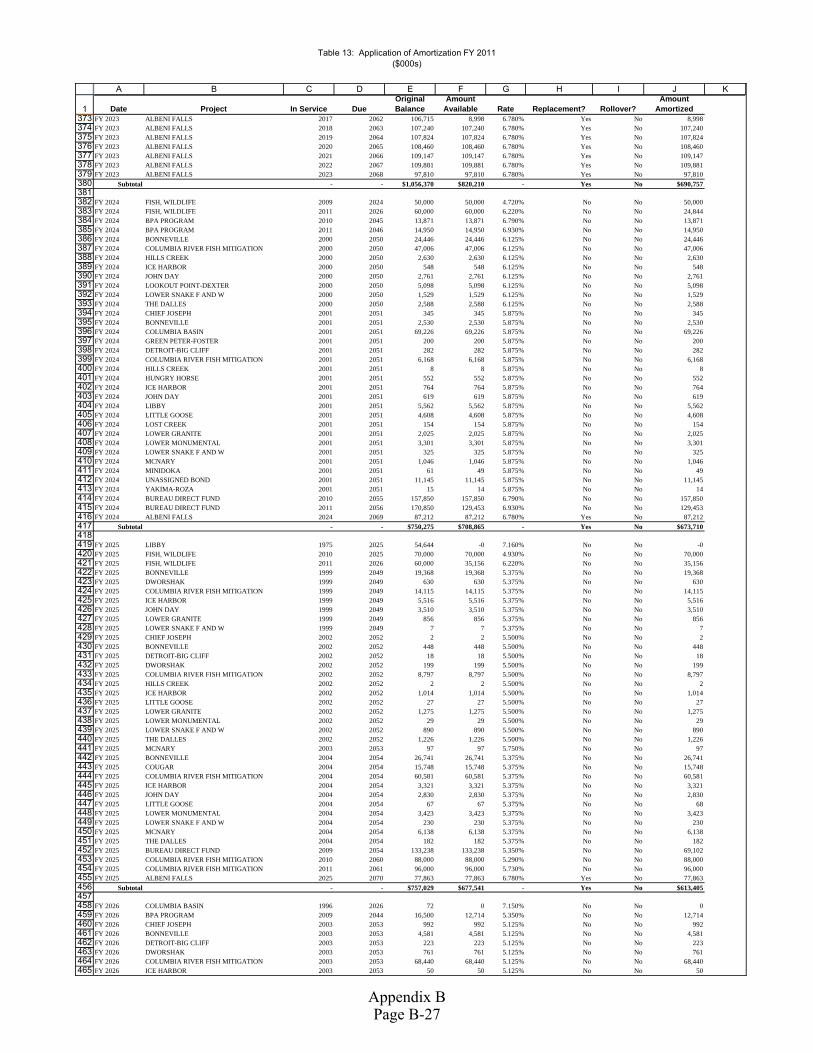
Table 13: Application of Amortization FY 2011($000s)
1
A B C D E F G H I J K
Date Project In Service DueOriginal Balance
Amount Available Rate Replacement? Rollover?
Amount Amortized
373374375376377378379380381382383384385386387388389390391392393394395396397398399400401402403404405406407408409410411412413
FY 2023 ALBENI FALLS 2017 2062 106,715 8,998 6.780% Yes No 8,998FY 2023 ALBENI FALLS 2018 2063 107,240 107,240 6.780% Yes No 107,240FY 2023 ALBENI FALLS 2019 2064 107,824 107,824 6.780% Yes No 107,824FY 2023 ALBENI FALLS 2020 2065 108,460 108,460 6.780% Yes No 108,460FY 2023 ALBENI FALLS 2021 2066 109,147 109,147 6.780% Yes No 109,147FY 2023 ALBENI FALLS 2022 2067 109,881 109,881 6.780% Yes No 109,881FY 2023 ALBENI FALLS 2023 2068 97,810 97,810 6.780% Yes No 97,810
Subtotal - - $1,056,370 $820,210 - Yes No $690,757 FY 2024 FISH, WILDLIFE 2009 2024 50,000 50,000 4.720% No No 50,000FY 2024 FISH, WILDLIFE 2011 2026 60,000 60,000 6.220% No No 24,844FY 2024 BPA PROGRAM 2010 2045 13,871 13,871 6.790% No No 13,871FY 2024 BPA PROGRAM 2011 2046 14,950 14,950 6.930% No No 14,950FY 2024 BONNEVILLE 2000 2050 24,446 24,446 6.125% No No 24,446FY 2024 COLUMBIA RIVER FISH MITIGATION 2000 2050 47,006 47,006 6.125% No No 47,006FY 2024 HILLS CREEK 2000 2050 2,630 2,630 6.125% No No 2,630FY 2024 ICE HARBOR 2000 2050 548 548 6.125% No No 548FY 2024 JOHN DAY 2000 2050 2,761 2,761 6.125% No No 2,761FY 2024 LOOKOUT POINT-DEXTER 2000 2050 5,098 5,098 6.125% No No 5,098FY 2024 LOWER SNAKE F AND W 2000 2050 1,529 1,529 6.125% No No 1,529FY 2024 THE DALLES 2000 2050 2,588 2,588 6.125% No No 2,588FY 2024 CHIEF JOSEPH 2001 2051 345 345 5.875% No No 345FY 2024 BONNEVILLE 2001 2051 2,530 2,530 5.875% No No 2,530FY 2024 COLUMBIA BASIN 2001 2051 69,226 69,226 5.875% No No 69,226FY 2024 GREEN PETER-FOSTER 2001 2051 200 200 5.875% No No 200FY 2024 DETROIT-BIG CLIFF 2001 2051 282 282 5.875% No No 282FY 2024 COLUMBIA RIVER FISH MITIGATION 2001 2051 6,168 6,168 5.875% No No 6,168FY 2024 HILLS CREEK 2001 2051 8 8 5.875% No No 8FY 2024 HUNGRY HORSE 2001 2051 552 552 5.875% No No 552FY 2024 ICE HARBOR 2001 2051 764 764 5.875% No No 764FY 2024 JOHN DAY 2001 2051 619 619 5.875% No No 619FY 2024 LIBBY 2001 2051 5,562 5,562 5.875% No No 5,562FY 2024 LITTLE GOOSE 2001 2051 4,608 4,608 5.875% No No 4,608FY 2024 LOST CREEK 2001 2051 154 154 5.875% No No 154FY 2024 LOWER GRANITE 2001 2051 2,025 2,025 5.875% No No 2,025FY 2024 LOWER MONUMENTAL 2001 2051 3,301 3,301 5.875% No No 3,301FY 2024 LOWER SNAKE F AND W 2001 2051 325 325 5.875% No No 325FY 2024 MCNARY 2001 2051 1,046 1,046 5.875% No No 1,046FY 2024 MINIDOKA 2001 2051 61 49 5.875% No No 49FY 2024 UNASSIGNED BOND 2001 2051 11,145 11,145 5.875% No No 11,145FY 2024 YAKIMA-ROZA 2001 2051 15 14 5.875% No No 14
414415416417418419420421422423424425426427428429430431432433434435436437438439440441442443444445446447448449450451452453454455456457458459460461462463464465
FY 2024 BUREAU DIRECT FUND 2010 2055 157,850 157,850 6.790% No No 157,850FY 2024 BUREAU DIRECT FUND 2011 2056 170,850 129,453 6.930% No No 129,453FY 2024 ALBENI FALLS 2024 2069 87,212 87,212 6.780% Yes No 87,212
Subtotal - - $750,275 $708,865 - Yes No $673,710 FY 2025 LIBBY 1975 2025 54,644 -0 7.160% No No -0FY 2025 FISH, WILDLIFE 2010 2025 70,000 70,000 4.930% No No 70,000FY 2025 FISH, WILDLIFE 2011 2026 60,000 35,156 6.220% No No 35,156FY 2025 BONNEVILLE 1999 2049 19,368 19,368 5.375% No No 19,368FY 2025 DWORSHAK 1999 2049 630 630 5.375% No No 630FY 2025 COLUMBIA RIVER FISH MITIGATION 1999 2049 14,115 14,115 5.375% No No 14,115FY 2025 ICE HARBOR 1999 2049 5,516 5,516 5.375% No No 5,516FY 2025 JOHN DAY 1999 2049 3,510 3,510 5.375% No No 3,510FY 2025 LOWER GRANITE 1999 2049 856 856 5.375% No No 856FY 2025 LOWER SNAKE F AND W 1999 2049 7 7 5.375% No No 7FY 2025 CHIEF JOSEPH 2002 2052 2 2 5.500% No No 2FY 2025 BONNEVILLE 2002 2052 448 448 5.500% No No 448FY 2025 DETROIT-BIG CLIFF 2002 2052 18 18 5.500% No No 18FY 2025 DWORSHAK 2002 2052 199 199 5.500% No No 199FY 2025 COLUMBIA RIVER FISH MITIGATION 2002 2052 8,797 8,797 5.500% No No 8,797FY 2025 HILLS CREEK 2002 2052 2 2 5.500% No No 2FY 2025 ICE HARBOR 2002 2052 1,014 1,014 5.500% No No 1,014FY 2025 LITTLE GOOSE 2002 2052 27 27 5.500% No No 27FY 2025 LOWER GRANITE 2002 2052 1,275 1,275 5.500% No No 1,275FY 2025 LOWER MONUMENTAL 2002 2052 29 29 5.500% No No 29FY 2025 LOWER SNAKE F AND W 2002 2052 890 890 5.500% No No 890FY 2025 THE DALLES 2002 2052 1,226 1,226 5.500% No No 1,226FY 2025 MCNARY 2003 2053 97 97 5.750% No No 97FY 2025 BONNEVILLE 2004 2054 26,741 26,741 5.375% No No 26,741FY 2025 COUGAR 2004 2054 15,748 15,748 5.375% No No 15,748FY 2025 COLUMBIA RIVER FISH MITIGATION 2004 2054 60,581 60,581 5.375% No No 60,581FY 2025 ICE HARBOR 2004 2054 3,321 3,321 5.375% No No 3,321FY 2025 JOHN DAY 2004 2054 2,830 2,830 5.375% No No 2,830FY 2025 LITTLE GOOSE 2004 2054 67 67 5.375% No No 68FY 2025 LOWER MONUMENTAL 2004 2054 3,423 3,423 5.375% No No 3,423FY 2025 LOWER SNAKE F AND W 2004 2054 230 230 5.375% No No 230FY 2025 MCNARY 2004 2054 6,138 6,138 5.375% No No 6,138FY 2025 THE DALLES 2004 2054 182 182 5.375% No No 182FY 2025 BUREAU DIRECT FUND 2009 2054 133,238 133,238 5.350% No No 69,102FY 2025 COLUMBIA RIVER FISH MITIGATION 2010 2060 88,000 88,000 5.290% No No 88,000FY 2025 COLUMBIA RIVER FISH MITIGATION 2011 2061 96,000 96,000 5.730% No No 96,000FY 2025 ALBENI FALLS 2025 2070 77,863 77,863 6.780% Yes No 77,863
Subtotal - - $757,029 $677,541 - Yes No $613,405 FY 2026 COLUMBIA BASIN 1996 2026 72 0 7.150% No No 0FY 2026 BPA PROGRAM 2009 2044 16,500 12,714 5.350% No No 12,714FY 2026 CHIEF JOSEPH 2003 2053 992 992 5.125% No No 992FY 2026 BONNEVILLE 2003 2053 4,581 4,581 5.125% No No 4,581FY 2026 DETROIT-BIG CLIFF 2003 2053 223 223 5.125% No No 223FY 2026 DWORSHAK 2003 2053 761 761 5.125% No No 761FY 2026 COLUMBIA RIVER FISH MITIGATION 2003 2053 68,440 68,440 5.125% No No 68,440FY 2026 ICE HARBOR 2003 2053 50 50 5.125% No No 50
Appendix BPage B-27

Table 13: Application of Amortization FY 2011($000s)
1
A B C D E F G H I J K
Date Project In Service DueOriginal Balance
Amount Available Rate Replacement? Rollover?
Amount Amortized
466467468469470471472473474475476477478479480481482483484485486487488489490491492493494495496497498499500501502503504505506
FY 2026 LITTLE GOOSE 2003 2053 146 146 5.125% No No 146FY 2026 LOOKOUT POINT-DEXTER 2003 2053 135 135 5.125% No No 135FY 2026 LOWER GRANITE 2003 2053 42 42 5.125% No No 42FY 2026 LOWER MONUMENTAL 2003 2053 22 22 5.125% No No 22FY 2026 LOWER SNAKE F AND W 2003 2053 98 98 5.125% No No 98FY 2026 BUREAU DIRECT FUND 2009 2054 133,238 64,136 5.350% No No 64,136FY 2026 BOISE 2005 2055 903 903 5.125% No No 903FY 2026 BONNEVILLE 2005 2055 19,725 19,725 5.125% No No 19,725FY 2026 COUGAR 2005 2055 35,317 35,317 5.125% No No 35,317FY 2026 COLUMBIA BASIN 2005 2055 10,963 10,963 5.125% No No 10,963FY 2026 DETROIT-BIG CLIFF 2005 2055 1,031 1,031 5.125% No No 1,031FY 2026 DWORSHAK 2005 2055 713 713 5.125% No No 713FY 2026 COLUMBIA RIVER FISH MITIGATION 2005 2055 52,039 52,039 5.125% No No 52,039FY 2026 HILLS CREEK 2005 2055 46 46 5.125% No No 46FY 2026 HUNGRY HORSE 2005 2055 2,951 2,951 5.125% No No 2,951FY 2026 JOHN DAY 2005 2055 2,827 2,827 5.125% No No 2,828FY 2026 LOOKOUT POINT-DEXTER 2005 2055 7,355 7,355 5.125% No No 7,355FY 2026 LOWER GRANITE 2005 2055 393 393 5.125% No No 393FY 2026 LOWER MONUMENTAL 2005 2055 527 527 5.125% No No 527FY 2026 LOWER SNAKE F AND W 2005 2055 4 4 5.125% No No 4FY 2026 MCNARY 2005 2055 550 550 5.125% No No 550FY 2026 ALBENI FALLS 2005 2055 481 481 5.125% No No 481FY 2026 YAKIMA-CHANDLER 2005 2055 833 833 5.125% No No 833FY 2026 THE DALLES 2005 2055 36,019 36,019 5.125% No No 36,019FY 2026 COLUMBIA RIVER FISH MITIGATION 2006 2056 366,395 366,395 4.500% No No 176,128FY 2026 JOHN DAY 2006 2056 601 601 4.500% No No 601FY 2026 LOWER MONUMENTAL 2006 2056 285 285 4.500% No No 285FY 2026 LOWER SNAKE F AND W 2006 2056 379 379 4.500% No No 379FY 2026 MCNARY 2006 2056 8,169 4,080 4.500% No No 4,080FY 2026 THE DALLES 2006 2056 2,030 2,030 4.500% No No 2,030FY 2026 BOISE 2007 2057 76 76 5.000% No No 76FY 2026 BONNEVILLE 2007 2057 1,124 1,124 5.000% No No 1,124FY 2026 COUGAR 2007 2057 521 521 5.000% No No 521FY 2026 COLUMBIA BASIN 2007 2057 929 929 5.000% No No 929FY 2026 COLUMBIA RIVER FISH MITIGATION 2007 2057 53,525 53,525 5.000% No No 53,525FY 2026 HUNGRY HORSE 2007 2057 294 294 5.000% No No 294FY 2026 JOHN DAY 2007 2057 233 233 5.000% No No 233FY 2026 LOOKOUT POINT-DEXTER 2007 2057 572 572 5.000% No No 572FY 2026 MINIDOKA 2007 2057 17 17 5.000% No No 17FY 2026 THE DALLES 2007 2057 140 140 5.000% No No 140FY 2026 ALBENI FALLS 2026 2071 69,622 69,622 6.780% Yes No 69,622
507508509510511512513514515516517518519520521522523524525526527528529530531532533534535536537538539540541542543544545546547548549550551552553554555556557558
, , ,Subtotal - - $902,887 $825,838 - Yes No $635,570
FY 2027 BOISE 2006 2056 15 15 4.500% No No 15FY 2027 BONNEVILLE 2006 2056 4,203 2,628 4.500% No No 2,628FY 2027 COUGAR 2006 2056 474 474 4.500% No No 474FY 2027 COLUMBIA BASIN 2006 2056 1,987 1,987 4.500% No No 1,987FY 2027 DWORSHAK 2006 2056 73 73 4.500% No No 73FY 2027 COLUMBIA RIVER FISH MITIGATION 2006 2056 366,395 190,267 4.500% No No 190,267FY 2027 BOISE 2008 2058 69 69 4.375% No No 70FY 2027 CHIEF JOSEPH 2008 2058 3,600 3,600 4.375% No No 3,600FY 2027 BONNEVILLE 2008 2058 14,609 14,609 4.375% No No 14,609FY 2027 COLUMBIA BASIN 2008 2058 837 837 4.375% No No 837FY 2027 DWORSHAK 2008 2058 22 22 4.375% No No 22FY 2027 COLUMBIA RIVER FISH MITIGATION 2008 2058 37,277 37,277 4.375% No No 37,277FY 2027 HUNGRY HORSE 2008 2058 76 76 4.375% No No 76FY 2027 ICE HARBOR 2008 2058 14 14 4.375% No No 14FY 2027 LIBBY 2008 2058 1,652 1,652 4.375% No No 1,652FY 2027 LITTLE GOOSE 2008 2058 14 14 4.375% No No 14FY 2027 LOWER GRANITE 2008 2058 1 1 4.375% No No 1FY 2027 LOWER MONUMENTAL 2008 2058 42 42 4.375% No No 42FY 2027 MCNARY 2008 2058 331 331 4.375% No No 331FY 2027 MINIDOKA 2008 2058 0 0 4.375% No No 0FY 2027 COLUMBIA RIVER FISH MITIGATION 2009 2060 110,000 110,000 4.380% No No 110,000FY 2027 ALBENI FALLS 2027 2072 62,363 62,363 6.780% Yes No 62,363
Subtotal - - $604,055 $426,353 - Yes No $426,353 FY 2028 ALBENI FALLS 2028 2073 55,898 55,898 6.780% Yes No 55,898
Subtotal - - $55,898 $55,898 - Yes No $55,898 FY 2029 ALBENI FALLS 2029 2074 50,186 50,186 6.780% Yes No 50,186
Subtotal - - $50,186 $50,186 - Yes No $50,186 FY 2030 ALBENI FALLS 2030 2075 45,188 45,188 6.780% Yes No 45,188
Subtotal - - $45,188 $45,188 - Yes No $45,188 FY 2031 BUREAU DIRECT FUND 2007 2031 30,000 30,000 5.730% No Yes 30,000FY 2031 ALBENI FALLS 2031 2076 40,741 40,741 6.780% Yes No 40,741
Subtotal - - $70,741 $70,741 - Yes Yes $70,741 FY 2032 ALBENI FALLS 2032 2077 36,816 36,816 6.780% Yes No 36,816
Subtotal - - $36,816 $36,816 - Yes No $36,816 FY 2033 LOWER SNAKE F AND W 1983 2033 30,983 0 7.150% No No 0FY 2033 BPA PROGRAM 2008 2033 10,000 10,000 6.500% No Yes 10,000FY 2033 BPA PROGRAM 2008 2033 10,000 10,000 6.500% No Yes 10,000FY 2033 ALBENI FALLS 2033 2078 52,599 52,599 6.780% Yes No 52,599
Subtotal - - $103,582 $72,599 - Yes Yes $72,599 FY 2034 ALBENI FALLS 2034 2079 53,078 53,078 6.780% Yes No 53,078
Subtotal - - $53,078 $53,078 - Yes No $53,078 FY 2035 ALBENI FALLS 2035 2080 53,600 53,600 6.780% Yes No 53,600
Appendix BPage B-28

Table 13: Application of Amortization FY 2011($000s)
1
A B C D E F G H I J K
Date Project In Service DueOriginal Balance
Amount Available Rate Replacement? Rollover?
Amount Amortized
559560561562563564565566567568569570571572573574575576577578579580581582583584585586587588589590591592593594595596597598599
Subtotal - - $53,600 $53,600 - Yes No $53,600 FY 2036 BPA PROGRAM 2006 2036 9,681 9,681 5.970% No Yes 9,681FY 2036 ALBENI FALLS 2036 2081 54,107 54,107 6.780% Yes No 54,107
Subtotal - - $63,788 $63,788 - Yes Yes $63,788 FY 2037 ALBENI FALLS 2037 2082 54,656 54,656 6.780% Yes No 54,656
Subtotal - - $54,656 $54,656 - Yes No $54,656 FY 2038 ALBENI FALLS 2038 2083 55,244 55,244 6.780% Yes No 55,244
Subtotal - - $55,244 $55,244 - Yes No $55,244 FY 2039 BUREAU DIRECT FUND 2006 2039 45,000 45,000 5.520% No Yes 45,000FY 2039 ALBENI FALLS 2039 2084 55,872 55,872 6.780% Yes No 55,872
Subtotal - - $100,872 $100,872 - Yes Yes $100,872 FY 2040 ALBENI FALLS 2040 2085 56,480 56,480 6.780% Yes No 56,480
Subtotal - - $56,480 $56,480 - Yes No $56,480 FY 2041 BUREAU DIRECT FUND 2008 2041 30,000 30,000 6.840% No Yes 30,000FY 2041 ALBENI FALLS 2041 2086 57,125 57,125 6.780% Yes No 57,125
Subtotal - - $87,125 $87,125 - Yes Yes $87,125 FY 2042 BUREAU DIRECT FUND 2008 2042 35,000 35,000 6.880% No Yes 35,000FY 2042 BUREAU DIRECT FUND 2008 2042 35,000 35,000 6.880% No Yes 35,000FY 2042 BUREAU DIRECT FUND 2008 2042 35,000 35,000 6.720% No Yes 35,000FY 2042 ALBENI FALLS 2042 2087 57,806 57,806 6.780% Yes No 57,806
Subtotal - - $162,806 $162,806 - Yes Yes $162,806 FY 2043 BUREAU DIRECT FUND 2007 2043 35,000 35,000 6.160% No Yes 35,000FY 2043 BUREAU DIRECT FUND 2006 2043 15,000 15,000 5.520% No Yes 15,000FY 2043 ALBENI FALLS 2043 2088 54,460 54,460 6.780% Yes No 54,460
Subtotal - - $104,460 $104,460 - Yes Yes $104,460 FY 2044 BUREAU DIRECT FUND 2008 2044 20,000 20,000 6.720% No Yes 20,000FY 2044 BUREAU DIRECT FUND 2008 2044 35,000 35,000 6.720% No Yes 35,000FY 2044 BUREAU DIRECT FUND 2007 2044 30,000 30,000 6.160% No Yes 30,000FY 2044 ALBENI FALLS 2044 2089 51,311 51,311 6.780% Yes No 51,311
Subtotal - - $136,311 $136,311 - Yes Yes $136,311 FY 2045 COLUMBIA BASIN 1995 2045 287 0 7.150% Yes No 0
600601602603604605606607608609610611612613614615616617618619620621622623624625626627628629630631632633634635636637638639640641642643644645646647648649650651
FY 2045 BUREAU DIRECT FUND 2008 2045 25,000 25,000 6.720% No Yes 25,000FY 2045 ALBENI FALLS 2045 2090 48,402 48,402 6.780% Yes No 48,402
Subtotal - - $73,689 $73,402 - Yes Yes $73,402 FY 2046 BOISE 1996 2046 442 0 7.150% No No 0FY 2046 ALBENI FALLS 2046 2091 45,674 45,674 6.780% Yes No 45,674
Subtotal - - $46,116 $45,674 - Yes No $45,674 FY 2047 BOISE 1997 2047 2,272 -0 7.150% No No -0FY 2047 HUNGRY HORSE 1997 2047 111 0 7.150% No No 0FY 2047 MINIDOKA 1997 2047 50,911 0 7.150% No No 0FY 2047 ALBENI FALLS 1997 2047 431 -0 7.150% No No -0FY 2047 ALBENI FALLS 2047 2092 43,118 43,118 6.780% Yes No 43,118
Subtotal - - $96,843 $43,118 - Yes No $43,118 FY 2048 ALBENI FALLS 2048 2093 40,728 40,728 6.780% Yes No 40,728
Subtotal - - $40,728 $40,728 - Yes No $40,728 FY 2049 BONNEVILLE 1999 2049 19,368 0 5.375% No No 0FY 2049 DWORSHAK 1999 2049 630 -0 5.375% No No -0FY 2049 COLUMBIA RIVER FISH MITIGATION 1999 2049 14,115 0 5.375% No No 0FY 2049 ICE HARBOR 1999 2049 5,516 -0 5.375% No No -0FY 2049 JOHN DAY 1999 2049 3,510 0 5.375% No No 0FY 2049 LOWER GRANITE 1999 2049 856 -0 5.375% No No -0FY 2049 ALBENI FALLS 2049 2094 36,747 36,747 6.780% Yes No 36,747
Subtotal - - $80,740 $36,747 - Yes No $36,747 FY 2050 BONNEVILLE 2000 2050 24,446 0 6.125% No No 0FY 2050 COLUMBIA RIVER FISH MITIGATION 2000 2050 47,006 -0 6.125% No No -0FY 2050 HILLS CREEK 2000 2050 2,630 0 6.125% No No 0FY 2050 ICE HARBOR 2000 2050 548 0 6.125% No No 0FY 2050 JOHN DAY 2000 2050 2,761 0 6.125% No No 0FY 2050 LOOKOUT POINT-DEXTER 2000 2050 5,098 0 6.125% No No 0FY 2050 THE DALLES 2000 2050 2,588 0 6.125% No No 0FY 2050 ALBENI FALLS 2050 2095 33,205 33,205 6.780% Yes No 33,205
Subtotal - - $118,283 $33,205 - Yes No $33,205 FY 2051 CHIEF JOSEPH 2001 2051 345 0 5.875% No No 0FY 2051 BONNEVILLE 2001 2051 2,530 0 5.875% No No 0FY 2051 COLUMBIA BASIN 2001 2051 69,226 -0 5.875% No No -0FY 2051 GREEN PETER-FOSTER 2001 2051 200 0 5.875% No No 0FY 2051 DETROIT-BIG CLIFF 2001 2051 282 0 5.875% No No 0FY 2051 COLUMBIA RIVER FISH MITIGATION 2001 2051 6,168 -0 5.875% No No -0FY 2051 HILLS CREEK 2001 2051 8 -0 5.875% No No -0FY 2051 HUNGRY HORSE 2001 2051 552 0 5.875% No No 0FY 2051 ICE HARBOR 2001 2051 764 0 5.875% No No 0FY 2051 JOHN DAY 2001 2051 619 -0 5.875% No No -0FY 2051 LIBBY 2001 2051 5,562 -0 5.875% No No -0FY 2051 LITTLE GOOSE 2001 2051 4,608 0 5.875% No No 0FY 2051 LOST CREEK 2001 2051 154 0 5.875% No No 0FY 2051 LOWER GRANITE 2001 2051 2,025 -0 5.875% No No -0FY 2051 LOWER MONUMENTAL 2001 2051 3,301 0 5.875% No No 0
Appendix BPage B-29

Table 13: Application of Amortization FY 2011($000s)
1
A B C D E F G H I J K
Date Project In Service DueOriginal Balance
Amount Available Rate Replacement? Rollover?
Amount Amortized
652653654655656657658659660661662663664665666667668669670671672673674675676677678679680681682683684685686687688689690691692
FY 2051 MCNARY 2001 2051 1,046 -0 5.875% No No -0FY 2051 MINIDOKA 2001 2051 61 -0 5.875% No No -0FY 2051 UNASSIGNED BOND 2001 2051 11,145 -0 5.875% No No -0FY 2051 YAKIMA-ROZA 2001 2051 15 -0 5.875% No No -0FY 2051 ALBENI FALLS 2051 2096 30,083 30,083 6.780% Yes No 30,083
Subtotal - - $138,694 $30,083 - Yes No $30,083 FY 2052 CHIEF JOSEPH 2002 2052 2 -0 5.500% No No -0FY 2052 BONNEVILLE 2002 2052 448 -0 5.500% No No -0FY 2052 DETROIT-BIG CLIFF 2002 2052 18 0 5.500% No No 0FY 2052 DWORSHAK 2002 2052 199 0 5.500% No No 0FY 2052 HILLS CREEK 2002 2052 2 0 5.500% No No 0FY 2052 ICE HARBOR 2002 2052 1,014 -0 5.500% No No -0FY 2052 LITTLE GOOSE 2002 2052 27 0 5.500% No No 0FY 2052 LOWER GRANITE 2002 2052 1,275 -0 5.500% No No -0FY 2052 LOWER MONUMENTAL 2002 2052 29 0 5.500% No No 0FY 2052 THE DALLES 2002 2052 1,226 -0 5.500% No No -0FY 2052 ALBENI FALLS 2052 2097 27,321 27,321 6.780% Yes No 27,321
Subtotal - - $31,560 $27,321 - Yes No $27,321 FY 2053 MCNARY 2003 2053 97 -0 5.750% No No -0FY 2053 BONNEVILLE 2003 2053 4,581 0 5.125% No No 0FY 2053 DETROIT-BIG CLIFF 2003 2053 223 0 5.125% No No 0FY 2053 DWORSHAK 2003 2053 761 -0 5.125% No No -0FY 2053 COLUMBIA RIVER FISH MITIGATION 2003 2053 68,440 -0 5.125% No No -0FY 2053 ICE HARBOR 2003 2053 50 0 5.125% No No 0FY 2053 LITTLE GOOSE 2003 2053 146 -0 5.125% No No -0FY 2053 LOOKOUT POINT-DEXTER 2003 2053 135 0 5.125% No No 0FY 2053 LOWER MONUMENTAL 2003 2053 22 0 5.125% No No 0FY 2053 LOWER SNAKE F AND W 2003 2053 98 -0 5.125% No No -0FY 2053 ALBENI FALLS 2053 2098 42,785 42,785 6.780% Yes No 42,785
Subtotal - - $117,337 $42,785 - Yes No $42,785 FY 2054 BONNEVILLE 2004 2054 26,741 0 5.375% No No 0FY 2054 COUGAR 2004 2054 15,748 -0 5.375% No No -0FY 2054 COLUMBIA RIVER FISH MITIGATION 2004 2054 60,581 -0 5.375% No No -0FY 2054 ICE HARBOR 2004 2054 3,321 0 5.375% No No 0FY 2054 LITTLE GOOSE 2004 2054 67 -0 5.375% No No -0FY 2054 LOWER MONUMENTAL 2004 2054 3,423 0 5.375% No No 0FY 2054 LOWER SNAKE F AND W 2004 2054 230 0 5.375% No No 0FY 2054 MCNARY 2004 2054 6,138 -0 5.375% No No -0
693694695696697698699700701702703704705706707708709710711712713714715716717718719720721722723724725726727728729730731732733734735736737738739740741742743744
,FY 2054 THE DALLES 2004 2054 182 0 5.375% No No 0FY 2054 BUREAU DIRECT FUND 2009 2054 133,238 -0 5.350% No No -0FY 2054 ALBENI FALLS 2054 2099 43,358 43,358 6.780% Yes No 43,358
Subtotal - - $293,027 $43,358 - Yes No $43,358 FY 2055 BOISE 2005 2055 903 -0 5.125% No No -0FY 2055 BONNEVILLE 2005 2055 19,725 -0 5.125% No No -0FY 2055 COUGAR 2005 2055 35,317 -0 5.125% No No -0FY 2055 COLUMBIA BASIN 2005 2055 10,963 0 5.125% No No 0FY 2055 DETROIT-BIG CLIFF 2005 2055 1,031 -0 5.125% No No -0FY 2055 DWORSHAK 2005 2055 713 -0 5.125% No No -0FY 2055 COLUMBIA RIVER FISH MITIGATION 2005 2055 52,039 -0 5.125% No No -0FY 2055 HILLS CREEK 2005 2055 46 -0 5.125% No No -0FY 2055 HUNGRY HORSE 2005 2055 2,951 0 5.125% No No 0FY 2055 JOHN DAY 2005 2055 2,827 -0 5.125% No No -0FY 2055 LOOKOUT POINT-DEXTER 2005 2055 7,355 -0 5.125% No No -0FY 2055 LOWER SNAKE F AND W 2005 2055 4 -0 5.125% No No -0FY 2055 MCNARY 2005 2055 550 0 5.125% No No 0FY 2055 ALBENI FALLS 2005 2055 481 -0 5.125% No No -0FY 2055 YAKIMA-CHANDLER 2005 2055 833 0 5.125% No No 0FY 2055 THE DALLES 2005 2055 36,019 0 5.125% No No 0FY 2055 ALBENI FALLS 2055 2100 43,962 43,962 6.780% Yes No 43,962
Subtotal - - $215,719 $43,962 - Yes No $43,962 FY 2056 BUREAU DIRECT FUND 2011 2056 170,850 -0 6.930% No No -0FY 2056 ALBENI FALLS 2011 2056 120,494 -0 6.780% Yes No -0FY 2056 BOISE 2006 2056 15 -0 4.500% No No -0FY 2056 BONNEVILLE 2006 2056 4,203 -0 4.500% No No -0FY 2056 COLUMBIA BASIN 2006 2056 1,987 0 4.500% No No 0FY 2056 COLUMBIA RIVER FISH MITIGATION 2006 2056 366,395 -0 4.500% No No -0FY 2056 LOWER MONUMENTAL 2006 2056 285 -0 4.500% No No -0FY 2056 LOWER SNAKE F AND W 2006 2056 379 0 4.500% No No 0FY 2056 THE DALLES 2006 2056 2,030 -0 4.500% No No -0FY 2056 ALBENI FALLS 2056 2101 44,597 44,597 6.780% Yes No 44,597
Subtotal - - $711,234 $44,597 - Yes No $44,597 FY 2057 BOISE 2007 2057 76 0 5.000% No No 0FY 2057 BONNEVILLE 2007 2057 1,124 -0 5.000% No No -0FY 2057 COUGAR 2007 2057 521 0 5.000% No No 0FY 2057 COLUMBIA BASIN 2007 2057 929 0 5.000% No No 0FY 2057 COLUMBIA RIVER FISH MITIGATION 2007 2057 53,525 -0 5.000% No No -0FY 2057 HUNGRY HORSE 2007 2057 294 0 5.000% No No 0FY 2057 JOHN DAY 2007 2057 233 -0 5.000% No No -0FY 2057 LOOKOUT POINT-DEXTER 2007 2057 572 0 5.000% No No 0FY 2057 MINIDOKA 2007 2057 17 0 5.000% No No 0FY 2057 THE DALLES 2007 2057 140 -0 5.000% No No -0FY 2057 ALBENI FALLS 2057 2102 45,216 45,216 6.780% Yes No 45,216
Subtotal - - $102,646 $45,216 - Yes No $45,216 FY 2058 BOISE 2008 2058 69 -0 4.375% No No -0FY 2058 BONNEVILLE 2008 2058 14,609 -0 4.375% No No -0FY 2058 COLUMBIA BASIN 2008 2058 837 0 4.375% No No 0
Appendix BPage B-30

Table 13: Application of Amortization FY 2011($000s)
1
A B C D E F G H I J K
Date Project In Service DueOriginal Balance
Amount Available Rate Replacement? Rollover?
Amount Amortized
745746747748749750751752753754755756757758759760761762763764765766767
FY 2058 DWORSHAK 2008 2058 22 -0 4.375% No No -0FY 2058 COLUMBIA RIVER FISH MITIGATION 2008 2058 37,277 -0 4.375% No No -0FY 2058 HUNGRY HORSE 2008 2058 76 0 4.375% No No 0FY 2058 ICE HARBOR 2008 2058 14 -0 4.375% No No -0FY 2058 LIBBY 2008 2058 1,652 -0 4.375% No No -0FY 2058 LITTLE GOOSE 2008 2058 14 -0 4.375% No No -0FY 2058 LOWER GRANITE 2008 2058 1 0 4.375% No No 0FY 2058 LOWER MONUMENTAL 2008 2058 42 -0 4.375% No No -0FY 2058 MCNARY 2008 2058 331 -0 4.375% No No -0FY 2058 MINIDOKA 2008 2058 0 -0 4.375% No No -0FY 2058 ALBENI FALLS 2058 2103 45,864 45,864 6.780% Yes No 45,864
Subtotal - - $100,810 $45,864 - Yes No $45,864 FY 2059 ALBENI FALLS 2059 2104 46,542 46,542 6.780% Yes No 46,542
Subtotal - - $46,542 $46,542 - Yes No $46,542 FY 2060 ALBENI FALLS 2060 2105 47,245 47,245 6.780% Yes No 47,245
Subtotal - - $47,245 $47,245 - Yes No $47,245 FY 2062 ALBENI FALLS 2017 2062 106,715 0 6.780% Yes No 0
Subtotal - - $106,715 $0 - Yes No $0
Grand Total - - $12,070,903 $9,240,762 - Yes Yes $8,463,077
Appendix BPage B-31

This page intentionally left blank.

This page intentionally left blank.

BONNEVILLE POWER ADMINISTRATION DOE/BP-3982 • February 2009 • 1C