REUTERS / Laszlo Balogh MID-MARKET M&A...
13
MID-MARKET M&A REVIEW FINANCIAL ADVISORS First Half 2016 REUTERS / Laszlo Balogh
Transcript of REUTERS / Laszlo Balogh MID-MARKET M&A...

MID-MARKET M&A REVIEW FINANCIAL ADVISORS First Half 2016
REUTERS / Laszlo Balogh
krizvi
Clairfield
* Source: Thomson Reuters/Freeman Consulting
52.459.543.717.984.371.162.858.3
100.099.1
14.410.1
Jan 1 - Jun 30Worldwide Mid-Market M&A up to US$500m by Target Nation Region
UniCredit
▲
34 25
31*
429,495.0
89*
1,261.030 ▲-
-46.5
N+1
Industry Total 21,105
31*
40*
Plutus Consulting Co Ltd
▼
-
-
Deutsche Bank
Daiwa Securities Group IncKBS Corporate Sales Ltd
CFI 38*33
31*-17
▲31.089.9
8.119
35*
1,040.6 - -25.6 ▼1,382.3 53 -
26* -2
▲
Sumitomo Mitsui Finl Grp Inc
Jefferies LLC8.5
45
-IMAP
71.6
-45
Baker Tilly International
4,812.0
-
-1926*
Raymond James Financial Inc25
44
4,361.3 18
61
12
43
52
15
3,183.328
▲
-
Stifel/KBW
0
-
▲
▼
Huatai Securities Co Ltd
30
34
33
28 -18 ▼
-
13
5
▲
57-
8,814.6
▲▲
18
55-10.3
Goldman Sachs & Co
▼ 5,468.6
94.312
20
BDO
40*952.3
243.0▼50
▲ 3021
16 ▲ 7,301.1 78.7▲
▲
0
7,939.4 4
▲12.3▼Ernst & Young LLP
87 ▲
5,597.0
16* 33
7*
Deloitte
▲ 5,660.6
14.9
1,965.6- 2,321.7
79 -101
35* 116.0
-12-39
38*
21 16 54
▼
441722
4.2-7
▼-
95.8
▲
77.5
0.8▲
69 62
▼
9
-11
-58 ▼▼
-
Credit Suisse
18*
Nomura 14*
23 ▼-35.2 44*
26* ▲29*
133.2 -▼
24
BNP Paribas SA
10 46.35
1083.9 15
26*Gram Capital
Clairfield International 29*
47
-31.4
31.8
RBC Capital Markets
Macquarie Group 29*▲
35.2
7Citi 24
▼
18* 2,266.5M&A International
29*
58 ▼17
14*
▼
36.8
Houlihan Lokey
▼ 1,484.4
-40.2
97.960
▲
80
-18
-38
63
▼▼
▼
91.211
3,894.320.5
12.757.516.7
18
▼
76.746.3
▼
44.71376.0
44.9
▲-65.9
255*60
60.7
-72.136
-39.0 4648*
27.8
Visit http://dmi.thomsonreuters.com to View Archives and Order Custom League Tables
33
7173
45.8
17.6
142*
27
44.116
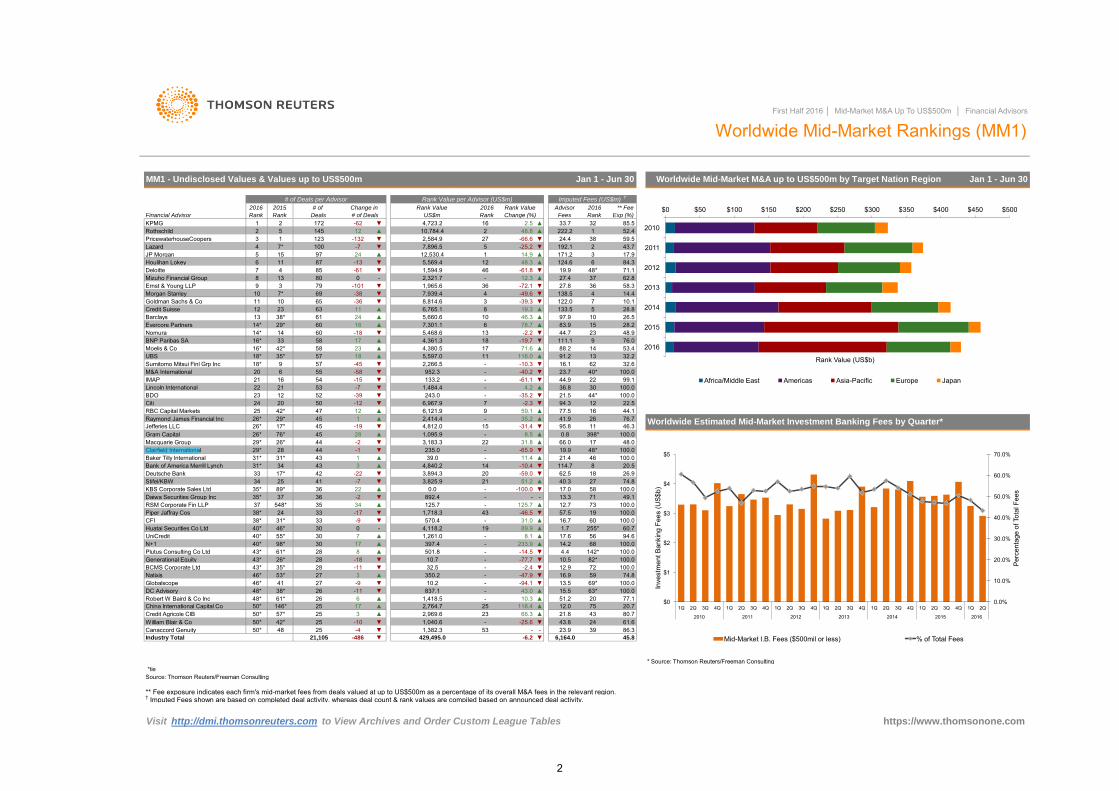
Worldwide Estimated Mid-Market Investment Banking Fees by Quarter*
48.0
26.9
5668
https://www.thomsonone.com
17.0
▲-
▼
21.4
14.2
-
570.4
▼
40.3
10.5 82*
100.0
4,840.2
25 3
-9
892.4
24
43.8
19
100.051.2 20 77.112.0 75 20.721.8 43 80.7
125.7
Source: Thomson Reuters/Freeman Consulting
10.2 - -94.1 ▼837.1 - 43.0
24 61.623.9 39 86.3
▼
4337
40* 46* 1.7
43*
25
-14.5233.9
501.8
28
40*
▲
28
1,418.5 - 10.3 ▲2,764.7 25 118.4 ▲2,969.6 23 66.3 ▲
27
-11 ▼27
100.012.9 72 100.016.9 59 74.8
8 -
-
-6.2
61*
-9 ▼26 -11
43
69* 100.0
Piper Jaffray Cos 38*
▲
*tie
74.8
100.0
6,164.0
100.0▲
▲30
▼
5836
4.4
35* 37RSM Corporate Fin LLP
100.0
4,118.255*
6
First Half 2016 │ Mid-Market M&A Up To US$500m │ Financial Advisors
Worldwide Mid-Market Rankings (MM1)
94.6
11 ▲ 6,765.1 8 19.3
6,121.9
397.4
4,380.5 1713
100.0100.0
49.1100.0
100.022.5
14
62.551.2
-100.0
17
2645
-2.2
▲
1,718.3
▲
11.4
1,095.9
2,414.4
1 ▲
60 ▼
88.2
23 48.9
53.432.232.6
-
42
35
-
▼548*
-22
16.1
100.0
12▼
76* 28
-15
21.5
45▼17*
6,967.9▲
-2.359.1
398*
9
3 ▲
7
▼
235.0 -▼-131*
2042*
19.9
41.9
-10.4-59.0
▼
125.7▲-2
1420
▼
22 0.0▲-741
36
1
▼
53▼-61.1
100.0
10.7 -
100.0
MM1 - Undisclosed Values & Values up to US$500m
# of Deals per Advisor
Rank
100 -7
1Financial Advisor
KPMGDeals
63
172 2.5Rank
16 ▲
PricewaterhouseCoopers 3 1
JP Morgan192.1
85.55 12
-66.62,584.9
1124 ▲
145
2015
222.2-132
-13 ▼97
Morgan Stanley 10
57▲
▲
14
28.826.528.2
48.37 4
Advisor 2016
Imputed Fees (US$m) †
32Fees Rank
Rank Value per Advisor (US$m)
Rank Value Rank Value2016Change in
5,569.4 12▼
▼7,896.5
-61.8
▲1
▼-25.2
48
# of
▼
Jan 1 - Jun 30
Exp (%)
** Fee
4,723.2Change (%)
1,594.9
▲
Lincoln International 22
23
10,784.4
858 13
-62▲
▼▼
6
-19.7
5 15Lazard 4 7*
27
12,530.4
48.8
▼
Evercore PartnersBarclays
-61
3
▼
26 ▲25 17 ▲
UBS▼
Mizuho Financial Group
Moelis & Co 16* 42* 58 23
2016
US$m
122.0
111.1
24.41
38
19.946
3 -39.3-49.6
-36
2Rothschild 2123
11
† Imputed Fees shown are based on completed deal activity, whereas deal count & rank values are compiled based on announced deal activity.** Fee exposure indicates each firm's mid-market fees from deals valued at up to US$500m as a percentage of its overall M&A fees in the relevant region.
26*35*53*4138*61*
146*57*42*
-486
124.6171.2
6
22
66.0
37
138.5
43*43*46*46*48*48*50*50*50*50*
Generational EquityBCMS Corporate LtdNatixisGlobalscopeDC AdvisoryRobert W Baird & Co IncChina International Capital CoCredit Agricole CIBWilliam Blair & CoCanaccord Genuity
-10 ▼25 -4 ▼
47
13.5
2
133.5
17*
98*
21
-77.7 ▼32.5 - -2.4 ▼
350.2 - -47.9 ▼
▲
15.5 63*
Bank of America Merrill Lynch 34 8114.7▼
3
3,825.9
13.3
23.7
33.7# of Deals
2Rank
9
10 6569
12
48*27.4
36
$0 $50 $100 $150 $200 $250 $300 $350 $400 $450 $500
2010
2011
2012
2013
2014
2015
2016
Rank Value (US$b)
Africa/Middle East Americas Asia-Pacific Europe Japan
0.0%
10.0%
20.0%
30.0%
40.0%
50.0%
60.0%
70.0%
$0
$1
$2
$3
$4
$5
1Q 2Q 3Q 4Q 1Q 2Q 3Q 4Q 1Q 2Q 3Q 4Q 1Q 2Q 3Q 4Q 1Q 2Q 3Q 4Q 1Q 2Q 3Q 4Q 1Q 2Q
2010 2011 2012 2013 2014 2015 2016
Per
cent
age
of T
otal
Fee
s
Inve
stm
ent B
anki
ng F
ees
(US
$b)
Mid-Market I.B. Fees ($500mil or less) % of Total Fees
2
krizvi
Highlight

2,007.6- ▲
1
4.5
▲
▲
1326
9
Visit http://dmi.thomsonreuters.com to View Archives and Order Custom League Tables
4 ▲
Alvarez & MarsalBMO Capital Markets 38*
*tie
73* 8 4 ▲88* 7 4
Stephens Inc 28
435.4
▲
-52.7
-
6*
8.7
25* -1
-75.5
21
22376.0
975.2The Braff Group 32 42* 211
▲Prairie Capital Advisors Inc
2515 -37.6
-1 23
3.0
19*KPMG
▲
7 ▲
▼
14
▼
14
-12
▼
40* -19
24
1,633.6
Cascadia Capital
RBC Capital Markets
Generational Equity
-29
28
William Blair & Co 21*
24*
29.8
-16.2
31
2.2 99*
26.6
8*Evercore Partners
14
▲
Stifel/KBW 5* 2
Lazard
▼
3,347.6
-2
2115
68.7
17
-116
▲
14▼
643.221*21*
-85.5
-46.3
▲
Citi47* 15
28.5
-18 ▼
12 21*
3,769.8
2
10.7-9
1
2,087.936
2
# of Deals per Advisor
5*
Houlihan Lokey 67 ▲4,349.6
20162015
-10 ▼
Moelis & Co
25*
84.8
16
Rank Value per Advisor (US$m)
▼
▲
49* 29
▼
42
▲4
3418 10 42.4▲
8
5,090.844
1,004.4
▲
-11
2,849.5
-4
4,230.4▼
-40.3
-17.054.6
1105.4
Jefferies LLC
Deutsche Bank 18
6*
100.0
818 74.0
59.7
Rank
2
Barclays
7
29248.9▼
▼
54.4
-
58.8
▼▲
43.2
▼
65.0
13
340.8
100.0
100.059
162.1 - 58.8
2,596.2
6.9 43 100.06.0 45* 100.0
† Imputed Fees shown are based on completed deal activity, whereas deal count & rank values are compiled based on announced deal activity.** Fee exposure indicates each firm's mid-market fees from deals valued at up to US$500m as a percentage of its overall M&A fees in the relevant region.
Source: Thomson Reuters/Freeman Consulting
24
5.120.1
-75.8
KeyBanc Capital Markets Inc
▼▲
17
51*26*
▲
▲▼-5 ▼
▲
20
6
3
2,430.6
667.1Wells Fargo & Co
18.3 ▲ 4.3 60*
33
10
-83.3150.0-
170.4▼
Duff & Phelps 33* 11* ▼
Rothschild
Chartwell Financial Advisory
55.147.532.8
▼
3
5.0
First Half 2016 │ Mid-Market M&A Up To US$500m │ Financial Advisors
US Target Mid-Market Rankings (MM2)
17.5
2,120.1
1,718.3
93.0
3,461.2
▼
2136Raymond James Financial Inc
15.0
48*
100.0
25.0
4
50.1
31.8
9.8
14
63.7
64.6
59.0 94.7
25
32.322
16
42.4
28
48.848.6
32.9
15
3
Jan 1 - Jun 30
Rank
15
Rank
2016
1
Rank Value
Fees
Imputed Fees (US$m) †
▲
Financial Advisor
Lincoln International
75.7
Deals
61.7
2,310.62
-9 ▼
5 -853.5-14
12
Rank Value
9*
-
# of
109.4
-
▼
Rank
1
3,349.2
PNC Financial Services Group
11*
Credit Suisse
9.1
20
▼
UBS
5
57
8.3
18
6
35.7
US Mid-Market M&A up to US$500m by Rank Value Range
39.6
100.0
28.5
▼
▼
7 ▲
▲
-13
77.7
2,437.5
▲
3
▼
▼
7,430.3
Change (%)
62.9
Change in
# of Deals
12
Exp. (%)
Advisor 2016 ** Fee
US$m
▲
▲0.0
1,573.09
AGC Partners
3
496.2
13.4
35*
-
38.4
717
15
202.4
14
27
124.0
43.0
-8Morgan Stanley
28.2 19
28*
▲
43*
4,588
23
▲174* 8
38* 37*
10
▲428.0
100.011.0 -
-4.1100,113.3
51*5.0
58.3
16
38*
8
-
1,535.212
43*46*
38*
33*
Macquarie Group
33*
DA Davidson & Co Inc 33*
24*
Industry Total
2950
83.3
100.0
100.0
39
US Mid-Market M&A up to US$500m by Target Industry
▲
37*
10
-
124*
100.0-20
8
47*
-
Global M&ASignal Hill Capital Group LLC
Robert W Baird & Co Inc
28.0
45.1
4
-310
▲9
33*
Sandler O'Neill Partners
PricewaterhouseCoopers
80.0
0.8
17 28*
3,223.1 9
4.6
▼13
29*
-1 ▼
21
10
12
3
16
▲
▼▲
20.0 - -85.2 ▼ 4.0 66*
37.3
79.276.0
12.7
-▲
▼ ▼106.3
-
1,685.7- -
49.4▼ 22.9
42.522
13
-
1,815.0
▲
18
38.148.2
▲0.0 - - -
100.0
76
100.0
71.7
298* 31
▲
10
11 -14.3
79
11*
92.8
18.5
37.4
26.5 42.926
66*4.0
1130
-
18
879.0 -
▼
2,451.2
385.8
5
57* 4
16
10
-6.0
10 0.0
▲
583.9
10
28*
96.2
5
▼
PJT Partners LP
-46.019
▼
34.5▲
Jan 1 - Jun 30 26*
38*
353.1
100.0
22.0
https://www.thomsonone.com
159*
24
-63.2
-28.8
810.9
57*
33*
43* 73* 8
73*
--
58
▼9
179.1
20
▲
▲ 141.4
29* 47*
20 -55.4-5
18.468.0
▼
7.4100.0
100.0
87.5
JP Morgan
-
163.2
42* 8
16
19*
21*
29*
Canaccord GenuityCain Brothers Co.
12
Bank of America Merrill Lynch
Piper Jaffray Cos 9* 4
Goldman Sachs & Co
Stout Risius Ross Inc
▲
-
-
-1
-25.2
16 15 ▲37
6
-
-
MM2 - Undisclosed Values & Values up to US$500m
▼
-1
100.0
▼
10
Mizuho Financial Group 46* 88* 7 4 ▲Greene Holcomb & Fisher LLC 46* 28* 7 -7 ▼Centerview Partners LLC 46* 66* 7 2 ▲
-531 ▼
204.3 65 -65.0 ▼0.0 - - -
1,233.8 24 55.2 ▲
3.2 80 100.03.5 75* 100.028.9 23 13.8
-
500
1,000
1,500
2,000
2,500
3,000
$0
$10
$20
$30
$40
$50
$60
$70
# of
Dea
ls
Ran
k Va
lue
(US$
b)
US$0 - 50m US$50 - 100m US$100 - 200m US$200 - 500m
16.7%
14.7%
13.1%
12.3%
8.6%
8.2%
7.8%
6.7%
4.2%
3.3% 2.3% 2.1%
Real Estate
Energy and Power
Financials
High Technology
Healthcare
Consumer Products and Services
Industrials
Media and Entertainment
Materials
Consumer Staples
Retail
Telecommunications
3
krizvi
Highlight

0.0 32* - -33* 2
Industry Total 521 -113
1 ▲6* 2 -4 ▼
▼
MAGMA Brasil Consultoria Ltda 16*Arab Banking Corporation 24* 17*
12*
14
17*
9.813.3
16*
32*
▲
91.6
92.664.6
- 22-3
32* -
--
41
Rank
556.9
5
2 -1 ▼3 3
Latin America Mid-Market M&A up to US$500m by Target Industry Jan 1 - Jun 30
0.0 32* -
18.2
12*
33*▼
1.6 -3
-
37
3
0
15-
3
-
*tie
24*PricewaterhouseCoopers
Latin America Involvement Mid-Market Rankings (MM17)
24*
8.5100.0
16*
-
4▲
Rank
MM17 - Undisclosed Values & Values up to US$500m
IMAP
Rank Value2016
▼ 2
Exp. (%)
** Fee
-
69.0100.0
Change (%)
- -
Advisor
12.3
5.5.5
-
4
33.3
2.9
2016
Jan 1 - Jun 30
▼
5.38
638.6
21
4
-
40.1
100.0100.0
9
35*
100.0
55.9
20.0
100.0
16
-
24UBS
60.6
10*
-9
33.9-
Deals
15
-
-
Rothschild
1*
-1 ▼4
-1Morgan Stanley 0
252.2
7.92.0
52.014*
2
43
Lazard 5*
▼
5
2016
# of Deals per Advisor
13
▼
# of Deals
-3
Rank Value per Advisor (US$m)
-70.9
Rank Value# of
32.4
388.3
12* 0.0
10*
16*
212.9
100.0
1.3
▼
27.1
-32*
13
▼
21
8.2
5.0
-13.7
-
1.6
3
▼▼ 5.6
3.1
-
5
▼
-
▲
KPMG
100.0
-44.0
-
7
-22.0▲
35.0
16*
4
53.26.6
▼
4*
https://www.thomsonone.com
53.3
18 -0.2 18 3.7
32*
100.0
Imputed Fees (US$m) †
50.0
1.0 18 100.0▲
▼
0
71,306.9
▼
First Half 2016 │ Mid-Market M&A Up To US$500m │ Financial Advisors
Fees
17.1
Latin America Mid-Market M&A up to US$500m by Rank Value Range
4* 6.6
▲
-
7
1
▲ 312.3
▲ 3.7▲
0
0
▲
** Fee exposure indicates each firm's mid-market fees from deals valued at up to US$500m as a percentage of its overall M&A fees in the relevant region.† Imputed Fees shown are based on completed deal activity, whereas deal count & rank values are compiled based on announced deal activity.
10,979.7 -9.2
17*
16
32*
2015
▼
Change in
3
27*
Financial Advisor
Banco BTG Pactual SA
17*
Itau Unibanco 13
11
18
-14.4
5*
10*
5 ▲
10*
6
5-3
BNP Paribas SA
6
-89.3
▼ 3
12
5*BBVA
10*
5* 2 64.6
-13.6
6*
111.4
-25*
0
2-
77.8
Banco Bradesco SA
Clairfield International
Credit Suisse
Greenhill & Co, LLC
5
3 -54.9165.9
12*
17* 3
Deutsche Bank
4
Rank Rank
27*
6*
1
6*
0
-
9.1
-1
Santander
Moelis & Co
M&A International
1428.7
53.5▼
141.9
-
156.1
16*0.0
-Artica Participacoes e Assesso
-0.010* 810.3
BR Partners0.0
16*
-1 ▲
▲
Bank of America Merrill Lynch -3 0.02 -
▲
JP Morgan
1.3
4
1*1,161.8
US$m
-
8
444.41974.9
▲
2
32*
15.8
▲-1
1
6*
5* 0.0
-
0.0
Visit http://dmi.thomsonreuters.com to View Archives and Order Custom League Tables
1
5
Citi
Source: Thomson Reuters/Freeman Consulting
9
16*
3
0.1 18 100.00.9 18 100.0
Evercore Partners 24* 12* 2 -2 ▼CFI 24* 17* 2 -1 ▼APOYO Consultoria SAC 24* - 2 2 ▲
255.0 9* 14.6 ▲7.8 31 -97.6 ▼24.8 - - -
1.5 18 100.0
-
50
100
150
200
250
300
350
400
450
500
$0
$2
$4
$6
$8
$10
$12
$14
$16
$18
# of
Dea
ls
Ran
k Va
lue
(US
$b)
US$200 - 500m US$100 - 200m US$50 - 100m US$0 - 50m # of Deals
28.0%
20.6%
12.3%
7.2%
6.7%
6.2%
6.1%
4.5%
3.2% 2.1%
2.0%
Energy and Power
Materials
Financials
Consumer Staples
Industrials
Real Estate
Media and Entertainment
Consumer Products and Services
Telecommunications
Retail
Healthcare
High Technology
4
krizvi
Highlight

William Blair & Co 51* 62* 13 3 ▲
*tie
▼
19
▲
19.8
11
-58.6-
▲554.2
4.6
22
-44.3
Source: Thomson Reuters/Freeman Consulting
HSBC Holdings PLC 51* 56* 13 1 ▲ 1,543.4 1,375.7 17 29.2 ▲ 20.5 19 58.1
19
▼
19*
41* 23
-7
29*Credit Agricole CIB
39
25*
▲
Industry Total
Citi
Kon SpA
19*
Clearwater International
Houlihan Lokey
45* 14 -1
0
35*
Morgan Stanley
▼
▲
▲
75
6
31*
3
▲
▲35
2,405.9
25
70*41*
54
▼
14
-89.8
41*
Rank Exp. (%)
▲
5
3
European Mid-Market M&A up to US$500m by Rank Value Range
-132
3,855.6 3,469.62,817.9
3
First Half 2016 │ Mid-Market M&A Up To US$500m │ Financial Advisors
1,373.7
51*
▲
Jan 1 - Jun 30
35
100.080.4
100.0
▼
1
33
▼
75.410.0
17 -5 ▼
-
European Mid-Market M&A up to US$500m by Target Industry
22.4
120.2
100.0
- - 22.5 16 100.0- - 14.7 41 100.0
100.0
Jan 1 - Jun 30
876.223
42
3,908.6
0.0
7.6
11.5 10.4
10
7
28.4
44.3
56.4
16.9-47.9
▼5.7
37IMAP 9
Ernst & Young LLP 6 -8057
18
Change (%)
▲1,414.2
** Fee
15.7
-24.015.5
▲ 29.1
34*
7
397.4 356.128
19.2
5
50.6
▲ 2010 23*
40.9
-98.6
▼2,808.2
Advisor
1
Evercore Partners
41*
337.0 101*
739.6 655.0 - 161.9 ▲
20.2
-6 ▼
1,289.447*
▲
La Compagnie Financiere
106,328.7▼
16-9 -88.7
Deutsche BankBenchmark InternationalCarnegie
-CBRE Holding SAS 55 81* 12 5
12.7 4817.0
-
Rank Value per Advisor
Rank Value
▲
41* -
▲ 1,084.4 986.4 -
881.7 29▲
Financiere Cambon
Altium Capital Limited
13 1
63
Visit http://dmi.thomsonreuters.com to View Archives and Order Custom League Tables
Rabobank NV
60.2
Panmure Gordon & Co Ltd
13Jones Lang LaSalle Inc
Livingstone Partners100.0
47* 51* 14 1 ▲45*
7.8
1,383.6
29.6
77.2100.0
72*▼
-26.4 ▼951.8 836.8
17
Global M&A 60*26.051*
41* 16
8.1
1,237.3
▼
21
36.2
-
20*
35* 49*45*
18.26.6 72*
-85.0 ▼
1,418.3
▲
414.8 373.5
278*
822.9 --85.8
17.9
100.0
28
48.4
299.1
-
- 494.114 -2 ▼
118,814.2
-
16.6 36* 51.217.9 29 67.8
▲32* 13
--3-10 4
993.4
▲
▲
-
615.5
1,870.4
28.7
12
34.7
5141.4
100.015.5 38* 31.415.5 38* 97.5
▲
8
138.3
▼
3.4
4.4
37.427
17
4.1 94
▲
37*57▼
31*921
20
0.0
1,416.8
6.6
53.5
▲-
▼
▼
-11
2045*
▼
45*45*47*
331.3 296.8 80 -88.6 ▼16.6 14.8 - -
-
16
31*
37*
91
▲
▼
-62.2
21 13.8
25
17
9
12.2
8.4
0.0
18.1
▲2140
4.1
34*
22
12.2
21
23*
25*
23*
▲
59
18.5
740.461.5
▲
15
9.0
100.0
16*
-
5
3
3
13*
743.7
5.2492.2
6
52.1
3513.3
UniCredit
N+1
▼
94.6
49*
-12.7233.9
1,285.7
-
20*29
36
10
Jefferies LLC
547.62,969.6
▼
19
▼
13.7
-1111*
1▲ 75.5
▼
▼12.9
-
19*
18
31*
69.429.4
31
44
26
13
32
2,680.6
-7
30
▲
▼
2015
MM3 - Undisclosed Values & Values up to US$500m
96.6
19
-22
14.4
50
1
1,154.6
15
M&A International-
-62.3 ▼
87.4
278*
100.0
11*
219.5
-
155.3
22
▼
8
-1
-
56*74.8
-
151
JP Morgan
16
Deals
PricewaterhouseCoopers
100.0
▲
2
19*42
22
170.7
-12.5
34
117.3
12
16.6
1,035.9
Rothschild
103.5
14.2
63 33
▲
41.4
19
▲
2,519.2-85.3
8▲
2836.4
--
7
▲
100.0
5100.0
1,261.0
15.2-
-45.5
Lazard
27
42.917.68.1
16
6Deloitte
Credit Suisse 16* 34*▼
-
100.0KBS Corporate Sales Ltd
9 -2
17.2
▼-10
3
16
Baker Tilly International
5
-9
21.3UBS
100.047
47*
8,409 ▼
-1 ▼41*
▼
122.2
100.0
20.6
50
30.8100.0
-39.1
https://www.thomsonone.com
112.4
2,669.9
Banca IMI (Intesa Sanpaolo)
▲93 34
BDO
RSM Corporate Fin LLP
6▼
▼837.113*
100.010.7 53 100.0
1,150.6 22 -1.9 ▼1,982.9 1,755.1 12 27.9 ▲151.2 136.7 116
14
6
BNP Paribas SA
CFI
NumisMacquarie Group
▼
17.443.0
100.0
-
▼
-15.3
11*36
8
24*Barclays
▼
7
-
15.5
26
▼
38*
Globalscope
2413*
25*
28
5,380.4
3,495.1
▼
▲
▲16.7
▼
Bank of America Merrill Lynch
Lincoln International
26* 30
27
63.6
76.0
133.2100.0
785.8
▲43.110
-23
146.8
230.13,129.6
2,717.4
51*51*
-4.9
25.5
11
-2,970.2
Rank Value
11*
Euro mil
3,422.9
246.5
3,073.77,707.5 6,879.81,580.1
4,844.9
207.1
50.2
1,289.9
1,476.8 1,315.2 ▲1,571.2
62* 15 5 ▲▼
20*
1520*
27
18
15 10
▲
9
-32
-
1,666.0
29* 29*
▲
55.9-54.9
18 43.251*
Rank
KPMG
-83 ▼122
11.0
▲
0.0125.7
▲
▼
20162016
Financial Advisor
2016
NomuraING
56*
† Imputed Fees shown are based on completed deal activity, whereas deal count & rank values are compiled based on announced deal activity.** Fee exposure indicates each firm's mid-market fees from deals valued at up to US$500m as a percentage of its overall M&A fees in the relevant region.
# of Deals per Advisor
# of Change in
Rank
67-66.5
-32
Natixis
33
European Involvement Mid-Market Rankings (MM3)
# of Deals
Imputed Fees (US$m) †
Fees
1 135 17.5
Clairfield International
US$m
5
2
DC Advisory
▼
Rank
Goldman Sachs & Co
16*
4
4
52
302,576.2
13*
97.351*44.6
1,132.0
▼
26
▼
4
311.0
-65.8
48.6
31.5
7
43
-23.6
2,298.6
▲
920.9
167.2
BCMS Corporate Ltd
-77.0
100.0
-
100.0
-350.22,171.0
112.6
320.731.9
-36*-
-24
55.1
1,522.0
-
11.0-
100.0
62* 12 ▲29*
6
25
-1216
26* 15 -8
-
500
1,000
1,500
2,000
2,500
3,000
3,500
4,000
4,500
5,000
$0
$10
$20
$30
$40
$50
$60
$70
$80
$90
$100
# of
Dea
ls
Ran
k Va
lue
(US
$b)
US$200 - 500m US$100 - 200m US$50 - 100m US$0 - 50m # of Deals
16.1%
13.9%
10.8%
9.9% 9.2%
9.1%
6.6%
5.6%
5.5%
5.4%
4.6% 3.3%
Real Estate
Financials
Industrials
High Technology
Energy and Power
Consumer Products and Services
Healthcare
Materials
Retail
Media and Entertainment
Consumer Staples
Telecommunications
5
krizvi
Highlight

** Fee exposure indicates each firm's mid-market fees from deals valued at up to US$500m as a percentage of its overall M&A fees in the relevant region.
65*
609.3
24
1
Credit Suisse
N+1
Rank
27
36
finnCap Ltd
Citi
1*
1,936
UBS
KPMG
UniCredit
DC Advisory
PricewaterhouseCoopers
M&A International
Lazard
BCMS Corporate Ltd
9▲
-3▲
Clearwater International
▼563.5
-
▼
14
-58.6
Barclays
Rothschild
▲
▲
▼
36.2
▼
▲5 125.3
17.3
▼
-
▲338.0
18.1
-
-
2
▼-
Rank Value Rank Value
Deals
987.9
-
1*
11
-8
1,020.9
167.7
https://www.thomsonone.com
828*
74.9
Catalyst Corporate Finance
Altium Capital Limited23*
6
Bank of America Merrill Lynch 20.6
109*.8
Jan 1 - Jun 30
▲
# of Deals per Advisor
Industry Total
Baker Tilly International
9*
846.4
24.2
10.2
8 ▼
▲
8
963.9-152
2.9
▲
91.2
13
280.6
▲
23* 54*
22*
100.0
43*
Visit http://dmi.thomsonreuters.com to View Archives and Order Custom League Tables
▼
62.9 43.9
54*
23.7761.574.4
6.9 30 100.01.9 78*
-33.67
39,282.6
Ernst & Young LLP
13*
11*
-79.7
17306.0
22*3
28*
451.6
9
▼-5
1
283
† Imputed Fees shown are based on completed deal activity, whereas deal count & rank values are compiled based on announced deal activity.
126*
▼
▲
100.0
5
▲
56.7
** Fee
21
Benchmark International
KBS Corporate Sales Ltd
▼
37*
44*
195.3
UK Mid-Market M&A up to US$500m by Target Industry Jan 1 - Jun 30
100.0
-2
First Half 2016 │ Mid-Market M&A Up To US$500m │ Financial Advisors
▲▲
Fees
18
0.5
1,080.322*
17.0
88*
423.2
- -73.8 ▼
17.08.4 25*
100.0
824.1
6
-94.7103*5.8
12.3
-
2
3
-13.8
Panmure Gordon & Co Ltd442.0
-2
-13.529.6 20.8
14.1 10*
▲
0.0RSM Corporate Fin LLP
# of
17
-7-1
16*
BDO 5 5
12
6
16*28*43*
100.0▲
Evercore Partners
3 ▼
-81.810.2
23
US$m
100.031
-
22
11
17.9
7
▼
-
▼Change (%)
-72.5
16
42*2213.8 9.6
303.3
18*
32
11
-3
▲ 20.4
485.0
335.3
7.6
18.8
▼
1,168.7
-6
▲▼-1
100.0
▼
19.7 13.7 1.7▼
▲
▼▼
45.0 - - -
19.3
6 46.6
10*15.4
38 -58.8 ▼
118.1 ▲
100.0
269.3
27,472.4
16* 5.21.1 98* 100.00.4 196* 100.08.5 24 15.712.0 19 91.64.7 42* 100.0
100.0
28*4.0 49* 100.0
0.0 - - -353.5 249.9
60* 100.062.1
- 3.0 60* 100.02.1
14.4 9 100.0
35.4
100.012.7
233.223*
6
33.9
6.2
3
-39.3
139.9 95.9 - 1195.4 ▲
23*
197.8 ▲
62*
7.6400.9 -28*
28*
▲162.3
26.0
-20 24.8
0 -
8 037*
11.2
14.19.3
1,564.6 ▼
14.1
-71.4
8
9*
29
6*▼ ▼
-67.254*82*
4.528*
2
8 4
476.7
11
-60.6
34*
52
555.9 23
11*
▲
8
14
▲
17
4
65.4
100.0
31.3
JP Morgan
Rank Value per Advisor
Financial Advisor
47.5# of Deals
Imputed Fees (US$m) †
100.0
4
6.1
▲
2016
116*-81.3
62*
Change in
11*22*
1.6
-85.4
85*
15
100.0100.0
34*
211.9
GBP mil
11*
7.5
20*
13.1
22
Rank
27
29
8-
16.6
▼
-18
▼
7 8.0
6.1
- 328.7 ▼1,183.2
11.7
3
-
▲
UK Mid-Market M&A up to US$500m by Rank Value Range
23
2.2 67*▼
▲23
832.6
11*4.7
14.843.5
-
90.9
2,245.8
16*
1,600.6
-
2016
-25
20
22.3
100.0
100.0
97.4
▼
34
69.13.830
▼
Exp. (%)
100.0
22 128*16* 11
116*
UK Involvement Mid-Market Rankings (MM4)
1
Advisor2016
52
11
2
10*
988.035
MM4 - Undisclosed Values & Values up to US$500m
48.1
Rank
362
23.3
▲
Rank
-82.3
4
-4
14*14*
-
-
-130.5
1,470.4
699.5482.8
16*
125.7 87.20.0
2015
Lincoln InternationalClairfield InternationalGoldman Sachs & CoInvestecWH Ireland LtdDeutsche BankBNP Paribas SAPeel Hunt LLPHSBC Holdings PLCCenkos Securities PLC
42.9
-
64.9 71 36.811.2 20* 55.43.0
▲▲▼
7 -337* 7
*tie
Source: Thomson Reuters/Freeman Consulting
-
23*
▼-
▲▼
9
56.8
107.9
-▲
-6.4
3.6
473.0
▼
▲▲▼
- -93.6 ▼
-38*38*38*
117.0 81.0
568.4 399.2 22 2471.9 ▲0.0
-
Fenchurch Advisory PartnersRBC Capital MarketsNatixisJefferies LLC
22* 8 -218* 8 -534*
▼- 406.1 287.5 35 -53.6 ▼
▼
44*44*44*
▲▲▲
80.5 56.4
382.8
▲
054* 7 388*
342.6 238.6
36*
Houlihan Lokey
-26.89
1
2.9
2,239.3
134.6
12329.6▼
12.7
Hoodless Brennan & Partners
806.1
100.0
16* 16Deloitte
4.5
8
100.06
521▲
10
0
▼-
4.2
685.1
-
▼
9 610.7
39.5
16*
4
-4
5
▼6*
8 18 8
28*28*28*28*28*38*
54* 6 2
38*44* 6 4
116* 6 5
38*
65* 6
14 -
477.0 335.1Livingstone PartnersMacquarie Group
39 6 -13
-1247* 7 254* 7 334* 7 -122*
44*
Numis
1,210.4
Morgan Stanley
296.0 206.7
0.0
4 -65.1680.2 467.5 17
90.6 ▲
9
821.3
64.5
78 -94.4 ▼0.0 133* -
-21.6
-
200
400
600
800
1,000
1,200
$0
$5
$10
$15
$20
$25
$30
$35
$40
# of
Dea
ls
Ran
k Va
lue
(US
$b)
US$200 - 500m US$100 - 200m US$50 - 100m US$0 - 50m # of Deals
21.0%
13.7%
10.8%
9.8%
9.7%
8.8%
5.8%
5.6%
4.9%
4.2%
4.2% Real Estate
Financials
Consumer Products and Services
Energy and Power
High Technology
Industrials
Consumer Staples
Retail
Materials
Healthcare
Media and Entertainment
Telecommunications
6
krizvi
Highlight
9
17,586.1 -8.9▼
-▲ 651.9
24* 5▼ 1.8
43*
0.0
-
0.4 49*
Goldman Sachs & Co
1.6
-
100.09.4
8
43*
† Imputed Fees shown are based on completed deal activity, whereas deal count & rank values are compiled based on announced deal activity.
Source: Thomson Reuters/Freeman Consulting
5.00.0
CBRE Holding SAS
5
18*0.9
▲
-
Linkers
-1
-13
-7
▲Deloitte
# of
9
11*
11.9
▼
3.5
-72.5
6
Rank
▼
0.7
1
-11
1.2
6*
1
# of Deals per Advisor
24
UBS
200.0
52
▼
JP Morgan -35.1
Euro mil
6
9
-2
▼10
524* 2
▼Jones Lang LaSalle Inc
Clairfield International
383
11*
1,010.4
-
First Half 2016 │ Mid-Market M&A Up To US$500m │ Financial Advisors
2
60.0
-
0.0
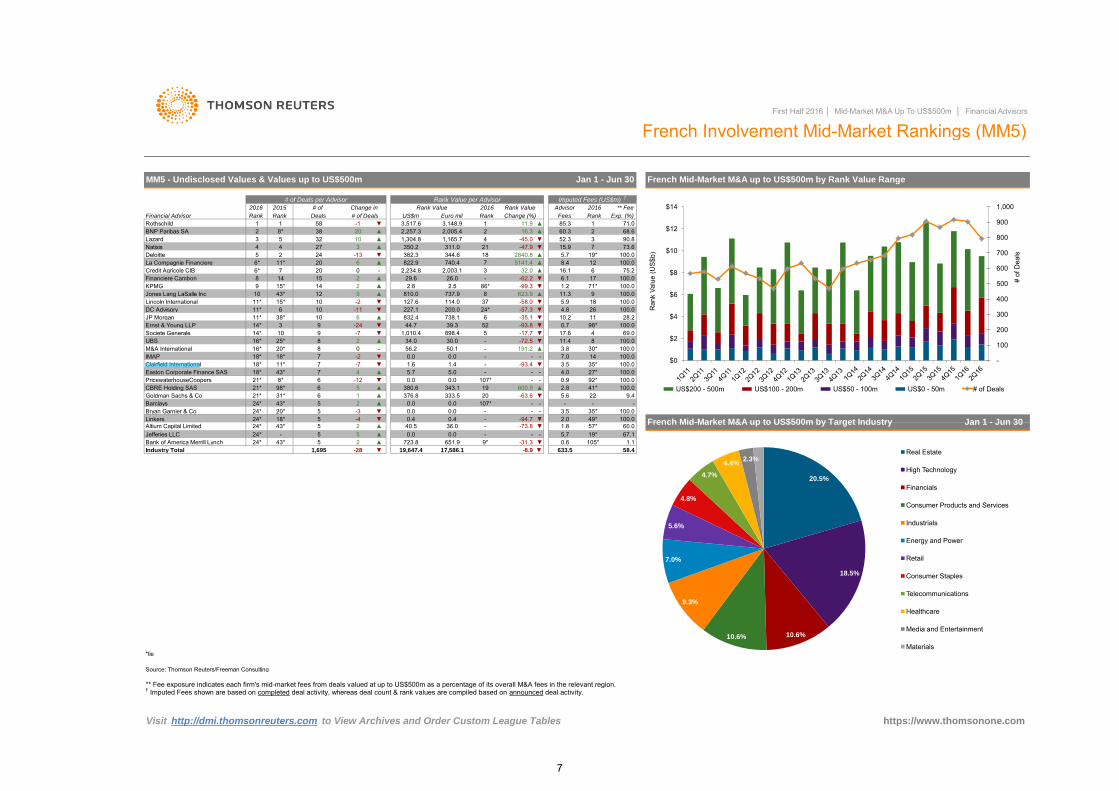
MM5 - Undisclosed Values & Values up to US$500m
▲
▼
20
71*11.3
10 ▲▼
16*
9
36.0
24*
Rank
11*
▲
11
▲
0.0 -
40.5
4.0-93.4
2.0
15*
344.6
18*
2
▲
12
71.0
▼
Visit http://dmi.thomsonreuters.com to View Archives and Order Custom League Tables
0.0
▲18
IMAP
5.721*
19,647.4
7
-17.7
20*
30.0
31* 6 376.8
7 14
4
4
600.9121*
-7
-
52.3
24* 18*
2.8
24*
10
740.4
-
285.3
2.8
▼ 0.4
810.0
4.8
73.6
▲
-4
▼
17
Rank Value per Advisor
▲343.1
0.03.8-
27*107*
14*
18*
11.4▼
5
1.1105*
▲
86*
37
100.0
https://www.thomsonone.com
*tie
French Mid-Market M&A up to US$500m by Target Industry Jan 1 - Jun 30
Barclays
2
** Fee
French Mid-Market M&A up to US$500m by Rank Value Range
French Involvement Mid-Market Rankings (MM5)
Advisor 20162016 Rank Value
26.0
66*
▼
▲
274
10.2
100.0100.0
5141.4
-62.2
1
6.1
▼
2840.8
127.6 114.0-57.3
1
623.9
19*
37
18*
▼
-47.9
10
0
▲943*
5
1,304.8 1,165.7 4
Change in
-45.016.3
2
2,005.42,257.3
311.0350.2
▲
▲3
-
227.1
20
3▼
-2
2015
8*
815*
▲
18
2015
100.0
29.6
32
3,517.6
Jan 1 - Jun 30
4
14
Rothschild
Industry Total
-
17.62
107* -
16*
5▼
5 ▲ 380.6
▼
100.0M&A International
6
5
- -
PricewaterhouseCoopers
-La Compagnie Financiere
Financial Advisor
Societe Generale
3.5100.0
Altium Capital Limited
898.434.0▲
39.3
226
Bryan Garnier & Co
38*
0.0
44.7▼
25*
14*
-3
0.6▼723.81,695
9* -31.358.4-28 633.5
11*
5
35*
92*
0
24*
98*-
▲41*
▼
333.5
-24
Lincoln International
56.2 50.1
10
Deals
2
6
382.3
738.1
3,148.9
212
Imputed Fees (US$m) †
Rank Value
Lazard
8
16.1
24*
2.5
DC Advisory
737.9
822.9
8
▼
2016
Rank # of Deals
714
8* -12
8
100.0
98*
-
19*
-
5.9
35* 100.0
69.0
100.07.0
- - -
20
100.0
8.4
US$m
BNP Paribas SA
Natixis
Ernst & Young LLP
Credit Agricole CIB
KPMG
-
21*
▲191.2
10-
43*Easton Corporate Finance SAS
0.0
11*
20*
5Jefferies LLC
6
3
▲ 0.0
Exp. (%)
72,234.8 2,003.1
Change (%)
215
▲
15.9
43*
2 ▲
1.47
▼
58
Bank of America Merrill Lynch
Financiere Cambon
** Fee exposure indicates each firm's mid-market fees from deals valued at up to US$500m as a percentage of its overall M&A fees in the relevant region.
-63.6 ▼
-93.8
67.1
30*
832.4
0.0-
▼-
26▼
Rank
5.6
-94.7
19
-
5.7
75.2
100.0
-58.0
Fees
100.028.2
100.0
100.0
68.660.3
- -73.8 57*
▼
5.7
100.032.0
90.8
100.0
-99.3
-
100
200
300
400
500
600
700
800
900
1,000
$0
$2
$4
$6
$8
$10
$12
$14
# of
Dea
ls
Ran
k Va
lue
(US
$b)
US$200 - 500m US$100 - 200m US$50 - 100m US$0 - 50m # of Deals
20.5%
18.5%
10.6% 10.6%
9.3%
7.0%
5.6%
4.8%
4.7%
4.4% 2.3%
Real Estate
High Technology
Financials
Consumer Products and Services
Industrials
Energy and Power
Retail
Consumer Staples
Telecommunications
Healthcare
Media and Entertainment
Materials
7
krizvi
Highlight

Lincoln International
-1
14*47*
17
▲
Advisor
Imputed Fees (US$m) †
Change (%)
11
Rank Value
Rank
1Globalscope
Rank
Deloitte
6*Mummert & Company
100.0
100.0
15*
100.0
140.0
100.0
100.0
24* -80.4
18* 111.7-
5
-7 ▼
0.0
52.5
-DC Advisory
▼
# of Deals per Advisor
2015
Financial Advisor
15*
61.7 --IEG-Investment Banking
▲
Rank
6
Deals
6*
-18
22
10
ACXIT Capital Partners
2
5*
47*0.0
1
3.4
69*45*
38*
18.1
1,560.5
-
14,630.6
4
3Bank of America Merrill LynchClearwater International
Berenberg Bank
-15* 21*
15*24* -
2.0
- 0.0 0.005-5
▼
-80.2
196.0
0
100.0
72.70.8
3.4
1.2
▲9
▲
10.0
81.7
-
2016
4718
2016
4*
44* ▲
-
28
- 100.0
-
2.1-
24*
1,392.8
12
-
-
# of
Exp. (%)Fees
† Imputed Fees shown are based on completed deal activity, whereas deal count & rank values are compiled based on announced deal activity.
- 1.4
11
-20.0
Deutsche Bank
BDOClairfield International
17.7
-
21
8.8
0.0
Rank Value
▲
100.0
100.0
3
PricewaterhouseCoopers
-
Rank
63.9
12*
11*
-
12.4
-
3275.86.0
34
BNP Paribas SA
-45.4
836.3
36.0
-
30.040.5
-
7.0
Change in
2
100.0100.0
34.7-
8
3.2
40.5
1.5
187.7
-
▼
4
1.0
▲
100.0
Jan 1 - Jun 30
Rank Value per Advisor
MM6 - Undisclosed Values & Values up to US$500m
1US$m
Ernst & Young LLP
8
-
7Commerzbank AG
KPMG
15*
25
▼▲
47*
-91.3 22 53*
First Half 2016 │ Mid-Market M&A Up To US$500m │ Financial Advisors
4.2-
19
7
0.0▼▲
1576.1
IMAP
--
97.6
65.3
** Fee
7*29*24*
14*11*
180.0
35
50
0.0
7397.0
-
17.9 16.5
German Involvement Mid-Market Rankings (MM6)
2.5
3.9
▼100.0
6▼
-
-
10
6
-64.9
37
6
-
100.0
10
Euro mil
5.50.014 0.0
110.6
-
0.0
▲▲
0.0
16.0
0.0100.0
German Mid-Market M&A up to US$500m by Rank Value Range
19*120.1
# of Deals
Rothschild
21*
44*
100.044*
15*Altium Capital Limited
Concentro Management AG
3.3
2016
4 1126.6
-
1
-
-
-
445.3
-21 -71.0
-2 55.0
--5
8
72.0 64.3
5.2▲
44*
635.4
1
-
23.0
▼
▼
0.0 -
▲
-
86.2
8
8
Source: Thomson Reuters/Freeman Consulting
17JP Morgan 60*
909.4
-
-185
-
100.0
74.4100.0
- 100.0
7*
33
-
0.0
1.7
20.2
3
Baker Tilly International
16.440*
22
20
51*
44
German Mid-Market M&A up to US$500m by Target Industry Jan 1 - Jun 30
2.9
15*
15* 18*
** Fee exposure indicates each firm's mid-market fees from deals valued at up to US$500m as a percentage of its overall M&A fees in the relevant region.
268.3 239.034.1
4 -5
5 ▲
421*
13,122.8
13* 15*
4
2.2
62.21,082Industry Total 416.2
▲
-92 ▼
▼4
-
▼▲
UniCredit
4.9
*tie
https://www.thomsonone.com Visit http://dmi.thomsonreuters.com to View Archives and Order Custom League Tables
7* 8*
3
15*
26.0
Lazard
-
7*
2
▲
5
11
▼
15*
5
45* ▼
8*
5
13* 12* -160
-4
13
-
125.0 24*
▼4.6
126.24*
24* 44*
Global M&A 24* 21* 4 0 -Network Corporate Finance 24* 33* 4 1 ▲N+1 24* 21* 4 0 -Credit Agricole CIB 24* - 4 4 ▲Credit Suisse
- -140.1 123.0 16 - -737.4 674.0 3 - -313.6 288.0 9* -18.1 ▼
0.0 0.0 - - -
3.5 23 100.01.0 53* 100.05.4 16 100.05.5 14* 100.03.0 32 30.02.0 40* 100.0
4 2 ▲M&A International 24* 8* 4 -5 ▼
0.0 0.0 - - -25.2 22.3 -
-
100
200
300
400
500
600
700
800
$0
$2
$4
$6
$8
$10
$12
# of
Dea
ls
Ran
k Va
lue
(US
$b)
US$200 - 500m US$100 - 200m US$50 - 100m US$0 - 50m # of Deals
33.1%
18.4% 7.8%
6.9%
6.1%
5.2%
5.0%
4.3%
4.3%
3.9% 3.2%
Real Estate
Industrials
Financials
High Technology
Healthcare
Materials
Retail
Consumer Products and Services
Energy and Power
Media and Entertainment
Telecommunications
Consumer Staples
8
krizvi
Highlight
*tie
5.369.0
- - - 0.5
5.6
48*0.5
20
- - -5.2
40*
15*1,383.3
723.8
2016
# of Deals Change (%)
902.6
3-
▲
3
100.0
▼
65.4
29
Rank Value per Advisor# of Deals per Advisor
22
3
121,766.8
▲
Deals
4
329.8-
32
100.0
14.5
▼ 0.0 0.0
15.5 97.5
82.38*
7
14-31.6
28 -70.0
-
122.1
13
▼
2015
-
205.4
4
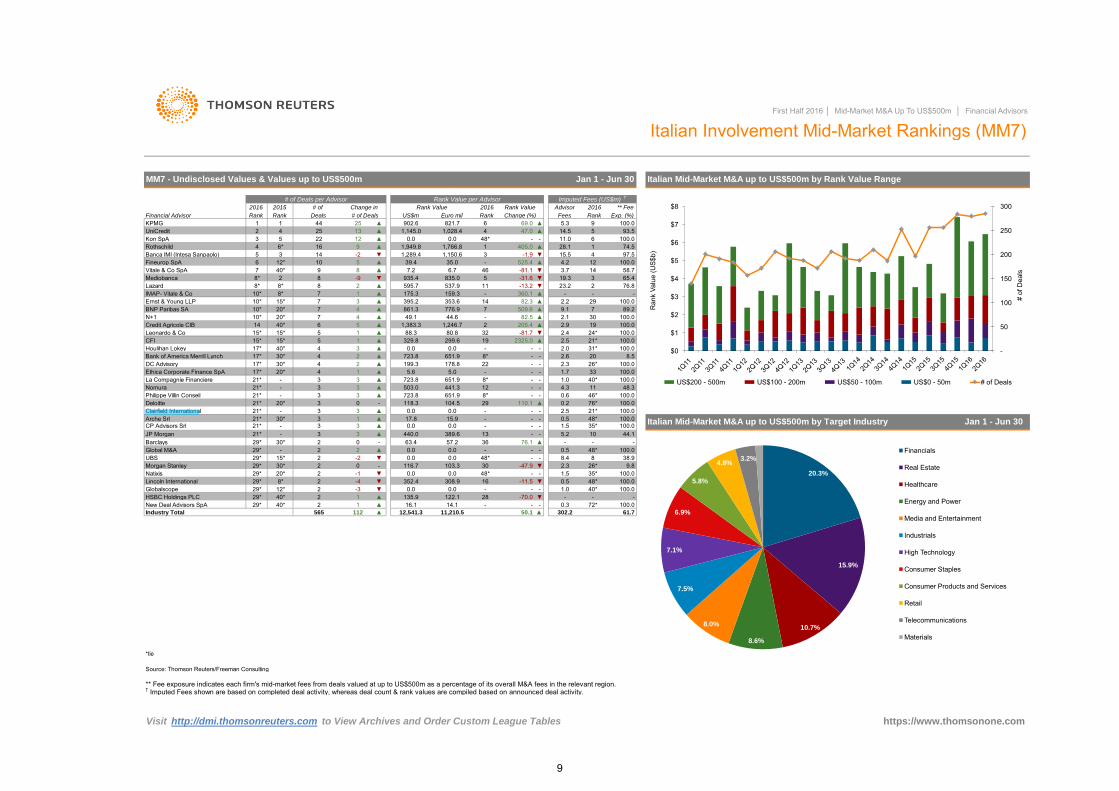
Italian Involvement Mid-Market Rankings (MM7)
▼0.0
4
80.8
25
HSBC Holdings PLC
0.0 48* - -352.4 308.9 16 -11.5 ▼
▼40* 2
** Fee
11.01 74.5
Visit http://dmi.thomsonreuters.com to View Archives and Order Custom League Tables
29*
Euro mil
▲KPMGUniCredit
-
2
11
26*
Globalscope
Jan 1 - Jun 30
29* 15*
JP Morgan
307
Leonardo & Co
BNP Paribas SAErnst & Young LLP
40*2.52.41
2.0
82.5861.3
-
100.0
0.0
8
Houlihan Lokey
2016Rank Value
Credit Agricole CIB
3
100.0
509.6
First Half 2016 │ Mid-Market M&A Up To US$500m │ Financial Advisors
Italian Mid-Market M&A up to US$500m by Rank Value Range
LazardIMAP- Vitale & Co
24*
44.6
7.2 6.7
4
2
Fees
▲1
15.9
La Compagnie Financiere
- -
5.0
-4 ▼
-
- -
3 ▲
651.9Ethica Corporate Finance SpA
Philippe Villin Conseil
Bank of America Merrill LynchDC Advisory
Nomura
0.0 0.0 48* - -
110.1 ▲
21*
- -
116.7
4
-2 ▼
76.1
-1 ▼
112
135.9
31*
1,949.8
0 36
New Deal Advisors SpA▲
CFI
-
8* 2
2
3 3CP Advisors Srl 21* -
▲
100.03 130*
72* 100.0Industry Total
48*
-48*
1.0
Global M&A 29* -
103.3 30
16.1 14.1 -61.7565
Deloitte 0.2
Arche Srl
3 0 -21*
76*100.0
17.8 -
50.1 ▲
UBS
-
21*
https://www.thomsonone.com
Barclays0.0
302.2
46*723.8 651.9
263.4
21*
29*
-
1.5 35*
0.0
0.0 1.5
▼
▲
10
▼175.3 159.3
2537.9
935.4 835.0
-
14
48.3
2 178.8
▲1
Advisor
12
89.2
-1.9▲
28.1
100.0
▲
Rank
▲ 100.0
8*
21*
4.3
▲
- 331.7▲
1199.3
651.9
1.03
▲
1
-
14
6
3 -
-26*
100.0
2325.0
24
10*
821.7
Change in
445
5
100.0
10*
3
57.2
3104.5
2.53
0.5
1 ▲29* 40* 2 1
12,541.3
30*
-329*
-47.9
9 ▲405.0
17*
10* ▲▲
Banca IMI (Intesa Sanpaolo)
100.0
▲
3.7
6*
100.0
723.8
7▲
11 76.8-
▲
Rank
-
395.2
8*
525.4
15*
7
3
20*
988
16
6
30*
48*
MM7 - Undisclosed Values & Values up to US$500m
9Financial Advisor
2.9
Fineurop SpA
Mediobanca
Rothschild
35.046
4
1,145.0 1,028.4
Rank
32
6
-▲
Rank Value
Rank
▲
776.9100.0
-13.2
N+1
2
21*
11,210.5
44.1
29* 30* 2 0 -29* 20* 2
2.3
** Fee exposure indicates each firm's mid-market fees from deals valued at up to US$500m as a percentage of its overall M&A fees in the relevant region.
Source: Thomson Reuters/Freeman Consulting
10--
20.0
-
Imputed Fees (US$m) †
-
-
15*
6
8*
1,150.6
▲
15*
▲
-81.7
35* 100.0-
21*21*
17*▲
Clairfield International
0.0
0.0▲
Morgan StanleyNatixis 100.0
100.040* 100.0
- - -
118.3
- 389.6
93.5
Vitale & Co SpA
5
8
-
-
195 1,246.7
-214
17*
49.1 ▲
▲
100.0
▼ 1,289.4
58.7
441.3
17*
19
1
20* 2.1
Kon SpA
2
19.3
10*2.2
100.0
40*
8*
12*
▼
-
5▲
-9
13440.0
8*12
9.1
-
0.0
88.3
-
▲
40*▼
4.2
30*
1
4
-81.1
# of
15*4
-
▲ 0.0
39.4
▲
0.6▲▲
7353.6
▲
† Imputed Fees shown are based on completed deal activity, whereas deal count & rank values are compiled based on announced deal activity.
38.9
▲ -
21*
3
8*
2.6
595.7
3
100.0
0.3
100.0
Italian Mid-Market M&A up to US$500m by Target Industry
20*
12* 2
9.8
-
8.4
Lincoln International 29*
5
25
-
3
Exp. (%)
Jan 1 - Jun 30
2.3
2016
23.2
-
360.17
299.60.0
8.5
5
US$m
▲
-
47.0
2220*
3▲
75
503.0
29
-4-
-
50
100
150
200
250
300
$0
$1
$2
$3
$4
$5
$6
$7
$8
# of
Dea
ls
Ran
k Va
lue
(US
$b)
US$200 - 500m US$100 - 200m US$50 - 100m US$0 - 50m # of Deals
20.3%
15.9%
10.7%
8.6%
8.0%
7.5%
7.1%
6.9%
5.8%
4.8% 3.2%
Financials
Real Estate
Healthcare
Energy and Power
Media and Entertainment
Industrials
High Technology
Consumer Staples
Consumer Products and Services
Retail
Telecommunications
Materials
9
krizvi
Highlight
14*
8
14
17*1
162.72
19*
-4
▲5
18677.4
31*
29*
304.915,332.2
31.0
▲
▲
1.1
100.0
- 33.5
36.5
5.7
1,114.4
6.3
26*
4.2
534.7 7
18*
6.3
20.5- -
18*286.8
135.7 121.0 180.4
US$m
--80.3
6
12
Visit http://dmi.thomsonreuters.com to View Archives and Order Custom League Tables
33*
14*
▼
▲-64.6
3
6*261.7
-
4595.5
19*
100.0
29.1
5-
1012.3
176.2
64
Rank Value per Advisor
41▲883.7
▼
11* 8*
100.03 655.0 ▲
19* 47
23.3
765.39
22▼
8205.4
25* 21
Jan 1 - Jun 30
3 ▲
8
124.8Clairfield International
ABG Sundal Collier
1.7545.82.3
5-
8*
-
125.6
161.9
Rank
55.2
▼
454.5
8*
4*
19.2
Rank
9*
▼20
7
6*▼
8.3
102.03
6.9
7
995.2
▼855.4
▲
3*
-15
15.9100.0
100.0
12* 3
DNB ASA
Translink Corporate Finance
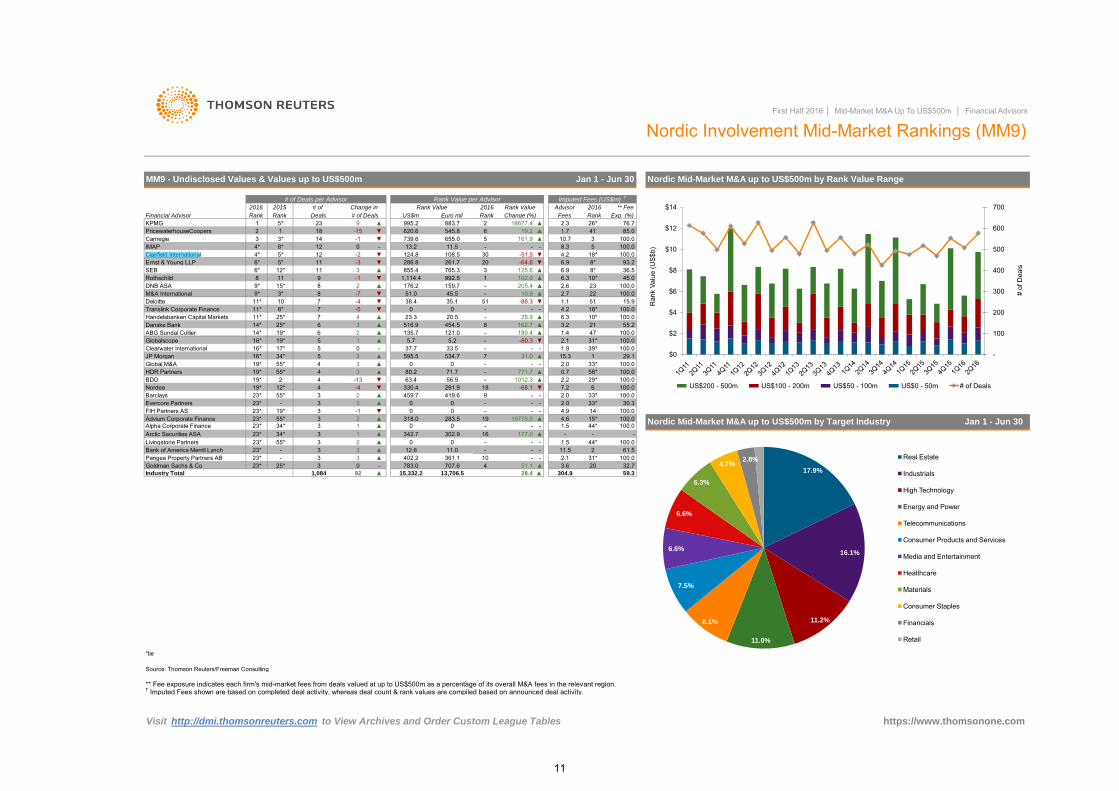
Nordic Involvement Mid-Market Rankings (MM9)
2016 2015
-1-
100.0
12
2.7
Euro mil
11 6.9
159.7
1
51
4*3*
1
11* 10
IMAP108.5
▲M&A International
-5
-3
100.0
25.925*
-51.50 13.2
▼
2.6
-86.34.2
100.0
8
0
-
Rothschild
-
▲PricewaterhouseCoopers
Imputed Fees (US$m) †
Rank Value
Financial Advisor
100.0
23
# of Deals per Advisor
100.0
9*
93.2
▲
-▲
215*10*
** Fee
30
KPMGRank
18
Change (%) Fees
Change in
▲ 3.2
-
SEBErnst & Young LLP 11
15.3 1
2.116*
3
Nordic Mid-Market M&A up to US$500m by Rank Value Range
5*
2016
620.6
Jan 1 - Jun 30
45.0
76.785.0
992.5
5* -2
▲
10.7-
Carnegie
23
10*
100.0
516.9
8*
7Deloitte
5*
HDR Partners4
Deals
MM9 - Undisclosed Values & Values up to US$500m
1.4GlobalscopeClearwater International
11.5
5151.0 45.538.4
▼35.1
▲
2 1
59.3
NordeaBarclays
2.2
https://www.thomsonone.com
Handelsbanken Capital Markets 11*
19*-Global M&A
739.6
▲
11 -1
2
▲
16*0 - -
▲
** Fee exposure indicates each firm's mid-market fees from deals valued at up to US$500m as a percentage of its overall M&A fees in the relevant region.
Source: Thomson Reuters/Freeman Consulting
--
19*4
92
771.7 ▲ 0.755* 3 ▲ 80.2 71.7 58*
Danske Bank
JP Morgan
*tie
6
19*55* 3 2 ▲ 2.0
330.4 291.9 18 -68.1 ▼459.7 419.6 9 - - 33* 100.0
Industry Total
2.0
1.9 39* 100.05 0
23*12*
▲ 0
37.716*
# of Deals
# of
▼
34*
100.0
▼
2
-7
9
Advisor
† Imputed Fees shown are based on completed deal activity, whereas deal count & rank values are compiled based on announced deal activity.
▼
5.2
10.9
Exp. (%)
28.4
BDO
Nordic Mid-Market M&A up to US$500m by Target Industry
Rank
2016 Rank Value
4 -4 ▼ 7.2 6 100.0
First Half 2016 │ Mid-Market M&A Up To US$500m │ Financial Advisors
0
▲
56.9 ▲
55*
-
▲
35
-
13,706.51,084
▲
-13 ▼ 63.4
Advium Corporate Finance 23* 55* 3 2 ▲Alpha Corporate Finance 23* 34* 3 1 ▲Arctic Securities ASA 23* 34* 3
00
318.0
Evercore Partners 23* - 3 3 ▲FIH Partners AS 23* 19* 3 -1 ▼
0 - - -0 - - -
2.0 33* 30.34.9 14 100.0
- -783.0 707.6 4 51.1 ▲
1 ▲Livingstone Partners 23* 55* 3 2 ▲Bank of America Merrill Lynch 23* - 3 3 ▲Pangea Property Partners AB 23* - 3 3 ▲Goldman Sachs & Co 23* 25* 3 0 -
4.6 15* 100.01.5 44* 100.0- - -
1.5 44* 100.011.5 2 61.52.1 31* 100.03.6 20 32.7
283.5 19 19775.0 ▲0 0 - - -
342.7 302.9 16 177.0 ▲0 0 - - -
12.6 11.0 - - -402.2 361.1 10
-
100
200
300
400
500
600
700
$0
$2
$4
$6
$8
$10
$12
$14
# of
Dea
ls
Ran
k Va
lue
(US
$b)
US$200 - 500m US$100 - 200m US$50 - 100m US$0 - 50m # of Deals
17.9%
16.1%
11.2%
11.0%
8.1%
7.5%
6.6%
6.6%
6.3%
4.7% 2.8% Real Estate
Industrials
High Technology
Energy and Power
Telecommunications
Consumer Products and Services
Media and Entertainment
Healthcare
Materials
Consumer Staples
Financials
Retail
11
krizvi
Highlight

Financial Advisor
728.566
8*
▲
66.9
0
711*
100.0
63*1798.1
-
-1128.1
Rank Value
▲
3
312.7
39
Industrial & Comm Bank China
Barclays
7
▲
9,185.21,831
▼ 2.0
8
5*
14
296.4
5
2
190.7
-
8*▲
21
IMAP
Scotiabank 180.9
12.614*14*
0
US$m
Visit http://dmi.thomsonreuters.com to View Archives and Order Custom League Tables
16*
5
0
-
2
112.5
3
22
3.7
▼
43*40*
0.5
1
KPMG
-48.9
▼
20*8*45
1*-29.1
8*
2
14*
0.7
▼
Rank
▲
0.2
44*
▼
17
-51.6
▲
-2
N+1
1
-▲
▲
2016
▲
1*
-
▼3
100.0
50.1 46.0
27*
6.3
100.0
7.2
CFI0
5
25.0
** Fee
-
-
4
20*
▲
3.1
2
2
100.0
100.0100.0
-2
35*
Change (%)
153.1-
14* 330.2
-
7.3
-8
Exp. (%)
9413.9
Change in Advisor
Industry Total
▼
▲
3
-
20162015
▲
-
▼275.9
Source: Thomson Reuters/Freeman Consulting
205.0
Bank of America Merrill Lynch
77.6
21*-
2
-
7
Eastern European Mid-Market M&A up to US$500m by Rank Value Range
202.0
-
▼
4.3
14*
Rank Value
First Half 2016 │ Mid-Market M&A Up To US$500m │ Financial Advisors
4
14*2
35*
-
11* 5*
5.1
Fees
MM16 - Undisclosed Values & Values up to US$500m
10*
▲
32*
BDO
281.5
JP Morgan
PricewaterhouseCoopers
8
29.6
6▲
-3*
Deals
301.5 268.5
-59.3
615VTB Capital
12-
-
2016
104.5
Clairfield International
4-15
1010
32
14*
▲
1
170.0
-
▲66*
▲
35*
18.3
651.50
-3
KBC Group NV
▲
16
Rothschild2
# of
208.7342.5 313.1
-5
18*
-18.3
69*
34*
12.0
7 0
11.02
3
-
-
2 ▲
▼
14*
5.8
# of Deals per Advisor
100.09.8
-
11*
0.1
https://www.thomsonone.com
EE Mid-Market M&A up to US$500m by Target Industry Jan 1 - Jun 30
3.98
20*
100.0
100.0
-4
Citi
-1100.0
24
17.221*
-
5
-4 ▼
14*
5.2
0 -
-72.6
Deutsche Bank
** Fee exposure indicates each firm's mid-market fees from deals valued at up to US$500m as a percentage of its overall M&A fees in the relevant region.† Imputed Fees shown are based on completed deal activity, whereas deal count & rank values are compiled based on announced deal activity.
0
12*
Rank
116.0
0.6
103.626.9
3* 16.3266.5
▲229.6
245.210*
37.8
Jan 1 - Jun 30
0
26
▲-
0.8
1.1
37*
1Rank
*tie
100.0
313.6
▲2 11
35*
1
# of Deals
3*
3*
2
186
100.0
4.0
92.0
8
8*
14*86.0
1.8
3.3-
10
7.0-
100.0
Deloitte 100.0
35*
Ernst & Young LLP
15 -74.310,270.8
-121
▼-
-
-
8.1
-
0.4
1.5
▲
-65.9
-70.1 ▼2
16.3
UniCredit
2
-516*
Morgan StanleyDanske Bank
35*
2Lazard
14*
95.9
0
144.6
-
6.5
2.0
Aday Bagimsiz Denetim7.3
-
100.0
85.9
100.0
100.0
14*
163.7
▲ 13*
Euro mil
Imputed Fees (US$m) †
Rank
Rank Value per Advisor
100.0
100.0
100.0
▼
Cushman & Wakefield Inc
Eastern Europe Involvement Mid-Market Rankings (MM16)
-
200
400
600
800
1,000
1,200
$0
$2
$4
$6
$8
$10
$12
# of
Dea
ls
Ran
k Va
lue
(US
$b)
US$200 - 500m US$100 - 200m US$50 - 100m US$0 - 50m # of Deals
19.2%
17.4%
9.9%
9.5%
8.3%
7.4%
6.9%
6.5%
5.0%
3.8%
3.8% 2.3% Financials
Energy and Power
Materials
Real Estate
Retail
Consumer Products and Services
Consumer Staples
Media and Entertainment
Industrials
High Technology
Telecommunications
Healthcare
13
krizvi
Highlight

4
36*
17
-
-
108.0
218.1-36.2Gresham Partners
Houlihan Lokey
BMO Capital Markets
▼
▲▲ 10
47*
36* 2 1 ▲21* 2 0 -
35
4
1 64.4
177.0 18 185.9 ▲
3-43.2
2* -78.0
16.7
▲32.8
-9
7
17▼
▲
-▼
510.6
21*
0
3
2
347*
19*
-3
-15.8
Aus/New Zealand Mid-Mkt M&A up to US$500m by Target Ind
-61.121*
21*
162.6
-
2100.0
55
-52.7
▼
59.8
19*
Visit http://dmi.thomsonreuters.com to View Archives and Order Custom League Tables
2832*
0.7
1.6
-▲
21
19*
▼
36* 1
10*
1
Australia/New Zealand Mid-Market M&A up to US$500m by Rank Value Range
100.0
4
0.7
2016
1,937.5
12*6*
-
1.2
4
613.2
Rank Value
3
-1
12*
20
Jan 1 - Jun 30
-
1505.2▲
614.2
12* 00
1
17.8
Rank
- 0.3
- 3
▼
19*
21*9*
▼2
Rank
19*
4*
Deutsche Bank12*
12*▼
▲
▲
20.6
▲
50-
100.0
▲
Rank Value
Rank Value per Advisor (US$m)
Rank
1
10.313
-21.2
▼2
29
85
32.1
4* ▼Goldman Sachs & Co 5
** Fee
Exp. (%)
2
7*
-12
-
197.4
14
RBC Capital Markets
▲58*
37*Ernst & Young LLP
Rank
Nomura
74.6
12.9
https://www.thomsonone.com
100.0
123
▲
12*
1,143.6
Rothschild-
6*
11
12.5
▲
224.096.5
-
2UBS
-2
▲ 25.816
100.0▼3
17.9
150.3
7*LazardCiti
▲
12 ▲
Change in
First Half 2016 │ Mid-Market M&A Up To US$500m │ Financial Advisors
PricewaterhouseCoopers
4*
51
43.1
16▼ 82.6
▼
17.5
10*
282.8
9.4
5
# of Deals per Advisor
▲
2016
350.5
723.0
-96.2-1
▲ ▲
2.0
9.8
2 12*Jones Lang LaSalle Inc
Clairfield InternationalPeel Hunt LLPBank of America Merrill Lynch
-4
-23.1
- 159.0
-37490.7
6*
-
100.0100.0100.0
172.7
▼
100.0
100.0
100.0
-30.8168.8
Jan 1 - Jun 30
5.5
19,664.3764 350.1
KPMG
Moelis & Co
3.0
# of
7*
Greenhill & Co, LLC
15
-
82.0
73.2
0.7
3
18
▼
3
3.5
21*
Deloitte
4
Credit Suisse
22
100.0
6
56.6
4
*tie
** Fee exposure indicates each firm's mid-market fees from deals valued at up to US$500m as a percentage of its overall M&A fees in the relevant region.
Source: Thomson Reuters/Freeman Consulting
† Imputed Fees shown are based on completed deal activity, whereas deal count & rank values are compiled based on announced deal activity.
312*
Haywood Securities Ltd.
19*19*
- 2 2 ▲9* 2 -3
12.0
423.30
19*19*
12*
6
2016
▲-57
▼
4
18*
21*
2
97.6
229.8
-81.0 100.00 66* -
5.3 14 100.0
▼
3.6 100.0
7.6100.0- -
30
62.7
1,624.8
9.1
12*
▲
1.9
11.4
30
Australia/New Zealand Involvement Mid-Market Rankings (MM11)
7
US$m
Advisor
47*
6
▼4.1
▲
Deals
45.0▲
77.0
261.5
83.0
2.7
- - -
-
Industry Total
MM11 - Undisclosed Values & Values up to US$500m
Financial Advisor
2 ▲
0.7 47* 100.01.4 35
1
39
- - -
0 - - -80.6
19*19*19*
- 2
▼-73.2
-
312.1
18
3
2015Change (%)
Macquarie Group# of Deals
2
0 ▼
12*
1.6 32* 66.7
Generational EquityMiles Advisory PartnersRabobank NVJP MorganGrant Samuel
1955.7105.1
1
Imputed Fees (US$m) †
Fees
-
100
200
300
400
500
600
700
$0
$2
$4
$6
$8
$10
$12
$14
$16
# of
Dea
ls
Ran
k Va
lue
(US
$b)
US$200 - 500m US$100 - 200m US$50 - 100m US$0 - 50m # of Deals
22.7%
14.2%
12.2% 10.2%
9.3%
7.6%
6.7%
5.6%
4.9%
3.5% 3.1% Real Estate
Materials
Industrials
Energy and Power
Consumer Products and Services
Financials
Consumer Staples
High Technology
Media and Entertainment
Retail
Healthcare
16
krizvi
Highlight

`
4.1 8
17 50.03 7 -3
▲ 517.6 5 204.5 ▲
# of Deals per Advisor Rank Value per Advisor (US$m) Imputed Fees (US$m) †
24 -47.3 ▼ 1.2
First Half 2016 │ Mid-Market M&A Up To US$500m │ Financial Advisors
Indian Involvement Mid-Market Rankings (MM21)
MM21 - Undisclosed Values & Values up to US$500m Jan 1 - Jun 30 Indian Mid-Market M&A up to US$500m by Rank Value Range
2016 2015 # of Change in Rank Value 2016 Rank Value Advisor 2016 ** Fee
Financial Advisor Rank Rank Deals # of Deals US$m Rank Change (%) Fees Rank Exp. (%)
90.8 ▲ 1.0 19 90.96 0 -
Standard Chartered PLC 5 29*
100.0▼ 128.0 17
- - -
1,041.4 1 2367.8 ▲ 0.7 22
GCA Savvian Group Corp 6* - 3 3 ▲ 26.5 - - - 0.2 40* 100.0Deloitte 6* 11*
Ernst & Young LLP 1 1 14 -10 ▼ 438.9 8 -41.9 ▼ 8.6 1 85.1KPMG 2 4 11 3 ▲
3
4 3
PricewaterhouseCoopers 3Axis Bank Ltd 4 5* 60.3
Avendus Capital Pvt Ltd 6* 2 3 -11 ▼ 64.1 23 -91.6 ▼ 1.1 18 100.0Goldman Sachs & Co 6* 11* 3 0 16.3 ▲ 5.1 6 100.0- 514.3 6
2
Clairfield International 6* 11* 3 0 - 11.5 - -21.8 ▼ 1.3 16 100.0
Moelis & Co 6* - 3 3 ▲ 505.3 7 - - 3.1 11* 100.0Rothschild 15* 29* 2 1 ▲ 230.0 14 -
19* 3
- 3.4 9
1 ▲ 0 39* - - 7.2 2
884.5UBS 15* -100.0
15*15*15*15*15*15*
Kotak Mahindra Bank LtdArma Partners LLPMorgan Stanleyo3 Capital Advisors Pvt LtdLazardTranslink Corporate Finance
5* 2 -4 ▼- 2 2 ▲
29* 2
93.1
▼0 - - -
410.0 10
74.0 Indian Mid-Market M&A up to US$500m by Target Industry Jan 1 - Jun 30
https://www.thomsonone.com
627 22 ▲ 10,899.8 11.7 ▲ 116.9
Visit http://dmi.thomsonreuters.com to View Archives and Order Custom League Tables
5* 2 -4 ▼ 19* 272.4 ▲ 0.5 25* 100.0
*tie
Source: Thomson Reuters/Freeman Consulting
** Fee exposure indicates each firm's mid-market fees from deals valued at up to US$500m as a percentage of its overall M&A fees in the relevant region.† Imputed Fees shown are based on completed deal activity, whereas deal count & rank values are compiled based on announced deal activity.
15*15*15* 15.4
5 100.00.4 35* 100.0
Industry Total
100.0
- - 6.4 3 100.0
Jefferies LLC 6*
Citi 6* 29* 3 2 ▲ 781.6 20* 11.5
2 2 ▲
▼ 0.3 38* 100.0
1 ▲11* 2 -1 ▼29* 2 1 ▲
70.2 22 -88.1
29
- - 0.9
0.0 ▲0
-78.0
3
3.10.61.8
39* - -
-29*29*
2 ▲2 1 ▲2 1 ▲
2
1540.0 ▲5.5 -
0.1 45*
100.0
0.9 20* 20.96.3 4 100.05.6
0 - 24.0
11*23*14
100.0100.0
6* 11* 0 - 571.7 3.4JM Financial Group 3
Societe GeneraleM&A InternationalJP Morgan
-7.8 - -
180.0 15 115.6
0 -
4 538.8 ▲
--
▲
-
50
100
150
200
250
300
350
400
$0
$1
$2
$3
$4
$5
$6
$7
$8
$9
$10
# of
Dea
ls
Ran
k Va
lue
(US
$b)
US$200 - 500m US$100 - 200m US$50 - 100m US$0 - 50m # of Deals
17.1%
14.4%
13.9%
13.4%
13.0%
9.5%
4.9%
4.7%
4.0% 2.7%
1.3%
1.2%
Healthcare
Materials
Financials
Industrials
High Technology
Energy and Power
Consumer Products and Services
Retail
Telecommunications
Media and Entertainment
Real Estate
Consumer Staples
20
krizvi
Highlight