Return of the Gold StockTechnicianfiles.constantcontact.com/25849dfa601/286ce323-36b... · Return...
15
Tuesday April 10 2018 Return of the Gold StockTechnician: As we noted in the last update, we want to let readers know that as of April 20 th 2018 we will be moving the GST Newsletter back to a paid subscription product. Each month, we anticipate writing two detailed reports, and along with those, we will also be sending out password protected pdf’s a few times per week with shorter updates to keep subsribers current. The new service is a broad advisory service and will cover a variety of areas including Gold, Gold Stocks, Bond Funds of all stripes, Equities and REITs. A lot of the focus will be on capital gains and on dividends. I am making this move because a year ago, I thought we would heading into a more challenging environment and for awhile it seemed like things would never change. Yet that change is upon us and I believe the coming climate is one where active investment management inputs will be valuable for subscribers and where Gold and Gold Stocks will soon move to the fore. Because we feel we are pricing the GST at a bargain basement price, we ask that all our readers respect the integrity of our work, the time it takes to make a good product and not share/forward the service with friends and associates. On a positive note, for those of you who are interested in potentially other services, we are hoping to have one or two gold products available on the investment management side of things available in the months ahead. We will keep you posted. You may contact us at [email protected] if interested. We know a few of you already have, and we appreciate your trust and confidence. The price of the new GST Service will be $325 per year, with subscription checks made out to “The Gold Stock Technician”. We accept several forms of payment. Personal checks or Money Order can be mailed to: Frank Barbera The Gold Stock Technician P.O. BOX 480858 Los Angeles, CA. 90048 In addition to a check or money order, you can also use Paypal, and send payment to FrankBGST@AOLcom Those of you interested in continuing this service you should send payment before April 20 th . Thank you Frank
Transcript of Return of the Gold StockTechnicianfiles.constantcontact.com/25849dfa601/286ce323-36b... · Return...
Tuesday April 10 2018
Return of the Gold StockTechnician: As we noted in the last update, we want to let readers know that as of April 20th 2018 we will be moving the GST Newsletter back to a paid subscription product. Each month, we anticipate writing two detailed reports, and along with those, we will also be sending out password protected pdf’s a few times per week with shorter updates to keep subsribers current. The new service is a broad advisory service and will cover a variety of areas including Gold, Gold Stocks, Bond Funds of all stripes, Equities and REITs. A lot of the focus will be on capital gains and on dividends. I am making this move because a year ago, I thought we would heading into a more challenging environment and for awhile it seemed like things would never change. Yet that change is upon us and I believe the coming climate is one where active investment management inputs will be valuable for subscribers and where Gold and Gold Stocks will soon move to the fore. Because we feel we are pricing the GST at a bargain basement price, we ask that all our readers respect the integrity of our work, the time it takes to make a good product and not share/forward the service with friends and associates. On a positive note, for those of you who are interested in potentially other services, we are hoping to have one or two gold products available on the investment management side of things available in the months ahead. We will keep you posted. You may contact us at [email protected] if interested. We know a few of you already have, and we appreciate your trust and confidence. The price of the new GST Service will be $325 per year, with subscription checks made out to “The Gold Stock Technician”. We accept several forms of payment. Personal checks or Money Order can be mailed to: Frank Barbera The Gold Stock Technician P.O. BOX 480858 Los Angeles, CA. 90048 In addition to a check or money order, you can also use Paypal, and send payment to FrankBGST@AOLcom Those of you interested in continuing this service you should send payment before April 20th. Thank you Frank
The Gold Stock Technician
2
Gold Stocks: Things are getting very interesting in the Gold arena right now, and we are seeing some hopeful signs that Gold could be bottoming out, along with the Gold Stocks. What’s more, we think that if the Gold Stocks do bottom out in the near-term, they could be very close to the start of a surprisingly large advance. While containing our potential bullish enthusiam, we want to use this letter to give our readers some insight as to what we are seeing in the charts. In the last few letters, we have been walking quite a neutral path, and if anything have probably been highlighting the downside risks more then anything else. It remains true that if Physical Gold (see DailyFx+ Gold on Google) at any time breaks down below $1305-$1310 that would be a significant near-term bearish development and for GDX, any move below $21.40 and then $21.00 would also be very bearish. As a week, not a lot of net movement really took place last week, with Gold ending at $1333.41, up 8.36 (or .63%)and GDX ended with a small gain of +.09 to end last week at $22.07.
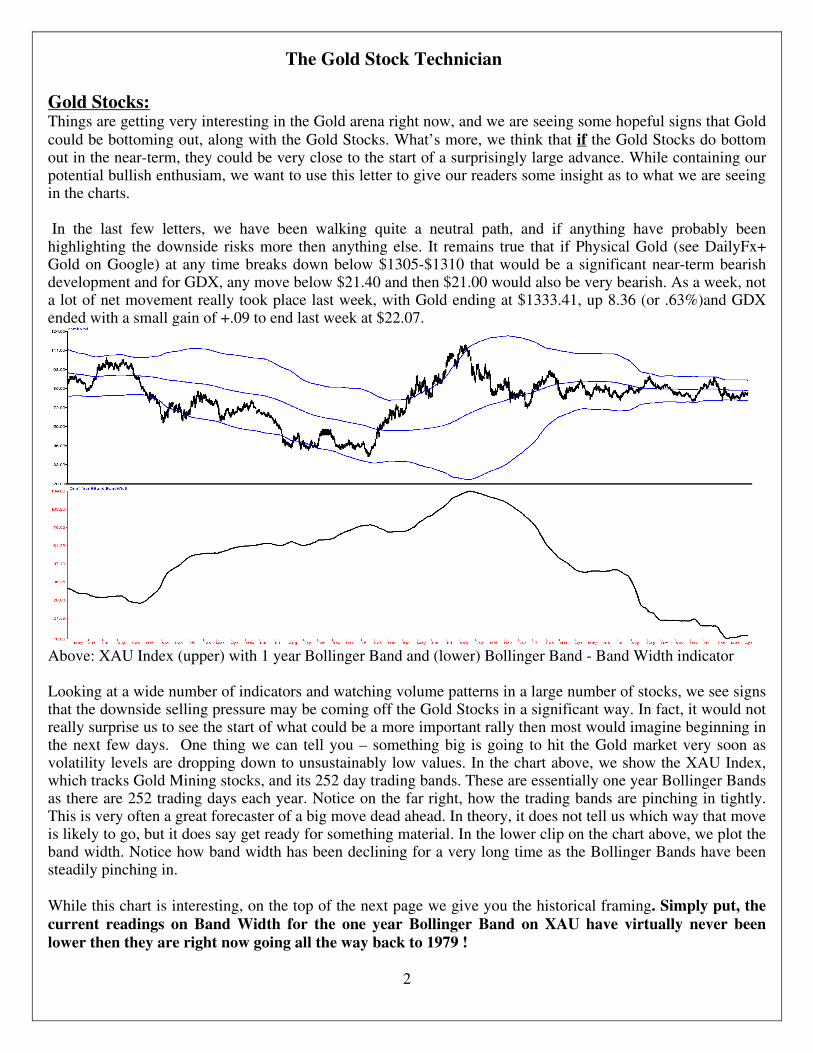
Above: XAU Index (upper) with 1 year Bollinger Band and (lower) Bollinger Band - Band Width indicator Looking at a wide number of indicators and watching volume patterns in a large number of stocks, we see signs that the downside selling pressure may be coming off the Gold Stocks in a significant way. In fact, it would not really surprise us to see the start of what could be a more important rally then most would imagine beginning in the next few days. One thing we can tell you – something big is going to hit the Gold market very soon as volatility levels are dropping down to unsustainably low values. In the chart above, we show the XAU Index, which tracks Gold Mining stocks, and its 252 day trading bands. These are essentially one year Bollinger Bands as there are 252 trading days each year. Notice on the far right, how the trading bands are pinching in tightly. This is very often a great forecaster of a big move dead ahead. In theory, it does not tell us which way that move is likely to go, but it does say get ready for something material. In the lower clip on the chart above, we plot the band width. Notice how band width has been declining for a very long time as the Bollinger Bands have been steadily pinching in. While this chart is interesting, on the top of the next page we give you the historical framing. Simply put, the current readings on Band Width for the one year Bollinger Band on XAU have virtually never been lower then they are right now going all the way back to 1979 !
The Gold Stock Technician
3
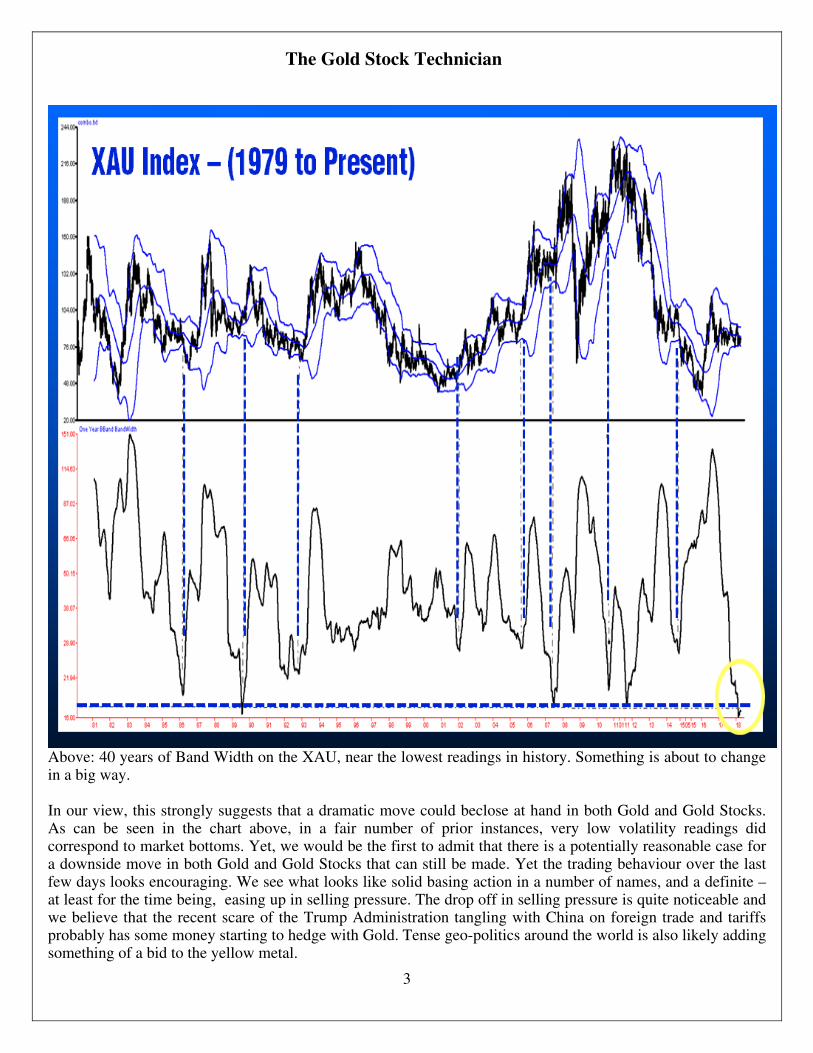
Above: 40 years of Band Width on the XAU, near the lowest readings in history. Something is about to change in a big way. In our view, this strongly suggests that a dramatic move could beclose at hand in both Gold and Gold Stocks. As can be seen in the chart above, in a fair number of prior instances, very low volatility readings did correspond to market bottoms. Yet, we would be the first to admit that there is a potentially reasonable case for a downside move in both Gold and Gold Stocks that can still be made. Yet the trading behaviour over the last few days looks encouraging. We see what looks like solid basing action in a number of names, and a definite – at least for the time being, easing up in selling pressure. The drop off in selling pressure is quite noticeable and we believe that the recent scare of the Trump Administration tangling with China on foreign trade and tariffs probably has some money starting to hedge with Gold. Tense geo-politics around the world is also likely adding something of a bid to the yellow metal.

The Gold Stock Technician
4
On the subject of tarrifs, a key aspect of globalization that is often overlooked is the role of multi-national companies headquarted in the U.S. In many cases, products made for these companies are “Made in China” and assembled here in the states, for U.S. companies. The US. Companies are the prime beneficiary but the goods are still labeled as ‘Made in China’ and thus addative to the Trade Deficit. Should there be a tit-for-tat trade war, the end result would definitely be pass through inflation as consumer’s in the U.S. would have to pay more for imported goods. The resulting downward spiral in global trade could also have the potential to kick start a serious recession or worse, and so the actual outcome would likely be stagflationary with prices rising, and rising prices negatively affecting consumer spending, and the slow down in consumer spending (which is better then 70% of GDP) slowing overall growth. Gold and Gold Stocks would be seen as a haven in such a world, as the threat of a Chinese Yuan devaluation risk could also surge and there could be a lot of money that would then be looking to exit China and move into a liquid, safe-haven asset.
In our work, we watch a number of proprietary gauges, including one we call our Trading Day Oscillator shown in the chart above. This gauge looks a lot at the relationship between the days close and the days mid-point to seek out underlying strength or weakness in a market. In bull markets, it tends to be oversold near the flat horizontal line. The period of 2001 to 2008 produced two spikes down toward this area and both were important lows. Note on the far right of the screen, we have once again come down to that same zone. There is a reasonable case to be made that the strong upward impulse of 2016 has now been unwound within the framework of a continuing bull market and that the recent readings are highlighting an oversold bottom. Volume is also showing signs of potentially having just seen a low volume bottom. Rather then a spike low, which would imply a lot of heavy selling pressure and drive our ARMS Indicators straight up, the action of late
The Gold Stock Technician
5
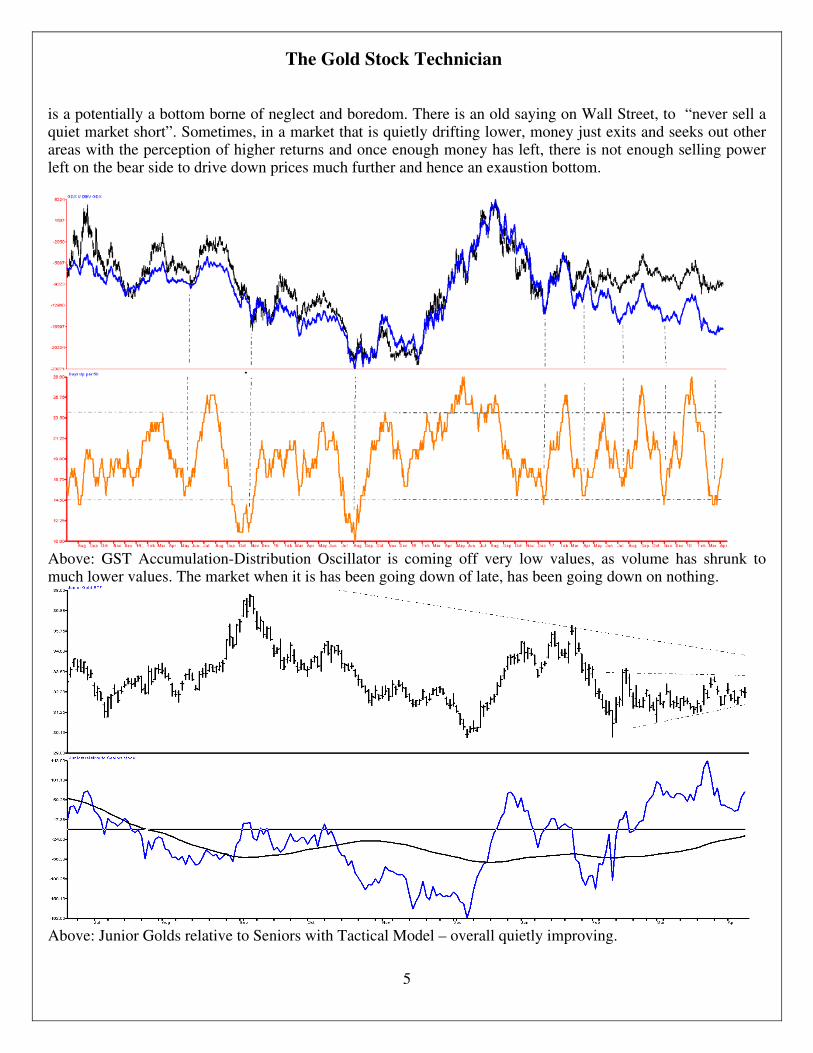
is a potentially a bottom borne of neglect and boredom. There is an old saying on Wall Street, to “never sell a quiet market short”. Sometimes, in a market that is quietly drifting lower, money just exits and seeks out other areas with the perception of higher returns and once enough money has left, there is not enough selling power left on the bear side to drive down prices much further and hence an exaustion bottom.
Above: GST Accumulation-Distribution Oscillator is coming off very low values, as volume has shrunk to much lower values. The market when it is has been going down of late, has been going down on nothing.
Above: Junior Golds relative to Seniors with Tactical Model – overall quietly improving.

The Gold Stock Technician
6
A couple of other gauges have also been quietly improving. Take the action of Juniors relative to Seniors for example. Here we see a relative strength curve that has moved solidly positive and is back above a rising, and uptrending moving average. Our tactical model for getting long Juniors is now bullish, with our other gauges perhaps one or two strong up days away from turning bullish.
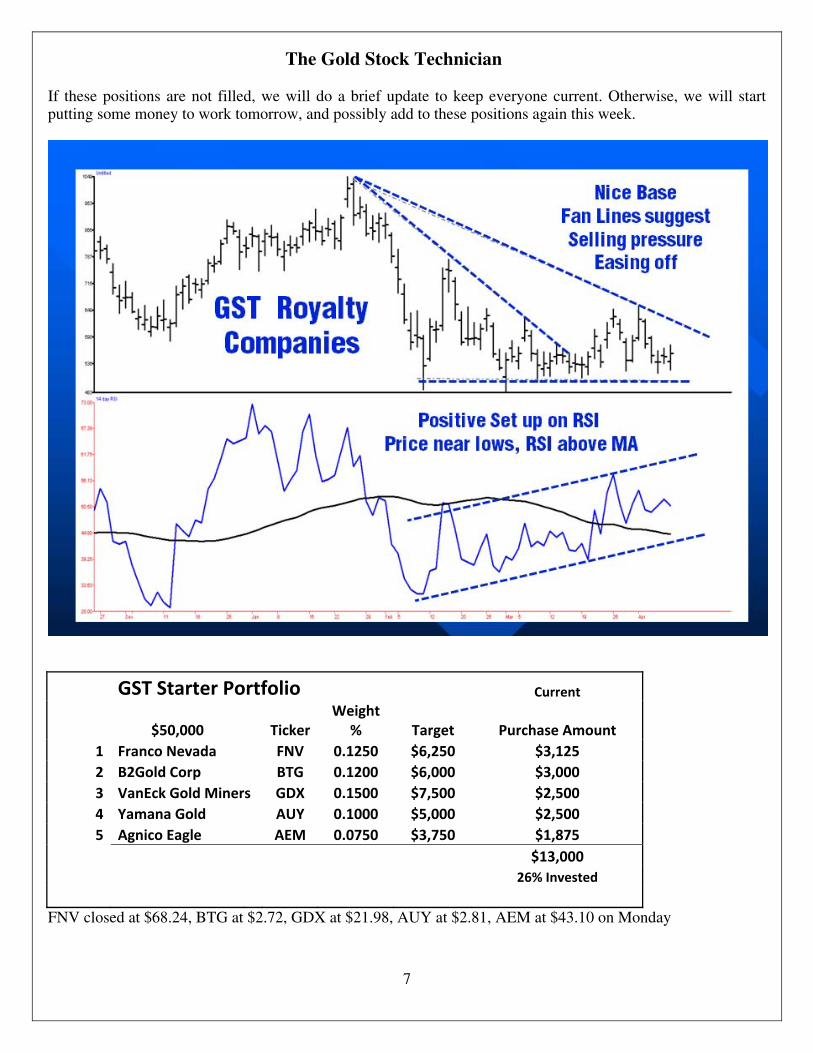
Elsewhere, Royalty companies are also showing good relative strength and appear to be ready to start a strong rally. These tend to lead just a little at key turns, and we really like the way the charts look in equities such as Franco Nevada (FNV), Royal Gold (RGLD), Wheaton Mining (WPM) and Sandstorm Gold (SAND). As a result, we are going to onboard some pilot long positions in the early going tomorrow. On the next page, are a few starter stocks with an overall allocation consistent with a $50,000 portfolio. To the right of the target allocation is a lesser amount, which we labeled as “purchase amount” which would be a first goal to reach over the first round or two of buying, Using those dollar figures and today’s closing prices, we arrive at around 45 shares of Franco Nevada, 1100 shares of BTG, 110 shares of GDX, 900 shares of Yamana and 40 shares of Agnico Eagle. Tomorrow, if FNV (last $68.24) is trading below $68.64 any time during the day, go ahead and buy the full 45 share position. For BTG (last $2.72) go ahead and buy half-of-the-half or 550 shares anytime the stock is below $2.76. For GDX, it is OK to buy the 110 share position any time GDX is below $22.20. For Yamana Gold (AUY), AUY last $2.81, go ahead and buy half-of-the-half, or 450 shares anytime AUY is below $2.86. AEM (last: $43.10) should be bought ideally on weakness below $42.85 (aim for that), but we are OK buying it anytime the stock is below $43.30 which is our max buy limit on AEM for now.
The Gold Stock Technician
7
If these positions are not filled, we will do a brief update to keep everyone current. Otherwise, we will start putting some money to work tomorrow, and possibly add to these positions again this week.
GST Starter Portfolio Current
$50,000 Ticker Weight
% Target Purchase Amount
1 Franco Nevada FNV 0.1250 $6,250 $3,125
2 B2Gold Corp BTG 0.1200 $6,000 $3,000
3 VanEck Gold Miners GDX 0.1500 $7,500 $2,500
4 Yamana Gold AUY 0.1000 $5,000 $2,500
5 Agnico Eagle AEM 0.0750 $3,750 $1,875
$13,000
26% Invested
FNV closed at $68.24, BTG at $2.72, GDX at $21.98, AUY at $2.81, AEM at $43.10 on Monday

The Gold Stock Technician
8
Physical Gold: At $1333.74, - Gold remains in the middle of the range. Below $1320 would be a short-term caution sign and below $1305 would be a near-term sell. Above $1348 would be short-term bullish and above $1365 would be a major breakout. Any move above $1365 would likely target at least $1450 in Gold. The overall look of the chart is improving and we think the near-term bias is for a try at breaking out topside. Obviously, we will just need to watch it closely over the next few days. Those interested in owning some GLD, could buy a pilot 2% position in their portfolio if Physical Gold moves above $1348. U.S. Stocks: Because of space in this issue, we are going to defer an in-depth view of the stock market, where the short-term trend remains very choppy. Late this evening, China’s President announced that China could significantly lower auto import tariffs and the S&P and NASDAQ futures are sharply higher overnight. While a rally could continue for one to three days, we still think there is a chance that the market could then reverse and push down toward 2530 on the S&P which remains a strong area of support. While we don’t expect it now, a break below 2530 on the S&P would be a negative development, especially if the DJIA also under-cut its equivalent support at $23,335 (DJIA last: $23,979). If the S&P can hold 2530 support, it could then be poised for a multi-week rally back up across the recent range toward the 2720 to 2770 zone. At the moment, 2670 is key resistance for the S&P 500. A near term move above that would probably suggest higher prices if sustained for more then a day or so. Tech stocks, in particular, seem to be deteriorating quite a bit and the NASDAQ has resistance at 7110. NASDAQ also looks like it could rally for a day or two, and then begin to slowly reverse. In a worst case near term outcome, a move down toward 6,500 is not impossible on NASDAQ over the next few weeks.
In our view, this is a good time to dis-engage from the stock market, Most investors, should avoid equities, and focus on holding high levels of cash (or Bonds) and not trying to pick a bottom in the stock market. The market is likely to remain quite erratic for a little while longer. While we still expect a counter-trend rally of substance, we still see significant near-term risks, and massive long-term risks. So the overall picture is poor risk-reward.

The Gold Stock Technician
9
US. Dollar Index: Back in our December 31st 2017 letter, we noted that the U.S. Dollar ($92.12) was nearing a critical juncture, where it would either bounce hard, or breakdown. As it turned out, there was no appreciable bounce and within a few days the Dollar Index began a significant break down. We stated, “The odds must be very high that the combination of a deep oversold reading and proximity to major support should produce a strong Dollar bounce almost immediately. If that fails to develop, and instead the Dollar starts to snowball downhill much below 91.60 we would take that as an indication that a full scale break down toward 89.00 could be in the works. In that scenario, the (A)-(B)-(C) correction for the Dollar would take on a downward skew and the upward (C) wave rally would be delayed until late January, and would then likely fail in the area at the underside of what had been major support, which would then role reverse and become major resistance at 91.80” At the time, we included the chart below to illustrate the breakdown scenario which had a downside objective of $89.00 on a break below $91.60. As it turned out, the Dollar Index did reach and marginally exceed $89.00 with a pair of lows at $88.67 on 2/1/2018 and $88.62 on 2/15/2018. So far, the rebound has peaked at about $90.61 on 2/28/2018. At the moment, we continue to believe that Dollar remains in a weak counter trend rally mode with upside potential between $92.00 and $92.50 over the next two to three months.
Above - Then and Now – We still think a Dollar Index counter-trend bounce has a little further to go before the

The Gold Stock Technician
10
next significant Dollar peak is seen. When the Dollar does peak, we believe we can make goo dmoney from a resumption of the larger decline in the Dollar Index using several approaches. One good example, which is appropriate for even Conservative Investors, is the use of Unhedged Global Bond Funds. The core of our new service will be all about simply making money using a carefully thought though approach to risk and reward. In our mind, nothing else really matters except helping our subscribers navigate the challenging waters ahead and coming with a solid total return. That is why we are taking a broad view on the markets we focus on, rather then just focusing 100% on Gold as some other letters do. When investing, it is always best to take a holistic approach. On the chart that illustrates the concept behind Unhedged Global Bond Funds is shown using FastTrack in the graph below. The top line is the U.S. Dollar Index. The other lines at the bottom of the chart show a pack of different unhedged global bond funds. These include Wells Fargo Int’l Bond A (ESIYX), PFUIX and BEGBX, PIMCO Foreign Bond Unhedged (PFUIX) and American Century Intl Bond (BEGBX). These funds have only one reason to exist, they go up and trend and well when the Dollar goes down.
In the chart above, we put our cursor on the high of the Dollar Index (12/29/2016) and measured to the recent February lows (2/15/2018) Over that time, the Dollar Index fell 14.21% while ESIYX gained 14.90%, PFUIX gained 16.43% and BEGBX gained 15.04%. That all developed over a period of 14 months, not bad! To understand which mutual fund share class to buy, one needs to check the website of the brokerage firm you
The Gold Stock Technician
11
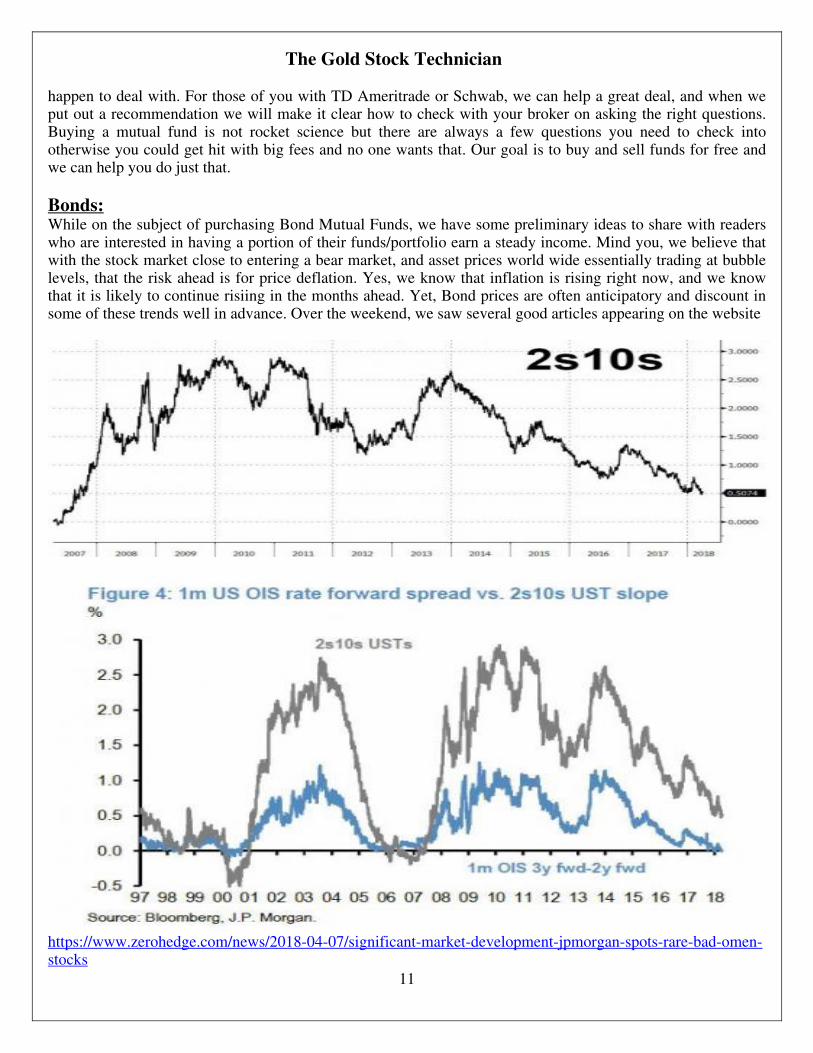
happen to deal with. For those of you with TD Ameritrade or Schwab, we can help a great deal, and when we put out a recommendation we will make it clear how to check with your broker on asking the right questions. Buying a mutual fund is not rocket science but there are always a few questions you need to check into otherwise you could get hit with big fees and no one wants that. Our goal is to buy and sell funds for free and we can help you do just that. Bonds: While on the subject of purchasing Bond Mutual Funds, we have some preliminary ideas to share with readers who are interested in having a portion of their funds/portfolio earn a steady income. Mind you, we believe that with the stock market close to entering a bear market, and asset prices world wide essentially trading at bubble levels, that the risk ahead is for price deflation. Yes, we know that inflation is rising right now, and we know that it is likely to continue risiing in the months ahead. Yet, Bond prices are often anticipatory and discount in some of these trends well in advance. Over the weekend, we saw several good articles appearing on the website
https://www.zerohedge.com/news/2018-04-07/significant-market-development-jpmorgan-spots-rare-bad-omen-stocks

The Gold Stock Technician
12
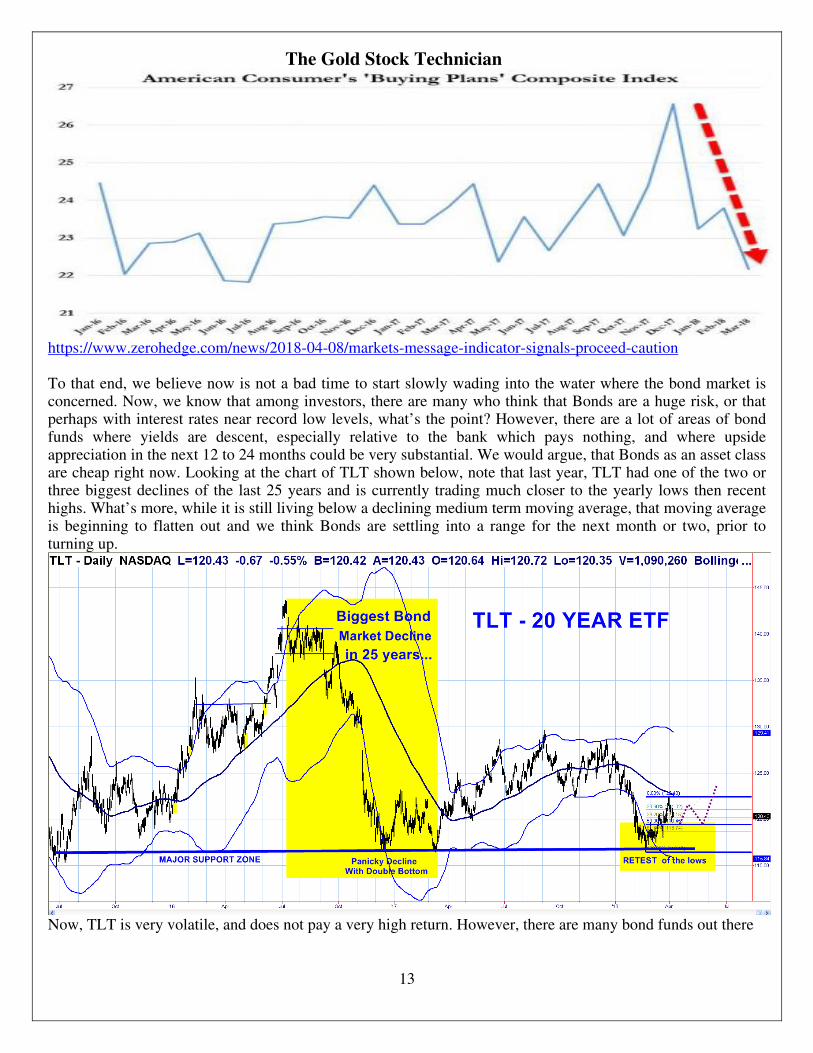
https://www.zerohedge.com/news/2018-04-08/markets-message-indicator-signals-proceed-caution Zerohedge.com, one of which focused on the shape of the yield curve and the other on late cycle risk factors. We currently agree wholeheartedly with both ideas. First off, the shape of the yield curve. During the entire Fed rating hiking cycle, we have noticed that as the short end of the curve moved and as bond bearishness increased, the long end of the curve has shown fantastic relative strength and as declined only moderately. As a result, the curve has been flattening steadily and now stands at a point where the curve for “two and tens” stands just fifty bips away from inverting. While some analysts are dismissing this, we believe it is a significant potential warning of a slow down dead ahead. In the past, yield curve inversions have been an excellent leading gauge for recessions, and while this time, we are not yet dealing with a fully-inverted curve, it is doubtful that an economy as fundamentally fragile as the U.S. is today can tolerate a fully-inverted curve. The recent nine year “recovery” has been a recovery, not for the masses, but for the elite wealthy and those who own assets and were already well off. As David Rosenberg, the fine economist at Gluskin Scheff, (and formerly Merrill Lynch) pointed out in late March, U.S. leading buying plans are sliding very sharply for things like Auto’s, Homes and Appliances. With asset prices trading at rare, nose-bleed levels for many markets, the risk of a cyclical top seems very high. This is illustrated by the downside reversal taking place in Mr. Jim Paulsen of Leuthhold Weeden “Message of the Markets Gauge”. This is where cycles end, and while we believe that equities may spend a few more months in a distribution top environment, the downtrend in Bond Funds has probably ended, with higher prices likely ahead. In our view, the odds are high that the Fed’s recent tightening move will be seen in 20/20 hindsight as a serious policy error, and that it could precipitate a slow down in the months ahead. Given that the Trump Administration is now engaging China on unfair trade practices through the potential use of Tarrifs, there are more balls in the air, and the risk for unanticipated economic outcomes --- i.e. uncertainty - is high, with surprises potentially developing on the downside.
The Gold Stock Technician
13
https://www.zerohedge.com/news/2018-04-08/markets-message-indicator-signals-proceed-caution To that end, we believe now is not a bad time to start slowly wading into the water where the bond market is concerned. Now, we know that among investors, there are many who think that Bonds are a huge risk, or that perhaps with interest rates near record low levels, what’s the point? However, there are a lot of areas of bond funds where yields are descent, especially relative to the bank which pays nothing, and where upside appreciation in the next 12 to 24 months could be very substantial. We would argue, that Bonds as an asset class are cheap right now. Looking at the chart of TLT shown below, note that last year, TLT had one of the two or three biggest declines of the last 25 years and is currently trading much closer to the yearly lows then recent highs. What’s more, while it is still living below a declining medium term moving average, that moving average is beginning to flatten out and we think Bonds are settling into a range for the next month or two, prior to turning up.
Now, TLT is very volatile, and does not pay a very high return. However, there are many bond funds out there
The Gold Stock Technician
14
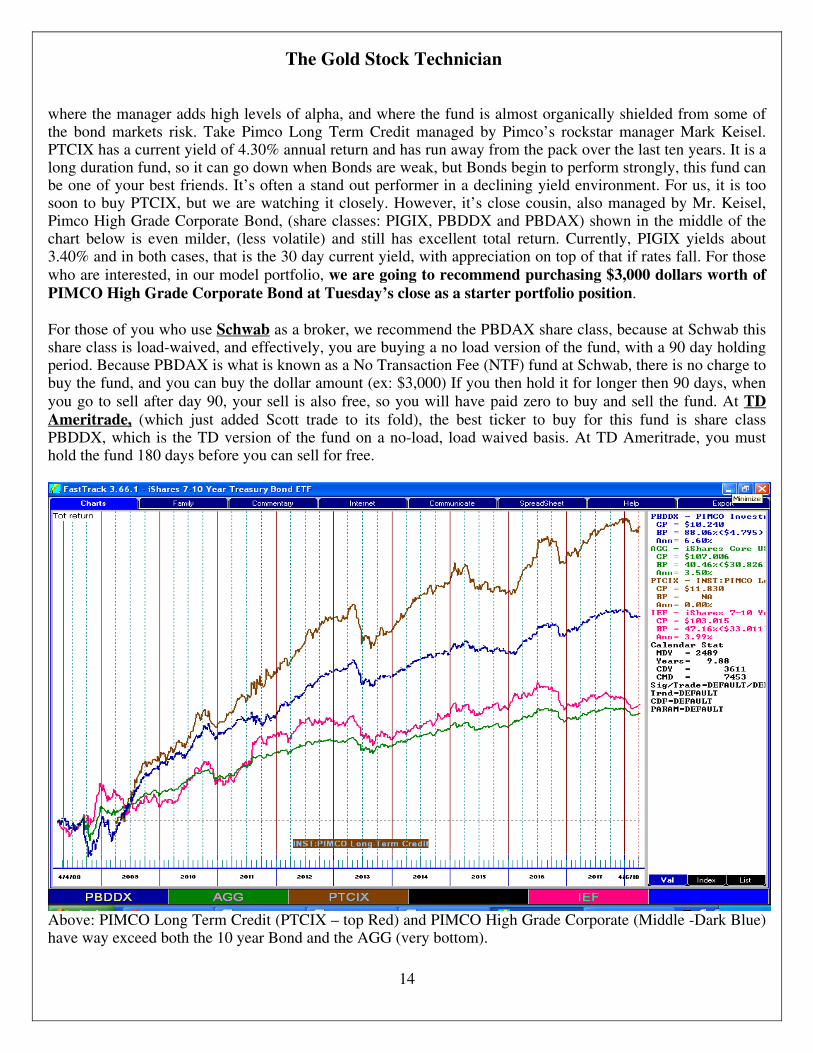
where the manager adds high levels of alpha, and where the fund is almost organically shielded from some of the bond markets risk. Take Pimco Long Term Credit managed by Pimco’s rockstar manager Mark Keisel. PTCIX has a current yield of 4.30% annual return and has run away from the pack over the last ten years. It is a long duration fund, so it can go down when Bonds are weak, but Bonds begin to perform strongly, this fund can be one of your best friends. It’s often a stand out performer in a declining yield environment. For us, it is too soon to buy PTCIX, but we are watching it closely. However, it’s close cousin, also managed by Mr. Keisel, Pimco High Grade Corporate Bond, (share classes: PIGIX, PBDDX and PBDAX) shown in the middle of the chart below is even milder, (less volatile) and still has excellent total return. Currently, PIGIX yields about 3.40% and in both cases, that is the 30 day current yield, with appreciation on top of that if rates fall. For those who are interested, in our model portfolio, we are going to recommend purchasing $3,000 dollars worth of PIMCO High Grade Corporate Bond at Tuesday’s close as a starter portfolio position. For those of you who use Schwab as a broker, we recommend the PBDAX share class, because at Schwab this share class is load-waived, and effectively, you are buying a no load version of the fund, with a 90 day holding period. Because PBDAX is what is known as a No Transaction Fee (NTF) fund at Schwab, there is no charge to buy the fund, and you can buy the dollar amount (ex: $3,000) If you then hold it for longer then 90 days, when you go to sell after day 90, your sell is also free, so you will have paid zero to buy and sell the fund. At TD Ameritrade, (which just added Scott trade to its fold), the best ticker to buy for this fund is share class PBDDX, which is the TD version of the fund on a no-load, load waived basis. At TD Ameritrade, you must hold the fund 180 days before you can sell for free.
Above: PIMCO Long Term Credit (PTCIX – top Red) and PIMCO High Grade Corporate (Middle -Dark Blue) have way exceed both the 10 year Bond and the AGG (very bottom).

The Gold Stock Technician
15
We are comfortable at these levels holding Pimco High Grade Corporate for 6 months or more, so it is OK to make these transaction at either Schwab or TD. If you use another broker, and want to do this trade, our suggestion would be to call their trading desk, and ask for a mutual fund specialist. Then, ask the them which of the two tickers, PBDAX, or PBDDXi is the NTF version of the fund on their platform. PIGIX is the institutional share class and can usually by bought, except it has a decent commission to go in and out at each broker. Some would argue that the lower expense ratio is better on PIGIX, but for smaller portfolios, the NTF share class is usually a good choice as well. If subscribers have questions, and we can be of help, don’t hesitate to drop us an email and we will do our best too guide you. To give you a rough idea of the ten year return on PTCIX (does not quite have ten years of history) and PBDDX versus AGG (the Bond Market benchmark) and IEF (the 10 Year ETF), from May 2009 to present, PTCIX is up 150.28%, PBDDX is up 86.20%, against IEF up 36.77% and AGG up 34.61%. Our point is that both of these funds have alpha and can be a good income producing component in a diversified portfolio. That’s all for now, Frank Disclosures: The Gold Stock Technician (GST) by Frank Barbera is offered to individuals to share some of our views on current markets. Materials in this report are copyrighted and proprietary to Gold Stock Technician and may not be reproduced or distributed without our expressed written approval. All rights are reserved. Past performance is no guarantee of future results. All opinions expressed constitute GST’s judgment as of the date of this report and are subject to change without notice. This information should not be used as the primary basis for investment decisions. It should not be assumed that any security transactions, strategies, holdings or sectors discussed were or will be profitable, or that future recommendations will be profitable or will equal the investment performance discussed herein. Investing in equities and other securities involves risk to your principal. Individual client account performance will vary and no guarantee of any kind is made as to the results that may be obtained from using these reports. These reports are impersonal and do not provide, nor are they intended to provide, individualized advice or recommendations for any specific audience or portfolio. To the maximum extent permitted by law, Gold Stock Technician, Frank Barbera disclaim any and all liability in the event that any information, commentary, analysis, opinions or advice contained in these reports proves to be inaccurate, incomplete or unreliable, or result in losses on any investment. The information provided in these reports is obtained from sources which the author believes to be reliable. However, the author has not independently verified or otherwise investigated all such information. Neither the author, nor GST guarantees the accuracy of any such information.