Return and Shortfall Risks of Rollover Hedge - Strategies with
28
RETURN AND SHORTFALL RISKS OF .., 975 RETURN AND SHORTFALL RISKS OF ROLLOVER HEDGE-STRATEGIES WITH OPTIONS PETERALRRECHT, RAIMOND MAURER AND THOMAS G. STEPHAN INSTITUTE FOR INSURANCE SCIENCES UNIVERSITY OF MANNHEIM D - 68131 MANNHEIM, SCHLOB GERMANY TELEPHONE : +49 621/292-5494 FAX : +49 6211292-5712 E-MAIL : [email protected] Abstract On the basis of a (partially) historical simulation approach the authors evaluate return and shortfall risks of various hedge strategies with options (put hedge: fixed percentage and ratchet strategy; covered short call; collar) which are performed in a roll-over design. The shortfall-risk measures considered are: shortfall probability, shortfall expectation, 5 %-percentile and 1 %-percentile. Transaction costs are included in the analysis. Keywords shortfall risk; rollover hedge strategies
Transcript of Return and Shortfall Risks of Rollover Hedge - Strategies with

RETURN AND SHORTFALL RISKS OF .., 975
RETURN AND SHORTFALL RISKS OF ROLLOVER HEDGE-STRATEGIES WITH OPTIONS
PETER ALRRECHT, RAIMOND MAURER AND THOMAS G. STEPHAN INSTITUTE FOR INSURANCE SCIENCES
UNIVERSITY OF MANNHEIM D - 68131 MANNHEIM, SCHLOB
GERMANY
TELEPHONE : +49 621/292-5494 FAX : +49 6211292-5712
E-MAIL : [email protected]
Abstract
On the basis of a (partially) historical simulation approach the authors evaluate return and shortfall risks of various hedge strategies with options (put hedge: fixed percentage and ratchet strategy; covered short call; collar) which are performed in a roll-over design. The shortfall-risk measures considered are: shortfall probability, shortfall expectation, 5 %-percentile and 1 %-percentile. Transaction costs are included in the analysis.
Keywords
shortfall risk; rollover hedge strategies

976 5TH AFIR INTERNATIONAL COLLOQUIUM
RETURN AND SHORTFALL RISKS OF ROLLOVER HEDGE-STRATEGIES WITH OPTIONS
PETER ALBRECHT,RAIMOND MAURER AND THOMAS G. STEPHAN INSTITUTE FOR INSURANCE SCIENCES
UNIVERSITY OF MANNHEIM D - 68131 MANNHEIM, SCHLOR
GERMANY
TELEPHONE : +49 6211292-5494 FAX : +49 6211292-5712
E-MAIL : [email protected]
R&urn6
Sur la base d’une simulation (partiellement) historique, les auteurs evaluent le rendement et le risque de shortfall des strategies de hedging par options (put hedge: fixed percentage and ratchet strategic; covered short call; collar) employee de facon roulante. Les mesures du risque de shortfall mentionnees dans cet article sont: shortfall-probabilite et shortfall-moyenne, 5%-percentile et 1 %-percentile. Les chutes de transactions sont inclus dans l’analyse.

RETURN AND SHORTFALL RISKS OF . . . 977
1. Intraduction
Due to the publication of FIGLEWSKI et al. (1993) the perform ante of rollover
put-hedge strategies has recently attracted increased interest. Rollover
strategies with options are characterized by the fact that the maturity of the
option position is shorter than a fixed planning horizon making it necessary
to buy (or sell) a sequence of shortm aturity options. In contrast to that static
hedge strategies are characterized by an identical maturity of the option
position and the planning horizon. FIGLEWSKI et al. (1993) show that rollover
hedge strategies give a reasonable protection, but do not reduce return as
much as the corresponding static hedge strategies.
The present paper continues the analysis of rollover option strategies. There
are the following differences compared to the paper of FIGLEWSKI et al.
(1993):
1) The analysis is (at least partially) based on empirical data. FIGLEWSKI
et al. (1993) use a stochastic simulation approach.
2) In addition to alternative put-hedge strategies we analyze covered-
short-call strategies as well as collar strategies.
3) Transaction costs are included in the analysis.
4) We use (inter alia) two measures of shortfall-risk, shortfall
probability and shortfall expectation to quantify the risk of the
strategies considered.
978 5TH AFIR INTERNATIONAL COLLOQUIUM
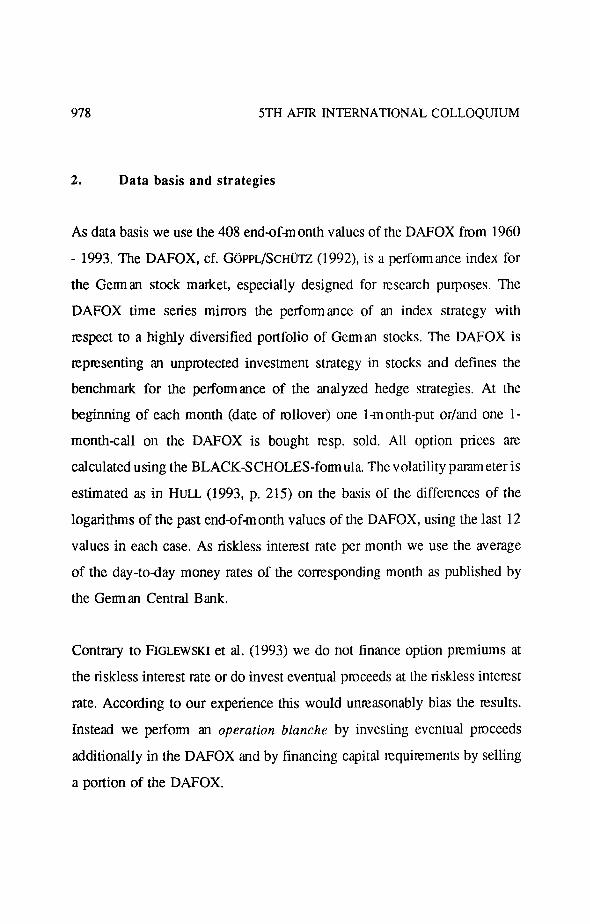
2. Data basis and strategies
As data basis we use the 408 end-ofmonth values of the DAFOX from 1960
- 1993. The DAFOX, cf. G~PPL/SCHUTZ (1992) is a performance index for
the German stock market, especially designed for research purposes. The
DAFOX time series mirrors the performance of an index strategy with
respect to a highly diversified portfolio of Getman stocks. The DAFOX is
representing an unprotected investment strategy in stocks ‘arid defines the
benchmark for the performance of the analyzed hedge strategies. At the
beginning of each month (date of rollover) one l-month-put or/and one l-
month-call on the DAFOX is bought resp. sold. All option prices are
calculated using the BLACK-SCHOLES-formula. The volatility parameter is
estimated as in HULL (1993, p. 215) on the basis of the differences of the
logarithms of the past end-ofmonth values of the DAFOX, using the last 12
values in each case. As riskless interest rate per month we use the average
of the day-today money rates of the corresponding month as published by
the German Central Bank.
Contrary to FIGLEWSKI et al. (1993) we do not finance option premiums at
the riskless interest rate or do invest eventual proceeds at the riskless interest
rate. According to our experience this would unreasonably bias the results.
Instead we perform an operation blanche by investing eventual proceeds
additionally in the DAFOX and by financing capital requirements by selling
a portion of the DAFOX.

RETURN AND SHORTFALL RISKS OF . . . 979
Transaction costs of 1 % of the option premium are assumed when buying
or selling an option. When exercising an option at the end of the month we
additionally assume 0.2 % of the inner value as transaction costs. According
to our investigations these assumptions are corresponding to a realistic order
of magnitude of the transaction costs of institutional investors.
We consider the following hedging strategies with options in our analysis:
I.
A.
Rollover Put-Hedge Strategies
Rollover Fixed-Percentage Strategies
At every rollover date we buy puts on the basis of a fixed-percentage
strategy, i.e. the exercise prices X, are corresponding to a fixed percentage
rate p of the price S, of the DAFOX, the underlying security, i.e. X, =
(p/lOO)S,. We consider one in-themoney strategy (p = 102), one at-the-
money strategy @I = 100) as well as three out-of-themoney strategies (p =
94, 96, 98). At each time one put is bought, however this dots not exactly
correspond to a 1 : 1 strategy.
B. Ratchet Strategies
Ratchet strategies, cf. FIGLEWSKI et al. (1993), are characterized by X, = max
(Xr.l, p S,) = p max (SC.,, S,) which implies X, = max (X0, X,, . . . . X,,) = p max
(S,, . . . . S,-,). The ratchet strategy allows the investor to lock in early gains
without accepting the downside risk of the fixed percentage strategy.
980 5TH AFIR INTERNATIONAL COLLOQUIUM
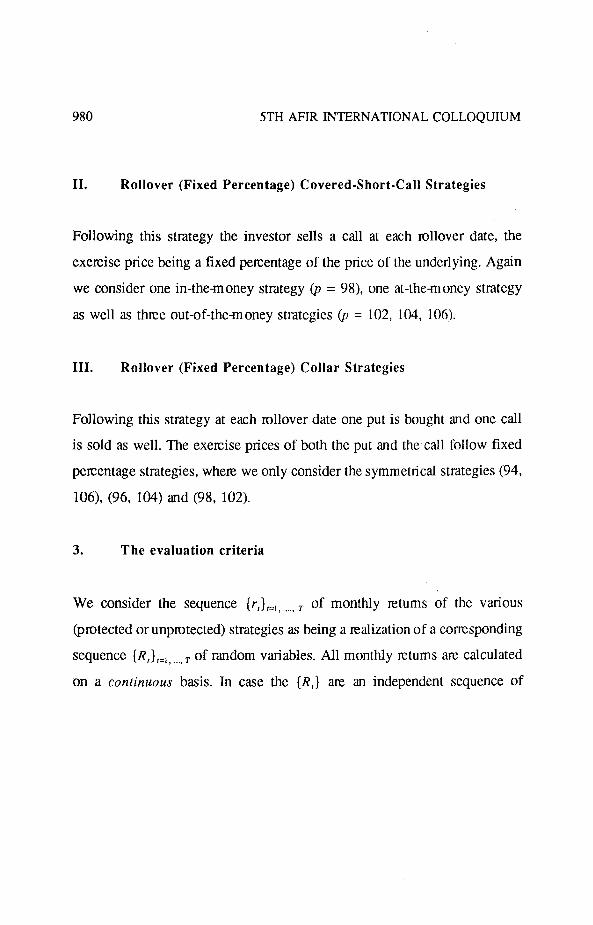
II. Rollover (Fixed Percentage) Covered-Short-Call Strategies
Following this strategy the investor sells a call at each rollover date, the
exercise price being a fixed percentage of the price of the underlying. Again
we consider one in-themoney strategy (p = 98) one at-the-money strategy
as well as three out-of-the-money strategies (p = 102, 104, 106).
III. Rollover (Fixed Percentage) Collar Strategies
Following this strategy at each rollover date one put is bought and one call
is sold as well. The exercise prices of both the put and the call follow fixed
percentage strategies, where we only consider the symmetrical strategies (94,
106), (96, 104) and (98, 102).
3. The evaluation criteria
We consider the sequence {T,},+ ,,,, r of monthly returns of the various
(protected or unprotected) strategies as being a realization of a corresponding
sequence I&) ,=,, __., T of random variables. All monthly tetums are calculated
on a continuous basis. In case the {R,) are an independent sequence of
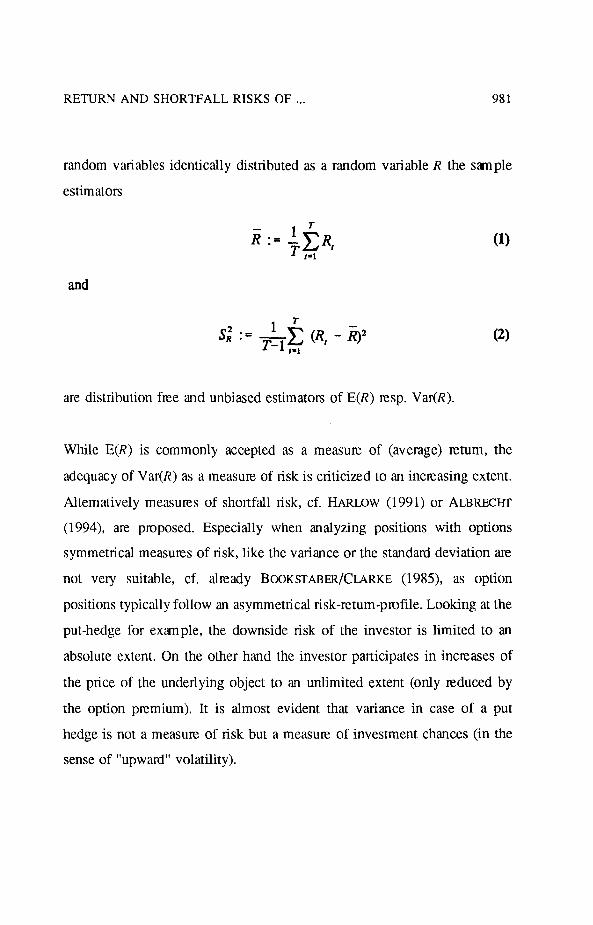
RETURN ANDSHORTFALLRISKS OF... 981
random variables identically distributed as a random variable R the sample
estimators
ii := $R, 1-1
and
SR” := $$ (R, - R)2 t-1 (2)
are distribution free and unbiased estimators of E(R) resp. Var(R).
While E(R) is commonly accepted as a measure of (average) mtum, the
adequacy of Var(R) as a measure of risk is criticized to an increasing extent.
Alternatively measures of shortfall risk, cf. HARLDW (1991) or ALBRECHT
(1994), are proposed. Especially when analyzing positions with options
symmetrical measures of risk, like the variance or the standard deviation are
not very suitable, cf. already BOOKSTABER/CLARKE (1985), as option
positions typically follow an asymmetrical risk-return-profile. Looking at the
put-hedge for example, the downside risk of the investor is limited to an
absolute extent. On the other hand the investor participates in increases of
the price of the underlying object to an unlimited extent (only reduced by
the option premium). It is almost evident that variance in case of a put
hedge is not a measure of risk but a measure of investment chances (in the
sense of “upward” volatility).

982 5TH AFIR INTERNATIONAL COLLOQUIUM
Taking into account the asymmetrical nature of positions with options we
will measure risk by four alternative asymmetrical measures.
At first we consider two measures of shortfall risk. A gcncral class of
shortfall risk measures is given by the lower parliaf moments of degree n 2
0 of R, cf. ALRRECHT (1994):
J-4,0-J = E[max(r, - R, O)“]
‘2 =
I (5 - r>” f(r)dr . -0)
(3)
The quantity rz is a target return, which can be interpreted as a spccilied
minimum return level. In the following we will consistently use a target of -
5% (on a continuous return basis). As risk measures we use the shortfall
probability, which corresponds to the case n = 0, and the shortfall
expectation, which corresponds to the case n = 1.
The other two asymmetrical measures of risk are based on the e-percentile
rs of the distribution F (additionally we assume the existence of a density
function f) of R, defined by
‘1 ES I f(r)dr = F(rJ .
-0 (4)
Obviously shortfall-probability and e-percentile are inversely related
measures of risk. In case of the shortfall probability the target return r2 is
RETURN AND SHORTFALL RISKS OF . . . 983
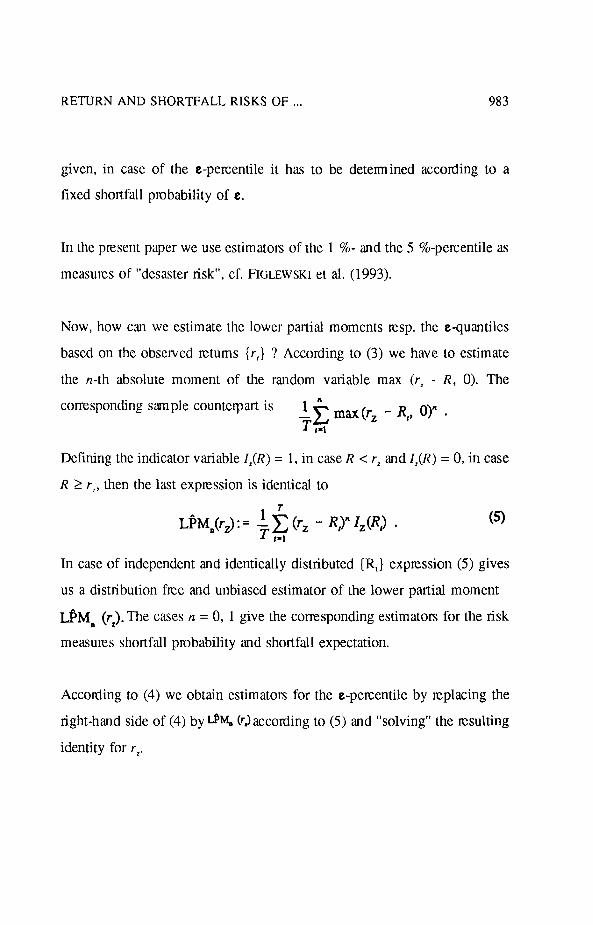
given, in cast of the e-percentile it has to be determined according to a
fixed shortfall probability of e.
In the present paper we use estimators of the 1 %- and the 5 %-percentile as
measures of “desaster risk”, cf. FIGLEWSKI et al. (1993).
Now, how can we estimate the lower partial moments tesp. the e-quantiles
based on the observed returns {r,} ? According to (3) we have to estimate
the n-th absolute moment of the random variable max (r, - R, 0). The
corresponding s‘ample countctpart is
Defining the indicator variable l,(R) = 1, in case R c rz and I,(R) = 0, in case
R 2 rr, then the last expression is identical to
LpM.(rJ : = - RS”I,@,l .
In case of independent and identically distributed {R,) expression (5) gives
us a distribution ftee and unbiased estimator of the lower partial moment
@Mm (rL>. The cases II = 0, 1 give the corresponding estimators for the risk
measures shortfall probability and shortfall expectation.
According to (4) we obtain estimators for the e-percentile by replacing the
right-hand side of (4) by OY @r)accotding to (5) and “solving” the resulting
identity for rz.
984 5TH AFIR INTERNATIONAL COLLOQUIUM
4. Statistical problems of rollover option strategies
As can be verified mathematically, cf. ALBRECHT/MAURER/STEPHAN (1994),
even in case of independent and identically distributed Etums (R,} of the
underlying, the DAFOX, the corresponding sequence of rztums for rollover
option strategies are neither independent nor identically distributed.
FIGLEWSKI et al. (1993) characteri7x mllover option strategies on a more
intuitive basis as path-dependent strategies. This however does imply, that
the estimators (l), (2) and (5) arc loosing their properties in the i.i.d.-case.
The estimators now are only simple descriptive statistical measures and no
more unbiased estimators for the moments of a parent distribution. This has
to be borne in mind, when interpreting the various estimators used in sequel.
5. The average return of rollover hedge strategies
The average return of the underlying, the DAFOX, as well as of the
alternative rollover hedge strategies is estimated on the basis of (1). All
returns calculated are monthly returns on a continuous basis. As a
benchmark the average monthly return of the DAFOX is used, which is
0.6283 %.
The following table contains the average return values for the rollover put-
hedge strategies for the different exercise prices expressed as a percentage
of the price of the underlying, the DAFOX:
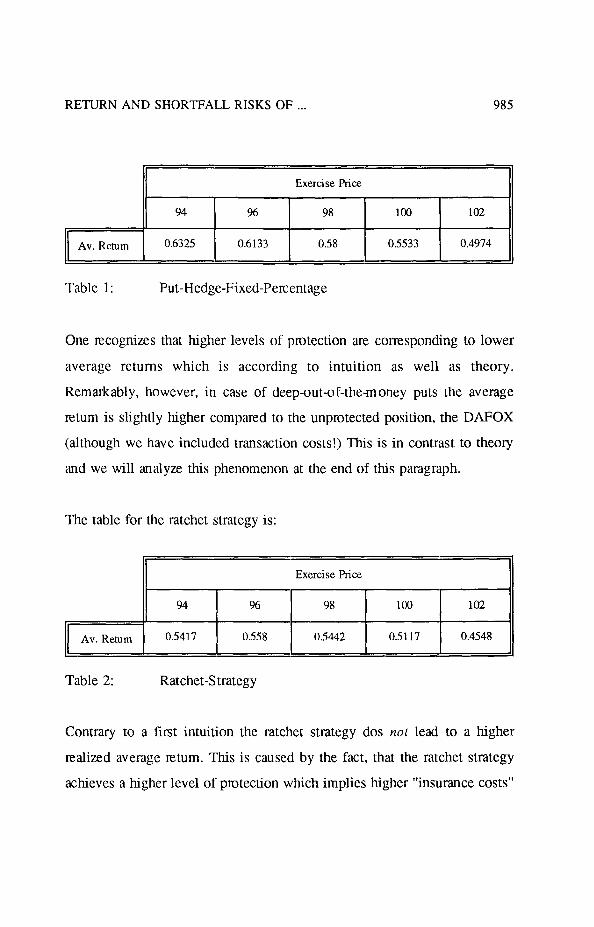
RETURN AND SHORTFALL RISKS OF . . . 985
Exercise price
94 96 98 100 102
Av. Return 0.6325 0.6133 0.58 0.5533 0.4974
Table 1: Put-Hedge-Fixed-Percentage
One recognizes that higher levels of protection are corresponding to lower
average returns which is according to intuition as well as theory.
Remarkably, however, in case of deep-out-of-the-money puts the average
return is slightly higher compared to the unprotected position, the DAFOX
(although we have included transaction costs!) This is in contrast to theory
and we will analyze this phenomenon at the end of this paragraph.
The table for the ratchet strategy is:
Av. Return 94 FFzLJ 0.5417
Table 2: Ratchet-Strategy
Contrary to a first intuition the ratchet strategy dos not lead to a higher
realized average return. This is caused by the fact, that the ratchet strategy
achieves a higher level of protection which implies higher “insurance costs”
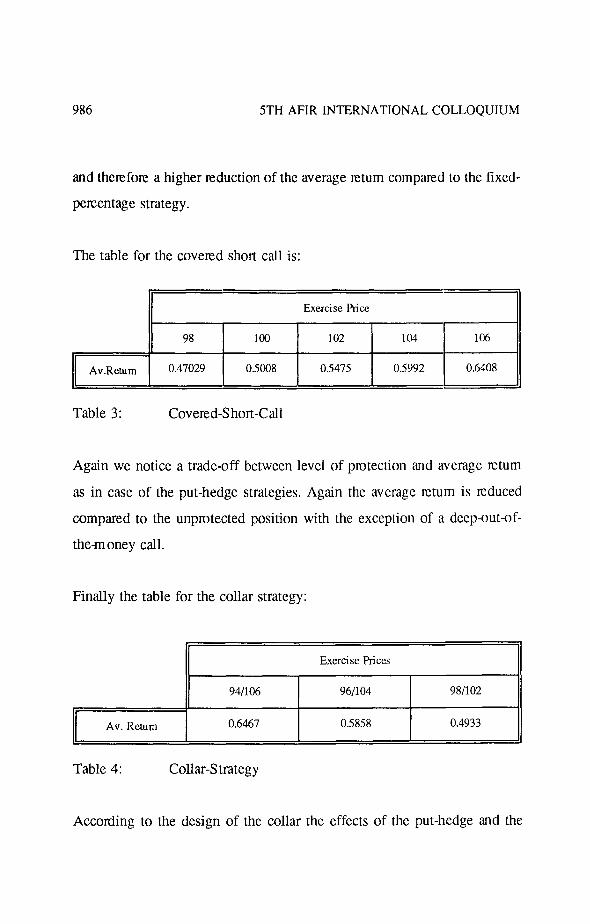
986 5TH AFIR INTERNATIONAL COLLOQUIUM
and therefore a higher reduction of the average ruturn compared to the tixcd-
percentage strategy.
The table for the covered short call is:
Exercise 1% cc
Av.Retum
Table 3:
98 IOU
0.47029 0.5008
Covered-Short-Call
102 104
0.5475 0.5992
Again we notice a trade-off between level of protection and average return
as in case of the put-hedge strategies. Again the average return is reduced
compared to the unprotected position with the exception of a deep-out-of-
the-money call.
Finally the table for the collar strategy:
Exercise Prices
941106 961104 981102
Av. Return 0.6467 0.5858 0.4933
Table 4: Collar-Strategy
According to the design of the collar the effects of the put-hedge and the
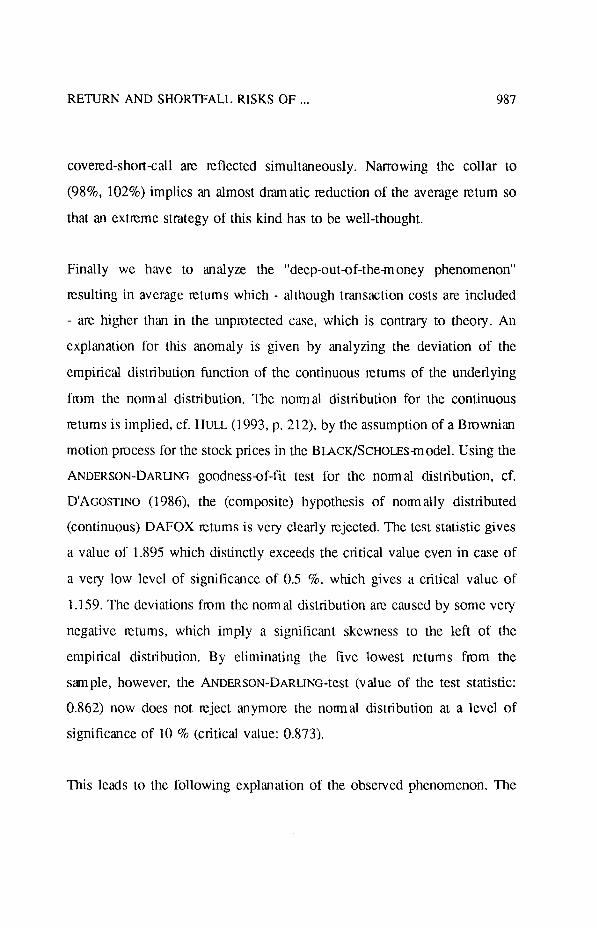
RETURN AND SHORTFALL RISKS OF . . . 987
covered-short-call am reflected simultaneously. Narrowing the collar to
(98%, 102%) implies an almost dramatic reduction of the average return so
that an extreme strategy of this kind has to be well-thought.
Finally we have to analyze the “deep-out-of-them oney phenomenon”
resulting in average returns which - allhough transaction costs are included
- are higher than in the unpmtected case, which is contrary to theory. An
explanation for this anomaly is given by analyzing the deviation of the
empirical distribution function of the continuous tetums of the underlying
from the noun al distribution. The noun al distribution for the continuous
returns is implied, cf. HULL (1993, p. 212), by the assumption of a Brownian
motion process for the stock prices in the BLACK/SCHOLES~ odel. Using the
ANDERSON-DARLING goodness-of-fit test for the norm al distribution, cf.
D’AGOSTINO (1986), the (composite) hypothesis of norm ally distributed
(continuous) DAFOX returns is very clearly rejected. The test statistic gives
a value of 1.895 which distinctly exceeds the critical value even in case of
a very low level of significance of 0.5 %, which gives a critical value of
1.159. The deviations from the nonn al distribution are caused by some very
negative tetums, which imply a significant skewness to the left of the
empirical distribution. By eliminating the five lowest returns ftom the
sample, however, the ANDERSON-DARLING-test (value of the test statistic:
0.862) now does not reject anymore the noun al distribution at a level of
significance of 10 % (critical value: 0.873).
This leads to the following explanation of the observed phenomenon. The

988 5TH AFIR INTERNATIONAL COLLOQUIUM
buyer of deep-out-of-the-money puts takes pmft from the shortfall risks
which are empirically higher than implicitely assumed by the
BLACK/SCHOLES-formula. The writer of deep-out-of-themoney calls takes
profit from the lower mtum chances of the underlying compared to the
normal distribution because of the skewness to the left of the empirical
returns.
6. The risk of rollover option strategies
We first give the frequency diagram for the put-hedge fixed-percentage
strategy in case of p = 96:

RETURN AND SHORTFALL RISKS OF . . . 989
0.14
0.12 1
0.1 0.08
i
0.00 I
0.04
0.02 0 L
Figure 1: Frequency Diagram Put-Hedge Fixed-Pementage 96%
The figure clearly shows the asymmetry of the frequency distribution as well
as the reduction of risk, as intended by the strategy. Mom detailed insight
into the risk of the strategy is given by table 6. All numerical values are
given as a percentage with respect to continuous monthly returns.
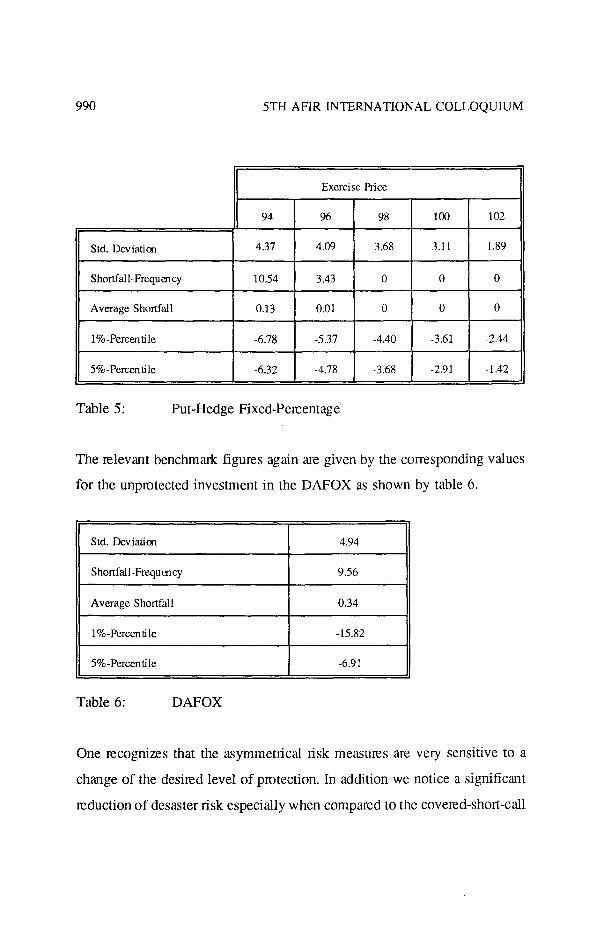
990 5TH AFIR INTERNATIONAL COLLOQUIUM
Exercise Price
94 %
Std. Deviation 4.31 4.09
Shortfall-Frequency 10.54 3.43
Average Shortfall 0.13 0.01
1%~Percentile -6.78 -5.37
5%.Percen tile -6.32 -4.78
Table 5: Put-Hedge Fixed-Percentage
98 100 102
3.68 3.11 1.89
0 0 0
0 0 0
-4.40 -3.61 -2.44
-3.68 1 -2.91 1 -1.42
The relevant benchmark figures again are given by the corresponding values
for the unprotected investment in the DAFOX as shown by table 6.
Std. Deviation
Shortfall-Frequency
Average Shortfall
1%-Percentile
5%-Percentile
Table 6: DAFOX
4.94
9.56
0.34
-15.82
-6.91
One recognizes that the asymmetrical risk measures are very sensitive to a
change of the desired level of protection. In addition we notice a significant
reduction of desaster risk especially when compared to the coveted-short-call
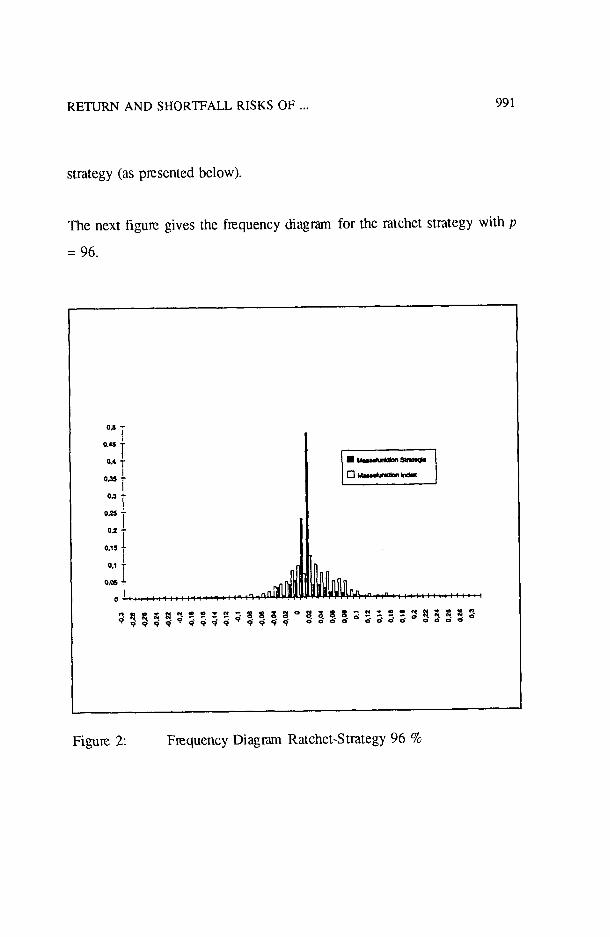
RETURN AND SHORTFALL RISKS OF . . . 991
strategy (as pmented below).
The next figure gives the frequency diagm for the ratchet strategy with p
= 96.
0.5 7
0.45 1 0.4 T
oJ5 i OJ $
01 - 01 - 0.15 0.15 1 1 0.1 L 0.1 L 0.05 0.05 1 1 od od II II
-I
Figure 2: Frequency Diagram Ratchet-Strategy 96 %

992 5TH AFIR INTERNATIONAL COLLOQUIUM
Next we have the corresponding table:
II ~ Exercise Price
94 96 98 100
Std. Deviatim 2.10 2.44 2.13 1.8
Shortfall-Frequency 2.21 0.25 0 0
Average Shortfall 0.026 0.0003 0 0
1%~Percentile -6.37 -4.60 -3.25 -2.12
5%-Pcrcen tile -3.12 -2.51 -2.20 -1.35
Table 7: Ratchet-Strategy
Comparing table 7 to table 5 we notice a generally higher level of risk
reduction for the ratchet strategy. This confinns FKLEWSKI et al. (1993, p.
56), who state: “Our results show that the ratchet’s advantage is not a higher
mean, but its protectiveness, especially against a desaster.”
Figure 3 gives the frequency diagram for the covered-short-call-strategy with
p = 104.

RETURN AND SHORTFALL RISKS OF . . . 993
Figure 3: Frequency Diagram Covered-Short-Call Fixed-Percentage 104 %
One recognizes that compared to the put-hedge strategy there is practically
no protection against desaster risk. This is confirmed by table 8.
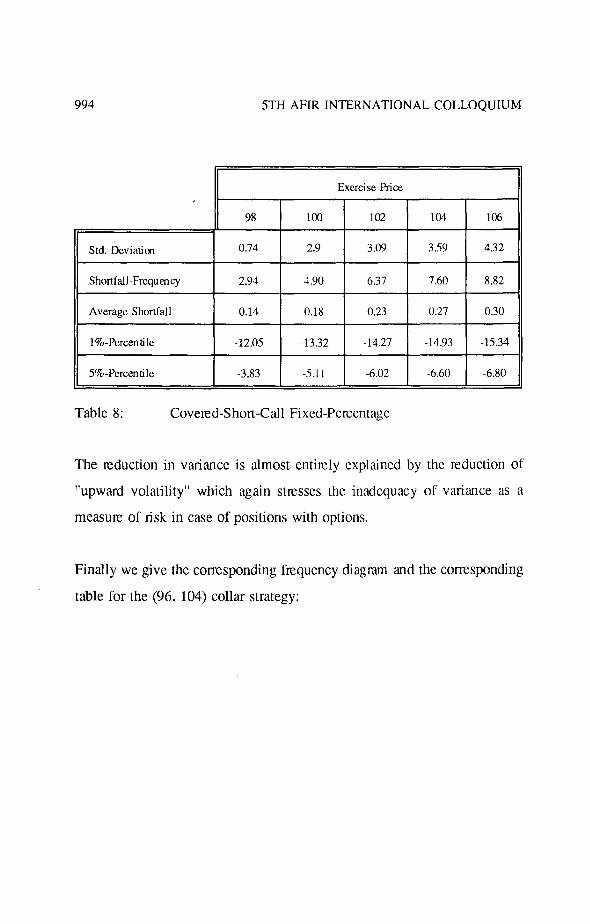
994 5TH AFIR INTERNATIONAL COLLOQUIUM
Exercise Price
98
Std. Ikviatim 0.74
Shortfall-Frequenq 2.94
Average S hortfal 1 0.14
1%~Percentile -12.05
5% -Perccn Ii le -3.83
Table 8: Covered-Short-Call Fixed-Percentage
The reduction in variance is almost entilcly explained by the reduction of
“upward volatility” which again stresses the inadequacy of variance as a
measure of risk in case of positions with options.
Finally we give the corresponding frequency diagmm and the corresponding
table for the (96, 104) collar strategy:
RETURN AND SHORTFALL RISKS OF .._ 995
02
0.11
0.16
0.14
0.12
0.1
0-m 0.m 0.04
0.02
0
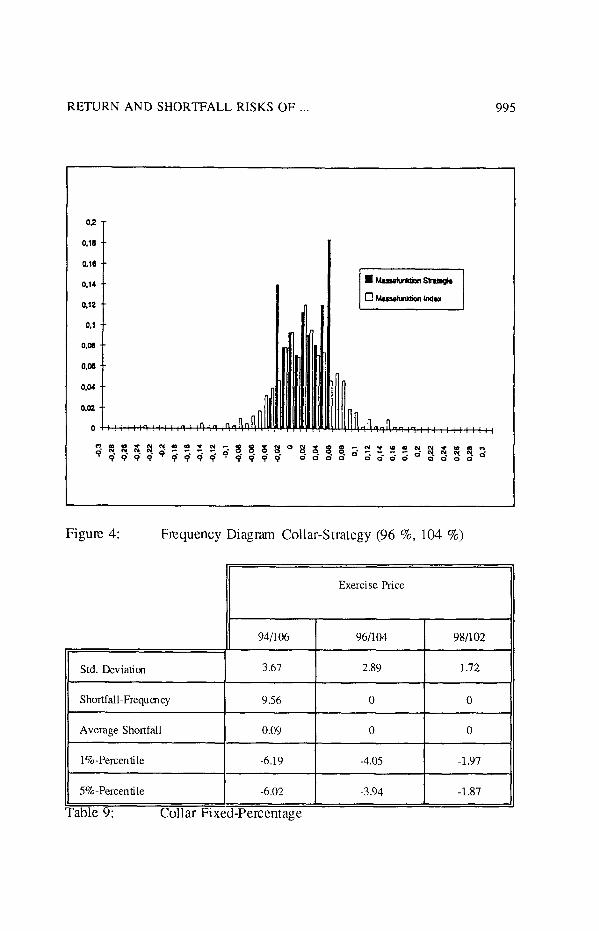
Figure 4: Frequency Diagram Collar-Strategy (96 %, 104 %)
Std. Deviatim
/ 941106 I 961104 I 98/102
3.67 I 2.89 I 1.72
Shortfall-Frequency
Average Shortfall
1%~Percentile
5%.Percentile
able 9: Collar Fixekrercentage
9.56 0 0
0.09 0 0
-6.19 -4.05 -1.97
-6.02 -3.94 -1.87 1-
Exercise Price
996 5TH AFIR INTERNATIONAL COLLOQUIUM
The collar strategy gives the highest risk reduction for all measures of risk.
However, as we have seen in paragraph 5, this is also true for the reduction
of the average return.
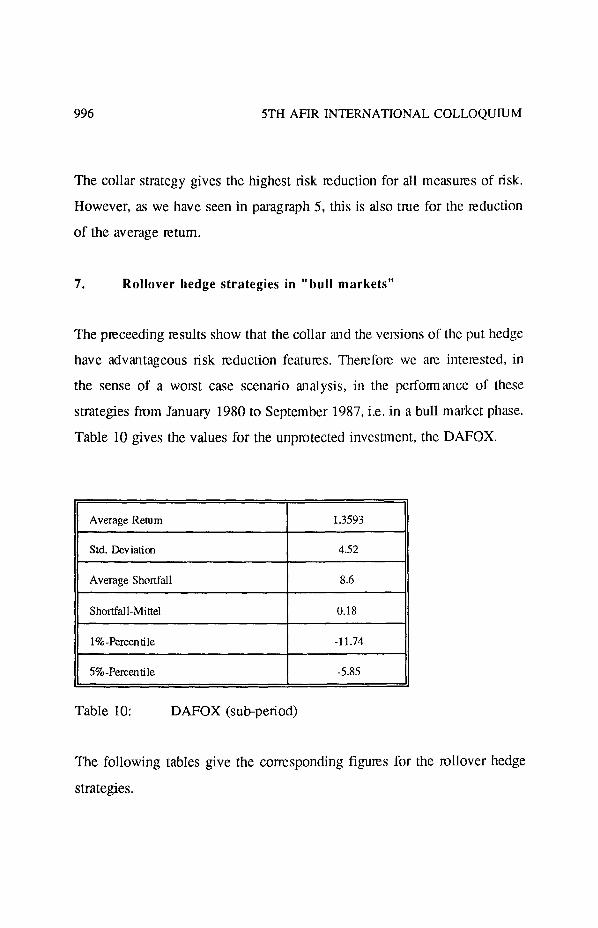
7. Rollover hedge strategies in “bull markets”
The pteceeding results show that the collar and the versions of the put hedge
have advantageous risk reduction features. Therefore we am interested, in
the sense of a worst case scenario analysis, in the performance of these
strategies from January 1980 to September 1987, i.e. in a bull market phase.
Table 10 gives the values for the unpmtected investment, the DAFOX.
Average Return
Std. Deviation
Average Shortfall
Shortfall-Mittel
1%-Percentile
5%-Percentile
Table 10: DAFOX (sub-period)
1.3593
4.52
8.6
0.18
-11.74
-5.85
The following tables give the corresponding figures for the rollover hedge
strategies.
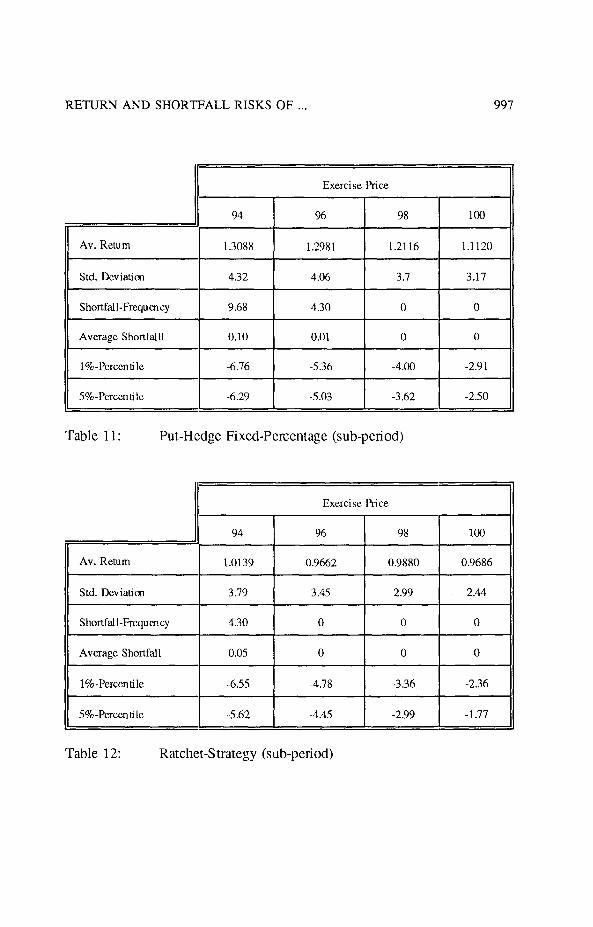
RETURN AND SHORTFALL RISKS OF .., 997
Exercise Price
Av. Return
Std. Deviation
Average Shortfall1
1%.Percenti Ic
Table 11: Put-Hedge Fixed-Percentage (sub-period)
Exercise Price
94 96 98 100
Av. Return 1.0139 0.9662 0.9880 0.9686
Std. Deviation 3.19 3.45 2.99 2.44
Shortfall-Frequency 4.30 0 0 0
Average Shortfall 0.05 0 0 0
l%-Percentile -6.55 -4.78 -3.36 -2.36
5%-Percentile -5.62 -4.45 -2.99 -1.77
Table 12: Ratchet-Strategy (sub-period)
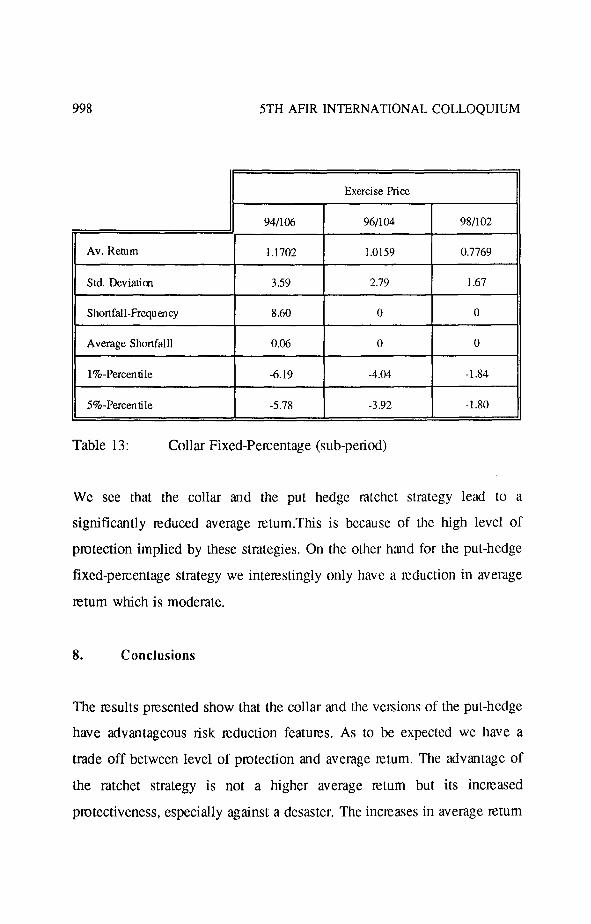
998 5TH AFIR INTERNATIONAL COLLOQUIUM
II Exercise price 1
941106 96/l 04 98/102
Av. Return 1.1702 1.0159 0.7769
Std. Deviation 3.59 2.79 1.67
Shortfall-Frequency 8.60 0 0
Average Shortfall1 0.06 0 0
1%-Percentile -6.19 -4.04 -1.84
5%-Percentile -5.78 -3.92 -1.80
Table 13: Collar Fixed-Percentage (sub-period)
We see that the collar and the put hedge ratchet strategy lead to a
significantly mduccd average retum.This is because of the high level of
protection implied by these strategies. On the other hand for the put-hedge
fixed-percentage strategy we interestingly only have a reduction in average
return which is moderate.
8. Conclusions
The results presented show that the collar and the versions of the put-hedge
have advantageous risk reduction features. As to be expected we have a
trade off between level of protection and average return. The advantage of
the ratchet strategy is not a higher average return but its increased
protectiveness, especially against a desaster. The increases in average return

RETURN AND SHORTFALL RISKS OF . . . 999
observed when analyzing deep-out-of-the-money positions are not of a
systematic nattnc. In the “bull market phase” 1980 - 1987 we observe that
the fixed-percentage strategy leads only to a moderate reduction of the
average rctum.

1000 5TH AFIR INTERNATIONAL COLLOQUIUM
References
ALBRECH~, P.; R. MAURER; T. STEPHAN (1994): Ertrag und Shortfall-
Risikcn rollierender Wertsicherungsstrategicn mit Optionen,
Mannheimer Manuskripte zu Versicherungsbetriebslehre,
Finanrm anagement und Risikotheorie No. 69, 08/94 Mannheim.
ALBRECW, P. (1994): Shortfall Returns and Shortfall Risk, Actuarial
Approach for Financial Risks, Proceedings of the 4th AFIR
International Colloquium, Orlando, Vol. 1, pp. 87 - 110.
BLACK, F.; M. SCHOLES (1973): The Pricing of Options and Corporate
Liabilities, Journal of Political Economy, Vol. 81, pp. 637 - 654.
BOOKSTABER, R.; R. CLARKE (198.5): Option Portfolio Strategies:
Measurement and Evaluation, Financial Analysts Journal,
January/February 1985, pp. 48 - 62.
D’AGOSTINO, R. B. (1986): Tests for the Normal Distribution, in:
D’AGOSTIONO, R. B.; M. A. STEPHENS (ed.): Goodness-of-Fit
Techniques, Marcel Dekker, New Yolk, pp. 367 - 419.
FIGLEWSKI, S.; N. K. CHIDAMBARAN; S. KAPLAN (1993): Evaluating the
Performance of the Protective Put Strategy, Financial Analysts
Journal, July/August 1993, pp. 46 - 56.
RETURN AND SHORTFALL RISKS OF . . . 1001
G~PPL, H.; H. SCH~BZ (1992): Die Konzeption eines Deutschen Aktienindex
fiir Forschungszwecke, Working Paper No. 162. University
Karlsmhe.
HARLOW, W. V. (1991): Asset Allocation in a Downside Risk Framewok,
Financial Analysts Journal, September/October 1991, pp. 28 -40.
HULL, J. (1993): Options, Futures, and other Derivative Securities, 2.
edition, Englewood Cliffs N.J.