Reticulon and CLIMP-63 regulate nanodomain organization of ...
19
RESEARCH ARTICLE Reticulon and CLIMP-63 regulate nanodomain organization of peripheral ER tubules Guang Gao, Chengjia ZhuID ☯ , Emma Liu ☯ , Ivan R. Nabi ID * Department of Cellular and Physiological Sciences, Life Sciences Institute, University of British Columbia, Vancouver, Canada ☯ These authors contributed equally to this work. * [email protected] Abstract The endoplasmic reticulum (ER) is an expansive, membrane-enclosed organelle composed of smooth peripheral tubules and rough, ribosome-studded central ER sheets whose mor- phology is determined, in part, by the ER-shaping proteins, reticulon (RTN) and cytoskele- ton-linking membrane protein 63 (CLIMP-63), respectively. Here, stimulated emission depletion (STED) super-resolution microscopy shows that reticulon4a (RTN4a) and CLIMP- 63 also regulate the organization and dynamics of peripheral ER tubule nanodomains. STED imaging shows that lumenal ER monomeric oxidizing environment-optimized green fluorescent protein (ERmoxGFP), membrane Sec61βGFP, knock-in calreticulin-GFP, and antibody-labeled ER-resident proteins calnexin and derlin-1 are all localized to periodic puncta along the length of peripheral ER tubules that are not readily observable by diffrac- tion limited confocal microscopy. RTN4a segregates away from and restricts lumenal blob length, while CLIMP-63 associates with and increases lumenal blob length. RTN4a and CLIMP-63 also regulate the nanodomain distribution of ER-resident proteins, being required for the preferential segregation of calnexin and derlin-1 puncta away from lumenal ERmoxGFP blobs. High-speed (40 ms/frame) live cell STED imaging shows that RTN4a and CLIMP-63 regulate dynamic nanoscale lumenal compartmentalization along peripheral ER tubules. RTN4a enhances and CLIMP-63 disrupts the local accumulation of lumenal ERmoxGFP at spatially defined sites along ER tubules. The ER-shaping proteins RTN and CLIMP-63 therefore regulate lumenal ER nanodomain heterogeneity, interaction with ER- resident proteins, and dynamics in peripheral ER tubules. Introduction Since the initial Singer-Nicholson fluid mosaic model of free membrane diffusion in the 1980s, the role of membrane nanodomains in the control of protein and lipid dynamics in the plasma membrane, regulating signal transduction, endocytosis and exocytosis, and thereby cellular behavior has been extensively characterized [1]. In contrast, the nanodomain organization of organellar membrane structures remains poorly defined. The endoplasmic reticulum (ER) is a continuous membrane network that is classically divided into central ribosome-studded rough ER sheets, the site of protein synthesis, and PLOS Biology | https://doi.org/10.1371/journal.pbio.3000355 August 30, 2019 1 / 19 a1111111111 a1111111111 a1111111111 a1111111111 a1111111111 OPEN ACCESS Citation: Gao G, Zhu C, Liu E, Nabi IR (2019) Reticulon and CLIMP-63 regulate nanodomain organization of peripheral ER tubules. PLoS Biol 17 (8): e3000355. https://doi.org/10.1371/journal. pbio.3000355 Academic Editor: Sandra L. Schmid, UT Southwestern Medical Center, UNITED STATES Received: February 19, 2019 Accepted: July 26, 2019 Published: August 30, 2019 Copyright: © 2019 Gao et al. This is an open access article distributed under the terms of the Creative Commons Attribution License, which permits unrestricted use, distribution, and reproduction in any medium, provided the original author and source are credited. Data Availability Statement: All relevant data are within the paper and its Supporting Information files. Funding: This work was supported by the Canadian Institutes of Health Research (PJT- 148698), the National Science and Engineering Research Council of Canada (RGPIN 227925-13), and the Canada Foundation for Innovation/British Columbia Knowledge Development Fund (LEF 30636) to IRN. GG is the recipient of a UBC Four Year Doctoral Fellowship and CZ the recipient of an NSERC Undergraduate Student Research Award.
Transcript of Reticulon and CLIMP-63 regulate nanodomain organization of ...

RESEARCH ARTICLE
Reticulon and CLIMP-63 regulate nanodomain
organization of peripheral ER tubules
Guang Gao, Chengjia ZhuID☯, Emma Liu☯, Ivan R. NabiID*
Department of Cellular and Physiological Sciences, Life Sciences Institute, University of British Columbia,
Vancouver, Canada
☯ These authors contributed equally to this work.
Abstract
The endoplasmic reticulum (ER) is an expansive, membrane-enclosed organelle composed
of smooth peripheral tubules and rough, ribosome-studded central ER sheets whose mor-
phology is determined, in part, by the ER-shaping proteins, reticulon (RTN) and cytoskele-
ton-linking membrane protein 63 (CLIMP-63), respectively. Here, stimulated emission
depletion (STED) super-resolution microscopy shows that reticulon4a (RTN4a) and CLIMP-
63 also regulate the organization and dynamics of peripheral ER tubule nanodomains.
STED imaging shows that lumenal ER monomeric oxidizing environment-optimized green
fluorescent protein (ERmoxGFP), membrane Sec61βGFP, knock-in calreticulin-GFP, and
antibody-labeled ER-resident proteins calnexin and derlin-1 are all localized to periodic
puncta along the length of peripheral ER tubules that are not readily observable by diffrac-
tion limited confocal microscopy. RTN4a segregates away from and restricts lumenal blob
length, while CLIMP-63 associates with and increases lumenal blob length. RTN4a and
CLIMP-63 also regulate the nanodomain distribution of ER-resident proteins, being required
for the preferential segregation of calnexin and derlin-1 puncta away from lumenal
ERmoxGFP blobs. High-speed (40 ms/frame) live cell STED imaging shows that RTN4a
and CLIMP-63 regulate dynamic nanoscale lumenal compartmentalization along peripheral
ER tubules. RTN4a enhances and CLIMP-63 disrupts the local accumulation of lumenal
ERmoxGFP at spatially defined sites along ER tubules. The ER-shaping proteins RTN and
CLIMP-63 therefore regulate lumenal ER nanodomain heterogeneity, interaction with ER-
resident proteins, and dynamics in peripheral ER tubules.
Introduction
Since the initial Singer-Nicholson fluid mosaic model of free membrane diffusion in the 1980s,
the role of membrane nanodomains in the control of protein and lipid dynamics in the plasma
membrane, regulating signal transduction, endocytosis and exocytosis, and thereby cellular
behavior has been extensively characterized [1]. In contrast, the nanodomain organization of
organellar membrane structures remains poorly defined.
The endoplasmic reticulum (ER) is a continuous membrane network that is classically
divided into central ribosome-studded rough ER sheets, the site of protein synthesis, and
PLOS Biology | https://doi.org/10.1371/journal.pbio.3000355 August 30, 2019 1 / 19
a1111111111
a1111111111
a1111111111
a1111111111
a1111111111
OPEN ACCESS
Citation: Gao G, Zhu C, Liu E, Nabi IR (2019)
Reticulon and CLIMP-63 regulate nanodomain
organization of peripheral ER tubules. PLoS Biol 17
(8): e3000355. https://doi.org/10.1371/journal.
pbio.3000355
Academic Editor: Sandra L. Schmid, UT
Southwestern Medical Center, UNITED STATES
Received: February 19, 2019
Accepted: July 26, 2019
Published: August 30, 2019
Copyright: © 2019 Gao et al. This is an open
access article distributed under the terms of the
Creative Commons Attribution License, which
permits unrestricted use, distribution, and
reproduction in any medium, provided the original
author and source are credited.
Data Availability Statement: All relevant data are
within the paper and its Supporting Information
files.
Funding: This work was supported by the
Canadian Institutes of Health Research (PJT-
148698), the National Science and Engineering
Research Council of Canada (RGPIN 227925-13),
and the Canada Foundation for Innovation/British
Columbia Knowledge Development Fund (LEF
30636) to IRN. GG is the recipient of a UBC Four
Year Doctoral Fellowship and CZ the recipient of an
NSERC Undergraduate Student Research Award.

peripheral smooth ER tubules, implicated in lipid synthesis and detoxification [2–5]. A family
of ER-shaping proteins that maintain sheet or tubule architecture include the cytoskeleton-
linking membrane protein 63 (CLIMP-63), ribosome-interacting protein p180, reticulon
(RTN), atlastin (ATL), and deleted in polyposis 1 (DP1/Yop1p) [4–8]. RTN has two hydropho-
bic hairpins that could form a wedge-like structure, causing local ER curvature by replacing
the lipids in the outer leaflet of the lipid bilayer [9], and has been implicated in peripheral ER
tubule formation [3,10–12]. CLIMP-63 is predominantly associated with central ER sheet for-
mation and has been proposed to function as a spacer that maintains ER sheets [6]. ATL
induces membrane fusion and the formation of three-way junctions [4,8]. RTN family mem-
ber reticulon4a (RTN4a) induces the expansion of peripheral ER tubules, while CLIMP-63
promotes ER sheet formation; the relative expression of these two ER-shaping proteins deter-
mines the cellular abundance of ER sheets versus tubules [3,6,12]. CLIMP-63 has also been
localized to peripheral ER tubules [13] and, here, we use stimulated emission depletion
(STED) super-resolution imaging to show that RTN4a and CLIMP-63 regulate the nanodo-
main organization and dynamics of peripheral ER tubules.
The thickness of an ER sheet and the diameter of an ER tubule are typically 30–100 nm
[2,14], below the diffraction limit of visible light (approximately 200 nm), hindering the char-
acterization of ER structure by standard confocal fluorescence microscopy. In addition to
these spatial limitations, the ER is a highly dynamic organelle and its study in live cells requires
high temporal resolution; recent use of high-speed, super-resolution imaging techniques sug-
gested that peripheral ER sheets are densely packed tubular arrays [13]. STED super-resolution
microscopy [15] obtains lateral resolution of approximately 50 nm, and the pioneering appli-
cation of STED imaging to the ER revealed ring structures formed by the tubular network of
the ER that were not observed by conventional confocal microscopy [16]. A more recent
STED analysis identified the presence of dynamic nanoholes in peripheral ER sheets [17]. Sin-
gle molecule super-resolution particle tracking of an ER lumenal reporter demonstrated the
existence of active ER lumenal flow in peripheral ER tubules [18], while high-speed, super-res-
olution grazing incidence structured illumination microscopy (GI-SIM) identified lumenal
bulges and constrictions along ER tubules [19].
However, molecular mechanisms that regulate the organization of ER nanodomains remain
to be defined. Here, we apply STED microscopy to study lumenal compartmentalization in
peripheral ER tubules using the lumenal ER reporter ER monomeric oxidizing environment-
optimized green fluorescent protein (ERmoxGFP). ERmoxGFP contains the bovine prolactin
signal sequence and Lys-Asp-Glu-Leu (KDEL) ER retention sequence linked to monomeric,
cysteine-less moxGFP, a modified inert GFP optimized for use in oxidizing environments that
minimally perturbs the cell [20]. We find that ERmoxGFP defines local lumenal filling of
nanodomains that are segregated from membrane-associated ER proteins along peripheral ER
tubules. RTN enhances and CLIMP-63 disrupts the spatial localization of these lumenal nano-
domains along ER tubules, thereby impacting the segregation of membrane-associated ER
proteins from lumenal ER nanodomains.
Results
STED super-resolution microscopy reveals nanoscale periodicity in ER
tubules
The peripheral ER imaged by diffraction limited confocal microscopy presents a highly reticu-
lar network of interconnected ER tubules. Super-resolution two-dimensional (2D) STED live
cell imaging of HT-1080 fibrosarcoma and COS-7 cells transfected with the ER lumenal
reporter ERmoxGFP [20] shows that peripheral ER tubules are highly periodic and composed
Reticulon and CLIMP-63 organize ER nanodomains
PLOS Biology | https://doi.org/10.1371/journal.pbio.3000355 August 30, 2019 2 / 19
The funders had no role in study design, data
collection and analysis, decision to publish, or
preparation of the manuscript.
Competing interests: The authors have declared
that no competing interests exist.
Abbreviations: ATL, atlastin; BiP, binding
immunoglobulin protein; CLIMP-63, cytoskeleton-
linking membrane protein 63; CoV, coefficient of
variation; Cas9, CRISPR-associated protein 9;
CRISPR, clustered regularly interspaced
palindromic repeat; CTL, control; DP1, deleted in
polyposis 1; ER, endoplasmic reticulum; ERAD,
ER-associated protein degradation; ERmoxGFP, ER
monomeric oxidizing environment-optimized green
fluorescent protein; FBS, fetal bovine serum;
FWHM, full width at half maximum; GI-SIM,
grazing incidence structured illumination
microscopy; Gp78, glycoprotein 78; GRP78,
glucose-regulated protein 78; KDEL, Lys-Asp-Glu-
Leu; KI, knock-in; mRFP, monomeric red
fluorescent protein; PBS, Phosphate-Buffered
Saline; ROI, region of interest; RTN, reticulon;
RTN4a, reticulon4a; SD, standard deviation; siRNA,
small interfering RNA; STED, stimulated emission
depletion; Stx17, Syntaxin-17; 2D, two-
dimensional; 3D, three-dimensional.

of tubules showing discrete densities of ERmoxGFP (Fig 1A). Peripheral ER tubule periodici-
ties are observed by 2D STED live cell imaging of ERmoxGFP transfected HT-1080 and COS-
7 cells, at a temporal resolution of 0.8 seconds per frame (S1 Video). Peripheral ER tubule peri-
odicities are also observed in cells fixed with 3% paraformaldehyde/0.2% glutaraldehyde (Fig
1A), an established fixation protocol that preserves ER architecture [13,21–23].
Line scan analysis shows distinct maxima and minima corresponding to local enrichment
and depletion, respectively, of the fluorescent signal from the lumenal ERmoxGFP reporter
along peripheral ER tubules in fixed and live cells (Fig 1B). ER tubule line scan analysis of raw
STED images matches that of the deconvolved image; deconvolution effectively reduces noise
along the line scan, which is increased for live cell scans due to refractive index mismatching
of the imaging media, without impacting blob (maxima) size or distribution (Fig 1B). ER
lumenal blob length, determined from the full width at half maximum (FWHM) measurement
of maxima in line scan analysis, is equivalent along ER tubules in both live and fixed cells (Fig
1C). STED analysis of fixed cells has therefore retained nanodomain features of ER tubules
observed in live cells.
As RTN4a promotes ER tubule formation [3,10–12], we therefore assessed whether it also
regulates peripheral ER tubule periodicity. Upon RTN4 small interfering RNA (siRNA) knock-
down, lumenal ERmoxGFP-labeled maxima in peripheral ER tubules are elongated relative to
control (Fig 2A and 2B), as indicated by arrowheads; CLIMP-63 siRNA knockdown did not
alter the periodic distribution of this lumenal ER reporter (Fig 2A and 2B). To quantify periph-
eral ER tubule periodicity, we measured maxima (blob) length, variation in maxima length
(standard deviation [SD]) and maxima-to-minima fluorescence intensity differentials from
line scans of ER tubules (i.e., Fig 1B). Significantly increased maxima length, increased varia-
tion of maxima length, and reduction in maxima-to-minima intensity differential are observed
for ER tubules of RTN4 knockdown cells (Fig 2C). No significant changes in these parameters
were observed for ER tubules of CLIMP-63 knockdown cells (Fig 2C) compared with cells
transfected with control siRNA. This suggests that RTN4 not only induces peripheral ER
tubule formation but also regulates the nanodomain organization of these ER tubules.
We then tested whether overexpression of mCherry-RTN4a, mCherry-CLIMP-63, and, as a
control, mCherry-ATL1, impacts lumenal nanodomain organization in peripheral ER tubules.
ERmoxGFP-transfected HT-1080 cells show expansion of the central ER and reduction of
peripheral tubules upon mCherry-CLIMP-63 overexpression, formation of an extended net-
work of peripheral tubules upon mCherry-RTN4a overexpression, and increased branched
peripheral ER structures upon mCherry-ATL1 overexpression (Fig 3A), consistent with previ-
ous reports on these ER-shaping proteins [3,6,9,12,24]. Similar to RTN4 knockdown (Fig 2B
and 2C), mCherry-CLIMP-63 overexpression induces the formation of elongated lumenal
ERmoxGFP blobs along ER tubules that overlap with mCherry-CLIMP-63 (Fig 3A). In con-
trast, upon mCherry-RTN4a overexpression, both ERmoxGFP and mCherry-RTN4a show
highly periodic distributions that present minimal overlap (Fig 3A).
Line scan quantification of ERmoxGFP in peripheral ER tubules of HT-1080 cells shows
that mCherry-CLIMP-63 transfection decreases lumenal periodicity. ERmoxGFP tubules pres-
ent significantly increased maxima length, increased variation in maxima length, and
decreased maxima-to-minima intensity differentials. In contrast, overexpressed mCherry-
RTN4a enhances the periodicity of ERmoxGFP, reducing the variation of maxima length and
increasing maxima-to-minima intensity differentials. mCherry-ATL1 overexpression does not
impact maxima length, variation of maxima length, or maxima-to-minima differentials (Fig
3B). To quantify the extent of overlap of ERmoxGFP nanodomains with the different ER-shap-
ing proteins, we counted the number of ER-shaping protein puncta localized to ERmoxGFP
maxima or minima in line scans of individual peripheral ER tubules. mCherry-CLIMP-63 is
Reticulon and CLIMP-63 organize ER nanodomains
PLOS Biology | https://doi.org/10.1371/journal.pbio.3000355 August 30, 2019 3 / 19
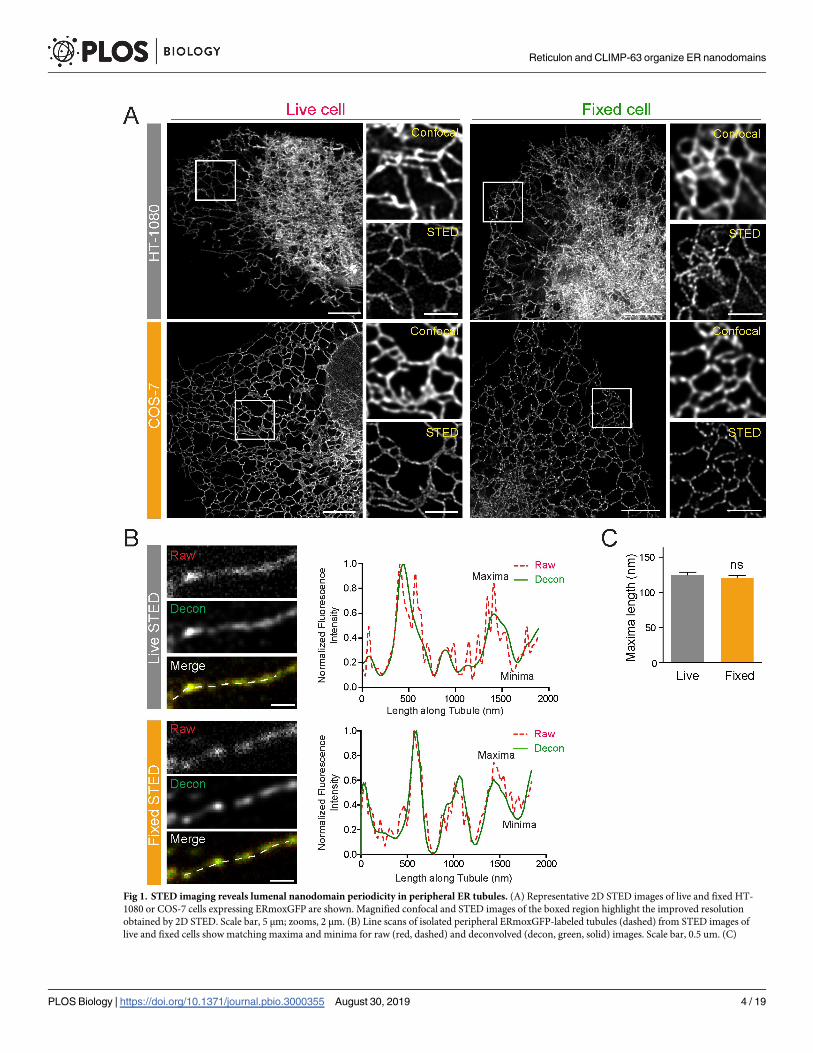
Fig 1. STED imaging reveals lumenal nanodomain periodicity in peripheral ER tubules. (A) Representative 2D STED images of live and fixed HT-
1080 or COS-7 cells expressing ERmoxGFP are shown. Magnified confocal and STED images of the boxed region highlight the improved resolution
obtained by 2D STED. Scale bar, 5 μm; zooms, 2 μm. (B) Line scans of isolated peripheral ERmoxGFP-labeled tubules (dashed) from STED images of
live and fixed cells show matching maxima and minima for raw (red, dashed) and deconvolved (decon, green, solid) images. Scale bar, 0.5 um. (C)
Reticulon and CLIMP-63 organize ER nanodomains
PLOS Biology | https://doi.org/10.1371/journal.pbio.3000355 August 30, 2019 4 / 19

Length of ERmoxGFP maxima/blob was measured in 2D STED images of peripheral ER tubules in live and fixed cells. Values plotted are mean ± SEM
from three independent experiments (10–20 line scans/each repeat). Significance assessed by Student t test. Numerical values that underlie the graph are
shown in S1 Data. ER, endoplasmic reticulum; ERmoxGFP, ER monomeric oxidizing environment-optimized green fluorescent protein; ns, not
significant; STED, stimulated emission depletion; 2D, two-dimensional.
https://doi.org/10.1371/journal.pbio.3000355.g001
Fig 2. RTN4 regulates lumenal ER nanodomain periodicity. (A) Western blots of siCTL–, siRTN4–, and siCLIMP-63–transfected HT-
1080 cells were probed with anti-RTN4, anti-CLIMP-63, and anti-β-actin as a loading control. (B) Representative images of ER tubules in
HT-1080 cells transfected with ERmoxGFP and siCTL, siRTN4, or siCLIMP-63. Arrowheads indicate the tubules with increased blob
length. Scale bar, 2 μm. (C) The quantification of maxima length, variation of maxima length (SD), and maxima-minima intensity
differentials of ER tubules in HT-1080 cells transfected with siRTN4, siCLIMP-63, or siCTL. Bar graphs show mean ± SEM and scatter dot
plots median with interquartile range. Significance assessed by Student t test from three independent experiments (20–40 line scans/each
repeat). ��P< 0.01; ���P< 0.001. Numerical values that underlie the graphs and plots are shown in S1 Data. CLIMP-63, cytoskeleton-
linking membrane protein 63; ER, endoplasmic reticulum; ERmoxGFP, ER monomeric oxidizing environment-optimized green fluorescent
protein; ns, not significant; RTN4, reticulon4; SD, standard deviation; siCLIMP-63, siRNA to CLIMP-63; siCTL, siControl; siRTN4, siRNA
to RTN4.
https://doi.org/10.1371/journal.pbio.3000355.g002
Reticulon and CLIMP-63 organize ER nanodomains
PLOS Biology | https://doi.org/10.1371/journal.pbio.3000355 August 30, 2019 5 / 19

Fig 3. RTN4a and CLIMP-63 overexpression differentially impacts ER nanodomain periodicity. (A) STED images of ERmoxGFP in HT-1080 cells transfected
with ERmoxGFP or cotransfected with mCherry-CLIMP-63 (CLIMP-63), mCherry-RTN4a (RTN4a), or mCherry-ATL1 (ATL1). Peripheral ER regions (white boxes)
are shown as zooms; line scans of selected tubules in these regions (yellow boxes) are shown with ERmoxGFP in green and ER-shaping proteins in red. Scale bar, 5 μm;
zooms, 2 μm. (B) Peripheral ER tubule maxima length, variation of maxima length (SD), and maxima-to-minima intensity differential are shown for cells transfected
with ERmoxGFP alone (CTL) or cotransfected with mCherry-CLIMP-63 (CLIMP-63), mCherry-RTN4a (RTN4a), or mCherry-ATL1 (ATL1). Significance assessed
Reticulon and CLIMP-63 organize ER nanodomains
PLOS Biology | https://doi.org/10.1371/journal.pbio.3000355 August 30, 2019 6 / 19

significantly associated with ERmoxGFP maxima, mCherry-RTN4a with minima, and
mCherry-ATL1 shows no significant preference for maxima or minima (Fig 3C). This suggests
that RTN4a is segregated away from, while CLIMP-63 is associated with, lumenal
ERmoxGFP-filled nanodomains.
RTN4a and CLIMP-63 regulate nanodomain heterogeneity in peripheral
ER tubules
We then undertook to determine whether other ER markers present a similar peripheral ER
tubule periodicity. As observed for ERmoxGFP, the peripheral reticular network of
Sec61βGFP-labeled tubules in live HT-1080 and COS-7 cells showed a highly periodic distri-
bution by STED (Fig 4A; S1 Video). Similarly, GFP-calreticulin expressed at endogenous levels
by clustered regularly interspaced palindromic repeat (CRISPR)/CRISPR-associated protein 9
(Cas9) knock-in technology in U2OS cells [22] presents a tubular network by confocal and a
highly periodic distribution by STED (Fig 4A) imaging. Two-dimensional STED imaging of
fixed cells expressing ERmoxGFP and Sec61β tagged with monomeric red fluorescent protein
(Sec61β-mRFP) show distinct patterns of nanodomain enrichment for these two ER reporters
along ER tubules (Fig 4B).
We then extended our analysis to examine the distribution of the endogenous ER-resident
proteins, calnexin and derlin-1, involved in protein quality control and ER-associated protein
degradation (ERAD), respectively [25,26]. Antibody labeling of both calnexin and derlin-1
shows a reticular ER distribution by confocal microscopy in HT-1080 cells; by contrast, STED
imaging of these endogenous ER proteins shows a highly punctate distribution (Fig 4C). A
similar punctate distribution for calnexin is observed in both ERmoxGFP transfected and
untransfected cells (S1 Fig), and is therefore not a result of overexpression of the lumenal
ERmoxGFP reporter. Two-dimensional STED images of fixed HT-1080 cells show that cal-
nexin and derlin-1 puncta show minimal overlap and that many of these ER protein puncta
align along ERmoxGFP-labeled tubules (Fig 4D). Three-dimensional (3D) STED analysis
shows that the majority of calnexin and derlin-1 puncta are intercalated into the ERmoxGFP
tubular network and that these two ER-resident proteins show minimal overlap (Fig 4E; S2
Video), highlighting the nanodomain heterogeneity of peripheral ER tubules.
Quantitative line scan analysis of 2D STED imaged peripheral ER tubules shows the
increased association of calnexin and derlin-1 puncta with ERmoxGFP minima and an equal
distribution between minima and maxima of Sec61βGFP-labeled tubules (Fig 5A and 5B).
Similarly, manual counting of the distribution of calnexin or derlin-1 puncta in peripheral 3D
STED regions of interest (ROIs) (Fig 4E) shows the clear localization of protein puncta to min-
ima between ERmoxGFP-labeled blobs (maxima) (S2A Fig). Line scan analysis of the distribu-
tion of three other ER proteins, binding immunoglobulin protein/glucose-regulated protein
78 (BiP/GRP78), glycoprotein 78 (Gp78), and Syntaxin-17 (Stx17), show a similar enriched
distribution to ERmoxGFP minima along peripheral ER tubules (S2B Fig). This suggests that
ER tubule nanodomains that present increased accumulation of the lumenal ER reporter
by one-way ANOVA from three independent experiments (40 line scans/each repeat). Bar graphs show mean ± SEM and scatter dot plots median with interquartile
range. �P< 0.05; ��P< 0.01; ���P< 0.001. Numerical values that underlie the graphs and plots are shown in S1 Data. (C) Based on line scan analysis of peripheral ER
tubules of HT-1080 cells cotransfected with mCherry-CLIMP-63 (CLIMP-63), mCherry-RTN4a (RTN4a), or mCherry-ATL1 (ATL1), percent localization of CLIMP-
63, RTN4a, and ATL1 puncta to minima or maxima of lumenal ERmoxGFP-labeled tubules was quantified. Significance assessed by one-way ANOVA from four
independent experiments (40 line scans/each repeat). Bar graphs show mean ± SEM. �P< 0.05; ���P< 0.001. Numerical values that underlie the graphs are shown in
S1 Data. ATL, atlastin; CLIMP-63, cytoskeleton-linking membrane protein 63; CTL, control ER, endoplasmic reticulum; ERmoxGFP, ER monomeric oxidizing
environment-optimized green fluorescent protein; ns, not significant; RTN4a, reticulon4a; SD, standard deviation; STED, stimulated emission depletion.
https://doi.org/10.1371/journal.pbio.3000355.g003
Reticulon and CLIMP-63 organize ER nanodomains
PLOS Biology | https://doi.org/10.1371/journal.pbio.3000355 August 30, 2019 7 / 19

ERmoxGFP are segregated away from nanodomains enriched for ER-resident protein
complexes.
We then tested if RTN4a and CLIMP-63 impact the distribution of ER-resident proteins to
ER tubule nanodomains. Upon RTN4 or CLIMP-63 knockdown or RTN4a or CLIMP-63
overexpression, calnexin or derlin-1 puncta no longer showed a preferential distribution to
minima of lumenal ERmoxGFP but rather a balanced distribution to maxima and minima
(Fig 5C and 5D). ATL1 overexpression did not significantly impact the distribution of ER pro-
tein puncta to lumenal minima (Fig 5D). This suggests that RTN4a and CLIMP-63 regulate
Fig 4. Periodic distribution of other ER markers and ER-resident proteins along peripheral ER tubules. (A)
Representative confocal and STED images of live HT-1080 and COS-7 cells overexpressing Sec61βGFP or live knock-
in U2OS cells expressing GFP-calreticulin at endogenous levels. Scale bar, 2 μm. (B) STED images of fixed HT-1080
cells expressing lumenal ERmoxGFP (green) and membrane Sec61βmRFP (red) show distinct periodicity of these two
ER reporters along peripheral ER tubules. Scale bar, 2 μm; zoom, 0.5 μm. (C) Untransfected HT-1080 cells labeled for
derlin-1 or calnexin imaged by confocal and STED. Scale bar, 2 μm. (D) Association of ER-resident proteins derlin-1
and calnexin with ERmoxGFP-labeled peripheral ER tubules in HT-1080 cells by 2D STED. Scale bar, 2 μm. (E)
Association of ER-resident proteins derlin-1 and calnexin with ERmoxGFP-labeled peripheral ER tubules in HT-1080
cells by 3D STED. Scale bar, 1 μm. ER, endoplasmic reticulum; ERmoxGFP, ER monomeric oxidizing environment-
optimized green fluorescent protein; KI, knock-in; STED, stimulated emission depletion; 2D, two-dimensional; 3D,
three-dimensional.
https://doi.org/10.1371/journal.pbio.3000355.g004
Reticulon and CLIMP-63 organize ER nanodomains
PLOS Biology | https://doi.org/10.1371/journal.pbio.3000355 August 30, 2019 8 / 19

lumenal domain length and organization and thereby impact overlap of lumenal and protein-
enriched nanodomains along ER tubules.
Fig 5. ER-resident proteins calnexin and derlin-1 are enriched in nanodomains depleted of lumenal ERmoxGFP. (A) Representative merged images
of single peripheral ER tubules expressing ERmoxGFP or Sec61βGFP labeled for calnexin or derlin-1. The dashed line indicates the site of line scan
analysis along tubule. Fluorescence intensities of ER reporter (green) and protein (red) from line scans are presented as graphs. Scale bar, 0.5 μm. (B)
Based on line scan analysis of peripheral ER tubules, percent localization of calnexin and derlin-1 puncta to ERmoxGFP or Sec61βGFP maxima and
minima was quantified. Values plotted are mean ± SEM from three independent experiments (40 tubules per repeat) with one-way ANOVA for
significance. ���P< 0.001. Numerical values that underlie the graphs are shown in S1 Data. (C) Based on line scan analysis of peripheral ER tubules,
percent localization of calnexin and derlin-1 puncta to ERmoxGFP maxima and minima was quantified in cells transfected with siCTL, siCLIMP-63, or
siRTN4. Significance was assessed by χ2 test from three independent experiments (20–40 tubules per repeat). ���P< 0.001. Numerical values that underlie
the graphs are shown in S1 Data. (D) Based on line scan analysis of peripheral ER tubules, percent localization of calnexin puncta to ERmoxGFP maxima
and minima was quantified in HT-1080 cells cotransfected with mCherry-CLIMP-63, mCherry-RTN4a, or mCherry-ATL1 compared with CTL.
Significance assessed by χ2 test from three independent experiments (40 tubules per repeat). ���P< 0.001. Numerical values that underlie the graphs are
shown in S1 Data. ATL, atlastin; CLIMP-63, cytoskeleton-linking membrane protein 63; CTL, control; ER, endoplasmic reticulum; ERmoxGFP, ER
monomeric oxidizing environment-optimized green fluorescent protein; ns, not significant; RTN4a, reticulon4a; siCLIMP-63, siRNA to CLIMP-63;
siCTL, siControl; siRTN4, siRNA to RTN4.
https://doi.org/10.1371/journal.pbio.3000355.g005
Reticulon and CLIMP-63 organize ER nanodomains
PLOS Biology | https://doi.org/10.1371/journal.pbio.3000355 August 30, 2019 9 / 19

RTN4a and CLIMP-63 regulate lumenal nanodomain dynamics in
peripheral ER tubules
To determine whether CLIMP-63 and RTN impact the dynamics of ERmoxGFP lumenal
nanodomains, we acquired high-speed (40 ms/frame) 2D STED time-lapse image series of
small ROIs encompassing individual peripheral ER tubules (Fig 6A). Kymograms of 100
frames over 4 seconds show increased ERmoxGFP intensity in select locations along the tubule
(Fig 6B). This accumulation is indicative of lumenal filling of localized nanodomains that is
reported as peaks when fluorescence intensity along the tubule is averaged over time (Fig 6C).
The coefficient of variation (CoV) along the tubule length of the normalized average fluores-
cent intensity over time provides a means to quantify the extent to which the lumenal
ERmoxGFP reporter accumulates stably at defined locations along peripheral ER tubules (Fig
6D). mCherry-CLIMP-63 overexpression disrupts the localized distribution of lumenal ER
nanodomains, while mCherry-RTN4a overexpression enhances the stability of these domains
(Fig 6A; S3 Video). Conversely, siRTN4 knockdown showed a similar effect to CLIMP-63
overexpression, such that local stable accumulation of the lumenal reporter at discrete sites
along ER tubules is no longer observed (Fig 6B; S3 Fig; S4 Video). CLIMP-63 knockdown did
not affect lumenal ER nanodomain stability (Fig 6B; S3 Fig; S4 Video). The latter is consistent
with the absence of an effect of CLIMP-63 siRNA on ERmoxGFP maxima length (Fig 2C).
Dynamic lumenal ERmoxGFP distribution along peripheral ER tubules therefore occurs
within the framework of stable nanodomains whose ability to preferentially accumulate the
lumenal ERmoxGFP reporter is regulated by RTN4a and CLIMP-63.
Discussion
Peripheral ER tubules are heterogenous, periodic structures composed of discrete nanodo-
mains. STED imaging of lumenal (ERmoxGFP) or membrane (Sec61βGFP) ER reporters, of
CRISPR/Cas9 knock-in calreticulin-GFP expressed at endogenous levels, and of various anti-
body-labeled ER-resident proteins shows that ER proteins are localized to discrete puncta
interspersed with lumenal domains along ER tubules. Periodic distribution of ER reporters
along ER tubules can be observed in various publications studying ER using various super-res-
olution microscope approaches and EM [13,27–32] and has more recently been reported by
live cell GI-SIM [19]. However, the nanodomain organization of ER tubules and the mecha-
nisms that underlie it have yet to be characterized. We show here that the ER-shaping proteins
RTN4a and CLIMP-63 regulate the size and stability of lumenal ER nanodomains and their
overlap with resident ER proteins.
Single particle tracking has identified active lumenal flow within ER tubules [18]. By high-
speed 2D STED imaging, ER lumenal periodicities are highly dynamic and present rapid oscil-
lations (Fig 1; S1, S3 and S4 Videos). We interpret ERmoxGFP periodicities to reflect regions
or nanodomains along ER tubules that preferentially accumulate or are filled with this lumenal
ER reporter. Localized distribution of these lumenal periodicities along ER tubules over time
suggests that these sites (blobs/maxima) are propitious to accumulation of the lumenal
reporter, relative to adjacent minima that limit lumenal reporter accumulation. RTN4 knock-
down or CLIMP-63 overexpression reduces, while RTN4a overexpression enhances the stabil-
ity of sites of lumenal reporter accumulation along ER tubules. These data suggest that these
two ER-shaping proteins regulate lumenal domain spacing along peripheral ER tubules. Our
data do not, however, report directly on the diffusion of the lumenal ERmoxGFP reporter in
ER tubules. The relationship between RTN4a and CLIMP-63 regulation of ER nanodomains
and the slower diffusion of lumenal ER reporters in ER tubules relative to cytoplasm [33] or
Reticulon and CLIMP-63 organize ER nanodomains
PLOS Biology | https://doi.org/10.1371/journal.pbio.3000355 August 30, 2019 10 / 19
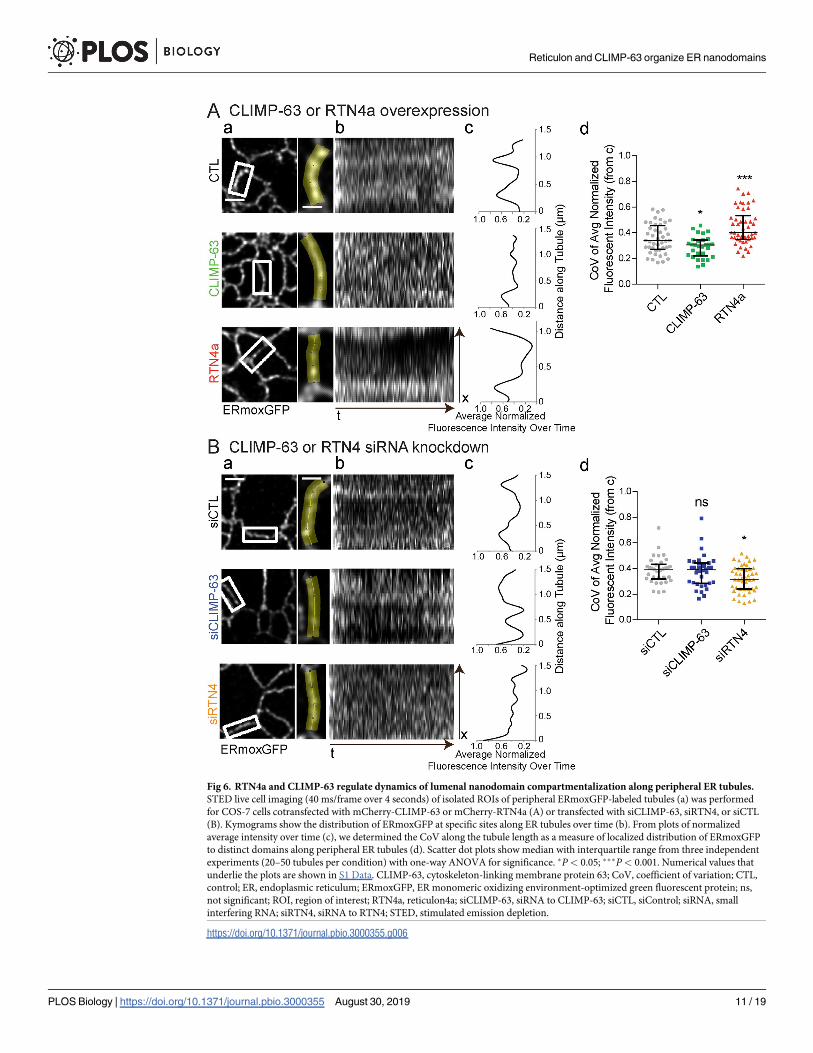
Fig 6. RTN4a and CLIMP-63 regulate dynamics of lumenal nanodomain compartmentalization along peripheral ER tubules.
STED live cell imaging (40 ms/frame over 4 seconds) of isolated ROIs of peripheral ERmoxGFP-labeled tubules (a) was performed
for COS-7 cells cotransfected with mCherry-CLIMP-63 or mCherry-RTN4a (A) or transfected with siCLIMP-63, siRTN4, or siCTL
(B). Kymograms show the distribution of ERmoxGFP at specific sites along ER tubules over time (b). From plots of normalized
average intensity over time (c), we determined the CoV along the tubule length as a measure of localized distribution of ERmoxGFP
to distinct domains along peripheral ER tubules (d). Scatter dot plots show median with interquartile range from three independent
experiments (20–50 tubules per condition) with one-way ANOVA for significance. �P< 0.05; ���P< 0.001. Numerical values that
underlie the plots are shown in S1 Data. CLIMP-63, cytoskeleton-linking membrane protein 63; CoV, coefficient of variation; CTL,
control; ER, endoplasmic reticulum; ERmoxGFP, ER monomeric oxidizing environment-optimized green fluorescent protein; ns,
not significant; ROI, region of interest; RTN4a, reticulon4a; siCLIMP-63, siRNA to CLIMP-63; siCTL, siControl; siRNA, small
interfering RNA; siRTN4, siRNA to RTN4; STED, stimulated emission depletion.
https://doi.org/10.1371/journal.pbio.3000355.g006
Reticulon and CLIMP-63 organize ER nanodomains
PLOS Biology | https://doi.org/10.1371/journal.pbio.3000355 August 30, 2019 11 / 19
the contractions associated with nano-peristalsis along ER tubules [18] remains to be
determined.
The RTNs cause local ER curvature [9], and CLIMP-63 maintains ER architecture by form-
ing coiled-coil structures that maintain lumenal spacing [6,34]. Knockdown of CLIMP-63 has
been reported to decrease the width of ER sheets from 45.5 nm to 27.9 nm [6]. Although
CLIMP-63 is predominantly associated with ER sheets [6,34], it is also expressed in peripheral
ER tubules [13]. Paralleling the macro level segregation of these two ER-shaping proteins [6],
RTN4a segregates away from and CLIMP-63 associates with lumenal ERmoxGFP nanodo-
mains. Alternating RTN4a membrane constriction and CLIMP-63 spacer functions along ER
tubules could explain the lumenal ER periodicity that we report here. Indeed, a recent study of
lumenal mEmerald-KDEL dynamics in peripheral ER tubules attributed the periodic distribu-
tion of this reporter to constrictions and bulges along the tubule length [19], as observed by
EM [13,35–37]. However, ER tubule width is below the 70–80 nm STED resolution obtained
in this study, and our data cannot therefore report on changes in ER tubule width. Further-
more, the fact that ERmoxGFP minima overlap with ER protein densities (Fig 5A and 5B)
argues that lumenal minima are not necessarily constrictions of the ER membrane itself.
Mechanisms that control lumenal filling of peripheral ER nanodomains may be related not
only to tubule width (i.e., constrictions versus bulges) but also to occlusion of lumenal space
within the tubules by ER-resident protein complexes.
Indeed, by STED imaging, puncta of various ER proteins (calnexin, derlin-1, Gp78, BiP, and
Stx17) along ER tubules were closely associated with RTN-associated lumenal ERmoxGFP min-
ima and therefore segregated away from lumenal nanodomains. Overexpression or knockdown
of either CLIMP-63 or RTN4a disrupted the enrichment of resident ER proteins in nanodo-
mains depleted of the lumenal ERmoxGFP reporter. Simplistically, increased ER tubule lumenal
filling due to CLIMP-63 overexpression or RTN4 knockdown could facilitate overlap between
resident ER proteins and fluid components, while, conversely, localized accumulation of overex-
pressed RTN along ER tubules may sequester both protein and lumenal ER tubule components
away from RTN-enriched nanodomains. The fact that CLIMP-63 knockdown had minimal
effect on lumenal nanodomain stability and distribution argues that it is but one of multiple
redundant mechanisms to define lumenal enriched ER nanodomains. Regulation of ER nanodo-
main organization by these ER-shaping proteins in peripheral ER tubules parallels their roles in
the formation of ER tubules and ER sheets. RTN and CLIMP-63 also contribute to nanohole for-
mation in ER sheets [17], and together, these studies suggest that ER-shaping proteins play criti-
cal roles in the determination of ER morphology from the macro- to the nanoscale.
This study suggests that ER tubules are composed of protein-enriched nanodomains inter-
spersed with fluid-filled nanodomains that may facilitate diffusion and exchange of small mol-
ecules, such as metabolites and enzyme substrates, as well as folding intermediates between
protein complexes. The minimal overlap between the two endogenous ER markers studied,
calnexin and derlin-1, suggests that multiple, discrete protein complexes exist within the ER.
Further study is required to define how nanodomain organization and heterogeneity within
the highly dynamic ER tubular network control functional interaction between ER-resident
proteins, cargo proteins, enzymatic substrates, and metabolites to enable ER quality control
and cargo processing.
Materials and methods
Plasmids, antibodies, and chemicals
ERmoxGFP was a gift from Dr. Erik Snapp (Albert Einstein College of Medicine, presently at
Howard Hughes Medical Institute Janelia Research Campus, VA) (Addgene plasmid #68072),
Reticulon and CLIMP-63 organize ER nanodomains
PLOS Biology | https://doi.org/10.1371/journal.pbio.3000355 August 30, 2019 12 / 19

mCherry-CLIMP-63 and Sec61βGFP from Dr. Gia Voeltz (University of Colorado, Boulder,
CO), Sec61βmRFP from Dr. Patrick Lajoie (University of Western Ontario, London, ON, Can-
ada), and mCherry-RTN4a and mCherry-ATL1 from Dr. Tom Rapoport (Harvard University,
MA) (Addgene plasmid #86683 and #86678, respectively). Anti-CLIMP-63 antibody (G1/296)
was purchased from Enzo Life Sciences (Farmingdale, NY) (Cat# ALX-804-604-C100). Rabbit
anti-calnexin (Cat# C4731), mouse anti-derlin-1 (Cat# SAB4200148), rabbit anti-BiP (Cat#
G9043), mouse anti-actin (Cat# A2228), goat anti-mouse HRP conjugate (Cat# AP308P), goat
anti-rabbit HRP conjugate (Cat# AP307P), and rabbit anti-Stx17 (Cat# HPA001204) antibod-
ies were from Sigma (St. Louis, MO). Rabbit anti-RTN4/NOGO (Cat# 10950-1-AP) and anti-
Gp78 (Cat# 16675-1-AP) antibodies were from Proteintech (Rosemont, IL). Goat serum (Cat#
16210–064), goat anti-rabbit IgG (H+L) cross-adsorbed secondary antibody, Alexa Fluor 532
(Cat# A-11009), and goat anti-mouse IgG (H+L) cross-adsorbed secondary antibody, Alexa
Fluor 568 (Cat# A-11004) were from Thermo Fisher Scientific (Waltham, MA). siCLIMP-63
(Cat# L-012755-01-0005), siRTN4 (L-010721-00-0005) and nontargeting Control siRNA (Cat#
D-001810-01-50) were from Dharmacon, GE Healthcare Life Sciences (Chicago, IL). Sixteen
percent paraformaldehyde (Cat# 15710) and 25% glutaraldehyde (Cat# 16220) were from Elec-
tron Microscopy Sciences (Hatfield, PA), USA. Other chemicals were from Sigma (St. Louis,
MO).
Cell culture, transfection, and western blot
HT-1080 cells were grown at 37˚C with 5% CO2 in complete RPMI 1640 (Thermo Fisher Sci-
entific, Waltham, MA) containing 10% fetal bovine serum (FBS) (Thermo Fisher Scientific,
Waltham, MA) and 1% L-glutamine (Thermo Fisher Scientific, Waltham, MA) unless other-
wise stated. The U2OS knock-in cell line expressing GFP-calreticulin at endogenous levels
generated with CRISPR/Cas technology was provided by Dr. Tom Rapoport (Harvard Univer-
sity, MA). COS-7 and U2OS cells were grown at 37˚C with 5% CO2 in complete DMEM
(Thermo Fisher Scientific, Waltham, MA) containing 10% FBS and 1% L-glutamine. All cell
lines were mycoplasma-free, tested routinely by PCR (Applied Biological Materials, Rich-
mond, BC, Canada) and, as necessary, treated with BM Cyclin (Roche, Mannheim, Germany)
to eliminate mycoplasma contamination.
Plasmids were transfected for 22 hours using Effectene (Qiagen, Hilden, Germany) accord-
ing to the manufacturer’s protocols. siRNA transfection was done with Lipofectamine 2000
Transfection Reagent (Thermo Fisher Scientific, Waltham, MA) in Opti-MEM Reduced
Serum Media (Thermo Fisher Scientific, Waltham, MA), which was replaced with fresh com-
plete RPMI 1640 after 5 hours; after a further 21 hours plasmids were transfected with Effec-
tene and incubated for 22 hours before fixation. For live cell imaging, cells were grown in ibidi
8-well μ-slides with #1.5H (170 μm ±5 μm) D 263 M Schott glass and transfected as described
above. For live cell imaging at 37˚C, complete RPMI 1640 medium was replaced with warmed
RPMI 1640 medium (Sigma, St. Louis, MO) without sodium bicarbonate, supplemented with
1% L-glutamine, 10% FBS, 10% HEPES (Thermo Fisher Scientific, Waltham, MA) for HT-
1080 cells. For COS-7 and U2OS cells, complete DMEM medium was replaced by FluoroBrite
DMEM media (Thermo Fisher Scientific, Waltham, MA) warmed to 37˚C before imaging.
Western blots were conducted as previously described [38].
Immunofluorescence labeling
Cells grown on #1.5H coverslips (Paul Marienfeld, Lauda-Konigshofen, Germany) were (1)
fixed with 3% paraformaldehyde with 0.2% glutaraldehyde in phosphate-buffered saline (PBS)
at room temperature for 15 minutes and washed with PBS-CM (PBS supplemented with 0.1
Reticulon and CLIMP-63 organize ER nanodomains
PLOS Biology | https://doi.org/10.1371/journal.pbio.3000355 August 30, 2019 13 / 19

mM CaCl2 and 1 mM MgCl2; two quick washes and then two 5-minute washes); (2) permeabi-
lized with 0.2% Triton X-100 for 5 minutes, then washed with PBS-CM as above; (3) quenched
with 1 mg/mL of NaBH4 (Sigma, USA) for 10 minutes and washed with PBS-CM; (4) blocked
with 10% Goat Serum (Thermo Fisher Scientific, Waltham, MA) and 1% bovine serum albu-
min (Sigma, St. Louis, MO) in PBS-CM for 1 hour; (5) incubated with primary antibodies in
Antibody Buffer (1% BSA, 2% goat serum, 0.05% Triton-X100 in saline-sodium citrate buffer
in Milli-Q H2O) overnight at 4˚C, then washed with PBS-CM, then three times for 5 minutes
with Antibody Wash Buffer (saline-sodium citrate buffer, 0.05% Triton-X100 in Milli-Q
H2O); (6) incubated with secondary antibodies in Antibody Buffer for 1 hour, then washed
with PBS-CM, then six times for 10 minutes with Antibody Wash Buffer on a rocker; and (7)
rinsed with Milli-Q H2O and mounted with ProLong Diamond (Thermo Fisher Scientific,
Waltham, MA) and cured for 24–48 hours at room temperature.
Confocal and STED microscopy
Confocal and STED imaging was performed with the 100×/1.4 Oil HC PL APO CS2 STED
White objective of a Leica TCS SP8 3× STED microscope (Leica, Wetzlar, Germany) equipped
with a white light laser, HyD detectors, and Leica Application Suite X (LAS X) software (LSIIMAGING, Life Sciences Institute, University of British Columbia). Time-gated fluorescence
detection was used for STED to further improve lateral resolution. Live cell time-lapse imaging
of GFP-tagged reporters was performed at 37˚C using the 592-nm depletion laser on a
15,360-nm square ROI (0.8-second frame rate over 40 seconds) or a 3,840-nm square ROI
(40-ms frame rate over 4 seconds) in the periphery of the cell. For double- or triple-labeled
fixed samples, acquisition was done at a scan speed of 600 Hz with a line average of 6. GFP was
excited at 488 nm and depleted using the 592-nm depletion laser. Alexa Fluor 532 was excited
at 528 nm, Alex Fluor 568 at 577 nm, and mRFP at 584 nm, and all three were depleted using
the 660-nm depletion laser. Sequential acquisition (in the order of AF568/AF532/GFP or
mRFP/GFP) between frames (2D) or between stacks (3D) was used to avoid cross talk. Three-
dimensional STED images were acquired at a step size of 100 nm. STED images were decon-
volved using Huygens Professional software (Scientific Volume Imaging, Hilversum, the Neth-
erlands) that was also used to determine the theoretical PSFs from 2D STED live and fixed
images and from 3D STED fixed images. XY FWHM values obtained from the theoretical
PSFs for STED GFP images were 70 nm for 2D fixed and 78 nm for 2D live. For 3D fixed anal-
ysis, FWHM was 126 nm for XY and 340 nm for Z.
Quantification and statistical analysis
Line scan analysis of at least 40 peripheral ER tubules per sample was done using Leica LAS-X
software. Spatially isolated peripheral tubules were selected for analysis based on the presence
of a minimum of two protein puncta per tubule in the protein-labeled channel. A histogram of
normalized fluorescence intensity (scale of 0–1) along the line was exported for the ER report-
ers (ERmoxGFP or Sec61βGFP) and either calnexin, derlin-1, mCherry-CLIMP-63, mCherry-
RTN4a, or mCherry-ATL1, and displayed using GraphPad Prism (GraphPad Software, San
Diego, CA). Maximum and minimum fluorescence values were identified with a Java script.
Blobs were defined as local maxima in the fluorescence signal and minima as troughs in fluo-
rescence intensity, at least 20% below both adjacent maxima. FWHM of maxima was used to
determine blob length. The percent decrease in the fluorescence signal of all minima was cal-
culated relative to the adjacent maximum of lower fluorescence. Protein (calnexin and derlin-
1) puncta were localized to either maxima or minima and deemed intermediate if the puncta
center was greater than 20 nm from the peak of the maxima or minima. Quantification of
Reticulon and CLIMP-63 organize ER nanodomains
PLOS Biology | https://doi.org/10.1371/journal.pbio.3000355 August 30, 2019 14 / 19

protein puncta distribution to maxima and minima in 3D projections was scored manually in
LAS-X. Three-dimensional STED volume rendering was done with LAS-X. Analysis of the live
cell imaging (40 ms/frame) was done with ImageJ/FIJI [39]. General image processing (2D
image exporting to tiff format and 3D volume rendering) and final image preparation (merg-
ing, zoom, cropping, and addition of the scale bar) for publication were performed using
LAS-X and FIJI. Statistical analyses were done using Prism 6.0.
Supporting information
S1 Fig. Calnexin exhibits a punctate distribution along peripheral ER tubules independent
of ERmoxGFP transfection. Representative confocal and STED images of calnexin and
ERmomxGFP in ERmoxGFP transfected and untransfected cells. The punctate distribution of
calnexin is observed more readily by STED (raw and decon) compared with confocal imaging
in both (A) transfected and (B) untransfected cells. Scale bar, 5 μm; zooms, 2 μm. decon,
deconvolution; ER, endoplasmic reticulum; ERmoxGFP, ER monomeric oxidizing environ-
ment-optimized green fluorescent protein; STED, stimulated emission depletion.
(TIF)
S2 Fig. ER-resident proteins are distributed to lumenal minima of peripheral ER tubules.
(A) Quantification of 3D localization of calnexin and derlin-1 puncta to ERmoxGFP maxima
and minima of peripheral ER tubules in 3D STED images of siCTL or siCLIMP-63 HT-1080
cells. Significance assessed by χ2 test from at least 25 ROIs (2.5 um × 2.5 um) from 10 three-
dimensional stacks for each condition at 2 degrees of freedom in three independent experi-
ments. �P< 0.05; ��P< 0.01. Numerical values that underlie the graphs are shown in S1 Data.
(B) Based on line scan analysis of peripheral ER tubules imaged by 2D STED, localization of
BiP, Gp78, and Stx17 puncta to ERmoxGFP maxima and minima was quantified. Significance
assessed by one-way ANOVA from at least 20 line scans in three independent experiments.�P< 0.05; ��P< 0.01; ���P< 0.001. Numerical values that underlie the graphs are shown in S1
Data. BiP, binding immunoglobulin protein; ER, endoplasmic reticulum; ERmoxGFP, ER
monomeric oxidizing environment-optimized green fluorescent protein; Gp78, glycoprotein
78; ROI, region of interest; siCTL, siControl; siCLIMP-63, siRNA to CLIMP-63; STED, stimu-
lated emission depletion; Stx17, Syntaxin-17; 2D, two-dimensional; 3D, three-dimensional.
(TIF)
S3 Fig. RTN4 and CLIMP-63 and knockdown by siRNA in COS-7 cells. Western blots of
RTN4 and CLIMP-63 siRNA knockdown in COS-7 cells. The blots were probed with anti-
CLIMP-63, anti-RTN4, or anti-β-actin as a loading control. CLIMP-63, cytoskeleton-linking
membrane protein 63; RTN4, reticulon4; siRNA, small interfering RNA.
(TIF)
S1 Video. Live cell STED imaging reveals ER periodicity. Live HT-1080 cells overexpressing
ERmoxGFP or Sec61βGFP were imaged with confocal or STED at 37˚C for 40 seconds at a
temporal resolution of 0.8 seconds per frame. (a) Confocal ERmoxGFP; (b) STED ERmoxGFP;
(c) confocal Sec61βGFP; (d) STED Sec61βGFP. Video frame rate: 10 frames per second. ER,
endoplasmic reticulum; ERmoxGFP, ER monomeric oxidizing environment-optimized green
fluorescent protein; STED, stimulated emission depletion.
(MP4)
S2 Video. Three-channel 3D STED imaging of calnexin and derlin-1 puncta localized to
ER tubule minima. ERmoxGFP expressing HT-1080 cells were fixed, labeled with calnexin
and derlin-1, and imaged sequentially (derlin-1, calnexin, and ERmoxGFP) with 3D STED
Reticulon and CLIMP-63 organize ER nanodomains
PLOS Biology | https://doi.org/10.1371/journal.pbio.3000355 August 30, 2019 15 / 19

(vortex donut enabled). Video frame rate: 10 frames per second. ER, endoplasmic reticulum;
ERmoxGFP, ER monomeric oxidizing environment-optimized green fluorescent protein;
STED, stimulated emission depletion; 3D, three-dimensional.
(MP4)
S3 Video. High-speed STED imaging of lumenal ER nanodomains upon RTN4a and
CLIMP-63 overexpression. Live COS-7 cells were transfected with ERmoxGFP (CTL) or
cotransfected with ERmoxGFP and either mCherry-CLIMP-63 (CLIMP-63 OX) or mCherry-
RTN4a (RTN OX). ERmoxGFP was imaged with STED at 37˚C over 4 seconds at a temporal
resolution of 40 ms per frame. Arrows show sites of stable distribution of ERmoxGFP at spe-
cific sites along ER tubules over time, as determined by kymogram analysis (Fig 6). Video
frame rate: 10 frames per second. CLIMP-63, cytoskeleton-linking membrane protein 63;
CTL, control; ER, endoplasmic reticulum; ERmoxGFP, ER monomeric oxidizing environ-
ment-optimized green fluorescent protein; OX, over-expression; RTN4a, reticulon4a; STED,
stimulated emission depletion.
(MP4)
S4 Video. High-speed STED imaging of lumenal ER nanodomains upon RTN4 and
CLIMP-63 knockdown. Live COS-7 cells were transfected with siCTL, siCLIMP-63, or
siRTN4, as indicated, and then with ERmoxGFP. ERmoxGFP was imaged with STED at 37˚C
over 4 seconds at a temporal resolution of 40 ms per frame. Arrows show sites of stable distri-
bution of ERmoxGFP at specific sites along ER tubules over time, as determined by kymogram
analysis (Fig 6). Video frame rate: 10 frames per second. CLIMP-63, cytoskeleton-linking
membrane protein 63; ER, endoplasmic reticulum; ERmoxGFP, ER monomeric oxidizing
environment-optimized green fluorescent protein; RTN4, reticulon4; siCLIMP-63, siRNA to
CLIMP-63; siCTL, siControl; siRTN4, siRNA to RTN4; STED, stimulated emission depletion.
(MP4)
S1 Data. Numerical values associated with graphs and plots in figures and supporting
information.
(XLSX)
Acknowledgments
We thank Dr. Christopher Loewen (UBC) for helpful discussions. Imaging was performed at
the UBC Life Sciences Institute Imaging Core Facility (LSI IMAGING).
Author Contributions
Conceptualization: Guang Gao, Ivan R. Nabi.
Data curation: Guang Gao, Chengjia Zhu, Emma Liu.
Formal analysis: Guang Gao, Chengjia Zhu, Emma Liu, Ivan R. Nabi.
Funding acquisition: Ivan R. Nabi.
Investigation: Guang Gao, Chengjia Zhu, Emma Liu.
Methodology: Guang Gao, Chengjia Zhu, Emma Liu, Ivan R. Nabi.
Project administration: Ivan R. Nabi.
Resources: Ivan R. Nabi.
Software: Guang Gao.
Reticulon and CLIMP-63 organize ER nanodomains
PLOS Biology | https://doi.org/10.1371/journal.pbio.3000355 August 30, 2019 16 / 19

Supervision: Guang Gao, Ivan R. Nabi.
Validation: Guang Gao.
Visualization: Guang Gao.
Writing – original draft: Guang Gao, Ivan R. Nabi.
Writing – review & editing: Guang Gao, Ivan R. Nabi.
References1. Kusumi A, Fujiwara TK, Chadda R, Xie M, Tsunoyama TA, Kalay Z, et al. Dynamic organizing principles
of the plasma membrane that regulate signal transduction: commemorating the fortieth anniversary of
Singer and Nicolson’s fluid-mosaic model. Ann Rev Cell Dev Biol. 2012; 28:215–50.
2. Shibata Y, Voeltz GK, Rapoport TA. Rough sheets and smooth tubules. Cell. 2006; 126(3):435–9.
https://doi.org/10.1016/j.cell.2006.07.019 PMID: 16901774
3. Voeltz GK, Prinz WA, Shibata Y, Rist JM, Rapoport TA. A class of membrane proteins shaping the tubu-
lar endoplasmic reticulum. Cell. 2006; 124(3):573–86. https://doi.org/10.1016/j.cell.2005.11.047 PMID:
16469703
4. Hu J, Shibata Y, Zhu PP, Voss C, Rismanchi N, Prinz WA, et al. A class of dynamin-like GTPases
involved in the generation of the tubular ER network. Cell. 2009; 138(3):549–61. https://doi.org/10.
1016/j.cell.2009.05.025 PMID: 19665976
5. Westrate LM, Lee JE, Prinz WA, Voeltz GK. Form follows function: the importance of endoplasmic retic-
ulum shape. Ann Rev Biochem. 2015; 84:791–811. https://doi.org/10.1146/annurev-biochem-072711-
163501 PMID: 25580528
6. Shibata Y, Shemesh T, Prinz WA, Palazzo AF, Kozlov MM, Rapoport TA. Mechanisms determining the
morphology of the peripheral ER. Cell. 2010; 143(5):774–88. https://doi.org/10.1016/j.cell.2010.11.007
PMID: 21111237
7. Anwar K, Klemm RW, Condon A, Severin KN, Zhang M, Ghirlando R, et al. The dynamin-like GTPase
Sey1p mediates homotypic ER fusion in S. cerevisiae. J Cell Biol. 2012; 197(2):209–17. https://doi.org/
10.1083/jcb.201111115 PMID: 22508509
8. Orso G, Pendin D, Liu S, Tosetto J, Moss TJ, Faust JE, et al. Homotypic fusion of ER membranes
requires the dynamin-like GTPase atlastin. Nature. 2009; 460(7258):978–83. https://doi.org/10.1038/
nature08280 PMID: 19633650
9. Zhang H, Hu J. Shaping the Endoplasmic Reticulum into a Social Network. Trends Cell Biol. 2016; 26
(12):934–43. https://doi.org/10.1016/j.tcb.2016.06.002 PMID: 27339937
10. Shibata Y, Voss C, Rist JM, Hu J, Rapoport TA, Prinz WA, et al. The reticulon and DP1/Yop1p proteins
form immobile oligomers in the tubular endoplasmic reticulum. J Biol Chem. 2008; 283(27):18892–904.
https://doi.org/10.1074/jbc.M800986200 PMID: 18442980
11. Hu J, Shibata Y, Voss C, Shemesh T, Li Z, Coughlin M, et al. Membrane proteins of the endoplasmic
reticulum induce high-curvature tubules. Science. 2008; 319(5867):1247–50. https://doi.org/10.1126/
science.1153634 PMID: 18309084
12. Lewis SC, Uchiyama LF, Nunnari J. ER-mitochondria contacts couple mtDNA synthesis with mitochon-
drial division in human cells. Science. 2016; 353(6296):aaf5549. https://doi.org/10.1126/science.
aaf5549 PMID: 27418514
13. Nixon-Abell J, Obara CJ, Weigel AV, Li D, Legant WR, Xu CS, et al. Increased spatiotemporal resolu-
tion reveals highly dynamic dense tubular matrices in the peripheral ER. Science. 2016; 354(6311).
14. Bernales S, McDonald KL, Walter P. Autophagy counterbalances endoplasmic reticulum expansion
during the unfolded protein response. PLoS Biol. 2006; 4(12):e423. https://doi.org/10.1371/journal.
pbio.0040423 PMID: 17132049
15. Hell SW, Wichmann J. Breaking the diffraction resolution limit by stimulated emission: stimulated-emis-
sion-depletion fluorescence microscopy. Optics Letters. 1994; 19(11):780–2. https://doi.org/10.1364/ol.
19.000780 PMID: 19844443
16. Hein B, Willig KI, Hell SW. Stimulated emission depletion (STED) nanoscopy of a fluorescent protein-
labeled organelle inside a living cell. PNAS USA. 2008; 105(38):14271–6. https://doi.org/10.1073/pnas.
0807705105 PMID: 18796604
17. Schroeder LK, Barentine AES, Merta H, Schweighofer S, Zhang Y, Baddeley D, et al. Dynamic nano-
scale morphology of the ER surveyed by STED microscopy. J Cell Biol. 2019; 218(1):83–96. https://doi.
org/10.1083/jcb.201809107 PMID: 30442642
Reticulon and CLIMP-63 organize ER nanodomains
PLOS Biology | https://doi.org/10.1371/journal.pbio.3000355 August 30, 2019 17 / 19

18. Holcman D, Parutto P, Chambers JE, Fantham M, Young LJ, Marciniak SJ, et al. Single particle trajec-
tories reveal active endoplasmic reticulum luminal flow. Nature Cell Biol. 2018; 20(10):1118–25. https://
doi.org/10.1038/s41556-018-0192-2 PMID: 30224760
19. Guo Y, Li D, Zhang S, Yang Y, Liu JJ, Wang X, et al. Visualizing Intracellular Organelle and Cytoskeletal
Interactions at Nanoscale Resolution on Millisecond Timescales. Cell. 2018; 175(5):1430–42 e17.
https://doi.org/10.1016/j.cell.2018.09.057 PMID: 30454650
20. Costantini LM, Baloban M, Markwardt ML, Rizzo M, Guo F, Verkhusha VV, et al. A palette of fluorescent
proteins optimized for diverse cellular environments. Nature Comm. 2015; 6:7670.
21. Lewis MJ, Pelham HR. Ligand-induced redistribution of a human KDEL receptor from the Golgi complex
to the endoplasmic reticulum. Cell. 1992; 68(2):353–64. https://doi.org/10.1016/0092-8674(92)90476-s
PMID: 1310258
22. Wang S, Tukachinsky H, Romano FB, Rapoport TA. Cooperation of the ER-shaping proteins atlastin,
lunapark, and reticulons to generate a tubular membrane network. eLife. 2016; 5.
23. Loewen CJ, Roy A, Levine TP. A conserved ER targeting motif in three families of lipid binding proteins
and in Opi1p binds VAP. EMBO J. 2003; 22(9):2025–35. https://doi.org/10.1093/emboj/cdg201 PMID:
12727870
24. Moss TJ, Andreazza C, Verma A, Daga A, McNew JA. Membrane fusion by the GTPase atlastin
requires a conserved C-terminal cytoplasmic tail and dimerization through the middle domain. PNAS
USA. 2011; 108(27):11133–8. https://doi.org/10.1073/pnas.1105056108 PMID: 21690399
25. Ye Y, Shibata Y, Yun C, Ron D, Rapoport TA. A membrane protein complex mediates retro-transloca-
tion from the ER lumen into the cytosol. Nature. 2004; 429(6994):841–7. https://doi.org/10.1038/
nature02656 PMID: 15215856
26. Chen W, Helenius J, Braakman I, Helenius A. Cotranslational folding and calnexin binding during glyco-
protein synthesis. PNAS USA. 1995; 92(14):6229–33. https://doi.org/10.1073/pnas.92.14.6229 PMID:
7541532
27. Caldieri G, Barbieri E, Nappo G, Raimondi A, Bonora M, Conte A, et al. Reticulon 3-dependent ER-PM
contact sites control EGFR nonclathrin endocytosis. Science. 2017; 356(6338):617–24. https://doi.org/
10.1126/science.aah6152 PMID: 28495747
28. York AG, Chandris P, Nogare DD, Head J, Wawrzusin P, Fischer RS, et al. Instant super-resolution
imaging in live cells and embryos via analog image processing. Nature Methods. 2013; 10(11):1122–6.
https://doi.org/10.1038/nmeth.2687 PMID: 24097271
29. Shim SH, Xia C, Zhong G, Babcock HP, Vaughan JC, Huang B, et al. Super-resolution fluorescence
imaging of organelles in live cells with photoswitchable membrane probes. PNAS USA. 2012; 109
(35):13978–83. https://doi.org/10.1073/pnas.1201882109 PMID: 22891300
30. Takakura H, Zhang Y, Erdmann RS, Thompson AD, Lin Y, McNellis B, et al. Long time-lapse nano-
scopy with spontaneously blinking membrane probes. Nature Biotech. 2017.
31. Bottanelli F, Kromann EB, Allgeyer ES, Erdmann RS, Wood Baguley S, Sirinakis G, et al. Two-colour
live-cell nanoscale imaging of intracellular targets. Nature Comm. 2016; 7:10778.
32. Huang F, Sirinakis G, Allgeyer ES, Schroeder LK, Duim WC, Kromann EB, et al. Ultra-High Resolution
3D Imaging of Whole Cells. Cell. 2016; 166(4):1028–40. https://doi.org/10.1016/j.cell.2016.06.016
PMID: 27397506
33. Dayel MJ, Hom EF, Verkman AS. Diffusion of green fluorescent protein in the aqueous-phase lumen of
endoplasmic reticulum. Biophys J. 1999; 76(5):2843–51. https://doi.org/10.1016/S0006-3495(99)
77438-2 PMID: 10233100
34. Klopfenstein DR, Klumperman J, Lustig A, Kammerer RA, Oorschot V, Hauri HP. Subdomain-specific
localization of CLIMP-63 (p63) in the endoplasmic reticulum is mediated by its luminal alpha-helical seg-
ment. J Cell Biol. 2001; 153(6):1287–300. https://doi.org/10.1083/jcb.153.6.1287 PMID: 11402071
35. Behnke O, Moe H. An Electron Microscope Study of Mature and Differentiating Paneth Cells in the Rat,
Especially of Their Endoplasmic Reticulum and Lysosomes. J Cell Biol. 1964; 22:633–52. https://doi.
org/10.1083/jcb.22.3.633 PMID: 14206428
36. West M, Zurek N, Hoenger A, Voeltz GK. A 3D analysis of yeast ER structure reveals how ER domains
are organized by membrane curvature. J Cell Biol. 2011; 193(2):333–46. https://doi.org/10.1083/jcb.
201011039 PMID: 21502358
37. Friedman JR, Voeltz GK. The ER in 3D: a multifunctional dynamic membrane network. Trends Cell Biol.
2011; 21(12):709–17. https://doi.org/10.1016/j.tcb.2011.07.004 PMID: 21900009
38. Meng F, Saxena S, Liu Y, Joshi B, Wong TH, Shankar J, et al. The phospho-caveolin-1 scaffolding
domain dampens force fluctuations in focal adhesions and promotes cancer cell migration. Mol Biol
Cell. 2017; 28(16):2190–201. https://doi.org/10.1091/mbc.E17-05-0278 PMID: 28592633
Reticulon and CLIMP-63 organize ER nanodomains
PLOS Biology | https://doi.org/10.1371/journal.pbio.3000355 August 30, 2019 18 / 19

39. Schindelin J, Arganda-Carreras I, Frise E, Kaynig V, Longair M, Pietzsch T, et al. Fiji: an open-source
platform for biological-image analysis. Nature Methods. 2012; 9(7):676–82. https://doi.org/10.1038/
nmeth.2019 PMID: 22743772
Reticulon and CLIMP-63 organize ER nanodomains
PLOS Biology | https://doi.org/10.1371/journal.pbio.3000355 August 30, 2019 19 / 19


![Uclacyanin proteins are required for lignified nanodomain ......2020/05/01 · 67 ated with lignified tissues [25-27]. We looked at the endodermal spatiotemporal expression 68 pattern](https://static.fdocuments.us/doc/165x107/613c546e4c23507cb6355049/uclacyanin-proteins-are-required-for-lignified-nanodomain-20200501-.jpg)