Rethinking adaptive capacity: A study of Midwestern U.S ...
156
Graduate eses and Dissertations Iowa State University Capstones, eses and Dissertations 2017 Rethinking adaptive capacity: A study of Midwestern U.S. corn farmers Syed Maaz Gardezi Iowa State University Follow this and additional works at: hps://lib.dr.iastate.edu/etd Part of the Agriculture Commons , and the Statistics and Probability Commons is Dissertation is brought to you for free and open access by the Iowa State University Capstones, eses and Dissertations at Iowa State University Digital Repository. It has been accepted for inclusion in Graduate eses and Dissertations by an authorized administrator of Iowa State University Digital Repository. For more information, please contact [email protected]. Recommended Citation Gardezi, Syed Maaz, "Rethinking adaptive capacity: A study of Midwestern U.S. corn farmers" (2017). Graduate eses and Dissertations. 15519. hps://lib.dr.iastate.edu/etd/15519
Transcript of Rethinking adaptive capacity: A study of Midwestern U.S ...
Graduate Theses and Dissertations Iowa State University Capstones, Theses andDissertations
2017
Rethinking adaptive capacity: A study ofMidwestern U.S. corn farmersSyed Maaz GardeziIowa State University
Follow this and additional works at: https://lib.dr.iastate.edu/etd
Part of the Agriculture Commons, and the Statistics and Probability Commons
This Dissertation is brought to you for free and open access by the Iowa State University Capstones, Theses and Dissertations at Iowa State UniversityDigital Repository. It has been accepted for inclusion in Graduate Theses and Dissertations by an authorized administrator of Iowa State UniversityDigital Repository. For more information, please contact [email protected].
Recommended CitationGardezi, Syed Maaz, "Rethinking adaptive capacity: A study of Midwestern U.S. corn farmers" (2017). Graduate Theses andDissertations. 15519.https://lib.dr.iastate.edu/etd/15519
Rethinking adaptive capacity: A study of Midwestern U.S. corn farmers
by
Syed Maaz Gardezi
A dissertation submitted to the graduate faculty
in partial fulfillment of the requirements for the degree of
DOCTOR OF PHILOSOPHY
Co-majors: Sociology; Sustainable Agriculture
Program of Study Committee: J. Gordon Arbuckle, Major Professor
Lois Wright Morton David Peters
Petruta Caragea Lisa Schulte Moore
The student author, whose presentation of the scholarship herein was approved by the program of study committee, is solely responsible for the content of this
dissertation. The Graduate College will ensure this dissertation is globally accessible and will not permit alterations after a degree is conferred.
Iowa State University
Ames, Iowa
2017
Copyright © Syed Maaz Gardezi, 2017. All rights reserved.
ii
TABLE OF CONTENTS
Page
ACKNOWLEDGMENTS .............................................................................. iii
ABSTRACT………………………………. ...................................................... vi
CHAPTER 1. INTRODUCTION: .................................................................. 1
Organization of Dissertation Chapters .................................................... 4
References ............................................................................................. 7
CHAPTER 2. TECHNO-OPTIMISM AND FARMERS’ ATTITUDES TOWARD CLIMATE CHANGE .................................................................... 10 Introduction ............................................................................................. 11 Literature Review .................................................................................... 15 Conceptual Framework and Hypothesis ................................................. 21 Method ............................................................................................. 23 Results ............................................................................................. 27 Discussion and Conclusion..................................................................... 32 References ............................................................................................. 37 CHAPTER 3. CAN FARMERS’ ADAPTIVE CAPACITIES—CONTEXTUAL -IZED WITHIN INSTITUTIONAL AND ENVIRONMENTALCONDITIONS—INFLUENCE THEIR DECISION TO USE ADAPTIVE MANAGEMENT PRACTICES? ............................................................................................. 44 Introduction ............................................................................................. 45 Literature Review .................................................................................... 49 Method ............................................................................................ 59 Results ............................................................................................. 74 Discussion ............................................................................................. 80 Conclusion ............................................................................................. 83 References ............................................................................................. 85 Appendix A ............................................................................................. 92 Appendix B ............................................................................................. 93 Appendix C ............................................................................................. 94 CHAPTER 4. SPATIALLY REPRESENTING VULNERABILITY TO EXTREME RAIN EVENTS USING MIDWESTERN FARMERS’ OBJECTIVE AND PERCEIVED ATTRIBUTES OF ADAPTIVE CAPACITY 95 Introduction ............................................................................................. 96 Literature Review .................................................................................... 100 Method ............................................................................................ 110 Results ............................................................................................. 121 Discussion and Conclusion..................................................................... 126 References ............................................................................................. 129

iii
CHAPTER 5. GENERAL DISCUSSION ...................................................... 135 General Discussion ................................................................................ 135
APPENDIX GLOSSARY OF TERMS ........................................................... 138
References ............................................................................................. 145
iv
ACKNOWLEDGMENTS
I would like to thank my dissertation advisor, Dr. J Arbuckle. His continuous
supervision, leadership, and encouragement have made this work possible. I am
thankful to him for giving me the intellectual autonomy to choose my research
project based on my curiosity. His constructive comments always helped me to think
more deeply about the problem. I have been privileged to have him as my
dissertation chair. This work would have never been possible without his insightful
critique and tireless editing.
I am also very thankful to the other members of my committee. Dr. Lois
Wright Morton was an excellent mentor and her guidance and support have been
unparalleled. Despite her busy schedule, she has been generous with her time, very
insightful in her feedback, and a great role model for me and my peers at ISU. Her
energy is contagious and has motivated me to read more and think harder. Dr. David
Peters has been very generous with his open-office-door-policy. I have been allowed
to interrupt him and inquire many times about questions pertaining to statistics. He
has always been there for me. Other members of my committee: Drs. Petrutza
Caragea and Lisa Schulte Moore also offered thoughtful and critical comments and
suggestions during critical stages of my dissertation. Their feedback significantly
contributed to the development and refinement of my ideas. The expertise and
advice of all my committee members have contributed enormously to advancing my
intellectual thinking during my time at ISU.
I am extremely fortunate for receiving research funding from the USDA-NIFA
project: Climate and Corn-based Cropping Systems Coordinated Agricultural

v
Project. This CSCAP project funding was instrumental in allowing me to experiment
with new theories and methods and bring them into my research on climate change
and agriculture. I would also like to thank the Department of Sociology and Graduate
Program in Sustainable Agriculture (GPSA) for providing me with the administrative
and financial support to attend and present my research at conferences. Specifically,
I would like to recognize the hard work of Dr. Susan Stewart, Director of Graduate
Education (DOGE) in Sociology for helping clearly communicating the requirements
for course completion and graduation. Last, but not least, I was very lucky to find an
excellent administrative team managed by Rachel Burlingame and Debra McKay.
I would like to dedicate this dissertation to my wife, Hina Illahe, without whom
this would have been an extremely difficult undertaking. Her intellectual and
emotional backing ensured me that I could exclusively focus on attending classes
and writing papers. She is one of the strongest pillars in my life.

vi
ABSTRACT
Global climate change is one of the most significant challenges facing
agriculture and society in the 21st century. In the Midwest, the projected trend
toward more extreme rainfall has meant that farm-level responses are needed to
maintain or increase crop yield and reduce soil erosion. On a local level, farmers
are at the forefront of responding to environmental change. Thus, it is critical to
understand their ability to take suitable actions for reducing risks and transforming
agriculture to a more resilient system. Adaptive capacity is a term that is often used
to describe farmers’ ability to access financial and technical resources. Although
these are important attributes of farmers’ capacity, scholarship on human behavior
has identified socio-cultural factors, such as perceived risk and capacity as strong
predictors of farmers’ decision making. Therefore, our understanding of farmers’ true
capacities is limited by our inability to comprehensively understand social and
behavioral factors that influence their decisions to ignore, cope or adapt to climate
change-related risks. In this dissertation, I attempt to address this gap by integrating
social and behavioral theoretical frameworks and statistical modeling approaches to
assess how variations in institutional and environmental conditions can influence
farmers’ adaptive capacity and their decision to use adaptive management practices.
1
CHAPTER 1. INTRODUCTION
The Upper Midwestern United States is a global leader in commodity crop
production, including corn and soybean. This region produces one-third of the global
corn supply and contributes a substantial amount of money to the national Gross
Domestic Product (GDP). In 2015, $68 billion of corn and soybean was produced in
this region (USDA-NASS, 2015). Climate change will cause agronomic and
environmental impacts for corn and soybean crop production. Some of these
impacts include a decrease in crop yield, increase in crop stressors due to extreme
rain events, soil erosion, floods, droughts, and increase in weed, pest, and disease
(Hatfield et al., 2014). The impacts of climate change on agriculture pose serious
economic and ecological risks to Upper Midwestern agriculture and global
commodity crop supply.
Projected trends toward more extreme rainfall events in the Upper Midwest
can make agriculture more vulnerable via a reduction in short-term crop productivity
and greater soil erosion and off-field nutrient losses across the region. On a farm
level, farmers are at the frontline of responding to the impacts of climate change
(McCarl, 2010). For example, farmers' use of agricultural best management
practices (BMPs), such as cover crops, can contribute to on-farm ecosystem
services such as increasing crop yield and reducing soil erosion, and potentially
mitigate nonpoint source pollution from agricultural lands (Kremen and Miles, 2012;
Reimer et al., 2012). These is much concern whether farmers are using best
management practices to make agriculture sufficiently resilient to changes in
weather and climate (Walthall et al., 2012).
2
In the environmental change literature, adaptive capacity is an important
social process for modulation of system resilience—defined as a system’s ability to
respond to a shock and still maintain its general attributes, while also retaining
capacity to evolve or transform to a more desirable state (Engle and Lemos, 2010;
Nelson et al., 2007; Rockström et al., 2009). Adaptive capacity can be conceived of
as comprising three components: a resource system; the ability of actors and social
groups to access those resources; and, the institutions and structures that can
influence whether actors manage natural resources effectively (Brown and
Westaway, 2011).
Existing research often frames the likelihood that farmers will adapt to
climate change as a function of objective capacity or material resources, such as
access to finances and structures of governance (Engle and Lemos, 2010; Parry et
al., 2007; Yohe and Tol, 2002). However, research on human behavior has noted
that in addition to these objective attributes of adaptive capacity, behavioral factors
are important for modulating actors' response to climate change (Grothmann and
Patt, 2005; Moser et al., 2014). Perceived capacity—defined as the “extent to which
[actors] feel prepared to endure changes and take necessary steps to cope with
them” (Seara et al., 2016, p. 50)—is an important human cognitive characteristic that
can influence actors’ pro-environmental behavior. Thus, it is important to
understand the relationships between farmers’ objective and perceived measures of
adaptive capacity. Examining this relationship can be especially important if farmers
are systematically under- or over-estimating their ability to address the impacts of
climate change. Moreover, simultaneously examining the objective and perceived
3
attributes of adaptive capacity may facilitate identification of culturally appropriate
actions available to farmers for adapting to climate change.
Farmers’ responses to changes in weather and climate are dependent not
only on their personal assessments of capacity, but also on the resources available
through broader social, economic, and political systems that they operate within
(Smit and Skinner, 2002). Contextual factors such as institutions and governance
can importantly determine the ability of a social-ecological system to endure abrupt
climatic changes (Agrawal, 2008; Berman et al., 2012; Dovers and Hezri, 2010;
Engle, 2011; Ostrom, 2008). Institutions have been defined in the literature in many
ways; one acceptable definition is that these are the “formal and informal rules and
norms that govern actors, resources and their interactions in any given situation”
(Eakin et al., 2016, p. 804). Previous research has found institutions to significantly
mediate farmers' objective capacity and perceived capacities by influencing their risk
perceptions (Frank et al., 2011); intentions to change behavior (Grothmann and Patt,
2005), changes in conservation behavior (Prokopy et al., 2008) and their self-
evaluation of capacity to adapt (Eakin et al., 2016). However, while these studies
provide useful insights into analysis of institutional support and pro-environmental
behavior, the environmental change literature is only beginning to address whether
institutions can influence farmers’ use of adaptive management practices via
changes in objective and perceived adaptive capacities (Eakin et al., 2016). An
examination of the relationship among biophysical conditions, adaptive capacity, and
institutional support can provide important indicators to develop risk management
policies and programs that can influence farmers’ pro-environmental behavior.
4
The central objective of this dissertation is to contribute to agricultural
sustainability by empirically examining the relationships among (1) farm-level
environmental conditions, such as soil and slope characteristics; (2) biophysical
stressors, such as extreme rain events, (3) socioeconomic, institutional, and
behavioral attributes of adaptive capacity and (4) farmer adaptive responses to
extreme rain events. These relationships are assessed to improve our
understanding of farmers’ use of adaptive management practices that can enhance
field-level or broader systemic resilience to climate change.
My dissertation research uses quantitative analysis, such as multilevel
modeling approach, spatial statistics, and path analysis (mediation analysis) to
develop a more thorough understanding of farmers’ use of adaptive management
practices across the U.S. Corn Belt. I use primary data from a 2012 survey of corn
and soybean farmers in 11 Midwestern states, and secondary data from Agriculture
Census, the National Weather Service, and Natural Resource Conservation Service.
Organization of Dissertation Chapters
The dissertation is organized as follows. In Chapter 2, I evaluate the
relationship among farmers’ faith in human exceptionalism, risk perceptions,
perceived capacity, and support for climate change adaptation. I examined two
dimensions of perceived capacity: (1) a paradigmatic type that is characterized as an
abstract faith in human ingenuity and (2) farmers’ self-evaluation of their technical
capacity to modulate climate change-related risks. Both dimensions are included in a
path model that examines farmers’ attitudes toward adaptation.
5
In Chapter 3, I examine how farmers' adaptive capacities—contextualized
within institutional and environmental conditions—can influence their decision to use
adaptive management practices. Two important dimensions of capacity are included
in this chapter: objective attributes and structural or institutional factors. The
objective was to evaluate the likelihood that Upper Midwestern corn farmers will
adapt to extreme rain events–i.e., use suitable adaptive management practices
(cover crops) on their farm. Adaptive action was examined vis-à-vis farmers’ (a)
perceived capacity; (b) their material assets and entitlements; and (c) the
institutional and environmental context in which adaptation occurs. Specifically, this
study examines farmer use of cover crops, a soil and water conservation best
management practice (BMP) that can be highly effective for reducing soil erosion
and nutrient loss associated with extreme rain events as well as sequestering
carbon and reducing the use of nitrogen. By modeling the interactions among
watershed level institutional and environmental factors, and farmer level capacities,
this study constitutes an important step in understanding the effects of perceived
and objective attributes of adaptive capacity on the use of adaptive management
practices. By comparing different dimensions of adaptive capacity and farmers’ use
of cover crops, I provide a timely assessment for supporting specific dimensions of
farmers’ capacities that can be beneficial for improving field and watershed-level soil
and water quality.
In Chapter 4, I highlight the importance of understanding farmers’ perceived
adaptive capacity by developing unique theoretical and methodological approaches
to assess farm/farmer’s vulnerability to extreme rain events. As highlighted in
6
Chapter 2 and 3, many studies on adaptive capacity frame the likelihood that actors
and communities will adapt to climate change as a function of access to financial
and technical resources. Yet actors’ vulnerability can be modulated by other
elements of adaptive capacity, such as how they assess their own capacity to cope
or adapt to climatic risks. In this chapter, I include perceived adaptive capacity into a
vulnerability assessment to evaluate the degree to which objective and perceived
adaptive capacity can differentially modify farm/farmers’ vulnerability to extreme rain
events. A better understanding of the relationships between objective and perceived
measures of adaptive capacity in agriculture has implications for climate change
policy and programs, especially if farmers are consistently under- or over-analyzing
their ability to adapt to weather and climatic impacts. Moreover, examining the
objective attributes of adaptive capacity in combination with the subjective measures
of capacity facilitates identification of adaptation actions that are culturally suitable.
In this chapter, we use spatial statistics to construct county level vulnerability
estimates with perceived and objective dimensions of adaptive capacity.
Chapter 5 summarizes and concludes the dissertation. Overall, this
dissertation empirically examines how biophysical stressors and socioeconomic,
institutional, and behavioral attributes of adaptive capacity can influence farmers’ (1)
attitude toward climate change adaptation, (2) ability to reduce vulnerability to
extreme rain events, and (3) use adaptive management practices, such as cover
crops. Finally, Appendix A provides a glossary of the key terms used in this
dissertation.
7
References
Agrawal, A., 2008. The Role of Local Institutions in Adaptation to. Soc. Dev. 65. doi:10.1596/978-0-8213-7887-8
Berman, R., Quinn, C., Paavola, J., 2012. The role of institutions in the
transformation of coping capacity to sustainable adaptive capacity. Environ. Dev. 2, 86–100. doi:10.1016/j.envdev.2012.03.017
Brown, K., Westaway, E., 2011. Agency, Capacity, and Resilience to Environmental
Change: Lessons from Human Development, Well-Being, and Disasters. Annu. Rev. Environ. Resour. 36, 321–342. doi:10.1146/annurev-environ-052610-092905
Dovers, S.R., Hezri, A.A., 2010. Institutions and policy processes: The means to the
ends of adaptation. Wiley Interdiscip. Rev. Clim. Chang. 1, 212–231. doi:10.1002/wcc.29
Eakin, H., York, A., Aggarwal, R., Waters, S., Welch, J., Rubiños, C., Smith-Heisters, S., Bausch, C., Anderies, J.M., 2016. Cognitive and institutional influences on farmers’ adaptive capacity: insights into barriers and opportunities for transformative change in central Arizona. Reg. Environ. Chang. 16, 801–814. doi:10.1007/s10113-015-0789-y
Engle, N.L., 2011. Adaptive capacity and its assessment. Glob. Environ. Chang. 21,
647–656. doi:10.1016/j.gloenvcha.2011.01.019 Engle, N.L., Lemos, M.C., 2010. Unpacking governance: Building adaptive capacity
to climate change of river basins in Brazil. Glob. Environ. Chang. 20, 4–13. doi:10.1016/j.gloenvcha.2009.07.001
Frank, E., Eakin, H., Lopez-Carr, D., 2011. Social identity, perception and motivation
in adaptation to climate risk in the coffee sector of Chiapas, Mexico. Glob. Environ. Chang. 21, 66–76. doi:10.1016/j.gloenvcha.2010.11.001
Grothmann, T., Patt, A., 2005. Adaptive capacity and human cognition: The process
of individual adaptation to climate change. Glob. Environ. Chang. 15, 199–213. doi:10.1016/j.gloenvcha.2005.01.002
Hatfield, J., Takle, G., Grotjahn, R., Holden, P., Izaurralde, R.C., Mader, T.,
Marshall, E., Liverman, D., 2014. Agriculture, in: Climate Change Impacts in the United States: The Third National Climate Assessment. pp. 150–174. doi:10.7930/J02Z13FR
Kremen, C., Miles, A., 2012. Ecosystem services in biologically diversified versus
conventional farming systems: Benefits, externalities, and trade-offs. Ecol. Soc. doi:10.5751/ES-05035-170440
8
McCarl, B.A., 2010. Analysis of climate change implications for agriculture and
forestry: An interdisciplinary effort. Clim. Change 100, 119–124. doi:10.1007/s10584-010-9833-6
Moser, C., Stauffacher, M., Blumer, Y.B., Scholz, R.W., 2014. From risk to
vulnerability: the role of perceived adaptive capacity for the acceptance of contested infrastructure. J. Risk Res. 9877, 1–15. doi:10.1080/13669877.2014.910687
Nelson, D.R., Adger, W.N., Brown, K., 2007. Adaptation to Environmental Change:
Contributions of a Resilience Framework. Annu. Rev. Environ. Resour. 32, 395–419. doi:10.1146/annurev.energy.32.051807.090348
Ostrom, E., 2008. Institutions and the environment. Econ. Aff. 28, 24–31.
doi:10.1111/j.1468-0270.2008.00840.x Parry, M.L., Canziani, O.F., Palutikof, J.P., van der Linden, P.J., Hanson, C.E.,
2007. IPCC, 2007: Summary for Policymakers, in: Climate Change 2007: Impacts, Adaptation and Vulnerability. Contribution ofWorking Group II to the Fourth Assessment Report of the Intergovernmental Panel on Climate Change. pp. 7–22. doi:10.2134/jeq2008.0015br
Prokopy, L.S., Floress, K., Klotthor-Weinkauf, D., Baumgart-Getz, a., 2008.
Determinants of agricultural best management practice adoption: Evidence from the literature. J. Soil Water Conserv. 63, 300–311. doi:10.2489/jswc.63.5.300
Reimer, A.P., Weinkauf, D.K., Prokopy, L.S., 2012. The influence of perceptions of
practice characteristics: An examination of agricultural best management practice adoption in two indiana watersheds. J. Rural Stud. 28, 118–128. doi:10.1016/j.jrurstud.2011.09.005
Rockström, J., Steffen, W., Noone, K., Persson, Å., Chapin, F.S., Lambin, E.,
Lenton, T.M., Scheffer, M., Folke, C., Schellnhuber, H.J., Nykvist, B., de Wit, C.A., Hughes, T., van der Leeuw, S., Rodhe, H., Sörlin, S., Snyder, P.K., Costanza, R., Svedin, U., Falkenmark, M., Karlberg, L., Corell, R.W., Fabry, V.J., Hansen, J., Walker, B., Liverman, D., Richardson, K., Crutzen, P., Foley, J., 2009. Planetary boundaries: Exploring the safe operating space for humanity. Ecol. Soc. 14. doi:10.1038/461472a
Seara, T., Clay, P.M., Colburn, L.L., 2016. Perceived adaptive capacity and natural
disasters: A fisheries case study. Glob. Environ. Chang. 38, 49–57. doi:10.1016/j.gloenvcha.2016.01.006
9
Smit, B., Skinner, M.W., 2002. Adaptation Options in Agriculture To Climate Change : a. Mitig. Adapt. Strateg. Glob. Chang. 7, 85–114. doi:10.1023/A:1015862228270
USDA-NASS, 2015. Quick-Stats [WWW Document]. URL
http://quickstats.nass.usda.gov/#C5600DC7-112D-345FBD43-1C73E0E4F539. Walthall, C.L., Hatfield, J., Backlund, P., Lengnick, L., Marshall, E., Walsh, M.,
Adkins, S., Aillery, M., Ainsworth, E.A., Ammann, C., Anderson, C.J., Bartomeus, I., Baumgard, L.H., Booker, F., Bradley, B., Blumenthal, D.M., Bunce, J., Burkey, K., Dabney, S.M., Delgado, J.A., Dukes, J., Funk, A., Garrett, K., Glenn, M., Grantz, D.A., Goodrich, D., Hu, S., Izaurralde, R.C., Jones, R.A.C., Kim, S.-H., Leaky, A.D.B., Lewers, K., Mader, T.L., McClung, A., Morgan, J., Muth, D.J., Nearing, M., Oosterhuis, D.M., Ort, D., Parmesan, C., Pettigrew, W.T., Polley, W., Rader, R., Rice, C., Rivington, M., Rosskopf, E., Salas, W.A., Sollenberger, L.E., Srygley, R., Stöckle, C., Takle, E.S., Timlin, D., White, J.W., Winfree, R., Wright-Morton, L., Ziska, L.H., 2012. Climate Change and Agriculture: Effects and Adaptation. Washington, DC.
Yohe, G., Tol, R.S.J., 2002. Indicators for social and economic coping capacity F
moving toward a working definition of adaptive capacity. Glob. Environ. Chang. 12, 25–40.
10
CHAPTER 2. TECHNO-OPTIMISM AND FARMERS’ ATTITUDES TOWARD
CLIMATE CHANGE ADAPTATION
Modified from a paper to be submitted to Journal of Rural Studies
Maaz Gardezi1 and J. Gordon Arbuckle2
Abstract
In industrialized societies, a dominant worldview speculates that human
ingenuity, through improved science and technology, will ultimately provide remedies
to most current and future adverse events, such as diseases, climate change, and
poverty. Here we examine: (1) whether techno-optimism is found among Midwestern
corn and soybean farmers and (2) how this blind faith in human ingenuity influences
their support for climate change adaptation. By examining a survey of nearly 5000
conventional farmers in the Midwestern U.S., we found that greater techno-optimism
can reduce farmers’ support for climate change adaptation and increase their
propensity to express a preference to delay adaptation-related actions. This
research can help extension educators to develop outreach programs that are
sensitive to farmers’ views about the ability of science and technology to solve
climate change-related issues. Such programs can also provide Corn Belt farmers
with a balanced view about the limitations and possibilities of science and
technology for solving climate change-related issues.
1 Author for correspondence, Department of Sociology, Iowa State University 2 Department of Sociology, Iowa State University
11
Introduction
Climate change presents significant challenges to agriculture and society. It is
affecting global and regional agricultural productivity now and predicts to continue
impacting more severely in the future (Coumou and Rahmstorf, 2012; Hatfield et al.,
2014). Farmers are at the frontiers of responding to the impacts of climate change
on agriculture (Lal et al., 2011). Understanding the social and behavioral drivers of
farmers' attitudes toward climate change is crucial for increasing agriculture’s
resilience to climate change. This study combines elements of the “Human
Exemptionalism Paradigm (HEP)” (Catton and Dunlap, 1978; Dunlap and Catton,
1994; Foster, 2012) and the alternative agriculture—conventional agricultural
(ACAP) paradigm (Beus and Dunlap, 1994, 1990a) frameworks with more recent
cognitive factor approaches (Bubeck et al., 2012; Wachinger et al., 2013) to examine
U.S. Corn Belt farmers’ attitudes toward climate change adaptation.
A major thread of environmental sociology theory posits that in industrialized
societies, the “Human Exemptionalism Paradigm (HEP)” has become a dominant
worldview (Catton and Dunlap, 1978). The main assumptions of the HEP include an
assertion that humans are: (1) unique among other species on earth; (2)
independent from the ecosystem that they inhabit, and (3) able to use technology to
dominate over nature (Catton and Dunlap, 1978). The Human Exemptionalism
Paradigm (HEP) implies natural resource limitlessness and expects social and
technological developments to lead to perpetual progress. Confidence in science
and technology is a core component of the HEP and Barry (2012) labels this
attribute as “techno-optimism” or “belief in human technological abilities to solve
12
problems of unsustainability while minimizing or denying the need for large-scale
social, economic and political transformation” (Barry, 2012). Techno-optimism is a
belief that human ingenuity, through improved science and technology, will ultimately
provide remedies to most current and future threats to human well-being, such as
diseases and climate change (Foster, 2012).
Many of the elements of the HEP, such as domination over nature,
exploitation of natural resources, and faith in human ingenuity, are central to the
U.S. conventional agriculture paradigm (Beus and Dunlap, 1990a). In the last
century, high-input, science-based capital intensive forms of agriculture, referred to
as “conventional agriculture” contributed to substantial increases in yields, but have
had impacts on the sustainability of farm income (Lobao and Meyer, 2001); well-
being of farming communities (Lobao and Meyer, 2001); and on-farm and off-farm
environmental degradation (Lowe et al., 1990). By the late 1980s these and other
concerns had given rise to an environmental movement in U.S. agriculture, whose
goal was to reduce the negative social and environmental impacts of farming that
had been associated with conventional agriculture (Beus and Dunlap, 1990a). In
contrast to the elements of the conventional agriculture paradigm, the alternative
worldview stresses harmony between humans and non-human nature; inclusion of
potential off-farm environmental impacts, and a critical approach toward examining
science and technology’s utility in solving social and environmental challenges
associated with agriculture (Beus and Dunlap, 1990a). Indeed, the alternative
agriculture paradigm holds a diametrically different view of human ingenuity. It
13
recognizes that no matter how inventive humans may be, their science and
technology cannot completely reverse ecological degradation.
Previous research has demonstrated the relationship between farmers’
paradigmatic belief and pro-environmental behavior. For example, Beus and Dunlap
(1990) used surveys to examine the relationship between farmers’ adherence to
conventional or alternative paradigm and use of environmentally harmful production
practices. They found that endorsement of conventional agriculture worldview was
strongly associated with higher self-reported use of chemicals. Other research has
examined how techno-optimism can act as a barrier to farmers’ pro-environmental
behavior. For example, Dentzman et al. (2016) found that adherence to a techno-
optimist worldview could constrain U.S. farmers’ adoption of pro-environmental
behavior, such as their use of holistic weed management. Thus, techno-optimism
can be an important moderator of farmers’ pro-environmental behavior.
Another important thread of research has focused on cognitive factors, such
as risk perceptions and perceived capacity, as important for influencing actors’
support for pro-environmental behavior, including adaptation to climate change
(Moser et al., 2014). For example, perceived capacity—defined here as the “extent
to which [people] feel prepared to endure changes and take necessary steps to cope
with them” (Seara et al., 2016, p. 50)—has been found to influence actors’ decisions
about taking actions for managing risks (Moser et al., 2014). At the farm level,
farmers’ perceived capacity can be comprised of such factors as perceptions about
their financial and technical knowledge.
14
A concept that has been increasingly considered to be an important
moderator of behavior is “decision delay.” Decision-delay’ is a common response to
threats that may be well-known to people, but are perceived to pose no immediate
risks (Anderson, 2003). This is a psychological phenomenon in which, rather than
deciding on and preparing for risky scenarios ahead of time, people delay decisions
and instead prefer to wait and see (McNeill et al. 2015). There are two steps of
cognitive processes that explain why actors’ make decisions in relation to threat
(Rogers, 1975). The first step is a risk or threat appraisal. In this stage, actors
evaluate the “likelihood” and “severity” of the threat (Truelove et al., 2015, p. 86). If
the risk is perceived to be high, in the second stage, people engage in “coping
appraisal”, which is an assessment of their personal capacity to respond to a threat
(Bubeck et al., 2012). Both risk and coping appraisals are important for influencing
personal action.
While extensive research on the relationships between perceived capacity
and personal action has been conducted in diverse contexts, this research focuses
rigorous, theoretically informed analysis on how farmers’ ideological dimensions of
capacity (i.e., techno-optimism), beliefs about personal capacity (perceived
capacity), and risk perception might influence their support for climate change
adaptation. It is hypothesized that techno-optimism can be an ideological force that
may hinder farmers from engaging in climate change adaptation, even when they
perceive that the risks associated with climate change are serious. On one hand,
farmers’ ought to continuously respond to the threats posed by climate change by
planning, learning, and experimenting. On the other hand, adherence to an abstract
15
faith in human ingenuity to solve future challenges associated with climate change
may reduce their ability to engage in adaptive management.
This paper examines how techno-optimism and perceived technical capacity
may moderate farmers’ willingness to respond to the threats posed by climate
change. We examine four research questions: (1) Does greater techno-optimism
reduce farmers’ support for climate change adaptation?; (2) Does higher level of
techno-optimism and perceived technical capacity reduce farmers’ support for
adaptation?; (3) Does techno-optimism increase farmers’ propensity to delay
adaptation-related decisions?; and, (4) Are farmers more likely to delay adaptation
decisions if they have higher techno-optimism and greater perceived technical
capacity? This paper is organized as follows: First, relevant literature is reviewed to
examine four key concepts: techno-optimism, perceived technical capacity, risk
perception, support for climate change adaptation, and decision-delay. Next,
conceptual models are developed to frame the complex relationships between
determinants of farmers’ climate change-related risk perception and support for
climate change adaptation. The hypothesized relationships are empirically examined
using a survey of almost 5000 conventional farmers from the Upper Midwestern U.S.
Finally, the main findings of this research are presented and possibilities for future
research on this subject are discussed.
Literature Review
“Human Exemptionalism Paradigm” in conventional agriculture
Many of the elements of the HEP, such as confidence in science and
technology that drives faith in human ingenuity, are central to the U.S. conventional
16
agriculture paradigm (Beus and Dunlap, 1990a). American agriculture in the first half
of the 20th century went through tremendous technological change. Widely known as
the “Green Revolution”, this era transformed farming from a labor-intensive to
industrial or capital-intensive system of operation (Rasmussen, 1962). The
widespread transitions to mechanization, advances in plant and animal breeding,
and greater use of fertilizer and chemicals, has led to a dramatic increase in farm
output and productivity (Dimitri et al., 2005). For example, between 1948 and 2011,
the U.S. agricultural output grew at 1.49 percent per annum, driven mainly by growth
in productivity and technology (Wang, 2013). The legacy of technological
advancements during the Green Revolution and the resulting improvements in
agricultural productivity is “…a source of national pride for many Americans,
especially farmers, agricultural scientists, and politicians (Beus and Dunlap, 1990b,
pp. 590–591).” Conventional farmers often highlight the strategic importance of
technological advancements in solving challenges pertaining agriculture. For
example, some research has documented perception among farmers that private
seed and chemical companies will supply the next technological breakthrough to
solve most problems related to drought, weed, pests and diseases (Dentzman et al.,
2016).
Previous research has found a strong relationship between farmers’
paradigmatic belief and pro-environmental behavior. For example, Beus and Dunlap
(1990) found evidence of a positive relationship between farmers’ adherence to
human exemptionalism paradigm and use of production practices that were
detrimental to the environment. They recommended that efforts should be made to
17
shift ideological focus of farmers from one that only targets productivity
enhancements as its goal to one that also incorporates environmental concerns.
Other research has examined how techno-optimism can act as a barrier to
farmers’ pro-environmental behavior. For example, Dentzman et al. (2016) used
focus groups to examine whether farmers’ adherence to a techno-optimist worldview
could constrain their adoption of pro-environmental behavior. They found that most
farmers had faith in future technologies to provide adequate weed management,
which made them less likely to use pro-environmental farming practices, such as
holistic weed management. Thus, literature on U.S. farmers has found techno-
optimism to moderate farmers’ pro-environmental behavior.
Risk perception and trust in experts
An important thread of research on human behavior has focused on risk
perceptions as significant for influencing actors’ support for pro-environmental
behavior, including adaptation to climate change (Grothmann and Patt, 2005; Moser
et al., 2014). Risk perceptions are socially constructed and various factors such as
past experiences of natural hazard, perceived capacity, and emotions can influence
actors’ decisions about both the significance of risks and the willingness to take
actions to cope, adapt or ignore such risks (Feldman et al., 2014; Weber and Stern,
2011). Farm-level research suggests that farmers who perceive climate change to
be a threat to their farm enterprises are more likely to make adjustments to
anticipate or react to changing conditions that may place the farm enterprise at risk
(Arbuckle et al., 2013a; Morton et al., 2015). Although a positive relationship
between risk perceptions and the willingness to take actions to cope, adapt or ignore
18
such risk is intuitive, scholars in the realm of natural hazard and climate change
adaptation research have been perplexed by inconsistent findings. While some
studies find a positive relationship between risk perceptions and behavioral change
(Arbuckle et al., 2013a; Gramig et al., 2013), some studies do not (Hung et al.,
2007), and still other research shows a negative correlation between the two
(Jorgensen and Termansen, 2016; Lo, 2013).
In a meta-study on actors’ risk perception of natural hazards, Wachinger et al.
(2013) offer various explanations of why higher risk perception about natural hazard
may not be associated with willingness to take actions to cope or adapt to such risks
(Wachinger et al., 2013). One reason put forward is that actors may correctly
evaluate the risk associated with a hazard, but rely on the support and expertise of
authorities to take charge or respond to a hazardous situation. Thus, actors may
trust experts in contemplation of reducing potential risks and improving potential
benefits of present actions and future consequences.
Trust in experts can be defined as a “disposition willingly to rely on another
person or entity to perform a given action or protect oneself or one’s interest in a
given domain” (Nickel and Vaesen, 2012, p. 860). Applied decision theory posits that
a rational decision-maker chooses to trust an expert after carefully quantifying risks
and assessing the trustworthiness of the expert (Nickel and Vaesen, 2012).
According to such reasoning, actors trust experts through a rational calculation of
the latter’s knowledge, skills, experience, and intentions (Earle, 2010). However,
scholars in the field of socio-cultural and cognitive studies argue that people’s trust
in authority does not have to depend on an extensive calculation of the benefits and

19
costs of trusting experts. Most people do not have time, money, and knowledge, to
conduct a rigorous risk assessment of the trust situation. Instead, people rely on
their emotions, intelligence, and experience to guide their judgment about trusting
experts (Hardin, 1991; Uslaner, 2008; Yamagishi, 2001). In its abstract form, trust
can be considered as a way for people to increase their dependence on the ‘expert’
without consciously assessing the competence of the expert or the trust situation
(Frederiksen, 2014).
In conventional agriculture, human ingenuity tends to be manufactured in
sophisticated technologies such as commercial inputs, Global Positioning Systems
(GPS) and genetics, etc. Following the general findings from previous research, it
can be argued that in the absence of complete knowledge about the risks associated
with climate change, conventional farmers’ attitude toward climate change
adaptation can be guided by an abstract faith in technology (techno-optimism). This
type of trust can be characterized as a “leap of faith” (Möllering, 2006) and may
reduce farmers’ support for climate change adaptation.
Perceived technical capacity
In the realm of adaptation to climate change in agriculture, farmers’ perceived
capacity is generally conceptualized as their personal beliefs as to whether they are
able to adapt to climate change (i.e., they have sufficient knowledge, financial, and
technical skills to make changes to their farming practices). For example, in a study
of Sri Lankan farmers, Truelove et al. (2015) found that those farmers who felt
capable of using climate-smart agriculture and perceived their adoption as
necessary to reduce risks related to climate change were more likely to engage in
20
adaptive responses. Other studies have assessed the relationships between actors’
perceived capacity and various environmental behaviors, such as water
conservation (Trumbo and O’Keefe, 2005), recycling behavior (Botetzagias et al.,
2015; Cheung et al., 1999), health-related practices (Black and Babrow, 1991), and
use of public transportation (Tikir and Lehmann, 2011). In general, these studies
have found that higher perceived capacity can lead actors to more strongly support
and practice environmental behavior. This paper examines how ideological
dimensions of capacity (techno-optimism) and beliefs about personal capacity
(perceived technical capacity) can moderate farmers’ willingness to respond to the
threats posed by climate change.
Decision-delay
Previous studies have examined farmers’ decision to support adaptation as a
dichotomous choice made by them, i.e. farmers either support or do not support
taking adaptive measures on their farm. Yet, managed farming systems are complex
and dynamic with unpredictability due to markets, policy, weather, and climate (Hess
et al., 2012). Instead of being assertive in accepting or rejecting the use of adaptive
management practices, farmers can be uncertain toward taking an action and may
decide to wait and see. This psychological phenomenon has been described in the
natural hazards literature as ‘Decision-delay’ and is associated with actors’ being
fully aware of the threats posed by a natural hazard but still intending to delay risk-
reduction action (Anderson, 2003).
Decision-delay is synonymous with uncertainty and Morton et al. (2017)
recently examined some of the social and behavioral drivers of farmers’ uncertainty
21
about the impact of climate change on their farm operation. Findings from their
research show that farmers’ uncertainty can be explained by the variation in beliefs
held by them about the causes of climate change. We build upon this scholarship
and advance our knowledge about how “decision-delay” can be influenced by
broader ideological beliefs, such as farmers’ adherence to a techno-optimistic
worldview.
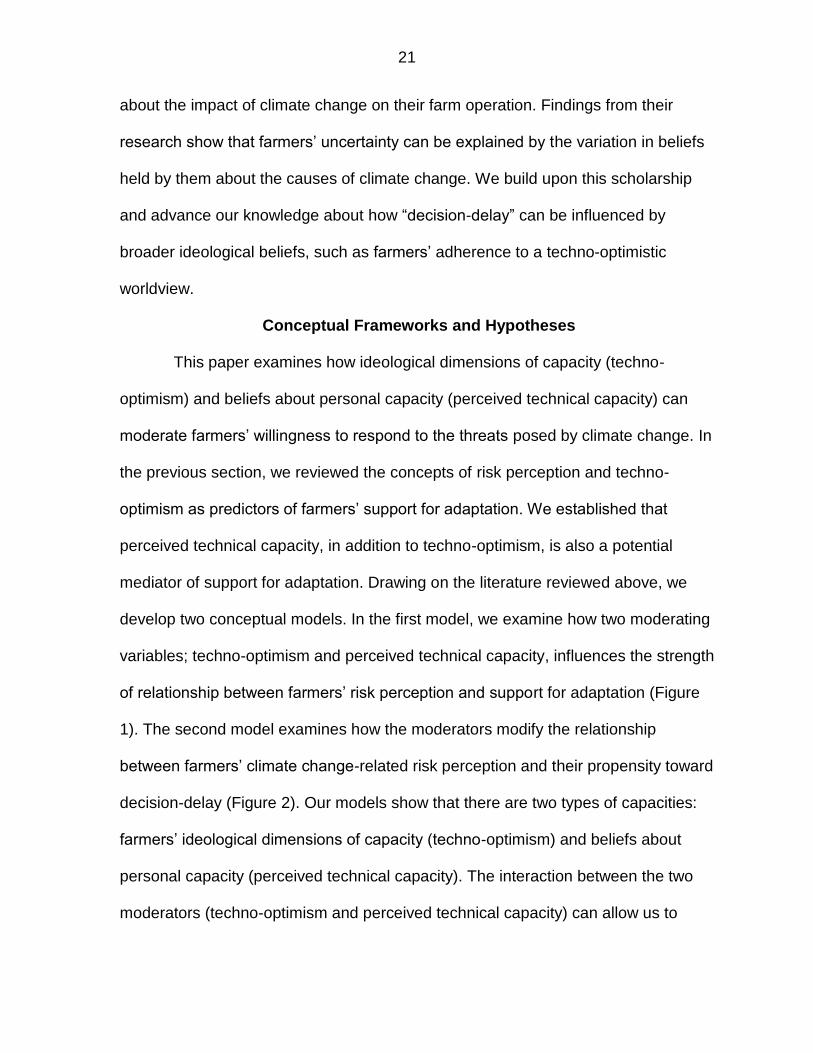
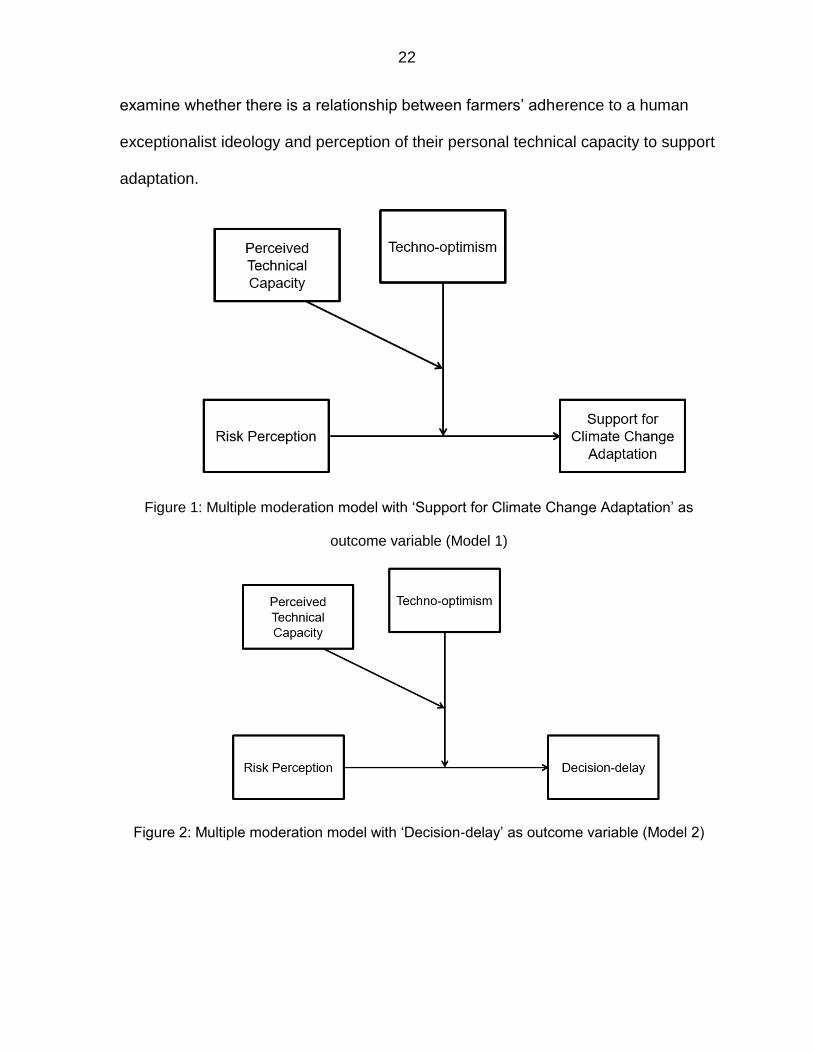
Conceptual Frameworks and Hypotheses
This paper examines how ideological dimensions of capacity (techno-
optimism) and beliefs about personal capacity (perceived technical capacity) can
moderate farmers’ willingness to respond to the threats posed by climate change. In
the previous section, we reviewed the concepts of risk perception and techno-
optimism as predictors of farmers’ support for adaptation. We established that
perceived technical capacity, in addition to techno-optimism, is also a potential
mediator of support for adaptation. Drawing on the literature reviewed above, we
develop two conceptual models. In the first model, we examine how two moderating
variables; techno-optimism and perceived technical capacity, influences the strength
of relationship between farmers’ risk perception and support for adaptation (Figure
1). The second model examines how the moderators modify the relationship
between farmers’ climate change-related risk perception and their propensity toward
decision-delay (Figure 2). Our models show that there are two types of capacities:
farmers’ ideological dimensions of capacity (techno-optimism) and beliefs about
personal capacity (perceived technical capacity). The interaction between the two
moderators (techno-optimism and perceived technical capacity) can allow us to
22
examine whether there is a relationship between farmers’ adherence to a human
exceptionalist ideology and perception of their personal technical capacity to support
adaptation.
Figure 1: Multiple moderation model with ‘Support for Climate Change Adaptation’ as
outcome variable (Model 1)
Figure 2: Multiple moderation model with ‘Decision-delay’ as outcome variable (Model 2)
23
Based on the literature reviewed above, for this study of Midwestern corn
and soybean farmers, we propose the following hypotheses:
H1: Higher levels of techno-optimism will be associated with lower levels of support
for climate change adaptation;
H2: Higher levels of techno-optimism and perceived technical capacity will weaken
the relationship between risk perception and support for climate change adaptation;
H3: Higher levels of techno-optimism will be associated with greater decision-delay;
H4: Higher levels of techno-optimism and perceived technical capacity will weaken
the relationship between risk perception and decision-delay.
Method
Data collection
The data in this research are from a February 2012 random sample survey
of farmers stratified by 22 HUC6 watersheds in the Upper Midwestern U.S.
(Arbuckle et al., 2013b). Appropriate human subjects research approvals were
obtained under Iowa State University Institutional Review Board ID#10-599. The
sample was drawn to ensure that it was representative of large-scale farmers in the
region. Only farm operations with greater than 80 acres of corn production and gross
farm revenue in excess of $100,000 were included in the sample frame. The survey
was sent to over 18,000 farmers and 4,778 respondents replied, a response rate of
26%. Statistical tests for non-response bias showed no practical differences
between respondents and non-respondents (Arbuckle et al., 2013b).
24
Measures
Each model employs one predictor variable, two moderator and control
variables and a single outcome variable. Listwise deletion of cases with missing
values on at least one variable reduced the sample size from 4,778 to 4,363 and
4,391 for model 1 and model 2, respectively. Cook’s D, leverage, and Mahalanobis
distance criteria were used to assess for outlier respondents. Tests were conducted
for multicollinearity, multivariate normality, and heteroscedasticity. Correlations
between variables are in the range of 0.1 to 0.3, so they do not depict
multicollinearity.
Outcome variables
There are two outcome variables, each measuring a unique attitude toward
climate change adaptation. “Support for adaptation” consists of a single item that
asked farmers to rate their agreement with the question: “I should take additional
steps to protect the land I farm from increased weather variability” on a 5-point scale
from strongly disagree (1) to strongly agree (5). The mean score on the support for
adaptation item was 3.47 out of 5 (Table 1). The Likert-scale for the adaptation item
were transformed into two categories (0 = “strongly disagreed, disagreed, uncertain”
and 1 = “agreed or strongly agreed).
“Decision-delay” is measured through a single survey question that asked
respondents to rate their agreement, on the same 5-point scale, with the statement:
“There’s too much uncertainty about the impacts of climate change to justify
changing my agricultural practices and strategies.” The mean score of 3.66 out of 5
on this question is evidence of sizeable agreement with the statement. We
25
constructed a dichotomous item for “Decision-delay” with 0 assigned to farmers who
strongly disagreed, disagreed, or were uncertain and 1 who agreed or strongly
agreed with the statements.
Moderators
This study uses two moderator variables. “Techno-optimism” is measured
through a single item that asked respondents to rate their agreement with the
statement, “climate change is not a big issue because human ingenuity will enable
us to adapt to changes”, on a five-point scale from strongly disagree (1) to strongly
agree (5). The mean score was 3.02 out of 5 on the techno-optimism item (Table 1).
“Perceived technical capacity” is measured through a question that asked farmers to
rate their agreement (on the same 5-point scale) with the statement, “I have the
knowledge and technical skill to deal with any weather-related threats to the viability
of my farm operation.” This question measures their assessment their farms’
capacity to withstand impacts of climate change.
Predictor variable
One predictor variable—“Perceived Risk”—is measured through a single
question that was answered on a 5-point scale ranging from 1 (strongly disagree) to
5 (strongly agree): “My farm operation will likely be harmed by climate change.” This
question measures respondents’ perception of threat associated with climate
change. Farmer education and farm size were included as statistical controls.
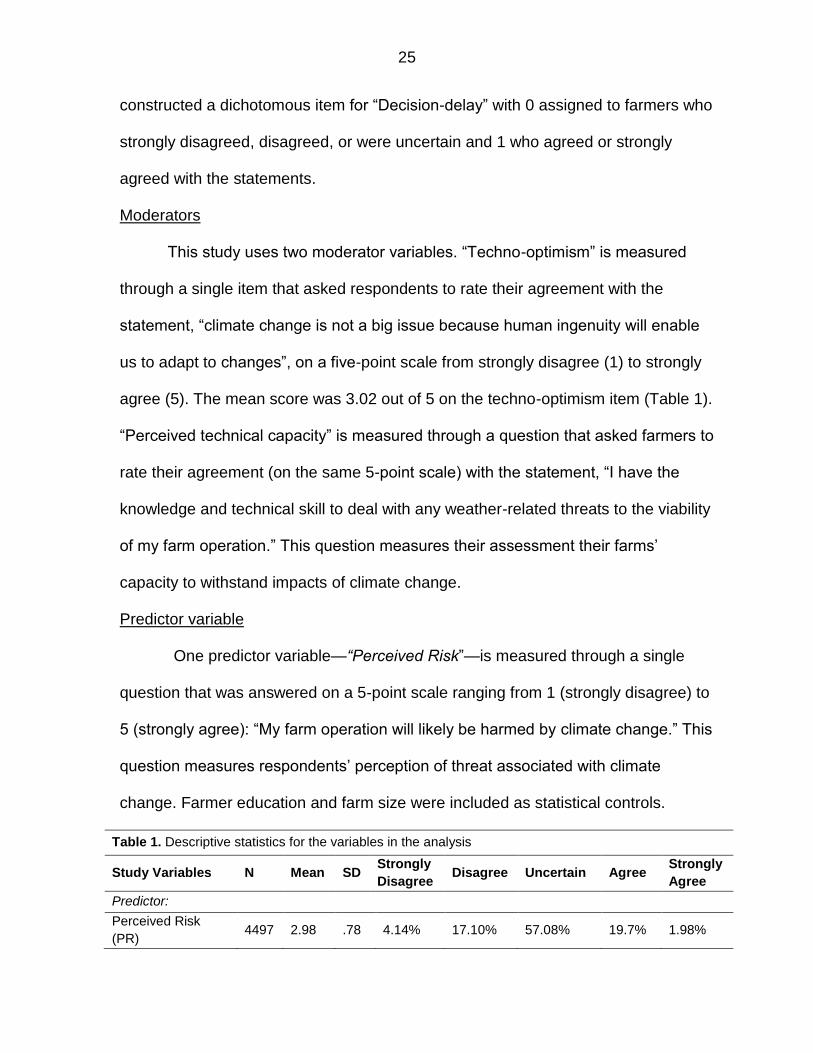
Table 1. Descriptive statistics for the variables in the analysis
Study Variables N Mean SD Strongly
Disagree Disagree Uncertain Agree
Strongly
Agree
Predictor:
Perceived Risk
(PR) 4497 2.98 .78 4.14% 17.10% 57.08% 19.7% 1.98%
26
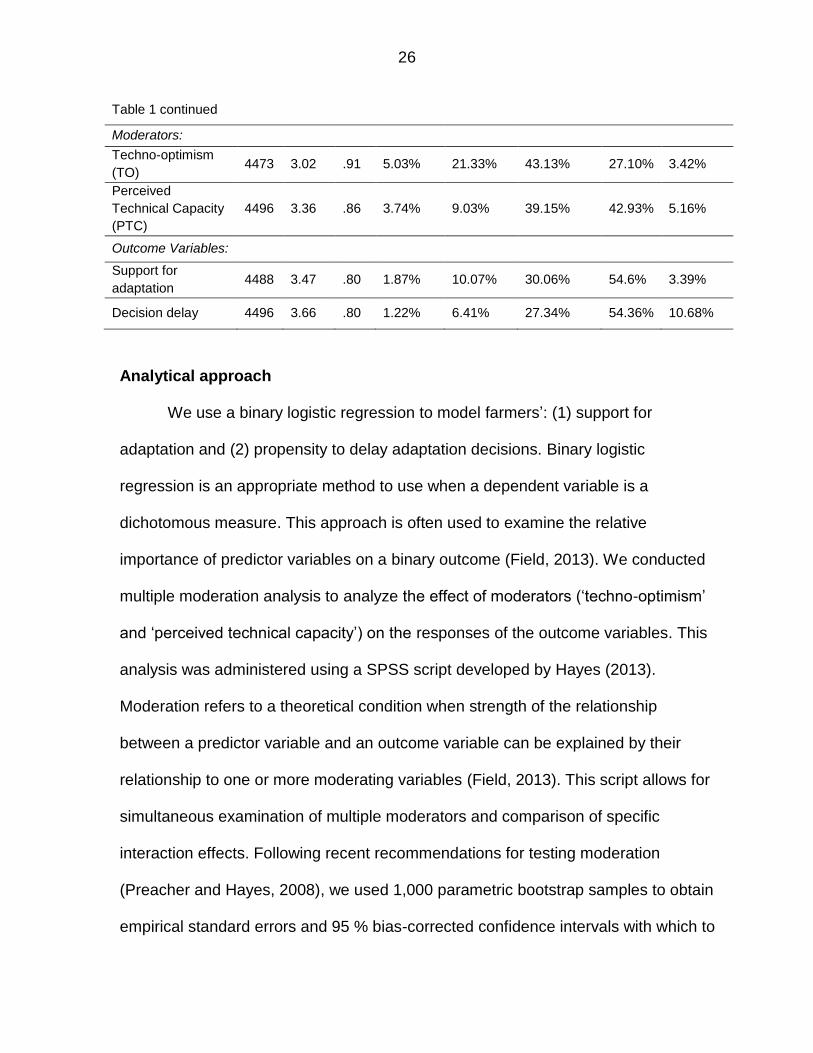
Table 1 continued
Moderators:
Techno-optimism
(TO) 4473 3.02 .91 5.03% 21.33% 43.13% 27.10% 3.42%
Perceived
Technical Capacity
(PTC)
4496 3.36 .86 3.74% 9.03% 39.15% 42.93% 5.16%
Outcome Variables:
Support for
adaptation 4488 3.47 .80 1.87% 10.07% 30.06% 54.6% 3.39%
Decision delay 4496 3.66 .80 1.22% 6.41% 27.34% 54.36% 10.68%
Analytical approach
We use a binary logistic regression to model farmers’: (1) support for
adaptation and (2) propensity to delay adaptation decisions. Binary logistic
regression is an appropriate method to use when a dependent variable is a
dichotomous measure. This approach is often used to examine the relative
importance of predictor variables on a binary outcome (Field, 2013). We conducted
multiple moderation analysis to analyze the effect of moderators (‘techno-optimism’
and ‘perceived technical capacity’) on the responses of the outcome variables. This
analysis was administered using a SPSS script developed by Hayes (2013).
Moderation refers to a theoretical condition when strength of the relationship
between a predictor variable and an outcome variable can be explained by their
relationship to one or more moderating variables (Field, 2013). This script allows for
simultaneous examination of multiple moderators and comparison of specific
interaction effects. Following recent recommendations for testing moderation
(Preacher and Hayes, 2008), we used 1,000 parametric bootstrap samples to obtain
empirical standard errors and 95 % bias-corrected confidence intervals with which to
27
assess the significance of estimates (Williams and Mackinnon, 2008). Parametric
bootstrap confidence intervals generally perform better without requiring to make
assumptions about the normality of the sampling distribution of the indirect effect
(Hayes, 2013).
Results
Table 2 shows the results of the multiple moderator models that were
specified in Model 1 (Figure 1) and Model 2 (Figure 2). The table reports logistic
coefficients and standard errors. Statistical significance is illustrated using
conventional asterisks on the coefficients. Model 1 examines both the main and
interaction effects of Perceived Risk (PR) on Support for Adaptation (SA) through
two moderators (TO and PTC). PR is the predictor, TO and PTC are moderators,
and SA is the outcome variable. This moderation model allows us to consider each
moderator’s unique influence on the relationship between PR and SA. The log odds
estimates of model 1, their standard errors, and statistical significance (represented
with an asterisk) are presented in Table 2. Overall, the model shows a coefficient of
determination (R2) of 0.05. The low R2 is expected because of the relatively few
predictor/moderator variables included in our model to explain farmers’ support for
adaptation.
Model 1 can be divided into two types of effects: main and interaction effects.
As shown in Table 2, with respect to the main effects, PR was positively associated
with SA (b=0.45, se=0.05, p<0.001). With respect to the main effects from the
moderators (TO and PTC) to SA, higher levels of TO was associated with lower
levels of SA (b=-0.13, se=0.04, p<0.001). The relationship between PTC and SA
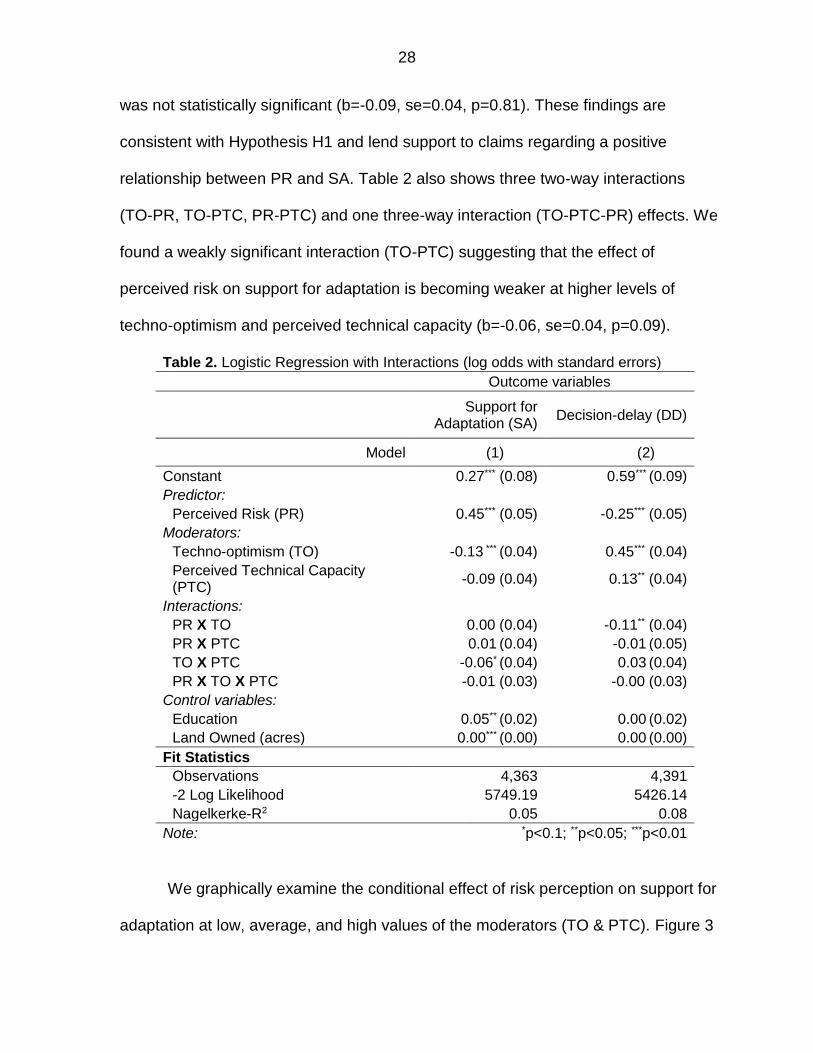
28
was not statistically significant (b=-0.09, se=0.04, p=0.81). These findings are
consistent with Hypothesis H1 and lend support to claims regarding a positive
relationship between PR and SA. Table 2 also shows three two-way interactions
(TO-PR, TO-PTC, PR-PTC) and one three-way interaction (TO-PTC-PR) effects. We
found a weakly significant interaction (TO-PTC) suggesting that the effect of
perceived risk on support for adaptation is becoming weaker at higher levels of
techno-optimism and perceived technical capacity (b=-0.06, se=0.04, p=0.09).
Table 2. Logistic Regression with Interactions (log odds with standard errors)
Outcome variables
Support for Adaptation (SA)
Decision-delay (DD)
Model (1) (2)
Constant 0.27*** (0.08) 0.59*** (0.09)
Predictor:
Perceived Risk (PR) 0.45*** (0.05) -0.25*** (0.05)
Moderators:
Techno-optimism (TO) -0.13 *** (0.04) 0.45*** (0.04)
Perceived Technical Capacity (PTC)
-0.09 (0.04) 0.13** (0.04)
Interactions:
PR X TO 0.00 (0.04) -0.11** (0.04)
PR X PTC 0.01 (0.04) -0.01 (0.05)
TO X PTC -0.06* (0.04) 0.03 (0.04)
PR X TO X PTC -0.01 (0.03) -0.00 (0.03)
Control variables:
Education 0.05** (0.02) 0.00 (0.02)
Land Owned (acres) 0.00*** (0.00) 0.00 (0.00)
Fit Statistics
Observations 4,363 4,391
-2 Log Likelihood 5749.19 5426.14
Nagelkerke-R2 0.05 0.08
Note: *p<0.1; **p<0.05; ***p<0.01
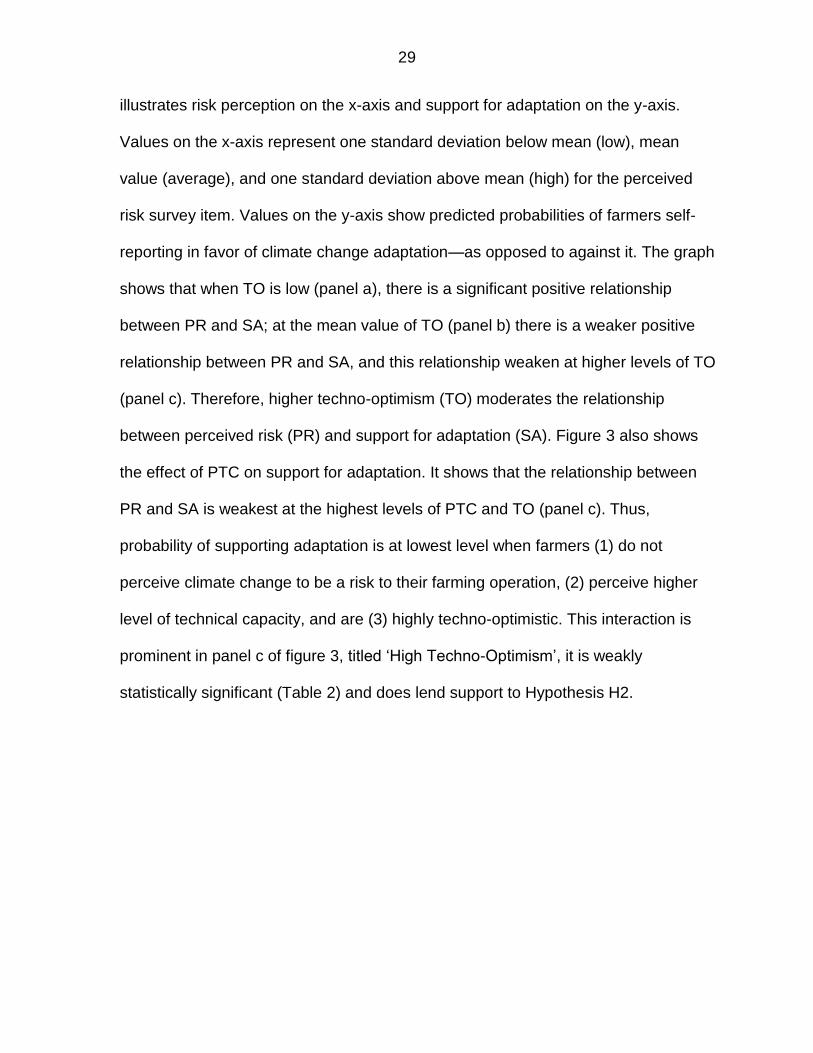
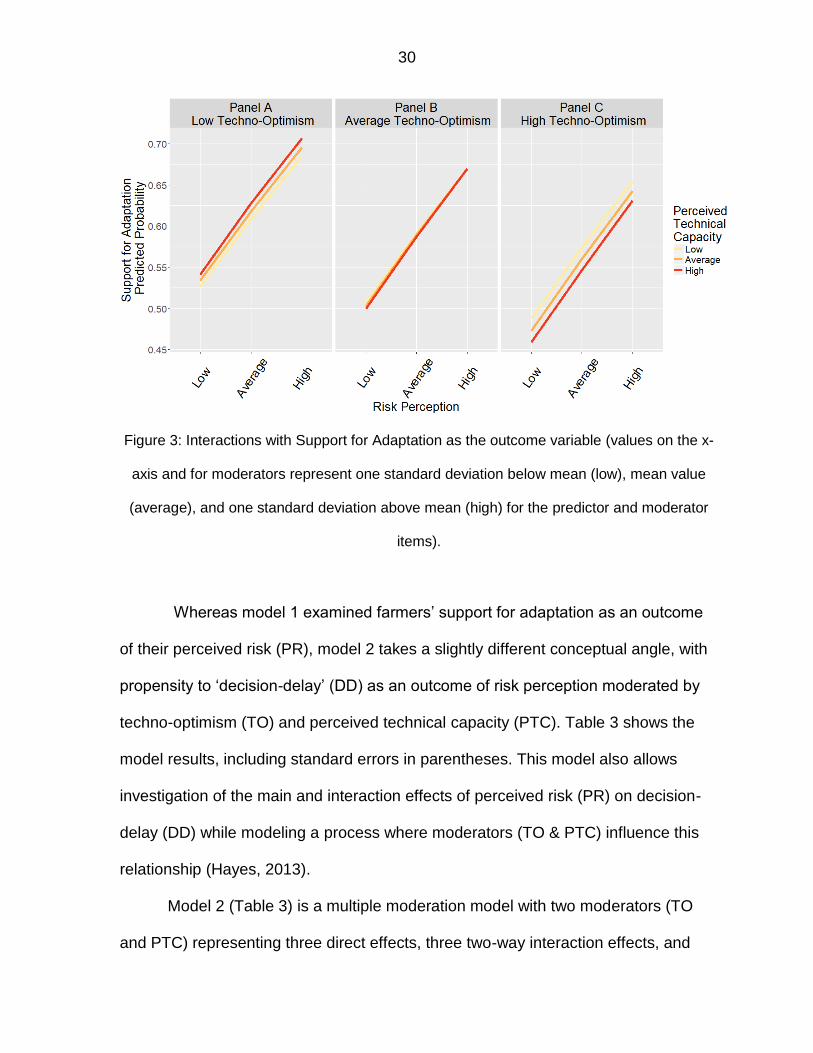
We graphically examine the conditional effect of risk perception on support for
adaptation at low, average, and high values of the moderators (TO & PTC). Figure 3
29
illustrates risk perception on the x-axis and support for adaptation on the y-axis.
Values on the x-axis represent one standard deviation below mean (low), mean
value (average), and one standard deviation above mean (high) for the perceived
risk survey item. Values on the y-axis show predicted probabilities of farmers self-
reporting in favor of climate change adaptation—as opposed to against it. The graph
shows that when TO is low (panel a), there is a significant positive relationship
between PR and SA; at the mean value of TO (panel b) there is a weaker positive
relationship between PR and SA, and this relationship weaken at higher levels of TO
(panel c). Therefore, higher techno-optimism (TO) moderates the relationship
between perceived risk (PR) and support for adaptation (SA). Figure 3 also shows
the effect of PTC on support for adaptation. It shows that the relationship between
PR and SA is weakest at the highest levels of PTC and TO (panel c). Thus,
probability of supporting adaptation is at lowest level when farmers (1) do not
perceive climate change to be a risk to their farming operation, (2) perceive higher
level of technical capacity, and are (3) highly techno-optimistic. This interaction is
prominent in panel c of figure 3, titled ‘High Techno-Optimism’, it is weakly
statistically significant (Table 2) and does lend support to Hypothesis H2.
30
Figure 3: Interactions with Support for Adaptation as the outcome variable (values on the x-
axis and for moderators represent one standard deviation below mean (low), mean value
(average), and one standard deviation above mean (high) for the predictor and moderator
items).
Whereas model 1 examined farmers’ support for adaptation as an outcome
of their perceived risk (PR), model 2 takes a slightly different conceptual angle, with
propensity to ‘decision-delay’ (DD) as an outcome of risk perception moderated by
techno-optimism (TO) and perceived technical capacity (PTC). Table 3 shows the
model results, including standard errors in parentheses. This model also allows
investigation of the main and interaction effects of perceived risk (PR) on decision-
delay (DD) while modeling a process where moderators (TO & PTC) influence this
relationship (Hayes, 2013).
Model 2 (Table 3) is a multiple moderation model with two moderators (TO
and PTC) representing three direct effects, three two-way interaction effects, and
31
one three-way interaction. As shown in Table 3, with respect to the main effects,
climate change risk perception was negatively associated with the decision-delay
(b=-0.25, se=0.05, p<0.001). With respect to the main effects from the moderators
(TO & PTC) to DD, higher levels of TO were associated with higher levels of DD
(b=0.45, se=0.04, p<0.001). The relationship between PTC and DD was statistically
significant and positive (b=0.13, se=0.04, p=0.02). Therefore, higher level of
perceived technical capacity is associated with greater decision-delay. These
findings are consistent with Hypothesis H3. Table 3 also shows three two-way
interactions (PR-TO, TO-PTC, PR-PTC) and one three-way interaction (PR-TO-
PTC) effects. The two-way interaction, PR-TO, is statistically significant (b=-0.11,
se=0.04, p=0.04), implying that the relationship between perceived risk (PR) and
decision-delay (DD) is significantly (weakly) moderated by techno-optimism (TO).
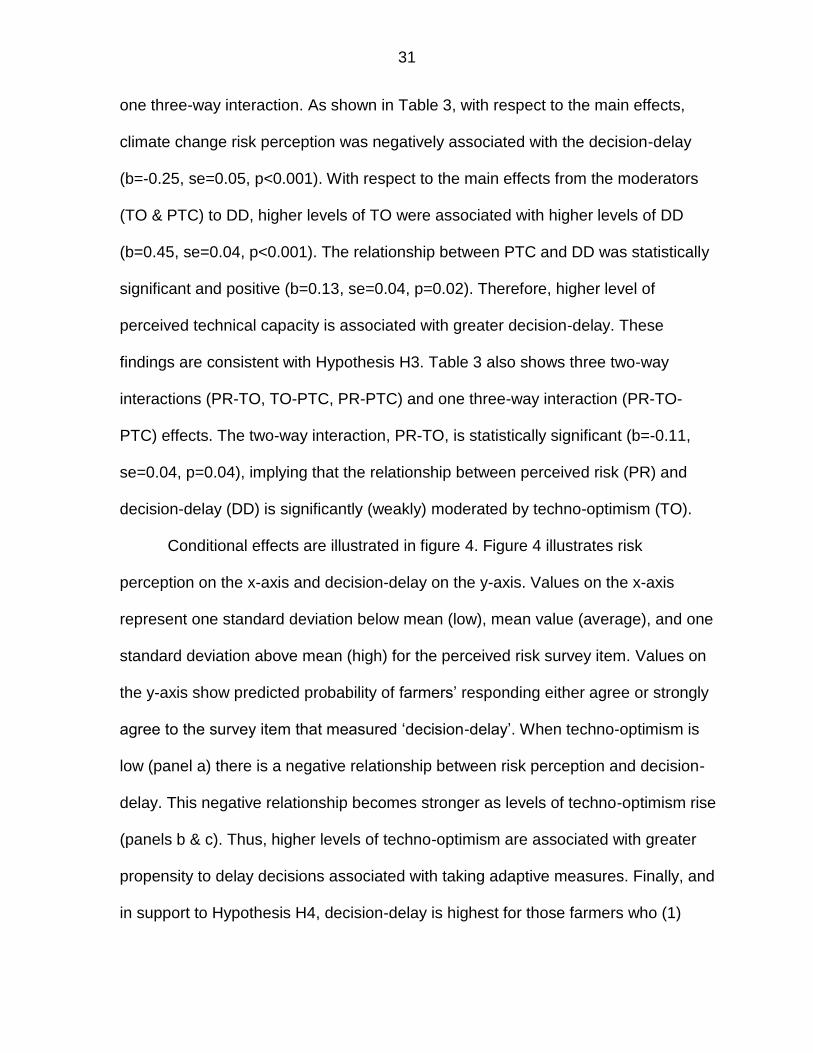
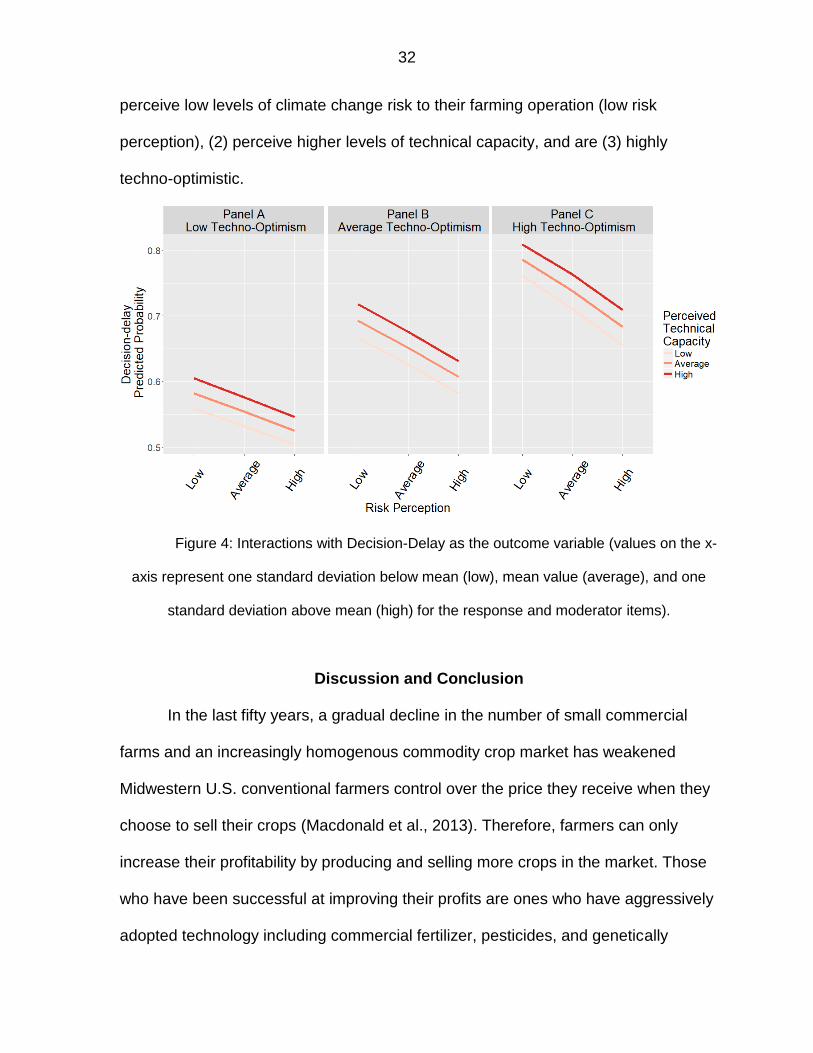
Conditional effects are illustrated in figure 4. Figure 4 illustrates risk
perception on the x-axis and decision-delay on the y-axis. Values on the x-axis
represent one standard deviation below mean (low), mean value (average), and one
standard deviation above mean (high) for the perceived risk survey item. Values on
the y-axis show predicted probability of farmers’ responding either agree or strongly
agree to the survey item that measured ‘decision-delay’. When techno-optimism is
low (panel a) there is a negative relationship between risk perception and decision-
delay. This negative relationship becomes stronger as levels of techno-optimism rise
(panels b & c). Thus, higher levels of techno-optimism are associated with greater
propensity to delay decisions associated with taking adaptive measures. Finally, and
in support to Hypothesis H4, decision-delay is highest for those farmers who (1)
32
perceive low levels of climate change risk to their farming operation (low risk
perception), (2) perceive higher levels of technical capacity, and are (3) highly
techno-optimistic.
Figure 4: Interactions with Decision-Delay as the outcome variable (values on the x-
axis represent one standard deviation below mean (low), mean value (average), and one
standard deviation above mean (high) for the response and moderator items).
Discussion and Conclusion
In the last fifty years, a gradual decline in the number of small commercial
farms and an increasingly homogenous commodity crop market has weakened
Midwestern U.S. conventional farmers control over the price they receive when they
choose to sell their crops (Macdonald et al., 2013). Therefore, farmers can only
increase their profitability by producing and selling more crops in the market. Those
who have been successful at improving their profits are ones who have aggressively
adopted technology including commercial fertilizer, pesticides, and genetically

33
modified seed varieties. Indeed, many conventional farmers see the adoption of new
technology as necessary for improving profitability and surviving a highly competitive
commodity market.
Although extensive use of technology, such as synthetic inputs has allowed
farmers to efficiently produce and sell more crops, some of these technologies have
has also been responsible for serious environmental problems associated with
degradation of soil health and water quality. While outreach efforts are
communicating and demonstrating to farmers the economic and environmental
benefits of alternative or sustainable farming practices, recent research on farmer
decision-making suggests that over time Midwestern corn farmers have become
more skeptical about the efficacy of such practices to improve economic profitability
and environmental quality (Morton et al., 2013). This raises concerns about the
effectiveness of existing engagement strategies that communicate the benefits of
adopting sustainable farm management practices to farmers.
In this study, we found that techno-optimistic farmers were less likely to
indicate support for individual-level adaptation to climate change. An important
implication of this finding is that effective outreach for adaptive management
practices, such as soil and water conservation should be promoted from a techno-
optimistic perspective. In other words, since many farmers attribute the use of new
technology with higher crop productivity and profitability, outreach activities for soil
and water conservation should highlight the technical aspects of sustainable farming
practices to appeal to farmers’ techno-optimism. Communication with farmers should
focus on the science of practices by highlighting their effectiveness. Outreach should
34
learn the principles of modern advertising (that many synthetic input manufacturers
use) to communicate the science behind soil and water conservation practices.
Natural resource systems, such as farming, are highly complex, fraught with
large uncertainties due to vagaries of weather and markets (Gunderson, 2015,
1999). Climate change is likely to create additional uncertainties related to farm
management, such as deciding when to plant and harvest crops. Therefore, farmers’
ought to continuously respond to the threats posed by climate change by planning,
learning, and experimenting. However, as identified in this study, farmers’ adherence
to an abstract faith in human ingenuity to solve future challenges associated with
climate change may reduce their willingness to support adaptation and increase their
propensity to delay decisions pertaining to agricultural adaptation. For example,
farmers could decide to wait and see whether research and development by
public/private sector will develop the next needed technology to manage uncertainty
associated with climate change. To deal with this unfettered faith in the capacity of
humans to solve all social and environmental problems, we suggest that
engagement strategies should highlight the limitations and possibilities of science
and technology for addressing challenges of food security and environmental
degradation.
A balanced view about the confines and opportunities of science and
technology for solving climate change-related issues can help farmers make better
evaluations of their perceived technical capacity. Contrary to previous research that
has shown perceived capacity to positively influence actors’ support for adaptation
(Esham and Garforth, 2013), we found that higher perceived technical capacity was
35
negatively related to support for adaptation and positively associated with decision-
delay (Figure 5). Farmers’ who reported higher levels of perceived technical capacity
to prepare for climate change were more likely to express uncertainty about
adaptation decisions. Therefore, by developing communication strategies that
explain both opportunities and limitations of adopting new technology, farmers' can
make more accurate assumptions about their own capacity to overcome challenges
associated with climate change and variability.
We examined how the interaction effects between ideological dimensions of
capacity (techno-optimism) and beliefs about personal capacity (perceived technical
capacity) can moderate farmers’ willingness to respond to the threats posed by
climate change. This study found that the combined effect of farmers’ techno-
optimism and perceived technical capacity was associated with reduced support for
adaptation (Figure 4) and greater decision-delay (Figure 6). Interestingly, these
findings applied to farmers with low, average, and high levels of risk perception. In
other words, even at higher levels of risk perception, farmers’ who perceived higher
technical capacity and greater techno-optimism were (1) less likely to support
adaptation (Figure 4) and (2) more likely to delay adaptation decisions (Figure 6).
Thus, a key finding of this research is that while perceived risks are important
indicators of farmers’ support for adaptation, they are filtered through other socio-
cognitive dimensions of risk. These results suggest that a focus on risk perception,
although an important complementary determinant of behavior, perhaps is not
sufficient on its own. Therefore, engagement strategies need to consider how these
mediating factors can play role in shaping adaptation-related behavior. Instead of
36
developing outreach efforts that focus only on educating farmers about risks,
engagement strategies need to explain to farmers the technological limitations of
different adaptation strategies. For example, the success of drought-resistant seeds
depends greatly on biophysical and managerial factors, such as the availability and
volatility of precipitation and the timing of planting seeds, respectively. Therefore,
engagement strategies should highlight how biophysical conditions and
management-related decisions can influence the success of farm-level adaptation to
climate change.
This study assessed the influence of techno-optimism, perceived technical
capacity, and risk perceptions on farmers’ attitudes toward climate change
adaptation. We found that higher level of techno-optimism and perceived technical
capacity can (1) reduce farmers’ support for climate change adaptation and (2)
increase their propensity to express a preference to delay adaptation-related
actions. The findings from this study advance our understanding of how social and
cognitive factors influence farmers’ attitudes toward climate change adaptation. This
study makes several contributions to our understanding of farmers and climate
change. First, to the literature on environmental sociology, specifically to its
understanding of human exemptionalism in conventional agriculture. Second, to
natural hazard research by highlighting that actors may think of ‘experts’ in terms of
abstract entities (Giddens, 1991) and not solely in terms of actual authorities, such
as disaster relief and rehabilitation agencies (Bichard and Kazmierczak, 2012).
Third, to the literature on farmers’ decision-making in uncertainty, specifically, as it
relates to their willingness to support adaptation to climate change.
37
References
Agrawal, A., 2008. The Role of Local Institutions in Adaptation to. Soc. Dev. 65. doi:10.1596/978-0-8213-7887-8
Anderson, C.J., 2003. The psychology of doing nothing: forms of decision avoidance result from reason and emotion. Psychol. Bull. 129, 139–167. doi:10.1037/0033-2909.129.1.139
Arbuckle, J.G., Morton, L.W., Hobbs, J., 2013a. Farmer beliefs and concerns about climate change and attitudes toward adaptation and mitigation: Evidence from Iowa. Clim. Change 118, 551–563. doi:10.1007/s10584-013-0700-0
Arbuckle, J.G., Prokopy, L.S., Haigh, T., Hobbs, J., Knoot, T., Knutson, C., Loy, A., Mase, A.S., McGuire, J., Morton, L.W., Tyndall, J., Widhalm, M., 2013b. Climate change beliefs, concerns, and attitudes toward adaptation and mitigation among farmers in the Midwestern United States. Clim. Change 117, 943–950. doi:10.1007/s10584-013-0707-6
Barry, J., 2012. Bio-fuelling the Hummer? Transdisciplinary thoughts on techno-optimism and innovation in the transition from unsustainability, in: Transdisciplinary Perspectives on Transitions to Sustainability. Routledge, p. 106.
Berman, R., Quinn, C., Paavola, J., 2012. The role of institutions in the transformation of coping capacity to sustainable adaptive capacity. Environ. Dev. 2, 86–100. doi:10.1016/j.envdev.2012.03.017
Beus, C.E., Dunlap, R.E., 1994. Agricultural Paradigms and the Practice of Agriculture. Rural Sociol. 59, 620–635. doi:10.1111/j.1549-0831.1994.tb00551.x
Beus, C.E., Dunlap, R.E., 1990a. Conventional versus Alternative Agriculture: The Paradigmatic Roots of the Debate. Rural Sociol. 55, 590–616. doi:10.1111/j.1549-0831.1990.tb00699.x
Beus, C.E., Dunlap, R.E., 1990b. Conventional versus Alternative Agriculture: The Paradigmatic Roots of the Debate. Rural Sociol. doi:10.1111/j.1549-0831.1990.tb00699.x
Bichard, E., Kazmierczak, A., 2012. Are homeowners willing to adapt to and mitigate the effects of climate change? Clim. Change 112, 633–654. doi:10.1007/s10584-011-0257-8
Black, D.R., Babrow, a S., 1991. Identification of campaign recruitment strategies for a stepped smoking cessation intervention for a college campus. Health Educ. Q. 18, 235–247. doi:10.1177/109019819101800208
Botetzagias, I., Dima, A.F., Malesios, C., 2015. Extending the Theory of Planned Behavior in the context of recycling: The role of moral norms and of demographic predictors. Resour. Conserv. Recycl. 95, 58–67. doi:10.1016/j.resconrec.2014.12.004
38
Brown, K., Westaway, E., 2011. Agency, Capacity, and Resilience to Environmental Change: Lessons from Human Development, Well-Being, and Disasters. Annu. Rev. Environ. Resour. 36, 321–342. doi:10.1146/annurev-environ-052610-092905
Bubeck, P., Botzen, W.J.W., Aerts, J.C.J.H., 2012. A Review of Risk Perceptions and Other Factors that Influence Flood Mitigation Behavior. Risk Anal. 32, 1481–1495. doi:10.1111/j.1539-6924.2011.01783.x
Catton, W.R., Dunlap, R.E., 1978. Catton & Dunlap, 1978, Environmental Sociology_A new paradigm.pdf. Am. Sociol. 13, 41–49.
Cheung, S.F., Chan, D.K.-S., Wong, Z.S.-Y., 1999. Reexamining the Theory of Planned Behavior in Understanding Wastepaper Recycling. Environ. Behav. 31, 587–612. doi:10.1177/00139169921972254
Coumou, D., Rahmstorf, S., 2012. A decade of weather extremes. Nat. Clim. Chang. 2, 491–496. doi:10.1038/Nclimate1452
Dentzman, K., Gunderson, R., Jussaume, R., 2016. Techno-optimism as a barrier to overcoming herbicide resistance: Comparing farmer perceptions of the future potential of herbicides. J. Rural Stud. 48, 22–32. doi:10.1016/j.jrurstud.2016.09.006
Dimitri, C., Effland, A., Conklin, N., 2005. The 20th century transformation of U.S. agriculture and farm policy / Carolyn Dimitri, Anne Effland, and Neilson Conklin. Transformation 3, 17.
Dovers, S.R., Hezri, A.A., 2010. Institutions and policy processes: The means to the ends of adaptation. Wiley Interdiscip. Rev. Clim. Chang. 1, 212–231. doi:10.1002/wcc.29
Dunlap, R.E., Catton, W.R., 1994. Struggling with human exemptionalism: The rise, decline and revitalization of environmental sociology. Am. Sociol. 25, 5–30. doi:10.1007/BF02691936
Eakin, H., York, A., Aggarwal, R., Waters, S., Welch, J., Rubiños, C., Smith-Heisters, S., Bausch, C., Anderies, J.M., 2016. Cognitive and institutional influences on farmers’ adaptive capacity: insights into barriers and opportunities for transformative change in central Arizona. Reg. Environ. Chang. 16, 801–814. doi:10.1007/s10113-015-0789-y
Earle, T.C., 2010. Trust in risk management: A model-based review of empirical research. Risk Anal. doi:10.1111/j.1539-6924.2010.01398.x
Engle, N.L., 2011. Adaptive capacity and its assessment. Glob. Environ. Chang. 21, 647–656. doi:10.1016/j.gloenvcha.2011.01.019
Engle, N.L., Lemos, M.C., 2010. Unpacking governance: Building adaptive capacity to climate change of river basins in Brazil. Glob. Environ. Chang. 20, 4–13. doi:10.1016/j.gloenvcha.2009.07.001
39
Esham, M., Garforth, C., 2013. Agricultural adaptation to climate change: Insights from a farming community in Sri Lanka. Mitig. Adapt. Strateg. Glob. Chang. 18, 535–549. doi:10.1007/s11027-012-9374-6
Feldman, L., Myers, T.A., Hmielowski, J.D., Leiserowitz, A., 2014. The mutual reinforcement of media selectivity and effects: Testing the reinforcing spirals framework in the context of global warming. J. Commun. 64, 590–611. doi:10.1111/jcom.12108
Field, A., 2013. Discovering Statistics using IBM SPSS Statistics. Discov. Stat. using IBM SPSS Stat. 297–321. doi:10.1016/B978-012691360-6/50012-4
Foster, J.B., 2012. The Planetary Rift and the New Human Exemptionalism: A Political-Economic Critique of Ecological Modernization Theory. Organ. Environ. 25, 211–237. doi:10.1177/1086026612459964
Frank, E., Eakin, H., Lopez-Carr, D., 2011. Social identity, perception and motivation in adaptation to climate risk in the coffee sector of Chiapas, Mexico. Glob. Environ. Chang. 21, 66–76. doi:10.1016/j.gloenvcha.2010.11.001
Frederiksen, M., 2014. Trust in the face of uncertainty: a qualitative study of intersubjective trust and risk. Int. Rev. Sociol. 24, 130–144. doi:10.1080/03906701.2014.894335
Giddens, A., 1991. The Consequences of Modernity. Br. J. Sociol. 188. doi:10.2307/591454
Gramig, B.M., Barnard, J.M., Prokopy, L.S., 2013. Farmer beliefs about climate change and carbon sequestration incentives. Clim. Res. 56, 157–167. doi:10.3354/cr01142
Grothmann, T., Patt, A., 2005. Adaptive capacity and human cognition: The process of individual adaptation to climate change. Glob. Environ. Chang. 15, 199–213. doi:10.1016/j.gloenvcha.2005.01.002
Gunderson, L., 2015. Lessons from adaptive management: obstacles and outcomes, in: Adaptive Management of Social-Ecological Systems. Springer Netherlands, pp. 27–38.
Gunderson, L., 1999. Resilience, flexibility and adaptive management - Antidotes for spurious certitude? Ecol. Soc. 3. doi:10.5751/ES-00089-030107
Hardin, R., 1991. Trusting persons, trusting institutions, in: Zeckhauser, R. (Ed.), Strategy and Choice. MIT Press, Cambridge, p. 185–209.
Hatfield, J., Takle, G., Grotjahn, R., Holden, P., Izaurralde, R.C., Mader, T., Marshall, E., Liverman, D., 2014. Agriculture, in: Climate Change Impacts in the United States: The Third National Climate Assessment. pp. 150–174. doi:10.7930/J02Z13FR
Hayes, A., 2013. Introduction to mediation, moderation, and conditional process analysis, New York, NY: Guilford. doi:978-1-60918-230-4
40
Hess, J.J., McDowell, J.Z., Luber, G., 2012. Integrating climate change adaptation into public health practice: Using adaptive management to increase adaptive capacity and build resilience. Environ. Health Perspect. 120, 171–179. doi:10.1289/ehp.1103515
Hung, H.V., Shaw, R., Kobayashi, M., 2007. Flood risk management for the RUA of Hanoi: Importance of community perception of catastrophic flood risk in disaster risk planning. Disaster Prev. Manag. 16, 245–258. doi:10.1108/09653560710739568
Jorgensen, S.L., Termansen, M., 2016. Linking climate change perceptions to adaptation and mitigation action. Clim. Change 138, 283–296. doi:10.1007/s10584-016-1718-x
Kremen, C., Miles, A., 2012. Ecosystem services in biologically diversified versus conventional farming systems: Benefits, externalities, and trade-offs. Ecol. Soc. doi:10.5751/ES-05035-170440
Lal, R., Delgado, J. a., Groffman, P.M., Millar, N., Dell, C., Rotz, a., 2011. Management to mitigate and adapt to climate change. J. Soil Water Conserv. 66, 276–285. doi:10.2489/jswc.66.4.276
Lo, A.Y., 2013. The role of social norms in climate adaptation: Mediating risk perception and flood insurance purchase. Glob. Environ. Chang. 23, 1249–1257. doi:10.1016/j.gloenvcha.2013.07.019
Lobao, L., Meyer, K., 2001. The Great Agricultural Transition: Crisis, Change, and Social Consequences of Twentieth Century US Farming. Annu. Rev. Sociol. 27, 103–124. doi:10.1146/annurev.soc.27.1.103
Lowe, P., Marsden, T., Whatmore, S., 1990. Technological change and the rural environments. Fulton.
Macdonald, J.M., Korb, P., Hoppe, R. a, 2013. Farm Size and the Organization of U . S . Crop Farming. Econ. Res. Rep. 1–61.
McCarl, B.A., 2010. Analysis of climate change implications for agriculture and forestry: An interdisciplinary effort. Clim. Change 100, 119–124. doi:10.1007/s10584-010-9833-6
McNeill, I. M., Dunlop, P. D., Skinner, T. C., & Morrison, D.L., 2015. Predicting delay in residents’ decisions on defending v. evacuating through antecedents of decision avoidance. Int. J. Wildl. Fire 24, 153–161.
Möllering, G., 2006. Trust: Reason, routine, reflexivity. Emerald Group Publishing.
Morton, L.W., Hobbs, J., Arbuckle, J.G., 2013. Shifts in farmer uncertainty over time about sustainable farming practices and modern farming’s reliance on commercial fertilizers, insecticides, and herbicides. J. Soil Water Conserv. 68, 1–12. doi:10.2489/jswc.68.1.1
41
Morton, L.W., Hobbs, J., Arbuckle, J.G., Loy, A., 2015. Upper midwest climate variations: farmer responses to excess water risks. J. Environ. Qual. 44, 810–22. doi:10.2134/jeq2014.08.0352
Morton, L.W., Roesch-Mcnally, G., Wilke, A.K., 2017. Upper Midwest farmer perceptions: Too much uncertainty about impacts of climate change to justify changing current agricultural practices 72, 215–225. doi:10.2489/jswc.72.3.215
Moser, C., Stauffacher, M., Blumer, Y.B., Scholz, R.W., 2014. From risk to vulnerability: the role of perceived adaptive capacity for the acceptance of contested infrastructure. J. Risk Res. 9877, 1–15. doi:10.1080/13669877.2014.910687
Nelson, D.R., Adger, W.N., Brown, K., 2007. Adaptation to Environmental Change: Contributions of a Resilience Framework. Annu. Rev. Environ. Resour. 32, 395–419. doi:10.1146/annurev.energy.32.051807.090348
Nickel, P.J., Vaesen, K., 2012. Risk and trust, in: In Handbook of Risk Theory. Springer Netherlands, pp. 857–876.
Ostrom, E., 2008. Institutions and the environment. Econ. Aff. 28, 24–31. doi:10.1111/j.1468-0270.2008.00840.x
Parry, M.L., Canziani, O.F., Palutikof, J.P., van der Linden, P.J., Hanson, C.E., 2007. IPCC, 2007: Summary for Policymakers, in: Climate Change 2007: Impacts, Adaptation and Vulnerability. Contribution ofWorking Group II to the Fourth Assessment Report of the Intergovernmental Panel on Climate Change. pp. 7–22. doi:10.2134/jeq2008.0015br
Preacher, K.J., Hayes, A.F., 2008. Asymptotic and resampling strategies for assessing and comparing indirect effects in multiple mediator models. Behav. Res. Methods 40, 879–891. doi:10.3758/BRM.40.3.879
Prokopy, L.S., Floress, K., Klotthor-Weinkauf, D., Baumgart-Getz, a., 2008. Determinants of agricultural best management practice adoption: Evidence from the literature. J. Soil Water Conserv. 63, 300–311. doi:10.2489/jswc.63.5.300
Rasmussen, W., 1962. The Impact of Technological Change on American Agriculture , 1862-1962. J. Econ. Hist. 22, 578–591.
Reimer, A.P., Weinkauf, D.K., Prokopy, L.S., 2012. The influence of perceptions of practice characteristics: An examination of agricultural best management practice adoption in two indiana watersheds. J. Rural Stud. 28, 118–128. doi:10.1016/j.jrurstud.2011.09.005
42
Rockström, J., Steffen, W., Noone, K., Persson, Å., Chapin, F.S., Lambin, E., Lenton, T.M., Scheffer, M., Folke, C., Schellnhuber, H.J., Nykvist, B., de Wit, C.A., Hughes, T., van der Leeuw, S., Rodhe, H., Sörlin, S., Snyder, P.K., Costanza, R., Svedin, U., Falkenmark, M., Karlberg, L., Corell, R.W., Fabry, V.J., Hansen, J., Walker, B., Liverman, D., Richardson, K., Crutzen, P., Foley, J., 2009. Planetary boundaries: Exploring the safe operating space for humanity. Ecol. Soc. 14. doi:10.1038/461472a
Rogers, R.W., 1975. A Protection Motivation Theory of Fear Appeals and Attitude Change1. J. Psychol. 91, 93–114. doi:10.1080/00223980.1975.9915803
Seara, T., Clay, P.M., Colburn, L.L., 2016. Perceived adaptive capacity and natural disasters: A fisheries case study. Glob. Environ. Chang. 38, 49–57. doi:10.1016/j.gloenvcha.2016.01.006
Smit, B., Skinner, M.W., 2002. Adaptation Options in Agriculture To Climate Change : a. Mitig. Adapt. Strateg. Glob. Chang. 7, 85–114. doi:10.1023/A:1015862228270
Tikir, A., Lehmann, B., 2011. Climate change, theory of planned behavior and values: A structural equation model with mediation analysis. Clim. Change. doi:10.1007/s10584-010-9937-z
Truelove, H.B., Carrico, A.R., Thabrew, L., 2015. A socio-psychological model for analyzing climate change adaptation: A case study of Sri Lankan paddy farmers. Glob. Environ. Chang. 31, 85–97. doi:10.1016/j.gloenvcha.2014.12.010
Trumbo, C.W., O’Keefe, G.J., 2005. Intention to Conserve Water: Environmental Values, Reasoned Action, and Information Effects Across Time. Soc. Nat. Resour. 18, 573–585. doi:10.1080/08941920590948002
USDA-NASS, 2015. Quick-Stats [WWW Document]. URL http://quickstats.nass.usda.gov/#C5600DC7-112D-345FBD43-1C73E0E4F539.
Uslaner, E.M., 2008. Trust as a moral value. Handb. Soc. Cap. 101–121.
Wachinger, G., Renn, O., Begg, C., Kuhlicke, C., 2013. The risk perception paradox-implications for governance and communication of natural hazards. Risk Anal. 33, 1049–1065. doi:10.1111/j.1539-6924.2012.01942.x
Walthall, C.L., Hatfield, J., Backlund, P., Lengnick, L., Marshall, E., Walsh, M., Adkins, S., Aillery, M., Ainsworth, E.A., Ammann, C., Anderson, C.J., Bartomeus, I., Baumgard, L.H., Booker, F., Bradley, B., Blumenthal, D.M., Bunce, J., Burkey, K., Dabney, S.M., Delgado, J.A., Dukes, J., Funk, A., Garrett, K., Glenn, M., Grantz, D.A., Goodrich, D., Hu, S., Izaurralde, R.C., Jones, R.A.C., Kim, S.-H., Leaky, A.D.B., Lewers, K., Mader, T.L., McClung, A., Morgan, J., Muth, D.J., Nearing, M., Oosterhuis, D.M., Ort, D., Parmesan, C., Pettigrew, W.T., Polley, W., Rader, R., Rice, C., Rivington, M., Rosskopf, E., Salas, W.A., Sollenberger, L.E., Srygley, R., Stöckle, C., Takle, E.S., Timlin, D., White, J.W., Winfree, R., Wright-Morton, L., Ziska, L.H., 2012. Climate Change and Agriculture: Effects and Adaptation. Washington, DC.
43
Wang, S.L., 2013. Agricultural Productivity Growth in the United States: Measurement, Drivers, and Impacts. Proc. 59th ISI World Stat. Congr. 25-30 August 2013, Hong Kong (Session STS025) 1610–1615. doi:ERR-189
Weber, E.U., Stern, P.C., 2011. Public understanding of climate change in the United States. Am. Psychol. 66, 315–328. doi:10.1037/a0023253
Williams, J., Mackinnon, D.P., 2008. Resampling and Distribution of the Product Methods for Testing Indirect Effects in Complex Models. Struct. Equ. Modeling 15, 23–51. doi:10.1080/10705510701758166
Yamagishi, T., 2001. Trust as a form of social intelligence., in: Cook, K.S. (Ed.), Trust in Society. The Russel Sage Foundation, New York, pp. 121–147.
Yohe, G., Tol, R.S.J., 2002. Indicators for social and economic coping capacity moving toward a working definition of adaptive capacity. Glob. Environ. Chang. 12, 25–40.
44
CHAPTER 3. CAN FARMERS' ADAPTIVE CAPACITIES—CONTEXTUALIZED WITHIN INSTITUTIONAL AND ENVIRONMENTAL CONDITIONS—INFLUENCE
THEIR DECISION TO USE ADAPTIVE MANAGEMENT PRACTICES?
Modified from a paper to be submitted to Global Environmental Change
Maaz Gardezi1 and J. Gordon Arbuckle2
Abstract
In the Upper Midwest, the coupling effects of extreme rain events and
intensive farming pose serious challenges to food security and environmental
sustainability. On a farm level, farmers’ use of adaptive management practice, such
as cover crop is highly effective for improving crop yield and reducing soil erosion
and nutrient loss. The objective of this article is to examine how farmers' adaptive
capacities—contextualized within institutional and environmental conditions—can
influence their decision to use adaptive management practices. We use Generalized
linear mixed models (GLMMs) to examine the relative importance of (a) “internal”
variables – the perceived capacity; (b) “external” or “objective” resources – the
assets and entitlements; and (c) the contextual variables – the institutional and
environmental context in which adaptation occurs, as predictors of adaptive action.
Our results suggest that objective and perceived adaptive capacity can positively
influence farmers' decisions to use cover crops. However, risk management
institutions, such as government subsidies (direct payments) can diminish the
likelihood of farmers using cover crops. This study develops a novel theoretical
1 Author for correspondence, Department of Sociology, Iowa State University 2 Department of Sociology, Iowa State University
45
approach to understanding farmer decision making that examines their objective and
perceived capacities as determinants of pro-environmental action.
Introduction
Global climate change presents one of the most significant challenge to
agriculture and society. Climate change will impact the economic and natural
resource base of Midwestern agriculture, which contributes substantially to both the
national economy and global crop availability (Hatfield et al., 2014). In the Upper
Midwest, projected trend suggests an increase in extreme rainfall events. Such
variation in rainfall can impact farm-level productivity and off-farm environmental
sustainability. On a farm-level, farmers are at the frontline for responding to the
impacts of climate change (McCarl, 2010). Thus, it is critical to examine capacities
that can enable or constrain farmers' ability to cope and adapt to the negative effects
of climate change.
In the environmental change literature, adaptive capacity is a primary social
process for modulation of system resilience—defined as a system’s ability to deal
with shocks and still maintain its overall characteristics, while also retaining capacity
to transform to a more desirable state (Engle and Lemos, 2010; Nelson et al., 2007;
Rockström et al., 2009). Adaptive capacity can be conceived of as composed of
three interrelated parts: a system of resources such as finances and institutions, the
capacity of individuals and communities to access those resources; and, the
contextual factors such as institutional and governance system that influences
whether actors can feasibly access and manage resources (Figure 1) (Brown and
Westaway, 2011).
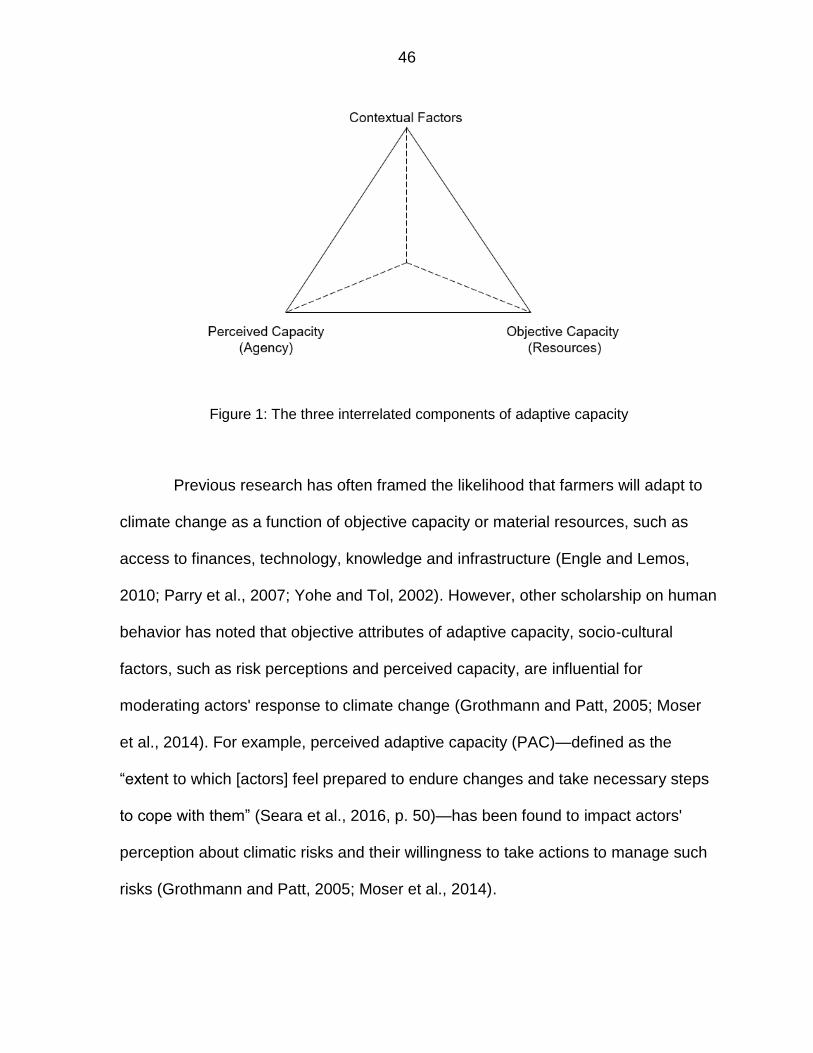
46
Figure 1: The three interrelated components of adaptive capacity
Previous research has often framed the likelihood that farmers will adapt to
climate change as a function of objective capacity or material resources, such as
access to finances, technology, knowledge and infrastructure (Engle and Lemos,
2010; Parry et al., 2007; Yohe and Tol, 2002). However, other scholarship on human
behavior has noted that objective attributes of adaptive capacity, socio-cultural
factors, such as risk perceptions and perceived capacity, are influential for
moderating actors' response to climate change (Grothmann and Patt, 2005; Moser
et al., 2014). For example, perceived adaptive capacity (PAC)—defined as the
“extent to which [actors] feel prepared to endure changes and take necessary steps
to cope with them” (Seara et al., 2016, p. 50)—has been found to impact actors'
perception about climatic risks and their willingness to take actions to manage such
risks (Grothmann and Patt, 2005; Moser et al., 2014).
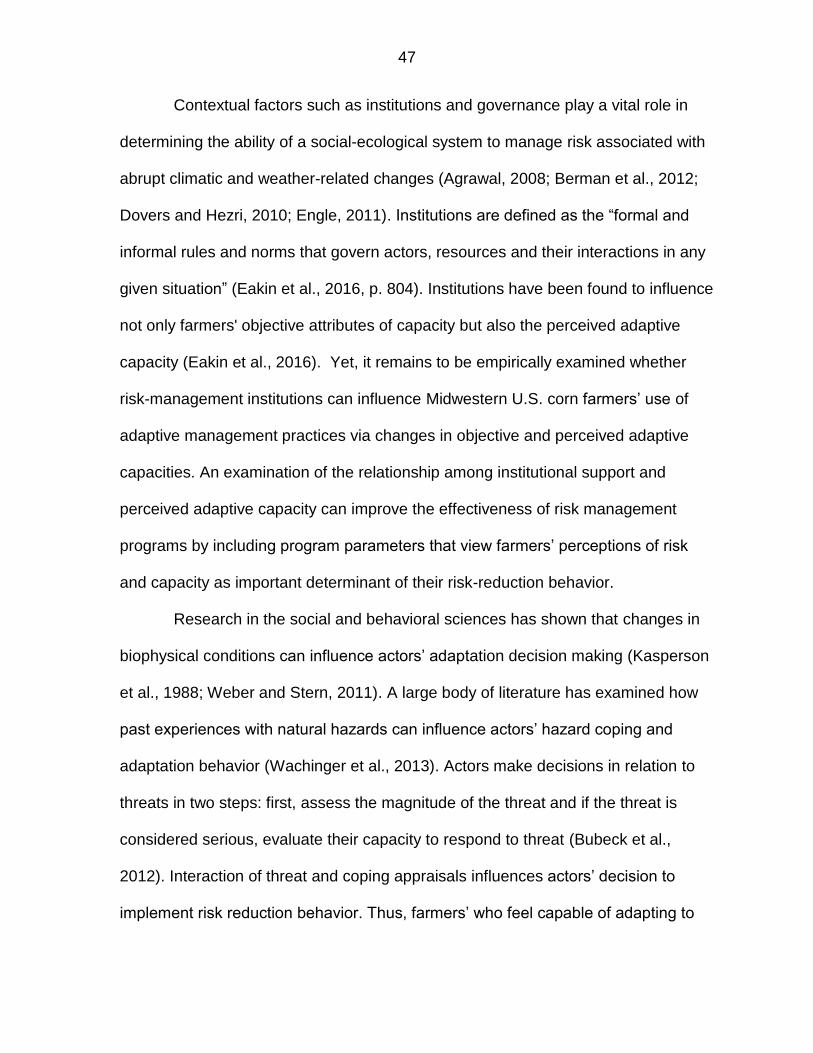
47
Contextual factors such as institutions and governance play a vital role in
determining the ability of a social-ecological system to manage risk associated with
abrupt climatic and weather-related changes (Agrawal, 2008; Berman et al., 2012;
Dovers and Hezri, 2010; Engle, 2011). Institutions are defined as the “formal and
informal rules and norms that govern actors, resources and their interactions in any
given situation” (Eakin et al., 2016, p. 804). Institutions have been found to influence
not only farmers' objective attributes of capacity but also the perceived adaptive
capacity (Eakin et al., 2016). Yet, it remains to be empirically examined whether
risk-management institutions can influence Midwestern U.S. corn farmers’ use of
adaptive management practices via changes in objective and perceived adaptive
capacities. An examination of the relationship among institutional support and
perceived adaptive capacity can improve the effectiveness of risk management
programs by including program parameters that view farmers’ perceptions of risk
and capacity as important determinant of their risk-reduction behavior.
Research in the social and behavioral sciences has shown that changes in
biophysical conditions can influence actors’ adaptation decision making (Kasperson
et al., 1988; Weber and Stern, 2011). A large body of literature has examined how
past experiences with natural hazards can influence actors’ hazard coping and
adaptation behavior (Wachinger et al., 2013). Actors make decisions in relation to
threats in two steps: first, assess the magnitude of the threat and if the threat is
considered serious, evaluate their capacity to respond to threat (Bubeck et al.,
2012). Interaction of threat and coping appraisals influences actors’ decision to
implement risk reduction behavior. Thus, farmers’ who feel capable of adapting to
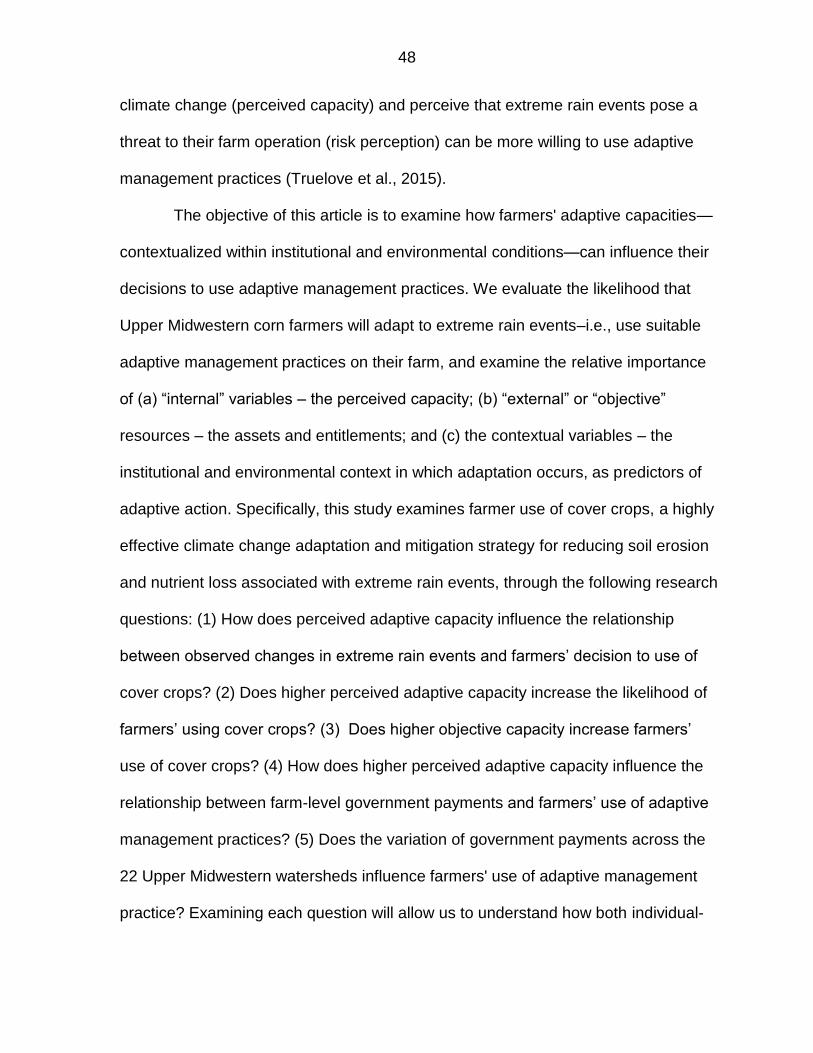
48
climate change (perceived capacity) and perceive that extreme rain events pose a
threat to their farm operation (risk perception) can be more willing to use adaptive
management practices (Truelove et al., 2015).
The objective of this article is to examine how farmers' adaptive capacities—
contextualized within institutional and environmental conditions—can influence their
decisions to use adaptive management practices. We evaluate the likelihood that
Upper Midwestern corn farmers will adapt to extreme rain events–i.e., use suitable
adaptive management practices on their farm, and examine the relative importance
of (a) “internal” variables – the perceived capacity; (b) “external” or “objective”
resources – the assets and entitlements; and (c) the contextual variables – the
institutional and environmental context in which adaptation occurs, as predictors of
adaptive action. Specifically, this study examines farmer use of cover crops, a highly
effective climate change adaptation and mitigation strategy for reducing soil erosion
and nutrient loss associated with extreme rain events, through the following research
questions: (1) How does perceived adaptive capacity influence the relationship
between observed changes in extreme rain events and farmers’ decision to use of
cover crops? (2) Does higher perceived adaptive capacity increase the likelihood of
farmers’ using cover crops? (3) Does higher objective capacity increase farmers’
use of cover crops? (4) How does higher perceived adaptive capacity influence the
relationship between farm-level government payments and farmers’ use of adaptive
management practices? (5) Does the variation of government payments across the
22 Upper Midwestern watersheds influence farmers' use of adaptive management
practice? Examining each question will allow us to understand how both individual-
49
level and contextual factors, such as institutional and environmental conditions, can
influence farm-level support for adaptive management practices.
This paper is organized as follows: We first present a review of the related
literature and discuss the shortcomings from the literature for understanding the role
of adaptive capacity in influencing farmers’ use of adaptive management practices.
Next, we present our study rationale, description of data, and methodological
procedures. We present the results of our analysis. Next, we discuss the main
results from the study and conclude with implications of this research for practice
along with suggestions for future research.
Literature Review
Extreme rain events and farm-level adaptation
Observed and projected changes in climate suggest that Midwestern U.S. will
continue to be exposed to changes in temperature, precipitation, and humidity
(Hatfield et al., 2014; Walthall et al., 2012). Increase in frequency and intensity of
extreme rain events are identified as one of the most prominent biophysical changes
due to climate change. Extreme rains are defined as events with more than four
inches of rain in a 24-hour period (Todey, 2014). These events can pose serious
risks to crop development, crop productivity and ecological sustainability (Walthall et
al., 2012). In this study, we are interested in examining agriculture’s susceptibility
and farmers’ responses to changes in extreme precipitation.
Projected increases in extreme rain events pose a major threat to natural
resource base and agricultural productivity in the Upper Midwestern U.S. (Arritt,
2016; Karl et al., 2009; Todey, 2014). To respond effectively to these climatic
50
changes, it is important for U.S. agriculture systems to modify existing systems to
reduce vulnerabilities and improve resilience. Farm-level adaptation to climate
change can include strategies, such as: (1) changes in farm production practices,
including modifying crop rotations system; (2) using technology, such as drought-
resistant crop varieties, and (3) practicing financial and risk management, such as
utilizing government payments or farm subsidies to reduce financial losses due to
unexpected changes in weather and markets.
At the farm level, adaptive management practices, many of which are also
known as soil and water conservation practices, are important adaptation strategies
that can provide the farm/farmer an opportunity to modulate the risks associated with
extreme rain events. These practices can potentially reduce soil erosion rates and
loss of soil organic carbon and other important nutrients (Reimer et al., 2012). In the
Upper Midwest, three of the primary farm-level adaptive management practices
suitable for dealing with an increase in the frequency of extreme rain events are: (1)
the enhancement of drainage systems (including drainage water management); (2)
the minimization of tillage or disturbances of the soil; and, (3) the use of cover crops
to maintain living ground cover after cash crops have been harvested (Morton et al.,
2015).
For this study, we focus solely on farmers’ use of cover crops as one of the
most effective of many adaptive responses available to them. Cover crops are
“grown primarily for the purpose of protecting and improving soil between periods of
regular crop production.” (Kremen and Miles, 2012) They are perceived as an
essential component of potential climate change adaptation and mitigation strategy

51
(Arbuckle and Roesch-McNally, 2015). They can help farmers adapt to the impacts
of climate change and extreme rain events by (1) preventing soil erosion, (2)
reducing the flow of nutrients, such as nitrate, from farms into streams and lakes, (3)
improving water and nutrient cycling, (4) controlling pest and disease, and (5)
improving field level soil organic carbon, soil structure, and soil carbon retention
(Kaspar et al., 2012; Kremen and Miles, 2012). As a mitigation strategy, some
research suggests that cover crops can reduce greenhouse gas emissions (GHGs)
through improvements in carbon sequestration and reduction in nitrogen use (Lal et
al., 2011). Given these benefits of cover crops, it is important to examine the key
factors that can explain farmers’ decisions regarding using this important adaptive
management practices to cope and adapt to weather/climate-related risks.
Climatic risks and adaptive behavior
Past experiences with natural hazards can influence actors’ hazard coping
and adaptation behavior (Wachinger et al., 2013). Empirical studies have examined
the link between natural hazard-related events and how actors perceive such risks
and found that personal experience with these events can increase or decrease their
intention to change behavior (Lo, 2013). For example, Shao et al. (2014) and
Hamilton and Keim (2009) examined the relationship between uncommon weather
patterns and actors’ perception of climate change. These studies found that those
who experienced increasing summer heat (Shao et al., 2014) and unusual winter
warming (Hamilton and Keim, 2009) also perceived a greater threat from climate
change.
52
Research in the U.S. agriculture sector has also found that spatial and
temporal proximity to natural hazards can be an important driver of farmers’
perceived risk and their willingness to implement appropriate protective measures
(Niles et al., 2013). These studies have examined how changes in weather and
climate, such as drought (van Duinen et al., 2015) and excess water (Morton et al.,
2015) can cause farmers to take necessary steps to reduce risks associated with
these hazards. Farm-level research suggests that farmers who perceive climate
change to be a threat to their farm enterprises are more likely to make adjustments
to anticipate or react to changing conditions that may place the farm enterprise at
risk (Arbuckle et al., 2013a; Morton et al., 2015). Observed changes in weather and
climate, such as changes in frequency and volatility of extreme rain events can
influence farmers’ behavior toward adjusting their farm management practices.
Research in the social and behavioral sciences has shown that there are two
steps of cognitive processes that explain how actors make decisions in relation to
threats (Rogers, 1975). The first step is a risk appraisal, where actors evaluate the
possibility of the threat (Truelove et al., 2015). If the risk is assessed to be high, in
the next stage, actors engage in “coping appraisal”, which is a self-evaluation of their
capacity to respond to threat (Bubeck et al., 2012). Previous studies have found that
it is the interaction of coping and threat evaluations that influences actors’ protection
motivation, and results in their support for behavioral change. For example, Truelove
et al. (2015) found that Sri Lankan paddy farmers who felt capable of using climate-
smart farming practices and perceived these practices to reduce risks related to
climate change, were more likely to engage in adaptive responses, i.e. planting a
53
new seed variety. Thus, farmers’ response to changes in weather and climate are
dependent not only on observed changes in weather patterns, but also on their
perceived capacity to implement appropriate risk-reduction measures.
Adaptive capacity
In the environmental change literature, adaptive capacity represents a key
social, economic, and institutional mechanism for allowing actors to cope, adapt, and
respond to the potentially harmful impacts of climate change (Adger, 2006; Smit et
al., 2001; Turner et al., 2003). A large body of research has identified several types
of material resources as important determinants of adaptive capacity (Moser et al.,
2008; Swanson et al., 2009). For example, greater availability of financial resources
significantly improved Northeastern U.S. dairy farmers’ adaptive capacity and
allowed them to reduce risks associated with changes in weather and climate
(Moser et al., 2008). Similarly, knowledge about production practices that could
make farming more resilient to climate change increased Canadian farmers’ ability to
diminish risks associated with climate change (Swanson et al., 2009). These studies
have shown that at the farm/farmer-level, financial and economic resources can be
important for farmers to cope or adapt to climate change.
In their seminal piece, Grothmann and Patt (2005) argued that existing
research on adaptive capacity had theorized capacity primarily in relation to actors’
ability to acquire material resources, and that this conceptualization was overly
simplistic and limiting. They proposed that while access to material resources, such
as financial and technical resources, are important arbiters of adaptive capacity,
cognitive factors, such as risk perceptions and perceived capacity, may also be

54
crucial for determining actors’ responses to environmental stressors, such as climate
change and variability.
Perceived capacity describes the internal dimension of capacity, i.e., actors’
perceptions of the suitability of available resources including financial, technical, and
institutional support needed for facilitating adaptation (Eakin et al., 2016; Grothmann
and Patt, 2005; Seara et al., 2016). Multiple theories can help explain the role of
perceived capacity in farmers’ climate change adaptation decision making. For
example, the theory of planned behavior (TPB) uses the term “perceived behavioral
control (PBC)” to define perceived capacity, i.e., the extent to which actors perceive
the existence of factors that enable or impede adoption of a pro-environmental
behavior. The theory of planned behavior (TPB) has been used to study the
relationships between actors’ perceived capacity and various environmental
behaviors, such as choosing: public over private transportation (Tikir and Lehmann
2011), conserving water (Trumbo and O’Keefe 2005), and using soil and water
conservation practices such as cover crops (Arbuckle and Roesch-McNally, 2015).
In general, these studies have found that higher perceived capacity can encourage
actors to support and practice pro-environmental behavior. While previous research
has added detailed insights on the relationships between actors’ perceived capacity
and personal action, fewer studies have examined this relationship when decision
making is complex and fraught with uncertainty, such as resulting from abrupt
changes in climate and weather.
Multi-sectoral research on adaptive capacity and resilience in the U.S. (Eakin
et al., 2016) and Australia (Marshall and Marshall, 2007) have examined the role of
55
perceived capacity in relation to actors’ decision making in uncertainty. This
research has highlighted at least five key characteristics of farmers perceived
adaptive capacity, which can promote adaptability through learning and
experimentation. These are perceived efficacy, or the confidence that a farmer has
in their ability to perform certain activities or implement a specific risk mitigation
action; learning and knowledge seeking, the extent to which farmers can use their
agency for learning and seeking new knowledge; decision constraints, the level of
expectations about exogenous constraints; centrality in social networks, how farmers
view themselves in terms of membership in social groups, and adaptive
management, the desire to foster resiliency in social-ecological systems through
learning and experimentation (Eakin et al., 2016; Marshall and Marshall, 2007).
Elements of perceived adaptive capacity can be a useful indicator of actors’ intention
to undertaken pro-environmental behavior. These dimensions can also form an
integral part of actors’ strategy to improving resilience in agriculture (Marshall et al.,
2012; Tschakert and Dietrich, 2010).
Contextual factors: crop insurance and adaptation
Contextual factors such as institutions and governance play a vital role in
determining the ability of a social-ecological system to withstand abrupt climatic and
weather-related changes (Berman et al., 2012; Dovers and Hezri, 2010; Engle,
2011; Ostrom, 2008). Institutions are defined as the “formal and informal rules and
norms that govern actors, resources and their interactions in any given situation
(Eakin et al., 2016, p. 804).” In relation to adaptation in U.S. Midwestern agricultural
systems, institutions can constrain or enable farmers’ adaptive capacity. For
56
example, at the farm-level, economic incentives and availability of markets can
either enable or impede farmers’ ability to shift production practices for achieving
greater resiliency (Blesh and Wolf, 2014). In general, institutions involved in climate
change adaptation (across various sectors) can range in characteristics from risk
management and technological development to risk sharing and information
dissemination (Engle and Lemos, 2010).
The U.S. federal government provides direct institutional support to protect
farmers from volatility in crop production and profitability due to changes in weather
and market prices. The government provides assistance to farmers to manage risk
in two main ways: (1) farm subsidies such as government payments that are paid
directly to farmers and (2) Federal Crop Insurance Program (FCIP) administered by
the Risk Management Agency (RMA) of the United States Department of Agriculture
(USDA). The goals of both government payments and FCIP are (1) to protect
farmers’ income against crop failure and revenue loss and (2) maintain a stable
supply of food, fuel, and fiber in the economy (RMA, 2017). In recent years, the
FCIP program has gained significant popularity, with the total number of insured
acres increasing from 100 million in 1989 to more than 297 million acres in 2015
(RMA, 2017).
Recent research has found at least five ways in which government payments
and crop insurance programs can influence U.S. farmers’ land use management and
response to climate change. First, government payments such as direct payments
have been found to increase commodity specialization, such as an increase in
acreage planted to continuous-corn (Broussard et al., 2012). Thus, direct payments
57
can influence farmers’ land use decisions in relation to cropland diversity, which can
increase or decrease the level of off-farm environmental sustainability (Broussard et
al., 2012). Second, subsidized crop insurance premiums can increase farmers’
expected revenue and thus incentivize faster conversion of grassland to crop
production (Claassen, 2012). Expanding crop production to marginal land can
increase soil erosion and water pollution at a regional-level (Claassen, 2012). Third,
enrollment in crop insurance program has been found to encourage farmers to plant
a less diverse portfolio of crops (Claassen et al., 2001, 2016; Claassen, 2012). For
example, in a recent study of U.S. Corn Belt farmers, Claassen et al. 2001 found
that higher utilization of crop insurance indemnities led to almost 4% increase in
acreage planted to continuous corn, thereby reducing crop diversity. Fourth, and in
relation to climate change adaptation, Annan and Schlenker 2015 found that
participation in the federal crop insurance program reduced U.S. farmers’
engagement in farm-level adaptation to extreme heat events. They posit that crop
insurance creates a moral hazard or a “disincentive to reduce the damaging effects
[of extreme heat events] (Annan and Schlenker, 2015, p. 265).” Similarly, Hertel and
Lobell 2014 argue that crop insurance can significantly delay farmers’ decision
regarding investing in irrigation infrastructure to supplement for water supply during
periods of water scarcity. Thus, institutional support from the government, such as
government payments and crop insurance can influence farmers’ attitudes toward
land use management, which in turn impact the economic and environmental
impacts associated with crop production.
58
In relation to adaptation in agricultural systems, risk management institutions
can either enable or impede farmers’ ability to shift production practices for
achieving greater resiliency (Blesh and Wolf, 2014). Institutions have been found to
influence not only farmers' objective attributes of capacity but also the perceived
adaptive capacity, i.e. by influencing their risk perceptions (Eakin et al., 2016);
intentions to change behavior (Grothmann and Patt, 2005), and their self-evaluation
of capacity to adapt (Eakin et al., 2016). However, more empirical research is
needed to examine how risk management institutions can encourage farmers’ use of
adaptive management practices—especially those concerning soil and water
conservation—through changes in their perceived dimensions of adaptive
capacities.
Based on the reviewed literature, farmers’ adaptive response, i.e., their use
of adaptive management practices, should be examined in relation to (a) “internal”
variables—the perceived capacity; (b) “external” or “objective” capacity—the assets;
and (c) the contextual variable—the institutional and environmental context in which
adaptation occurs. Most studies on farmers’ adaptation to climate change have
exclusively focused on their objective attributes of adaptive capacity while ignoring
the importance of perceived adaptive capacity in influencing their adaptive
responses to climate change. We address this deficit by exploring the influence of
environmental risks, objective and perceived adaptive capacity, and institutional
conditions on farmers’ adaptive response to extreme rain events.
59
Methods
Conceptual framework
In the previous sections, we reviewed the interaction among the themes of
biophysical conditions such as climate; the human conditions including perceived
adaptive capacity, and institutional conditions, such as farm subsidies. First, we
reviewed how risks associated with extreme rain events can be consequential to
crop productivity and environmental sustainability. We found that observed changes
in climate and weather can influence farmers’ adaptive responses to climate change.
For example, farmers who perceived climate change to be a threat to their farm
enterprises and felt capable of respond to it were more likely to adjust to changing
conditions that may place the farm enterprise at risk.
Next, we reviewed the concept of adaptive capacity. We introduced two
important attributes of adaptive capacity—objective and perceived adaptive capacity.
It was established that farmers’ perceived adaptive capacity can influence their
willingness to take actions to ignore, cope, or adapt to risks. Specifically, previous
research had found positive relationship between perceived capacity and actors’
willingness to engage with risk-reduction behavior.
We also examined how farmers’ objective and perceived adaptive capacities
are contextualized within an institutional context that can either enable or impede
their response to climate change and variability. A review of the literature
established that availability of government payments and enrollment in crop
insurance programs can encourage U.S. farmers to (1) convert more grassland to
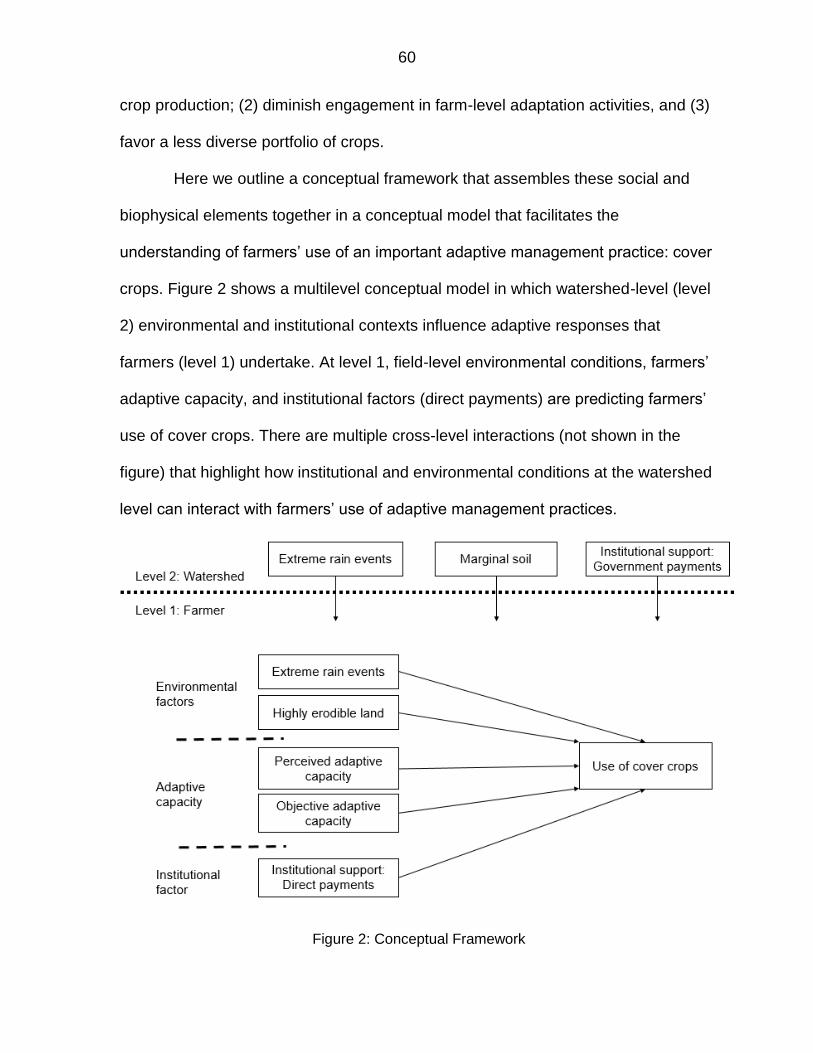
60
crop production; (2) diminish engagement in farm-level adaptation activities, and (3)
favor a less diverse portfolio of crops.
Here we outline a conceptual framework that assembles these social and
biophysical elements together in a conceptual model that facilitates the
understanding of farmers’ use of an important adaptive management practice: cover
crops. Figure 2 shows a multilevel conceptual model in which watershed-level (level
2) environmental and institutional contexts influence adaptive responses that
farmers (level 1) undertake. At level 1, field-level environmental conditions, farmers’
adaptive capacity, and institutional factors (direct payments) are predicting farmers’
use of cover crops. There are multiple cross-level interactions (not shown in the
figure) that highlight how institutional and environmental conditions at the watershed
level can interact with farmers’ use of adaptive management practices.
Figure 2: Conceptual Framework
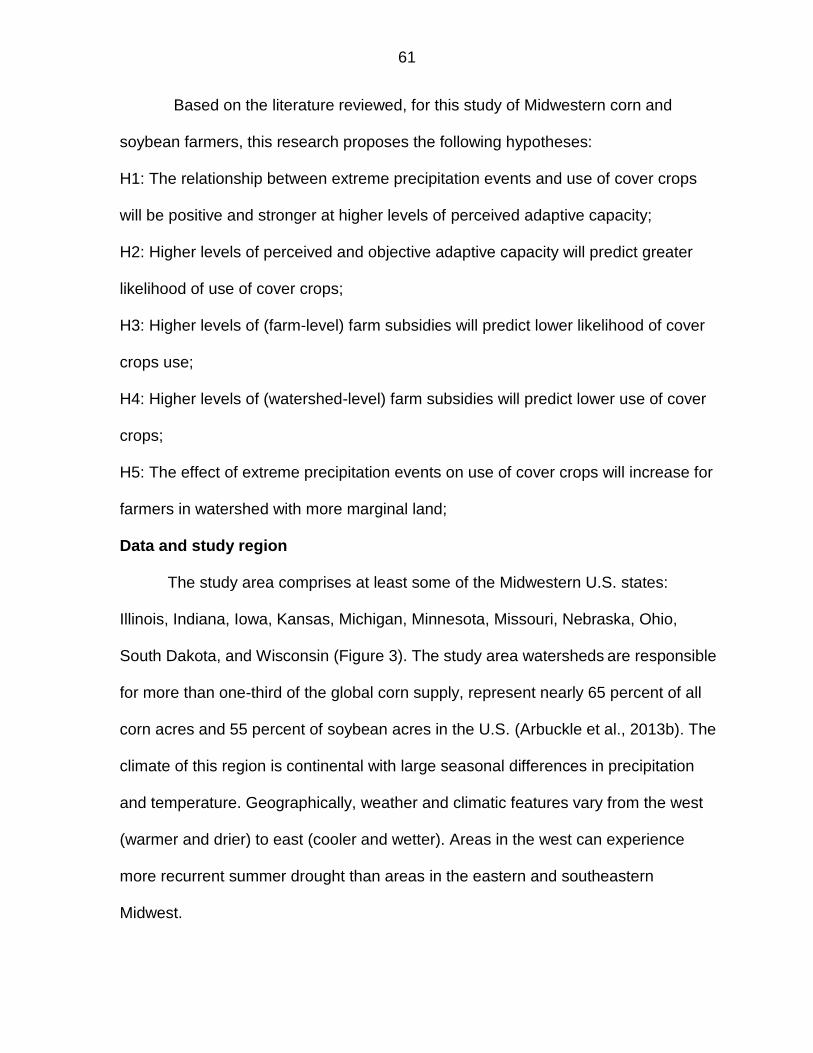
61
Based on the literature reviewed, for this study of Midwestern corn and
soybean farmers, this research proposes the following hypotheses:
H1: The relationship between extreme precipitation events and use of cover crops
will be positive and stronger at higher levels of perceived adaptive capacity;
H2: Higher levels of perceived and objective adaptive capacity will predict greater
likelihood of use of cover crops;
H3: Higher levels of (farm-level) farm subsidies will predict lower likelihood of cover
crops use;
H4: Higher levels of (watershed-level) farm subsidies will predict lower use of cover
crops;
H5: The effect of extreme precipitation events on use of cover crops will increase for
farmers in watershed with more marginal land;
Data and study region
The study area comprises at least some of the Midwestern U.S. states:
Illinois, Indiana, Iowa, Kansas, Michigan, Minnesota, Missouri, Nebraska, Ohio,
South Dakota, and Wisconsin (Figure 3). The study area watersheds are responsible
for more than one-third of the global corn supply, represent nearly 65 percent of all
corn acres and 55 percent of soybean acres in the U.S. (Arbuckle et al., 2013b). The
climate of this region is continental with large seasonal differences in precipitation
and temperature. Geographically, weather and climatic features vary from the west
(warmer and drier) to east (cooler and wetter). Areas in the west can experience
more recurrent summer drought than areas in the eastern and southeastern
Midwest.

62
Primary data used in this study is from a February 2012 survey of corn and
soybean farmers in 11 Midwestern states (Figure 3). The survey was mailed to a
stratified random sample of farmers in a contiguous set of 22 watersheds (Arbuckle
et al., 2013b). The USDA National Agricultural Statistics Service (NASS) Census of
Agriculture’s master list, which is the most comprehensive and up-to-date list of US
farmers was the sampling frame. Only farmers who grew at least 80 acres of corn
and grossed farm sales value more than $100,000 per year were included in the
mailing list. The survey was mailed by NASS to 18,707 eligible farmers. Completed
surveys were received from 4,778 farmers for an effective response rate of 26%.
Non-response bias checks compared respondent demographics to U.S. Census of
Agriculture data, and no meaningful differences between respondents and non-
respondents were observed (Arbuckle et al., 2013b). To maintain the privacy of
respondents, the farm-level geospatial coordinates were not stored in the database.
However, zip codes and county FIPS were used to identify farmers’ location in each
watershed.
Our study proposes two levels of analysis so that farmers (level 1) are
nested in watersheds (level 2). The Hydrological Unit Code 6 (HUC6) watersheds
are selected as the higher-order unit (level 2) for several reasons: (1) farming
systems are influenced by environmental conditions that can vary by hydrological
unit; (2) the effects of climate change in the Upper Midwest are projected to be
predominantly water-related; (3) we are interested in examining how changes in
extreme precipitation (climatic) and soil conditions (environment) can influence
farmers’ use of adaptive management practices. Biophysical conditions associated
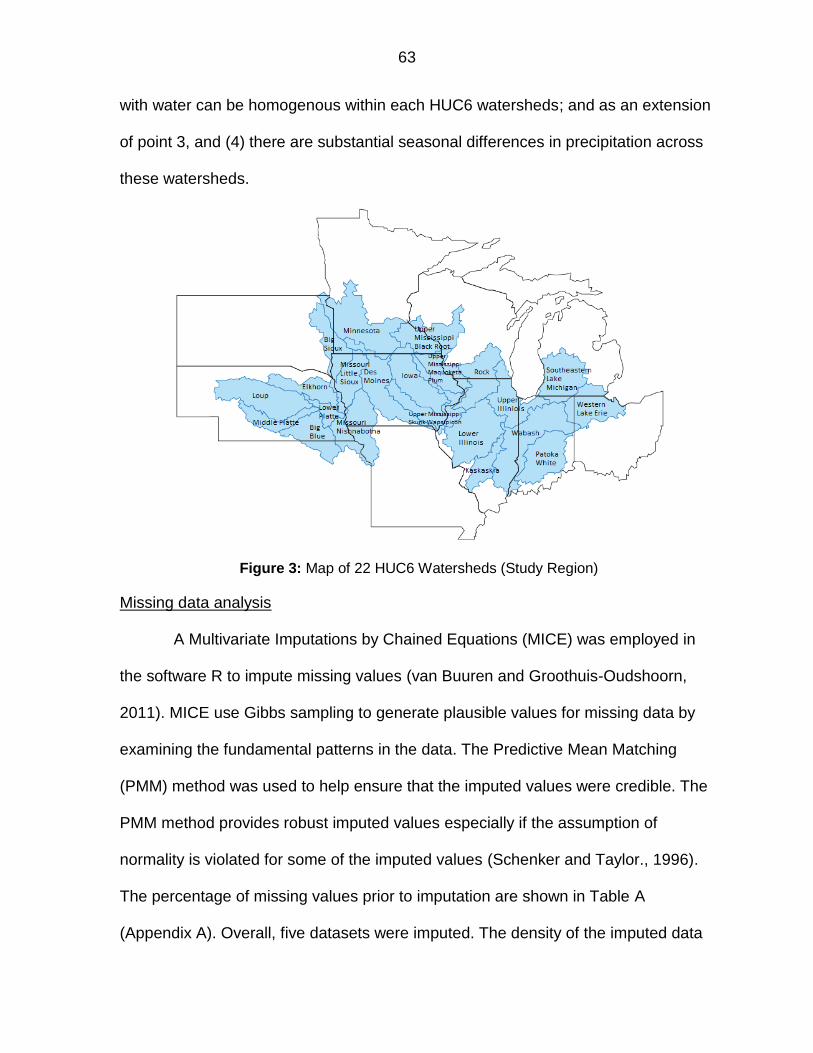
63
with water can be homogenous within each HUC6 watersheds; and as an extension
of point 3, and (4) there are substantial seasonal differences in precipitation across
these watersheds.
Figure 3: Map of 22 HUC6 Watersheds (Study Region)
Missing data analysis
A Multivariate Imputations by Chained Equations (MICE) was employed in
the software R to impute missing values (van Buuren and Groothuis-Oudshoorn,
2011). MICE use Gibbs sampling to generate plausible values for missing data by
examining the fundamental patterns in the data. The Predictive Mean Matching
(PMM) method was used to help ensure that the imputed values were credible. The
PMM method provides robust imputed values especially if the assumption of
normality is violated for some of the imputed values (Schenker and Taylor., 1996).
The percentage of missing values prior to imputation are shown in Table A
(Appendix A). Overall, five datasets were imputed. The density of the imputed data
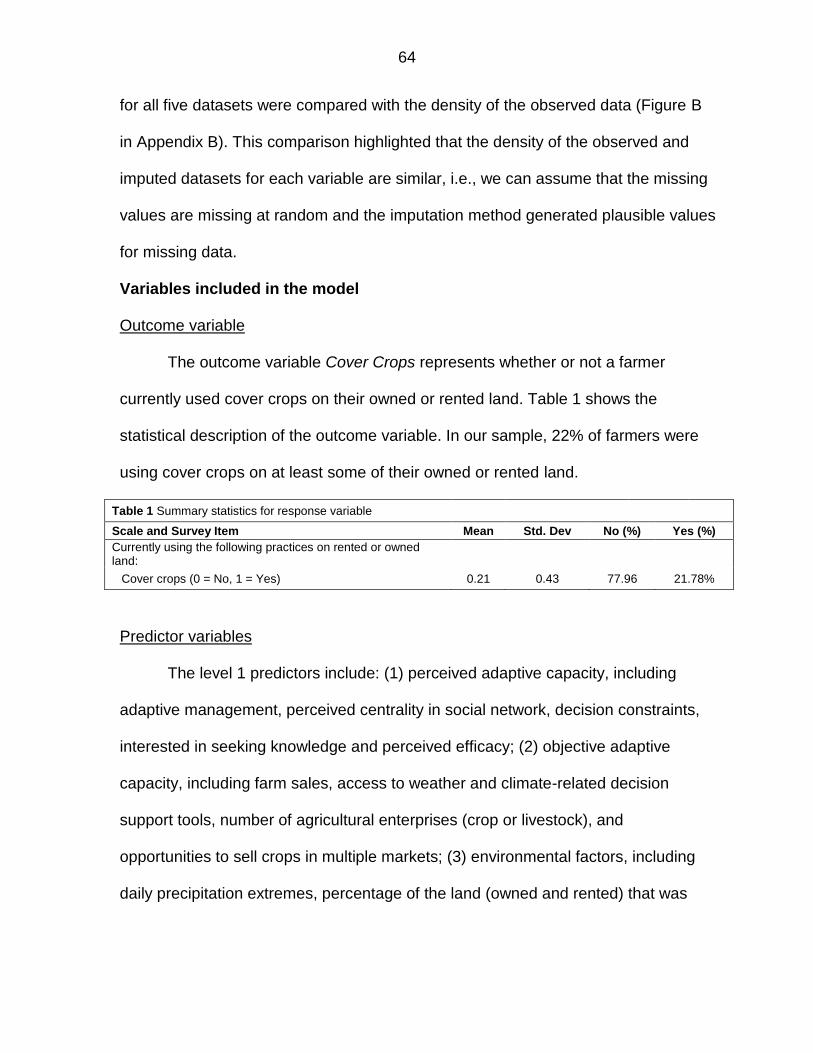
64
for all five datasets were compared with the density of the observed data (Figure B
in Appendix B). This comparison highlighted that the density of the observed and
imputed datasets for each variable are similar, i.e., we can assume that the missing
values are missing at random and the imputation method generated plausible values
for missing data.
Variables included in the model
Outcome variable
The outcome variable Cover Crops represents whether or not a farmer
currently used cover crops on their owned or rented land. Table 1 shows the
statistical description of the outcome variable. In our sample, 22% of farmers were
using cover crops on at least some of their owned or rented land.
Table 1 Summary statistics for response variable
Scale and Survey Item Mean Std. Dev No (%) Yes (%)
Currently using the following practices on rented or owned land:
Cover crops (0 = No, 1 = Yes) 0.21 0.43 77.96 21.78%
Predictor variables
The level 1 predictors include: (1) perceived adaptive capacity, including
adaptive management, perceived centrality in social network, decision constraints,
interested in seeking knowledge and perceived efficacy; (2) objective adaptive
capacity, including farm sales, access to weather and climate-related decision
support tools, number of agricultural enterprises (crop or livestock), and
opportunities to sell crops in multiple markets; (3) environmental factors, including
daily precipitation extremes, percentage of the land (owned and rented) that was

65
Highly Erodible (HEL) and planted to crops, and (4) institutional factors, including
farm subsidies (direct payments).
Level 2 predictors include: (1) an environmental factor, including percent of
marginal lands by watershed; (2) an institutional factor, government payments
(excluding conservation and wetland reserve program payments) for each
watershed, and (3) group means of level 1 variables. Reintroducing the group
means at level 2 allow us to separately investigate the between-watershed and
within-watershed effects of the predictors on the outcome variable.
Level 1 variables: Perceived adaptive capacity (PAC) consist of five
subcategories, each constructed using an Exploratory Factor Analysis (EFA)
technique. EFA is a commonly used statistical technique in the social sciences that
can condense information from multiple items (survey, census etc.) into meaningful
latent variables. EFA was applied to measure key concepts that can explain the
various dimensions of perceived adaptive capacity, including Adaptive Management,
Perceived Centrality in Social Network, Decision Constraints, Interested in Seeking
Knowledge and Perceived Efficacy. Four survey items measured Adaptive
Management (Table 2). These variables measured farmers’ resolve to learn and
experiment with adaptive management practices, which might affect the overall
resilience of their farm. Three survey items measured farmers’ views about their
influence and membership in social groups. These items were grouped together to
create a construct, Perceived Centrality in Social Network (Table 2). The Decision
Constraints construct was developed using four survey questions, which included
statements about farmers’ perceptions about the institutional environment, such as
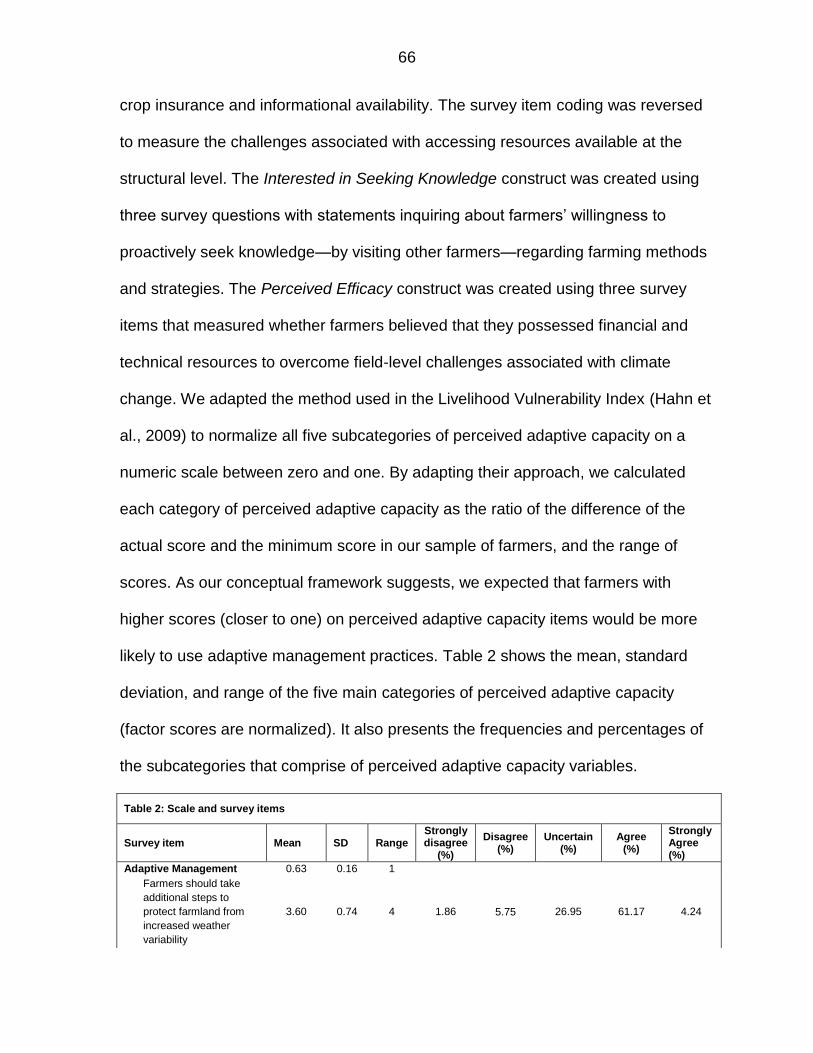
66
crop insurance and informational availability. The survey item coding was reversed
to measure the challenges associated with accessing resources available at the
structural level. The Interested in Seeking Knowledge construct was created using
three survey questions with statements inquiring about farmers’ willingness to
proactively seek knowledge—by visiting other farmers—regarding farming methods
and strategies. The Perceived Efficacy construct was created using three survey
items that measured whether farmers believed that they possessed financial and
technical resources to overcome field-level challenges associated with climate
change. We adapted the method used in the Livelihood Vulnerability Index (Hahn et
al., 2009) to normalize all five subcategories of perceived adaptive capacity on a
numeric scale between zero and one. By adapting their approach, we calculated
each category of perceived adaptive capacity as the ratio of the difference of the
actual score and the minimum score in our sample of farmers, and the range of
scores. As our conceptual framework suggests, we expected that farmers with
higher scores (closer to one) on perceived adaptive capacity items would be more
likely to use adaptive management practices. Table 2 shows the mean, standard
deviation, and range of the five main categories of perceived adaptive capacity
(factor scores are normalized). It also presents the frequencies and percentages of
the subcategories that comprise of perceived adaptive capacity variables.
Table 2: Scale and survey items
Survey item Mean SD Range Strongly disagree
(%)
Disagree (%)
Uncertain (%)
Agree (%)
Strongly Agree (%)
Adaptive Management 0.63 0.16 1
Farmers should take
additional steps to
protect farmland from
increased weather
variability
3.60 0.74 4 1.86 5.75 26.95 61.17 4.24
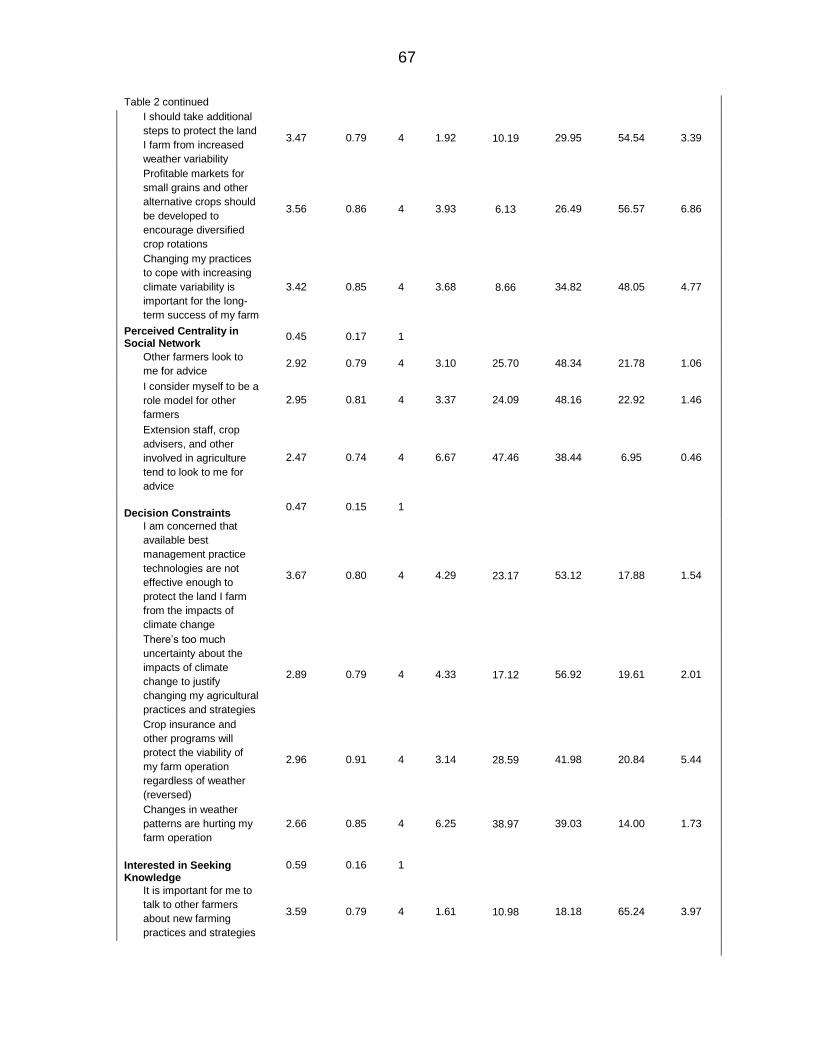
67
Table 2 continued
I should take additional
steps to protect the land
I farm from increased
weather variability
3.47 0.79 4 1.92 10.19 29.95 54.54 3.39
Profitable markets for
small grains and other
alternative crops should
be developed to
encourage diversified
crop rotations
3.56 0.86 4 3.93 6.13 26.49 56.57 6.86
Changing my practices
to cope with increasing
climate variability is
important for the long-
term success of my farm
3.42 0.85 4 3.68 8.66 34.82 48.05 4.77
Perceived Centrality in Social Network
0.45 0.17 1
Other farmers look to
me for advice 2.92 0.79 4 3.10 25.70 48.34 21.78 1.06
I consider myself to be a
role model for other
farmers
2.95 0.81 4 3.37 24.09 48.16 22.92 1.46
Extension staff, crop
advisers, and other
involved in agriculture
tend to look to me for
advice
2.47 0.74 4 6.67 47.46 38.44 6.95 0.46
Decision Constraints 0.47 0.15 1
I am concerned that
available best
management practice
technologies are not
effective enough to
protect the land I farm
from the impacts of
climate change
3.67 0.80 4 4.29 23.17 53.12 17.88 1.54
There’s too much
uncertainty about the
impacts of climate
change to justify
changing my agricultural
practices and strategies
2.89 0.79 4 4.33 17.12 56.92 19.61 2.01
Crop insurance and
other programs will
protect the viability of
my farm operation
regardless of weather
(reversed)
2.96 0.91 4 3.14 28.59 41.98 20.84 5.44
Changes in weather
patterns are hurting my
farm operation
2.66 0.85 4 6.25 38.97 39.03 14.00 1.73
Interested in Seeking Knowledge
0.59 0.16 1
It is important for me to
talk to other farmers
about new farming
practices and strategies
3.59 0.79 4 1.61 10.98 18.18 65.24 3.97
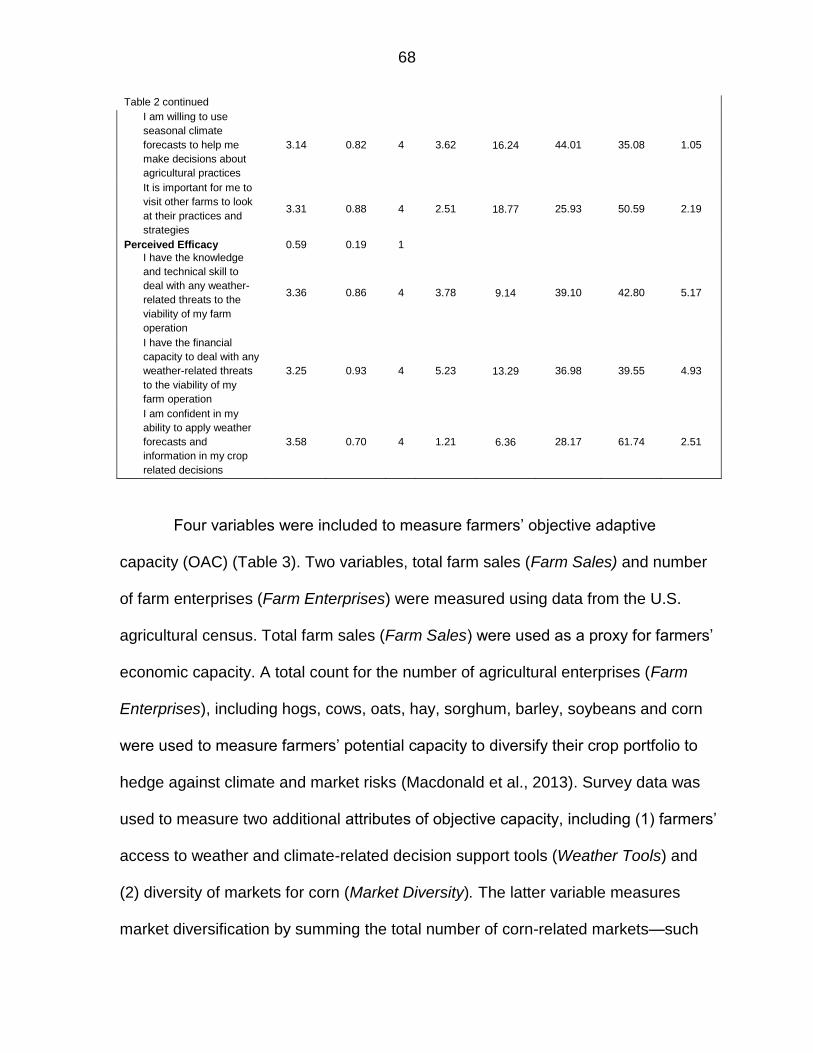
68
Table 2 continued
I am willing to use
seasonal climate
forecasts to help me
make decisions about
agricultural practices
3.14 0.82 4 3.62 16.24 44.01 35.08 1.05
It is important for me to
visit other farms to look
at their practices and
strategies
3.31 0.88 4 2.51 18.77 25.93 50.59 2.19
Perceived Efficacy 0.59 0.19 1
I have the knowledge
and technical skill to
deal with any weather-
related threats to the
viability of my farm
operation
3.36 0.86 4 3.78 9.14 39.10 42.80 5.17
I have the financial
capacity to deal with any
weather-related threats
to the viability of my
farm operation
3.25 0.93 4 5.23 13.29 36.98 39.55 4.93
I am confident in my
ability to apply weather
forecasts and
information in my crop
related decisions
3.58 0.70 4 1.21 6.36 28.17 61.74 2.51
Four variables were included to measure farmers’ objective adaptive
capacity (OAC) (Table 3). Two variables, total farm sales (Farm Sales) and number
of farm enterprises (Farm Enterprises) were measured using data from the U.S.
agricultural census. Total farm sales (Farm Sales) were used as a proxy for farmers’
economic capacity. A total count for the number of agricultural enterprises (Farm
Enterprises), including hogs, cows, oats, hay, sorghum, barley, soybeans and corn
were used to measure farmers’ potential capacity to diversify their crop portfolio to
hedge against climate and market risks (Macdonald et al., 2013). Survey data was
used to measure two additional attributes of objective capacity, including (1) farmers’
access to weather and climate-related decision support tools (Weather Tools) and
(2) diversity of markets for corn (Market Diversity). The latter variable measures
market diversification by summing the total number of corn-related markets—such
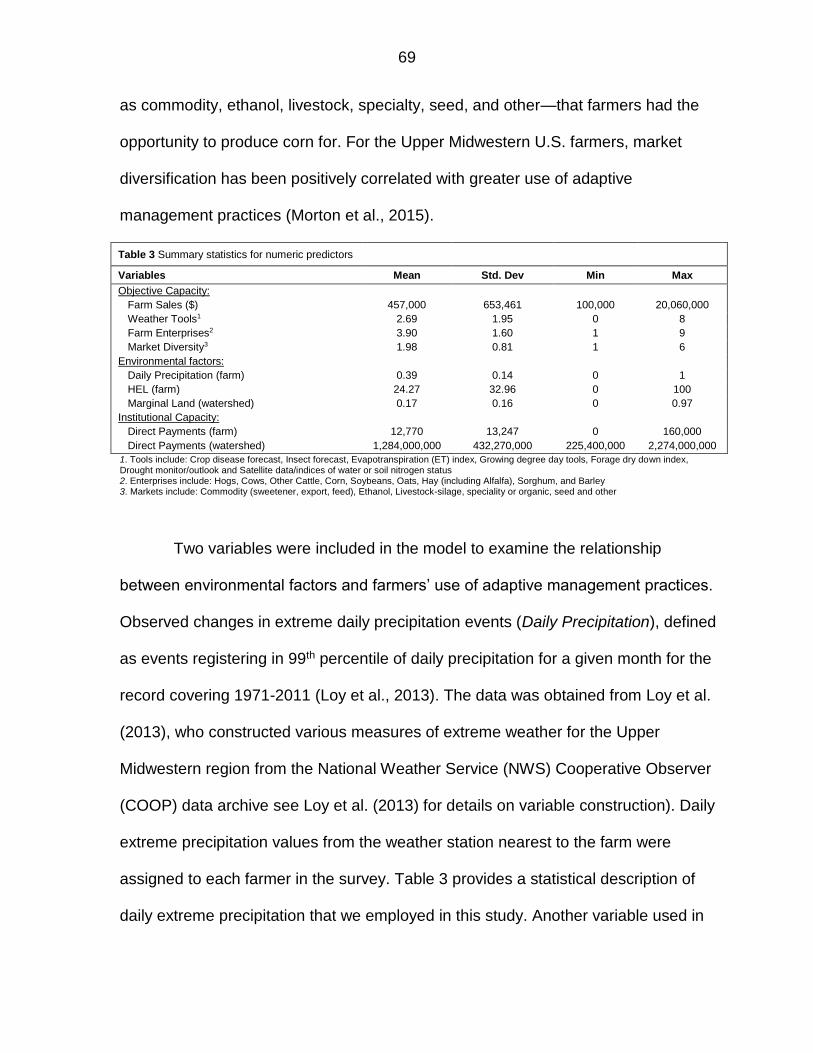
69
as commodity, ethanol, livestock, specialty, seed, and other—that farmers had the
opportunity to produce corn for. For the Upper Midwestern U.S. farmers, market
diversification has been positively correlated with greater use of adaptive
management practices (Morton et al., 2015).
Table 3 Summary statistics for numeric predictors
Variables Mean Std. Dev Min Max
Objective Capacity:
Farm Sales ($) 457,000 653,461 100,000 20,060,000
Weather Tools1 2.69 1.95 0 8
Farm Enterprises2 3.90 1.60 1 9
Market Diversity3 1.98 0.81 1 6
Environmental factors:
Daily Precipitation (farm) 0.39 0.14 0 1
HEL (farm) 24.27 32.96 0 100
Marginal Land (watershed) 0.17 0.16 0 0.97
Institutional Capacity:
Direct Payments (farm) 12,770 13,247 0 160,000
Direct Payments (watershed) 1,284,000,000 432,270,000 225,400,000 2,274,000,000
1. Tools include: Crop disease forecast, Insect forecast, Evapotranspiration (ET) index, Growing degree day tools, Forage dry down index, Drought monitor/outlook and Satellite data/indices of water or soil nitrogen status 2. Enterprises include: Hogs, Cows, Other Cattle, Corn, Soybeans, Oats, Hay (including Alfalfa), Sorghum, and Barley 3. Markets include: Commodity (sweetener, export, feed), Ethanol, Livestock-silage, speciality or organic, seed and other
Two variables were included in the model to examine the relationship
between environmental factors and farmers’ use of adaptive management practices.
Observed changes in extreme daily precipitation events (Daily Precipitation), defined
as events registering in 99th percentile of daily precipitation for a given month for the
record covering 1971-2011 (Loy et al., 2013). The data was obtained from Loy et al.
(2013), who constructed various measures of extreme weather for the Upper
Midwestern region from the National Weather Service (NWS) Cooperative Observer
(COOP) data archive see Loy et al. (2013) for details on variable construction). Daily
extreme precipitation values from the weather station nearest to the farm were
assigned to each farmer in the survey. Table 3 provides a statistical description of
daily extreme precipitation that we employed in this study. Another variable used in
70
this study to measure the environmental factors was the percentage of farmers’ land
planted to crops in 2011 was highly erodible land (HEL). HEL is any land with high
erosion properties. Farmers’ who produce crops on land identified as highly erodible
are required to develop and implement a conservation plan (Conservation
Compliance) that can reduce the propensity of soil erosion (Arbuckle, 2013).
One farm-level variable, farm direct payments (Direct Payments), was used
to measure the institutional or structural dimension of farmers’ adaptive capacity.
Farm direct payments was one of many farm subsidy programs available to farmers
to reduce the yearly variation in agricultural production and farm profitability
(Environmental Working Group, 2017). This government payment scheme was
discontinued in 2014 (except for cotton producers) but was available to farmers in
2012 when the data for this study was collected. Direct payments were paid out to
farmers each year based on the historic production of their land (base year is 1986).
We chose direct payments as the measure of farmers’ institutional support because
it provided farmers with additional income even during years when there was no loss
in crop yield or farm revenue.
Level 2 variables: Our study proposes two levels of analysis so that farmers
(level 1) are nested in 22 watersheds (level 2). For each watershed, we calculated
an environmental variable, including soil conditions (Marginal Land) and a variable
measuring institutional capacity: government payments (Government Payments).
The data for the variable, marginal land, was obtained from Loy et al. (2013), who
calculated the percent of non-irrigated marginal lands (by county) using the Soil
Survey Geographic (SSURGO) database. The characteristics of soil were grouped
71
according to the USDA Natural Resources Conservation Service (NRCS) land
capability classification system see Loy et al. (2013) for a detailed account of
variable construction). The percentage of land designated as marginal land in each
county were aggregated to the watershed level.
The data for Government Payments was obtained from 2012 Census of
Agriculture’s data browser. Government payments category in the Agriculture
Census consist of all federal farm programs which make payments directly to the
farm operators. Thus, it provides a holistic view of institutional support available at
the watershed level. Government payments comprise of farm subsidy programs
such as direct payments, loan deficiency payments, disaster payments, as well as
conservation programs such as the Conservation Reserve Program (CRP) and
Wetland Reserve Program (WRP). We excluded CRP and WRP from the
government payments to make them comparable to our level 1 variable for
institutional support (direct payments). The total of government payments for each
county was computed and aggregated for all 22 watersheds. We used the county
FIPS and HUC6 codes to merge the farmer-level data with level-2 variables.
Merging data at multiple levels can pose statistical complications, such as the error
terms of farmers’ responses nested within the same watershed are no longer
independent of one another. A multilevel model was a suitable approach to model
such hierarchical data structure and fulfill the basic assumptions of regression
analysis.
72
Regression analysis
Generalized linear mixed models (GLMMs) combine two commonly used
statistical frameworks in social and natural science research: (1) linear mixed effects
modeling for examining random effects and (2) dealing with dichotomous outcome
variables using exponential family of distributions (Bolker et al., 2009). Several
GLMMs were constructed to investigate the relationship between environmental
factors, adaptive capacity, institutional factors and farmers’ use of cover crops. We
constructed three models each with farmers at the first level and HUC6 watersheds
at the second level. All models tested for random intercepts between watersheds.
Random slopes were not included because there was little variance remaining in the
final model. Model 1 is the null model with only a varying intercept across all
watersheds. Model 2 and include all predictors, and Model 3 adds the interaction
terms.
The outcome variable, use of cover crops in watershed, is a proportion—the
number of farmers who either use or do not use cover crops. We use a logit function
(logit(x)=ln[x/(1-x)] as the link function. The observed proportion of farmers using
cover crops 𝑖 in a watershed 𝑗 is given by 𝑃𝑖𝑗.

73
The 𝑙𝑜𝑔𝑖𝑡(𝑃𝑖𝑗) has an approximate normal distribution and we use a linear
regression equation at the farmer level to specify a simplistic model with one
intercept and one farmer-level explanatory variable:
𝑙𝑜𝑔𝑖𝑡(𝑃𝑖𝑗) = 𝐵0𝑗 + 𝐵1𝑋𝑖𝑗 Equation 1
Equation 1 shows that the intercept is assumed to vary across watersheds
and the coefficient for the slope is fixed. This variation in intercept is modeled by the
watershed-level variable 𝑍𝑗 as follows:
𝐵0𝑗 = 𝛾00 + 𝛾01𝑍𝑗 + 𝑢0𝑗 Equation 2
𝐵1𝑗 = 𝛾10 + 𝑢1𝑗 Equation 3
We could substitute Equation 2 and 3 into 1, and re-write it as a single-
equation:
𝑙𝑜𝑔𝑖𝑡(𝑃𝑖𝑗) = 𝛾00 + 𝛾10𝑋𝑖𝑗 + 𝛾01𝑍𝑗 + 𝑢0𝑗 + 𝑢1𝑗 + 𝛾10𝑋𝑖𝑗 Equation 4
For GLMMs it can be difficult to find ML estimates without integrating the
likelihoods for all random effects-a process that can be computationally expensive
(Bolker et al., 2009). Therefore, we computed the Maximum Likelihood (ML)
estimates of equation 4 by using a Gauss-Hermite quadrature (GHQ) approximation
approach. We choose a GHQ approach because it balances the need for
computational speed and accuracy. For example, GHQ approach is also more
accurate than Laplace approximation. A Bayesian framework using Markov Chain
Monte Carlo (MCMC) technique could have been advantageous if there were at
least three or more random factors to be estimated in our models (our GLMMs only
have one random effect) (Bolker et al., 2009).

74
Testing the ex-ante assumptions of GLMMs
Prior to fitting the GLMMs, we examined the predictor variables for
multicollinearity. A correlation matrix shown in Appendix C suggests that the highest
correlation found among the predictors was 0.45. Thus, multicollinearity is not a
matter of concern in our study (we also tested multicollinearity using a variance
inflation factor (VIF) and found similar results). All level 1 variables were centered-
within-context (CWC) and standardized. CWC includes rescaling variables by
subtracting the group (watershed) mean. These group means were then
reintroduced at level 2.
We also specified the covariance structure, i.e. described the form of the
variance-covariance matrix for our GLMMs. We used an unstructured covariance
structure so that covariances are assumed to be random (Field, 2013). We
examined the distribution of predictor variables at each level of our binary outcome
variable (Appendix A). The distributions seem normal and symmetric, except for
farm sales and direct payments, which had skewed distributions. These variables
were transformed (logarithmic).
The intra-class correlation coefficient (ICC) or ρ measures the proportion of
variance explained by the higher-order unit, in this case the 22 watersheds. The
ICC can be measured by various methods (Snijders and Bosker, 1999). We used
the commonly used formula:
𝜌 = 𝜏11
𝜏11+ 𝜎2 Equation 5
𝜏11 is the amount of variance attributed to watershed differences or variance
between groups. The σ2 is attributed to the farmer-level variation. It explains the
75
within watershed variation. The computed value of 𝜌 is 0.24 so 24 percent of the
variance in farmers’ use of cover crops can be attributed to watershed level
conditions, which suggests that a GLMM is an appropriate method for assessing the
hierarchical structure of the data. We used a parametric bootstrap approach to
create standardized residuals of the fitted models. Transformed residuals are then
tested for fulfilling the ex-post assumptions of GLMMs.
Results
Table 4 presents results of three GLMMs predicting farmers’ use of cover
crops. Model 1 is the null model that uses random intercepts for watersheds; Model
2 includes random intercepts and predictors representing environmental factors,
adaptive capacity, and institutional factors. Model 3 includes random intercepts,
predictors, and adds three interaction terms. The fixed effects are presented as odds
ratios with standard errors in the parenthesis. The random effects are presented as
variance between watersheds 𝜏11 and ICC. We did not include random slopes
between the watersheds since there was little variance remaining to be explained in
the final model.
We will be interpreting the results of Model 2 as it has the lowest log
likelihood value, AIC, and DIC among all three models. To confirm our results, we
used a Likelihood Ratio Test (Chi-square test) to examine whether Model 2 fitted
better than other models and confirmed that Model 2 fits better than Model 3 (the
value of Chi-square is weakly significant for Model 3). We also calculated the Tjur’s
Coefficient of Discrimination or Tjur’s D (Tjur, 2009). This is an alternative approach
to other Pseudo-R-squared values such as Nakelkerke’s R2 or Cox-Snell R2 when
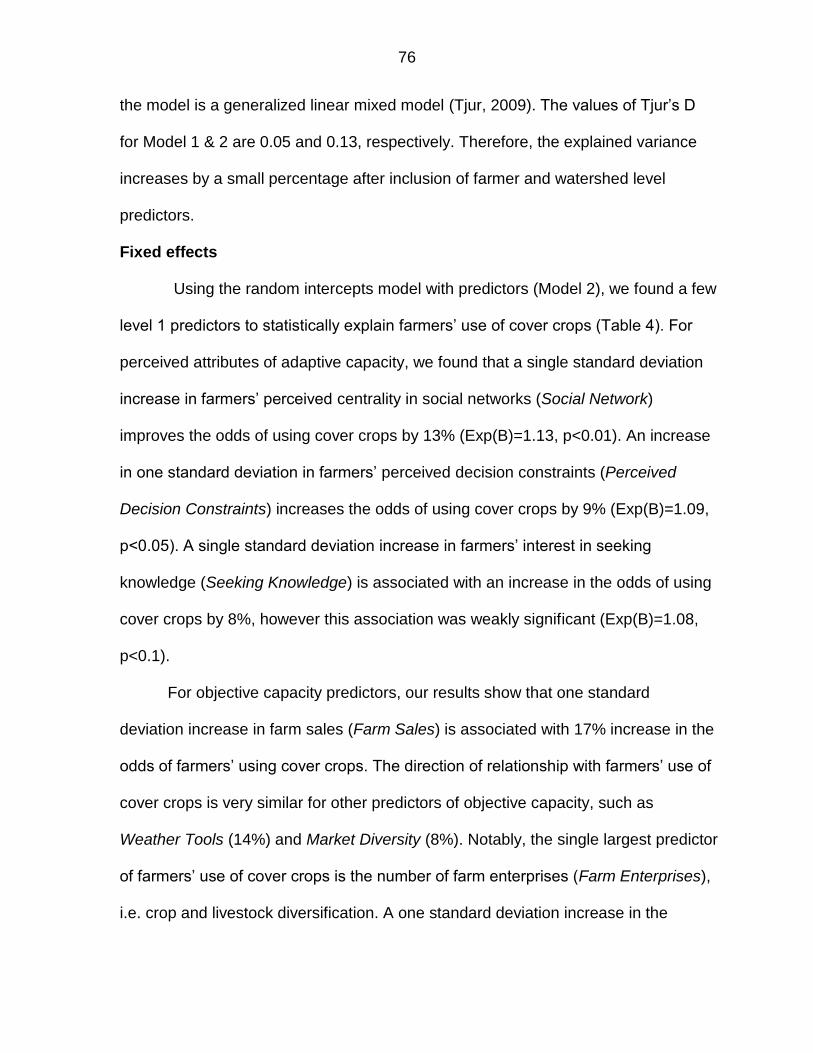
76
the model is a generalized linear mixed model (Tjur, 2009). The values of Tjur’s D
for Model 1 & 2 are 0.05 and 0.13, respectively. Therefore, the explained variance
increases by a small percentage after inclusion of farmer and watershed level
predictors.
Fixed effects
Using the random intercepts model with predictors (Model 2), we found a few
level 1 predictors to statistically explain farmers’ use of cover crops (Table 4). For
perceived attributes of adaptive capacity, we found that a single standard deviation
increase in farmers’ perceived centrality in social networks (Social Network)
improves the odds of using cover crops by 13% (Exp(B)=1.13, p<0.01). An increase
in one standard deviation in farmers’ perceived decision constraints (Perceived
Decision Constraints) increases the odds of using cover crops by 9% (Exp(B)=1.09,
p<0.05). A single standard deviation increase in farmers’ interest in seeking
knowledge (Seeking Knowledge) is associated with an increase in the odds of using
cover crops by 8%, however this association was weakly significant (Exp(B)=1.08,
p<0.1).
For objective capacity predictors, our results show that one standard
deviation increase in farm sales (Farm Sales) is associated with 17% increase in the
odds of farmers’ using cover crops. The direction of relationship with farmers’ use of
cover crops is very similar for other predictors of objective capacity, such as
Weather Tools (14%) and Market Diversity (8%). Notably, the single largest predictor
of farmers’ use of cover crops is the number of farm enterprises (Farm Enterprises),
i.e. crop and livestock diversification. A one standard deviation increase in the
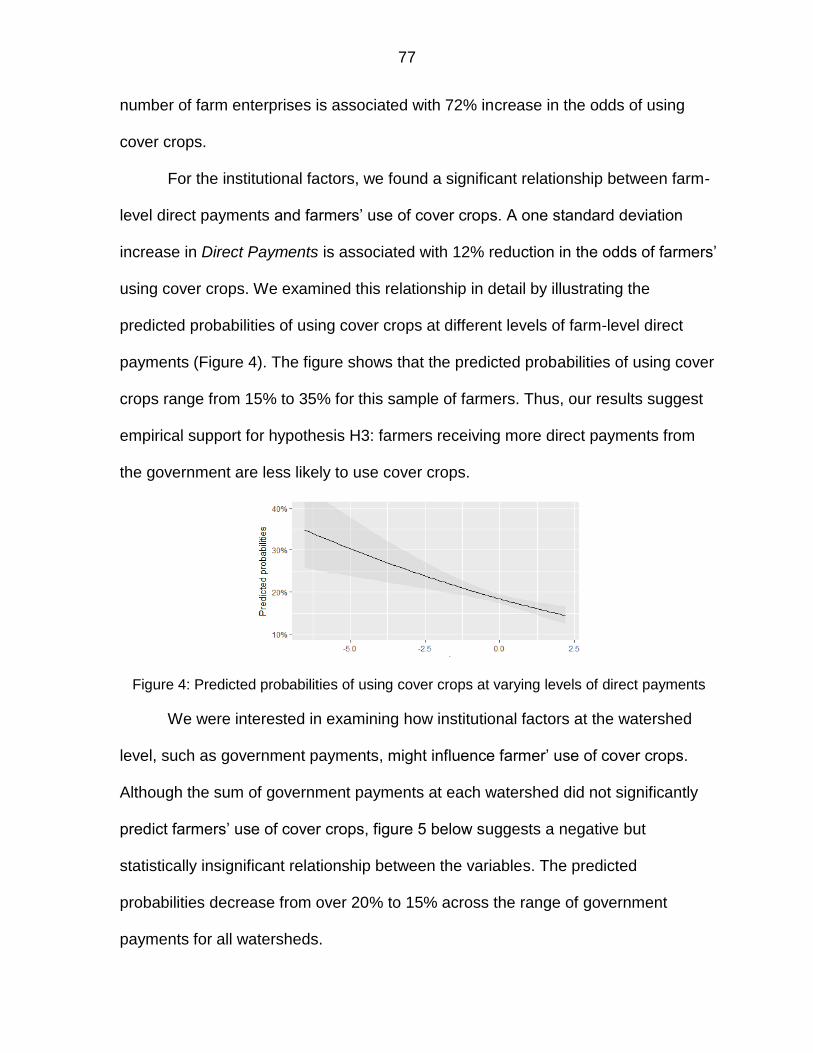
77
number of farm enterprises is associated with 72% increase in the odds of using
cover crops.
For the institutional factors, we found a significant relationship between farm-
level direct payments and farmers’ use of cover crops. A one standard deviation
increase in Direct Payments is associated with 12% reduction in the odds of farmers’
using cover crops. We examined this relationship in detail by illustrating the
predicted probabilities of using cover crops at different levels of farm-level direct
payments (Figure 4). The figure shows that the predicted probabilities of using cover
crops range from 15% to 35% for this sample of farmers. Thus, our results suggest
empirical support for hypothesis H3: farmers receiving more direct payments from
the government are less likely to use cover crops.
Figure 4: Predicted probabilities of using cover crops at varying levels of direct payments
We were interested in examining how institutional factors at the watershed
level, such as government payments, might influence farmer’ use of cover crops.
Although the sum of government payments at each watershed did not significantly
predict farmers’ use of cover crops, figure 5 below suggests a negative but
statistically insignificant relationship between the variables. The predicted
probabilities decrease from over 20% to 15% across the range of government
payments for all watersheds.
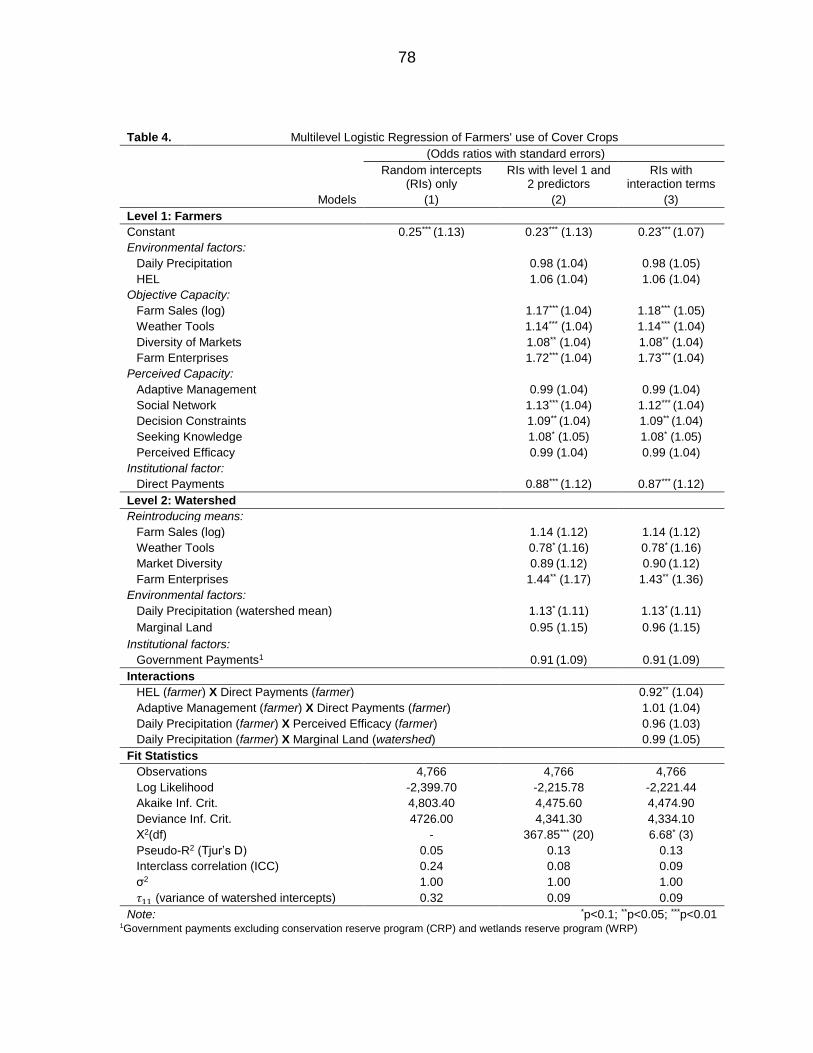
78
Table 4. Multilevel Logistic Regression of Farmers' use of Cover Crops (Odds ratios with standard errors)
Random intercepts (RIs) only
RIs with level 1 and 2 predictors
RIs with interaction terms
Models (1) (2) (3)
Level 1: Farmers
Constant 0.25*** (1.13) 0.23*** (1.13) 0.23*** (1.07)
Environmental factors:
Daily Precipitation 0.98 (1.04) 0.98 (1.05)
HEL 1.06 (1.04) 1.06 (1.04)
Objective Capacity:
Farm Sales (log) 1.17*** (1.04) 1.18*** (1.05)
Weather Tools 1.14*** (1.04) 1.14*** (1.04)
Diversity of Markets 1.08** (1.04) 1.08** (1.04)
Farm Enterprises 1.72*** (1.04) 1.73*** (1.04)
Perceived Capacity:
Adaptive Management 0.99 (1.04) 0.99 (1.04)
Social Network 1.13*** (1.04) 1.12*** (1.04)
Decision Constraints 1.09** (1.04) 1.09** (1.04)
Seeking Knowledge 1.08* (1.05) 1.08* (1.05)
Perceived Efficacy 0.99 (1.04) 0.99 (1.04)
Institutional factor:
Direct Payments 0.88*** (1.12) 0.87*** (1.12)
Level 2: Watershed
Reintroducing means:
Farm Sales (log) 1.14 (1.12) 1.14 (1.12)
Weather Tools 0.78* (1.16) 0.78* (1.16)
Market Diversity 0.89 (1.12) 0.90 (1.12)
Farm Enterprises 1.44** (1.17) 1.43** (1.36)
Environmental factors:
Daily Precipitation (watershed mean) 1.13* (1.11) 1.13* (1.11)
Marginal Land 0.95 (1.15) 0.96 (1.15)
Institutional factors:
Government Payments1 0.91 (1.09) 0.91 (1.09)
Interactions
HEL (farmer) X Direct Payments (farmer) 0.92** (1.04)
Adaptive Management (farmer) X Direct Payments (farmer) 1.01 (1.04)
Daily Precipitation (farmer) X Perceived Efficacy (farmer) 0.96 (1.03)
Daily Precipitation (farmer) X Marginal Land (watershed) 0.99 (1.05)
Fit Statistics
Observations 4,766 4,766 4,766
Log Likelihood -2,399.70 -2,215.78 -2,221.44
Akaike Inf. Crit. 4,803.40 4,475.60 4,474.90
Deviance Inf. Crit. 4726.00 4,341.30 4,334.10
Χ2(df) - 367.85*** (20) 6.68* (3)
Pseudo-R2 (Tjur’s D) 0.05 0.13 0.13
Interclass correlation (ICC) 0.24 0.08 0.09
σ2 1.00 1.00 1.00
𝜏11 (variance of watershed intercepts) 0.32 0.09 0.09
Note: *p<0.1; **p<0.05; ***p<0.01 1Government payments excluding conservation reserve program (CRP) and wetlands reserve program (WRP)
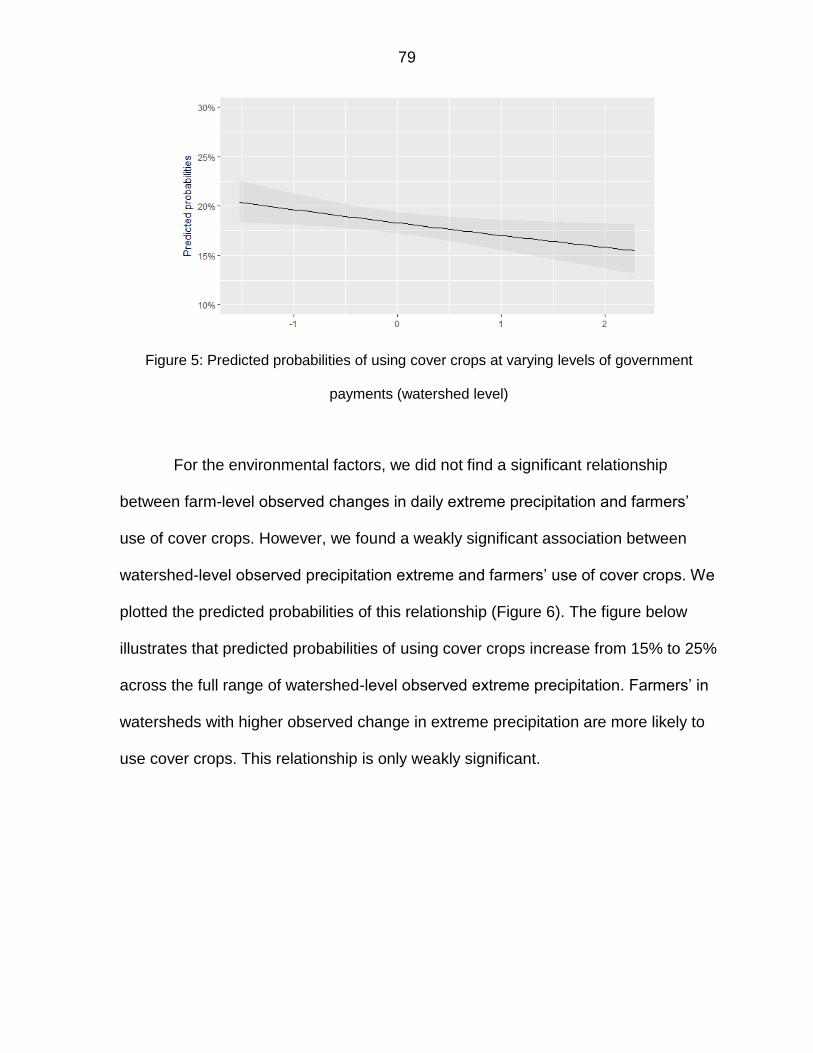
79
Figure 5: Predicted probabilities of using cover crops at varying levels of government
payments (watershed level)
For the environmental factors, we did not find a significant relationship
between farm-level observed changes in daily extreme precipitation and farmers’
use of cover crops. However, we found a weakly significant association between
watershed-level observed precipitation extreme and farmers’ use of cover crops. We
plotted the predicted probabilities of this relationship (Figure 6). The figure below
illustrates that predicted probabilities of using cover crops increase from 15% to 25%
across the full range of watershed-level observed extreme precipitation. Farmers’ in
watersheds with higher observed change in extreme precipitation are more likely to
use cover crops. This relationship is only weakly significant.
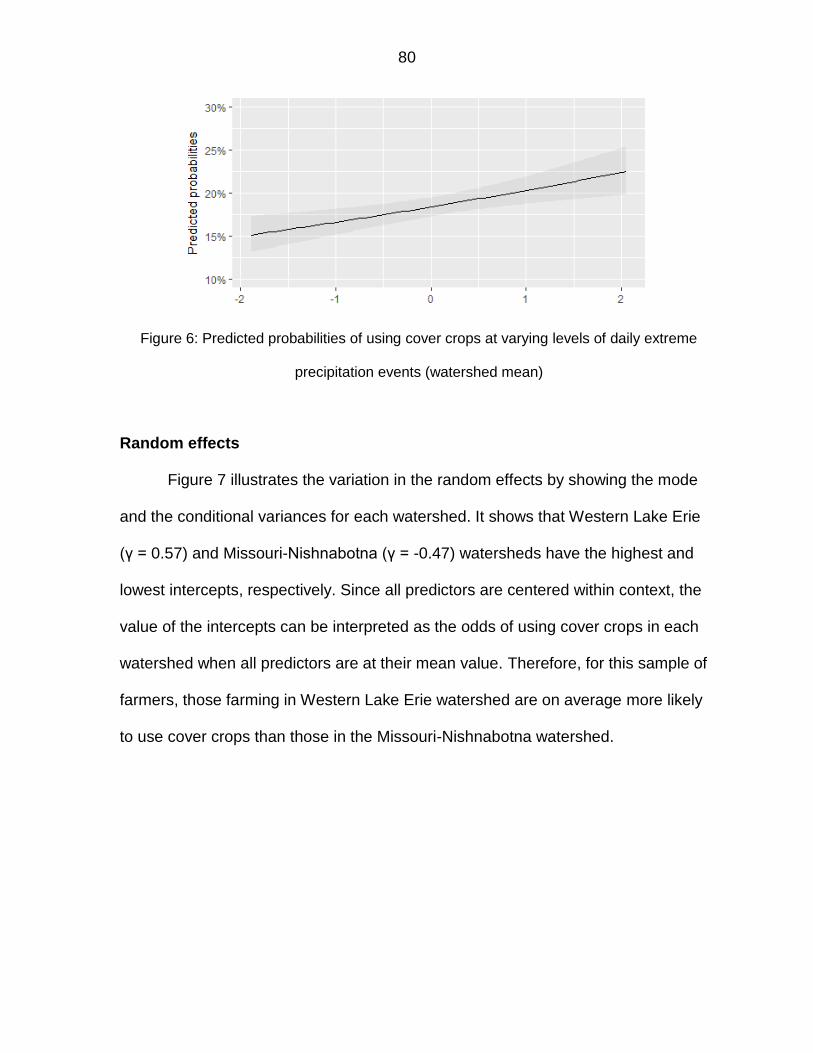
80
Figure 6: Predicted probabilities of using cover crops at varying levels of daily extreme
precipitation events (watershed mean)
Random effects
Figure 7 illustrates the variation in the random effects by showing the mode
and the conditional variances for each watershed. It shows that Western Lake Erie
(γ = 0.57) and Missouri-Nishnabotna (γ = -0.47) watersheds have the highest and
lowest intercepts, respectively. Since all predictors are centered within context, the
value of the intercepts can be interpreted as the odds of using cover crops in each
watershed when all predictors are at their mean value. Therefore, for this sample of
farmers, those farming in Western Lake Erie watershed are on average more likely
to use cover crops than those in the Missouri-Nishnabotna watershed.
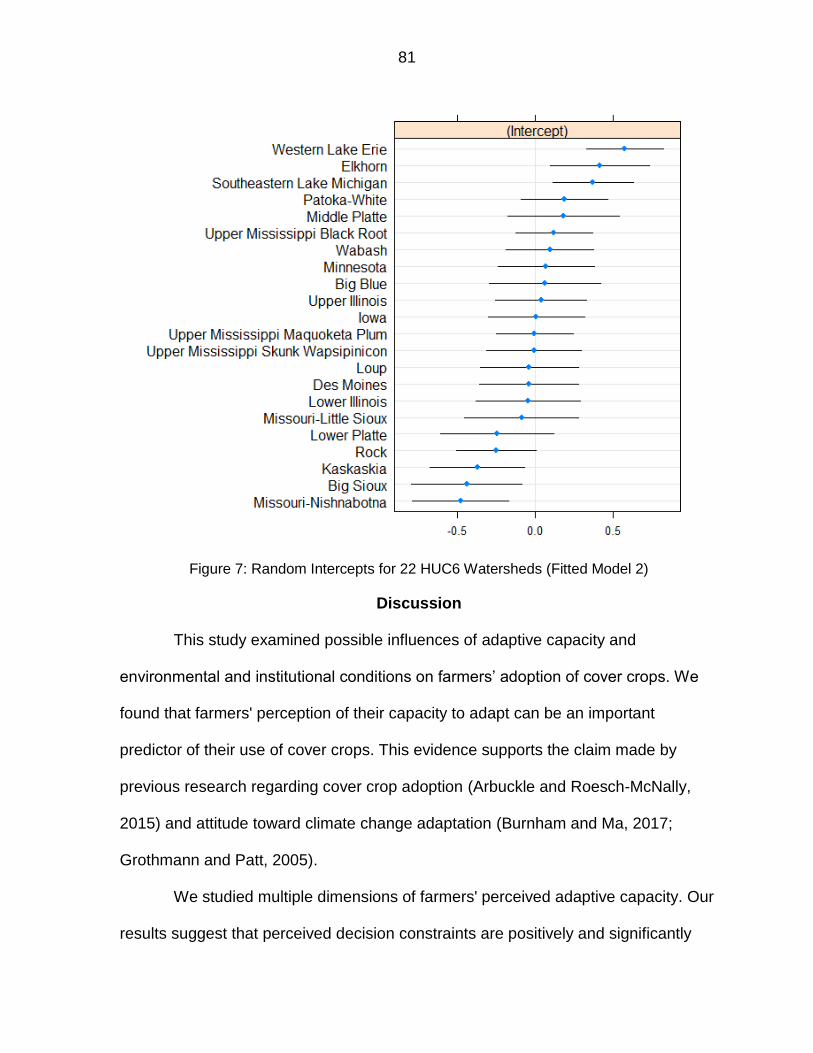
81
Figure 7: Random Intercepts for 22 HUC6 Watersheds (Fitted Model 2)
Discussion
This study examined possible influences of adaptive capacity and
environmental and institutional conditions on farmers’ adoption of cover crops. We
found that farmers' perception of their capacity to adapt can be an important
predictor of their use of cover crops. This evidence supports the claim made by
previous research regarding cover crop adoption (Arbuckle and Roesch-McNally,
2015) and attitude toward climate change adaptation (Burnham and Ma, 2017;
Grothmann and Patt, 2005).
We studied multiple dimensions of farmers' perceived adaptive capacity. Our
results suggest that perceived decision constraints are positively and significantly

82
related to farmers’ use of cover crops. Our results support findings of previous
studies that have found farmers’ perceptions of constraints (exogenous) associated
with biophysical stressors, such as drought (van Duinen et al., 2015) and excess
water (Morton et al., 2015) to increase their willingness to take necessary steps
reduce risks associated with these hazards.
Our study suggests that farmers’ centrality in social network—a measure of
their relative positioning with the social structure—can influence their adaptive
response to climate change. We found that farmers’ who perceive themselves to be
central in their social group are more likely to use cover crops. This result supports
previous research on farmer adoption of adaptive management practices that have
found that social networks can influence farmers' pro-environmental behavior
(Floress et al., 2011) and response to adaptive management of resources (Bodin et
al., 2006). We also found that farmers’ desire to seek knowledge can increase their
use of cover crops. This study corroborates findings from previous research in the
U.S. and Australia, which have found that farmers’ attitude toward seeking new
knowledge is a key attribute for achieving greater resilience in agriculture (Eakin et
al., 2016; Marshall and Marshall, 2007).
In terms of institutional factors influencing farmers’ use of cover crops, we
found that formal institutions such as direct payments are likely to impede farmer’
decision to use cover crops. We found that the effect of receiving direct payments on
farmers’ land use decisions are comparable to them obtaining crop insurance
indemnities. Both are sources of additional revenue. Our study’s results are
consistent with findings from other studies (Annan and Schlenker, 2015; Babcock,

83
2014; Falco et al., 2014) who found that crop insurance can create a disincentive for
the farmer to take necessary adaptive measures on their farm because of the
additional revenue protection provided by these programs. We examined the
interaction effect between direct payments and farmers planting crops on highly
erodible land. We found that farmers are less likely to use cover crops if they have
received (1) direct payments and (2) plant on highly erodible land. Our finding
supports results from previous studies that have attributed farmers’ enrollment in
subsidized crop insurance programs with an increase in conversion rate of non-
cropland to cropland (Claassen, 2012; Hertel and Lobell, 2014). Overall, we found
that risk management institutions such as direct payments can influence farmers’
land use decisions, with potential negative economic and environmental
consequences.
We also examined how objective dimensions of adaptive capacity can
influence farmers’ adoption of cover crops. We found that more crop and livestock
diversification increases farmers’ use of cover crops, which supports findings from
earlier research that found a positive relationship between crop and livestock
diversification and adoption of adaptive management practices (Knutson et al., 2011;
Singer et al., 2007). We also found that material resources had an influence on
farmers’ use of cover crops. These results concur with recent studies that have
identified farm revenue (Prokopy et al., 2008), weather and climate information
(Lemos et al., 2014), and availability of various markets for selling corn (Morton et
al., 2015) as important predictors of farmers’ adaptive response.
84
Conclusion
Our study contributed to understanding how biophysical stressors, perceived
and objective characteristics of adaptive capacity and institutional conditions may
enhance or impede farmers’ use of cover crops. We presented a comprehensive
model that reconciled farmer agency with structural risks and capacities. Results of
this study are believed to be directly applicable in the policy-making domain as many
plans and policies are designed and implemented at multiple levels: farm and
watersheds. At the farm level, we identified several farmer specific variables,
including perceptions of capacity and objective or material sources of capacity which
can predict farmers’ pro-environmental behavior. At the watershed level, we
examined whether regional changes in soil and weather (extreme rain) and
institutional conditions such as government payments could impact farmers’
adaptive responses.
Overall both levels of analysis provided some results to instigate interesting
policy discussion on increasing adaptive management practices in the Upper
Midwest. For example, our study shows that farm subsidies can impede farmers’ use
of adaptive management practices. Therefore, it is important to inquire whether
government payments and crop insurance can also encourage farmers to implement
practices that are beneficial for soil health and water quality? How can rules be
made for crop insurance or government payments that encourage farmers to use
soil and water conservation practices? In our view, farm subsidies provide an
excellent opportunity to connect financial incentives with pro-environmental
behavior. However, currently farm subsidies are creating barriers to conservation.
85
One reason is that the United States Department of Agriculture (USDA) guidelines
for crop insurance eligibility requires farmers to manage cover crops through
extensive “termination guidelines”. This extra layer of compliance with procedures
can increase the managerial complexity for farmers to integrate cover crops into
existing cropping system.
A Midwestern conventional farmer recently drafted an opinion piece on the
potential role of crop insurance to encourage farmers’ use of conservation practices.
He wrote: “There’s a powerful opportunity for crop insurance to encourage
conservation practices. Right now, farmers and the government split the cost of crop
insurance premiums. What if the government paid a larger share to farmers who
practice conservation? If my crop insurance agent offered me a lower crop
insurance premium because I plant cover crops, I’d definitely try to plant cover crops
every year. I’m sure my neighbors would say the same.” (Peterson, 2016) Farm
subsidies programs have made payments to farmers proportional to their use of
conservation practices. More research is needed to examine which programs have
been successful and what have been the social, economic, and behavioral reasons
behind their success. Our study provides the building blocks for future research that
can use perceived and objective adaptive capacities to understand how certain farm
subsidies programs can help achieve conservation goals.
Future research should examine the reasons why farmers in some
watersheds are more likely to use adaptive management practices, such as cover
crops. Are variations in biophysical conditions across watersheds, such as the length
of the growing season influencing greater use of cover crops in some watersheds?
86
or outreach and engagement efforts in some watersheds are contributing more
toward farmers’ use of cover crops? Empirical examination of these questions can
answer questions pertaining to the importance of meso-level engagement efforts
and structural policies for encouraging farmers to use more adaptive management
practices.
References
Adger, W.N., 2006. Vulnerability. Glob. Environ. Chang. 16, 268–281. doi:10.1016/j.gloenvcha.2006.02.006
Agrawal, A., 2008. The Role of Local Institutions in Adaptation to. Soc. Dev. 65.
doi:10.1596/978-0-8213-7887-8 Annan, F., Schlenker, W., 2015. Federal Crop Insurance and the Disincentive to
Adapt to Extreme Heat. Am. Econ. Rev. 105, 262–266. doi:10.1257/aer.p20151031
Arbuckle, J.G., 2013. Farmer support for extending Conservation Compliance
beyond soil erosion: Evidence from Iowa. J. Soil Water Conserv. 68, 99–109. doi:10.2489/jswc.68.2.99
Arbuckle, J.G., Morton, L.W., Hobbs, J., 2013a. Farmer beliefs and concerns about
climate change and attitudes toward adaptation and mitigation: Evidence from Iowa. Clim. Change 118, 551–563. doi:10.1007/s10584-013-0700-0
Arbuckle, J.G., Prokopy, L.S., Haigh, T., Hobbs, J., Knoot, T., Knutson, C., Loy, A.,
Mase, A.S., McGuire, J., Morton, L.W., Tyndall, J., Widhalm, M., 2013b. Climate change beliefs, concerns, and attitudes toward adaptation and mitigation among farmers in the Midwestern United States. Clim. Change 117, 943–950. doi:10.1007/s10584-013-0707-6
Arbuckle, J.G., Roesch-McNally, G., 2015. Cover crop adoption in Iowa: The role of
perceived practice characteristics. J. Soil Water Conserv. 70, 418–429. doi:10.2489/jswc.70.6.418
Arritt, R., 2016. Climate Change in the Corn Belt. Resilient Agric. Babcock, B.A., 2014. Taxpayers, Crop Insurance, and the Drought of 2012,
Taxpayers, Crop Insurance, and the Drought of 2012.
87
Berman, R., Quinn, C., Paavola, J., 2012. The role of institutions in the transformation of coping capacity to sustainable adaptive capacity. Environ. Dev. 2, 86–100. doi:10.1016/j.envdev.2012.03.017
Blesh, J., Wolf, S.A., 2014. Transitions to agroecological farming systems in the
Mississippi River Basin: toward an integrated socioecological analysis. Agric. Human Values 31, 621–635. doi:10.1007/s10460-014-9517-3
Bodin, Ö., Crona, B.I., Ernstson, H., 2006. Social networks in natural resource
management: what is there to learn from a structural perspective? Ecol. Soc. 11, r2. doi:http://www.ecologyandsociety.org/vol11/iss2/resp2/
Bolker, B.M., Brooks, M.E., Clark, C.J., Geange, S.W., Poulsen, J.R., Stevens,
M.H.H., White, J.-S.S., 2009. Generalized linear mixed models: a practical guide for ecology and evolution. Trends Ecol. Evol. 24, 127–135. doi:10.1016/j.tree.2008.10.008
Broussard, W.P., Turner, R.E., Westra, J. V., 2012. Do federal farm policies
influence surface water quality? Agric. Ecosyst. Environ. 158, 103–109. doi:10.1016/j.agee.2012.05.022
Brown, K., Westaway, E., 2011. Agency, Capacity, and Resilience to Environmental
Change: Lessons from Human Development, Well-Being, and Disasters. Annu. Rev. Environ. Resour. 36, 321–342. doi:10.1146/annurev-environ-052610-092905
Bubeck, P., Botzen, W.J.W., Aerts, J.C.J.H., 2012. A Review of Risk Perceptions
and Other Factors that Influence Flood Mitigation Behavior. Risk Anal. 32, 1481–1495. doi:10.1111/j.1539-6924.2011.01783.x
Burnham, M., Ma, Z., 2017. Climate change adaptation: factors influencing Chinese
smallholder farmers’ perceived self-efficacy and adaptation intent. Reg. Environ. Chang. 17, 171–186. doi:10.1007/s10113-016-0975-6
Claassen, L.R., Hansen, L., Peters, M., Breneman, V., Cattaneo, A., Feather, P.,
Gadsby, D., Hellerstein, D., Johnston, P., Morehart, M., Smith, M., 2001. Agri-environmental Policy at the Crossroads: Guideposts on a Changing Landscape. Department of Agriculture Economic Research Service. Agric. Econ. Rep. 1–73. doi:10.1080/01635581.2014.888898
Claassen, R., 2012. The Future of Environmental Compliance Incentives in U.S.
Agriculture: The Role of Commodity, Conservation, and Crop Insurance Programs. SSRN Electron. J. 1–18. doi:10.2139/ssrn.2026902

88
Claassen, R., Langpap, C., Wu, J., 2016. Impacts of Federal Crop Insurance on Land Use and Environmental Quality. Am. J. Agric. Econ. 99, aaw075. doi:10.1093/ajae/aaw075
Dovers, S.R., Hezri, A.A., 2010. Institutions and policy processes: The means to the
ends of adaptation. Wiley Interdiscip. Rev. Clim. Chang. 1, 212–231. doi:10.1002/wcc.29
Eakin, H., York, A., Aggarwal, R., Waters, S., Welch, J., Rubiños, C., Smith-
Heisters, S., Bausch, C., Anderies, J.M., 2016. Cognitive and institutional influences on farmers’ adaptive capacity: insights into barriers and opportunities for transformative change in central Arizona. Reg. Environ. Chang. 16, 801–814. doi:10.1007/s10113-015-0789-y
Engle, N.L., 2011. Adaptive capacity and its assessment. Glob. Environ. Chang. 21,
647–656. doi:10.1016/j.gloenvcha.2011.01.019 Engle, N.L., Lemos, M.C., 2010. Unpacking governance: Building adaptive capacity
to climate change of river basins in Brazil. Glob. Environ. Chang. 20, 4–13. doi:10.1016/j.gloenvcha.2009.07.001
Falco, S. Di, Adinolfi, F., Bozzola, M., Capitanio, F., 2014. Crop Insurance as a
Strategy for Adapting to Climate Change. J. Agric. Econ. 65, 485–504. doi:10.1111/1477-9552.12053
Field, A., 2013. Discovering Statistics using IBM SPSS Statistics. Discov. Stat. using
IBM SPSS Stat. 297–321. doi:10.1016/B978-012691360-6/50012-4 Floress, K., Prokopy, L.S., Allred, S.B., 2011. It’s Who You Know: Social Capital,
Social Networks, and Watershed Groups. Soc. Nat. Resour. 24, 871–886. doi:10.1080/08941920903493926
Grothmann, T., Patt, A., 2005. Adaptive capacity and human cognition: The process
of individual adaptation to climate change. Glob. Environ. Chang. 15, 199–213. doi:10.1016/j.gloenvcha.2005.01.002
Hahn, M.B., Riederer, A.M., Foster, S.O., 2009. The Livelihood Vulnerability Index: A
pragmatic approach to assessing risks from climate variability and change-A case study in Mozambique. Glob. Environ. Chang. 19, 74–88. doi:10.1016/j.gloenvcha.2008.11.002
Hamilton, L., Keim, B., 2009. Regional variation in perceptions about climate
change. Int. J. Climatol. 29, 2348–2352. doi:10.1002/joc
89
Hatfield, J., Takle, G., Grotjahn, R., Holden, P., Izaurralde, R.C., Mader, T., Marshall, E., Liverman, D., 2014. Agriculture, in: Climate Change Impacts in the United States: The Third National Climate Assessment. pp. 150–174. doi:10.7930/J02Z13FR
Hertel, T.W., Lobell, D.B., 2014. Agricultural adaptation to climate change in rich and
poor countries: Current modeling practice and potential for empirical contributions. Energy Econ. 46, 562–575. doi:10.1016/j.eneco.2014.04.014
Karl, T.R., Melillo, J.M., Peterson, T.C., 2009. Global Climate Change Impacts in the
United States, Society. Kaspar, T.C., Jaynes, D.B., Parkin, T.B., Moorman, T.B., Singer, J.W., 2012.
Effectiveness of oat and rye cover crops in reducing nitrate losses in drainage water. Agric. Water Manag. 110, 25–33. doi:10.1016/j.agwat.2012.03.010
Kasperson, R.E., Renn, O., Slovic, P., Brown, H.S., Emel, J., Goble, R., Kasperson,
J.X., Ratick, S., 1988. The Social Amplification of Risk: A Conceptual Framework. Risk Anal. 8, 177–187. doi:10.1111/j.1539-6924.1988.tb01168.x
Knutson, C.L., Haigh, T., Hayes, M.J., Widhalm, M., Nothwehr, J., Kleinschmidt, M.,
Graf, L., 2011. Farmer perceptions of sustainable agriculture practices and drought risk reduction in Nebraska, USA. Renew. Agric. Food Syst. 26, 255–266. doi:10.1017/S174217051100010X
Kremen, C., Miles, A., 2012. Ecosystem services in biologically diversified versus
conventional farming systems: Benefits, externalities, and trade-offs. Ecol. Soc. doi:10.5751/ES-05035-170440
Lal, R., Delgado, J. a., Groffman, P.M., Millar, N., Dell, C., Rotz, a., 2011.
Management to mitigate and adapt to climate change. J. Soil Water Conserv. 66, 276–285. doi:10.2489/jswc.66.4.276
Lemos, M.C., Lo, Y.J., Kirchhoff, C., Haigh, T., 2014. Crop advisors as climate information brokers: Building the capacity of us farmers to adapt to climate change. Clim. Risk Manag. 4, 32–42. doi:10.1016/j.crm.2014.08.001
Loy, A., Hobbs, J., Arbuckle Jr, J.G., Morton, L.W., Prokopy, L.S., Haigh, T., ... & Tyndall, J., 2013. Farmer perspectives on agriculture and weather variability in the Corn Belt: A statistical atlas.
Macdonald, J.M., Korb, P., Hoppe, R. a, 2013. Farm Size and the Organization of U
. S . Crop Farming. Econ. Res. Rep. 1–61. Marshall, N.A., Marshall, P.A., 2007. Conceptualizing and operationalizing social
resilience within commercial fisheries in northern Australia. Ecol. Soc. 12. doi:1
90
Marshall, N.A., Park, S.E., Adger, W.N., Brown, K., Howden, S.M., 2012. Transformational capacity and the influence of place and identity. Environ. Res. Lett. 7, 34022. doi:10.1088/1748-9326/7/3/034022
McCarl, B.A., 2010. Analysis of climate change implications for agriculture and
forestry: An interdisciplinary effort. Clim. Change 100, 119–124. doi:10.1007/s10584-010-9833-6
Morton, L.W., Hobbs, J., Arbuckle, J.G., Loy, A., 2015. Upper midwest climate
variations: farmer responses to excess water risks. J. Environ. Qual. 44, 810–22. doi:10.2134/jeq2014.08.0352
Moser, C., Stauffacher, M., Blumer, Y.B., Scholz, R.W., 2014. From risk to
vulnerability: the role of perceived adaptive capacity for the acceptance of contested infrastructure. J. Risk Res. 9877, 1–15. doi:10.1080/13669877.2014.910687
Moser, S.C., Kasperson, R.E., Yohe, G., Agyeman, J., 2008. Adaptation to climate
change in the Northeast United States: Opportunities, processes, constraints. Mitig. Adapt. Strateg. Glob. Chang. 13, 643–659. doi:10.1007/s11027-007-9132-3
Nelson, D.R., Adger, W.N., Brown, K., 2007. Adaptation to Environmental Change:
Contributions of a Resilience Framework. Annu. Rev. Environ. Resour. 32, 395–419. doi:10.1146/annurev.energy.32.051807.090348
Niles, M.T., Lubell, M., Haden, V.R., 2013. Perceptions and responses to climate
policy risks among california farmers. Glob. Environ. Chang. 23, 1752–1760. doi:10.1016/j.gloenvcha.2013.08.005
Ostrom, E., 2008. Institutions and the environment. Econ. Aff. 28, 24–31.
doi:10.1111/j.1468-0270.2008.00840.x Parry, M.L., Canziani, O.F., Palutikof, J.P., van der Linden, P.J., Hanson, C.E.,
2007. IPCC, 2007: Summary for Policymakers, in: Climate Change 2007: Impacts, Adaptation and Vulnerability. Contribution ofWorking Group II to the Fourth Assessment Report of the Intergovernmental Panel on Climate Change. pp. 7–22. doi:10.2134/jeq2008.0015br
Peterson, M., 2016. Let’s improve soil and water quality with crop insurance. Des
Moines Regist. Prokopy, L.S., Floress, K., Klotthor-Weinkauf, D., Baumgart-Getz, a., 2008.
Determinants of agricultural best management practice adoption: Evidence from the literature. J. Soil Water Conserv. 63, 300–311. doi:10.2489/jswc.63.5.300
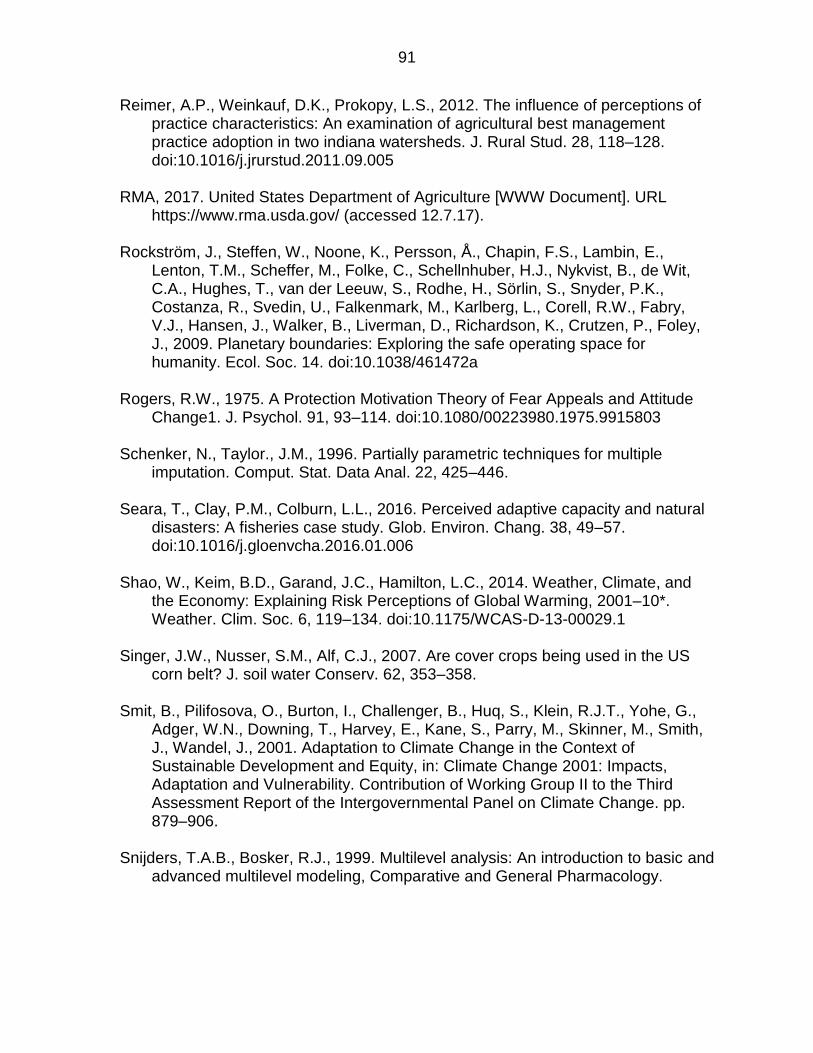
91
Reimer, A.P., Weinkauf, D.K., Prokopy, L.S., 2012. The influence of perceptions of practice characteristics: An examination of agricultural best management practice adoption in two indiana watersheds. J. Rural Stud. 28, 118–128. doi:10.1016/j.jrurstud.2011.09.005
RMA, 2017. United States Department of Agriculture [WWW Document]. URL
https://www.rma.usda.gov/ (accessed 12.7.17). Rockström, J., Steffen, W., Noone, K., Persson, Å., Chapin, F.S., Lambin, E.,
Lenton, T.M., Scheffer, M., Folke, C., Schellnhuber, H.J., Nykvist, B., de Wit, C.A., Hughes, T., van der Leeuw, S., Rodhe, H., Sörlin, S., Snyder, P.K., Costanza, R., Svedin, U., Falkenmark, M., Karlberg, L., Corell, R.W., Fabry, V.J., Hansen, J., Walker, B., Liverman, D., Richardson, K., Crutzen, P., Foley, J., 2009. Planetary boundaries: Exploring the safe operating space for humanity. Ecol. Soc. 14. doi:10.1038/461472a
Rogers, R.W., 1975. A Protection Motivation Theory of Fear Appeals and Attitude
Change1. J. Psychol. 91, 93–114. doi:10.1080/00223980.1975.9915803 Schenker, N., Taylor., J.M., 1996. Partially parametric techniques for multiple
imputation. Comput. Stat. Data Anal. 22, 425–446. Seara, T., Clay, P.M., Colburn, L.L., 2016. Perceived adaptive capacity and natural
disasters: A fisheries case study. Glob. Environ. Chang. 38, 49–57. doi:10.1016/j.gloenvcha.2016.01.006
Shao, W., Keim, B.D., Garand, J.C., Hamilton, L.C., 2014. Weather, Climate, and
the Economy: Explaining Risk Perceptions of Global Warming, 2001–10*. Weather. Clim. Soc. 6, 119–134. doi:10.1175/WCAS-D-13-00029.1
Singer, J.W., Nusser, S.M., Alf, C.J., 2007. Are cover crops being used in the US
corn belt? J. soil water Conserv. 62, 353–358. Smit, B., Pilifosova, O., Burton, I., Challenger, B., Huq, S., Klein, R.J.T., Yohe, G.,
Adger, W.N., Downing, T., Harvey, E., Kane, S., Parry, M., Skinner, M., Smith, J., Wandel, J., 2001. Adaptation to Climate Change in the Context of Sustainable Development and Equity, in: Climate Change 2001: Impacts, Adaptation and Vulnerability. Contribution of Working Group II to the Third Assessment Report of the Intergovernmental Panel on Climate Change. pp. 879–906.
Snijders, T.A.B., Bosker, R.J., 1999. Multilevel analysis: An introduction to basic and
advanced multilevel modeling, Comparative and General Pharmacology.
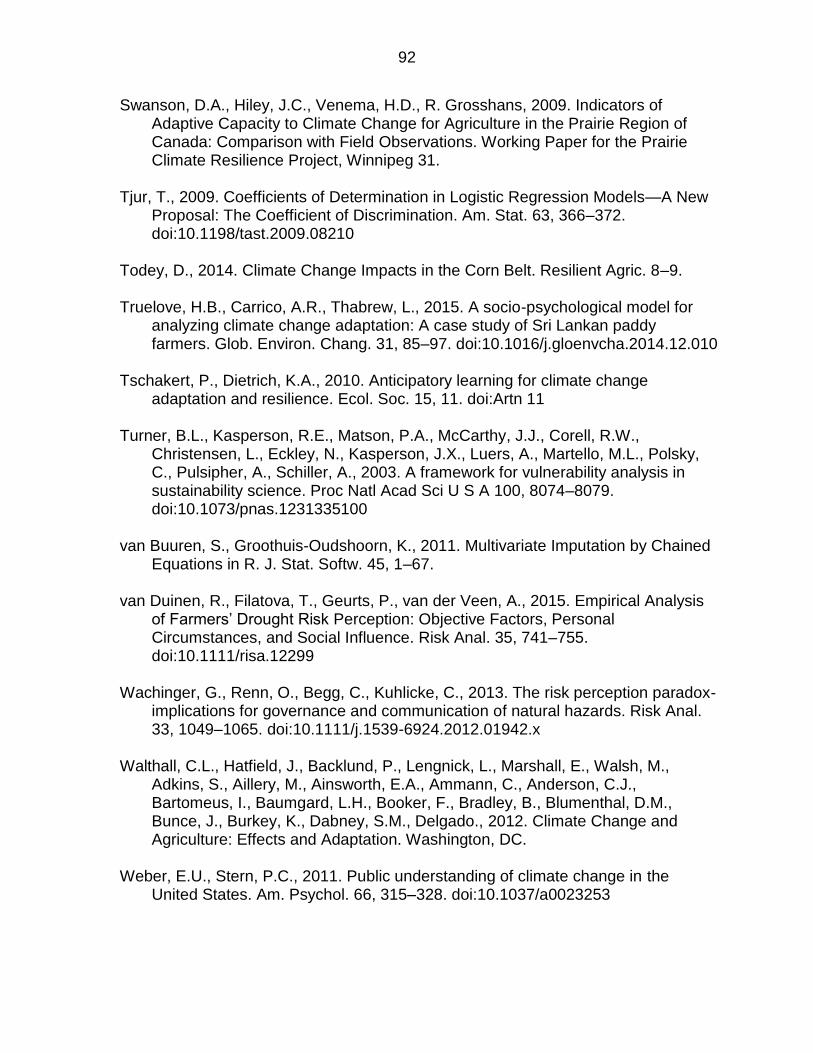
92
Swanson, D.A., Hiley, J.C., Venema, H.D., R. Grosshans, 2009. Indicators of Adaptive Capacity to Climate Change for Agriculture in the Prairie Region of Canada: Comparison with Field Observations. Working Paper for the Prairie Climate Resilience Project, Winnipeg 31.
Tjur, T., 2009. Coefficients of Determination in Logistic Regression Models—A New
Proposal: The Coefficient of Discrimination. Am. Stat. 63, 366–372. doi:10.1198/tast.2009.08210
Todey, D., 2014. Climate Change Impacts in the Corn Belt. Resilient Agric. 8–9. Truelove, H.B., Carrico, A.R., Thabrew, L., 2015. A socio-psychological model for
analyzing climate change adaptation: A case study of Sri Lankan paddy farmers. Glob. Environ. Chang. 31, 85–97. doi:10.1016/j.gloenvcha.2014.12.010
Tschakert, P., Dietrich, K.A., 2010. Anticipatory learning for climate change
adaptation and resilience. Ecol. Soc. 15, 11. doi:Artn 11 Turner, B.L., Kasperson, R.E., Matson, P.A., McCarthy, J.J., Corell, R.W.,
Christensen, L., Eckley, N., Kasperson, J.X., Luers, A., Martello, M.L., Polsky, C., Pulsipher, A., Schiller, A., 2003. A framework for vulnerability analysis in sustainability science. Proc Natl Acad Sci U S A 100, 8074–8079. doi:10.1073/pnas.1231335100
van Buuren, S., Groothuis-Oudshoorn, K., 2011. Multivariate Imputation by Chained
Equations in R. J. Stat. Softw. 45, 1–67. van Duinen, R., Filatova, T., Geurts, P., van der Veen, A., 2015. Empirical Analysis
of Farmers’ Drought Risk Perception: Objective Factors, Personal Circumstances, and Social Influence. Risk Anal. 35, 741–755. doi:10.1111/risa.12299
Wachinger, G., Renn, O., Begg, C., Kuhlicke, C., 2013. The risk perception paradox-
implications for governance and communication of natural hazards. Risk Anal. 33, 1049–1065. doi:10.1111/j.1539-6924.2012.01942.x
Walthall, C.L., Hatfield, J., Backlund, P., Lengnick, L., Marshall, E., Walsh, M.,
Adkins, S., Aillery, M., Ainsworth, E.A., Ammann, C., Anderson, C.J., Bartomeus, I., Baumgard, L.H., Booker, F., Bradley, B., Blumenthal, D.M., Bunce, J., Burkey, K., Dabney, S.M., Delgado., 2012. Climate Change and Agriculture: Effects and Adaptation. Washington, DC.
Weber, E.U., Stern, P.C., 2011. Public understanding of climate change in the
United States. Am. Psychol. 66, 315–328. doi:10.1037/a0023253
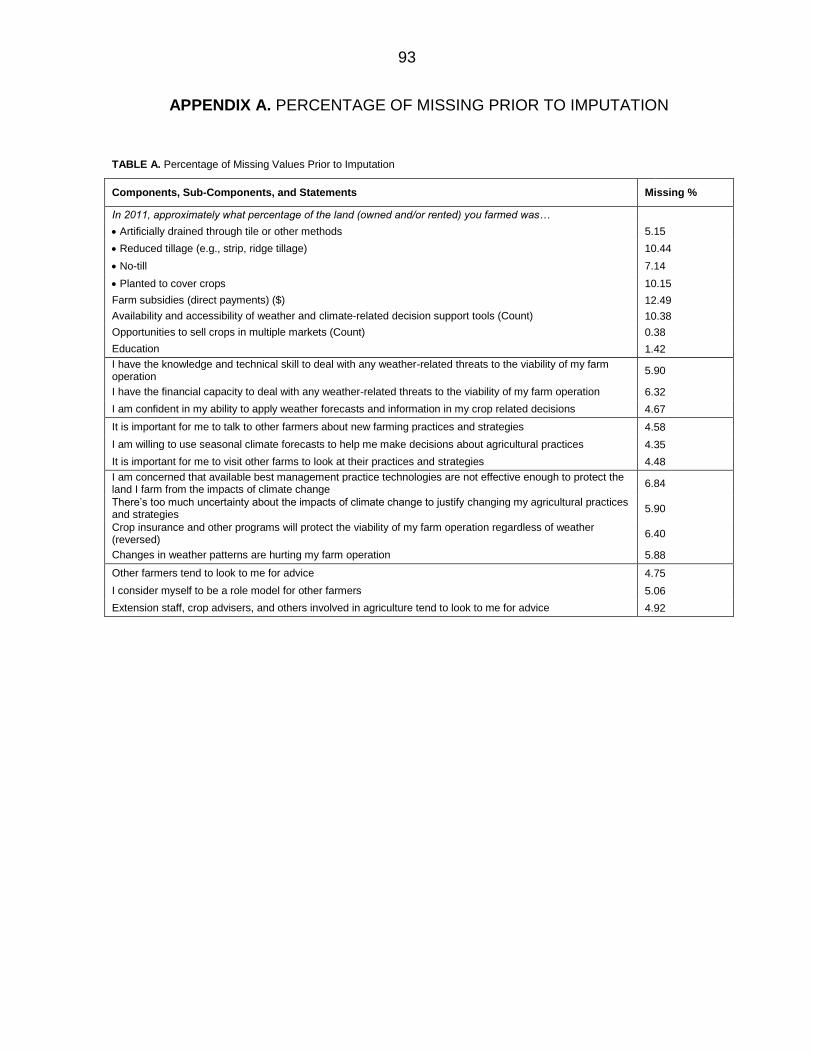
93
APPENDIX A. PERCENTAGE OF MISSING PRIOR TO IMPUTATION
TABLE A. Percentage of Missing Values Prior to Imputation
Components, Sub-Components, and Statements Missing %
In 2011, approximately what percentage of the land (owned and/or rented) you farmed was…
• Artificially drained through tile or other methods 5.15
• Reduced tillage (e.g., strip, ridge tillage) 10.44
• No-till 7.14
• Planted to cover crops 10.15
Farm subsidies (direct payments) ($) 12.49
Availability and accessibility of weather and climate-related decision support tools (Count) 10.38
Opportunities to sell crops in multiple markets (Count) 0.38
Education 1.42
I have the knowledge and technical skill to deal with any weather-related threats to the viability of my farm operation
5.90
I have the financial capacity to deal with any weather-related threats to the viability of my farm operation 6.32
I am confident in my ability to apply weather forecasts and information in my crop related decisions 4.67
It is important for me to talk to other farmers about new farming practices and strategies 4.58
I am willing to use seasonal climate forecasts to help me make decisions about agricultural practices 4.35
It is important for me to visit other farms to look at their practices and strategies 4.48
I am concerned that available best management practice technologies are not effective enough to protect the land I farm from the impacts of climate change
6.84
There’s too much uncertainty about the impacts of climate change to justify changing my agricultural practices and strategies
5.90
Crop insurance and other programs will protect the viability of my farm operation regardless of weather (reversed)
6.40
Changes in weather patterns are hurting my farm operation 5.88
Other farmers tend to look to me for advice 4.75
I consider myself to be a role model for other farmers 5.06
Extension staff, crop advisers, and others involved in agriculture tend to look to me for advice 4.92

94
APPENDIX B. MISSING DATA ANALYSIS
Figure B: Imputed dataset is illustrated in magenta while the density of the observed
data is showed in blue
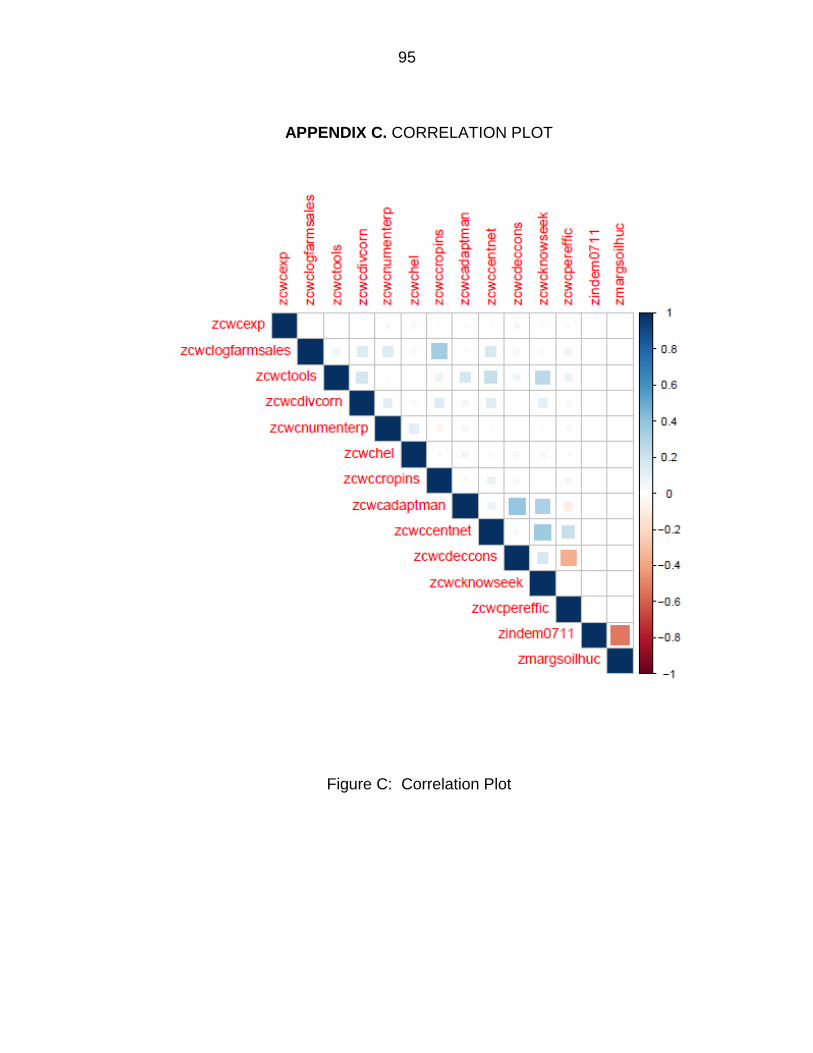
95
APPENDIX C. CORRELATION PLOT
Figure C: Correlation Plot

96
CHAPTER 4. SPATIALLY REPRESENTING VULNERABILITY TO EXTREME RAIN EVENTS USING MIDWESTERN FARMERS' OBJECTIVE AND PERCEIVED
ATTRIBUTES OF ADAPTIVE CAPACITY
Modified from a paper submitted to Risk Analysis
Maaz Gardezi1 and J. Gordon Arbuckle2
Abstract
Potential climate change-related impacts to agriculture in the Upper Midwest
pose serious economic and ecological risks to the U.S. and the global economy. Given
the projected trend toward more extreme rainfall events in the Upper Midwest, it is
important to recognize that such variation in rainfall can impact farm-level productivity
and off-farm environmental sustainability. On a local level, farmers are at the forefront
of responding to the impacts of climate change. Hence, it is important to understand
how farmers and their farm operations may be more or less vulnerable to changes in
the climate. A vulnerability index is a tool commonly used by researchers and
practitioners to represent the geographical distribution of vulnerability in response to
global change. Most vulnerability assessments measure objective adaptive capacity
using secondary data collected by governmental agencies. These assessments can
potentially overlook people’s subjective perceptions of changes in climate and
extreme weather events and the extent to which people feel prepared to take
necessary steps to cope and respond to the negative effects of climate change. This
paper incorporates socio-cognitive aspects of adaptive capacity into a vulnerability
assessment approach. Farmer-level vulnerability is calculated and spatial statistics
1 Corresponding author, Department of Sociology, Iowa State University 2 Department of Sociology, Iowa State University
97
are used to conduct small area (county) estimation with continuous areal data. The
farmer and county-level vulnerability indices presented in this paper can be useful to
meet the information needs of a diversity of decision makers such as farmers,
agricultural educators, and policy makers.
Introduction
The Upper Midwestern United States is a national and global leader in
commodity crop production, mainly corn (Zea mays) and soybeans (Glycine max). In
2015, approximately $68 billion of corn and soybeans was produced in this region
(USDA-NASS, 2015). This region also produces one-third of the global corn supply
and one-quarter of its soybeans (FAOSTAT, 2015). Current and predicted climate
change-related impacts to corn and soybean crops include reduction in crop yield,
higher crop stressors due to extreme rain events, soil erosion, droughts, floods, and
weed and insect pests (Hatfield et al., 2014). These impacts on agriculture in the
Upper Midwest, pose serious economic and ecological risks to the U.S. and the global
economy.
Extreme precipitation represents one of the greatest threats to agricultural
productivity and environmental sustainability (Arritt, 2016; Karl et al., 2009; Todey,
2014). Extreme precipitation is defined as an event with more than four inches (101.6
millimeters) of rain in a 24 hour period (Todey, 2014). Such events can reduce the
efficiency or total factor productivity (TFP) of agriculture (Liang et al., 2017). For
example, in the early growing season, extreme precipitation events can delay planting
and increase farmers’ economic risks. Before the crop canopy is established, extreme
precipitation events increase the risk of soil erosion (Abendroth et al., 2011; Morton et
98
al., 2015) and exacerbate negative off-farm environmental impacts, such as an
increase in the transportation of nitrogen, phosphorus and other nutrients into ground
water, streams, and lakes (Morton et al., 2015). Excessive sediment and nutrient
export from corn-soybean producing agricultural lands is a significant driver of
nonpoint source pollution loads in the Mississippi River Basin and the Gulf of Mexico
(Mitsch et al., 2001; Rabalais, 2006). Thus, extreme precipitation events can not only
hurt short-term crop productivity but also exacerbate soil erosion, off-field, and off-
farm nutrient losses across the region (Morton et al., 2015).
The US 3rd National Climate Assessment defines vulnerability as “the degree
to which a system is susceptible to, or unable to cope with, adverse effects of climate
change, including climate variability and extremes (Bierbaum et al., 2014, p. 672).”
Vulnerability is a function of exposure, sensitivity, and adaptive capacity. In
agriculture, farm-level vulnerability to extreme rain events can be determined by the
interaction between (1) biophysical stressors or exposure, such as extreme rainfall
events; (2) biophysical impacts or sensitivity, which are mediated by soil
characteristics and use of adaptive management practices, and (3) adaptive capacity,
such as availability and access to financial, technical, and institutional resources
needed for facilitating adaptation. Assessing the exposure, sensitivity, and adaptive
capacity at the farm-level can potentially help to explain the qualities or deficiencies
that make a farm less or more at risk to a range of stressors related to extreme
precipitation events.
In the environmental change literature, most vulnerability assessments have
measured objective attributes of adaptive capacity using secondary data collected by
99
government agencies. These studies often frame the likelihood that people and
communities will adapt to climate change as a function of access to financial and
technical resources and suitable institutional arrangements (Adger, 2003; Berkes and
Jolly, 2002). However, other scholarship on human behavior has noted that in addition
to the objective attributes of adaptive capacity, socio-cultural and cognitive factors,
such as risk perceptions and perceived capacity, are consequential for modulating
peoples’ actual vulnerability (Grothmann and Patt, 2005; Moser et al., 2014). For
example, perceived adaptive capacity (PAC)—defined as the “extent to which [people]
feel prepared to endure changes and take necessary steps to cope with them” (Seara
et al., 2016, p. 50)—has been found to influence peoples’ decisions about both the
significance of climatic risks and the willingness to take actions to cope, adapt or
ignore such risks (Grothmann and Patt, 2005; Moser et al., 2014). A better
understanding of the relationships between objective and subjective measures of
adaptive capacity in agriculture has implications for climate change policy and
programs, especially if farmers are systematically under- or over-estimating their own
ability to adapt to weather and climatic impacts. Moreover, examining the objective
attributes of adaptive capacity in conjunction with the subjective measures of capacity
may facilitate identification of culturally acceptable adaptation actions available to
farmers.
The objectives of this study are to (1) incorporate perceived adaptive capacity
into a vulnerability assessment, (2) use spatial smoothing to aggregate individual-level
vulnerabilities to the county level, and (3) evaluate the degree to which objective and
perceived adaptive capacity align or misalign. We propose that this study adds value
100
to existing research on farmers’ vulnerability in three ways: (1) incorporating subjective
measures of capacity into a vulnerability assessment can improve understanding of
the farmers’ perceived ability to take suitable actions for adaptation (Hicks et al.,
2016); (2) if there is misalignment between objective and subjective measures of
adaptive capacity, such findings could point to ways that government agencies might
include questions about farmers’ perceived capacity in large-scale surveys, such as
the agriculture census; and (3) disaggregating farmers’ adaptive capacity can highlight
how objective measures of adaptive capacity alone often inadequately capture these
complex behavioral processes.
We organize the paper as follows: we first summarize the literature on
exposure, sensitivity, and adaptive capacity in the context of Upper Midwestern
agricultural systems. We examine various rationales and approaches employed in
understanding adaptive capacity and present a framework that situates this study’s
conception of perceived adaptive capacity within that literature. In the methods
section, we present the study region, the list of measures used in the construction of
farmer-level vulnerability index, and justification for choosing the administrative
region—county—as the scale for mapping vulnerabilities. Next, we report the results
of Conditional Autoregressive (CAR) modeling employed to spatially smooth county-
level climate change vulnerability from farmer-level vulnerability scores. This model
exploits auxiliary information from neighboring counties and estimates a farmer
vulnerability score for each Upper Midwestern county in the study sample. The farmer-
level and county-level spatially smoothed vulnerability indices produced in this paper
can be useful to meet the information needs of a diversity of decision makers such as
101
farmers, agricultural educators, agencies, and policy makers. Finally, we discuss the
main findings and conclude by suggesting possibilities for future research on this
subject.
Literature Review
Global climate change is one of the most significant challenges facing
agriculture in the 21st century. It is already affecting global and regional agricultural
productivity with predicted impacts that will continue to increase in intensity and
frequency (Coumou and Rahmstorf, 2012; Hatfield et al., 2014). Potential climatic and
weather-related threats to agriculture represent threats to food security, livelihoods,
and societal stability (Howden et al., 2007; McCarl, 2010). For example, limited
availability of food, rising food prices, and limited access to food in 2007-2008 has
been linked to political instability and regional conflict in 48 countries (Brinkman and
Hendrix, 2011). On a local level, farmers are at the forefront of responding to the
impacts of climate change on agriculture (Lal et al., 2011). Examining the dynamic
interactions between climatic risks and social, economic, and institutional conditions,
can highlight the qualities or deficiencies that make a farm/farmer more or less
vulnerable to current and future climate change and variability (Walthall et al., 2012).
In the environmental change and disaster studies literature, vulnerability is
generally considered as a function of the likelihood and rate of climate variation to
which a system is exposed, its sensitivity, and its adaptive capacity (Adger, 2006;
Brooks et al., 2005; Parry et al., 2007). Exposure is the likelihood that a system will
experience hazard. Sensitivity refers to the likely magnitude of effect that the hazard
will have on a system. Thus, exposure is an external characteristic of a system, and
102
sensitivity is an internal characteristic. Agricultural systems are human-dominated
ecosystems, so the agriculture’s vulnerability to climate change depends on both the
biophysical effects of climate change but also on the responses taken by individuals
and institutions to moderate those effects (Eakin et al., 2016; Marshall and Marshall,
2007). These individual and social responses are dependent on adaptive capacity—
the ability of the system to cope, adapt, and respond to the negative effects of climate
change (Adger, 2006; Smit et al., 2001; Turner et al., 2003). In the following section,
we briefly highlight some of the current and potential changes in precipitation
(exposure) and the impacts (sensitivity) of these changes on Midwestern U.S.
agriculture.
Exposure: Changes in precipitation for the Midwest
Exposure is the likelihood that a system will experience hazard (Bierbaum et
al., 2014). Observed and projected changes in climate highlight that Midwestern U.S.
is exposed to several climatic and weather-related changes, primarily driven by
changes in temperature and precipitation. Of interest to this study is to examine
agriculture’s exposure to changes in precipitation. In the last century, there has been
a 20% increase in annual precipitation in the U.S., much of which has been driven by
an increase in extreme rain events—events with more than four inches (101.6
millimeters) of rain in a 24-hour period (Todey, 2014). In the Midwest, the frequency
of days with extreme rain events has increased by almost 50% in the entire 20th
century (Arritt, 2016). There is seasonal variation in the observed trend, with 85% of
extreme rain events occurring during the summer period (May-September). Projected
103
changes in precipitation suggest that it is very likely that extreme rain events will
continue to increase in the Midwest throughout the 21st century (Walthall et al., 2012).
Shifts in climatic conditions in the Midwest, such as changes in extreme
precipitation events at important stages in crop development, pose risks of significant
damages to crop productivity and environmental sustainability (Walthall et al., 2012).
On an annual basis, extreme rain events can delay planting or cause waterlogging
that reduces the efficiency or total factor productivity (TFP) of agriculture (Liang et al.,
2017). Extreme rains are also implicated in degradation of soil resources through
erosion, which reduces the long-term productive capacity of agricultural lands
(Abendroth et al., 2011; Morton et al., 2015). Off-farm impacts, especially the
transportation of nitrogen, phosphorus and/or other nutrients into ground water,
streams, and lakes is also exacerbated greatly by extreme rain events (Morton et al.,
2015).
Sensitivity: Extreme rain events and adaptive practices
In the Upper Midwest, projected increases in extreme rain events pose a major
threat to soil quality and agricultural productivity (Arritt, 2016; Karl et al., 2009; Todey,
2014). As discussed above, extreme precipitation events can reduce both annual and
long-term crop productivity and exacerbate off-field, and off-farm nutrient losses
across the region (Morton et al., 2015). Thus, we examine sensitivity as the potential
impacts of extreme rain events on farm-level soil erosion (Walthall et al., 2012).
Sensitivity can be reduced if farmers implement adaptive management
practices to protect the land and retain soils and nutrients (Arbuckle Jr. et al., 2011).
Adaptive best management practices, also known as soil and water conservation
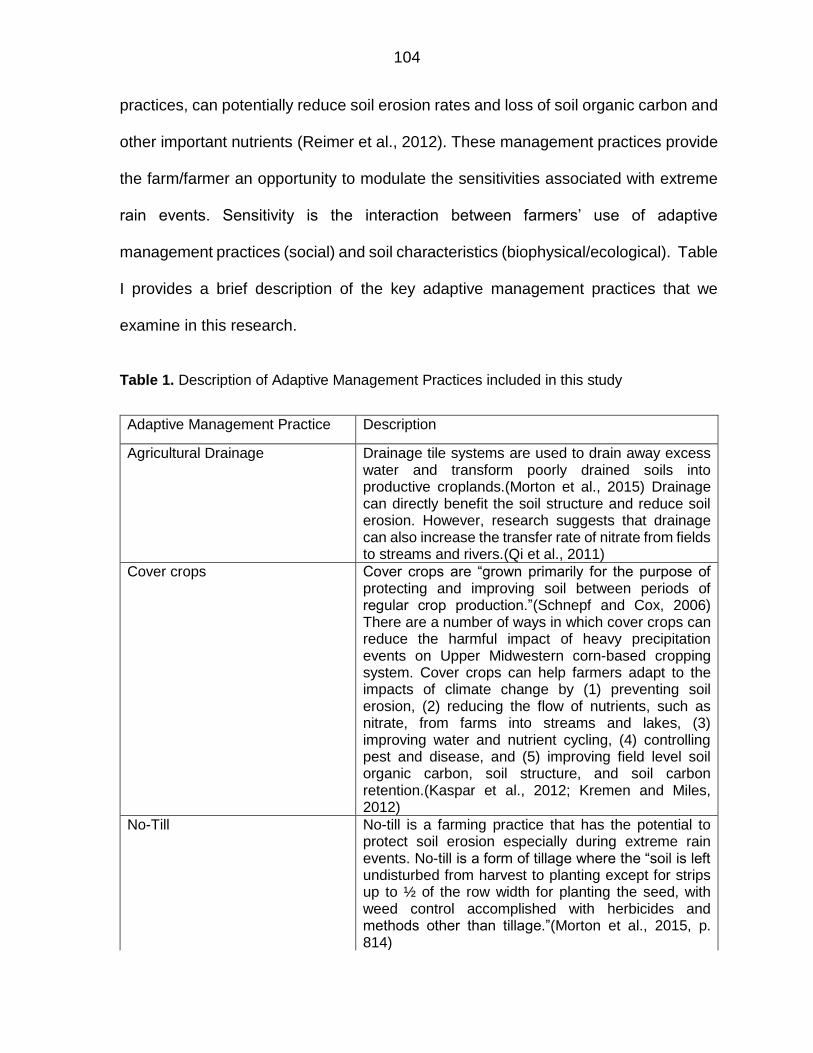
104
practices, can potentially reduce soil erosion rates and loss of soil organic carbon and
other important nutrients (Reimer et al., 2012). These management practices provide
the farm/farmer an opportunity to modulate the sensitivities associated with extreme
rain events. Sensitivity is the interaction between farmers’ use of adaptive
management practices (social) and soil characteristics (biophysical/ecological). Table
I provides a brief description of the key adaptive management practices that we
examine in this research.
Table 1. Description of Adaptive Management Practices included in this study
Adaptive Management Practice Description
Agricultural Drainage Drainage tile systems are used to drain away excess water and transform poorly drained soils into productive croplands.(Morton et al., 2015) Drainage can directly benefit the soil structure and reduce soil erosion. However, research suggests that drainage can also increase the transfer rate of nitrate from fields to streams and rivers.(Qi et al., 2011)
Cover crops Cover crops are “grown primarily for the purpose of protecting and improving soil between periods of regular crop production.”(Schnepf and Cox, 2006) There are a number of ways in which cover crops can reduce the harmful impact of heavy precipitation events on Upper Midwestern corn-based cropping system. Cover crops can help farmers adapt to the impacts of climate change by (1) preventing soil erosion, (2) reducing the flow of nutrients, such as nitrate, from farms into streams and lakes, (3) improving water and nutrient cycling, (4) controlling pest and disease, and (5) improving field level soil organic carbon, soil structure, and soil carbon retention.(Kaspar et al., 2012; Kremen and Miles, 2012)
No-Till No-till is a farming practice that has the potential to protect soil erosion especially during extreme rain events. No-till is a form of tillage where the “soil is left undisturbed from harvest to planting except for strips up to ½ of the row width for planting the seed, with weed control accomplished with herbicides and methods other than tillage.”(Morton et al., 2015, p. 814)
105
Table 1 continued
Reduction in tillage or no-tillage has the potential to reduce soil erosion, increase soil porosity, and increase nutrient retention.(Lal et al., 2011) Benefits to soil properties from no-till farming can reduce the harmful impact of heavy precipitation events on the soil surface by reducing soil erosion.(Morton et al., 2015)
Objective attributes of adaptive capacity
In the environmental change literature, the term ‘resilience’ is defined as a
system’s ability to respond to a shock and still maintain its general attributes, while
also retaining capacity to evolve or transition to a more desirable state (Nelson et al.,
2007; Rockström et al., 2009). Adaptive capacity represents a primary social
mechanism for regulation of system resilience (Engle and Lemos, 2010). Adaptive
capacity includes three distinct, but related, parts: a resource system; the ability of
individuals and communities to access those resources; and, the governance system
that structures and mediates the management of resources and systems of access
(Nelson et al., 2007). Recent research on adaptive capacity has highlighted various
factors as determinants of adaptive capacity, including economic resources,
technology, knowledge and skills, institutions, social capital, and infrastructure.(Engle
and Lemos, 2010; Parry et al., 2007; Yohe and Tol, 2002).
In the context of adaptation in agricultural systems, studies have often focused
on relationships between farmers’ and farming communities’ opportunities to cope,
adapt, and respond to the negative effects of climate change and their access to
financial resources, knowledge, and suitable institutional arrangements (Moser et al.,
2008; Swanson et al., 2009). For example, Moser et al. (2008) found that financial
resources were the most significant determinant of Northeastern U.S. dairy farmers’

106
adaptive capacity. Similarly, Swanson et al. (2009) identified economic resources,
technology, and knowledge to enhance the adaptive capacity of farmers and farm
organizations in the Canadian agriculture sector. Most studies have examined
external or objective dimensions of adaptive capacity, i.e., “the material and immaterial
resources and the assets and entitlements that predetermine the decision options
available to an actor at any point in time to cope with losses and to anticipate future
harm (Eakin, 2014, p. 228).” In this study, we examine some of the key objective
attributes of adaptive capacity for Midwestern U.S. farmers. These include: (1)
financial resources such as farm income, land size, and farm subsidies in the form of
direct payments; (2) institutional resources, such as, opportunities to sell crops in
multiple markets, and (3) technical resources, such as farmers' education levels and
use of weather and climate-related decision support tools.
Perceived attributes of adaptive capacity
While most vulnerability assessments posit access to financial and technical
resources and suitable institutional arrangements as the critical arbiters of adaptive
capacity (Adger, 2003; Berkes and Jolly, 2002), recent scholarship on social-
ecological and psychological resilience has highlighted the importance of socio-
cognitive factors, such as agency, as determinants of individuals’ and communities’
adaptive capacity to respond to environmental stressors (Brown and Westaway, 2011;
Grothmann and Patt, 2005; Moser et al., 2014; Seara et al., 2016). Agency refers to
the ability of individuals to act freely and make independent choices (Brown and
Westaway, 2011). At the individual level, agency can be influenced by personal beliefs
and values; how people perceive risks and opportunities, and broader structural
107
elements, which can either facilitate or serve as barriers to adaptation (Brown and
Westaway, 2011). For example, at the individual level, farmers’ perceived adaptive
capacity in relation to climate change and variability can be composed of such factors
as perceptions about their financial and technical knowledge, perceptions about the
institutional environment, such as faith in crop insurance programs, and perceptions
about their kinship and centrality in social networks. The determinants of perceived
adaptive capacity can be local (e.g., the presence of a strong kinship network which
has the potential to relieve stress) as well as broader socio-economic (e.g., a crop
insurance program). Thus, perceived adaptive capacity describes the internal
dimension of adaptive capacity, i.e., the individual’s perception of the suitability of
available resources (financial, technical, institutional, etc.) needed for facilitating
adaptation (Eakin et al., 2016; Grothmann and Patt, 2005; Seara et al., 2016). It
highlights the “…extent to which people feel they are prepared to endure changes or
impacts and undertake steps to cope with them (Seara et al., 2016).”
Recent research on agricultural and ranching communities in the U.S. (Eakin
et al., 2016) and Australia (Marshall and Marshall, 2007) have used surveys and in-
depth interviews to identify specific perceived dimensions of farmer’s adaptive
capacity. These include: perceived agency in terms of financial resources and
technical skills (also referred to as self-efficacy); perceptions of the extent to which
people can utilize agency for learning and seeking new knowledge (learning and
knowledge seeking); expectations that the institutional context, such as crop
insurance programs can facilitate or buffer individuals from risk (decision constraints);
and social networks that may help farmers in accessing and personalizing information
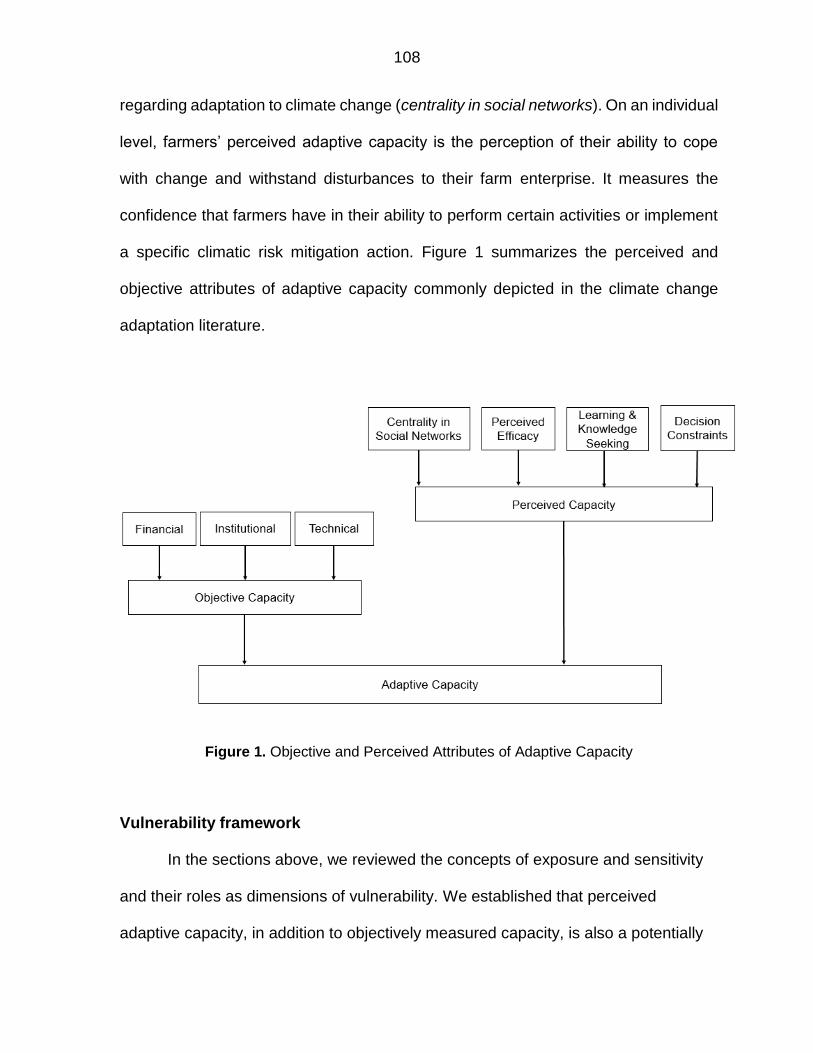
108
regarding adaptation to climate change (centrality in social networks). On an individual
level, farmers’ perceived adaptive capacity is the perception of their ability to cope
with change and withstand disturbances to their farm enterprise. It measures the
confidence that farmers have in their ability to perform certain activities or implement
a specific climatic risk mitigation action. Figure 1 summarizes the perceived and
objective attributes of adaptive capacity commonly depicted in the climate change
adaptation literature.
Figure 1. Objective and Perceived Attributes of Adaptive Capacity
Vulnerability framework
In the sections above, we reviewed the concepts of exposure and sensitivity
and their roles as dimensions of vulnerability. We established that perceived
adaptive capacity, in addition to objectively measured capacity, is also a potentially
109
important mediator of adaptive action. In this section, we outline a conceptual
framework that brings these elements together in a vulnerability framework that is
appropriate for the unique context of Midwestern agriculture.
Vulnerability frameworks generally outline the interactions between
environmental services and social outcomes, in part to examine the qualities or
deficiencies that make coupled human and natural systems (CHANS) or social-
ecological systems (SES) more or less vulnerable to a range of social, economic,
institutional and biophysical stressors (Turner, 2010). In the last decade, use of
vulnerability frameworks has become more common, primarily for recognizing the
synergy or interdependency of the human and environmental subsystems in
determining the vulnerability to and capacity to respond to climate change (Dow et
al., 2013). The conceptualization of vulnerability frameworks has advanced from
solely examining the distribution of physical losses (Hafner-Burton and Montgomery,
2006) to integrating biophysical and social, economic, and political drivers of
vulnerability across space and time (Cutter, 2006; Preston et al., 2011).

110
Figure 2. Vulnerability Framework for Midwestern Farmers
Figure 2 illustrates the vulnerability framework developed for this study,
showing how vulnerability is comprised of the four components: exposure,
sensitivity, perceived and objective adaptive capacity. The framework highlights the
direction of relationships between these four components and the overall
vulnerability to extreme precipitation events. For example, farmland with a higher
exposure and sensitivity will be more vulnerable to the impacts of extreme rain
events. The framework also illustrates adaptive capacity as a primary social
mechanism for reducing vulnerability. For example, a farm’s (or farmer’s)
vulnerability to extreme precipitation can be mediated by their perceived and
objective attributes of adaptive capacity.
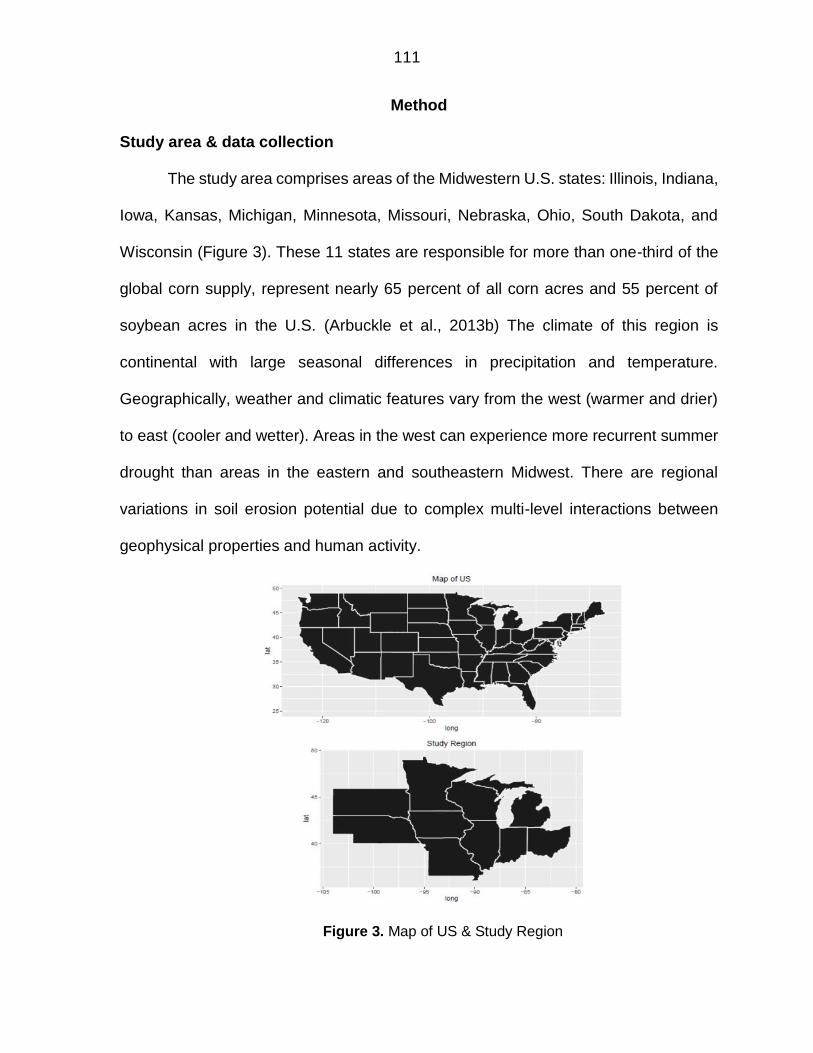
111
Method
Study area & data collection
The study area comprises areas of the Midwestern U.S. states: Illinois, Indiana,
Iowa, Kansas, Michigan, Minnesota, Missouri, Nebraska, Ohio, South Dakota, and
Wisconsin (Figure 3). These 11 states are responsible for more than one-third of the
global corn supply, represent nearly 65 percent of all corn acres and 55 percent of
soybean acres in the U.S. (Arbuckle et al., 2013b) The climate of this region is
continental with large seasonal differences in precipitation and temperature.
Geographically, weather and climatic features vary from the west (warmer and drier)
to east (cooler and wetter). Areas in the west can experience more recurrent summer
drought than areas in the eastern and southeastern Midwest. There are regional
variations in soil erosion potential due to complex multi-level interactions between
geophysical properties and human activity.
Figure 3. Map of US & Study Region
112
Primary data used in this study is from a February 2012 survey of corn and
soybean farmers in 11 Midwestern states (Fig 3). The survey was mailed to a stratified
random sample of farmers in a contiguous set of 22 watersheds.(Arbuckle et al.,
2013b) The USDA National Agricultural Statistics Service (NASS) Census of
Agriculture’s master list, which is the most comprehensive and up-to-date list of US
farmers was the sampling frame. Only farmers who grew at least 80 acres of corn and
grossed farm sales value in excess of $100,000 per year were included in the mailing
list. The survey was mailed by NASS to 18,707 eligible farmers. Completed surveys
were received from 4,778 farmers for an effective response rate of 26%. Non-
response bias checks compared respondent demographics to U.S. Census of
Agriculture data, and no meaningful differences between respondents and non-
respondents were observed (Arbuckle et al., 2013b). To maintain the privacy of
respondents, the farm-level geospatial coordinates were not stored in the database.
However, zip codes and county FIPS were used to identify farmers’ location. The
survey measured farmers’ climate change-related risk perceptions, use of
conservation practices, past experiences with climate change-related hazard, beliefs
about climate change and other sociodemographic features.
Prior to index construction, a Multivariate Imputations by Chained Equations
(MICE) was employed in the software R to impute missing values (van Buuren and
Groothuis-Oudshoorn, 2011). MICE uses Gibbs sampling to generate plausible values
for missing data by examining the underlying patterns in the data.
113
Measuring components of vulnerability
Exposure to extreme precipitation events
Farmers’ experience of extreme precipitation events was measured as number
of days that they had experience extreme precipitation events, defined as events
registering in 99th percentile of daily precipitation for a given month for the record
covering 1971-2011 (Loy et al., 2013). The data was obtained from Loy et al. (2013),
who constructed various measures of extreme weather for the Upper Midwestern
region from the National Weather Service (NWS) Cooperative Observer (COOP) data
archive (see Loy et al. (2013) for details on variable construction). Daily extreme
precipitation values from the weather station nearest to the farm were assigned to
each farmer in the survey. Table II provides a statistical description of daily extreme
precipitation that we employed in this study.
Sensitivity
We used two items to measure farm-level sensitivity to extreme precipitation
events. The first item measured the percent of land designated as “marginal lands” in
each county to represent the local soil characteristics. The data to measure soil
characteristics were obtained from Loy et al. (2013), who calculated the percent of
non-irrigated marginal lands (by county) using the Soil Survey Geographic (SSURGO)
database. The characteristics of soil were grouped according to the USDA Natural
Resources Conservation Service (NRCS) land capability classification system (see
Loy et al., 2013) for a detailed account of variable construction). The second item used
for measuring sensitivity was the maximum percentage of land on which farmers’ self-
reported to use adaptive management practices. Four farm-level adaptive
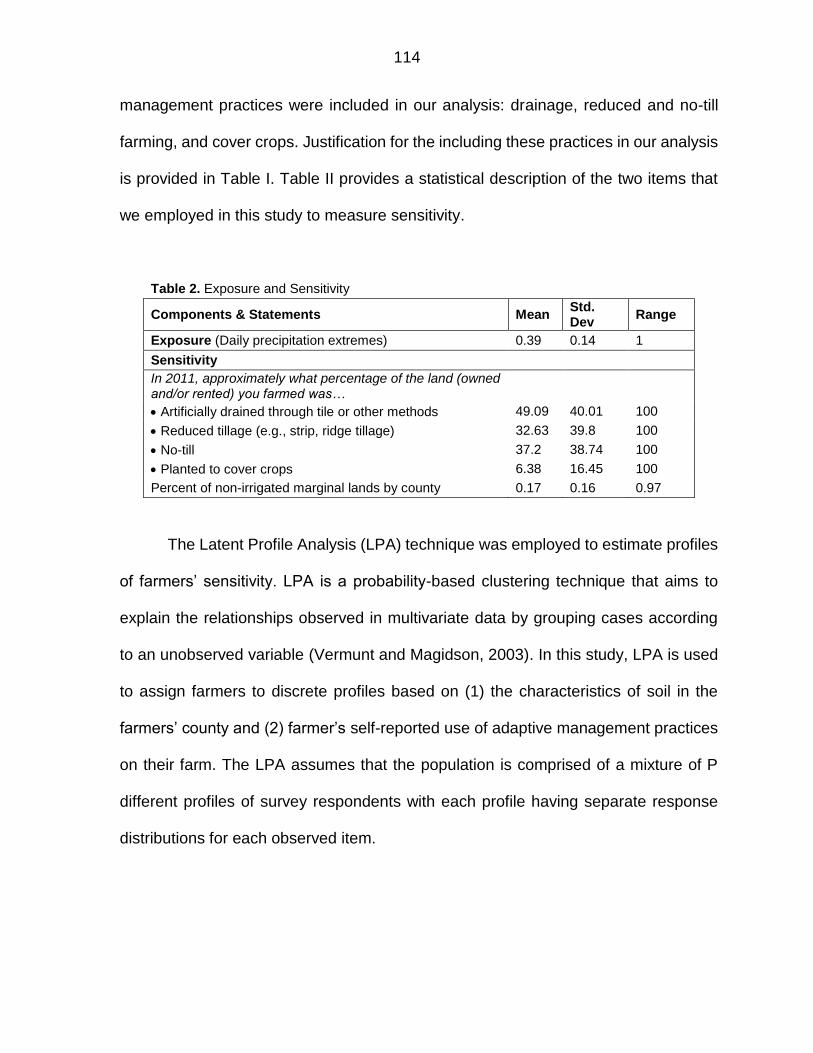
114
management practices were included in our analysis: drainage, reduced and no-till
farming, and cover crops. Justification for the including these practices in our analysis
is provided in Table I. Table II provides a statistical description of the two items that
we employed in this study to measure sensitivity.
Table 2. Exposure and Sensitivity
Components & Statements Mean Std. Dev
Range
Exposure (Daily precipitation extremes) 0.39 0.14 1
Sensitivity
In 2011, approximately what percentage of the land (owned and/or rented) you farmed was…
• Artificially drained through tile or other methods 49.09 40.01 100
• Reduced tillage (e.g., strip, ridge tillage) 32.63 39.8 100
• No-till 37.2 38.74 100
• Planted to cover crops 6.38 16.45 100
Percent of non-irrigated marginal lands by county 0.17 0.16 0.97
The Latent Profile Analysis (LPA) technique was employed to estimate profiles
of farmers’ sensitivity. LPA is a probability-based clustering technique that aims to
explain the relationships observed in multivariate data by grouping cases according
to an unobserved variable (Vermunt and Magidson, 2003). In this study, LPA is used
to assign farmers to discrete profiles based on (1) the characteristics of soil in the
farmers’ county and (2) farmer’s self-reported use of adaptive management practices
on their farm. The LPA assumes that the population is comprised of a mixture of P
different profiles of survey respondents with each profile having separate response
distributions for each observed item.
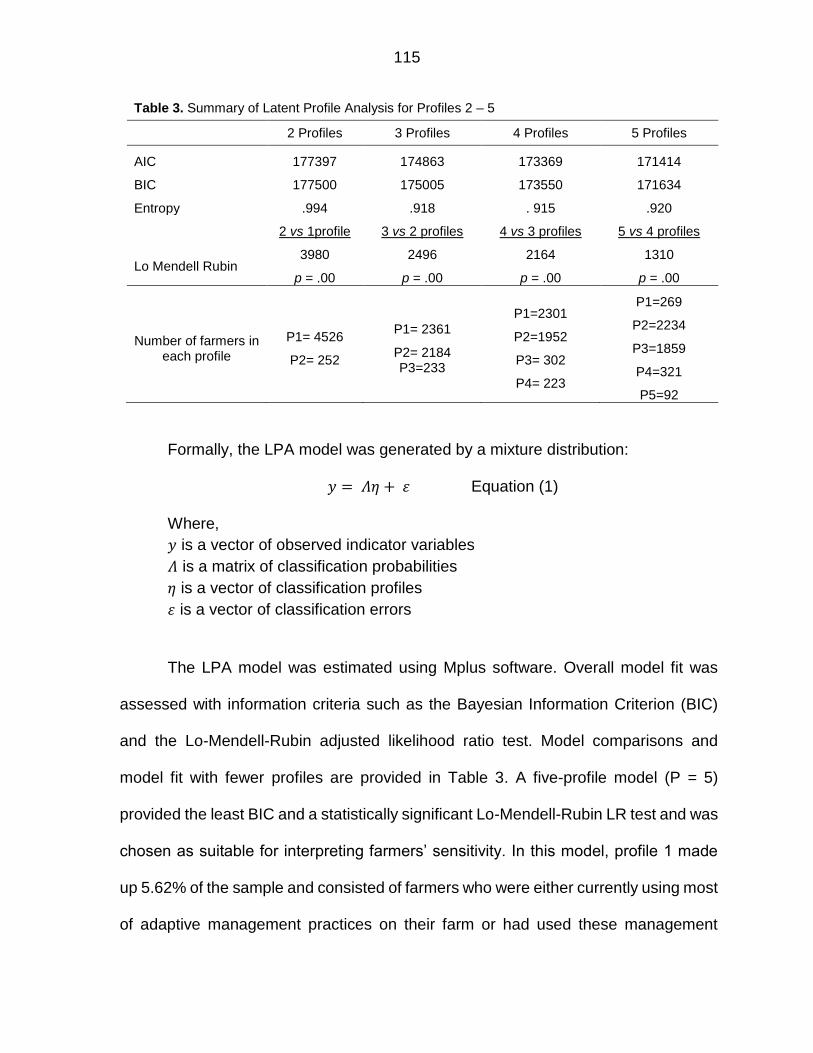
115
Table 3. Summary of Latent Profile Analysis for Profiles 2 – 5
2 Profiles 3 Profiles 4 Profiles 5 Profiles
AIC 177397 174863 173369 171414
BIC 177500 175005 173550 171634
Entropy .994 .918 . 915 .920
Lo Mendell Rubin
2 vs 1profile
3980
p = .00
3 vs 2 profiles
2496
p = .00
4 vs 3 profiles
2164
p = .00
5 vs 4 profiles
1310
p = .00
Number of farmers in each profile
P1= 4526
P2= 252
P1= 2361
P2= 2184 P3=233
P1=2301
P2=1952
P3= 302
P4= 223
P1=269
P2=2234
P3=1859
P4=321
P5=92
Formally, the LPA model was generated by a mixture distribution:
𝑦 = 𝛬𝜂 + 𝜀 Equation (1)
Where,
𝑦 is a vector of observed indicator variables
𝛬 is a matrix of classification probabilities
𝜂 is a vector of classification profiles
𝜀 is a vector of classification errors
The LPA model was estimated using Mplus software. Overall model fit was
assessed with information criteria such as the Bayesian Information Criterion (BIC)
and the Lo-Mendell-Rubin adjusted likelihood ratio test. Model comparisons and
model fit with fewer profiles are provided in Table 3. A five-profile model (P = 5)
provided the least BIC and a statistically significant Lo-Mendell-Rubin LR test and was
chosen as suitable for interpreting farmers’ sensitivity. In this model, profile 1 made
up 5.62% of the sample and consisted of farmers who were either currently using most
of adaptive management practices on their farm or had used these management
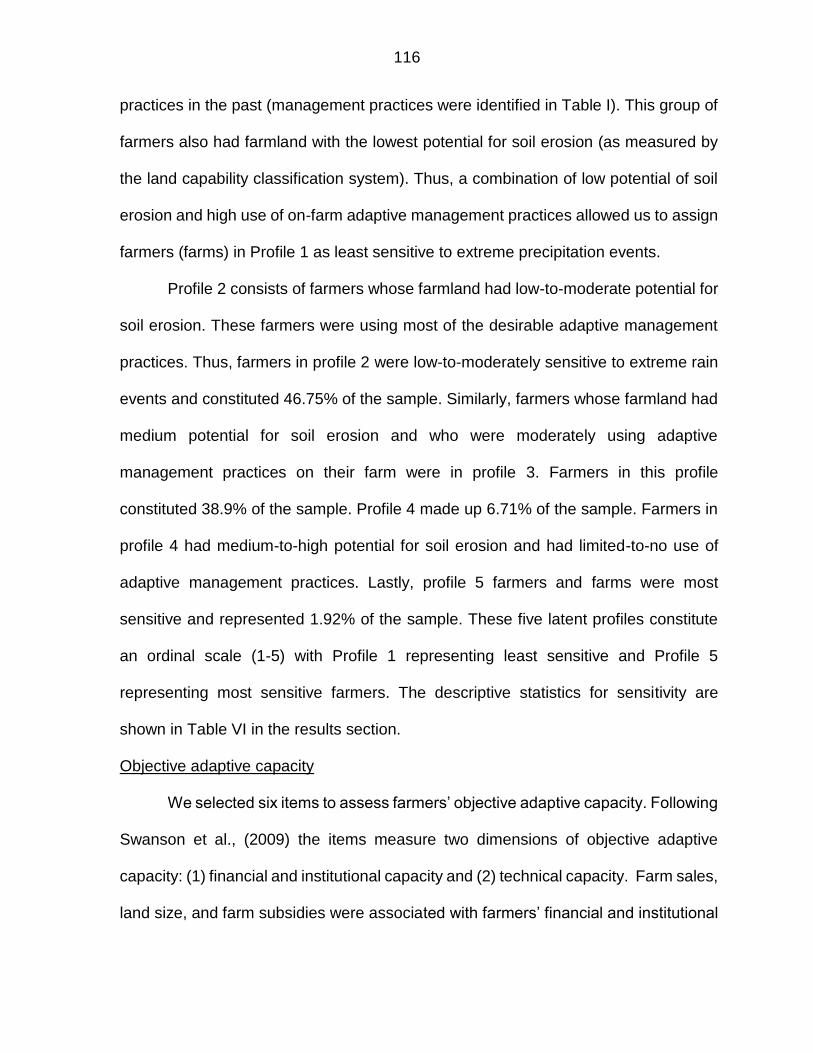
116
practices in the past (management practices were identified in Table I). This group of
farmers also had farmland with the lowest potential for soil erosion (as measured by
the land capability classification system). Thus, a combination of low potential of soil
erosion and high use of on-farm adaptive management practices allowed us to assign
farmers (farms) in Profile 1 as least sensitive to extreme precipitation events.
Profile 2 consists of farmers whose farmland had low-to-moderate potential for
soil erosion. These farmers were using most of the desirable adaptive management
practices. Thus, farmers in profile 2 were low-to-moderately sensitive to extreme rain
events and constituted 46.75% of the sample. Similarly, farmers whose farmland had
medium potential for soil erosion and who were moderately using adaptive
management practices on their farm were in profile 3. Farmers in this profile
constituted 38.9% of the sample. Profile 4 made up 6.71% of the sample. Farmers in
profile 4 had medium-to-high potential for soil erosion and had limited-to-no use of
adaptive management practices. Lastly, profile 5 farmers and farms were most
sensitive and represented 1.92% of the sample. These five latent profiles constitute
an ordinal scale (1-5) with Profile 1 representing least sensitive and Profile 5
representing most sensitive farmers. The descriptive statistics for sensitivity are
shown in Table VI in the results section.
Objective adaptive capacity
We selected six items to assess farmers’ objective adaptive capacity. Following
Swanson et al., (2009) the items measure two dimensions of objective adaptive
capacity: (1) financial and institutional capacity and (2) technical capacity. Farm sales,
land size, and farm subsidies were associated with farmers’ financial and institutional
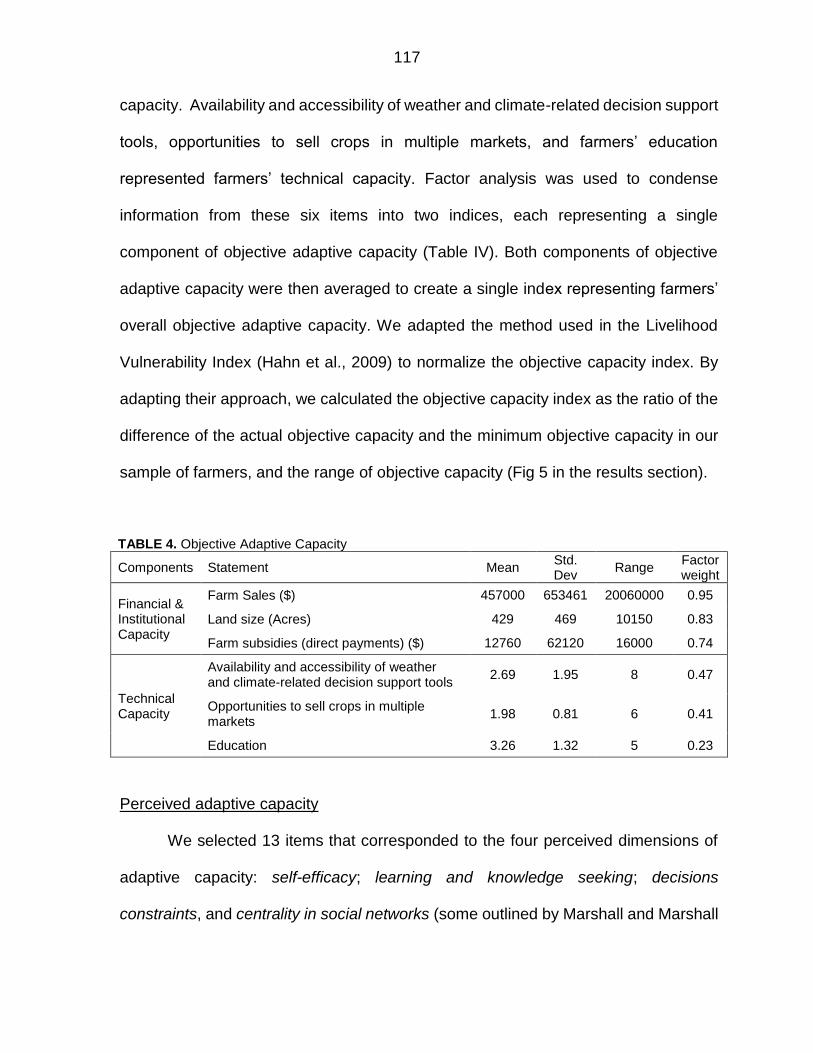
117
capacity. Availability and accessibility of weather and climate-related decision support
tools, opportunities to sell crops in multiple markets, and farmers’ education
represented farmers’ technical capacity. Factor analysis was used to condense
information from these six items into two indices, each representing a single
component of objective adaptive capacity (Table IV). Both components of objective
adaptive capacity were then averaged to create a single index representing farmers’
overall objective adaptive capacity. We adapted the method used in the Livelihood
Vulnerability Index (Hahn et al., 2009) to normalize the objective capacity index. By
adapting their approach, we calculated the objective capacity index as the ratio of the
difference of the actual objective capacity and the minimum objective capacity in our
sample of farmers, and the range of objective capacity (Fig 5 in the results section).
TABLE 4. Objective Adaptive Capacity
Components Statement Mean Std. Dev
Range Factor weight
Financial & Institutional Capacity
Farm Sales ($) 457000 653461 20060000 0.95
Land size (Acres) 429 469 10150 0.83
Farm subsidies (direct payments) ($) 12760 62120 16000 0.74
Technical Capacity
Availability and accessibility of weather and climate-related decision support tools
2.69 1.95 8 0.47
Opportunities to sell crops in multiple markets
1.98 0.81 6 0.41
Education 3.26 1.32 5 0.23
Perceived adaptive capacity
We selected 13 items that corresponded to the four perceived dimensions of
adaptive capacity: self-efficacy; learning and knowledge seeking; decisions
constraints, and centrality in social networks (some outlined by Marshall and Marshall
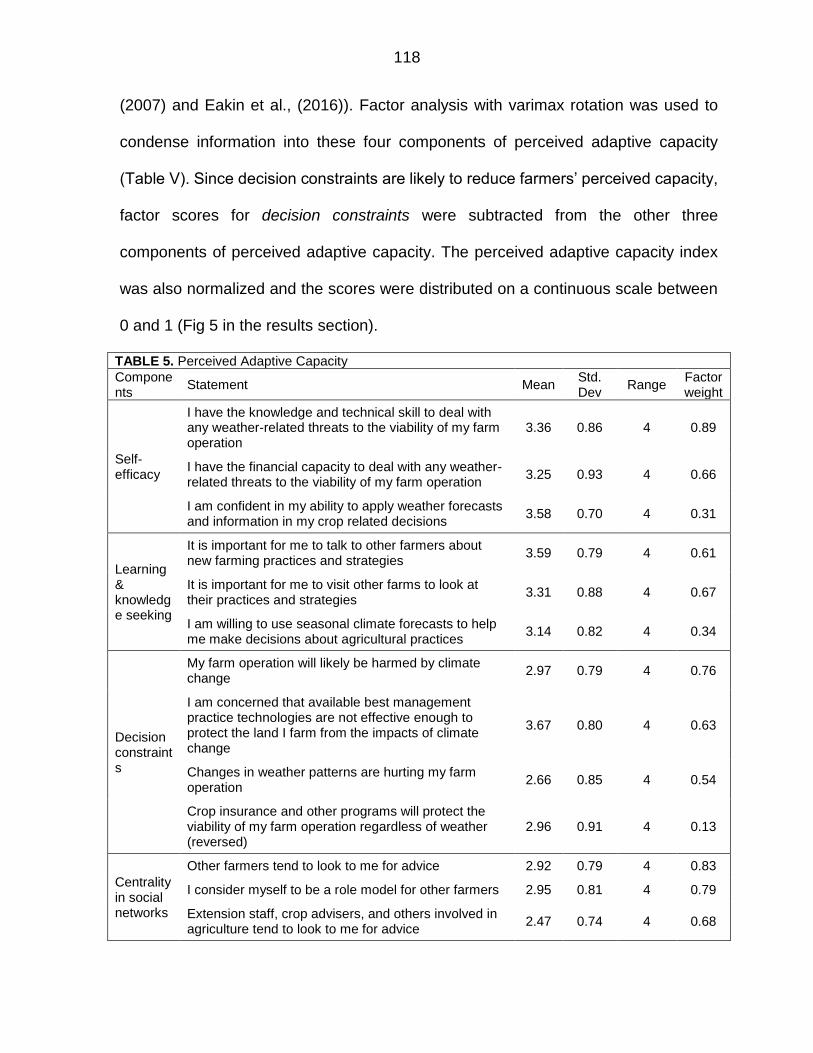
118
(2007) and Eakin et al., (2016)). Factor analysis with varimax rotation was used to
condense information into these four components of perceived adaptive capacity
(Table V). Since decision constraints are likely to reduce farmers’ perceived capacity,
factor scores for decision constraints were subtracted from the other three
components of perceived adaptive capacity. The perceived adaptive capacity index
was also normalized and the scores were distributed on a continuous scale between
0 and 1 (Fig 5 in the results section).
TABLE 5. Perceived Adaptive Capacity
Components
Statement Mean Std. Dev
Range Factor weight
Self-efficacy
I have the knowledge and technical skill to deal with any weather-related threats to the viability of my farm operation
3.36 0.86 4 0.89
I have the financial capacity to deal with any weather-related threats to the viability of my farm operation
3.25 0.93 4 0.66
I am confident in my ability to apply weather forecasts and information in my crop related decisions
3.58 0.70 4 0.31
Learning & knowledge seeking
It is important for me to talk to other farmers about new farming practices and strategies
3.59 0.79 4 0.61
It is important for me to visit other farms to look at their practices and strategies
3.31 0.88 4 0.67
I am willing to use seasonal climate forecasts to help me make decisions about agricultural practices
3.14 0.82 4 0.34
Decision constraints
My farm operation will likely be harmed by climate change
2.97 0.79 4 0.76
I am concerned that available best management practice technologies are not effective enough to protect the land I farm from the impacts of climate change
3.67 0.80 4 0.63
Changes in weather patterns are hurting my farm operation
2.66 0.85 4 0.54
Crop insurance and other programs will protect the viability of my farm operation regardless of weather (reversed)
2.96 0.91 4 0.13
Centrality in social networks
Other farmers tend to look to me for advice 2.92 0.79 4 0.83
I consider myself to be a role model for other farmers 2.95 0.81 4 0.79
Extension staff, crop advisers, and others involved in agriculture tend to look to me for advice
2.47 0.74 4 0.68
119
Vulnerability Index
The 3rd National Climate Assessment defines vulnerability as a “function of the
character, magnitude, and rate of climate variation to which a system is exposed, its
sensitivity, and its adaptive capacity (Bierbaum et al., 2014).” Thus, climate change
vulnerability is the sum of exposure and sensitivity mediated by the system’s adaptive
capacity. We used this definition of vulnerability and adapted it for the context of
examining Midwestern farmers’ vulnerability to extreme rain events. We constructed
two vulnerability indices: (1) an index that incorporated objective attributes of farmers’
adaptive capacity and (2) a vulnerability index that included farmers’ perceived
attributes of adaptive capacity. We calculated these indices separately to demonstrate
the added value of incorporating farmers’ perceived adaptive capacity into a
vulnerability assessment. Finally, all indices were normalized and the distributions of
farmer/farm vulnerability were aligned to a normal distribution (Fig 6 in the results
section).
Aggregating farmers’ vulnerability scores in each county
For agricultural and climate policy makers and planners it is important to
spatially locate the distribution of vulnerabilities to provide policy recommendations for
targeted farm, county, and watershed-level adaptation. However, it can be challenging
to map farmers’ vulnerabilities to climate change without having the geospatial
coordinates of their farms. In this situation, one possible solution is to use spatial
statistics to construct vulnerability estimates for small areas, such as counties. Our
choice of county as the focal geographic unit was based on the following
considerations: (1) institutional processes including many policies and decisions are
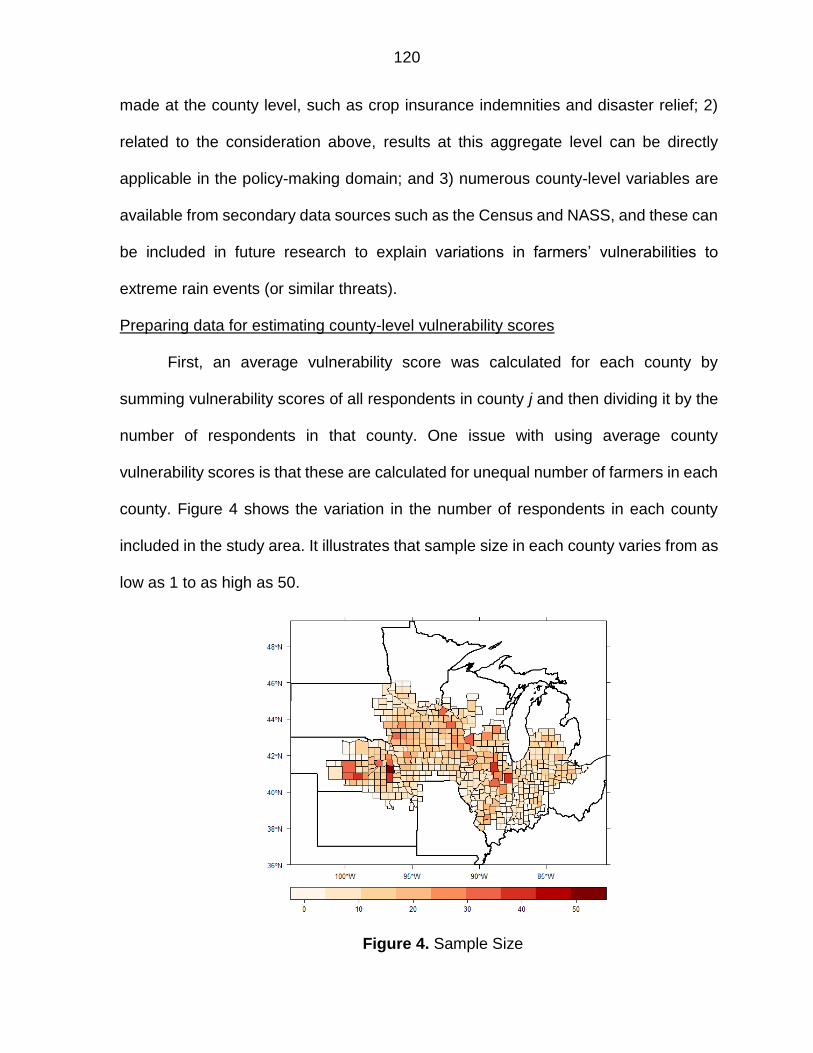
120
made at the county level, such as crop insurance indemnities and disaster relief; 2)
related to the consideration above, results at this aggregate level can be directly
applicable in the policy-making domain; and 3) numerous county-level variables are
available from secondary data sources such as the Census and NASS, and these can
be included in future research to explain variations in farmers’ vulnerabilities to
extreme rain events (or similar threats).
Preparing data for estimating county-level vulnerability scores
First, an average vulnerability score was calculated for each county by
summing vulnerability scores of all respondents in county j and then dividing it by the
number of respondents in that county. One issue with using average county
vulnerability scores is that these are calculated for unequal number of farmers in each
county. Figure 4 shows the variation in the number of respondents in each county
included in the study area. It illustrates that sample size in each county varies from as
low as 1 to as high as 50.
Figure 4. Sample Size
121
To compensate the wide variation displayed among counties, this paper uses
an approximation technique to calculate the county-level simple random sample
variance. The approximation consists of three steps: 1) the variance among all
residents is calculated; 2) the sample variance of the county mean is obtained by
dividing overall variance by total number of residents in each county; 3) the first two
steps are repeated for each county so that an approximate county-level simple
random sample variance was calculated. Intuitively, this approximation ensures that
counties with fewer survey respondents have larger sampling variances.
Spatial smoothing vulnerability scores using a Conditional Autoregressive (CAR)
model
Next, a Conditional Autoregressive (CAR) model was estimated. A CAR model
is appropriate for situations with first order dependency or relatively local spatial
autocorrelation. CAR model assumes that the state of a particular area is influenced
by its neighbors. Formally, the CAR model can be written as:
𝑌𝑖| 𝑌−𝑖 = 𝑋𝑖𝛽 + ∑ 𝑐𝑖𝑗𝑁𝑗=1 (𝑌𝑗 − 𝑋𝑗𝛽) + 𝜈𝑖 Equation 2
Where 𝑌−𝑖 is treated as having fixed values when specifying the distribution of
𝑌𝑖. The variance of Y is specified as:
Var[𝑌] = (𝐼 − 𝐶)−1 ∑ 𝑣 Equation 3
For a valid variance-covariance matrix, two constraints must be set on the
parameters of the model: (1) the value of 𝜌 cannot be very large, (2) 𝐶 must be
symmetric, so that 𝑐𝑖𝑗=𝑐𝑗𝑖.
First, suitable neighbors for each county were identified by specifying a queen
neighbor structure, i.e., counties sharing a boundary point were taken as neighbors
122
(Bivand et al., 2013). A queen neighbor structure was selected for ensuring that each
county was assigned at least one neighbor. This neighboring structure ensured that
the prediction for a county will also include contributions from at least one spatial
neighbor. On average, there are almost 5 neighboring links for every county. After
establishing the set of neighbors, spatial weights were assigned to each neighbor
relationship. Binary weights were assigned to ensure that the structure can define
symmetry needed for estimating a CAR model. A binary weight structure assigns
weight of 1 to each neighbor and 0 to non-neighbor relationship. Thus, binary weights
differentiate the influence of observations—those with many neighbors are more
influential compared to those with few neighbors.
Prior to specifying the CAR models, Moran’s I was also calculated to test the
null hypothesis that no spatial correlation existed among county-level vulnerability
scores. This study used queen neighbors with row-standardized weights to estimate
the Moran’s I. The equation for estimating the Moran's I (eq. 4) is given below:
𝐼 = 𝑛
∑ ∑ 𝑤𝑖𝑗 𝑛𝑗=1
𝑛𝑖=1
∑ ∑ 𝑤𝑖𝑗 (𝑦𝑖− �̅�)(𝑦𝑗− �̅�) 𝑛
𝑗=1𝑛𝑖=1
∑ (𝑦𝑖− �̅�)𝑛𝑖=1
Equation 4
Where, yiis the ith county score, yj is the jth county score, y̅ is the overall mean
of the study area and wij represents the spatial weight between county i and j.
Results
Results of the farm/farmer-level analysis
Table 6 summarizes the distribution of the computed values of farmers’
exposure, sensitivity, perceived adaptive capacity and objective adaptive capacity.
Two overall vulnerability scores that are made up of the preceding components are
also summarized. The components of vulnerability are normalized so they represent
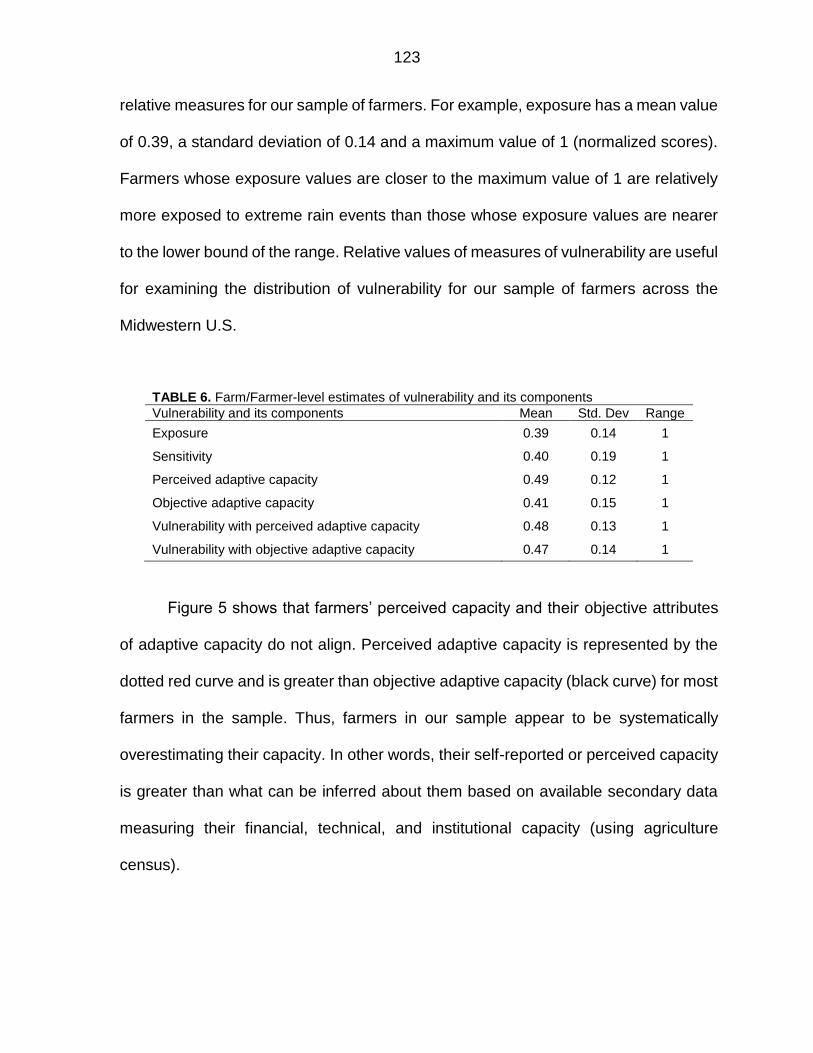
123
relative measures for our sample of farmers. For example, exposure has a mean value
of 0.39, a standard deviation of 0.14 and a maximum value of 1 (normalized scores).
Farmers whose exposure values are closer to the maximum value of 1 are relatively
more exposed to extreme rain events than those whose exposure values are nearer
to the lower bound of the range. Relative values of measures of vulnerability are useful
for examining the distribution of vulnerability for our sample of farmers across the
Midwestern U.S.
TABLE 6. Farm/Farmer-level estimates of vulnerability and its components
Vulnerability and its components Mean Std. Dev Range
Exposure 0.39 0.14 1
Sensitivity 0.40 0.19 1
Perceived adaptive capacity 0.49 0.12 1
Objective adaptive capacity 0.41 0.15 1
Vulnerability with perceived adaptive capacity 0.48 0.13 1
Vulnerability with objective adaptive capacity 0.47 0.14 1
Figure 5 shows that farmers’ perceived capacity and their objective attributes
of adaptive capacity do not align. Perceived adaptive capacity is represented by the
dotted red curve and is greater than objective adaptive capacity (black curve) for most
farmers in the sample. Thus, farmers in our sample appear to be systematically
overestimating their capacity. In other words, their self-reported or perceived capacity
is greater than what can be inferred about them based on available secondary data
measuring their financial, technical, and institutional capacity (using agriculture
census).
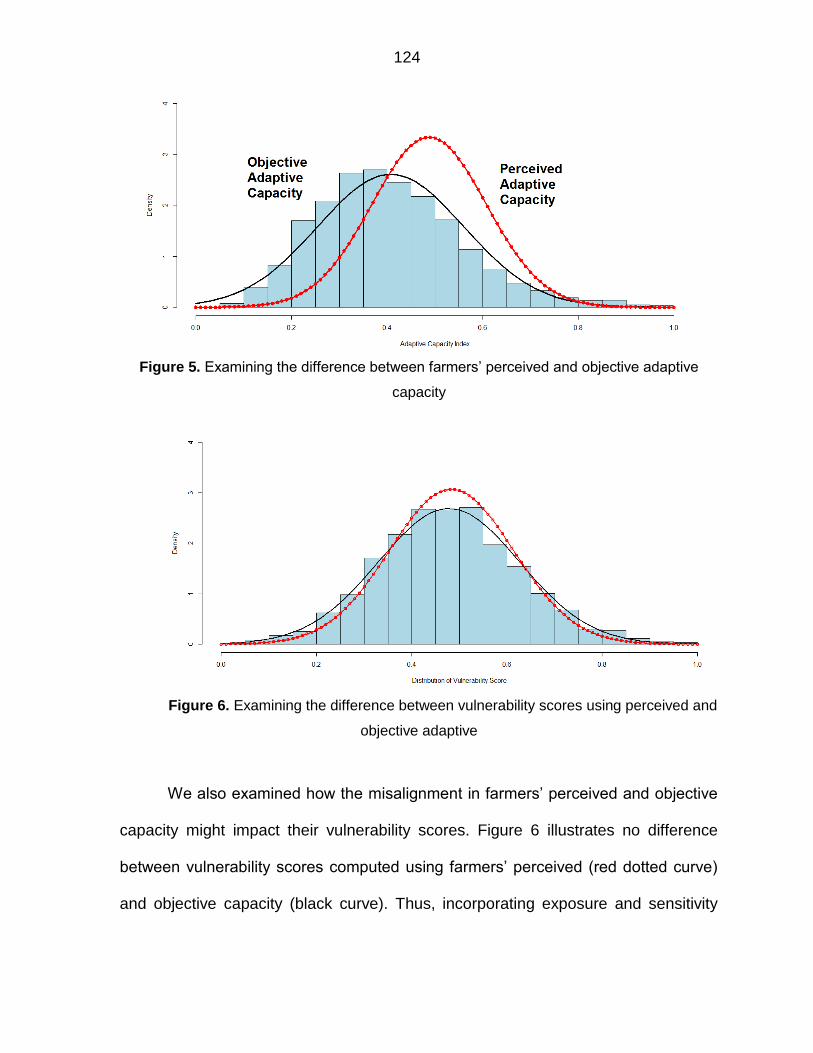
124
Figure 5. Examining the difference between farmers’ perceived and objective adaptive
capacity
Figure 6. Examining the difference between vulnerability scores using perceived and
objective adaptive
We also examined how the misalignment in farmers’ perceived and objective
capacity might impact their vulnerability scores. Figure 6 illustrates no difference
between vulnerability scores computed using farmers’ perceived (red dotted curve)
and objective capacity (black curve). Thus, incorporating exposure and sensitivity

125
reduced the computed differences between farmers’ vulnerability with perceived and
objective adaptive capacity scores.
Results of the county-level analysis
Figure 7 graphs the Moran’s I for county-level vulnerability indices using (1)
perceived adaptive capacity (I = .40) and (2) objective adaptive capacity (I = .43). The
results of the Moran plot suggest that neighboring counties have similar vulnerability
values, i.e., the pattern is clustered. A Monte-Carlo estimate of the p-value is
calculated to ensure consistency in results and spatial autocorrelation is confirmed in
this dataset.
Figure 7. Moran plots for vulnerability index with perceived adaptive capacity (left),
vulnerability index with objective adaptive capacity (right)
Figure 8 illustrates the county-level vulnerability scores obtained after spatial
smoothing average vulnerability score in each county. The smoothed values of
county-level vulnerability are the sum of non-spatial and spatial fitted values,
including contributions from spatial neighbors. Vulnerability scores computed using
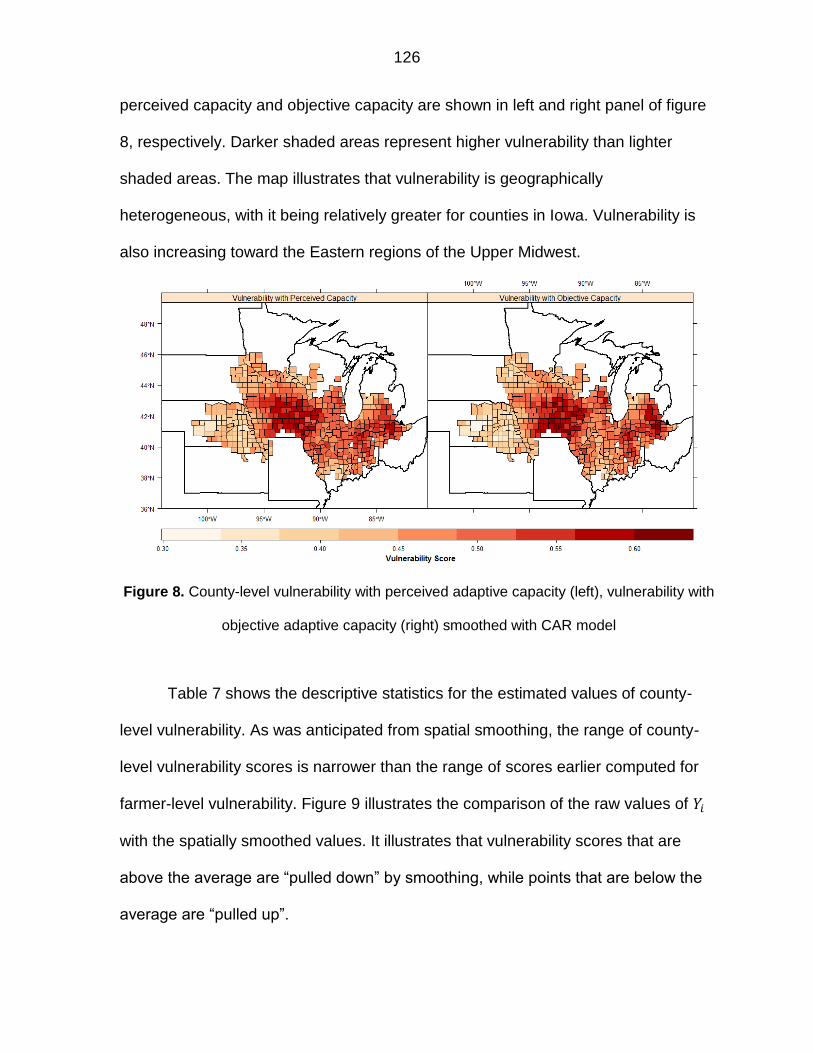
126
perceived capacity and objective capacity are shown in left and right panel of figure
8, respectively. Darker shaded areas represent higher vulnerability than lighter
shaded areas. The map illustrates that vulnerability is geographically
heterogeneous, with it being relatively greater for counties in Iowa. Vulnerability is
also increasing toward the Eastern regions of the Upper Midwest.
Figure 8. County-level vulnerability with perceived adaptive capacity (left), vulnerability with
objective adaptive capacity (right) smoothed with CAR model
Table 7 shows the descriptive statistics for the estimated values of county-
level vulnerability. As was anticipated from spatial smoothing, the range of county-
level vulnerability scores is narrower than the range of scores earlier computed for
farmer-level vulnerability. Figure 9 illustrates the comparison of the raw values of 𝑌𝑖
with the spatially smoothed values. It illustrates that vulnerability scores that are
above the average are “pulled down” by smoothing, while points that are below the
average are “pulled up”.
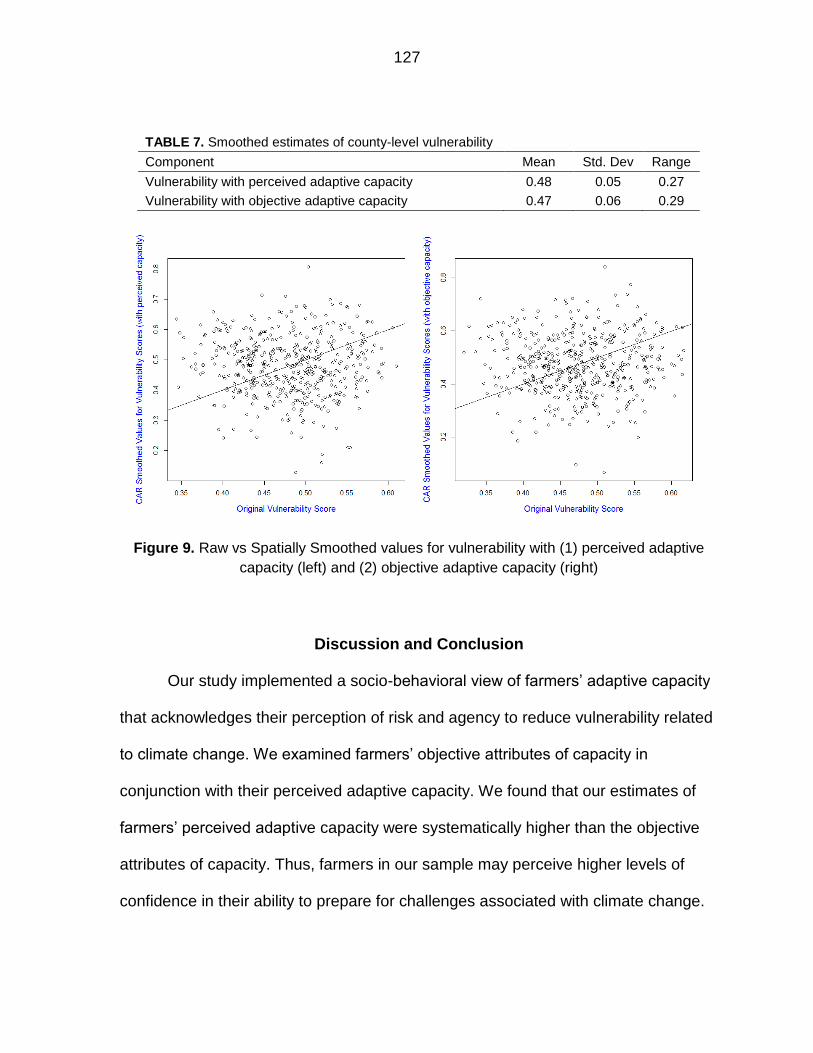
127
TABLE 7. Smoothed estimates of county-level vulnerability
Component Mean Std. Dev Range
Vulnerability with perceived adaptive capacity 0.48 0.05 0.27
Vulnerability with objective adaptive capacity 0.47 0.06 0.29
Figure 9. Raw vs Spatially Smoothed values for vulnerability with (1) perceived adaptive
capacity (left) and (2) objective adaptive capacity (right)
Discussion and Conclusion
Our study implemented a socio-behavioral view of farmers’ adaptive capacity
that acknowledges their perception of risk and agency to reduce vulnerability related
to climate change. We examined farmers’ objective attributes of capacity in
conjunction with their perceived adaptive capacity. We found that our estimates of
farmers’ perceived adaptive capacity were systematically higher than the objective
attributes of capacity. Thus, farmers in our sample may perceive higher levels of
confidence in their ability to prepare for challenges associated with climate change.
128
This finding is unique because it is often difficult to understand attitudes such as self-
confidence by only assessing objective attributes of adaptive capacity.
The primary implication of our findings is that vulnerability assessments
should take farmers’ perceived attributes of capacity into account. While objective
attributes of capacity, such as financial and technical resources, may be important
for adaptation, this research suggests that understanding of perceived adaptive
capacity is also necessary for evaluation of farmers’ overall adaptability. In other
words, the culturally acceptable levels of actions that the farmer is willing to take for
climate change adaptation may depend on both objective and perceived adaptive
capacity. Our results suggest that farmers in the Midwestern U.S. may perceive that
they can overcome most threats associated with climate change, even when they
don’t possess adequate levels of resources to make structural or managerial
changes to their farm operation. In addition, objective attributes of adaptive capacity
may inadequately capture these complex socio-cultural and behavioral processes
associated with adaptation to climate change. Thus, our findings suggest that
perceived aspects of adaptive capacity should be considered in conjunction with
objective measures when assessing farmers’ vulnerability to climate change.
Our results may be of interest to policy makers and extension educators.
Such stakeholders could look to our county-level estimates of vulnerability to inform
engagement strategies for improving environmental sustainability in the region.
These agencies can use the result of this research to engage more effectively with
farmers. For example, we have identified counties in the Midwestern U.S. that are
129
vulnerable to extreme rain events. Extension educators could use our maps to target
their communication strategies toward these regions.
The results of this research also point to potential shortcomings in official data
collection. If, as our results suggest, farmers’ perceived adaptive capacity is greater
than their actual, objective capacity to adapt to climate change, this could have
substantial ramifications for the agricultural sector as policy and programs seek to
increase adaptive capacity. Although our approach has limitations, primarily
associated with sparseness of data, the results suggest that government agencies
and other data collection organizations might consider including questions about
agency, risk perceptions, and perceived capacity in large-scale surveys, such as the
agriculture census. Such questions may improve our understanding of the complex
behavioral processes influencing farmers’ (and other groups’) decisions to cope,
adapt or ignore climate change-related risks.
One limitation of our research is that we are examining vulnerability as a
linear combination of exposure, sensitivity, and adaptive capacity (perceived or
objective). Future research might examine interactions between the components of
vulnerability. For example, farmland with a higher potential for soil erosion
(sensitivity) may be more drastically harmed by frequent and extreme rainfall events
(exposure). Similarly, a farm's (or farmer's) sensitivity to heavy rain events can be
mediated by their objective attributes of capacity, such as the amount of crop
insurance available to them. An in-depth examination of vulnerability should highlight
the complex interactions between exposure, sensitivity, and adaptive capacity.
130
Moreover, as importantly highlighted in this study, there is a need to disaggregate
adaptive capacity to study both its perceived and objective dimensions.
References
Abendroth, L.J., Elmore, R.W., Boyer, M.., Marlay, S.K., 2011. Corn growth and development.
Adger, W.N., 2006. Vulnerability. Glob. Environ. Chang. 16, 268–281.
doi:10.1016/j.gloenvcha.2006.02.006 Adger, W.N., 2003. Social aspects of adaptive capacity. Clim. Chang. Adapt.
Capacit. Dev. 29–50. doi:10.1142/9781860945816_0003 Arbuckle, J.G., Prokopy, L.S., Haigh, T., Hobbs, J., Knoot, T., Knutson, C., Loy, A.,
Mase, A.S., McGuire, J., Morton, L.W., Tyndall, J., Widhalm, M., 2013. Climate change beliefs, concerns, and attitudes toward adaptation and mitigation among farmers in the Midwestern United States. Clim. Change 117, 943–950. doi:10.1007/s10584-013-0707-6
Arbuckle Jr., J.G., Helmers, M., Liebman, M., Schulte, L., 2011. From vulnerability to
resiliency: Iowa agriculture in the age of biorenewables. Arritt, R., 2016. Climate Change in the Corn Belt. Resilient Agric. Berkes, F., Jolly, D., 2002. Adapting to climate change: Social-ecological resilience
in a Canadian western arctic community. Ecol. Soc. 5. doi:18 Bierbaum, R., Lee, A., Smith, J., Blair, M., Carter, L.M., Chapin, F.S., Fleming, P.,
Ruffo, S., McNeeley, S., Stults, M., Verduzco, L., Seyller, E., 2014. Ch. 28: Adaptation. Clim. Chang. Impacts United States Third Natl. Clim. Assess. 670–706. doi:10.7930/J07H1GGT.On
Bivand, R.S., Pebesma, E.J., Gómez-Rubio, V., 2013. Applied Spatial Data Analysis
with R, Use R. doi:10.1007/978-0-387-78171-6 Brinkman, H., Hendrix, C.S., 2011. Food Insecurity and Violent Conflict : Causes ,
Consequences , and Addressing the Challenges. Challenges 1–28.
131
Brooks, N., Adger, W.N., Kelly, P.M., 2005. The determinants of vulnerability and adaptive capacity at the national level and the implications for adaptation. Glob. Environ. Chang. 15, 151–163. doi:10.1016/j.gloenvcha.2004.12.006
Brown, K., Westaway, E., 2011. Agency, Capacity, and Resilience to Environmental
Change: Lessons from Human Development, Well-Being, and Disasters. Annu. Rev. Environ. Resour. 36, 321–342. doi:10.1146/annurev-environ-052610-092905
Coumou, D., Rahmstorf, S., 2012. A decade of weather extremes. Nat. Clim. Chang.
2, 491–496. doi:10.1038/Nclimate1452 Cutter, S.L., 2006. Moral Hazard, Social Catastrophe: The Changing Face of
Vulnerability along the Hurricane Coasts. Ann. Am. Acad. Pol. Soc. Sci. 604, 102–112. doi:10.1177/0002716205285515
Dow, K., Berkhout, F., Preston, B.L., 2013. Limits to adaptation to climate change: A
risk approach. Curr. Opin. Environ. Sustain. doi:10.1016/j.cosust.2013.07.005 Eakin, H., 2014. The “turn to capacity”in vulnerability researchitle. Appl. Stud. Clim.
Adapt. 225–230. Eakin, H., York, A., Aggarwal, R., Waters, S., Welch, J., Rubiños, C., Smith-
Heisters, S., Bausch, C., Anderies, J.M., 2016. Cognitive and institutional influences on farmers’ adaptive capacity: insights into barriers and opportunities for transformative change in central Arizona. Reg. Environ. Chang. 16, 801–814. doi:10.1007/s10113-015-0789-y
Engle, N.L., Lemos, M.C., 2010. Unpacking governance: Building adaptive capacity
to climate change of river basins in Brazil. Glob. Environ. Chang. 20, 4–13. doi:10.1016/j.gloenvcha.2009.07.001
FAOSTAT, 2015. Crop Production Database. Food and Agriculture Organization
Statistics Division [WWW Document]. URL http://faostat3.fao.org/browse/Q/QC/E.
Grothmann, T., Patt, A., 2005. Adaptive capacity and human cognition: The process
of individual adaptation to climate change. Glob. Environ. Chang. 15, 199–213. doi:10.1016/j.gloenvcha.2005.01.002
Hafner-Burton, E.M., Montgomery, A.H., 2006. Power Positions: International
Organizations, Social Networks, and Conflict. J. Conflict Resolut. 50, 3–27. doi:10.2307/27638473

132
Hahn, M.B., Riederer, A.M., Foster, S.O., 2009. The Livelihood Vulnerability Index: A pragmatic approach to assessing risks from climate variability and change-A case study in Mozambique. Glob. Environ. Chang. 19, 74–88. doi:10.1016/j.gloenvcha.2008.11.002
Hatfield, J., Takle, G., Grotjahn, R., Holden, P., Izaurralde, R.C., Mader, T.,
Marshall, E., Liverman, D., 2014. Agriculture, in: Climate Change Impacts in the United States: The Third National Climate Assessment. pp. 150–174. doi:10.7930/J02Z13FR
Hicks, C.C., Levine, A., Agrawal, A., Basurto, X., Breslow, S.J., Carothers, C.,
Charnley, S., Coulthard, S., Dolsak, N., Donatuto, J., Garcia-Quijano, C., Mascia, M.B., Norman, K., Poe, M.R., Satterfield, T., St. Martin, K., Levin, P.S., 2016. Engage key social concepts for sustainability. Science (80-. ). 352, 38–40. doi:10.1126/science.aad4977
Howden, S.M., Soussana, J.-F., Tubiello, F.N., Chhetri, N., Dunlop, M., Meinke, H.,
2007. Adapting agriculture to climate change. Proc. Natl. Acad. Sci. 104, 19691–19696. doi:10.1073/pnas.0701890104
Karl, T.R., Melillo, J.M., Peterson, T.C., 2009. Global Climate Change Impacts in the
United States, Society. Kaspar, T.C., Jaynes, D.B., Parkin, T.B., Moorman, T.B., Singer, J.W., 2012.
Effectiveness of oat and rye cover crops in reducing nitrate losses in drainage water. Agric. Water Manag. 110, 25–33. doi:10.1016/j.agwat.2012.03.010
Kremen, C., Miles, A., 2012. Ecosystem services in biologically diversified versus
conventional farming systems: Benefits, externalities, and trade-offs. Ecol. Soc. doi:10.5751/ES-05035-170440
Lal, R., Delgado, J. a., Groffman, P.M., Millar, N., Dell, C., Rotz, a., 2011.
Management to mitigate and adapt to climate change. J. Soil Water Conserv. 66, 276–285. doi:10.2489/jswc.66.4.276
Liang, X.-Z., Wu, Y., Chambers, R.G., Schmoldt, D.L., Gao, W., Liu, C., Liu, Y.-A.,
Sun, C., Kennedy, J.A., 2017. Determining climate effects on US total agricultural productivity. Proc. Natl. Acad. Sci. 201615922. doi:10.1073/pnas.1615922114
Loy, A., Hobbs, J., Arbuckle Jr, J.G., Morton, L.W., Prokopy, L.S., Haigh, T., ... &
Tyndall, J., 2013. Farmer perspectives on agriculture and weather variability in the Corn Belt: A statistical atlas.
Marshall, N.A., Marshall, P.A., 2007. Conceptualizing and operationalizing social
resilience within commercial fisheries in northern Australia. Ecol. Soc. 12. doi:1
133
McCarl, B.A., 2010. Analysis of climate change implications for agriculture and
forestry: An interdisciplinary effort. Clim. Change 100, 119–124. doi:10.1007/s10584-010-9833-6
Mitsch, W.J., Day, J.W., Gilliam, J.W., Groffman, P.M., Hey, D.L., Randall, G.W.,
Wang, N., 2001. Reducing Nitrogen Loading to the Gulf of Mexico from the Mississippi River Basin: Strategies to {…}. Bioscience 51, 373–388. doi:10.1641/0006-3568(2001)051[0373:RNLTTG]2.0.CO;2
Morton, L.W., Hobbs, J., Arbuckle, J.G., Loy, A., 2015. Upper midwest climate
variations: farmer responses to excess water risks. J. Environ. Qual. 44, 810–22. doi:10.2134/jeq2014.08.0352
Moser, C., Stauffacher, M., Blumer, Y.B., Scholz, R.W., 2014. From risk to
vulnerability: the role of perceived adaptive capacity for the acceptance of contested infrastructure. J. Risk Res. 9877, 1–15. doi:10.1080/13669877.2014.910687
Moser, S.C., Kasperson, R.E., Yohe, G., Agyeman, J., 2008. Adaptation to climate
change in the Northeast United States: Opportunities, processes, constraints. Mitig. Adapt. Strateg. Glob. Chang. 13, 643–659. doi:10.1007/s11027-007-9132-3
Nelson, D.R., Adger, W.N., Brown, K., 2007. Adaptation to Environmental Change:
Contributions of a Resilience Framework. Annu. Rev. Environ. Resour. 32, 395–419. doi:10.1146/annurev.energy.32.051807.090348
Parry, M.L., Canziani, O.F., Palutikof, J.P., van der Linden, P.J., Hanson, C.E.,
2007. IPCC, 2007: Summary for Policymakers, in: Climate Change 2007: Impacts, Adaptation and Vulnerability. Contribution ofWorking Group II to the Fourth Assessment Report of the Intergovernmental Panel on Climate Change. pp. 7–22. doi:10.2134/jeq2008.0015br
Preston, B.L., Yuen, E.J., Westaway, R.M., 2011. Putting vulnerability to climate
change on the map: A review of approaches, benefits, and risks. Sustain. Sci. doi:10.1007/s11625-011-0129-1
Qi, Z., Helmers, M.J., Christianson, R.D., Pederson, C.H., 2011. Nitrate-nitrogen
losses through subsurface drainage under various agricultural land covers. J. Environ. Qual. 40, 1578–85. doi:10.2134/jeq2011.0151
Rabalais, N.N., 2006. Oxygen depletion in the gulf of Mexico adjacent to the
Mississippi river. Gayana (Concepción) 70, 225–245. doi:10.1007/1-4020-4297-3_09
134
Reimer, A.P., Weinkauf, D.K., Prokopy, L.S., 2012. The influence of perceptions of practice characteristics: An examination of agricultural best management practice adoption in two indiana watersheds. J. Rural Stud. 28, 118–128. doi:10.1016/j.jrurstud.2011.09.005
Rockström, J., Steffen, W., Noone, K., Persson, Å., Chapin, F.S., Lambin, E.,
Lenton, T.M., Scheffer, M., Folke, C., Schellnhuber, H.J., Nykvist, B., de Wit, C.A., Hughes, T., van der Leeuw, S., Rodhe, H., Sörlin, S., Snyder, P.K., Costanza, R., Svedin, U., Falkenmark, M., Karlberg, L., Corell, R.W., Fabry, V.J., Hansen, J., Walker, B., Liverman, D., Richardson, K., Crutzen, P., Foley, J., 2009. Planetary boundaries: Exploring the safe operating space for humanity. Ecol. Soc. 14. doi:10.1038/461472a
Schnepf, M., Cox, C., 2006. Environmental benefits of conservation on cropland: the
status of our knowledge. Soil and Water Conservation Society. Seara, T., Clay, P.M., Colburn, L.L., 2016. Perceived adaptive capacity and natural
disasters: A fisheries case study. Glob. Environ. Chang. 38, 49–57. doi:10.1016/j.gloenvcha.2016.01.006
Smit, B., Pilifosova, O., Burton, I., Challenger, B., Huq, S., Klein, R.J.T., Yohe, G.,
Adger, W.N., Downing, T., Harvey, E., Kane, S., Parry, M., Skinner, M., Smith, J., Wandel, J., 2001. Adaptation to Climate Change in the Context of Sustainable Development and Equity, in: Climate Change 2001: Impacts, Adaptation and Vulnerability. Contribution of Working Group II to the Third Assessment Report of the Intergovernmental Panel on Climate Change. pp. 879–906.
Swanson, D.A., Hiley, J.C., Venema, H.D., R. Grosshans, 2009. Indicators of
Adaptive Capacity to Climate Change for Agriculture in the Prairie Region of Canada: Comparison with Field Observations. Working Paper for the Prairie Climate Resilience Project, Winnipeg 31.
Todey, D., 2014. Climate Change Impacts in the Corn Belt. Resilient Agric. 8–9. Turner, B.L., 2010. Vulnerability and resilience: Coalescing or paralleling
approaches for sustainability science? Glob. Environ. Chang. 20, 570–576. doi:10.1016/j.gloenvcha.2010.07.003
Turner, B.L., Kasperson, R.E., Matson, P.A., McCarthy, J.J., Corell, R.W.,
Christensen, L., Eckley, N., Kasperson, J.X., Luers, A., Martello, M.L., Polsky, C., Pulsipher, A., Schiller, A., 2003. A framework for vulnerability analysis in sustainability science. Proc Natl Acad Sci U S A 100, 8074–8079. doi:10.1073/pnas.1231335100
135
USDA-NASS, 2015. Quick-Stats [WWW Document]. URL http://quickstats.nass.usda.gov/#C5600DC7-112D-345FBD43-1C73E0E4F539.
van Buuren, S., Groothuis-Oudshoorn, K., 2011. Multivariate Imputation by Chained
Equations in R. J. Stat. Softw. 45, 1–67. Vermunt, J., Magidson, J., 2003. Latent class models for classiffication. Comput.
Stat. Data Anal. 41, 531–537. doi:10.1016/S0167-9473(02)00179-2 Walthall, C.L., Hatfield, J., Backlund, P., Lengnick, L., Marshall, E., Walsh, M.,
Adkins, S., Aillery, M., Ainsworth, E.A., Ammann, C., Anderson, C.J., Bartomeus, I., Baumgard, L.H., Booker, F., Bradley, B., Blumenthal, D.M., Bunce, J., Burkey, K., Dabney, S.M., Delgado, J.A., Dukes, J., Funk, A., Garrett, K., Glenn, M., Grantz, D.A., Goodrich, D., Hu, S., Izaurralde, R.C., Jones, R.A.C., Kim, S.-H., Leaky, A.D.B., Lewers, K., Mader, T.L., McClung, A., Morgan, J., Muth, D.J., Nearing, M., Oosterhuis, D.M., Ort, D., Parmesan, C., Pettigrew, W.T., Polley, W., Rader, R., Rice, C., Rivington, M., Rosskopf, E., Salas, W.A., Sollenberger, L.E., Srygley, R., Stöckle, C., Takle, E.S., Timlin, D., White, J.W., Winfree, R., Wright-Morton, L., Ziska, L.H., 2012. Climate Change and Agriculture: Effects and Adaptation. Washington, DC.
Yohe, G., Tol, R.S.J., 2002. Indicators for social and economic coping capacity F moving toward a working definition of adaptive capacity. Glob. Environ. Chang. 12, 25–40.
136
CHAPTER 5. GENERAL DISCUSSION
This dissertation highlights the importance of social and behavioral drivers in
determining farmers’ attitudinal and behavioral support for using adaptive
management practices. We were able to highlight an important lacuna in existing
research on agricultural adaptation to climate change: farmers’ perceived capacity
can be consequential for their climate change decision making. Various dimensions
of perceived capacity were assessed, including (1) ideological, (2) perceived
efficacy, and (3) perceived effectiveness of exogenous factors such as institutional
support. Each chapter examined some aspect of the overall adaptive capacity and
evaluated its effectiveness for policy making and outreach.
In chapter 2, we wanted to study whether an abstract faith in human
ingenuity, often characterized in conventional agriculture by greater confidence in
science and technology, could encourage or impede farmers’ support for adaptation.
We identified this worldview as “techno-optimism”. In the Midwestern U.S.
agriculture, adoption of technology, such as synthetic inputs and genetically modified
seeds have enabled Midwestern farmers to increase their profitability in a commodity
crop market where farmers are price-taker (they cannot influence price by their
supply). Most farmers increase their farm profitability through enhancements in crop
yield and by expanding to more acres of crop land—often requiring aggressive
adoption of new technology. We wanted to examine whether greater dependence on
technology is causing higher levels of “techno-optimism” among conventional
farmers and influencing their support for climate change adaptation.
137
We identified two dimensions of perceived capacity: (1) ideological or
“techno-optimism” and (2) personal belief about capacity or perceived efficacy. The
path models empirically found that both types of capacity (ideological and personal)
could diminish farmers’ support for adaptation and cause them delay decisions
regarding adaptation. The results from this study suggest that outreach activities
should focus on the scientific and technological properties of adaptive management
practices. This might make such management practices more attractive to
conventional farmers’ who hold a techno-optimistic worldview.
In chapter 3, we introduced additional characteristics of perceived adaptive
capacity, including centrality in social networks, decision constraints, and learning
and experimenting. We found that these dimensions of capacity were as much
important as the material resources needed by farmers for using adaptive
management practices. We also studied whether institutional conditions, such as
government payments and direct payments could encourage farmers to use more
soil and water conservation practices, such as cover crops. Our study found that
instead of supporting farmers to engage in adaptation, farm subsidies can diminish
farmers’ adoption of cover crops. This finding suggests the need to closely examine
the role of government support in influencing farmers’ use of adaptive management
practices.
In chapter 4, we found three very interesting findings. First, farmers’
perceived adaptive capacity were systematically higher than their material or
objective adaptive capacity. This means that if we were to only include objective
indicators of capacity, our results would have overestimated farmers’ vulnerability. It
138
also implied that farmers may be less prepared to manage risks than what they
perceive. Second, by including perceived attributed of capacity we could understand
the culturally acceptable levels of adaptive actions that farmers were willing to
undertake. In other words, there is a need to explain this mismatch between
perceived and objective attributes of capacity. We suggest that future research
should identify whether the socioeconomic and demographic trends in Midwestern
counties could explain why some farmers are over-or under-estimating their
capacity. Finally, we did not settle with computing farmer level score of
vulnerabilities. Instead, we aggregated farmer scores to county level. Our estimates
of county level vulnerability can be useful for agencies that are trying to engage
more effectively with farmers. We found evidence of a misalignment between
objective and perceived capacity at the country level and propose that government
agencies can include questions about farmers’ perceived capacity in large-scale
surveys, such as the agriculture census to adequately capture these complex
behavioral processes.
139
APPENDIX GLOSSARY OF KEY TERMS
Coupled human-natural systems: Coupled human-natural systems or social-
ecological systems (SES) are groups of related social and environmental parts that
are nested at multiple levels and “that provide essential services to society such as
supply of food, fiber, energy, and drinking water (Binder et al., 2013, p. 26).” Human
and environmental systems can be established at multiple scales as a nested set of
arrangements from the local scale through regional and national and so forth (Damm,
2010).
Human systems: The human systems include a range of interconnected
actors and institutions, such as people, societal processes, organizations, and
networks (Binder et al., 2013). These actors and institutions operate at multiple scales
i.e. they interact with other social and ecological systems at the individual, community,
sub-national, national and international scales. For example, in agriculture, the social
or human scale can range from the farmer to his or her social network.
Natural systems: The natural systems include the various biotic and abiotic
components of the environment that interact with one another at multiple geographical
and temporal scales (Damm, 2010). In the case of agriculture, the environmental
scale can range from a single plant to the existence of large ecological community of
plants and animals.
Risk: Risk represents a potential negative consequence that may arise from
some process, activity, or event (Cox and Thompson, 2015). Risks are usually
evaluated in relation to some reference values, such as protecting livelihoods, human
health, environmental and social sustainability. For example, the Risk Management
140
Agency (RMA) of the United States Department of Agriculture (USDA) defines risk as
the consequential effect on farm income volatility from ecological and market-driven
events (USDA, 2011). Thus, risk is usually defined in relation to some unfavorable
consequences, where consequences are often viewed within the context of protecting
some individual and societal values (Cox and Thompson, 2015).
Uncertainty: Uncertainty is often defined in a probabilistic sense to explain a
decision-maker’s knowledge about the future consequences of an activity (Blau, 1964;
Frederiksen, 2014). Uncertainty is frequently a result of incomplete or imperfect
knowledge available to decision makers about a possible risky event (Taylor, 2003).
Decision-maker: Decision-makers are defined as individuals who are actively
involved in “management of an establishment” (Slovic, 2000, p. 1). Thus, decision
maker is used synonymously with ‘farmer’ or ‘farm manager’.
Establishment: Establishment is defined as a unique areal entity, such as a
farm that serves a distinct purpose.
Event: Event is a specified change of the state from the normal. Such as an
extreme precipitation event.
Extreme precipitation events: Extreme precipitation events are described as
events with more than four inches (101.6 millimeters) of rain in a 24-hour period
(Todey, 2014).
Exposure: Exposure is broadly defined as the physically defined climate-
related hazard to a system (Brooks et al., 2005). In relation to the impact of climate
change on conventional agriculture in the Upper Midwest, one measure of exposure
is the likelihood of the farm enterprise experiencing an extreme precipitation event. In
141
the Upper Midwestern U.S., extreme rain events are among the most hazardous forms
of climate change-related weather extremes affecting conventional farming (Morton et
al. 2015). In this region, the frequency of days with heavy precipitation has increased
by almost 50% in the entire 20th century (Arritt, 2016). Moreover, climate observations
and predictions depict an increase in heavy precipitation events for the Upper Midwest
in the next 30 to 50 years (Arritt, 2016; Karl et al., 2009; Todey, 2014).
Sensitivity: Sensitivity is the vulnerability component that describes the
internal state of the system. The intergovernmental Panel on Climate Change (IPCC)
defines sensitivity as the “degree to which a system is affected, either adversely or
beneficially, by climate-related stimuli” (McCarthy et al., 2001, p. 6). Sensitivity is
generally conceptualized as the mutual interaction between the human condition and
the environmental condition (Turner et al., 2003). The human condition includes a
range of actors and institutions, such as people, societal processes, and decisions.
The environmental condition includes the various biotic and abiotic components that
interact with one another at a given place. Sensitivity emerges from the iterative
interactions between the human and environmental conditions. In the case of climate
change and conventional agriculture in the Upper Midwest, one measure of sensitivity
is the likely magnitude of effect an extreme rainfall event will have on the farm
enterprise.
Adaptive capacity: The Intergovernmental Panel on Climate Change (IPCC)
defines adaptive capacity as the “ability of a system to adjust to climate change to
moderate potential damages, to take advantage of opportunities, or to cope with the
consequences” (IPCC 2007). Adaptive capacity represents the main social
142
mechanisms for reducing vulnerability and regulation system resilience (Engle and
Lemos, 2010). It includes three distinct, but related, part: a resource system, the ability
of individuals to access those resources, and the governance system that structures
and mediates the management of resources and systems of access (Nelson et al.,
2007). In the case of climate change and agriculture, farmers’ adaptive capacity is
their ability to cope, adapt, and respond to the negative effects of climate change.
Vulnerability: Vulnerability is a function of the exposure and sensitivity to
climate change as well as the adaptive capacity of social-ecological systems to cope
and adapt to climate change (Adger, 2006; Brooks et al., 2005; Parry et al., 2007). In
relation to climate change and conventional agriculture, vulnerability is dependent
both on the farm-level risks associated with climate change as well as the adaptive
capacities of decision-makers (i.e. farmers) to mediate these risks.
Resilience: Resilience is the ability of social-ecological systems to cope, adapt
and respond to change (Folke, 2006). Some properties of resilient socio-ecological
systems include, adaptability, flexibility and preparedness for change and uncertainty
(Eakin et al., 2016; Gunderson, 1999; Hughes et al., 2005). Specifically, three system
characteristics are at the core of resilience theory: (1) the amount of disturbance a
system can absorb while retaining its original structure and function, (2) the capability
of the system to self-organize, and (3) the degree to which the system can build the
capacity for adaptation and learning (Carpenter and Gunderson, 2001; Folke, 2006;
Holling, 1973).
Objective adaptive capacity: Objective adaptive capacity focuses on the
external dimensions of adaptive capacity, i.e. “the material and immaterial resources
143
and the assets and entitlements that predetermine the decision options available to
an actor at any point in time to cope with losses and to anticipate future harm” (Eakin,
2014, p. 228). Thus, objective adaptive capacity links individuals or societies ability to
adapt to change with the overall availability of financial, technical, and institutional
resources. Studies that investigate and model the interaction between the social and
the ecological systems often assume that individuals will have more opportunities to
cope, adapt, and respond to the negative effects of climate change if they have
adequate access to financial resources, knowledge, and suitable institutional
arrangements (Adger, 2003; Smit and Wandel, 2006).
Perceived adaptive capacity: Perceived adaptive capacity is the internal
dimension of adaptive capacity, i.e. the individual’s perception of the suitability of
available resources (financial, technical, institutional, etc) needed for facilitating
adaptation (Eakin et al., 2016; Grothmann and Patt, 2005; Seara et al., 2016). In other
words, perceived adaptive capacity highlights “…the extent to which people feel they
are prepared to endure changes or impacts and undertake steps to cope with them”
(Seara et al., 2016).
Perceived technical capacity: Perceived technical capacity describes
farmers’ self-assessments of their technical abilities to respond to climate change and
can be dependent upon farmers’ perception of possessing an adequate and
accessible technological and knowledge system.
Risk perceptions: Risk perceptions are a person’s subjective judgement or
appraisal of risk (SRA Glossary), i.e. it is how risk and uncertainty are perceived. Risk
perceptions are socially constructed and various factors such as past experiences of
144
natural hazard, self-efficacy, and emotions can influence peoples’ decisions about
both the significance of risks and the willingness to take actions to cope, adapt or
ignore such risks (Feldman et al., 2014; Weber and Stern, 2011).
Intention to Adapt: Attitudes are defined as the “degree to which a person has
favorable or unfavorable evaluation or appraisal of the behavior in question” (Ajzen,
1991, p. 10). Attitudes are often assessed directly in relation to a specific behavior.
For example, in the case of farmers’ conservation practice adoption, pro-
environmental attitudes have been found to be important predictors of behavioral
intentions (Prokopy et al., 2008). Similarly, farmers’ intention to adapt to climate
change is indicative of adaptive behavior (Arbuckle et al., 2013a; Hyland et al., 2015).
Decision-delay: ‘Decision-delay’ is a common response to threats that may be
well-known to people, but are perceived to pose no immediate risks (Anderson, 2003).
This is a psychological phenomenon in which, rather than deciding on and preparing
for risky scenarios ahead of time, people delay decisions and instead prefer to wait
and see (McNeill et al. 2015).
Techno-optimism: In modern industrialized societies, techno-optimism is the
dominant common sense belief that the less beneficial legacies of the capitalist
economic growth model, such as over-production, social inequality, and
environmental degradation, can be solved or eliminated through greater technological
innovation. Barry (2012) defines techno-optimism as “an exaggerated and
unwarranted belief in human technological abilities to solve problems of
unsustainability while minimizing or denying the need for large-scale social, economic
and political transformation” (Barry, 2012, p. 108). Techno-optimists have unlimited
145
confidence or faith in human ingenuity, including the ability of science and technology
to solve socio-environmental problems, such as using geoengineering technologies
as solutions to climate change (Hulme, 2014). Thus, techno-optimism is a belief that
technological innovation can by itself lead to a sustainable society or world.
Trust (expert): Trust in experts can be defined as a “disposition willingly to rely
on another person or entity to perform a given action or protect oneself or one’s
interest in a given domain” (Nickel and Vaesen, 2012, p. 860). Applied decision theory
posits that a rational decision-maker chooses to trust an expert after carefully
quantifying risks and assessing the trustworthiness of the expert (Nickel and Vaesen,
2012). According to such reasoning, actors trust experts through a rational calculation
of the latter’s knowledge, skills, experience, and intentions (Earle, 2010). However,
scholars in the field of socio-cultural and cognitive studies argue that people’s trust in
authority does not have to depend on an extensive calculation of the benefits and
costs of trusting experts. Most people do not have time, money, and knowledge, to
conduct a rigorous risk assessment of the trust situation. Instead, people rely on their
emotions, intelligence, and experience to guide their judgment about trusting experts
(Hardin, 1991; Uslaner, 2008; Yamagishi, 2001).
References
Adger, W.N., 2006. Vulnerability. Glob. Environ. Chang. 16, 268–281. doi:10.1016/j.gloenvcha.2006.02.006
Adger, W.N., 2003. Social aspects of adaptive capacity. Clim. Chang. Adapt.
Capacit. Dev. 29–50. doi:10.1142/9781860945816_0003 Ajzen, I., 1991. The theory of planned behavior. Organ. Behav. Hum. Decis.
Process. 50, 179–211. doi:10.1016/0749-5978(91)90020-T
146
Anderson, C.J., 2003. The psychology of doing nothing: forms of decision avoidance
result from reason and emotion. Psychol. Bull. 129, 139–167. doi:10.1037/0033-2909.129.1.139
Arbuckle, J.G., Morton, L.W., Hobbs, J., 2013. Farmer beliefs and concerns about
climate change and attitudes toward adaptation and mitigation: Evidence from Iowa. Clim. Change 118, 551–563. doi:10.1007/s10584-013-0700-0
Arritt, R., 2016. Climate Change in the Corn Belt. Resilient Agric. Barry, J., 2012. Bio-fuelling the Hummer? Transdisciplinary thoughts on techno-
optimism and innovation in the transition from unsustainability, in: Transdisciplinary Perspectives on Transitions to Sustainability. Routledge, p. 106.
Binder, C.R., Hinkel, J., Bots, P.W.G., Pahl-Wostl, C., 2013. Comparison of
frameworks for analyzing social-ecological systems. Ecol. Soc. 18. doi:10.5751/ES-05551-180426
Blau, P.M., 1964. Exchange and Power in Social Life, Exchange and Power in
Social Life. doi:10.2307/2091154 Brooks, N., Adger, W.N., Kelly, P.M., 2005. The determinants of vulnerability and
adaptive capacity at the national level and the implications for adaptation. Glob. Environ. Chang. 15, 151–163. doi:10.1016/j.gloenvcha.2004.12.006
Carpenter, S.R., Gunderson, L.H., 2001. Coping with Collapse: Ecological and
Social Dynamics in Ecosystem Management. Bioscience 51, 451. doi:10.1641/0006-3568(2001)051[0451:CWCEAS]2.0.CO;2
Cox, T., Thompson, K.M., 2015. SRA glossary. Soc. risk Anal. Comm. Found. risk
Anal. 1–16. Damm, M., 2010. Mapping Social-Ecological Vulnerability to Flooding. A Sub-
National Approach for Germany., Graduate Research Series. Eakin, H., 2014. The “turn to capacity”in vulnerability researchitle. Appl. Stud. Clim.
Adapt. 225–230. Eakin, H., York, A., Aggarwal, R., Waters, S., Welch, J., Rubiños, C., Smith-
Heisters, S., Bausch, C., Anderies, J.M., 2016. Cognitive and institutional influences on farmers’ adaptive capacity: insights into barriers and opportunities for transformative change in central Arizona. Reg. Environ. Chang. 16, 801–814. doi:10.1007/s10113-015-0789-y
147
Earle, T.C., 2010. Trust in risk management: A model-based review of empirical research. Risk Anal. doi:10.1111/j.1539-6924.2010.01398.x
Engle, N.L., Lemos, M.C., 2010. Unpacking governance: Building adaptive capacity
to climate change of river basins in Brazil. Glob. Environ. Chang. 20, 4–13. doi:10.1016/j.gloenvcha.2009.07.001
Feldman, L., Myers, T.A., Hmielowski, J.D., Leiserowitz, A., 2014. The mutual
reinforcement of media selectivity and effects: Testing the reinforcing spirals framework in the context of global warming. J. Commun. 64, 590–611. doi:10.1111/jcom.12108
Folke, C., 2006. Resilience: The emergence of a perspective for social-ecological
systems analyses. Glob. Environ. Chang. 16, 253–267. doi:10.1016/j.gloenvcha.2006.04.002
Frederiksen, M., 2014. Trust in the face of uncertainty: a qualitative study of
intersubjective trust and risk. Int. Rev. Sociol. 24, 130–144. doi:10.1080/03906701.2014.894335
Grothmann, T., Patt, A., 2005. Adaptive capacity and human cognition: The process
of individual adaptation to climate change. Glob. Environ. Chang. 15, 199–213. doi:10.1016/j.gloenvcha.2005.01.002
Gunderson, L., 1999. Resilience, flexibility and adaptive management - Antidotes for
spurious certitude? Ecol. Soc. 3. doi:10.5751/ES-00089-030107 Hardin, R., 1991. Trusting persons, trusting institutions, in: Zeckhauser, R. (Ed.),
Strategy and Choice. MIT Press, Cambridge, p. 185–209. Holling, C.S., 1973. Resilience and Stability of Ecological Systems. Annu. Rev. Ecol.
Syst. 4, 1–23. doi:10.1146/annurev.es.04.110173.000245 Hughes, T.P., Bellwood, D.R., Folke, C., Steneck, R.S., Wilson, J., 2005. New
paradigms for supporting the resilience of marine ecosystems. Trends Ecol. Evol. doi:10.1016/j.tree.2005.03.022
Hulme, M., 2014. Can Science Fix Climate Change: A Case Against Climate
Engineering. John Wiley Sons 10. Hyland, J.J., Jones, D.L., Parkhill, K.A., Barnes, A.P., Williams, A.P., 2015. Farmers’
perceptions of climate change: identifying types. Agric. Human Values. doi:10.1007/s10460-015-9608-9
Karl, T.R., Melillo, J.M., Peterson, T.C., 2009. Global Climate Change Impacts in the
United States, Society.
148
McCarthy, J., Canziani, O.F., Leary, N.A., Dokken, D.J., White, C., 2001. Climate
Change 2001: Impacts, Adaptation, and Vulnerability. Contribution of Working. Cambridge Univ. Press.
McNeill, I. M., Dunlop, P. D., Skinner, T. C., & Morrison, D.L., 2015. Predicting delay
in residents’ decisions on defending v. evacuating through antecedents of decision avoidance. Int. J. Wildl. Fire 24, 153–161.
Nelson, D.R., Adger, W.N., Brown, K., 2007. Adaptation to Environmental Change:
Contributions of a Resilience Framework. Annu. Rev. Environ. Resour. 32, 395–419. doi:10.1146/annurev.energy.32.051807.090348
Nickel, P.J., Vaesen, K., 2012. Risk and trust, in: In Handbook of Risk Theory.
Springer Netherlands, pp. 857–876. Parry, M.L., Canziani, O.F., Palutikof, J.P., van der Linden, P.J., Hanson, C.E.,
2007. IPCC, 2007: Summary for Policymakers, in: Climate Change 2007: Impacts, Adaptation and Vulnerability. Contribution ofWorking Group II to the Fourth Assessment Report of the Intergovernmental Panel on Climate Change. pp. 7–22. doi:10.2134/jeq2008.0015br
Prokopy, L.S., Floress, K., Klotthor-Weinkauf, D., Baumgart-Getz, a., 2008.
Determinants of agricultural best management practice adoption: Evidence from the literature. J. Soil Water Conserv. 63, 300–311. doi:10.2489/jswc.63.5.300
Seara, T., Clay, P.M., Colburn, L.L., 2016. Perceived adaptive capacity and natural
disasters: A fisheries case study. Glob. Environ. Chang. 38, 49–57. doi:10.1016/j.gloenvcha.2016.01.006
Slovic, P., 2000. The perception of risk, Risk, society, and policy series. Smit, B., Wandel, J., 2006. Adaptation, adaptive capacity and vulnerability. Glob.
Environ. Chang. 16, 282–292. doi:10.1016/j.gloenvcha.2006.03.008 Taylor, C.R., 2003. The Role of Risl versus the Role of Uncertainty in Economic
Systems. Agric. Syst. 75, 251–264. Todey, D., 2014. Climate Change Impacts in the Corn Belt. Resilient Agric. 8–9. Turner, B.L., Kasperson, R.E., Matson, P.A., McCarthy, J.J., Corell, R.W.,
Christensen, L., Eckley, N., Kasperson, J.X., Luers, A., Martello, M.L., Polsky, C., Pulsipher, A., Schiller, A., 2003. A framework for vulnerability analysis in sustainability science. Proc Natl Acad Sci U S A 100, 8074–8079. doi:10.1073/pnas.1231335100
149
USDA, 2011. Risk Management Glossary. Uslaner, E.M., 2008. Trust as a moral value. Handb. Soc. Cap. 101–121. Weber, E.U., Stern, P.C., 2011. Public understanding of climate change in the
United States. Am. Psychol. 66, 315–328. doi:10.1037/a0023253 Yamagishi, T., 2001. Trust as a form of social intelligence., in: Cook, K.S. (Ed.),
Trust in Society. The Russel Sage Foundation, New York, pp. 121–147.