Retention - DiVA - Simple search
68
Ekonomihögskolan Bachelor Thesis Växjö, January 2008 Retention ~ An explanatory study of Swedish employees in the financial sector regarding leadership style, remuneration and elements towards job satisfaction Authors: Linda Lindgren Sanna Paulsson Tutor: Anders Hytter Examinator: Richard Nakamura
Transcript of Retention - DiVA - Simple search

Ekonomihögskolan
Bachelor Thesis
Växjö, January 2008
Retention
~
An explanatory study of Swedish employees in the
financial sector regarding leadership style, remuneration
and elements towards job satisfaction
Authors: Linda Lindgren
Sanna Paulsson
Tutor: Anders Hytter
Examinator: Richard Nakamura
Abstract
Introduction: Companies today are forced to function in a world full of change and
complexity, and it is more important than ever to have the right employees in order to survive
the surrounding competition. It is a fact that a too high turnover rate affects companies in a
negative way and retention strategies should therefore be high on the agenda. When looking
at this problem area we found that there may be actions and tools that companies could use to
come to terms with this problem. Research told us that leadership, remuneration and elements
like participation, feedback, autonomy, fairness, responsibility, development and work-
atmosphere is important for job satisfaction and retention.
Object: The main objective is to increase the understanding regarding employee’s retention in
relation to leadership style, remuneration and elements such as participation, feedback,
autonomy, fairness, responsibility, development and work-atmosphere in the Swedish
financial sector.
Method: We wanted to investigate how employee of the Swedish financial sector prefers to
be retained, and how they consider and react to the chosen areas. The survey has a
quantitative approach with a web based questionnaire and includes 129 respondents from
banks, insurance and finance companies. The theoretical framework includes leadership and
leadership style, financial as well as non-financial remuneration and research done in later
years regarding participation, feedback, autonomy, fairness, responsibility, development and
work-atmosphere connected to retention.
Conclusion: The result shows that regarding leadership the respondents prefer leadership
based on relations were they feel appreciation. Both appreciations from the closest manager as
well as the company management influences employee job satisfaction in a positive way.
More money was the most common reason for wanting to change jobs, and when asking how
the remuneration system should be designed, base pay with additional bonus and benefits
were preferred. But also non financial factors such as participation, feedback, autonomy,
fairness, responsibility, development and work-atmosphere must be taken in consideration to
satisfy since they seem to increase employees’ willingness to stay in the company.

Table of contents
1. Introduction _____________________________________________________________ 1
1.2 Problem discussion __________________________________________________________ 2
1.3 Objectives__________________________________________________________________ 4
1.4 Limitations_________________________________________________________________ 4
1.5 Theoretical and Practical relevance ____________________________________________ 4
2. Method _________________________________________________________________ 5
2.1 Perspective and approach ____________________________________________________ 52.1.1 Positivistic and hermeneutic________________________________________________________ 52.1.2 Inductive and deductive ___________________________________________________________ 52.1.3 Type of study ___________________________________________________________________ 6
2.2 Secondary and primary data __________________________________________________ 62.2.1 Conversational interview __________________________________________________________ 7
2.3 Qualitative and Quantitative method ___________________________________________ 8
2.4 Proceeding _________________________________________________________________ 82.4.1 The survey _____________________________________________________________________ 92.4.2 Formation of questions ____________________________________________________________ 92.4.3 Selection ______________________________________________________________________ 112.4.4 Fall out _______________________________________________________________________ 122.4.5 Analysis ______________________________________________________________________ 12
2.5 Validity and reliability ______________________________________________________ 13
3. Retention_______________________________________________________________ 15
3.1 Leadership ________________________________________________________________ 153.1.1 Perspective in leadership style _____________________________________________________ 16
3.2 Remuneration _____________________________________________________________ 173.2.1 Remuneration in classical theories __________________________________________________ 173.2.2 Modern approaches to remuneration ________________________________________________ 183.2.2.1 Reward management ___________________________________________________________ 183.2.2.2 Benefits _____________________________________________________________________ 193.2.2.3 Fairness _____________________________________________________________________ 203.2.2.4 Performance-related rewards _____________________________________________________ 203.2.2.5 Generation shift _______________________________________________________________ 21
3.3 Factors that impact employee satisfaction ______________________________________ 22
3.4 Theory Conclusion _________________________________________________________ 24
4. Empirical study result and analysis__________________________________________ 26
4.1 Leadership and style________________________________________________________ 264.1.1 Retention related to satisfaction and appreciation. ______________________________________ 264.1.2 Leadership style ________________________________________________________________ 27
4.2 Remuneration _____________________________________________________________ 27
4.3 Other satisfaction factors ____________________________________________________ 304.3.1 Retention In relation to career development___________________________________________ 304.3.2. Autonomy ____________________________________________________________________ 314.3.3 Development___________________________________________________________________ 314.3.4 Participation and Responsibility ____________________________________________________ 324.3.5 Feed-back _____________________________________________________________________ 324.3.6 Work-atmosphere _______________________________________________________________ 33

4.4. Discussion ________________________________________________________________ 33
5. Conclusion _____________________________________________________________ 38
5.1 Reflections ________________________________________________________________ 39
6. References______________________________________________________________ 41
Books _______________________________________________________________________ 41
Articles ______________________________________________________________________ 42
Conversation _________________________________________________________________ 44
Appendix 1: Question guide used in the conversational interviewAppendix 2: Questions analysed (coding included)Appendix 3: Statistics analysed through SPSS
Table 1a: GenderTable 1b: Age groupTable 1c: Annual salaryTable 2: Retention related to satisfaction and appreciationTable 3: Age group and better payTable 4a: Leadership styleTable 4b: Leadership style with genderTable 5: Knowledge and developmentTable 6: Career and developmentTable 7: Reason for turnoverTable 8a: Salary procedure with genderTable 8b: Bonus procedure with genderTable 9: Fairness with pay with retentionTable 10: Are you entiteled to bonus paymentsTable 11: Do you receive extra benefitsTable 12: Specified benefitsTable 13: Shareholder with retention and positionTable 14: Gender with bonus systemTable 15: Satisfaction pay with retentionTable 16: Pay, bonus, benefit and satisfaction with intention to stayTable 17: Career with retentionTable 18: Personal workbalanceTable 19: Autonomy with retentionTable 20: Career and retentionTable 21: Traning and development with retention

1
1. Introduction
Companies today are forced to function in a world full of change and complexity, and it is
more important than ever to have the right employees in order to survive the surrounding
competition. New companies and business are blossoming, new technologies are constantly
developed and the knowledge and perception of how much your employees actually mean to
your organisation is greater for every day. Most companies are looking for the right expertise
in different areas, and human resources are therefore an important competitive factor that
needs to be taken into consideration while managing business (Ljungberg & Larsson, 2005).
Some implications of how important this is lies within the fact that all of the American
companies listed in the stock market in 1999 valued human resources higher than the physical
recourses, and in 2001 those rankings were equal (Jacobsen and Thorsvik, 2002). Arthur
(2001) describes that when the Saratoga Institute surveyed forty-five Fortune 1000
organizations across the United States, over 89% indicated that their organisations viewed
employee retention as a strategic business issue.
Today employees are more aware of their intrinsic value, not just as another person in the
production row. Studies show that the focus is shifting from the financial perspective, and the
individual well being is becoming more and more important (The Economist, 2006). From the
leader’s and manager’s point of view this could be a difficult dilemma, and organisations
have to balance both production effectiveness as well as human needs to be successful
(Jacobsen & Thorsvik, 2002).
Even though a company has managed to find the right employees, this is not enough. A
crucial factor is to make employees stay and reduce the turnover rate. In some industries the
high level of staff turnover is naturally high, but for most industries this could damage the
company in terms of for example quality and customer service (Curtis & Wright, 2001). We
consider the target market, the financial sector, an area where expertise is of utter importance,
and a long-term commitment of the right employees is important to the organisation’s
functuality, development and credibility.
The process of replacing an employee is costly. According to two different sources it may
cost as much as 150 percent of an annual salary for key staff (Curtis and Wright, 2001) or for

2
one-third of a new hire’s annual salary according to U.S Department of Labor (Michaud,
2005), and these is just the financial loss. There are also great losses in areas such as for
example skills, knowledge temporary replacement costs and training time (Curtis; Wright,
2001). If a company suffers from a too large turnover rate, potential employees may not
consider this as a stabile, secure and successful organisation. This could instead be an
indication of that there may be some problems inside the workplace. Large amount of cost in
turnover makes it important to have retention high on the agenda, and throughout this thesis
we will explore several ways of achieving this.
1.2 Problem discussion
Retention of talented employees can be a source of advantage for an organisation (Siegler
(1999), but how to achieve this may be a major challenge. What do employees want from
their organisation in order to feel committed? The primary reason for working is to obtain
money (Jackson and Carter, 2007), but could employers do more in order to retain their
employees? Or even more important, what do employees want from their employer in order to
feel committed willing to stay? Since there may be a difference between how employers try to
retain employees regarding to how employees actually would prefer to be retained, we will
concentrate on the latter question.
Throughout research we find indications that job satisfaction is a major element for employee
turnover and organizational commitment. Job satisfaction is affected by the worker and the
work itself (Chen, 2008). In older literature the focus has been on the relationship between
satisfaction and leadership style as well as remuneration with the main focus on pay. In the
1940’s, 1950’s and 1960’s several studies were made (Ohio, Michigan and the Hi-Hi leader),
emphasising the difference of task-oriented and relation-oriented leadership style and how the
leader managed to combine these two dimensions in order to achieve effectiveness. In the
1990’s a third dimension of leadership style was introduced, called change-oriented
leadership style. This third intention was that the leader should act as a promoter towards
development in a more complex way (Yukl, 2006). Is leadership still relevant for satisfying
employees? If so, which leadership styles do the subordinates prefer? Regarding remuneration
the foundational focus has been on base pay, with the traditional fix base pay in direct relation
to the employee’s job or position. During the late 1980’s the shift from pay for the job
towards the individualisation of pay began, and during the 1990’s employees stated that pay

3
was an important factor in the consideration of staying with an employer (Armstrong, 1996;
Thorpe and Homan, 2000). Researchers began so see a shift towards a more benefit-focused
remuneration system, and today there are discussions whether or not the size of the
remuneration even is of importance for job satisfaction. Pay has been an important factor for
employers to retain employees in the company, but we ask ourselves if this is still the way
employees want to be retained? During the latest decade research indicates that other factors
than pure pay and leadership style have a major part of the employees’ satisfaction.
Employee’s satisfaction builds on elements such as a higher participation, feedback,
autonomy, fairness, responsibility, development and work-atmosphere (Hytter, 2007). Are
these elements more important than the old way of thinking regarding remuneration and
leadership style, i.e., has there been a shift? Figure 1 is an illustration of our way of thinking
regarding these subject fields.
Fig. 1: Job satisfaction towards retention
We have also noticed that there, compared to other countries, is little research done about
these topics within Sweden. We want to compare the findings in Sweden regarding job
satisfaction factors such as leadership style, remuneration and new elements: participation,
feedback, autonomy, fairness, responsibility, development and work-atmosphere, with
theories and research from other countries to see if the Swedish preferences are the same.
Considering these problem areas we have come up with a main question we will establish the
thesis upon: “How do employees within the Swedish financial sector want to be retained by
their employer?”. From this point of view we will explore three sub questions in order to find
out what satisfies employees:

4
Which leadership style do the employees prefer?
Is the amount of pay the best way towards retention?
Are the new elements important for retention?
1.3 Objectives
The main objective is to increase the understanding regarding employee’s retention in relation
to leadership style, remuneration and elements such as participation, feedback, autonomy,
fairness, responsibility, development and work-atmosphere in the Swedish financial sector.
1.4 Limitations
Due to the time frame and choice of subject we have made some limitations in the thesis:
We have chosen the financial sector because there is a demand of competent and educated
employees which strengthen the importance of retention as a key to success in company.
We will only investigate Swedish companies since this makes it possible for us to
investigate the chosen subject fields more profound.
1.5 Theoretical and Practical relevance
This thesis has a theoretical relevance because surveys done in the topic retention are
relatively unexplored in Europe. Therefore this is an important and interesting subject to
investigate in order to see variation and connection in Sweden within the chosen area. We
have found existing material on retention in different work sectors and for separate countries,
but not a comparative one regarding the chosen sector. Within for example reward strategy
there has been a dominance of American literature (Armstrong, 1996). The American research
ideas may not applicable in Sweden due to their strong emphasis on new industrial relations
and their absence of an appreciation of Western Europe’s forms of capitalism. Therefore it is
also of interest to see if Swedish employees in financial sector have the same opinions as
previous respondents in other countries. The knowledge for retention preferences could help
managers and employers in our country and in the specific work sector, and contributes
therefore to the practical relevance of our work.

5
2. Method
2.1 Perspective and approach
2.1.1 Positivistic and hermeneutic
If you use a hermeneutics approach there is no objective truth and this approach is built on
interpretations. The researcher tries to find new ways to understand happenings. Reality is
something that is created by people and is investigated through people’s opinion about reality.
In positivism there is an objective reality that is investigated by objective methods and
measures, and the positivistic researcher tries to find patterns. We are using the positivistic
approach since we take the knowledge and test it to empirics to see if it accord with reality
(Djurfeldt et al, 2003).
2.1.2 Inductive and deductive
There are two main ways of approaching theory and empirics, shown in figure 2 below.
Induction means that you make general conclusions from empirical facts. You can study a
subject without any previous theory, and you discover patterns that you conclude in models
and theories. When using a deductive approach you start from the theoretical facts and make
empirical predictions, which you then try to verify with collected data (Björklund and
Paulsson, 2003).
We have in the thesis used a deductive strategy first collecting theory in the topics and then
creating a questionnaire. We made an assumption based on theory when forming the survey,
but the actual facts are not received until the survey is answered. These facts are than
compared with the theory.

6
Fig. 2: Illustration of inductive and deductive approach (Björklund & Paulsson, 2003:63)
2.1.3 Type of study
There are different ways to make a study, for instance the amount of existing knowledge
within the subject may be of importance. An explorative study is used when there is little
knowledge within the area, and you want to obtain a basic comprehension. A descriptive
study is used when the basic comprehension is there, but the object is to describe but not
explain the phenomena. An explanatory study can be used when you want deeper knowledge
and comprehension, and when the purpose is to both explain and describe. Finally, a
normative study is used when the knowledge within the area is there, and the object is to
guide and suggest measures to be taken (Björklund & Paulsson, 2003). We have used
explanatory study in the thesis in order to describe and explain, through causal connection
between two or several variables.
2.2 Secondary and primary data
Sources used in a research process can be divided in two categories, primary and secondary
data. A primary data is the data collected by the researcher with the intention to be used
directly in the actual study. Secondary data is material collected and cultivated by others,
often with another purpose than the one for the actual study. A common way is to combine
the two types of data, for example secondary data may be used to analyse gathered primary
data (Halvorsen, 1992; Björklund and Paulsson, 2003).
The theoretical chapters in this thesis are based foremost of a literature study from previous
published literature (secondary data). We have used books and magazines to deepen our

7
understanding in retention, leadership and remuneration. We have also used the Internet to
search for articles, news and information in the topic. On the Internet we mainly used the
library databases Ebrary, Elin and Emerald, but also the search engine Google. Keywords
used were retention, remuneration, reward, leadership, leadership style, management,
motivation and employee.
To broaden our prior knowledge we had a conversational interview with a person in banking
just given notice of dismissal and soon starting at a competitor (primary data). This was a
kind of inductive strategy in order to open our minds and catch approaches that was not in
previous studies or theories. The main primary source in the thesis we handle in through
gathered data in forms of the answered questionnaires. This primary source was related and
adapt to our aim.
2.2.1 Conversational interview
As an introduction in the topic we had a 50-minute informal conversational interview with a
banker who just had given her resignation after working at the bank for ten years. We thought
she would be a good respondent for us to get a more profound comprehension in the chosen
topic reason for retention. In order to interpret feelings and body language we made the
interview face to face. This also made it easier for us to remain as open and adaptable as
possible to the interviewee’s nature and priorities. We initiated the conversation with a
presentation of the purpose, but after that both the questions and the answers were open-ended
in order to receive a complete picture of why this person had chosen to quit (Jacobsen, 2002;
Annex 1). We had questions prepared before the interview, but complemented with lots of
attendant questions such as: “What do you mean by that?” and “How come?” (Appendix 1).
The respondent was encouraged to speak freely and we interrupted the respondent as little as
possible to make the result more open. Only when we felt that the respondent’s digression fell
too far from the main subject we interrupted and tried to get the questions back on track. As a
result of the conversation we found out that leadership and remuneration were two important
subjects for her decision to leave, and therefore this is the chosen foundation for this thesis.
When doing a face to face interview the respondent is more likely to be affected by the
interviewer, which may threat the reliability of the research. We were also careful not to slant
the questions, and the back-translation made sure that the questions would not be
misinterpreted (Björklund & Paulsson, 2003).

8
2.3 Qualitative and Quantitative method
A quantitative method is based on information that can be measured or valued numerical,
while a qualitative method is used when you want to get a more profound understanding for a
specific situation. Mainly it is the purpose of the survey that determines which approach the
method should have. Observations and interviews are often more suitable for a qualitative
survey whereas questionnaires is a better start for a quantitative survey. The two approaches
are not mutual exclusive, and good research tends to combine them even though the starting-
point may be in one of the approaches (Björklund and Paulsson, 2003; Denscombe, 1998).
In the thesis we have used a quantitative approach to obtain the objective. One advantage of
this method for this type of thesis is that when using a quantitative method it is possible to
analyse the data with statistical methods. We believe that this method will give us a more
objective result than if we had used a qualitative method, since it is easier to generalise the
findings. Due to the resources it is also easier to obtain a larger amount of quantitative data
for the analysis. Another advantage is that the final results are based on quantities rather than
interpretations, which may simplify potential future development and comparisons with the
work.
2.4 Proceeding
In order to receive information about the specified target group, we decided to do a social
survey. A social survey can be defined as “a technique for gathering statistical information
about attributes, attitudes or actions of a population by administering standardized questions
to some or all of its members” (Buckingham & Saunders, 2004:13). There are different ways
of collecting the empirical material needed for this, for instance interviews, questionnaires,
observations etc. We wanted to study a larger amount of people to create our own opinion of
satisfaction towards retention, and be able to see the extent and different relations within it.
This is called extensive formation and makes it easier to be able to generalise the result. We
choose a quantitative approach, and made a survey with respondents from the financial sector
in Sweden to be able to investigate variation and connection between different situations
Jacobsen, 2002).

9
2.4.1 The survey
In order to do the thesis we joined a research project about retention in Växjö University. The
main purpose of the project was to find out what employers in different countries need to do
in order to retain their employees. Countries represented in the project group were France,
Germany, Finland, Sweden, Kosovo and Taiwan. Everybody in the project group started with
reading scientific articles, distributed by the project leader and tutor Anders Hytter, to get a
deeper understanding for the topic retention. This was the base in order to be able to have a
quantitative survey (Jacobsen, 2002). Secondly we were divided in six different content areas;
remuneration, management of careers, leadership style as a way to motivate, training and
development of skills, physical working conditions and work-life balance, with the intention to
write relevant questions. We were three persons from different countries in each group.
The next step was to generate the questionnaire. We first came up with questions in each
group based on previous research. After that we joined a seminar to be able to discuss how
well we had managed to transcribe our theoretical assumptions and issues in to measurable
questions in order to create a questionnaire with conceptualization and theoretical relevance
(Djurfeldt et al, 2003). The final questionnaire was translated in to our native language and
then back translated by an alienage in order to reassure that the translation was validated.
To distribute the questionnaire we used the system Query and Report. This gave us the
possibility to link the questionnaire directly to the respondents e-mail, and the data results
were automatically emerged into the database. We believe that this type of data-collection
would fit the respondents because of their everyday use of computers. It also simplifies the
distribution procedures, and this kind of relation between distribution and respondent is
important in order to receive as many answers as possible (Jacobsen, 2002). The reliability is
high due to the fact that we used the same research instrument (Query and Report) when
collocating the data. This reduces the chance of errors since it automatically, within the
program, produces raw data without middle links that may cause errors such as an
accidentally misinterpreted handwriting.
2.4.2 Formation of questions
When using a qualitative approach it is an inductive way at the beginning. This implicates that
the method has to be open and the questions also have to be open to not steer data collection.

10
Afterwards data is being structured and categorized. When using quantitative approach the
categorizing has to be done before the data collection. This makes the survey more regulated,
meaning that the respondent is just being able to have a predetermined way of answering
(closed). When developing the questionnaire we had to decide what kinds of variables and
ranges for value we considered relevant for each question. Pre-coded (closed) questions:
The respondent has to choose one of a range of possible answers. Open-ended questions:
The respondent can give any answer (Buckingham & Saunders, 2004; Jacobsen, 2002).
Because of the quantitative approach, being able to investigate a phenomenon’s extent,
variation and connection, we have to choose more regulated answers. We had on forehand put
up answers but in some questions left the possibility to do a choice called others. The
respondents were here able to write another selection not predetermined by us.
There are two main types of variables: categorical including ordinal and nominal scale and
continuous including interval and contingent or ratio scale. Which types of scale you choose
influences the type of analysis method you can use, so it is important to define them. Nominal
measures: Categorization of values, with no mathematical significance attaches for instance
man and woman or catholic, protestant and Muslim. Ordinal measures: A rank order of
ascending or descending size but without a ground zero, but the gaps between the ranks are
necessarily not equal. Example of this is bronze-, silver- and gold medal. Interval measures:
This measurement is about numbers and it is unusual to use. It has no zero point and the
distance between every number is the same, for example degrees. If you go from 20 to 25 it is
as far as from 25 to 30. Contingent (ratio) measure: It is the same as interval measure but it
has a zero point for example distance in meters or age. We can also say that a distance of four
meters is double up regarding two meters. You can always go from a higher measure to a
lower but never the opposite, meaning that you can take age (contingent) and turn it into
groups of age (ordinal) but defining someone’s exact age based on a group of age
(Buckingham & Saunders, 2004; Ludvigsson, 2002).
To collect background data about the respondent we have used a variation of contingent,
ordinal and nominal measure scale. There were questions about age, working year
(contingent) and gender, kind of company (nominal) and level of education, workplace,
position and kind of work (ordinal) that we used in the analysis.

11
A specific type of bipolar ordinal scale we used in the study is called a Likert scale. This is a
method of measuring people’s attitudes by combining their scores on a variety of items into a
single index. Scaling is achieved by ensuring that high-scoring and low-scoring individuals
differ in their responds on each of the items selected for inclusion in the index. There is a
clear rank, and the distance is assumed to be the same between categories. Ranking (ordinal)
and categorising (nominal) are also called qualitative answers depending on that a sentence or
word is translated into numbers (Buckingham & Saunders, 2004). When collocating the result
we picked an amount of questions related to our aim. The other question about the topic
management of careers, training and development of skills, physical working conditions and
work-life balance were not included when analysing the result. In the chosen questions
contingent, nominal and ordinal including Likert scale were used.
2.4.3 Selection
Within the project group the decision was taken to the survey within the financial sector, i.e.
banks, finance and insurance companies. We believe that this sector gives us a good
foundation for comparing different countries due to their differences and similarities in for
instance environment, management and national culture. We also believe this sector to be
interesting because of its requirement of educated employees, and the need to have long
termed relationships between contact person and customer.
The questionnaire was distributed by members in the project group based on native language
to France, Canada (French speaking part), Belgium, Germany, Austria, Switzerland (German
speaking part), Sweden, Taiwan, Finland and Kosovo.
To make it easier to observe connections between variables and to strengthen validity and
reliability we had a goal to get at least 125 answer. We were able to collect 134 answers in the
survey which made a good foundation for the analysis. To select respondents in Sweden we
contacted companies active within the banking, financing and insurance sector. To receive a
more extended range of respondents we selected companies from as well different sized
offices and organisations as cities. We made a first initiative conversation with the company
through a phone call. Before doing this we tried to find an employee (for example the
manager of the company or the person in charge of the information within the company)
within every company that could help us to distribute the questionnaires to others within the

12
same company. In about a week from delivering the questionnaire we contacted the contact
person in each company to find out if there was any problem and also to check how many
they have distributed the questionnaire forward to. By contacting the company after a week
we were supposed to increase the level of answer and we saw that the answer rate increased
more that day or the day after contact was made.
We chose to have a multi-step selection and a non-random approach when choosing which
companies to contact. We thought that we would obtain a higher frequency in answers and
lower in fallout’s if we contacted companies where we had personal connections or that were
situated nearby Växjö, and this was the first selection made based on subjectivity. Within the
selected companies we used a so called snowball sampling. The snowball sampling is a non-
probability method, which begins with a contact person that is asked to ‘nominate’ other
respondents relevant for the purpose of the study (Denscombe, 1998).
Selected employees from following companies answered the questionnaire: Acta, SEB,
Skatelövs- och Västra Torsås Sparbank, Långasjö Sockens Sparbank, Sveland, Trygg Hansa,
Handelsbanken, Swedbank, Catella Kapitalförvaltning AB, Ikanobanken, Smålandsbanken,
Länsförsäkringar Kronoberg och Diligensia.
2.4.4 Fall out
We had a goal of receiving at least 125 responses. Due to the snowball approach we can not
be absolutely certain of the number of people asked to participate in the survey, and therefore
it is difficult to give numbers of the fallout’s as well. We tried to get an as accurate number as
possible by contacting the contact persons at each company, and estimated the number to a
fully 230 people. After three week we had received a total of 134 answers which compares to
58 percent. Because of the difficulty to verify 5 of the respondent’s nationality they were
excluded from the material. After this we had 129 respondents participating in the final result.
2.4.5 Analysis
Using Query and Report, the coding becomes partly automatically made. Questions where
respondents were asked to rank alternatives were coded afterwards. When coding results it is
important to be consequent, for instance we always coded the highest ranked value as a 1 and
the lowest as a 6. We have used a range of different methods while conducting the analysis,
made through the statistical program SPSS. When calculating ranking based questions we
13
used a mean, which gives an easy summarization of the central tendency in a distribution. In
the analysis we were interested in looking at covariance between variables (bivariat analysis).
To do so we used correlation analysis. There is a requirement that both of the questions
compared to each other are ranked (ordinal) or metrical. If the correlation is 0 there are no
systematic differences between the two. If the correlation is negative the high score in one
question is correlated to a question with low score. If there is a positive correlation a high
score in both of the questions they are related to each other. One way of doing correlation
analysis is to use Pearson’s r test to check the correlation’s between two groups of normal
spread data and the spread is between +-1. The correlation numbers are interpreted like this:
Below 0,30 is week correlation, between 0,30 – 0,50 is middle strong correlation and above
0,50 is a strong correlation. In the thesis we used Pearson’s r (Pearson’s Product Moment
Correlation Coefficient) to test correlation between retention related to other factors
(Jacobsen, 2002; Buckingham & Saunders, 2004).
While analysing data it is common to search for statistical significance. This is a measure of
how big the likelihood in being wrong is, and it is common to use the confidence level 90, 95
or 99%. This means that there is a 10, 5 or 1% chance of being wrong and most common to
use in researching are the five percent significance level meaning 95% confidence level
(Ludvigsson, 2002; Buckingham & Saunders, 2004; Jacobsen, 2002).
2.5 Validity and reliability
When collecting empirics it has to be both valid and relevant. Validity refers to the empirics’
data collection measuring compared to what it is supposed to measure, and is applicable on a
major population. There are both internal and external validity. The internal validity can be
threatening by measuring wrong things, which automatically may lead to incorrect
interpretations. The external validity is about being able to transmit to other contexts.
There are different ways of testing the validity of a result such, as going back to the
respondents and see if they agree or support the result. This could happen in personal
conversations or in groups and is called face validity. This kind of validity has limitation
because the investigator may see things that the respondent is not able to see. Another way to
test validity is to compare the result with other experts, theories and empirics. If other surveys
in the topic is done with other kind of methods and we have the same result it strengthen the

14
validity. This part is being tested in the analysis and in the conclusions. To test our own
validity we have to be critical in the choice of respondents and sources. It is of importance to
choose sources as close to the primary source as possible to not having others interpretations
included in the own research. Why we choose or did not choose certain kind of theories or
respondents we talk more about under Reflections. Through this thesis writing we have had
several occasional and planned meetings with our tutor, teachers and other students in order to
have a critical review of the method. These are ways of increasing validity in the work and to
have some new input to the way of thinking. Respondents fall out is another risk in validity. A
high value of fall out could distort the results. Also the total number of respondents is
important to be able to generalize the result. A larger amount of respondents, to some extent,
makes the result more valid. There is no linear proponent between size of the survey and error
margin, but there is a role that says that if you three double the size/number of respondents it
halves the error margin. If the population is big there is a demand of at least between 100-200
respondents in size of selection (Djurfeldt et al, 2003; Jacobsen, 2002). The goal was
therefore at least 125 respondents answering our questionnaire. We have chosen a web-based
quantitative questionnaire in the empirics, to strengthen the validity we could have combine
the work with qualitative empiric for example interviews. This had been a way to increase
validity.
Another demand on empirics is that it has to be reliable and believable. We have to ask the
question: If we tried to do the survey the same way ones more, would we be able to come up
with the same result? If not, there is a low reliability. Reliability is all about trust and there
must not be any errors in the measurement (Djurfeldt et al, 2003; Jacobsen, 2002).

15
3. Retention
Chiefs and managers want their employees to perform their best but to achieve this they also
need to take the cause of job satisfaction in consideration. Business today is much about
innovation and switching, which creates a requirement on the leader of being able to motivate
the subordinates. Leaders of today have another function than in a couple of decades, and the
demands on remuneration strategies have changed. In this section we will describe some of
the classical theories regarding leadership style and ways to remunerate employees. At the
same time we have tried to find some of the latest literature, articles and studies published,
and compare these findings to each others similarities and differences. As described in the
method section we have during the journey found indications that some elements are more
important than others in order for employees to obtain job satisfaction. While combining these
with our findings of remuneration and leadership style we hope to give an accurate picture of
how employees in the Swedish financial sector wishes to be retained.
3.1 Leadership
Leadership is a kind of process between people, where one or several people are trying to
influence others. You behave in a certain way in order to affect others thoughts and behaviour
(Jacobsen et al, 2002). Leadership can be described in two ways depending in how it is
viewed. One way is that there is one leader and the others are followers and there is a
difference between them. The other way to view leadership is that a leader role arises natural
in every social system and there are no differences between leader and follower (Yukl, 2006).
In the study we use the first view with one leader and followers.
According to Yukl there is a difference between management and leadership. Managers
exhort people to perform better and have concerns about how things are being done, while
leaders are more concerned in what people thinks and tries to make them agree in important
things to be done. Management is about setting goals, creating action plans and establishes
structure in the organisation. Leadership is more about developing vision and strategies than
trying to motivate and inspire the subordinates to follow and achieve them (Yukl, 2006).
16
3.1.1 Perspective in leadership style
In the 1940’s and 1950’s there were two major surveys done by Ohio State University and
University of Michigan in leadership behaviour and the subordinates’ effectiveness. Both of
them showed that subordinates valued their leaders from without two dimensions, 1) how they
develop good relations with subordinates by being supportive and 2) how much they focus on
effectiveness and structuring in reaching formal goals (task-oriented). These dimensions were
quite independent of each other and you could score high or low in both relation- and task
orienting at the same time (Jacobsen & Thorsvik, 2002). A task-oriented leader prioritises
activities in order to increase efficiency in the company. To achieve this he or she clarify what
results are expected, direct works and monitor performance. A relation-oriented leader
support and encourage employees in several way to reach goals, through coaching, mentoring,
allowing people to take decision in how to do a task, giving information and so on (Yukl,
2006).
In 1964 Blake and Mouton presented a model called the managerial grid which is a
development of previous studies. It has two dimensions like the Ohio and Michigan study,
person- and task oriented, but includes concern for people and concern for production instead.
If you score high in concern for people and low in concern for production it means that you
are more concerned with people’s feelings and wishes and have no concern in the result of
production. According to Blake and Mouton the high-high leader is to prefer because he/she
creates engagement to the task in supplying subordinates needs (Yukl, 2006).
When Ekvall and Arvonen investigated leadership style in Sweden, based on Ohio state study,
they found a third dimension called changed-centered leadership style (Ekvall et al, 1991) The
change-oriented behaviors main objective is to understand the environment, finding
innovative ways to adapt to it, and implementing major changes in strategies, products, or
processes (Yukl, 2006). Ekvall and Arvonen developed a model called CPE
Change/development, production/task/structure and employee/relation centered leadership
behavior. They found that the dimension change-centered leadership behavior had four
discernible extents, which were leader as a promoter of change and growth, he/she has a
creative attitude, is a risk taker and has visionary qualities (Ekvall & Arvonen, 1991).

17
3.2 Remuneration
As we have stated before, employees work for money. They may also work for other rewards,
but, on the whole, they will not work without money. Pay is one of the means by which
employers seek to control or influence the workforce, and it is a major component of the
employment contract, both formal and informal. Pay is used to signal the relative worth of
jobs, and gives an indication regarding the fairness in the wage and salary policy of a
company. To have a satisfactory pay system helps the company in order to motivate high
performance and retain good employees (Armstrong, 1996).
Pay and remuneration are terms used within (extrinsic) financial reward. The term
remuneration is equivalent to the term pay, which means to provide money in exchange for
other commodities or services deemed to be of the equal value (Shields, 2007). In considering
remuneration, we will refer to three main types of financial reward: base pay, benefits (i.e.
basically everything else including healthcare, subsidised lunch etc.) and performance pay. In
this segment we will get a more comprehensive understanding on how remuneration has been
viewed so far, and compare it to the latest research we have found.
3.2.1 Remuneration in classical theories
Instrumentality is the belief that if we do one thing it will lead to another and in its most
basic assumption it states that people will only work for money. People will be motivated to
work if the rewards and consequences are tied directly to their performance, and the theory is
based on the principle of reinforcement (Armstrong, 1996).
The basis of the needs (content) theory is that an unsatisfied need creates tension and
disequilibrium. Even though not every need is equally important to you or other persons at the
same time or even ever, they fulfil different purposes. Some needs may constitute a more
powerful drive towards a goal than others, and the same need could be satisfied by a number
of different goals at the same time as one goal may satisfy a number of needs. Considering
rewards, for example may a new car provide you with transportation at the same time as it
may be a status symbol, which impresses your colleagues (Armstrong, 1996).
According to Armstrong (1996) the cognitive theories including expectancy theory are a
more relevant approach to motivation, since it is concerned with people’s perception of their

18
working environment and the ways in which they interpret and understand it. Thorpe and
Homan (2000) describe the expectancy theory as the most fundamental in the field of reward
management. They mean that even though reward management manifests itself in different
ways depending on what is the latest within fashion, the base of the theory still consist of to
what extent individual workers are motivated by money. Money is a significant motivator for
most, and they mean that we will usually alter our behaviour in order to secure a higher base
salary or some form of bonus payment.
3.2.2 Modern approaches to remuneration
3.2.2.1 Reward managementReward management is not just about money. It is concerned with intrinsic as well as
extrinsic motivation, with non-financial as well as financial rewards. The idea of reward
management is not a new concept, even over 25 years ago Tichy et al (in Armstrong, 1992)
stated that “the reward system is one of the most underutilized and mishandled managerial
tools for driving organisational performance” (Armstrong, 1992:178).
A primary aim of reward management is to increase the motivation of the employees
(Armstrong, 1992). As we have discussed before, a major degree of a people’s motivation
will depend upon the perception of achieving the reward, i.e. their expectations. Motivation
theory describes why people at work behave in the way they do, and what organisations can
do to encourage people to apply their efforts and abilities in ways that will help to achieve the
organisation’s goals as well as satisfying their own needs. This may function in two different
ways. First, employees can motivate themselves in different ways that will lead them to
expect that their goals will be achieved. Second, management can motivate people through
methods like pay, promotion and praise. These two methods can be described as (Armstrong,
1992):
Intrinsic rewards: arise from the content of the job itself, includes task variety, autonomy,
feedback etc.
Extrinsic rewards: arise from the factors associated with the job context such as financial
rewards, developmental rewards and social rewards.
19
Intrinsic rewards related to responsibility, achievement and the work itself may have longer-
term and deeper impact on motivation than extrinsic since they are inherent in individuals and
not imposed from outside. On the other hand, even though they may not last long, extrinsic
motivators can have an immediate and powerful effect. Shields (2007) conclude with the fact
that in formulating an optimal approach to total reward management, the best solution is a
combination of intrinsic and extrinsic rewards.
Armstrong (1996) argues that using a reward system not only gives instrumental value, but
also acts as a powerful symbol of the management’s philosophy, attitudes and intent. Rewards
are designed to encourage behaviour that will contribute directly to the achievement of the
organisations objective. According to Armstrong extrinsic rewards provided by the employer
will be important in attracting and retaining employees, and Shields (2007) claims that one of
the three main purposes with reward management is to retain the best people by recognising
and rewarding their contribution.
3.2.2.2 Benefits
Benefits were once the least glamorous of all aspects of reward management, but today many
organisations consider benefits to be an important approach in order to gain a competitive
advantage in labour markets. Both financial and non-financial benefits play an important role
when it comes to attract, retain and motivate employees. As a supplement to base pay
financial benefits may enhance an organisations ability to attract and retain employees, and
non-financial benefits allows organisations to meet the specific needs of the employees. The
design of benefits offered may differ, but having a variety of benefits to choose from, a so
called cafeteria menu may be the easiest and cheapest way for employers to satisfy the
employees’ needs (Shields, 2007); Curtis and Wright, 2001).
Another type of benefit that have become more popular and widespread is the idea of
employee share ownership, which is very popular in especially France and the UK, but also in
the rest of the European Union. Employees may participate in the profits of the enterprise, and
this type of remuneration has been an important component of remuneration packages for
many employees, especially managers (Thorpe and Homan, 2000). Also Sigler (1999) writes

20
about stock ownership as a type of pay incentive, and describes it as a way to motivate
employees and reduce retention problems.
3.2.2.3 Fairness
Curtis and Wright (2001) have different approaches towards retaining employees. One of
them is called continuance commitment, which is an attempt to influence the employee’s
affections. Regarding pay this continuance commitment amounts to fairness. They claim that
in order to increase retention, pay levels should be reviewed and compared with other
employers regularly, that there is a clear link between performance and reward and that PRP
systems should be well developed. These factors are the basis for a successful retention of an
employee. They also emphasise the importance of a competitive wage with the external
labour market in contrast to fairness within the internal market to obtain a successful
maintenance of employees. Other research also emphasises the importance of fairness. For
example O’Connell (2001) means that workers who believe that they are fairly paid in
relation to others within the organisation are more committed, and Sigler (1999) states that
organisations must provide a competitive wage so the employees are paid fairly if they are to
comply with organisational practices. Mulvey et al (2002) states that satisfaction with the
process used to determine pay is more important in determining retention than the satisfaction
with the actual amount of pay received.
Shields (2007) go a bit deeper in the discussions of fairness. He states that employee
perceptions about fairness of human resource management practice will have a major impact
on how employees relate to their organisation. The outcome of an employees reward must be
assessed with fairness compared to the employee’s effort and qualifications. Employees who
feel that their outcome is either lower or higher than the ones they compare themselves to,
will have a feeling of reward inequity. This lack of equity may, according to equity theory,
take six different courses of action where the first one is to leave the organisation for a more
rewarding position elsewhere.
3.2.2.4 Performance-related rewards
In the last twenty years the practical application of expectancy theory has been seen in the
growth of individual performance-related pay (PRP) systems. This was the beginning of a
shift from pay for the job towards the individualisation of pay and pay for the person. Now
there is a growing recognition that an effective pay system can be central to business survival.

21
Performance-related rewards are incentives that are used as contingents in comparison to the
guaranteed base pay, and may take financial as well as non-financial characters. All forms of
paid employment have performance-based standards. Performance pay may be defined as
“any remuneration practice in which part or all of remuneration is based directly and explicitly
on employees’ assessed work behaviour and/or measured results” (Shields, 2007:348).
The impacts of this type of pay are however not clear among researchers. Thorpe and Homan
(2000) accounts both for research stating that one of the major advantages of performance-
related pay is that it attract and retain good employee whereas other research indicates that
performance-related pay fails to motivate and that the employees generally regard the
performance-related pay system as unfair in practice. Fong and Shaffer (2003) describes that
this variable has proven to have significance for pay satisfaction in several empirical studies
and Curtis and Wright (2001) emphasize the importance of employee involvement in the pay
scheme, that also should be regularly reviewed. Mulvey et al (2002) as well asked the
question whether these new pay and performance approaches really have the desired results,
and the results of their research concluded that the most important circumstance regarding
retention concerned the knowledge and information sharing about the reward systems
themselves.
3.2.2.5 Generation shift
O’Malley (2006) believes that the changes are dependent upon the generation shift. Ha refers
to research done by Maritz, Inc., which indicates that the new generation Y are more likely to
change jobs since they are continually searching for new challenges and experiences, which
forces employers to try new and innovative solutions to motivate this group of employees. He
claims that this generation needs an effective reward and compensation package in order to
create a new retention process that suits this generation. O’Connell (2001) argues that the
differences in remuneration-methods until now have been within the group of age, that an
older work-force appreciates non-cash benefits, while younger members have been more
impressed with immediate rewards. She means that even though younger workers have been
substantially more interested in money than the elder, this trend is now beginning to change.

22
3.3 Factors that impact employee satisfaction
There are many different facts that may affect employees’ decision to stay within the
company. Later research adverts that more elements than pay and leadership style are
important for retention. To obtain a more up to date theoretical background about this section
of new elements, we have searched for as new articles as possible, and limited the findings to
the latest decade.
Tobia (1999) describes successful leaders in retention as environment focused and they know
that satisfied and motivated workers intend to stay. They have core values such as treating
employees with dignity and respect, employees are giving access to the CEO, information is
shared, they have opportunity to develop and to take responsibility, they have a high level of
freedom and high performance is liaised to remuneration and recognition. It is important to
show how essential employees are and retention leaders try to solve conflicts on an early
stage to decrease the risk of loosing an employee. Retention leaders take notice about
subordinates’ attitude, personal problems and signalise if the turnover rate is increasing
(Tobia, 1999).
The foundation for increasing personal qualification and development is to understand your
own needs. The company can support with different kind of instrumental help such as
development centre, assessment centre, personal conversations and personal development
plans. By committing employees in developing their own skills the company makes profits,
but they need to create rewards to make it work. Rewards could be promotion, increasing
autonomy, education and so on. It is important that the reward is individual, meaning that it is
valuable for that person, to have a positive outcome (Hansson, 2001).
To create a good work group there has to be a good working atmosphere. This arises when
group members feel trust and confidence and as a result they treat each other with respect.
The group feel safe and members feel they can express their opinions. Being able to express
sensitive opinion and discuss this in the group stimulates to development (Wolven, 2000).
Trust is also an important issue when it comes to psychological contracts and promises. If an
employee feels that a promise is unfulfilled, communicated explicitly or implicitly, he or she
is more disposed to leaving the company (Kickul, 2001).

23
A way to increase trust might be to give the subordinates information about changes and plans
and generate a feeling of involvement and participation. Participation is about employees’
possibility in being able to influence decision-making in different situation. It is important for
a leader to show appreciation for suggestion to encourage participation. A participative
climate makes people feel that they are an important asset and that they can make a difference
and secondly this make them more committed. Spreitzer (1996) found out that participative
climate was related to empowerment. Empowerment includes four elements 1) meaning: A
person is more empowered if content and consequences are comport with values and ideas 2)
self-determination: A person can determine when and how work is done 3) self-efficacy: A
person believes he/she can do the work effectively and 4) impact: A person believes in being
able to have impact on the job and environment (Spreitzer Gretchen M, 1996); Yukl, 2006);
Curtis & Wright, 2001). A leader who uses empowerment, provides the subordinates with
information, gives support, act for a participative climate and creates opportunities for the
subordinates to develop (Brazier, 2005).
In a study by Egan et al (2004) it was circumstantiated that job satisfaction was related to
turnover intention. It also showed that learning culture had an indirect impact, mediated to job
satisfaction, in turnover intention (Egan et al, 2004). Job Satisfaction can also be increased by
autonomy in work according to Chen (2008). In this study done on IS workers in Taiwan
there was a positive relation in autonomy and job satisfaction. This relationship between
autonomy and job satisfaction was also found in a study done on nurses in the republic of
Ireland. Autonomy was even more important than pay, related to job satisfaction (Curtis,
2007). The employees should therefore be able to choose the content of their jobs and
progress of themselves. Secondly, higher autonomy makes employees more responsibility
taking regarding to company result and this improves job satisfaction as well (Chen, 2008).
One of the most influential motivators to use for increasing a motivating climate is positive
reinforcement used in for example effective reward-feedback system. This kind of feedback
should be given closed to the event and related to a specific task or goal. It should be
unpredictable and intermittent because rewards given routinely tend to lose its worth (Marquis
& Huston, 2003). The most effective way of increasing job satisfaction is by feedback.
Feedback is related to job characteristic and in high performance job it is important with
feedback, followed by professionalism (Chen, 2008). Positive feedback is also described as a

24
feel-good factor and makes the employee more committed and increases willingness to
retention (Curtis and Wright, 2001).
3.4 Theory Conclusion
The definition of leadership may take different terms, but we have chosen to define it as a
leader that differs from his/hers followers. Over 50 years ago two major leadership surveys
referred to as Ohio and Michigan, studied the relationship of leadership behaviour and
subordinate effectiveness. The conclusions of these both were that subordinates viewed and
valued leaders as either relation-oriented, task-oriented or a combination of them both. In the
1960’s a model based on the previous Ohio and Michigan studies were introduced. This so
called managerial grid included concern for both people and production, and indicated that the
best leader should score high in both these variables to provide with subordinates needs. The
Ohio study cleared the way for yet another leadership study made in Sweden, with the
additional dimension change.
Remuneration consists of different kinds of pay and benefits, and is according to many
researchers the most important way to reward and retain employees. There are several
classical theories regarding remuneration as a way to satisfaction. Instrumentality theory is
based on reinforcement where motivation comes from rewards tied to performance, needs
theory says that an unsatisfied need creates disequilibrium and expectancy theory is said to be
the most important in reward management since it implies that people will change their
behaviour in order to achieve more of whatever they want. Reward management is a relative
new conception that involves financial as well as non-financial rewards, and intrinsic as well
as extrinsic values. Intrinsic rewards are achieved from within (example coming from
autonomy or feedback) and extrinsic rewards arise from factors associated with the job (such
as financial or social rewards). Other factors that may contribute to the satisfaction of an
employee are benefits in different shapes and forms and fairness regarding the received pay
including the relationships and processes around it such as for example pay tied to
performance. Another suggested impact for type of remuneration wanted may exist within the
age.
As we have seen so far leadership style and remuneration are two important factors in
determining the satisfaction for employees which in turn leads to retention. Nevertheless there
are more to it than to just be a good leader or to pay more money; other elements seem to

25
have major impacts as well. Employee development and responsibility-giving are two
important elements especially if combined with performance-related rewards. Important is
also the working atmosphere which should be permeated by trust and confidence. Trust is also
important in the element participation, and research indicates that this is closely linked to
empowerment and development. Autonomy is another important factor when discussing
satisfaction since several studies shows a positive correlation between these two factors. The
last element illustrated is feedback, which is suggested to be the most effective way to
increase job satisfaction. Since researchers indicate that job satisfaction is related to turnover
intention, the study is dedicated to finding factors that may impact employees regarding this.

26
4. Empirical study result and analysis
In this section we will present the final data, and at the same time use the theoretical part to
analyse the results. When looking quickly at the collocation of the result we find that of the
129 respondents 60% are women (table 1a). The respondents’ age is evenly spread from 18 to
65, which makes the result easier to generalize (table 1b). There is an uneven distribution
among the respondents job position, where only 5% works in top management whereas more
than 80% do not have any management position at all (table 12). Nearly 60% of the
respondents have an annual salary between 21.000 and 40.000 Euros (table 1c).
4.1 Leadership and style
4.1.1 Retention related to satisfaction and appreciation.
Using Pearson correlation we can see that the intention to stay in the company is positively
related to satisfaction (corr. coef. 0,231, p=0,008, table 2), even though the correlations is
classified as weak. Employee satisfaction can be positively related to retention in the Swedish
financial sector and strengthens the research that has already been done in the topic in other
countries. Previous research (Tobia, 1999 and Egan et al, 2004) says that satisfaction is of
importance for willingness to stay in the company, which we also can tell by the results.
When looking at appreciation by the closest manager we can see that it motivates employees’
willingness to stay in the company, corr. coef. 0,277, p=0,002 (table 2). This is an indication
of leadership as an important way to retention and strengthens Tobias (1999) statement about
the importance of showing appreciation by the nearest manager. We can not see any
significance between the two factors appreciation by company management and retention.
Both appreciation by the nearest manager (corr. coef. 0,304; p=0,000, table 2) and
appreciation by company management (corr. coef. 0,308; p=0,00, table 2) matters for feeling
satisfaction. This indicates that the company management has an indirect impact on retention
because satisfaction has a direct correlation to retention.
When viewing leadership with one leader and followers we see that the manager has an
important function in influencing employees. By using behaviour in order to show

27
appreciation the manager may increase employees/followers intention to stay in the company.
The closest manager has a major impact on the followers when it comes to retention
(Jacobsen, 2002); Yukl, 2006).
4.1.2 Leadership style
Workers in the financial sector seem to think that the relation to the closest manager is of
importance for retention, which is ranked as number 1 (table 4 a). This indicates that they
prefer what is described as a relation- or person oriented leader (Jacobsen, 2002); Blake et al,
1964). This is strengthening by the fact that the least important issue (ranked as number 5) for
retention is that the leader has focus on the task (task- oriented). Second most important is the
factor with a manager that creates a good working atmosphere, which Wolven (2000) means
is related to relation between different parties where trust and respect toward each other is the
key. Working atmosphere is therefore associated with the relation oriented leader.
Table 4b presents the difference between male and female ranking, and within the three
highest ranked alternatives the results between the genders differed. Men think that the
personal relation to the closest manager is of most importance while women think that focus
on relation and supporting employees is of most importance. But it is still, for both genders,
the relation oriented style in leadership that is the most important issue for retention (Table
4b). Least preferred, by both genders, was the alternatives with a task oriented manager.
There is an indication on desire for change-oriented leaders in the result. Looking at the
question about training and career development we understand the importance of these two
areas (tables 5 and 6). Employees in the survey like to develop their skills and they want it to
be relevant for the job. They also think that it is important to be satisfied with future career
development which implicates willingness for change. Being offered a more challenging task
was a reason for leaving the company (ranked as number two in table 7) which also indicates
that Swedish workers prefer change-oriented leaders because of their willingness in
development and growth (Ekvall et al, 1991).
4.2 Remuneration
When the respondents were asked to rank factors that would impact there willingness of
leaving the company we found that a better pay was significantly dominating (table 7). 43%
of the respondents ranked this factor as the most important of them all. This strengthens for
28
example Thorpe’s and Homan’s (2000) theory about money being the most significant
motivator, and amplifies Armstrong’s (1996) beliefs of the fundamental importance of
instrumentality, in which the main assumption is that people only will work for money. We
could not find any difference between age groups and preference for factors that would
seriously make the respondents interested in leaving their company (table 3) as implicated by
O’Malley (2006). Instead we find in favour of O’Connell’s (2001) research where she
indicates that both young and older workers are attracted by the similar things.
Also factors of importance for choosing a competitor were to receive more challenging tasks
and to obtain better career opportunities (table 7). The possibilities to develop and take more
responsibility are described in newer research as two important elements for retention.
Hansson (2001) describes career opportunities as a way to reward employees and to increase
their commitment. As a result in the survey we saw that career opportunities were of
importance for turnover, which indicates that it is an important issue for retention as well.
As we can see in table 8a the respondents were asked to rank different aspects of procedures
surrounding pay. Overall the most important factor regarding pay was that the employees
would get the pay rise deserved, and second most important that the pay rise is regular. Least
important according to the respondents was the fact that the procedure for deciding on pay
rise was known by the other employees, different from what Mulvey et al (2002) said about
reward systems. Both men and women ranked the individual pay raise highest, but the men
did so to a larger extent. Second, men wanted to have a regular raise in pay while women
ranked the regular pay rise equal to fair pay rise-criteria in second place. Interesting to see
here is that the result differs from the previous theory (Curtis and Wright, 2001, O’Connell,
2001, Sigler, 1999, Mulvey et al, 2002) since regarding fair pay and fair processes
surrounding pay were ranked low. On the contrary, the Swedish respondents ranked the
amount and regularity of rise highest.
To see if these rankings affected the employee’s intention to stay within the company, we
tested these correlations in table 9. Here we can see that the only correlation although weak
(corr. coef. 0,178 p = 0,043) is between intention to stay and fair procedures for deciding on
pay rise, which supports the ideas of Curtis and Wright (2001) or Fong and Shaffer (2003)
regarding fair procedures for pay. Between the other factors there is no significance.

29
When asking respondents of received bonus or other benefits, we can see that the share of
employees receiving a bonus is exactly as big as the share that does not (50% each, table 10),
whereas 71% of the respondents do receive some kind of benefit (table 11). The respondents
were asked to describe which types of benefits they received, if any, in an open question. Of
the 66% answering the open-ended question, the most common benefit received were
luncheon vouchers followed by an equal amount of cellular phones as well as interest and
exchange benefits (table 12). Here we can see that these kinds of rewards, financial as well as
non-financial, are very common in the remuneration system, as implied in the theory (Shields,
2007, Armstrong, 1996). Most common was the fact that the respondents could have a range
of various benefits, what Curtis and Wright (2001) refers to as a cafeteria menu, which could
be an indication of employers’ attention to the needs theory.
One question dealt with the respondents’ preferences for remuneration in addition to a regular
pay. In table 8b we can see that the employees want various bonuses as a complement to the
regular salary. This was the highest ranking, and second up was the fact that the company
uses a bonus system. Least important was to become a shareholder of the company. The most
important factor for women was to receive various bonuses complementary to the regular
salary whereas men prefer to work in a company that uses a bonus system. Here it seems like
men are more competitive in their way of thinking than women. Men prefer a strictly bonus
related wage while women wants the security of a base pay in addition to an extra bonus.
Least important to both men and women was to become a shareholder. This is opposite to
what foremost Thorpe and Homan (2000) but also Sigler (1999) says about stock ownership
as an incentive. On the other hand Thorpe and Homan (2000) also state that especially
managers appreciate this kind of remuneration, and this could be a result of the fact that we
have very few respondents of this kind. We still wanted to see if this could be the case, but 5
of the 7 top managers ranked the alternative “to become a share-holder of the company” the
lowest and all of the 6 respondents in middle management agreed that this was the least
important factor. (table 13).
When it comes to preferences regarding the foundation of the bonus system, we can see a
distinct difference between men and women in table 14. Men have an even spread with the
major part (35%) believing that the own performance should influence the most. Regarding
the women, this alternative came last with only 17% of the respondents. For women the most
preferred alternative is the one based on the whole companies performances, which in turn
30
men prefer second. Overall, the most preferred alternative is the one based on the whole
companies performance (39%) and the least preferred based on the employees own
performance (24%). 8% of the respondents stated that the foundation should consist of a
mixture of the three alternatives. These results strengthen the differences in findings regarding
performance-related pay in the theory part.
In general we can tell that 46% of the respondents intend so stay with their employer for over
5 years, and this is also this group that are the most satisfied with their total pay (table 15).
Here we thought of the possibility that some respondents could be in the age where they
would retire within just a few years and therefore had to choose less than five years as an
answer. When looking at the respondents in this range of age we can see that we only had 7
people over 60 years old (table 1b), which does not affect the statistics to any larger extent.
25% are dissatisfied to completely dissatisfied with their received pay (table 15), but the
majority of these (88%) still intend to stay with their employer for more than three years. We
can see an obvious trend between the two variables; the more satisfied you are with your pay
the longer you intend to stay with your employer.
When using Pearson correlation on intention to stay with the questions regarding bonus,
benefits and satisfaction with pay there is a correlation, although weak, between intention to
stay and satisfaction with total remuneration (corr. coef. 0,166, p=0,06, table 16). These
findings indicates that pay is an important and relevant factor when it comes to retention, and
for instance Armstrong’s (1996) statement that extrinsic rewards are important to attract and
retain employees is valid. There is no significant correlation between any of the other factors.
4.3 Other satisfaction factors
4.3.1 Retention In relation to career development
When testing correlation (table 17) between career developments up to now in relation to
potential career development in the company, there was significance in this. If the respondent
was satisfied with career development up to now, he/she was also satisfied with potential
career development (Pearson: 0,557, p=0,000).

31
Both the factors career development up to now and potential career development in the
company correlates with intention to stay in the company. This means that if the respondent is
satisfied with career development the intention to stay increases. The potential career
development (Pearson 0,279, p=0,001) has a stronger correlation as well as higher
significance to retention than career development up to now (Pearson 0,195, p=0,027) (table
17). This indicates the importance of employees’ career development as a factor for
satisfaction and retention. This is in line with Tobia (1999) who talks about giving employees
opportunity to develop and take responsibility. Hansson (2001) describes promotion as a
reward and Shields (2007) talks about development reward as a way to extrinsic reward and
both seems to be a motivation factor to retention of non-financial nature. Career development
can also be seen as a close element to autonomy because of it’s relation to responsibility as
well.
4.3.2. Autonomy
We can see that autonomy (table 18) is an important issue when it comes to retention in
relation to private and working life. The most important element for retention is that the
company let the employee decide on matters regarding their own work. This intrinsic reward
autonomy is therefore an important element for retention and goes with the finding done by
Chen (2008) and Curtis (2007) in both IS-worker and nurses. Autonomy seems to be a
important issue today according to the result and to research done in later year and is a basic
element for satisfaction and retention. This is more important than having flexible work
schedule and support from the manager to balance family and work demands. When doing a
correlation to retention there is none found (table 19).
4.3.3 Development
It is important that employers give access to relevant development (ranked as number 1 of 5)
and that it is relevant for the job (ranked as number 2) according to the survey (table 5). The
personal need (ranked as number 3) is less important in this case and rewards (ranked as
number 4) is not that necessary, which is quite the contrary to what Shields (2007) and
Hansson (2002) describes. They say that reward is necessary to make development function.
Could it be that way that Swedish employees thinks that development is a kind of reward it
self, that Shields (2007) describes as extrinsic reward.

32
Even in Q42 (table 6) it is obvious that satisfaction with possible future career development
(ranked as number 1) and satisfaction in current career development (ranked as number 2) are
of importance for retention. These two answers about satisfaction in career development are
the most important issues when it comes to career development and they have a correlation to
each other but not to Q37 retention in current company (Table 20). But in question about
satisfaction in career development up to now and potential career development there was a
correlation to retention which indicates the importance of this factor to remain employees in
the company (table 17). This result in relation to previous research adverts at the importance
in giving employees possibility to develop (Tobia, 1999). In relation to Q 38 (table 7) about
facts that will make you leave the company, that includes several different topics, career
development comes in 4:th place of 9. Better pay, benefits and more challenging tasks are
more important for turnover. In Q 42 promotion as a part of personal career development was
ranked as least important out of 5. Promotion could be associated as a reward according to
Shields (2007), but also in this question reward is not ranked as the most important thing to
retention.
4.3.4 Participation and Responsibility
We could not find any correlation that participation and responsibility increase retention but
there is an indirect effect. To make an employee feel participative the leader can use
empowerment to achieve this. In question 43 (table 4) it is obvious that relationship to the
manager (ranked as number 1) and manager focus on creating good working atmosphere
(ranked as number 2) is important for willingness to stay in the company. A good relation is
building on support and participation and the result may therefore be an indication in
employees preferring participative climate (Spreitzer, 1996); Brazier, 2005). In question 38
(table 7) more challenging tasks were ranked as number two, along with better benefits, as
important factors in leaving for a competitor. This shows that more responsibility are ranked
high for leaving a company.
4.3.5 Feed-back
Feed-back was hard to analyse because it is a factor in several questions in the survey. If we
look at feed-back as an extrinsic reward connected to pay raise we can see that “That getting
the pay raise I deserve even if higher than my colleagues” is the most important issue (table
8). This indicates a personal need for reward feed-back on performance. Pay raise fulfil the

33
demand in not being routinely, instead it is unpredictable and intermittent and the employer
may connect it to performance in reaching a certain goal (Marquis, 2003); Chen, 2008).
When studying the result of Q19 (Table 14) about bonus based on your own performance or
the whole company there is a difference between male and female respondents. Male thinks
that bonus based on own performance is more important (35% male and 17% female ranked it
as most important). This indicates that male is more receptive than female in having bonus as
a reward feed-back system on their own performance.
Appreciation by the closest manager was correlated to retention (Table 2) and is also a result
of positive feed-back. Feed-back is related to the job characteristics and high performance and
by feeling appreciated you have received positive feed-back (Chen, 2008).
Feed-back session on development was not that important for employees related to retention
and there was no correlation to retention in current company (Table 21).
4.3.6 Work-atmosphere
The second most important thing for Swedish workers in the financial sector was that the
leader puts focus on creating a good working atmosphere (Table 4). The most important was
having a good relation with the closest manager. Both of these answers are related to
working-atmosphere. Working-atmosphere is built on trust and being able to express your
opinion, which also is the case if you prefer a good relation to your manager (Wolven, 2000);
Kickul, 2001). There is no way of building a good relation if there is no trust between the
company’s manager and workers.
4.4. Discussion
In the problem discussion we saw indications from previous research that job satisfaction
seemed to be an important factor for retention. The survey done within the Swedish financial
sector showed that this was the actual case. We could see that if an employee felt satisfaction
with his or hers work, he or she was also more willing to remain in the company. Mitchell et
al (2001) describes the importance of dissatisfaction in relation to retention. They discovered
a connection between dissatisfaction and turnover rate; if employees’ were not satisfied and
got the opportunity, they would leave their job. According to us companies have to improve
34
their retention effort through making employees feel job satisfaction. This issue must be one
of their main objectives because it increases the possibility to handle competition in the
market. By having competent employees and decreasing turnover rate companies may save a
lot of money which also is important throughout business administration.
According to the survey there is a correlation between job satisfaction and management. If the
employee feels appreciation from the closest manager or the company management, there is
an increased job satisfaction as well. When we cross-matched appreciation with retention we
found that appreciation from the closest manager increased willingness to remain within the
company. Even though appreciation from company management does not correlate with
retention, we believe that there is an indirect outcome because of the affect towards
satisfaction. The final conclusion in this part is that the closest manager has impact on
retention so leadership is therefore of utter most importance for retention. These findings are
strengthening by the fact that a similar result were found done on nurses by K. Khowaja et al.
(2005). The study identified that “the behaviour that directly influenced job satisfactions of
nurses were giving them timely recognition and appreciation on their good performance”
(Khowaja K et al, 2005:38). By giving feed-back on performance we consider this as a good
way of successfully work with retention. The closest manager has a bigger impact on the
employees by showing appreciation, but even the company manager should take this in
consideration.
Good leadership is about relationship between the employees and the manager. The
employees within the Swedish financial sector preferred a relation-oriented leadership prior to
change- and task-oriented leadership to increase retention. But they were also positive
regarding more challenging tasks and development, which indicates a positive attitude
concerning the change oriented leadership. As a leader there are several tools to use for
increasing retention, one of them being remuneration which we tested next. Of the
respondents we could see that almost half of them intended to stay with their employer for
more than 5 years, and those were also the group most satisfied with their total pay.
Surprisingly we could also see that almost everyone that was dissatisfied with their pay still
intended to stay with their employer for more than 3 years. Perhaps this could be an effect off
people (eventually at a younger age with less experience) just started working for his/hers
employer, whishing to obtain a certain amount of experience before searching for a better paid
job.

35
Regarding remuneration we saw that the outstanding most important factor that would
influence an employee to leave his job for a competitor was if the employee could receive a
better pay. The result also showed that although employees are not satisfied with the pay they
intend to stay in the company. This is contradictive but it may be interpret that there are other
factors than pay that makes us stay in the company, but if a competitor offer a better
alternative employees are willing to take this in consideration. Also highly ranked were the
factors to receive more challenging tasks and to obtain better career opportunities which
accurate with the findings of the newer elements we described towards job satisfaction. The
aspects of the procedures surrounding pay were also examined, and opposite to the previous
theory we could not see any clear indications that information about the procedures for
deciding on pay or a fair pay should be of importance to the employees. On the contrary the
respondents valued an individual and regular pay rise the highest and least important was the
facts regarding known procedures. To support the believes of the researchers emphasising
fairness we could argue about the phrasing of the highest ranked statement “That I get the pay
rise I deserve, even though this might mean that I get a higher/much higher rise than my
colleagues”. Perhaps this is viewed as fair in the sense that everybody should get what they
deserve; if someone does a better job than me he/she should get more money than me as well.
This could be a support to Shields’ (2007) ideas about reward inequity, where employees
comparing themselves to others may be of importance to an employee’s intention to stay.
Monetary bonuses as well as financial and non-financial benefits seem to be a commonly used
remuneration tool, and it is common for the employee to choose which kind of benefits
preferred from a so called cafeteria menu. The respondents prefer a range of various bonuses
as a complement to the regular pay, and surprisingly the least attractive alternative was to
become a shareholder in the company. Perhaps this is an effect of a cultural difference, since
Thorpe and Homan (2000) describes this reward as a very popular method in France and the
UK. When deciding on how the bonus system should be designed the result differs drastically
between the two genders. Women wants a bonus that is based on the whole companies
performance, while men prefers a system based on the individual performance which in turn
is least appreciated by the women. Overall, the most preferred alternative is a system based on
the whole company’s performance. Especially from the women’s answers we can support
Thorpe’s and Homan’s (2000) suggestion those employees tend to see performance-related
pay as unfair since the women in the survey preferred this the least. Perhaps women have a
36
greater need of equity, and compare themselves to others in a larger extent? The men on the
other hand again prefer bonus pay after own performance, and is more in favour of the
individualisation of pay.
We looked at the elements participation, feedback, autonomy, fairness, responsibility,
development and work-atmosphere to see if they had any effect on retention. There was a
significant correlation between career development and retention. It was important for
employees to have both a career development up to now as well as a potential career
development. Both of them increased the willingness to stay in the company. Mitchell et al
(2001) describes how employees always have to make some kind of sacrifices when leaving
their job. Common things to sacrifice are bonus benefits, stock option and so on. These things
are easy for a competitor to match and it is therefore important with non-financial motivations
factors to be effective for retention. Regarding this we think personal develop plans may be an
intrinsic way for Swedish companies to retain their employees. It is also harder for a
competitor to outmatch this kind of retention factor, than for example a monetary bonus.
When looking at the other factors (participation, feedback, autonomy, fairness, responsibility,
and work-atmosphere) we found out that there were no significant correlation between them
and retention. When we instead compared the means of the respondents ranking we saw some
important impact for retention. Employees deciding on matters regarding their own work
were of most importance, which also shows how important autonomy is. When it comes to
participation and responsibility there is an indirect impact on retention. Employees prefer
relation-oriented leaders, and this kind of leadership insists on having participation by the
employees. Employees may leave their employer for a competitor if they get more
challenging tasks; this indicates their willingness for responsibility. Reward feed-back on
performance by “getting the pay raise you deserved” was of most importance. Personal bonus
related to reward were of more importance from the male point of view. Feed-back through
appreciation by the closest manager was significant related to retention. Managers putting
focus on working atmosphere was ranked after a good relation to the manager, but on the
other hand a good working atmosphere includes a good relation. Conclusions made to above
shows that these elements are closely related to leadership and retention and they are non
financial tools a manager can use to increase retention.

37
This survey indicates the importance of satisfaction in relation to retention but Mitchell et al
(2001) also experienced that rather satisfied employees left their jobs as a result of shock,
which most often was external and did not involve money. To prevent the employees from
resigning we believe, according to the result, that they might use several tools to resist a too
high turnover rate. As a final conclusion we think it should be a mixture of both financial and
non-financial formations.
38
5. Conclusion
Regarding leadership the respondents preferred leadership based on relations were they felt
appreciation. Both appreciations from the closest manager as well as the company
management influence satisfaction in a positive way. We saw that more money was the most
common reason for wanting to change jobs, and when asked how the remuneration system
should be designed, base pay with additional bonus and benefits were preferred. But also non
financial factors such as participation, feedback, autonomy, fairness, responsibility,
development and work-atmosphere must be taken in consideration to satisfy and increase
employees’ willingness to stay in the company. Retention was therefore not only based on
pay according to the survey, even if pay turned out to be an important issue, but also these
new elements can successfully be used by the company to increase retention.
Overall, the respondents seem to appreciate a mixture of both extrinsic as well as intrinsic
rewards. Since monetary extrinsic rewards are easy for a competitor to match, we believe that
it is in the company’s interest to secure its employees by not just focusing on the money. Of
course money is an important issue as we have seen, but also intrinsic rewards such as variety
of tasks and other extrinsic matters such as development were highly searched. The
employees also appreciated a participative and change-oriented leader, which also indicates
that it is not enough for a company to focus on just one factor. Our findings say that for a
company with both men and women in different ages and positions, the best way to retain
their employees is to use a combination of offering them monetary benefits, being a
participative and attentive leader as well as putting focus to participation, feedback,
autonomy, fairness, responsibility, development and work-atmosphere.
In this thesis we have chosen to focus on the areas we find most interesting, but originally we
were one large research group collecting extensive data from different countries as well as
different continents. Suggestions for further research is therefore to expand the research, and
try to find similarities and differences in between different cultures, the other subject fields or
even to compare different sectors.

39
5.1 Reflections
To use deductive strategy may decrease the ability to find new information though it is built
on others previous thoughts. To compensate this weakness we had a conversation before
choosing topic and making question in order to open our minds and expectations. But an
extension of the survey may be to do interviews with employees. Interviews also tend to
strengthen the validity additionally because of its flexibility (Djurfeldt et al, 2003).
This thesis has been conducted as a literature study based on scientific articles and literature.
We used search methods based on choice of subject and purpose, and our keywords are
closely related to this. The literature gave us a profound knowledge base, and must be viewed
as a good method for the beginning of the study. Limitation in research about the topic done
in Sweden may have decreased the foundation in the previous knowledge. On the other hand
this is always a problem exploring new areas.
Regarding the selection for the surveys you may argue about the applicability to the financial
sector as whole. We focused our attention to companies where we had contacts ourselves,
companies who had some connection to our region, to our school or through
recommendations from persons in the sector. We thought that these types of companies would
be more inclined to respond than for instance a bank in the north of Sweden with no
connection to our region what so ever. The major part of respondents belongs within banks.
This is also a result that could have been avoided if choosing a different selection. By
conducting a different selection we could obtain a result more applicable to the financial
sector within Sweden. But we believe that the choice of selection gave us an advantage in
time. Since we managed to receive all needed respondents in just three weeks we could
concentrate the efforts to a more elaborated method and analysis. The amount of respondents
has increased the external validity and strengthens the contingency to generalize.
We used a quantitative approach in the questionnaire and did not leave many opportunities to
open answers, and in relation to the respondent’s opinion ranking none were made. If we had
used more of the alternative “others” we may have had a larger variation of answers and also
being able to really say that this is what the respondents think. On the other hand we were
more interested in comparing chosen elements to each other and to find out the amount of the
finding and by that we thought that this kind of variation was not necessary.
40
There were some comments from respondents about the questionnaire that may have
influence the result. One of them was “It is hard to rank the alternatives because several of
them were equal in importance”. This opinion is also described as a problem in literature.
Respondents think this kind of ranking questions are difficult to answer, they often know the
most or least important answer but them in between is more difficult to rank (Jacobsen, 2002).
When analyzing the result there was some difficulty in the ranking questions. Some of them
were hard to analyse in SPSS because they were too widespread, especially referring to the
topic about “new element”. For our aim it would have been better if some of the ranking
questions had been in Likert scales to do a better correlation test. But since we were part of a
whole research group, we could not specify the wanted questions to a too large extent. If
every group wanted to adjust the questions to their preferences, this would have affected the
whole groups result. It would have made the number of questions too large and the time to
answer them too long, which probably would have made it harder for us as a group to get
sufficient respondents.

41
6. References
Books
Armstrong Michael (1992) Human Resource Management, Strategy and Action. Kogan Page
Limited, London.
Armstrong Michael (1996) Employee Reward. Cromwell Press, Trowbridge, Wiltshire.
Arthur Diane (2001) The employee recruitment and retention handbook. Amacom, New
York.
Björklund Maria, Paulsson Ulf (2003). Seminariehandboken – att skriva, presentera och
opponera. Studentlitteratur, Lund.
Buckingham, Alan and Saunders, Peter (2004) The survey methods workbook: from design to
analysis. Polity Press Ltd, Cambridge.
Denscombe, Martyn (1998) Forskningshandboken -för småskaliga forskningsprojekt inom
samhällsvetenskaperna. Studentlitteratur, Lund.
Djurfeldt Göran, Larsson Rolf and Stjärnhagen Ola (2003) Statistisk verktygslåda –
samhällsvetenskaplig orsaksanalys med kvantitativa metoder. Studentlitteratur, Lund.
Halvorsen, Knut (1992), Samhällsvetenskaplig metod. Studentlitteratur, Lund.
Hansson Jörgen (2001) Skapande personalarbete- lärande och kompetens som strategi.
Bokförlaget Prisma, Stockholm
Jackson Norman and Carter Pippa (2007) Rethinking Organisational Behaviour –A
Poststructuralist Framework. Pearson Eductation Limited, Prentice Hall.
Jacobsen Dag Ingvar (2002) Vad, hur och varför? Studentlitteratur, Lund

42
Jacobsen; Thorsvik (2002) Hur moderna organisationer fungerar. Studentlitteratur, Lund
Ljungberg Anders and Larsson Everth (2005) Processbaserad verksamhetsutveckling.
Studentlitteratur Lund
Ludvigsson Jonas F (2002) Att börja forska- inom bio- och vårdvetenskap. Studentlitteratur,
Lund
Marquis Bessie and Huston Carol (2003) Leadership roles and management functions in
nursing. Lippincott Williams and Wilkins, Philadelphia.
Shields John (2007) Managing Employee Performance and Reward: Concept, Practices,
Strategies. Cambridge University Press, Port Melbourne, Australia.
Thorpe Richard and Homan Gill (2000) Strategic Reward Systems. Pearson Education
Limited, Essex.
Wolven Lars-Erik (2000) Att utveckla mänskliga resurser i organisationer. Studentlitteratur,
Lund
Yukl Gary (2006) Leadership in organizations. Pearson Prentice Hall, New Jersey.
Articles
Abraham, Rebecca (1999) The relationship between differential inequity, job satisfaction,
intention to turnover, and self-esteem. The Journal of Psychology, Vol. 133, No. 2, pp. 205-
16.
Blake, Robert R.; Mouton, Jane S; Barnes, Louis B (1964) Breakthrough in Organization
Development. Harvard Business Review; Nov/Dec64, Vol. 42 Issue 6, p133-155, 23p,
Brazier Davina Kay (2005:128-140) Influence of contextuak factors on health-care leadership.
Leadership and Organization Development Journal. Vol 26. No2. pp.128-140
43
Chen L.H (2008) Job satisfaction among information system (IS) personnel. Computers in
Human Behavior. Vol 24 Issue: 1 Pages: 105-118
Curtis E.A. (2007) Job satisfaction: a survey of nurses in the Republic of Ireland.
International Nursing Review Vol:54. Pages:92–99
Curtis Susan and Wright Dennis. (2001)Retaining Employees- The fast Track to
Commitment. Management Research News. Vol.24 Number 8, pp. 59-64
Egan Toby Marshall, Yang Baiyin and Bartlett Kenneth R. (2004) The Effects of
Organizational Learning Culture and Job Satisfaction on Motivation to Transfer Learning and
Turnover Intention. Human Resource Development Quarterly Vol: 15 Issue: 3 Pages: 279-301
Ekvall, G.; Arvonen, J. (1991) Change-centered leadership: An extension of the two-
dimensional model. Scandinavian Journal of Management Volume: 7 Issue: 1 Pages: 17-26
Fong, S. and Shaffer, M. (2003) The dimensionality and determinants of pay satisfaction: a
cross-cultural investigation of a group incentive plan, International Journal of Human
Resource Management, Vol. 14, No. 4, pp. 559-80.
Hytter, Anders (2007) Retention Strategies in France and Sweden, The Irish Journal of
Management, Vol. 28, No. 1, pp. 59-79
Jamal, Muhammad (1999). Job stress and employee well-being: a cross-cultural empirical
study. Stress Medicine, Vol 15, No. 3, pp. 153-158
Khowaja K, Merchant R & Hirani D (2005)
Registered nurses perception of work satisfaction at a Tertiary Care University Hospital.
Journal of Nursing Management . Vol 13, No: 1, Pages: 32-39
Kickul Jill (2001) Promises Made, Promises Broken: An Exploration of Employee Attraction
and Retention Practices in Small Business. Journal of Small Business Management.Vol. 39
(4): Pages 320-335.

44
Life beyond pay - Work-life balance. The Economist; 6/17/2006, Vol. 379 Issue 8482, p73-
74.
Mitchell, T.R., Holtom, B.C., & Lee, T.W. (2001) How to Keep Your Best Employees:
Developing an Effective Retention Policy. Academy of Management Executive, 15 (4) :96-
107
Mulvey, P. W., LeBlanc, P. V., Heneman, R. L. and McInerney, M. (2002) Study Finds that
Knowledge of Pay Process Can Beat Out Amount of Pay in Employee Retention,
Organizational Effectiveness, Journal of Organizational Excellence, Vol. 21, No. 4, pp. 29-
42.
Michaud L. (2005) Reducing Employee Turnover. Construction Bulletin, Vol.290,no3, pp10-
12
Thornton Sandra L (2001) How communication can aid retention. Strategic Communication
Management. Vol.5, No. 6, pp.24-27
Tobia M.P (1999) Retention success. Executive Excellence. Volume:16; nr 9: Pages: 15-16
Sigler, Kevin (1999) Challenges of Employee Retention. Management Research News. Vol.22
No. 10, pp. 1-5
Spreitzer Gretchen M (1996) Social Structural Characteristics of Psychological
Empowerment. Academy of Management Journal Volym: 39 Issue: 2 Page: 483-504
Woodruffe C. (2006) The crucial importance of employee engagement. Human Resource
Management International Digest; Volume: 14 Issue: 1
Conversation
Interview 2007-11-07. Anonymous.

45
Appendix 1: Question guide used in our conversational interview
How many years have you worked for your current employer?
What made you consider changing employer?
Which factors were decisive for your final decision to leave?
What were you content /not so content with at your current workplace?
Which opportunities do you see for yourself at your new workplace?
How do you look upon your career?

46
Appendix 2: Questions analysed (coding included)
Question no: Question Type of answerQ 1 Are you a 1 = Man
2 = WomanQ 2 Which year were you born? 19___Q 8 What is your position? 1 = Top management
2 = Middle management3 = First line management4 = No management position
Q 13 How much do you earn in one year (including salary but excluding bonuses and benefits)
Please answer in thousands of Euros
1 = <202 = 21-303 = 31-404 = 41-505 = 51-606 = 61-707 = 71-808 = 81-909 = 90+
Q 15 Are you entitled to bonus payments (do not take the extra months’ salary into account)
1 = No2 = Yes
Q 16 Do you receive benefits from your company (for example free cell phone, free or subsidized lunch, free car, etc.)
1 = No (go to question 16)2 = Yes
Q 17 If you have benefits please specify Please specifyQ 18 Are you satisfied with what you earn in total
(salary + bonus + benefits) from your employer?
1 = Completely dissatisfied2 = Dissatisfied to some extent3 = Not dissatisfied, nor satisfied4 = Satisfied to some extent5 = Completely satisfied
Q 19 A bonus system should be based on 1 = The whole company’s performance2 = My whole teams’ performance3 = My own performance4 = Other, please specify
Q 23 Are you satisfied with working in this kind of company?
1 = Completely dissatisfied2 = Dissatisfied to some extent3 = Not dissatisfied, nor satisfied4 = Satisfied to some extent5 = Completely satisfied
Q 30: 1) Are you satisfied with your career development in this company up to now?
2) Are you satisfied with your potential career development in this company in the future?
1 = Completely dissatisfied2 = Dissatisfied to some extent3 = Not dissatisfied, nor satisfied4 = Satisfied to some extent5 = Completely satisfied

47
Q 34: 1) I feel appreciated by my closest manager
2) I feel appreciated by the company management (i.e. on the level of my managers’ manager and higher up in the organization)
1 = Disagree completely2 = Disagree to some extent3 = Do not disagree or agree4 = Agree to some extent5 = Agree completely
Q 37 Do you intend to stay with this employer? 1 = No, I am about to quit2 = Yes, but for less than one year3 = Yes, but for less than three years4 = Yes, but for less than five years5 = Yes, for five years or more
Q 38 What would make you seriously interested in leaving this company in order to start working for a competitor?
Please rank the alternatives according to how they would influence you in such a situation:
1 = the most interesting, to 9 = the least interesting
More challenging tasksBetter pay Better benefitsBetter work environmentBetter leadershipBetter career opportunitiesBetter training opportunitiesBetter working conditionsMore healthy work-family balance
The following factors might influence your willingness to remain in this company. Please rank them according to how important you think they are from this point of view.
Pay1= most important, 5 = least important
Q 39 That I have a regular raise in pay
That the criteria for having a pay raise are fair
That the procedures for deciding on a pay raise are fair
That the procedures for deciding on a pay raise are known by the employees
That I can have the pay raise I deserve, even if this means that I will have a higher/much higher raise than my colleagues
____
____
____
____
____

48
Bonus and Benefits1= most important, 4 = least important
Q 40That my company uses a bonus system
That I, complementary to my salary, will receive various benefits
That I have the possibility to chose from a range of benefits, i.e. that I can compose my own benefit package
That I can have the opportunity to become a share holder in the company
____
____
____
____
Training and Skill Development1= most important, 5 = least important
Q 41 That I have access to relevant training programmes and skill development activities
That the training and development offered by my company is relevant for my daily work
That the training and development offered by my company is aligned with my expectations and my personal development needs related to work
That my employer organizes continuous follow-up, feedback-sessions, knowledge sharing activities after the training
That I feel satisfied with the way completed training activities are being rewarded (raise in salary, promotion etc.)
____
____
____
____
____

49
Career Development1= most important, 5 = least important
Q 42 That I am satisfied with my current career development in this company
That I am satisfied with my possible future career development in this company
That my personal career development is aligned with the company’s goals
That I, as part of my personal career development can expect to be promoted with regular intervals
That my company takes its’ employees career development seriously
____
____
____
____
____
Leadership1= most important, 5 = least important
Q 43 That my closest manager puts focus on the task, pushing the employees to meet the set goals on time
That my closest manager puts focus on relations, striving to support the employees in their efforts to reach the goals
That my closest manager puts focus on development, encouraging the employees to see new opportunities and also to act upon them
That my closest manager puts focus on creating a good working atmosphere
That I have a good working relation with my closest manager
____
____
____
____
____
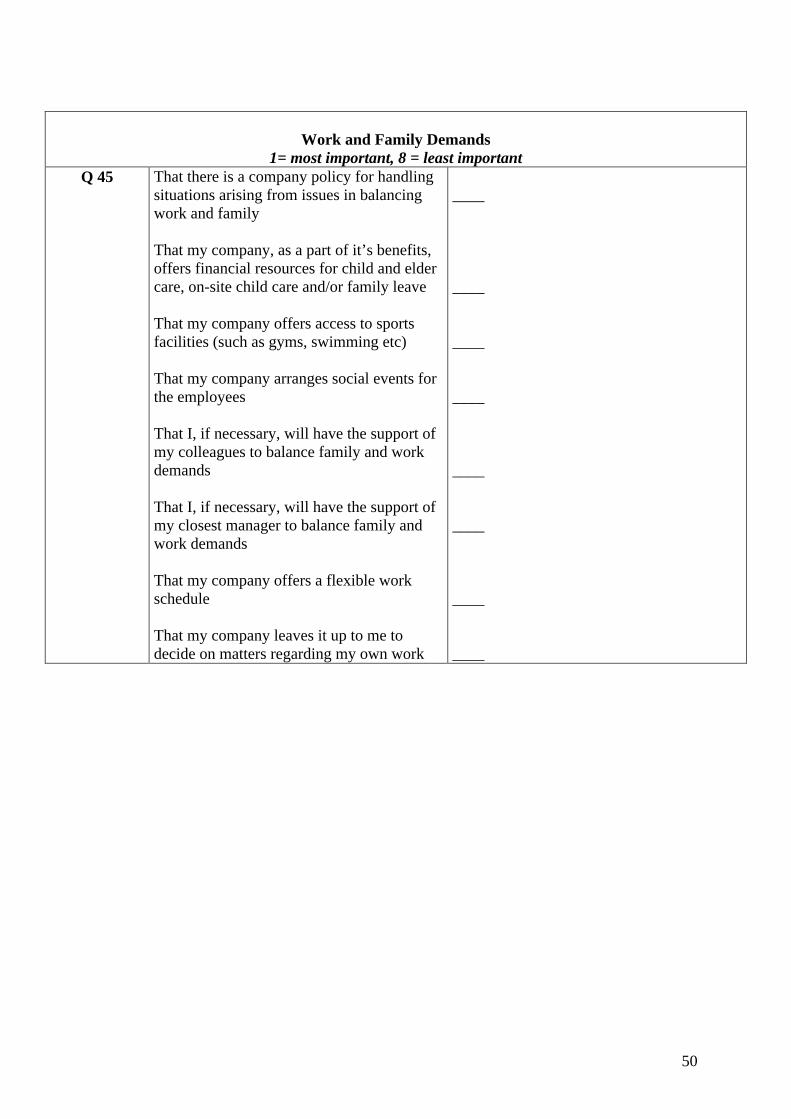
50
Work and Family Demands1= most important, 8 = least important
Q 45 That there is a company policy for handling situations arising from issues in balancing work and family
That my company, as a part of it’s benefits, offers financial resources for child and elder care, on-site child care and/or family leave
That my company offers access to sports facilities (such as gyms, swimming etc)
That my company arranges social events for the employees
That I, if necessary, will have the support of my colleagues to balance family and work demands
That I, if necessary, will have the support of my closest manager to balance family and work demands
That my company offers a flexible work schedule
That my company leaves it up to me to decide on matters regarding my own work
____
____
____
____
____
____
____
____

51
Appendix 3: Statistics analysed through SPSS
Table 1a: Gender
Frequency Percent Valid Percent Cumulative PercentMen 52 40,3 40,3 40,3Women 77 59,7 59,7 100,0
Valid
Total 129 100,0 100,0
Table 2b: Age group
Frequency Percent Valid PercentCumulative Percent
18-29 30 23,3 23,3 23,330-39 26 20,2 20,2 43,440-49 33 25,6 25,6 69,050-59 33 25,6 25,6 94,660+ 7 5,4 5,4 100,0
Valid
Total 129 100,0 100,0
Table 3c: Annual salary
Frequency Percent Valid PercentCumulative
Percent<20 2 1,6 1,6 1,621-30 40 31,0 31,0 32,631-40 37 28,7 28,7 61,241-50 19 14,7 14,7 76,051-60 17 13,2 13,2 89,161-70 5 3,9 3,9 93,071-80 6 4,7 4,7 97,781-90 1 ,8 ,8 98,4>90 2 1,6 1,6 100,0
1000 Euros
Total 129 100,0 100,0
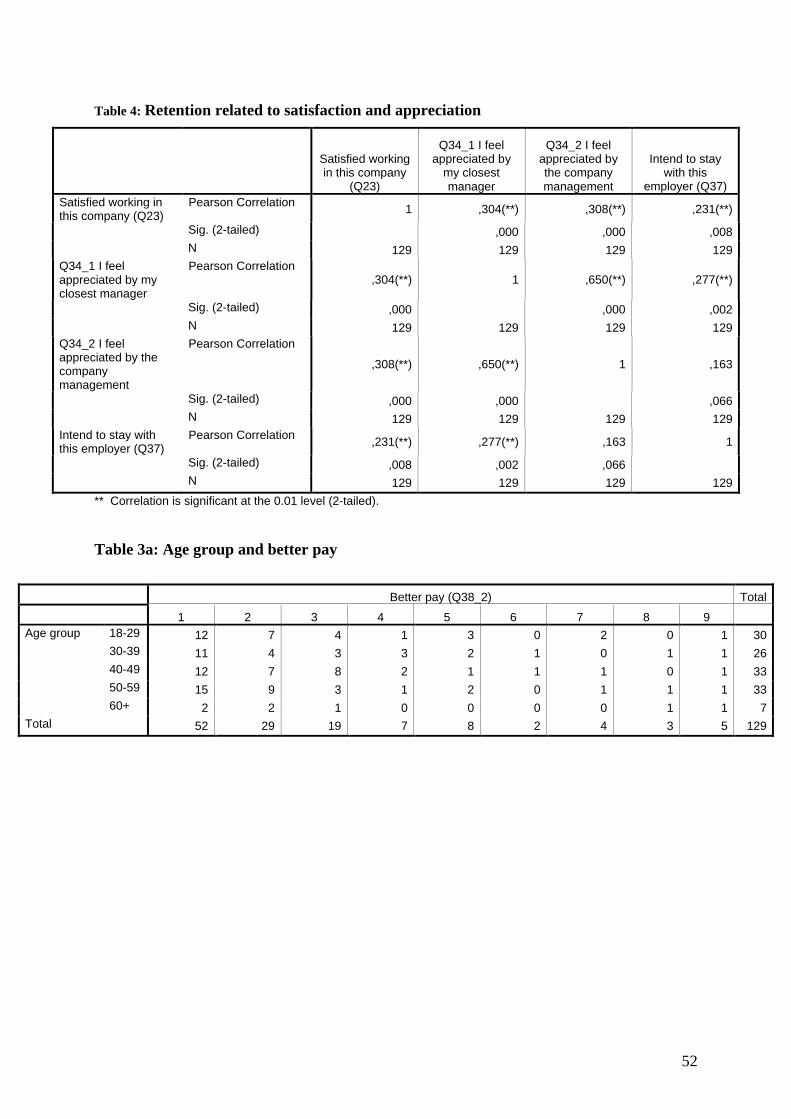
52
Table 4: Retention related to satisfaction and appreciation
Satisfied working in this company
(Q23)
Q34_1 I feel appreciated by
my closest manager
Q34_2 I feel appreciated by the company management
Intend to stay with this
employer (Q37)Satisfied working in this company (Q23)
Pearson Correlation1 ,304(**) ,308(**) ,231(**)
Sig. (2-tailed) ,000 ,000 ,008N 129 129 129 129
Q34_1 I feel appreciated by my closest manager
Pearson Correlation,304(**) 1 ,650(**) ,277(**)
Sig. (2-tailed) ,000 ,000 ,002N 129 129 129 129
Q34_2 I feel appreciated by the company management
Pearson Correlation
,308(**) ,650(**) 1 ,163
Sig. (2-tailed) ,000 ,000 ,066N 129 129 129 129
Intend to stay with this employer (Q37)
Pearson Correlation,231(**) ,277(**) ,163 1
Sig. (2-tailed) ,008 ,002 ,066N 129 129 129 129
** Correlation is significant at the 0.01 level (2-tailed).
Table 3a: Age group and better pay
Better pay (Q38_2) Total
1 2 3 4 5 6 7 8 9Age group 18-29 12 7 4 1 3 0 2 0 1 30
30-39 11 4 3 3 2 1 0 1 1 2640-49 12 7 8 2 1 1 1 0 1 3350-59 15 9 3 1 2 0 1 1 1 3360+ 2 2 1 0 0 0 0 1 1 7
Total 52 29 19 7 8 2 4 3 5 129

53
Table 5a: Leadership style
N Minimum Maximum Ranking Mean Std. DeviationThat my closest mngr puts focus on the task (Q43_1)
129 0 5 5 3,62 1,552
That my closest mngr put focus on relations (Q43_2)
129 0 5 3 2,47 1,263
That my closest mngr puts focus on dvelopment (Q43_3)
129 0 5 4 2,81 1,335
That my closest mngr puts focus on creating a good working atmosphere (Q43_4)
129 0 5 2 2,38 1,376
That I have a good working relation with my closest mngr (Q43_5)
129 0 5 1 2,31 1,430
Valid N (listwise) 129
Table 6b: Leadership style with gender
Gender (Q1) NRanking
Mean Std. DeviationStd. Error
MeanThat my closest mngr puts focus on the task (Q43_1)
Men52 5 3,63 1,442 ,200
Women 77 5 3,61 1,632 ,186
That my closest mngr pust focus on relations (Q43_2)
Men52 3 2,67 1,216 ,169
Women
77 1 2,34 1,284 ,146
That my closest mngr puts focus on dvelopment (Q43_3)
Men52 4 2,96 1,252 ,174
Women 77 4 2,70 1,387 ,158That my closest mngr puts focus on creating a good working atmosphere (Q43_4)
Men
52 2 2,13 1,221 ,169
Women 77 3 2,55 1,456 ,166That I have a good working relation with my closest mngr (Q43_5)
Men52 1 2,00 1,455 ,202
Women 77 2 2,52 1,382 ,158

54
Table 7: Knowledge and development
N Minimum Rankning Maximum Mean Std. DeviationThat I have access to relevant training and skill development (Q41_1)
129 0
1
5 2,35 1,412
That the training and development is relevant for my daily work (Q41_2)
129 0
2
5 2,47 1,317
That the training and development is aligned with expect and pers dev needs (Q41_3)
129 0
3
5 2,57 1,339
That my empl organizes follow up, feedback, knowledge sharing after training (Q41_4)
129 0
5
5 3,45 1,408
That the rewards after completed training is satisfactory (Q41_5)
129 0
4
5 3,12 1,534
Valid N (listwise) 129
Table 8: Career and development
N Ranking Minimum Maximum Mean Std. DeviationThat I am satisfied with my current career dev in this comp (Q42_1)
129
2
0 5 2,21 1,434
That I am satisfied with my possible future career dev in this comp (Q42_2)
129
1
0 5 2,10 1,172
That my personal career dev is aligned with the company's goals (Q42_3)
129
4
0 5 3,06 1,456
That I can expect to be promoted with regular intervalls (Q42_4)
129
5
0 5 3,49 1,537
That my company takes it's employees career dev seriously (Q42_5)
129
3
0 5 2,71 1,438
Valid N (listwise) 129

55
Table 9: Reason for turnover
N Minimum Mean Maximum Mean Std. DeviationLeaving More challenging tasks (Q38_1) 129 1 2 9 4,57 3,127
Better pay (Q38_2) 129 1 1 9 2,67 2,163Better benefits (Q38_3) 129 1 2 9 4,57 2,420Better work environment (Q38_4) 129 1 9 9 5,72 2,443
Better leadership (Q38_5) 129 1 8 9 5,41 2,530Better career opportunities (Q38_6) 129 1 4 9 5,03 2,574
Better training opportunities (Q38_7) 129 1 7 9 5,29 2,191
Better working conditions (Q38_8) 129 1 5 9 5,16 2,515
More helathy work-family balance (Q38_9) 129 1 6 9 5,22 2,795
Valid N (listwise) 129
Table 10a: Salary procedure with gender
Gender (Q1) NRanking
Mean Std. DeviationStd. Error
MeanThat I have a regular raise in pay (Q39_1)
Men52 2 2,31 1,245 ,173
Women 77 2 2,40 1,369 ,156That there are fair criteria for pay raise (Q39_2)
Men52 3 2,75 1,135 ,157
Women77 2 2,40 1,139 ,130
That there are fair procedures for deciding on pay raise (Q39_3)
Men52 4 3,06 1,074 ,149
Women 77 4 2,94 1,139 ,130That the procedures for deciding on pay raise known by employees (Q39_4)
Men
52 5 4,06 1,420 ,197
Women 77 5 4,18 1,325 ,151That I get the payraise I deserve even if higher than my colleagues (Q39_5)
Men
52 1 1,81 1,269 ,176
Women 77 1 2,21 1,533 ,175
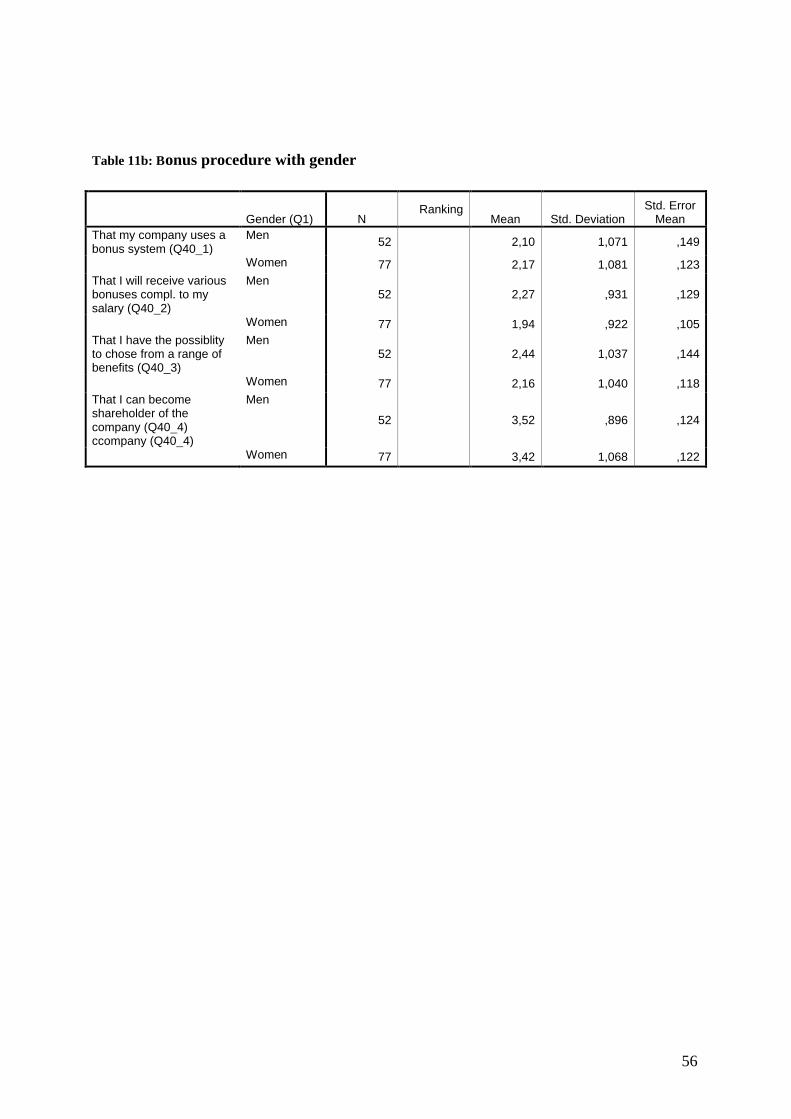
56
Table 11b: Bonus procedure with gender
Gender (Q1) NRanking
Mean Std. DeviationStd. Error
MeanThat my company uses a bonus system (Q40_1)
Men52 2,10 1,071 ,149
Women 77 2,17 1,081 ,123That I will receive various bonuses compl. to my salary (Q40_2)
Men52 2,27 ,931 ,129
Women 77 1,94 ,922 ,105That I have the possiblity to chose from a range of benefits (Q40_3)
Men52 2,44 1,037 ,144
Women 77 2,16 1,040 ,118That I can become shareholder of the company (Q40_4)ccompany (Q40_4)
Men
52 3,52 ,896 ,124
Women 77 3,42 1,068 ,122

57
Table 12: Fairness with pay with retention
Intend to stay with this employer
(Q37)
That I have a regular raise
in pay (Q39_1)
That there are fair criteria for
pay raise (Q39_2)
That there are fair
procedures for deciding on pay raise
(Q39_3)
That the procedures for deciding on pay raise
known by employees
(Q39_4)
That I get the payraise I
deserve even if higher than
my colleagues
(Q39_5)Intend to stay with this employer (Q37)
Pearson Correlation
1 -,135 ,009 ,178(*) -,047 -,022
Sig. (2-tailed) ,127 ,916 ,043 ,599 ,802N 129 129 129 129 129 129
That I have a regular raise in pay (Q39_1)
Pearson Correlation -,135 1 ,148 -,001 -,018 -,211(*)
Sig. (2-tailed) ,127 ,095 ,987 ,837 ,016N 129 129 129 129 129 129
That there are fair criteria for pay raise (Q39_2)
Pearson Correlation ,009 ,148 1 ,277(**) ,174(*) -,191(*)
Sig. (2-tailed) ,916 ,095 ,001 ,048 ,031N
129 129 129 129 129 129
That there are fair procedures for deciding on pay raise (Q39_3)
Pearson Correlation
,178(*) -,001 ,277(**) 1 ,415(**) -,083
Sig. (2-tailed) ,043 ,987 ,001 ,000 ,353N 129 129 129 129 129 129
That the procedures for deciding on pay raise known by employees (Q39_4)
Pearson Correlation
-,047 -,018 ,174(*) ,415(**) 1 ,033
Sig. (2-tailed) ,599 ,837 ,048 ,000 ,713N 129 129 129 129 129 129
That I get the payraise I deserve even if higher than my colleagues (Q39_5)
Pearson Correlation
-,022 -,211(*) -,191(*) -,083 ,033 1
Sig. (2-tailed) ,802 ,016 ,031 ,353 ,713N 129 129 129 129 129 129
* Correlation is significant at the 0.05 level (2-tailed).** Correlation is significant at the 0.01 level (2-tailed).
Table 13: Are you entiteled to bonus payments
Frequency Percent Valid PercentCumulative
PercentBlank 1 ,8 ,8 ,8No 64 49,6 49,6 50,4Yes 64 49,6 49,6 100,0
Valid
Total 129 100,0 100,0

58
Table 14: Do you receive extra benefits
Frequency Percent Valid PercentCumulative
PercentBlank 1 ,8 ,8 ,8No 37 28,7 28,7 29,5Yes 91 70,5 70,5 100,0
Valid
Total 129 100,0 100,0
Table 15: Specified benefits
Frequency(of the 85 respondents specifying the question)
Percent (of the 85 respondents)
Valid Cellular phone 29 34,1
Luncheon vouchers
45 52,9
Interest and exchange benefits
45 52,9
Table 163: Shareholder with retention and position
That I can become shareholder of the company (Q40_4)
Blank 1 2 3 4 Total
Count 0 2 0 0 5 7Top management % within
Position (Q8),0% 28,6% ,0% ,0% 71,4% 100,0%
Count 0 0 0 0 6 6Middle management % within
Position (Q8),0% ,0% ,0% ,0% 100,0% 100,0%
Count 0 1 2 1 6 10First line management % within
Position (Q8),0% 10,0% 20,0% 10,0% 60,0% 100,0%
Count 2 5 10 13 76 106
Position (Q8)
No management position
% within Position (Q8)
1,9% 4,7% 9,4% 12,3% 71,7% 100,0%
Count 2 8 12 14 93 129Total
% within Position (Q8)
1,6% 6,2% 9,3% 10,9% 72,1% 100,0%

59
Table 17: Gender with bonus system
Q19 A bonus system should be based on
,00 1,00 2,00 3,00 4,00 Total
Count 0 16 13 18 5 52Men
% within Gender (Q1)
,0% 30,8% 25,0% 34,6% 9,6% 100,0%
Count 3 34 22 13 5 77
Gender (Q1)
Women
% within Gender (Q1)
3,9% 44,2% 28,6% 16,9% 6,5% 100,0%
Count 3 50 35 31 10 129Total
% within Gender (Q1)
2,3% 38,8% 27,1% 24,0% 7,8% 100,0%
Table 18: Satisfaction pay with retention
Intend to stay with this employer (Q37)
Blank NoYes, < 1
yearYes, < 3
yearsYes, < 5
yearsYes, > 5
years Total
Count 0 0 1 4 4 2 11Completely dissatisfied
% within Q18 ,0% ,0% 9,1% 36,4% 36,4% 18,2% 100,0%
Count 0 2 0 6 4 9 21Dissatisfied to some extent
% within Q18 ,0% 9,5% ,0% 28,6% 19,0% 42,9% 100,0%
Count 1 1 4 10 11 15 42Not dissatisfied, nor satisfied
% within Q18 2,4% 2,4% 9,5% 23,8% 26,2% 35,7% 100,0%
Count 0 2 2 7 9 31 51Satisfied to some extent
% within Q18
,0% 3,9% 3,9% 13,7% 17,6% 60,8% 100,0%
Count 0 0 1 0 1 2 4
Q18 Are you satisfied with what you earn in total
Completely satisfied
% within Q18
,0% ,0% 25,0% ,0% 25,0% 50,0% 100,0%
Count 1 5 8 27 29 59 129Total
% within Q18
,8% 3,9% 6,2% 20,9% 22,5% 45,7% 100,0%

60
Table 19: Pay, bonus, benefit and satisfaction with intention to stay
Intend to stay with this employer
(Q37)
Annual salary (excl bonuses and benefits)
(Q13)Receives
bonus (Q15)Receives
benefits (Q16)
Satisfied with what you earn
Q18Intend to stay with this employer (Q37)
Pearson Correlation 1 ,043 -,083 -,013 ,166
Intend to stay with this employer (Q37)
Pearson Correlation 1 ,043 -,083 -,013 ,166
Sig. (2-tailed) ,632 ,347 ,888 ,060N 129 129 129 129 129
Annual salary (excl bonuses and benefits) (Q13)
Pearson Correlation ,043 1 ,123 ,047 ,489(**)
Sig. (2-tailed) ,632 ,166 ,600 ,000
N 129 129 129 129 129
Receives bonus (Q15)
Pearson Correlation
-,083 ,123 1 ,033 ,108
Sig. (2-tailed) ,347 ,166 ,710 ,224N 129 129 129 129 129
Receives benefits (Q16)
Pearson Correlation
-,013 ,047 ,033 1 ,062
Sig. (2-tailed) ,888 ,600 ,710 ,483N 129 129 129 129 129
Satisfied with what you earn Q 18
Pearson Correlation
,166 ,489(**) ,108 ,062 1
Sig. (2-tailed) ,060 ,000 ,224 ,483N 129 129 129 129 129
* Correlation is significant at the 0.05 level (2-tailed).** Correlation is significant at the 0.01 level (2-tailed).
Table 20: Career with retention
Q30 Career development up to
now
Q30: 2 Potential career develop
mentIntend to stay with
this employer (Q37)Q30: 1 Career development up to now
Pearson Correlation1 ,557(**) ,195(*)
Sig. (2-tailed) ,000 ,027N 129 129 129
Q30: 2 Potential career development
Pearson Correlation,557(**) 1 ,279(**)
Sig. (2-tailed) ,000 ,001N 129 129 129
Intend to stay with this employer (Q37)
Pearson Correlation,195(*) ,279(**) 1
Sig. (2-tailed) ,027 ,001N
129 129 129
** Correlation is significant at the 0.01 level (2-tailed).* Correlation is significant at the 0.05 level (2-tailed).

61
Table 21: Personal workbalance
N Minimum Rankning Maximum MeanStd.
DeviationCompany police for balancing work
and familyWFC_rank_1
129 ,006
8,00 5,0000 2,44949
Financial resources for child and elder care WFC_rank_2
129 ,008
8,00 5,6822 2,43985
Sport facilities WFC_rank_3 129 ,00 5 8,00 4,5039 2,11809Social events WFC_rank_4 129 ,00 7 8,00 5,0078 2,20261Support from colleagues to balance
family and workWFC_rank_5
129 ,004
8,00 4,2171 1,92825
Support from manager to balance family and work demands
WFC_rank_6129 ,00
38,00 3,3798 1,90063
Flexible schedule WFC_rank_7
129 ,002
8,00 2,7674 1,83929
Let me decide on matters regarding my own work
WFC_rank_8129 ,00
18,00 2,3333 1,94989
Valid N (listwise) 129

62
Table 22: Autonomy with retention
Intend to stay with
this employer
(Q37)
Company police for balancing work and
familyWFC_rank
_1
Financial resources for child
and elder care
WFC_rank_2
Sport facilities
WFC_rank_3
Social events
WFC_rank_4
Support from
colleagues to balance family and
workWFC_rank
_5
Support from
manager to balance family and
work demands
WFC_rank_6
Flexible schedule
WFC_rank_7
Let me decide on matters
regarding my own
workWFC_rank
_8Intend to stay with this employer (Q37)
Pearson Correlation
1 -,051 ,087 ,005 -,087 -,152 -,142 ,080 -,081
Sig. (2-tailed)
,564 ,328 ,958 ,327 ,086 ,108 ,367 ,360
N 129 129 129 129 129 129 129 129 129WFC_rank_1
Pearson Correlation
-,051 1 ,362(**) ,226(*) ,081 ,172 ,208(*) -,005 -,082
Sig. (2-tailed)
,564 ,000 ,010 ,361 ,051 ,018 ,953 ,357
N 129 129 129 129 129 129 129 129 129WFC_rank_2
Pearson Correlation
,087 ,362(**) 1 ,190(*) ,181(*) ,118 ,114 ,004 -,130
Sig. (2-tailed)
,328 ,000 ,031 ,040 ,184 ,199 ,962 ,141
N 129 129 129 129 129 129 129 129 129WFC_rank_3
Pearson Correlation
,005 ,226(*) ,190(*) 1 ,436(**) ,122 -,063 ,157 -,013
Sig. (2-tailed)
,958 ,010 ,031 ,000 ,168 ,475 ,076 ,887
N 129 129 129 129 129 129 129 129 129WFC_rank_4
Pearson Correlation
-,087 ,081 ,181(*) ,436(**) 1 ,248(**) ,007 ,066 ,032
Sig. (2-tailed)
,327 ,361 ,040 ,000 ,005 ,939 ,457 ,718
N 129 129 129 129 129 129 129 129 129WFC_rank_5
Pearson Correlation
-,152 ,172 ,118 ,122 ,248(**) 1 ,551(**) -,096 -,044
Sig. (2-tailed)
,086 ,051 ,184 ,168 ,005 ,000 ,280 ,618
N 129 129 129 129 129 129 129 129 129WFC_rank_6
Pearson Correlation
-,142 ,208(*) ,114 -,063 ,007 ,551(**) 1 -,095 -,060
Sig. (2-tailed)
,108 ,018 ,199 ,475 ,939 ,000 ,283 ,501
N 129 129 129 129 129 129 129 129 129WFC_rank_7
Pearson Correlation
,080 -,005 ,004 ,157 ,066 -,096 -,095 1 ,362(**)
Sig. (2-tailed)
,367 ,953 ,962 ,076 ,457 ,280 ,283 ,000
N 129 129 129 129 129 129 129 129 129WFC_rank_8
Pearson Correlation
-,081 -,082 -,130 -,013 ,032 -,044 -,060 ,362(**) 1
Sig. (2-tailed)
,360 ,357 ,141 ,887 ,718 ,618 ,501 ,000
N 129 129 129 129 129 129 129 129 129
** Correlation is significant at the 0.01 level (2-tailed).* Correlation is significant at the 0.05 level (2-tailed).

63
Table 23: Career and retention
Intend to stay with this employer
(Q37)
That I am satisfied with my current
career dev in this comp (Q42_1)
That I am satisfied with my possible future career
dev in this comp (Q42_2)
That my personal
career dev is aligned with
the company's goals (Q42_3)
That I can expect to be
promoted with regular
intervalls (Q42_4)
That my company takes it's employees career dev seriously (Q42_5)
Intend to stay with this employer (Q37)
Pearson Correlation 1 -,048 ,002 ,001 ,075 ,037
Sig. (2-tailed) ,591 ,985 ,992 ,398 ,675N 129 129 129 129 129 129
That I am satisfied with my current career dev in this comp (Q42_1)
Pearson Correlation
-,048 1 ,313(**) ,001 -,114 -,057
Sig. (2-tailed) ,591 ,000 ,989 ,198 ,521
N 129 129 129 129 129 129
That I am satisfied with my possible future career dev in this comp (Q42_2)
Pearson Correlation
,002 ,313(**) 1 ,060 ,111 ,008
Sig. (2-tailed) ,985 ,000 ,496 ,209 ,924N
129 129 129 129 129 129
That my personal career dev is aligned with the company's goals (Q42_3)
Pearson Correlation
,001 ,001 ,060 1 ,301(**) ,188(*)
Sig. (2-tailed) ,992 ,989 ,496 ,001 ,033N 129 129 129 129 129 129
That I can expect to be promoted with regular intervalls (Q42_4)
Pearson Correlation
,075 -,114 ,111 ,301(**) 1 ,285(**)
Sig. (2-tailed) ,398 ,198 ,209 ,001 ,001N 129 129 129 129 129 129
That my company takes it's employees career dev seriously (Q42_5)
Pearson Correlation
,037 -,057 ,008 ,188(*) ,285(**) 1
Sig. (2-tailed) ,675 ,521 ,924 ,033 ,001N 129 129 129 129 129 129
** Correlation is significant at the 0.01 level (2-tailed).* Correlation is significant at the 0.05 level (2-tailed).

64
Table 24: Traning and development with retention
Intend to stay with this employer
(Q37)
That I have access to relevant
training and skill
development (Q41_1)
That the training and
development is relevant for my
daily work (Q41_2)
That the training and
development is aligned with expect and
pers dev needs (Q41_3)
That my empl organizes follow up, feedback, knowledge
sharing after training (Q41_4)
That the rewards after
completed training is
satisfactory (Q41_5)
Intend to stay with this employer (Q37)
Pearson Correlation
1 -,033 -,078 ,013 -,031 -,059
Sig. (2-tailed) ,714 ,379 ,880 ,726 ,508N 129 129 129 129 129 129
access to relevant training and skill development (Q41_1)
Pearson Correlation
-,033 1 ,020 -,012 -,166 -,026
Sig. (2-tailed) ,714 ,824 ,896 ,060 ,769
N 129 129 129 129 129 129
training and development is relevant for my daily work (Q41_2)
Pearson Correlation
-,078 ,020 1 -,044 ,070 -,008
Sig. (2-tailed) ,379 ,824 ,619 ,432 ,927N
129 129 129 129 129 129
training and development is aligned with expect and pers dev needs (Q41_3)
Pearson Correlation
,013 -,012 -,044 1 ,256(**) -,078
Sig. (2-tailed) ,880 ,896 ,619 ,003 ,377N 129 129 129 129 129 129
That my empl organizes feedback, knowledge sharing after training (Q41_4)
Pearson Correlation
-,031 -,166 ,070 ,256(**) 1 ,127
Sig. (2-tailed) ,726 ,060 ,432 ,003 ,150N 129 129 129 129 129 129
rewards after completed training is satisfactory (Q41_5)
Pearson Correlation
-,059 -,026 -,008 -,078 ,127 1
Sig. (2-tailed) ,508 ,769 ,927 ,377 ,150N 129 129 129 129 129 129
** Correlation is significant at the 0.01 level (2-tailed).