Retention and Graduation Rate Analysis · Retention and Graduation Rate Analysis Prepared for...
35
© 2013 Hanover Research | District Administration Practice 1 In the following report, Hanover Research analyzes the retention and graduation rates of students entering Clarion University of Pennsylvania between 2006 and 2011. More specifically, we investigate various academic, institutional, and demographic factors that significantly influence retention and graduation rates. Retention and Graduation Rate Analysis Prepared for Clarion University of Pennsylvania April 2013
Transcript of Retention and Graduation Rate Analysis · Retention and Graduation Rate Analysis Prepared for...

© 2013 Hanover Research | District Administration Practice 1
In the following report, Hanover Research analyzes the retention and graduation rates of
students entering Clarion University of Pennsylvania between 2006 and 2011. More
specifically, we investigate various academic, institutional, and demographic factors that
significantly influence retention and graduation rates.
Retention and Graduation Rate
Analysis
Prepared for Clarion University of Pennsylvania
April 2013

Hanover Research | April 2013
© 2013 Hanover Research | District Administration Practice 2
TABLE OF CONTENTS
Executive Summary and Key Findings ............................................................................... 3
Introduction ........................................................................................................................... 3
Discussion .............................................................................................................................. 3
Structure of the Report .......................................................................................................... 4
Key Findings ........................................................................................................................... 4
Factors Promoting Retention............................................................................................. 4
Factors Promoting Retention for One Additional Year...................................................... 5
Factors Correlated with Graduation in Four Years ............................................................ 5
Factors Correlated with Graduation in Five Years ............................................................. 6
Section I: Methodology .................................................................................................... 7
Regression Analysis ................................................................................................................ 7
Dependent (Outcome) Variable ........................................................................................ 8
Independent (Explanatory) Variables .............................................................................. 12
Section II: Regression Analysis ........................................................................................ 19
Regression Results: Set 1 Models ........................................................................................ 19
Key Findings Across Set 1 Models .................................................................................... 20
Model 1 (2nd Year Retention) ........................................................................................... 20
Model 2 and 3 (3rd and 4th Year Retention) ..................................................................... 20
Model 4 (5th Year Retention) ........................................................................................... 21
Model 5 (6th Year Retention) ........................................................................................... 21
Regression Results: Set 2 Models ........................................................................................ 23
Key Findings Across Set 2 Models .................................................................................... 23
Model 6 (3rd Year Conditional Retention) ........................................................................ 23
Model 7 (4th Year Conditional Retention) ........................................................................ 24
Model 8 (5th Year Conditional Retention) ........................................................................ 24
Model 9 (6th Year Conditional Retention) ........................................................................ 24
Regression Results: Set 3 Models ........................................................................................ 26
Model 10 (Graduation within Four Years) ....................................................................... 26
Model 11 (Graduation within Five Years) ........................................................................ 27
Appendix A: Retention Rates .......................................................................................... 29
Appendix B: Graduation Rates ........................................................................................ 32
Hanover Research | April 2013
© 2013 Hanover Research | District Administration Practice 3
EXECUTIVE SUMMARY AND KEY FINDINGS
INTRODUCTION
In the following report, Hanover Research investigates the factors contributing to bachelor’s degree-seeking students’ retention and graduation rates at Clarion University of Pennsylvania (Clarion). In particular, we use the data supplied by Clarion to assess which demographic, institutional, and academic variables proved the most useful predictors of four-year and five-year graduation and second, third, fourth, fifth, and sixth year retention for students entering in fall 2006 through 2011. In our analysis of Clarion’s data, we developed three sets of models. The first set analyzes factors associated with higher retention, with a focus on factors Clarion could know before a student begins their studies at the university. Next, the second set of models analyzes factors that can help a student be retained for an additional year, given that they were retained through the previous year. Lastly, the third set of models analyzes factors associated with increased graduation rates within four years and five years of enrollment at the university.
DISCUSSION
In terms of the most notable outcomes of our analysis, we find that a student’s high school ranking is a strong predictor of retention and graduation. A higher high school rank leads to higher retention, and ultimately a higher likelihood of graduation within four or five years of enrollment. This finding suggests that as Clarion seeks to boost retention and graduation rates, the university should strive to increase its admission rates of higher ranked students. As Clarion explained to Hanover, the university has found high school GPA to be a helpful predictor of retention and graduation in the past. In the datasets provided to Hanover, an extremely large number of students had missing values for the high school GPA variable (listed as “0” in the files) and therefore high school GPA was excluded from our analysis. Nevertheless, the finding that high school ranking (a reasonable proxy for high school GPA) is a strong predictor of retention aligns well with Clarion’s experience. Unfortunately, we also find that minorities, particularly black students, have a lower likelihood of retention and graduation within four or five years at Clarion. This finding holds true even after controlling for high school ranking, age, gender, and other observable variables. Based on this result, Hanover recommends a review of why black students are not being retained at higher rates at the university, with the goal of uncovering strategies to better support these students. Other notable takeaways from our analysis include the finding that being a student athlete increases a student’s likelihood of retention in their third and fourth year, as well as
Hanover Research | April 2013
© 2013 Hanover Research | District Administration Practice 4
improves their chances of graduating within five years at Clarion. Perhaps unsurprisingly, having a higher first year GPA also boosts a student’s chances of retention and graduation. With regard to coursework, we find that if a student attempts a higher number of credits during the spring semester, they are more likely to be retained the following year. Additionally, if a student fails particular courses – ENG 111, MATH 050, MATH 110, and MATH 112 – they are less likely to be retained by the university in the next year. All of these findings offer insight into concrete predictors of retention and graduation at the university and should assist in identifying groups of students who may need additional support while progressing toward graduation.
STRUCTURE OF THE REPORT
The report is organized as follows: In Section I, we provide a description of the methodology and data used to evaluate the factors affecting graduation and retention. In Section II, we discuss and present our findings from the regression models that quantify the effects of individual academic, institutional, and demographic factors on students’ likelihood of retention and graduation. Further, in Appendix A and B, we present cross-tabulations of retention and graduation rates broken down by students’ gender, ethnicity, and high school class rank. Before proceeding to the body of the report, below we offer a more detailed breakdown of the key findings of our analysis.
KEY FINDINGS
FACTORS PROMOTING RETENTION
The following factors were found to be key predictors of retention:
1) Ranking in the top quarter of a high school class – For example, a student ranked in the top 10 percent of his or her class is 19 percent more likely to be retained in their second year at Clarion compared to a student whose ranking is within the 50-75 percent range of their high school class.1
2) Achieving higher SAT scores – While higher SAT scores were linked to an increased likelihood of being retained, the magnitude of this effect was fairly small. For instance, for every 100-point increase in total SAT score (Math, Reading, and Writing combined), a student’s probability of being retained in his or her second year is expected to increase by less than 1 percent.
Additionally, minorities, particularly black students, are found to have lower retention rates. Holding other factors equal, our models indicate that a black student would be 12 to 19 percent less likely to be retained than a white student.
1 Note that the high school class rank measure calculates a given student’s rank as a percentage of the number of
students in his or her high school class. For example, a student who is ranked 32nd
out of a class of 100 would have a value of 32 percent on this measure.
Hanover Research | April 2013
© 2013 Hanover Research | District Administration Practice 5
FACTORS PROMOTING RETENTION FOR ONE ADDITIONAL YEAR
Described as “conditional retention” in our report, the following factors are associated with an increased likelihood of being retained for an additional year if a student has completed their previous year of study at Clarion.
1) Achieving a higher first year GPA at Clarion – A one-point increase in first year GPA (e.g., 2.0 to 3.0) is associated with a roughly 3-4 percent increase in the likelihood of being retained for an additional year.
2) Being a student athlete in the previous year – The chances of an athlete being retained in the third or fourth year at Clarion is approximately 3-6 percent higher than that of a non-athlete.
3) Attempting a higher number of credits in the previous semester – For example, a one-credit increase in the number of credits attempted in the previous spring semester is associated with a 4 percent increase in the likelihood of being retained in the third year. Further, a three-credit increase would be associated with a 12 percent boost in the likelihood of being retained.
Additionally, failing the following subjects is associated with a decreased likelihood of retention for an additional year (if the student has completed the previous year). The estimated magnitude of this decline in likelihood of retention is 8-18 percent depending on the course/year of retention.
1) Failing MATH 110 adversely affects third year retention. 2) Failing ENG 111 or MATH 050 adversely affects third and fourth year retention 3) Failing MATH 112 adversely affects third and fifth year retention.
FACTORS CORRELATED WITH GRADUATION IN FOUR YEARS
The following factors are associated with a higher likelihood of graduating in four years.
1) Having a higher high school ranking – For example, a student ranked in the top 10 percent of his or her high school class is roughly 12 percent more likely to graduate in four years than a student whose ranking falls between 25-50 percent of the class.
2) Having a higher first year GPA – For every one-point increase in first year GPA, a student’s probability of graduating within four years increases by 15 percent.
Further, being black was found to decrease a student’s likelihood of graduation in four years by 11 percent, as compared to being white.
Hanover Research | April 2013
© 2013 Hanover Research | District Administration Practice 6
FACTORS CORRELATED WITH GRADUATION IN FIVE YEARS
The following factors are associated with a higher likelihood of graduating in five years.
1) Being female – Increases a student’s likelihood of graduating in five years by 10 percent, as compared to being a male.
2) Ranking in the top half of a high school class – For example, a student whose rank falls between 50 and 75 percent of the high school class is 17 percent less likely to graduate within five years than a student in the top 10 percent.
3) Being an athlete – Student athletes are nearly 9 percent more likely to graduate within five years, as compared to non-athletes.
Finally, similar to our previous findings on retention and four-year graduation, being black decreases the probability of a student graduating within five years by 13 percent, as compared to being white.
Hanover Research | April 2013
© 2013 Hanover Research | District Administration Practice 7
SECTION I: METHODOLOGY In this section, we offer an overview of the data and methodology used in our analysis. Clarion provided Hanover with seven different datasets (a separate dataset for each year), containing demographic, academic, and institutional information of students between the years 2006 and 2012. More specifically, the data included the following:
Demographic data – Students’ gender, age, and race
Academic data o Pre-university (high school) – Students’ high school class ranking and SAT
scores o University – Students’ first GPA, performance in specific courses (ENG 110,
ENG 111, MATH 050, MATH 110, MATH 112, and MGMT 120), number of credits earned in each fall semester, and number of credits attempted in each spring semester.
Institutional data – Students’ starting year, graduation year, and athlete status Our analysis is based on a master dataset that was created by combining the seven datasets provided by Clarion. From each of the datasets, we selected students who enrolled at Clarion in that year (either freshmen or transfer students). This provided us with a list of 9,131 unique students, who enrolled at Clarion between 2006 and 2011. For each of these students we checked whether they appeared in the subsequent year’s dataset. Students who appeared in the subsequent year’s dataset were marked as retained while students who did not graduate and did not appear in the subsequent year’s dataset were marked as not retained. Note that 299 students were dropped from our combined dataset as these students continued to appear in the Clarion datasets even though they had been identified as graduates of the previous year. Our final dataset available for analysis therefore contains 8,832 unique students.
REGRESSION ANALYSIS
In order to examine the impact of the various demographic, academic, and institutional factors on retention and graduation rates, we constructed a series of linear probability models (LPMs). Overall, we estimated 11 models grouped as Sets 1, 2, and 3, based on the dependent (i.e., outcome) variable used.2 LPMs represent a variation of the standard ordinary least squares (OLS) regression model used to analyze dichotomous dependent variables. Dichotomous variables assume one of two values; in the context of the present analysis, we assign a value of 1 to our dependent variable in cases where students meet a specific criterion (e.g., having been retained or having graduated) and a value of 0 otherwise (having not been retained or having not graduated).
2 As described in greater detail below, the dependent variables examined in this analysis include retention
(corresponding to Set 1), “conditional” retention (Set 2), and graduation (Set 3).
Hanover Research | April 2013
© 2013 Hanover Research | District Administration Practice 8
For each of our regression models, we provide coefficient estimates, as well as an indication of which coefficients proved statistically significant. The coefficients of our models reveal how much we expect the dependent variable to change when the independent variable increases by one unit, holding all of the other independent variables in the model constant. In the context of LPMs, the coefficients capture the change in the likelihood of retention or graduation, depending on the model estimated. More specifically, multiplying the coefficients by 100 percent indicates the extent to which the likelihood changes due to a one-unit increase in the associated independent variable. For example, as seen in Figure 2.2, a one-unit increase in first GPA leads to a 4.21 percent rise in the probability of first year retention in Model 6. Lastly, when presenting our results, we also include the R-squared value, which reveals the percentage of variation in the dependent variable accounted for by the model. Using Figure 2.2 and Model 6 as an example once again, the R-squared value of 0.3284 indicates that the model can explain 32.84 percent of the variation in retention.
DEPENDENT (OUTCOME) VARIABLE
As discussed previously, we used three types of dependent, or outcome, variables in our regression analysis. We describe the dependent variables as follows:
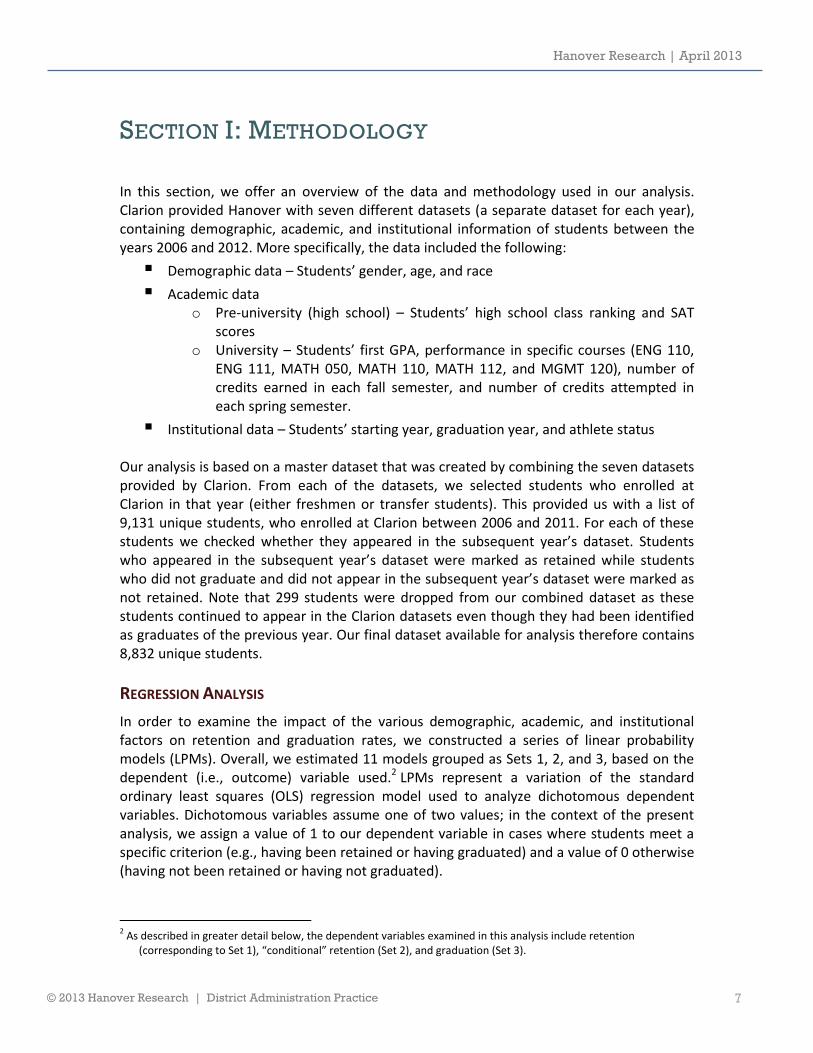
Set 1 (Models 1, 2, 3, 4, and 5): The dependent variable in this set of models indicates whether or not a student (who did not yet graduate) was retained in a particular year of study. For instance, the second year retention of a student who initially enrolled at Clarion in 2006 indicates whether or not the student was retained in 2007. Similarly, the third year retention of that same student indicates whether he or she was retained in 2008. Please note that a particular year’s retention, as defined by this outcome variable, is independent of the students’ retention in the immediate previous year.3 Figure 1.1 below helps understand what a particular year’s retention means for students who enrolled at Clarion between 2006 and 2011. We estimate separate models for different years of retention.
Figure 1.1: Retention Years
STARTING
YEAR 2ND
YEAR
RETENTION 3RD
YEAR
RETENTION 4TH
YEAR
RETENTION 5TH
YEAR
RETENTION 6TH
YEAR
RETENTION
2006 2007 2008 2009 2010 2011
2007 2008 2009 2010 2011 2012
2008 2009 2010 2011 2012 --
2009 2010 2011 2012 -- --
3 In other words, if a student initially enrolled in 2006 but did not re-enroll in 2007, they would be marked as retained
under “second year retention.” However, if this same student re-enrolled in 2008, they would then be marked as retained under “third year retention.” As discussed in greater detail below, the Set 2 models focus on “conditional retention,” a measure that takes into account whether a student had been enrolled in the previous year at Clarion in addition to whether they were enrolled in the current year.
Hanover Research | April 2013
© 2013 Hanover Research | District Administration Practice 9
STARTING
YEAR 2ND
YEAR
RETENTION 3RD
YEAR
RETENTION 4TH
YEAR
RETENTION 5TH
YEAR
RETENTION 6TH
YEAR
RETENTION
2010 2011 2012 -- -- --
2011 2012 -- -- -- --
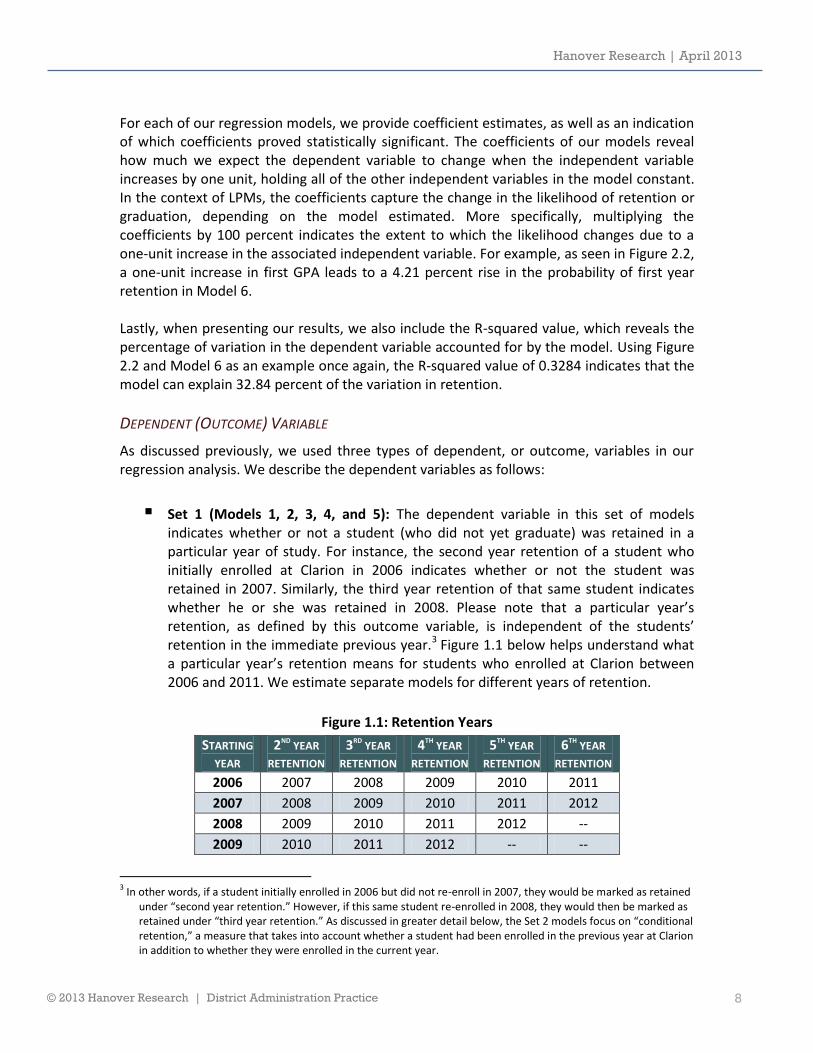
In Figure 1.2, we provide descriptive statistics of the dependent variables used for each model in Set 1. For each of the student cohorts (e.g., students beginning in fall 2006, students beginning in fall 2007, etc.), we provide the percentage of students who were retained and not retained. The table indicates that for all cohorts, the retention rate declines over the years. Please note that we have also provided a breakdown of retention rates by various subgroups in Appendix A.
Figure 1.2: Distribution of Dependent Variables in Set 1 – Descriptive Statistics
STARTING
TERM STATUS
2ND YEAR
RETENTION 3RD
YEAR
RETENTION 4TH
YEAR
RETENTION 5TH
YEAR
RETENTION 6TH
YEAR
RETENTION
Fall 2006
Not Retained 32% 44% 50% 69% 92%
Retained 68% 56% 50% 31% 8%
Count 1,436 1,414 1,346 1,013 792
Fall 2007
Not Retained 29% 39% 44% 67% 92%
Retained 71% 61% 56% 33% 8%
Count 1,437 1,421 1,365 979 744
Fall 2008
Not Retained 31% 43% 49% 71% --
Retained 69% 57% 51% 29% --
Count 1,416 1,388 1,326 989 --
Fall 2009
Not Retained 31% 41% 48% -- --
Retained 69% 59% 52% -- --
Count 1,582 1,561 1,499 -- --
Fall 2010
Not Retained 30% 42% -- -- --
Retained 70% 58% -- -- --
Count 1,527 1,495 -- -- --
Fall 2011
Not Retained 31% -- -- -- --
Retained 69% -- -- -- --
Count 1,418 -- -- -- --
Total 8,816 7,279 5,536 2,981 1,536
Set 2 (Models 6, 7, 8, and 9): The dependent variable for the models in Set 2 assumes a value of 1 whenever a student who was retained in a particular year is enrolled in the following year and a value of 0 whenever a student who was retained in a particular year is not enrolled in the following year. This is described as “conditional” retention, as being retained in a given year is conditioned on whether a student was retained in the previous year. For instance, in the case of a student who started in 2006, fourth year conditional retention refers to that student being
Hanover Research | April 2013
© 2013 Hanover Research | District Administration Practice 10
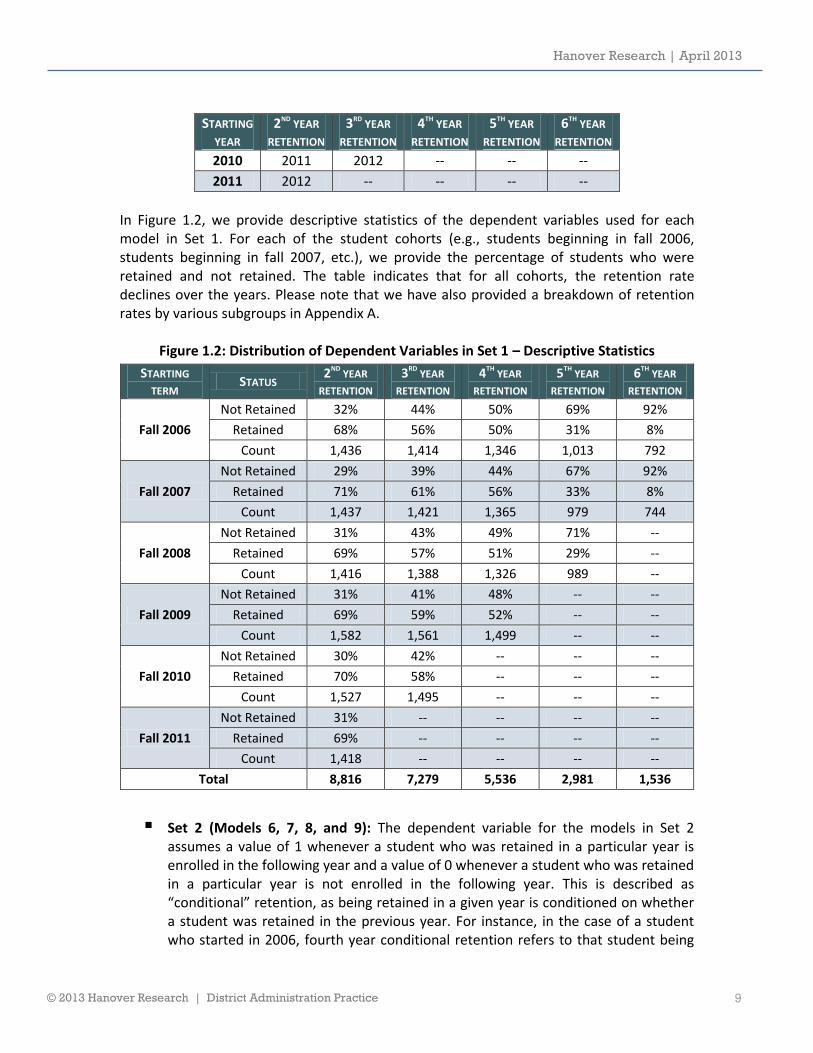
retained in 2009 given that he/she was also retained in 2008. The table below provides brief clarification of what a particular year’s conditional retention indicates.
Figure 1.3: Conditional Retention
STARTING
YEAR 3RD
YEAR CONDITIONAL
RETENTION 4TH
YEAR CONDITIONAL
RETENTION 5TH
YEAR CONDITIONAL
RETENTION 6TH
YEAR CONDITIONAL
RETENTION
2006
Students retained in 2007, did not graduate,
and were retained again in 2008
Students retained in 2008, did not graduate,
and were retained again in 2009
Students retained in 2009, did not graduate,
and were retained again in 2010
Students retained in 2010, did not graduate,
and were retained again in 2011
2007
Students retained in 2008, did not graduate,
and were retained again in 2009
Students retained in 2009, did not graduate,
and were retained again in 2010
Students retained in 2010, did not graduate,
and were retained again in 2011
Students retained in 2011, did not graduate,
and were retained again in 2012
2008
Students retained in 2009, did not graduate,
and were retained again in 2010
Students retained in 2010, did not graduate,
and were retained again in 2011
Students retained in 2011, did not graduate,
and were retained again in 2012
--
2009
Students retained in 2010, did not graduate,
and were retained again in 2011
Students retained in 2011, did not graduate,
and were retained again in 2012
-- --
2010
Students retained in 2011, did not graduate,
and were retained again in 2012
-- -- --
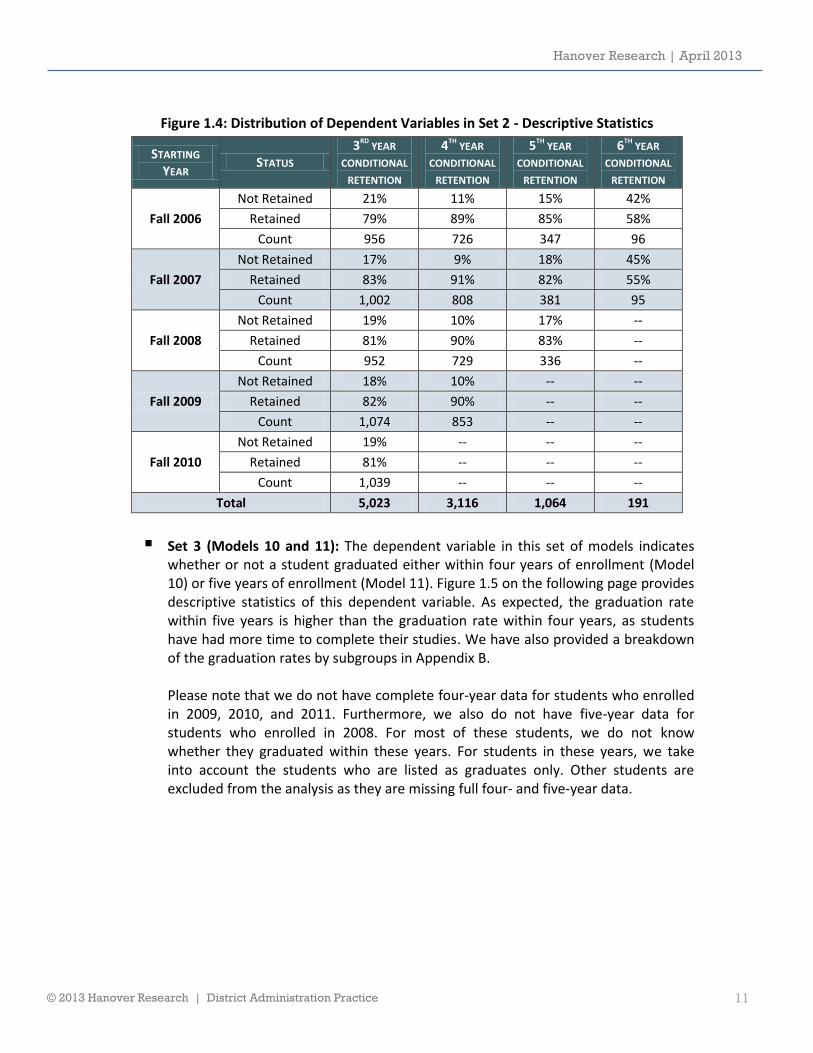
As the above table illustrates, conditional retention only looks at the group of students who had been retained in the previous year. For example, if a student is marked as “not retained” in the third year, they would not be included in the calculation of fourth year retention (only students who had been retained in the third year would be included). This differs from the dependent variable used in the Set 1 models, where the measure of retention is not conditioned on whether the student was enrolled in the previous year. Figure 1.4 on the following page provides descriptive statistics of the dependent variables used in the Set 2 models. In general, between the third year and fifth year, the conditional retention rate increases slightly. Note that we have also provided a breakdown of the conditional retention rates by various sub-groups in Appendix A.
Hanover Research | April 2013
© 2013 Hanover Research | District Administration Practice 11
Figure 1.4: Distribution of Dependent Variables in Set 2 - Descriptive Statistics
STARTING
YEAR STATUS
3RD YEAR
CONDITIONAL
RETENTION
4TH YEAR
CONDITIONAL
RETENTION
5TH YEAR
CONDITIONAL
RETENTION
6TH YEAR
CONDITIONAL
RETENTION
Fall 2006
Not Retained 21% 11% 15% 42%
Retained 79% 89% 85% 58%
Count 956 726 347 96
Fall 2007
Not Retained 17% 9% 18% 45%
Retained 83% 91% 82% 55%
Count 1,002 808 381 95
Fall 2008
Not Retained 19% 10% 17% --
Retained 81% 90% 83% --
Count 952 729 336 --
Fall 2009
Not Retained 18% 10% -- --
Retained 82% 90% -- --
Count 1,074 853 -- --
Fall 2010
Not Retained 19% -- -- --
Retained 81% -- -- --
Count 1,039 -- -- --
Total 5,023 3,116 1,064 191
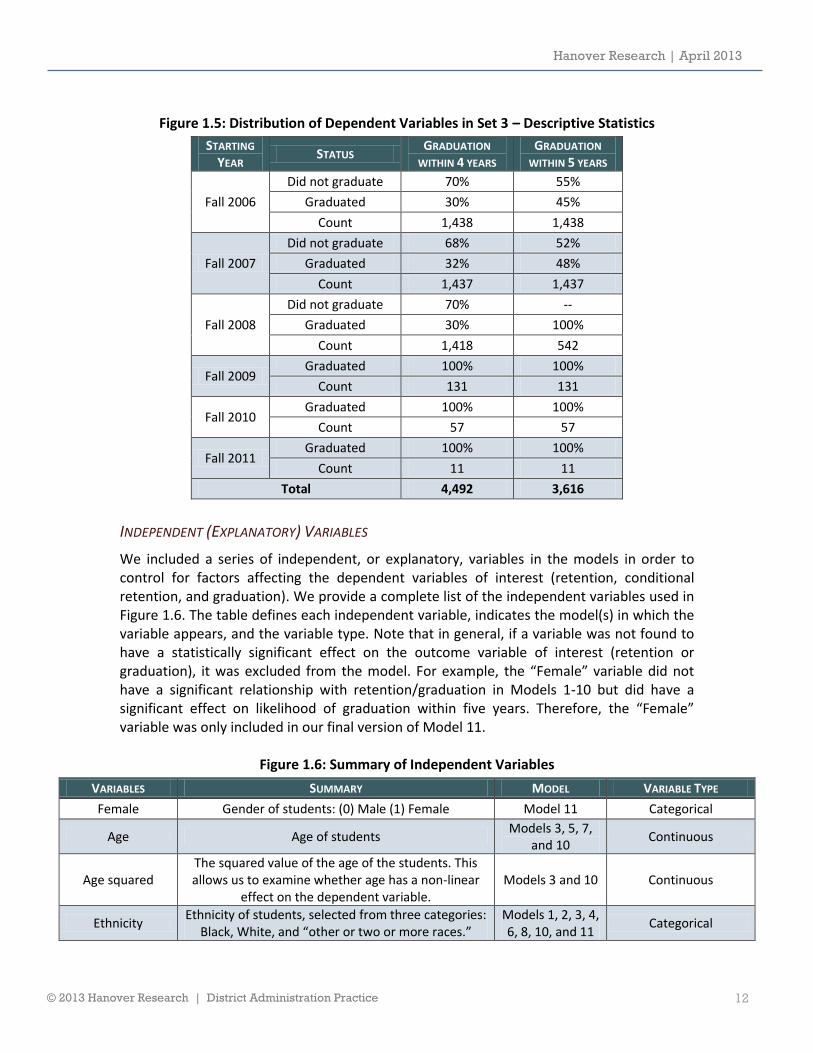
Set 3 (Models 10 and 11): The dependent variable in this set of models indicates whether or not a student graduated either within four years of enrollment (Model 10) or five years of enrollment (Model 11). Figure 1.5 on the following page provides descriptive statistics of this dependent variable. As expected, the graduation rate within five years is higher than the graduation rate within four years, as students have had more time to complete their studies. We have also provided a breakdown of the graduation rates by subgroups in Appendix B. Please note that we do not have complete four-year data for students who enrolled in 2009, 2010, and 2011. Furthermore, we also do not have five-year data for students who enrolled in 2008. For most of these students, we do not know whether they graduated within these years. For students in these years, we take into account the students who are listed as graduates only. Other students are excluded from the analysis as they are missing full four- and five-year data.
Hanover Research | April 2013
© 2013 Hanover Research | District Administration Practice 12
Figure 1.5: Distribution of Dependent Variables in Set 3 – Descriptive Statistics
STARTING
YEAR STATUS
GRADUATION
WITHIN 4 YEARS GRADUATION
WITHIN 5 YEARS
Fall 2006
Did not graduate 70% 55%
Graduated 30% 45%
Count 1,438 1,438
Fall 2007
Did not graduate 68% 52%
Graduated 32% 48%
Count 1,437 1,437
Fall 2008
Did not graduate 70% --
Graduated 30% 100%
Count 1,418 542
Fall 2009 Graduated 100% 100%
Count 131 131
Fall 2010 Graduated 100% 100%
Count 57 57
Fall 2011 Graduated 100% 100%
Count 11 11
Total 4,492 3,616
INDEPENDENT (EXPLANATORY) VARIABLES
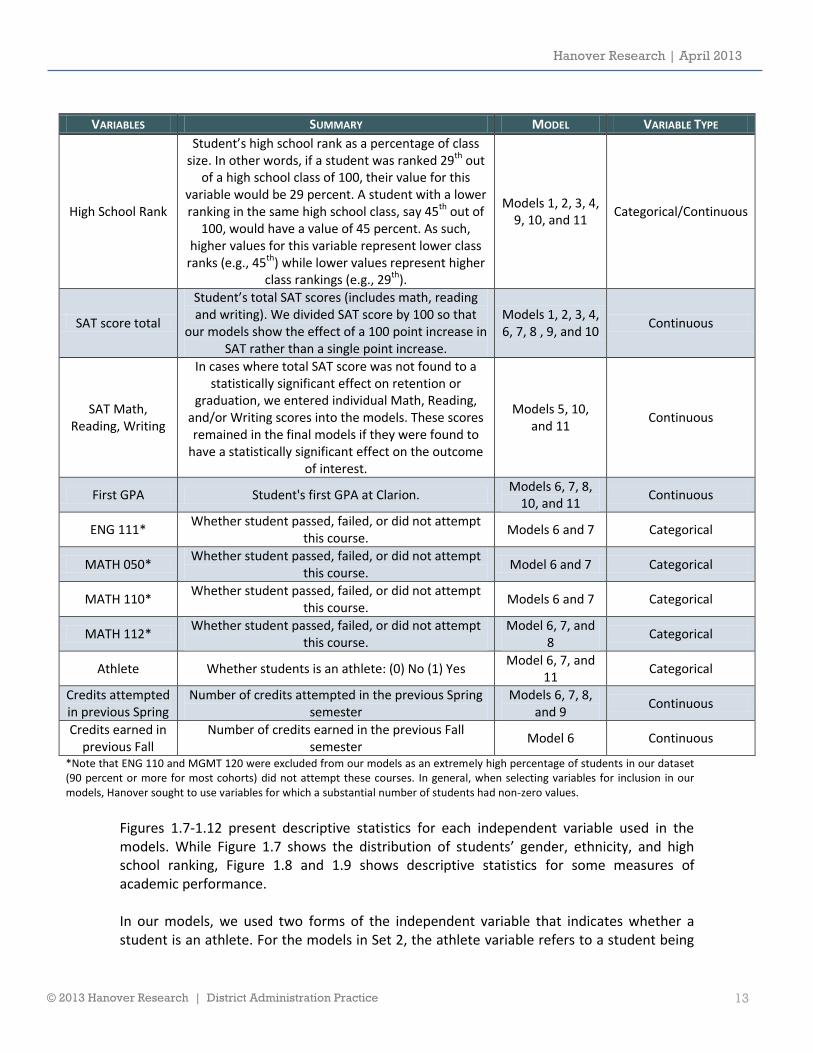
We included a series of independent, or explanatory, variables in the models in order to control for factors affecting the dependent variables of interest (retention, conditional retention, and graduation). We provide a complete list of the independent variables used in Figure 1.6. The table defines each independent variable, indicates the model(s) in which the variable appears, and the variable type. Note that in general, if a variable was not found to have a statistically significant effect on the outcome variable of interest (retention or graduation), it was excluded from the model. For example, the “Female” variable did not have a significant relationship with retention/graduation in Models 1-10 but did have a significant effect on likelihood of graduation within five years. Therefore, the “Female” variable was only included in our final version of Model 11.
Figure 1.6: Summary of Independent Variables
VARIABLES SUMMARY MODEL VARIABLE TYPE
Female Gender of students: (0) Male (1) Female Model 11 Categorical
Age Age of students Models 3, 5, 7,
and 10 Continuous
Age squared The squared value of the age of the students. This allows us to examine whether age has a non-linear
effect on the dependent variable. Models 3 and 10 Continuous
Ethnicity Ethnicity of students, selected from three categories:
Black, White, and “other or two or more races.” Models 1, 2, 3, 4, 6, 8, 10, and 11
Categorical
Hanover Research | April 2013
© 2013 Hanover Research | District Administration Practice 13
VARIABLES SUMMARY MODEL VARIABLE TYPE
High School Rank
Student’s high school rank as a percentage of class size. In other words, if a student was ranked 29th out
of a high school class of 100, their value for this variable would be 29 percent. A student with a lower ranking in the same high school class, say 45th out of
100, would have a value of 45 percent. As such, higher values for this variable represent lower class
ranks (e.g., 45th) while lower values represent higher class rankings (e.g., 29th).
Models 1, 2, 3, 4, 9, 10, and 11
Categorical/Continuous
SAT score total
Student’s total SAT scores (includes math, reading and writing). We divided SAT score by 100 so that
our models show the effect of a 100 point increase in SAT rather than a single point increase.
Models 1, 2, 3, 4, 6, 7, 8 , 9, and 10
Continuous
SAT Math, Reading, Writing
In cases where total SAT score was not found to a statistically significant effect on retention or
graduation, we entered individual Math, Reading, and/or Writing scores into the models. These scores remained in the final models if they were found to
have a statistically significant effect on the outcome of interest.
Models 5, 10, and 11
Continuous
First GPA Student's first GPA at Clarion. Models 6, 7, 8,
10, and 11 Continuous
ENG 111* Whether student passed, failed, or did not attempt
this course. Models 6 and 7 Categorical
MATH 050* Whether student passed, failed, or did not attempt
this course. Model 6 and 7 Categorical
MATH 110* Whether student passed, failed, or did not attempt
this course. Models 6 and 7 Categorical
MATH 112* Whether student passed, failed, or did not attempt
this course. Model 6, 7, and
8 Categorical
Athlete Whether students is an athlete: (0) No (1) Yes Model 6, 7, and
11 Categorical
Credits attempted in previous Spring
Number of credits attempted in the previous Spring semester
Models 6, 7, 8, and 9
Continuous
Credits earned in previous Fall
Number of credits earned in the previous Fall semester
Model 6 Continuous
*Note that ENG 110 and MGMT 120 were excluded from our models as an extremely high percentage of students in our dataset (90 percent or more for most cohorts) did not attempt these courses. In general, when selecting variables for inclusion in our models, Hanover sought to use variables for which a substantial number of students had non-zero values.
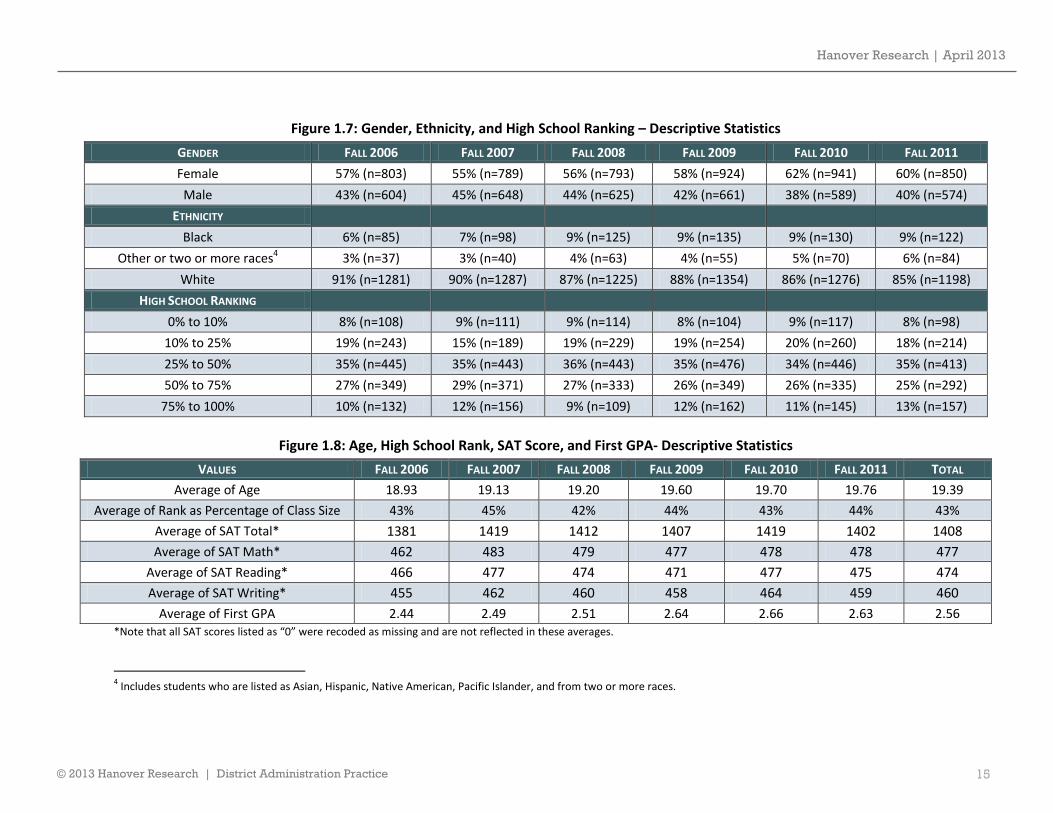
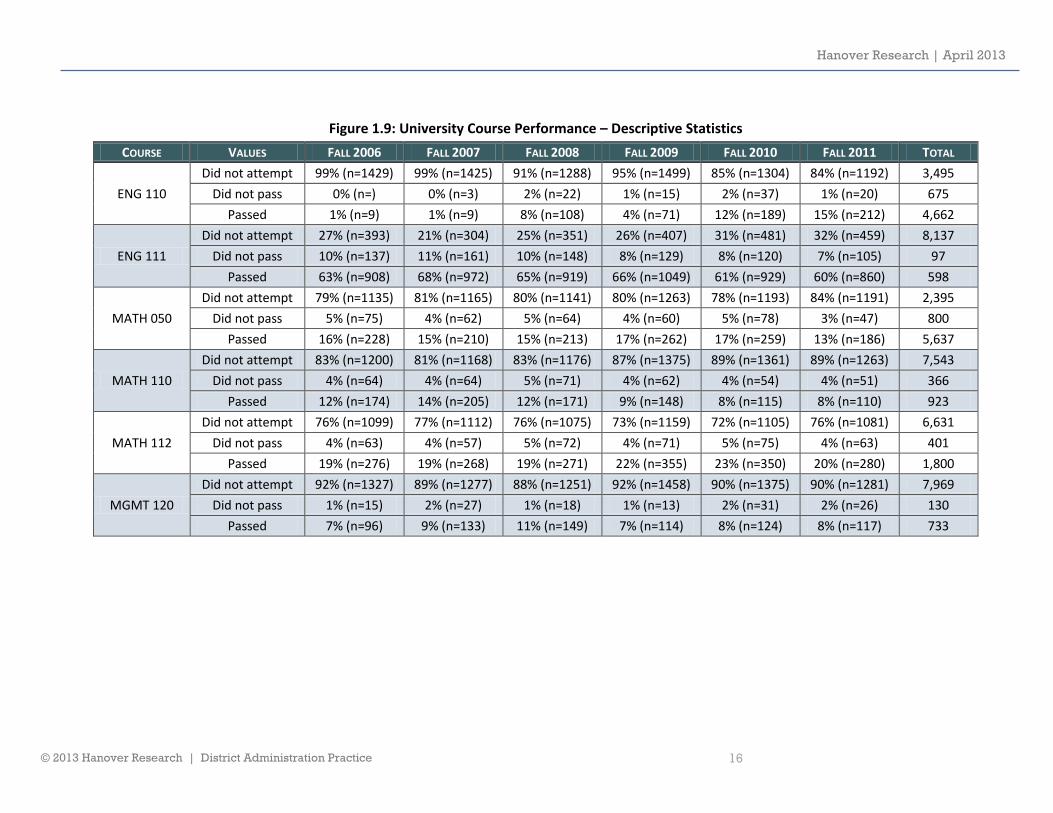
Figures 1.7-1.12 present descriptive statistics for each independent variable used in the models. While Figure 1.7 shows the distribution of students’ gender, ethnicity, and high school ranking, Figure 1.8 and 1.9 shows descriptive statistics for some measures of academic performance. In our models, we used two forms of the independent variable that indicates whether a student is an athlete. For the models in Set 2, the athlete variable refers to a student being
Hanover Research | April 2013
© 2013 Hanover Research | District Administration Practice 14
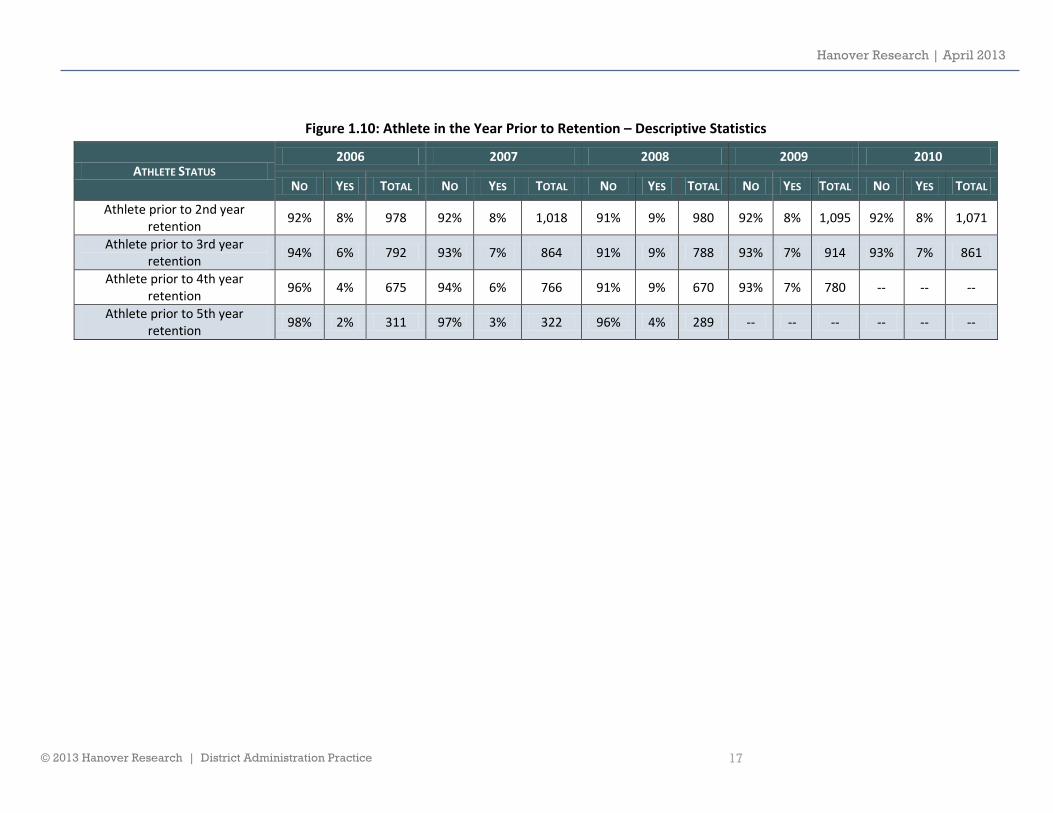
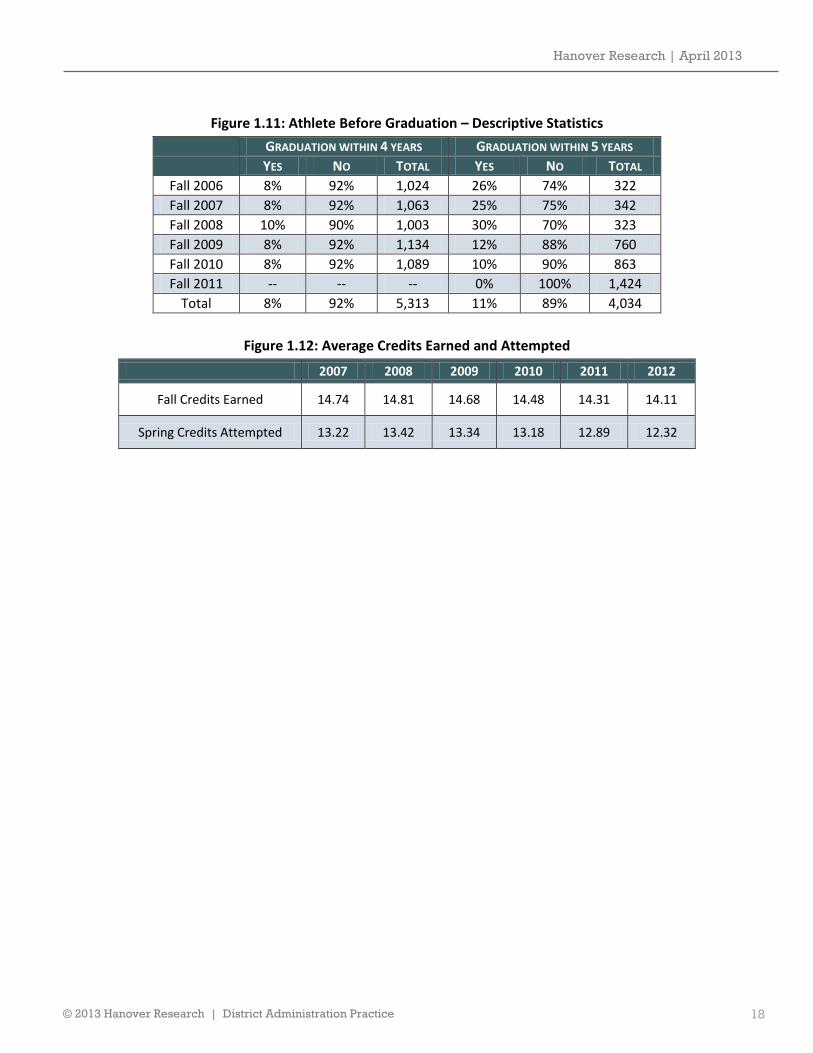
an athlete in the year immediately prior to the year in which retention is measured. For instance, Model 7, which analyzes fourth year conditional retention, indicates the effect of a student being an athlete in his/her third year only. By contrast, the athlete variable used in the Set 3 models (Model 11), indicates whether the student was an athlete at any point within the four or five years taken into account. Descriptive statistics of these alternate forms of the athlete variable are provided in Figures 1.10 and 1.11. Finally, Figure 1.12 provides the average number of credits earned (fall) and attempted (spring) for each year of our dataset.
Hanover Research | April 2013
© 2013 Hanover Research | District Administration Practice 15
Figure 1.7: Gender, Ethnicity, and High School Ranking – Descriptive Statistics
GENDER FALL 2006 FALL 2007 FALL 2008 FALL 2009 FALL 2010 FALL 2011
Female 57% (n=803) 55% (n=789) 56% (n=793) 58% (n=924) 62% (n=941) 60% (n=850)
Male 43% (n=604) 45% (n=648) 44% (n=625) 42% (n=661) 38% (n=589) 40% (n=574)
ETHNICITY
Black 6% (n=85) 7% (n=98) 9% (n=125) 9% (n=135) 9% (n=130) 9% (n=122)
Other or two or more races4 3% (n=37) 3% (n=40) 4% (n=63) 4% (n=55) 5% (n=70) 6% (n=84)
White 91% (n=1281) 90% (n=1287) 87% (n=1225) 88% (n=1354) 86% (n=1276) 85% (n=1198)
HIGH SCHOOL RANKING
0% to 10% 8% (n=108) 9% (n=111) 9% (n=114) 8% (n=104) 9% (n=117) 8% (n=98)
10% to 25% 19% (n=243) 15% (n=189) 19% (n=229) 19% (n=254) 20% (n=260) 18% (n=214)
25% to 50% 35% (n=445) 35% (n=443) 36% (n=443) 35% (n=476) 34% (n=446) 35% (n=413)
50% to 75% 27% (n=349) 29% (n=371) 27% (n=333) 26% (n=349) 26% (n=335) 25% (n=292)
75% to 100% 10% (n=132) 12% (n=156) 9% (n=109) 12% (n=162) 11% (n=145) 13% (n=157)
Figure 1.8: Age, High School Rank, SAT Score, and First GPA- Descriptive Statistics
VALUES FALL 2006 FALL 2007 FALL 2008 FALL 2009 FALL 2010 FALL 2011 TOTAL
Average of Age 18.93 19.13 19.20 19.60 19.70 19.76 19.39
Average of Rank as Percentage of Class Size 43% 45% 42% 44% 43% 44% 43%
Average of SAT Total* 1381 1419 1412 1407 1419 1402 1408
Average of SAT Math* 462 483 479 477 478 478 477
Average of SAT Reading* 466 477 474 471 477 475 474
Average of SAT Writing* 455 462 460 458 464 459 460
Average of First GPA 2.44 2.49 2.51 2.64 2.66 2.63 2.56 *Note that all SAT scores listed as “0” were recoded as missing and are not reflected in these averages.
4 Includes students who are listed as Asian, Hispanic, Native American, Pacific Islander, and from two or more races.
Hanover Research | April 2013
© 2013 Hanover Research | District Administration Practice 16
Figure 1.9: University Course Performance – Descriptive Statistics
COURSE VALUES FALL 2006 FALL 2007 FALL 2008 FALL 2009 FALL 2010 FALL 2011 TOTAL
ENG 110
Did not attempt 99% (n=1429) 99% (n=1425) 91% (n=1288) 95% (n=1499) 85% (n=1304) 84% (n=1192) 3,495
Did not pass 0% (n=) 0% (n=3) 2% (n=22) 1% (n=15) 2% (n=37) 1% (n=20) 675
Passed 1% (n=9) 1% (n=9) 8% (n=108) 4% (n=71) 12% (n=189) 15% (n=212) 4,662
ENG 111
Did not attempt 27% (n=393) 21% (n=304) 25% (n=351) 26% (n=407) 31% (n=481) 32% (n=459) 8,137
Did not pass 10% (n=137) 11% (n=161) 10% (n=148) 8% (n=129) 8% (n=120) 7% (n=105) 97
Passed 63% (n=908) 68% (n=972) 65% (n=919) 66% (n=1049) 61% (n=929) 60% (n=860) 598
MATH 050
Did not attempt 79% (n=1135) 81% (n=1165) 80% (n=1141) 80% (n=1263) 78% (n=1193) 84% (n=1191) 2,395
Did not pass 5% (n=75) 4% (n=62) 5% (n=64) 4% (n=60) 5% (n=78) 3% (n=47) 800
Passed 16% (n=228) 15% (n=210) 15% (n=213) 17% (n=262) 17% (n=259) 13% (n=186) 5,637
MATH 110
Did not attempt 83% (n=1200) 81% (n=1168) 83% (n=1176) 87% (n=1375) 89% (n=1361) 89% (n=1263) 7,543
Did not pass 4% (n=64) 4% (n=64) 5% (n=71) 4% (n=62) 4% (n=54) 4% (n=51) 366
Passed 12% (n=174) 14% (n=205) 12% (n=171) 9% (n=148) 8% (n=115) 8% (n=110) 923
MATH 112
Did not attempt 76% (n=1099) 77% (n=1112) 76% (n=1075) 73% (n=1159) 72% (n=1105) 76% (n=1081) 6,631
Did not pass 4% (n=63) 4% (n=57) 5% (n=72) 4% (n=71) 5% (n=75) 4% (n=63) 401
Passed 19% (n=276) 19% (n=268) 19% (n=271) 22% (n=355) 23% (n=350) 20% (n=280) 1,800
MGMT 120
Did not attempt 92% (n=1327) 89% (n=1277) 88% (n=1251) 92% (n=1458) 90% (n=1375) 90% (n=1281) 7,969
Did not pass 1% (n=15) 2% (n=27) 1% (n=18) 1% (n=13) 2% (n=31) 2% (n=26) 130
Passed 7% (n=96) 9% (n=133) 11% (n=149) 7% (n=114) 8% (n=124) 8% (n=117) 733
Hanover Research | April 2013
© 2013 Hanover Research | District Administration Practice 17
Figure 1.10: Athlete in the Year Prior to Retention – Descriptive Statistics
ATHLETE STATUS 2006 2007 2008 2009 2010
NO YES TOTAL NO YES TOTAL NO YES TOTAL NO YES TOTAL NO YES TOTAL
Athlete prior to 2nd year retention
92% 8% 978 92% 8% 1,018 91% 9% 980 92% 8% 1,095 92% 8% 1,071
Athlete prior to 3rd year retention
94% 6% 792 93% 7% 864 91% 9% 788 93% 7% 914 93% 7% 861
Athlete prior to 4th year retention
96% 4% 675 94% 6% 766 91% 9% 670 93% 7% 780 -- -- --
Athlete prior to 5th year retention
98% 2% 311 97% 3% 322 96% 4% 289 -- -- -- -- -- --
Hanover Research | April 2013
© 2013 Hanover Research | District Administration Practice 18
Figure 1.11: Athlete Before Graduation – Descriptive Statistics
GRADUATION WITHIN 4 YEARS GRADUATION WITHIN 5 YEARS
YES NO TOTAL YES NO TOTAL
Fall 2006 8% 92% 1,024 26% 74% 322
Fall 2007 8% 92% 1,063 25% 75% 342
Fall 2008 10% 90% 1,003 30% 70% 323
Fall 2009 8% 92% 1,134 12% 88% 760
Fall 2010 8% 92% 1,089 10% 90% 863
Fall 2011 -- -- -- 0% 100% 1,424
Total 8% 92% 5,313 11% 89% 4,034
Figure 1.12: Average Credits Earned and Attempted
2007 2008 2009 2010 2011 2012
Fall Credits Earned 14.74 14.81 14.68 14.48 14.31 14.11
Spring Credits Attempted 13.22 13.42 13.34 13.18 12.89 12.32
Hanover Research | April 2013
© 2013 Hanover Research | Academy Administration Practice 19
SECTION II: REGRESSION ANALYSIS In this section, we present the results of our regression models that help us understand the factors that affect student retention and graduation rates at Clarion. As noted previously, the models included in Set 1 and Set 2 examine students’ retention rates between the second and sixth years at the university, while the models in Set 3 examine students’ four-year and five-year graduation rates. The results of each set of regression models are presented in Figures 2.1, 2.2., and 2.3. Each set of models focuses on a different combination of variables. More specifically,
The models included in Set 1 (Figure 2.1) were constructed to examine the effects of a variety of factors Clarion would be aware of prior to a student’s initial enrollment at the university (e.g., gender, age, ethnicity, high school rank, and SAT). The outcome variable for these Set 1 models is retention.
The Set 2 models (Figure 2.2) analyze the effects of a range of demographic, pre-university, and university characteristics (e.g., age, gender, high school rank, SAT, first GPA at Clarion, passage/failure of specific courses, athlete status, credits attempted and earned) on conditional retention. As mentioned previously, conditional retention takes into account (or is “conditioned on”) whether a student was retained in the previous year. In other words, it only measures the retention of students in a given year if they were also retained in the previous year.
Finally, the Set 3 models (Figure 2.3) analyze the effects of demographic, pre-university, and university characteristics on graduation within four years and graduation within five years.
REGRESSION RESULTS: SET 1 MODELS
We recall that Set 1, which covers Models 1 to 5, included a dependent variable showing the proportion of students who re-enrolled at Clarion in each of the five years. We developed separate models for the different years of retention (e.g., second year retention, third year retention, fourth year retention, etc.) with only demographic and pre-university data included in the models. Further, in general, the models only include variables that have a statistically significant effect on our dependent variables5 and in the points below, we only highlight findings that are statistically significant.
5 In the figures, statistical significance is denoted with asterisks:
*** denotes statistical significance at 1 percent – meaning that there is a less than 1 percent likelihood that the observed effect is due to chance.
** denotes statistical significance at 5 percent – meaning that there is a less than 5 percent likelihood that the observed effect is due to chance.
* denotes statistical significance at 10 percent – meaning that there is a less than 10 percent likelihood that the observed effect is due to chance.
Hanover Research | April 2013
© 2013 Hanover Research | Academy Administration Practice 20
KEY FINDINGS ACROSS SET 1 MODELS
The following subsections highlight findings relative to each individual model. In terms of broader points that can be drawn across the Set 1 models, we find that in general, the following are associated with a higher likelihood of being retained:
Being ranked in the top quarter of a high school class
Having higher SAT scores
By contrast, minorities, and particularly black students, are less likely to be retained than white students.
MODEL 1 (2ND YEAR RETENTION)
Relative to white students, black students and students from other racial/ethnic backgrounds are less likely to be retained in their second year at Clarion.
Students ranked below the top 25 percent of their high school classes are less likely to be retained in their second year.6 In fact, outside of the top 25 percent, the lower the student’s ranking, the less likely the student is to be retained (e.g., students whose ranking is within 50-75 percent of their high school class are less likely to be retained than students whose ranking is within 25-50 percent of their high school class).
Second year retention has a positive relationship with SAT scores. With every 100-point increase in SAT scores, a student’s chances of being retained increase slightly (by 0.78 percent).
MODEL 2 AND 3 (3RD AND 4TH
YEAR RETENTION)
Black students and students from other ethnic backgrounds are less likely to be retained in their third and fourth years than white students.
Students ranked below the top 25 percent of their high school classes are less likely to be retained in their third and fourth years than students ranked in the top 10 percent. Similar to Model 1, outside of the top 25 percent, the lower a students’ high school rank, the less likely they are to be retained.
6 Note that we make this conclusion based on a combination of results. First, high school rank was separated into a
series of dummy variables where the reference category was a high school rank within the top 10 percent of a students’ high school class. For example, the negative coefficient in Model 1 for the variable listed as “High School Rank (25%-50%)” indicates that students whose ranking was among 25-50 percent of their high school class were significantly less likely to be retained than students in the top 10 percent. The same could be said for students in the 50-75 percent range and the 75-100 percent range. However, the variable measuring “High School Rank (10%-25%)” was not found to a have a statistically significant effect (i.e., students in the 10-25 percent range were not significantly less likely to be retained than students in the top 10 percent). Taken together, these results suggest that students ranked within the top 25 percent of their high school class are more likely to be retained than students with lower rankings.
Hanover Research | April 2013
© 2013 Hanover Research | Academy Administration Practice 21
Students with higher SAT scores are more likely to be retained in their third year at Clarion. Once again, a 100-point increase in SAT scores increases a student’s chances of being retained by a relatively small margin (i.e., a boost of 0.84 percent in their likelihood of being retained in their third year). This effect was not observed with regard to fourth year retention.
Older students are less likely to be retained in their fourth year at Clarion than younger students. This finding did not hold true with regard to third year retention.
MODEL 4 (5TH
YEAR RETENTION)
Similar to the previous models, black students and students of other ethnicities are less likely to be retained in their fifth year than their white classmates.
Students ranked in the lower half of their high school classes (50-100 percent) are less likely to be retained compared to students in the top half of their high school classes.
MODEL 5 (6TH YEAR RETENTION)
Similar to Model 3 (fourth year retention), older students are less likely to be retained in their sixth year than younger students.
While total SAT scores were not found to have an effect on sixth year retention, higher SAT Reading scores were associated with a higher likelihood of retention and higher SAT Writing scores were associated with a lower likelihood of retention. Note, however, these effects appear fairly small in terms of magnitude. A 100-point increase in Reading scores corresponds to a 3.43 percent increase in the likelihood of being retained in the sixth year. A 100-point increase in Writing scores corresponds to a 4.42 percent decrease in the likelihood of being retained.
Hanover Research | April 2013
© 2013 Hanover Research | Academy Administration Practice 22
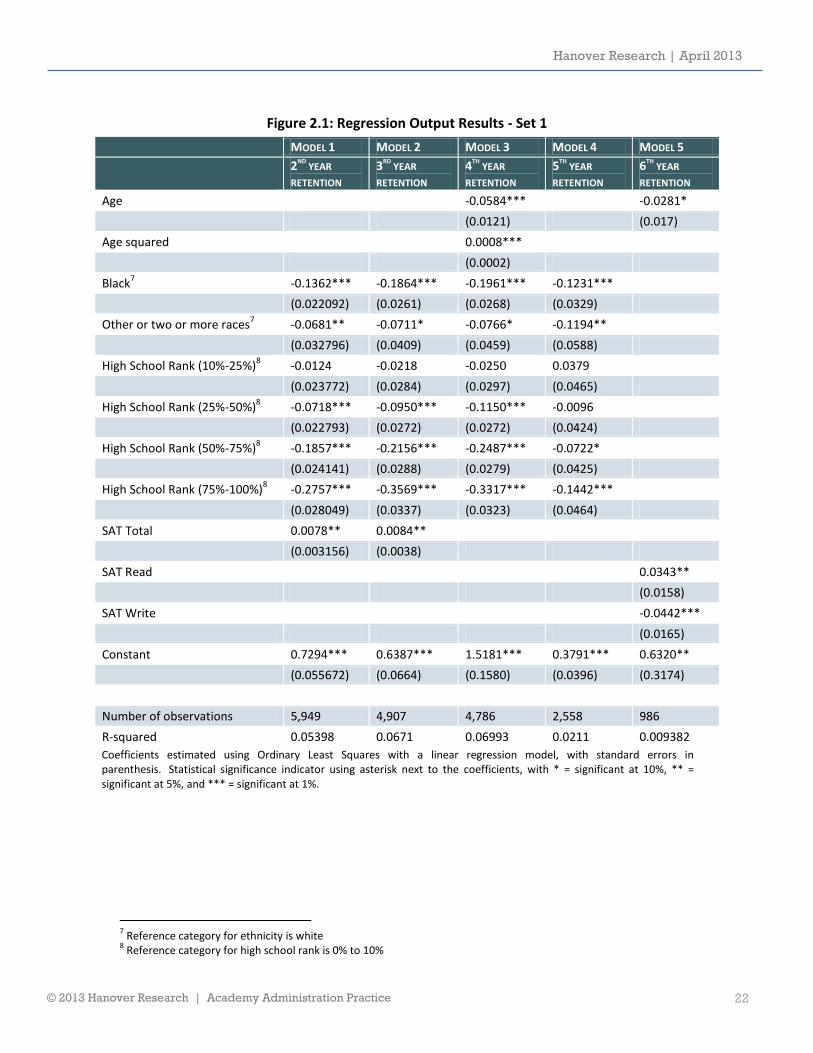
Figure 2.1: Regression Output Results - Set 1
MODEL 1 MODEL 2 MODEL 3 MODEL 4 MODEL 5
2
ND YEAR
RETENTION 3
RD YEAR
RETENTION 4
TH YEAR
RETENTION 5
TH YEAR
RETENTION 6
TH YEAR
RETENTION
Age -0.0584*** -0.0281*
(0.0121) (0.017)
Age squared 0.0008***
(0.0002)
Black7 -0.1362*** -0.1864*** -0.1961*** -0.1231***
(0.022092) (0.0261) (0.0268) (0.0329)
Other or two or more races7 -0.0681** -0.0711* -0.0766* -0.1194**
(0.032796) (0.0409) (0.0459) (0.0588)
High School Rank (10%-25%)8 -0.0124 -0.0218 -0.0250 0.0379
(0.023772) (0.0284) (0.0297) (0.0465)
High School Rank (25%-50%)8 -0.0718*** -0.0950*** -0.1150*** -0.0096
(0.022793) (0.0272) (0.0272) (0.0424)
High School Rank (50%-75%)8 -0.1857*** -0.2156*** -0.2487*** -0.0722*
(0.024141) (0.0288) (0.0279) (0.0425)
High School Rank (75%-100%)8 -0.2757*** -0.3569*** -0.3317*** -0.1442***
(0.028049) (0.0337) (0.0323) (0.0464)
SAT Total 0.0078** 0.0084**
(0.003156) (0.0038)
SAT Read 0.0343**
(0.0158)
SAT Write -0.0442***
(0.0165)
Constant 0.7294*** 0.6387*** 1.5181*** 0.3791*** 0.6320**
(0.055672) (0.0664) (0.1580) (0.0396) (0.3174)
Number of observations 5,949 4,907 4,786 2,558 986
R-squared 0.05398 0.0671 0.06993 0.0211 0.009382
Coefficients estimated using Ordinary Least Squares with a linear regression model, with standard errors in parenthesis. Statistical significance indicator using asterisk next to the coefficients, with * = significant at 10%, ** = significant at 5%, and *** = significant at 1%.
7 Reference category for ethnicity is white
8 Reference category for high school rank is 0% to 10%
Hanover Research | April 2013
© 2013 Hanover Research | Academy Administration Practice 23
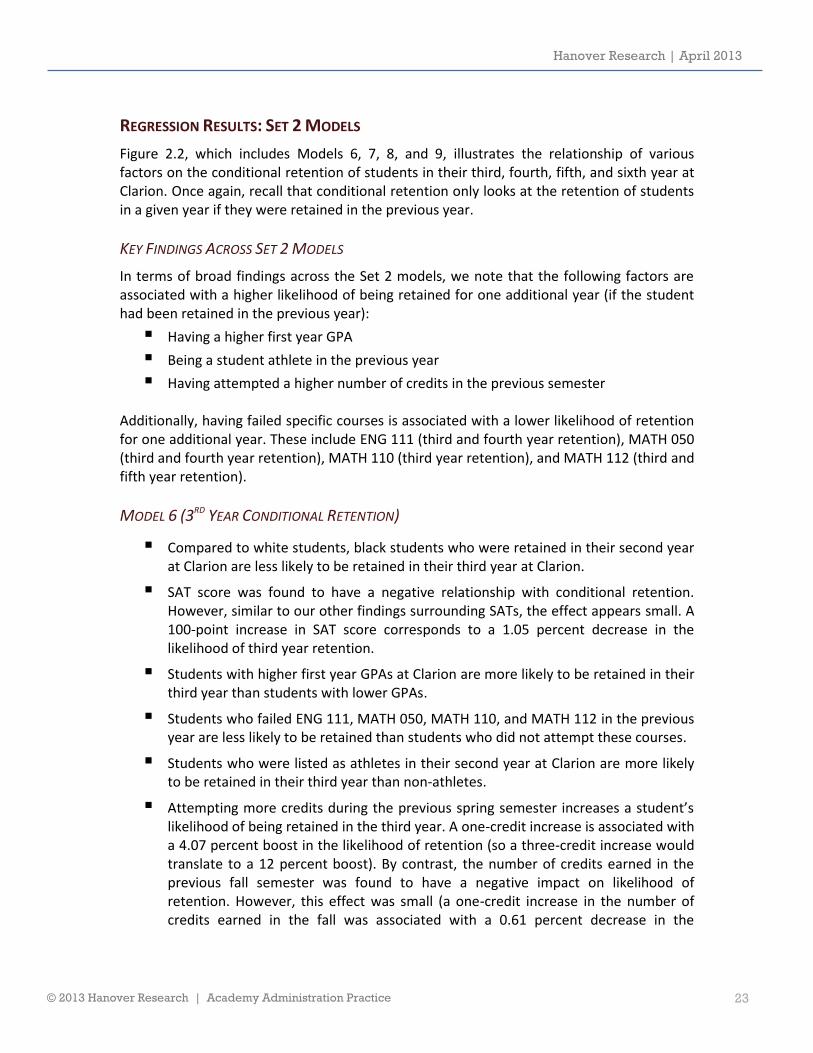
REGRESSION RESULTS: SET 2 MODELS
Figure 2.2, which includes Models 6, 7, 8, and 9, illustrates the relationship of various factors on the conditional retention of students in their third, fourth, fifth, and sixth year at Clarion. Once again, recall that conditional retention only looks at the retention of students in a given year if they were retained in the previous year.
KEY FINDINGS ACROSS SET 2 MODELS
In terms of broad findings across the Set 2 models, we note that the following factors are associated with a higher likelihood of being retained for one additional year (if the student had been retained in the previous year):
Having a higher first year GPA
Being a student athlete in the previous year
Having attempted a higher number of credits in the previous semester Additionally, having failed specific courses is associated with a lower likelihood of retention for one additional year. These include ENG 111 (third and fourth year retention), MATH 050 (third and fourth year retention), MATH 110 (third year retention), and MATH 112 (third and fifth year retention).
MODEL 6 (3RD YEAR CONDITIONAL RETENTION)
Compared to white students, black students who were retained in their second year at Clarion are less likely to be retained in their third year at Clarion.
SAT score was found to have a negative relationship with conditional retention. However, similar to our other findings surrounding SATs, the effect appears small. A 100-point increase in SAT score corresponds to a 1.05 percent decrease in the likelihood of third year retention.
Students with higher first year GPAs at Clarion are more likely to be retained in their third year than students with lower GPAs.
Students who failed ENG 111, MATH 050, MATH 110, and MATH 112 in the previous year are less likely to be retained than students who did not attempt these courses.
Students who were listed as athletes in their second year at Clarion are more likely to be retained in their third year than non-athletes.
Attempting more credits during the previous spring semester increases a student’s likelihood of being retained in the third year. A one-credit increase is associated with a 4.07 percent boost in the likelihood of retention (so a three-credit increase would translate to a 12 percent boost). By contrast, the number of credits earned in the previous fall semester was found to have a negative impact on likelihood of retention. However, this effect was small (a one-credit increase in the number of credits earned in the fall was associated with a 0.61 percent decrease in the

Hanover Research | April 2013
© 2013 Hanover Research | Academy Administration Practice 24
likelihood of retention), and this finding did not hold for retention in the fourth, fifth, and sixth years (Models 7-9).
MODEL 7 (4TH YEAR CONDITIONAL RETENTION)
Among students who were retained in their third year, older students are less likely to be retained in their fourth year than younger students.
SAT score also has a negative effect on the likelihood of retention, though once again, the magnitude of this effect appears small in practical terms. A 100-point increase in SAT scores is associated with a 0.63 percent decrease in the likelihood a student will be retained in their fourth year.
Students with higher first year GPAs are more likely to be retained in their fourth year.
Compared to students who did not attempt ENG 111 and MATH 050, students who failed these courses have a lower chance of being retained in their fourth year.
Students who passed MATH 110 and MATH 112 in the previous year are expected to have a higher retention rate than students who did not attempt these courses.
Students who were listed as athletes in their third year are more likely to be retained in their fourth year.
Students who attempted more credits in the previous spring semester are more likely to be retained in their fourth year.
MODEL 8 (5TH YEAR CONDITIONAL RETENTION)
Black students are less likely to be retained in their fifth year than white students.
Similar to Model 6, higher SAT scores are associated with a lower likelihood of being retained in the fifth year. A 100-point increase in SATs is associated with a 1.57 percent decrease in the likelihood of retention at this stage.
First year GPA has a positive impact on students’ fifth year conditional retention. As a student’s first GPA increases, he or she is more likely to be retained in the fifth year.
Students who failed MATH 112 are less likely to be retained in their fifth year than students who did not attempt the course.
Students who attempted more credits in the previous spring semester are more likely to be retained in their fifth year.
MODEL 9 (6TH YEAR CONDITIONAL RETENTION)
An increase in high school rank as a percentage of class size is associated with a decrease in the likelihood that a student would be retained in the sixth year. In other words, lower ranked students (e.g., a student ranked 75th out of 100) are less
Hanover Research | April 2013
© 2013 Hanover Research | Academy Administration Practice 25
likely to be retained in the sixth year than students with higher ranks (e.g., a student ranked at 25th out of 100).
Number of credits attempted in the previous spring semester has a positive impact on students’ sixth year retention. Students who attempted more credits in the previous spring are more likely to be retained in their sixth year.
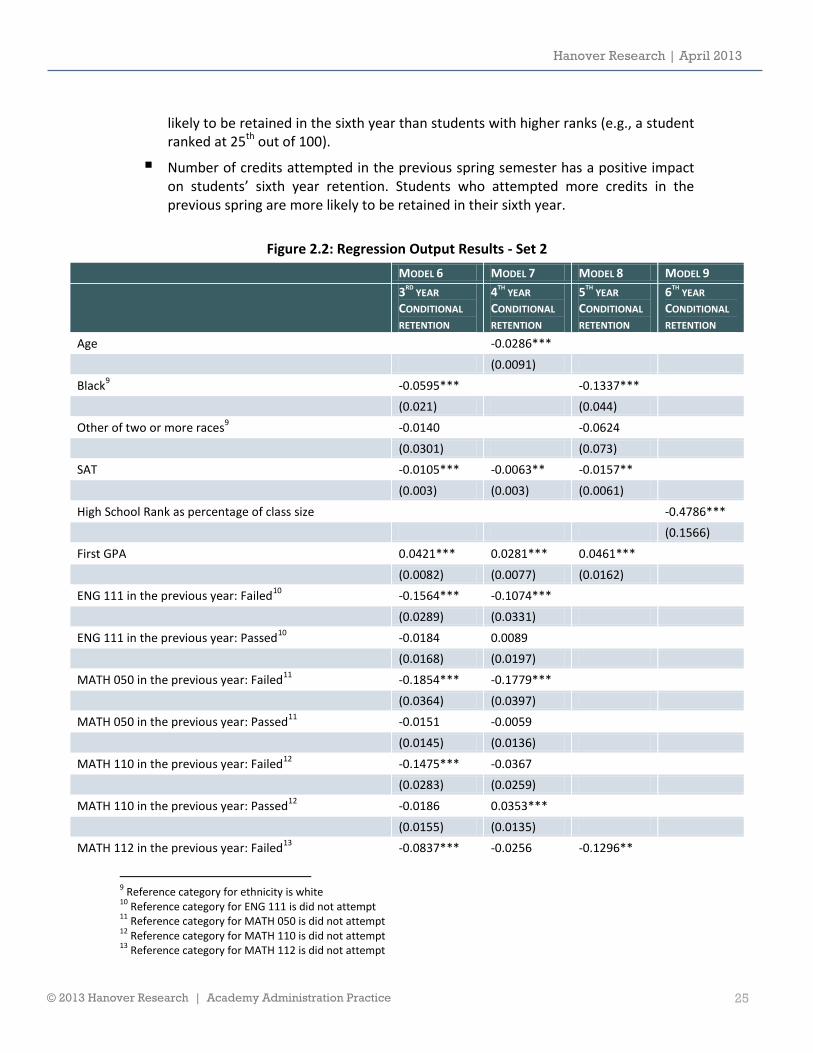
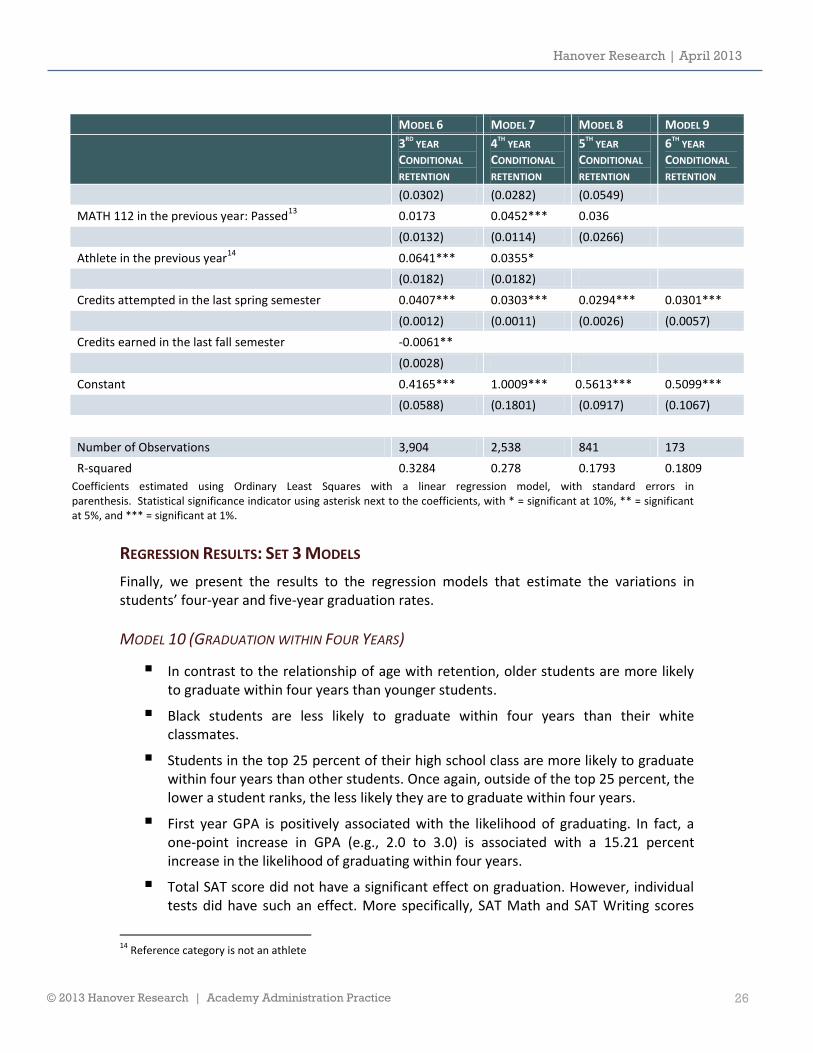
Figure 2.2: Regression Output Results - Set 2
MODEL 6 MODEL 7 MODEL 8 MODEL 9
3RD
YEAR
CONDITIONAL
RETENTION
4TH
YEAR
CONDITIONAL
RETENTION
5TH
YEAR
CONDITIONAL
RETENTION
6TH
YEAR
CONDITIONAL
RETENTION
Age -0.0286***
(0.0091)
Black9 -0.0595*** -0.1337***
(0.021) (0.044)
Other of two or more races9 -0.0140 -0.0624
(0.0301) (0.073)
SAT -0.0105*** -0.0063** -0.0157**
(0.003) (0.003) (0.0061)
High School Rank as percentage of class size -0.4786***
(0.1566)
First GPA 0.0421*** 0.0281*** 0.0461***
(0.0082) (0.0077) (0.0162)
ENG 111 in the previous year: Failed10
-0.1564*** -0.1074***
(0.0289) (0.0331)
ENG 111 in the previous year: Passed10
-0.0184 0.0089
(0.0168) (0.0197)
MATH 050 in the previous year: Failed11
-0.1854*** -0.1779***
(0.0364) (0.0397)
MATH 050 in the previous year: Passed11
-0.0151 -0.0059
(0.0145) (0.0136)
MATH 110 in the previous year: Failed12
-0.1475*** -0.0367
(0.0283) (0.0259)
MATH 110 in the previous year: Passed12
-0.0186 0.0353***
(0.0155) (0.0135)
MATH 112 in the previous year: Failed13
-0.0837*** -0.0256 -0.1296**
9 Reference category for ethnicity is white
10 Reference category for ENG 111 is did not attempt
11 Reference category for MATH 050 is did not attempt
12 Reference category for MATH 110 is did not attempt
13 Reference category for MATH 112 is did not attempt
Hanover Research | April 2013
© 2013 Hanover Research | Academy Administration Practice 26
MODEL 6 MODEL 7 MODEL 8 MODEL 9
3RD
YEAR
CONDITIONAL
RETENTION
4TH
YEAR
CONDITIONAL
RETENTION
5TH
YEAR
CONDITIONAL
RETENTION
6TH
YEAR
CONDITIONAL
RETENTION
(0.0302) (0.0282) (0.0549)
MATH 112 in the previous year: Passed13
0.0173 0.0452*** 0.036
(0.0132) (0.0114) (0.0266)
Athlete in the previous year14
0.0641*** 0.0355*
(0.0182) (0.0182)
Credits attempted in the last spring semester 0.0407*** 0.0303*** 0.0294*** 0.0301***
(0.0012) (0.0011) (0.0026) (0.0057)
Credits earned in the last fall semester -0.0061**
(0.0028)
Constant 0.4165*** 1.0009*** 0.5613*** 0.5099***
(0.0588) (0.1801) (0.0917) (0.1067)
Number of Observations 3,904 2,538 841 173
R-squared 0.3284 0.278 0.1793 0.1809
Coefficients estimated using Ordinary Least Squares with a linear regression model, with standard errors in parenthesis. Statistical significance indicator using asterisk next to the coefficients, with * = significant at 10%, ** = significant at 5%, and *** = significant at 1%.
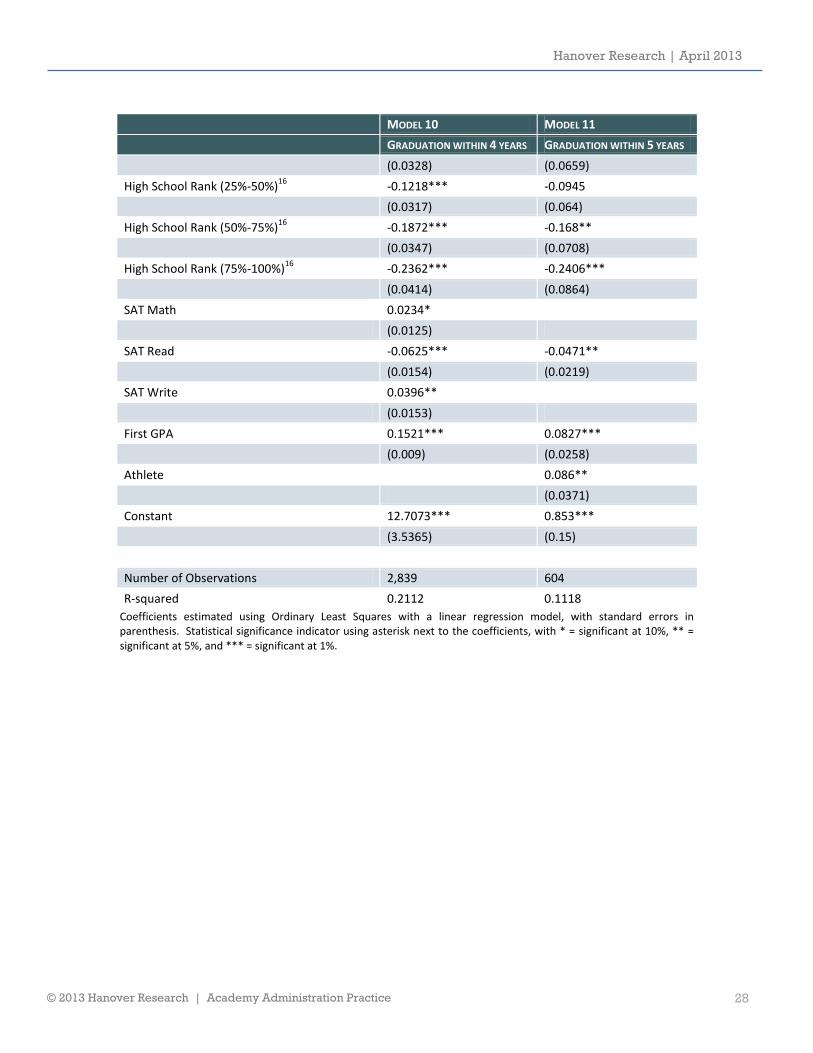
REGRESSION RESULTS: SET 3 MODELS
Finally, we present the results to the regression models that estimate the variations in students’ four-year and five-year graduation rates.
MODEL 10 (GRADUATION WITHIN FOUR YEARS)
In contrast to the relationship of age with retention, older students are more likely to graduate within four years than younger students.
Black students are less likely to graduate within four years than their white classmates.
Students in the top 25 percent of their high school class are more likely to graduate within four years than other students. Once again, outside of the top 25 percent, the lower a student ranks, the less likely they are to graduate within four years.
First year GPA is positively associated with the likelihood of graduating. In fact, a one-point increase in GPA (e.g., 2.0 to 3.0) is associated with a 15.21 percent increase in the likelihood of graduating within four years.
Total SAT score did not have a significant effect on graduation. However, individual tests did have such an effect. More specifically, SAT Math and SAT Writing scores
14
Reference category is not an athlete
Hanover Research | April 2013
© 2013 Hanover Research | Academy Administration Practice 27
had a positive relationship (a 100-point increase in Math is associated with a 2.34 percent increase in likelihood of graduation, while a 100-point increase in Writing is expected to yield a 3.96 percent increase in the likelihood of graduation). By contrast, a 100-point increase in SAT Reading scores is associated with a 6.25 percent decrease in the probability of graduating in four years.
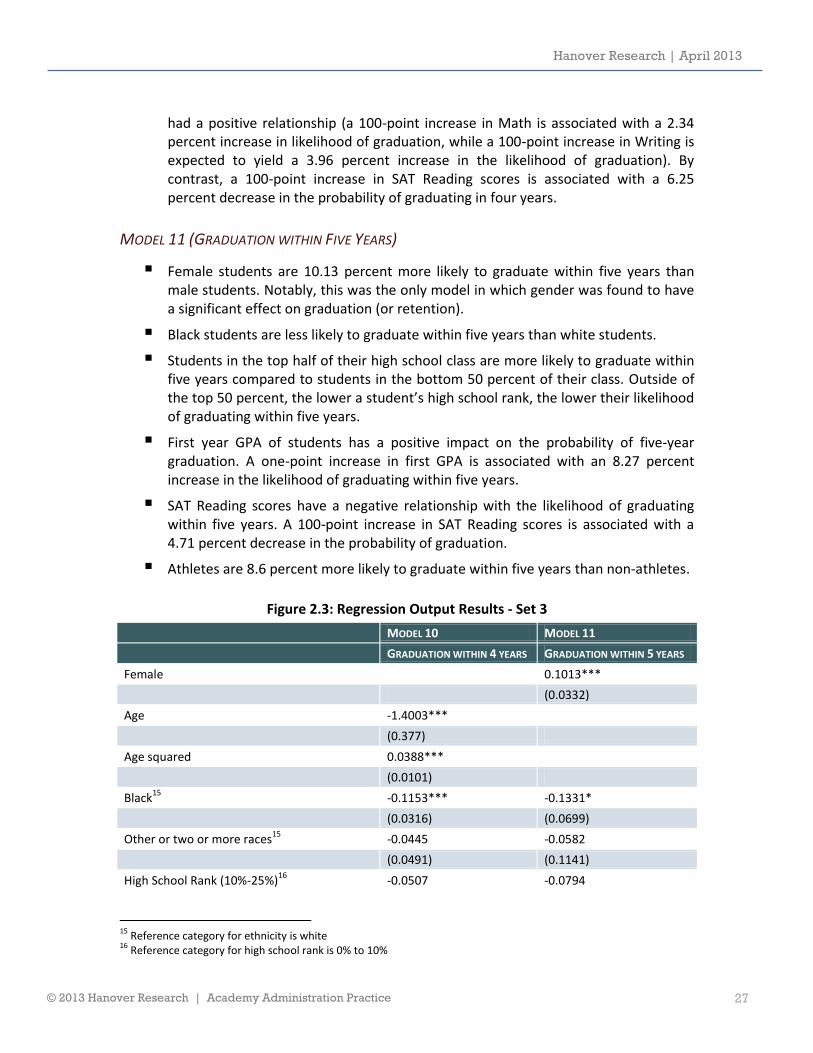
MODEL 11 (GRADUATION WITHIN FIVE YEARS)
Female students are 10.13 percent more likely to graduate within five years than male students. Notably, this was the only model in which gender was found to have a significant effect on graduation (or retention).
Black students are less likely to graduate within five years than white students.
Students in the top half of their high school class are more likely to graduate within five years compared to students in the bottom 50 percent of their class. Outside of the top 50 percent, the lower a student’s high school rank, the lower their likelihood of graduating within five years.
First year GPA of students has a positive impact on the probability of five-year graduation. A one-point increase in first GPA is associated with an 8.27 percent increase in the likelihood of graduating within five years.
SAT Reading scores have a negative relationship with the likelihood of graduating within five years. A 100-point increase in SAT Reading scores is associated with a 4.71 percent decrease in the probability of graduation.
Athletes are 8.6 percent more likely to graduate within five years than non-athletes.
Figure 2.3: Regression Output Results - Set 3
MODEL 10 MODEL 11
GRADUATION WITHIN 4 YEARS GRADUATION WITHIN 5 YEARS
Female 0.1013***
(0.0332)
Age -1.4003***
(0.377)
Age squared 0.0388***
(0.0101)
Black15
-0.1153*** -0.1331*
(0.0316) (0.0699)
Other or two or more races15
-0.0445 -0.0582
(0.0491) (0.1141)
High School Rank (10%-25%)16
-0.0507 -0.0794
15
Reference category for ethnicity is white 16
Reference category for high school rank is 0% to 10%
Hanover Research | April 2013
© 2013 Hanover Research | Academy Administration Practice 28
MODEL 10 MODEL 11
GRADUATION WITHIN 4 YEARS GRADUATION WITHIN 5 YEARS
(0.0328) (0.0659)
High School Rank (25%-50%)16
-0.1218*** -0.0945
(0.0317) (0.064)
High School Rank (50%-75%)16
-0.1872*** -0.168**
(0.0347) (0.0708)
High School Rank (75%-100%)16
-0.2362*** -0.2406***
(0.0414) (0.0864)
SAT Math 0.0234*
(0.0125)
SAT Read -0.0625*** -0.0471**
(0.0154) (0.0219)
SAT Write 0.0396**
(0.0153)
First GPA 0.1521*** 0.0827***
(0.009) (0.0258)
Athlete 0.086**
(0.0371)
Constant 12.7073*** 0.853***
(3.5365) (0.15)
Number of Observations 2,839 604
R-squared 0.2112 0.1118
Coefficients estimated using Ordinary Least Squares with a linear regression model, with standard errors in parenthesis. Statistical significance indicator using asterisk next to the coefficients, with * = significant at 10%, ** = significant at 5%, and *** = significant at 1%.
Hanover Research | April 2013
© 2013 Hanover Research | Academy Administration Practice 29
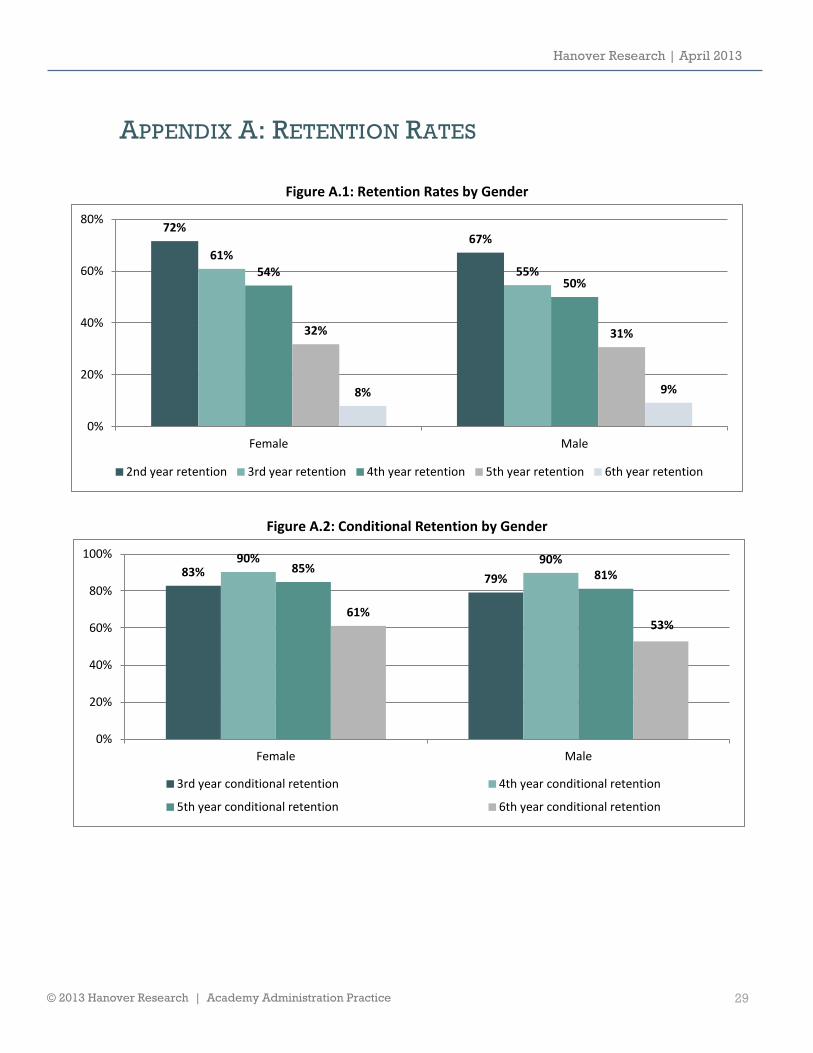
APPENDIX A: RETENTION RATES
Figure A.1: Retention Rates by Gender
Figure A.2: Conditional Retention by Gender
72% 67%
61% 55% 54%
50%
32% 31%
8% 9%
0%
20%
40%
60%
80%
Female Male
2nd year retention 3rd year retention 4th year retention 5th year retention 6th year retention
83% 79%
90% 90% 85%
81%
61% 53%
0%
20%
40%
60%
80%
100%
Female Male
3rd year conditional retention 4th year conditional retention
5th year conditional retention 6th year conditional retention
Hanover Research | April 2013
© 2013 Hanover Research | Academy Administration Practice 30
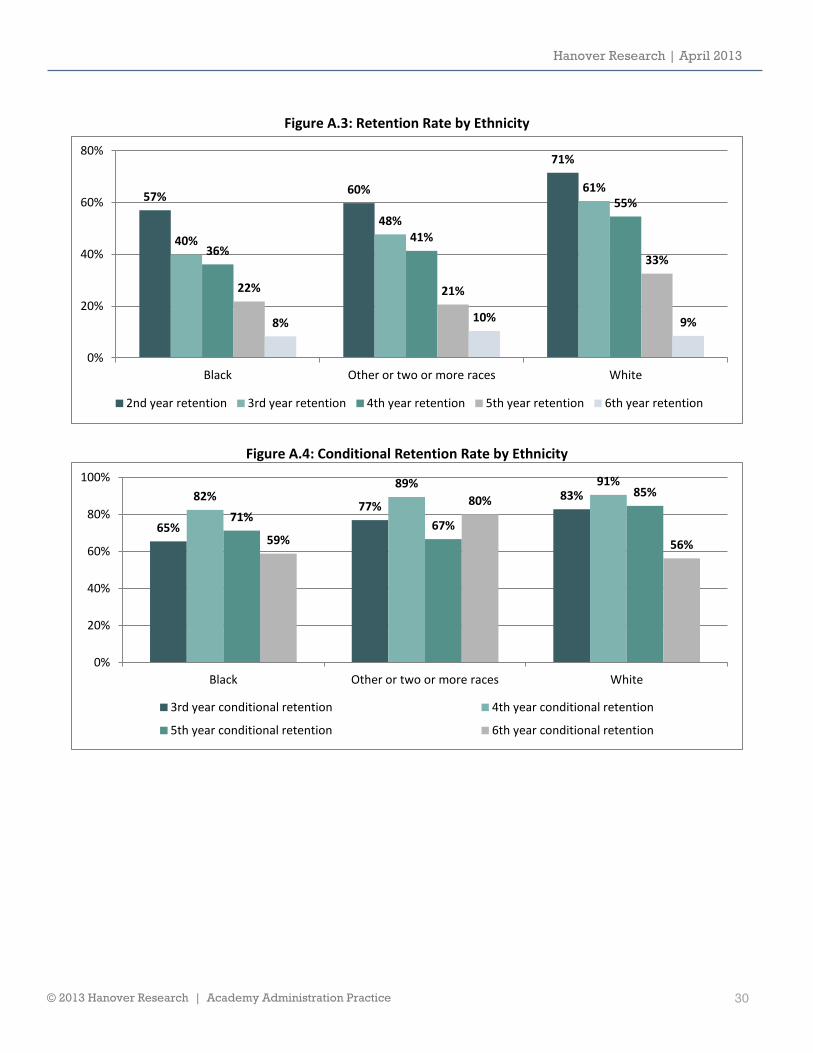
Figure A.3: Retention Rate by Ethnicity
Figure A.4: Conditional Retention Rate by Ethnicity
57% 60%
71%
40%
48%
61%
36% 41%
55%
22% 21%
33%
8% 10% 9%
0%
20%
40%
60%
80%
Black Other or two or more races White
2nd year retention 3rd year retention 4th year retention 5th year retention 6th year retention
65%
77% 83% 82%
89% 91%
71% 67%
85%
59%
80%
56%
0%
20%
40%
60%
80%
100%
Black Other or two or more races White
3rd year conditional retention 4th year conditional retention
5th year conditional retention 6th year conditional retention
Hanover Research | April 2013
© 2013 Hanover Research | Academy Administration Practice 31
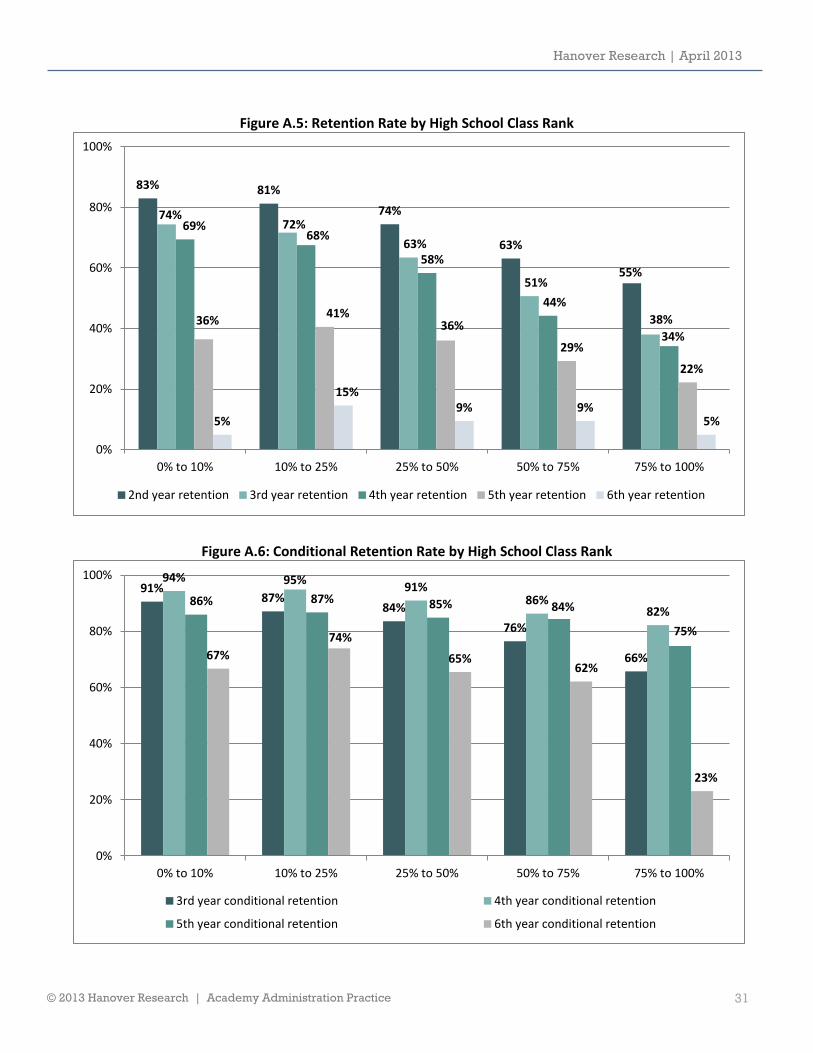
Figure A.5: Retention Rate by High School Class Rank
Figure A.6: Conditional Retention Rate by High School Class Rank
83% 81%
74%
63%
55%
74% 72%
63%
51%
38%
69% 68%
58%
44%
34% 36%
41% 36%
29%
22%
5%
15% 9% 9%
5%
0%
20%
40%
60%
80%
100%
0% to 10% 10% to 25% 25% to 50% 50% to 75% 75% to 100%
2nd year retention 3rd year retention 4th year retention 5th year retention 6th year retention
91% 87%
84%
76%
66%
94% 95% 91%
86% 82%
86% 87% 85% 84%
75%
67%
74%
65% 62%
23%
0%
20%
40%
60%
80%
100%
0% to 10% 10% to 25% 25% to 50% 50% to 75% 75% to 100%
3rd year conditional retention 4th year conditional retention
5th year conditional retention 6th year conditional retention
Hanover Research | April 2013
© 2013 Hanover Research | Academy Administration Practice 32
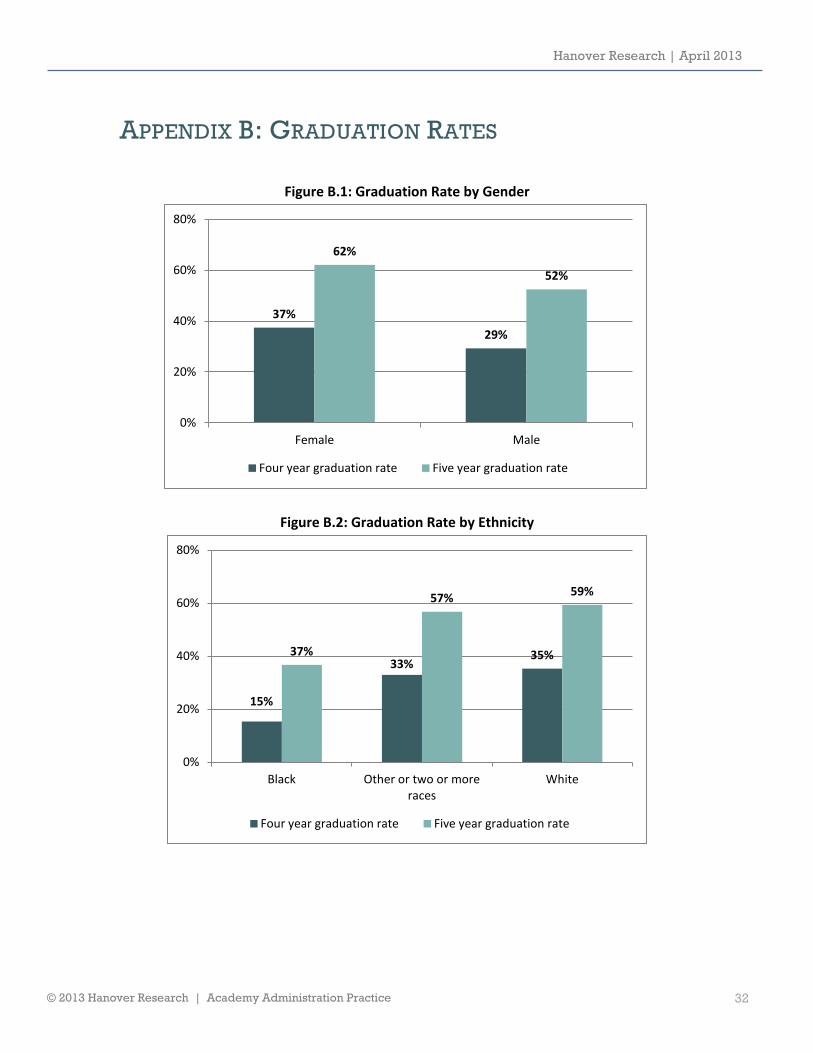
APPENDIX B: GRADUATION RATES
Figure B.1: Graduation Rate by Gender
Figure B.2: Graduation Rate by Ethnicity
37%
29%
62%
52%
0%
20%
40%
60%
80%
Female Male
Four year graduation rate Five year graduation rate
15%
33% 35% 37%
57% 59%
0%
20%
40%
60%
80%
Black Other or two or more races
White
Four year graduation rate Five year graduation rate
Hanover Research | April 2013
© 2013 Hanover Research | Academy Administration Practice 33
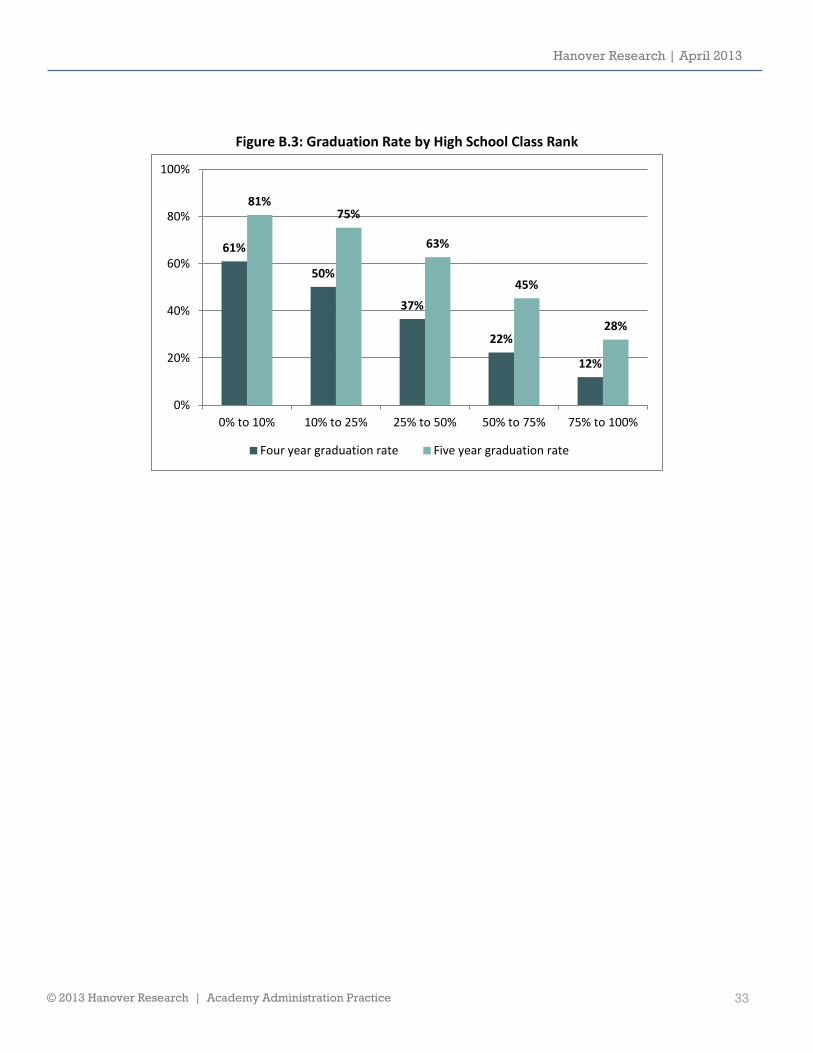
Figure B.3: Graduation Rate by High School Class Rank
61%
50%
37%
22%
12%
81% 75%
63%
45%
28%
0%
20%
40%
60%
80%
100%
0% to 10% 10% to 25% 25% to 50% 50% to 75% 75% to 100%
Four year graduation rate Five year graduation rate
Hanover Research | April 2013
© 2013 Hanover Research | Academy Administration Practice 34
PROJECT EVALUATION FORM Hanover Research is committed to providing a work product that meets or exceeds partner expectations. In keeping with that goal, we would like to hear your opinions regarding our reports. Feedback is critically important and serves as the strongest mechanism by which we tailor our research to your organization. When you have had a chance to evaluate this report, please take a moment to fill out the following questionnaire. http://www.hanoverresearch.com/evaluation/index.php
CAVEAT The publisher and authors have used their best efforts in preparing this brief. The publisher and authors make no representations or warranties with respect to the accuracy or completeness of the contents of this brief and specifically disclaim any implied warranties of fitness for a particular purpose. There are no warranties which extend beyond the descriptions contained in this paragraph. No warranty may be created or extended by representatives of Hanover Research or its marketing materials. The accuracy and completeness of the information provided herein and the opinions stated herein are not guaranteed or warranted to produce any particular results, and the advice and strategies contained herein may not be suitable for every partner. Neither the publisher nor the authors shall be liable for any loss of profit or any other commercial damages, including but not limited to special, incidental, consequential, or other damages. Moreover, Hanover Research is not engaged in rendering legal, accounting, or other professional services. Partners requiring such services are advised to consult an appropriate professional.

Hanover Research | April 2013
© 2013 Hanover Research | Academy Administration Practice 35
1750 H Street NW, 2nd Floor
Washington, DC 20006
P 202.756.2971 F 866.808.6585
www.hanoverresearch.com