Retarding Forces Cancellation in Electrolyte Solutions-An Electrical Approach
4
INT J APPL ELECTR PHYS & ROBOT, Vol. 1 No. 1 July (2013) pp. 1–4 ISSN: 2203-0069 International Journal of Applied Electronics in Physics & Robotics Research Article Retarding Forces Cancellation in Electrolyte Solutions-An Electrical Approach Kaveh Mazloomi 1, * , Nasri Sulaiman 1 (1) Department of Electrical and Electronics Engineering, University Putra Malaysia, 43400 Serdang, Selangor, Malaysia. Copyright © 2013 Australian International Academic Centre, Australia doi:10.7575/aiac.ijaepr.v.1n.1p.1 Article history: Received 13 May 2013 Reviewed 16 May 2013 Revised 16 May 2013 Accepted 19 May 2013 Published 2 July 2013 Abstract. The process efficiency of electrolytic hydrogen production is enhanced regarding the transient response of a water electrolysis cell at the time of voltage application and disconnection. When such cells are connected to a power source, a momentary current surge passes through the cell charging the electrical double layer. In addition, the electrolysis process does not stop immediately after the cell is disconnected from its power source. An experimental electrolysis cell was constantly subjected to these phenomena under high frequency pulsating voltage conditions. Results show that the process efficiency is higher when the power is applied in the form of high frequency short pulses. Applied pulse width and frequency were as short as 25 nanoseconds and up to over 7 MHz respectively. Keywords: water electrolysis, efficiency, short pulses, frequency, hydrogen, electrochemical conductance. 1 Introduction Water electrolysis is known as one of the many ap- proaches for hydrogen production. For this electricity dependent process, decreasing power losses has been an important research objective for a long time [1,2] . Such ob- jective has been pursued by different approaches mainly, chemical, electrochemical and mechanical. A wide range of electrode and separator materials have been exten- sively experimented with [3,4] as well as different elec- trolyte solutions [5,6] . Significant literature is available covering subjects like the alignments of electrodes in an electrolytic bath [7] , their optimum distance, their surface texture and reaction and methods of forced bubble-plate detachment [8] . Although an electrical equivalent circuit for an electrolysis cell is available, records about the pos- sibility of influencing the hydrogen production process ef- ficiency solely regarding the form of power application are noticeably rare to find [5,6,9] . Electrolytes and ionic solutions are second class con- ductors [10] . Therefore, electric current is resulted by the physical movement of charged species (ions) through the bulk of material to the surface of an electrode. Such con- ductors behave less resistive and more conductive if ions can travel at higher velocities [11] . As it is depicted in Fig. 1, ions of an electrolyte have a random, Brownian in nature movement at the absence of an external electric field. These movements average out in time [10] . However, when electrode plates are being charged by an external * Corresponding author: K. Mazloomi : +6 017 242 9060 B: [email protected] Fig. 1. Ions distribution before voltage application voltage source, ionic particles of the electrolyte start to move toward their opposite sign charged plate. This movement is usually slowed down because of re- tarding forces such as the formation of diffusion and elec- trical double layers (EDL) [12] and relaxation time [11] and electrophoretic effects [10] . The goal of our research was to implement a method of power application to reduce the retarding effects and reduce the resistivity of the elec- trolyte solution. Therefore, less energy has to be con- sumed to generate a given mass of hydrogen. Fig. 2 shows the structure of an electrical double layer and diffusion layer. As in this figure, negative ions are covering the surface of a positively charged electrode plate. The interface between different signed species is called the EDL. On the other hand, the formation of a stable EDL on an electrode plate comes with unwanted side effects. Concentration of in this case negative ions on the surface of the anode attracts positively charged species. Although the charge of one ion is very small, the
-
Upload
international-journal-of-applied-electronics-in-physics-robotics-ijaepr -
Category
Documents
-
view
26 -
download
1
description
By: Kaveh Mazloomi, Nasri Sulaiman.The process efficiency of electrolytic hydrogen production is enhanced regarding the transient response of a water electrolysis cell at the time of voltage application and disconnection. When such cells are connected to a power source, a momentary current surge passes through the cell charging the electrical double layer. In addition, the electrolysis process does not stop immediately after the cell is disconnected from its power source. An experimental electrolysis cell was constantly subjected to these phenomena under high frequency pulsating voltage conditions. Results show that the process efficiency is higher when the power is applied in the form of high frequency short pulses. Applied pulse width and frequency were as short as 25 nanoseconds and up to over 7 MHz respectively.
Transcript of Retarding Forces Cancellation in Electrolyte Solutions-An Electrical Approach
INT J APPL ELECTR PHYS & ROBOT, Vol. 1 No. 1 July (2013) pp. 1–4ISSN: 2203-0069
International Journal of AppliedElectronics in Physics & Robotics
Research Article
Retarding Forces Cancellation in Electrolyte Solutions-AnElectrical Approach
Kaveh Mazloomi1,∗, Nasri Sulaiman1
(1) Department of Electrical and Electronics Engineering, University Putra Malaysia, 43400 Serdang, Selangor, Malaysia.
Copyright © 2013 Australian International Academic Centre, Australia doi:10.7575/aiac.ijaepr.v.1n.1p.1
Article history:Received 13 May 2013Reviewed 16 May 2013Revised 16 May 2013Accepted 19 May 2013Published 2 July 2013
Abstract. The process efficiency of electrolytic hydrogen production is enhanced regarding the transientresponse of a water electrolysis cell at the time of voltage application and disconnection. When such cellsare connected to a power source, a momentary current surge passes through the cell charging the electricaldouble layer. In addition, the electrolysis process does not stop immediately after the cell is disconnected fromits power source. An experimental electrolysis cell was constantly subjected to these phenomena under highfrequency pulsating voltage conditions. Results show that the process efficiency is higher when the power isapplied in the form of high frequency short pulses. Applied pulse width and frequency were as short as 25nanoseconds and up to over 7 MHz respectively.
Keywords: water electrolysis, efficiency, short pulses, frequency, hydrogen, electrochemical conductance.
1 Introduction
Water electrolysis is known as one of the many ap-proaches for hydrogen production. For this electricitydependent process, decreasing power losses has been animportant research objective for a long time [1,2]. Such ob-jective has been pursued by different approaches mainly,chemical, electrochemical and mechanical. A wide rangeof electrode and separator materials have been exten-sively experimented with [3,4] as well as different elec-trolyte solutions [5,6]. Significant literature is availablecovering subjects like the alignments of electrodes in anelectrolytic bath [7], their optimum distance, their surfacetexture and reaction and methods of forced bubble-platedetachment [8]. Although an electrical equivalent circuitfor an electrolysis cell is available, records about the pos-sibility of influencing the hydrogen production process ef-ficiency solely regarding the form of power applicationare noticeably rare to find [5,6,9].
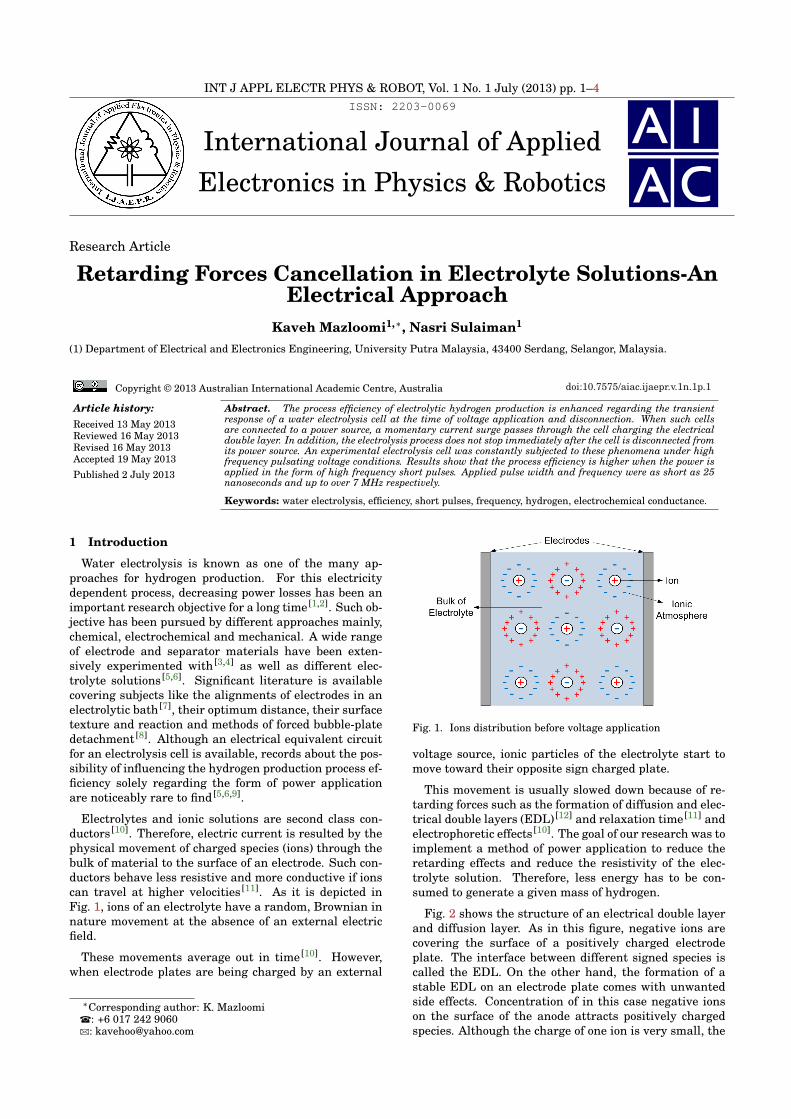
Electrolytes and ionic solutions are second class con-ductors [10]. Therefore, electric current is resulted by thephysical movement of charged species (ions) through thebulk of material to the surface of an electrode. Such con-ductors behave less resistive and more conductive if ionscan travel at higher velocities [11]. As it is depicted inFig. 1, ions of an electrolyte have a random, Brownian innature movement at the absence of an external electricfield.
These movements average out in time [10]. However,when electrode plates are being charged by an external
∗Corresponding author: K. Mazloomi�: +6 017 242 9060B: [email protected]
Fig. 1. Ions distribution before voltage application
voltage source, ionic particles of the electrolyte start tomove toward their opposite sign charged plate.
This movement is usually slowed down because of re-tarding forces such as the formation of diffusion and elec-trical double layers (EDL) [12] and relaxation time [11] andelectrophoretic effects [10]. The goal of our research was toimplement a method of power application to reduce theretarding effects and reduce the resistivity of the elec-trolyte solution. Therefore, less energy has to be con-sumed to generate a given mass of hydrogen.
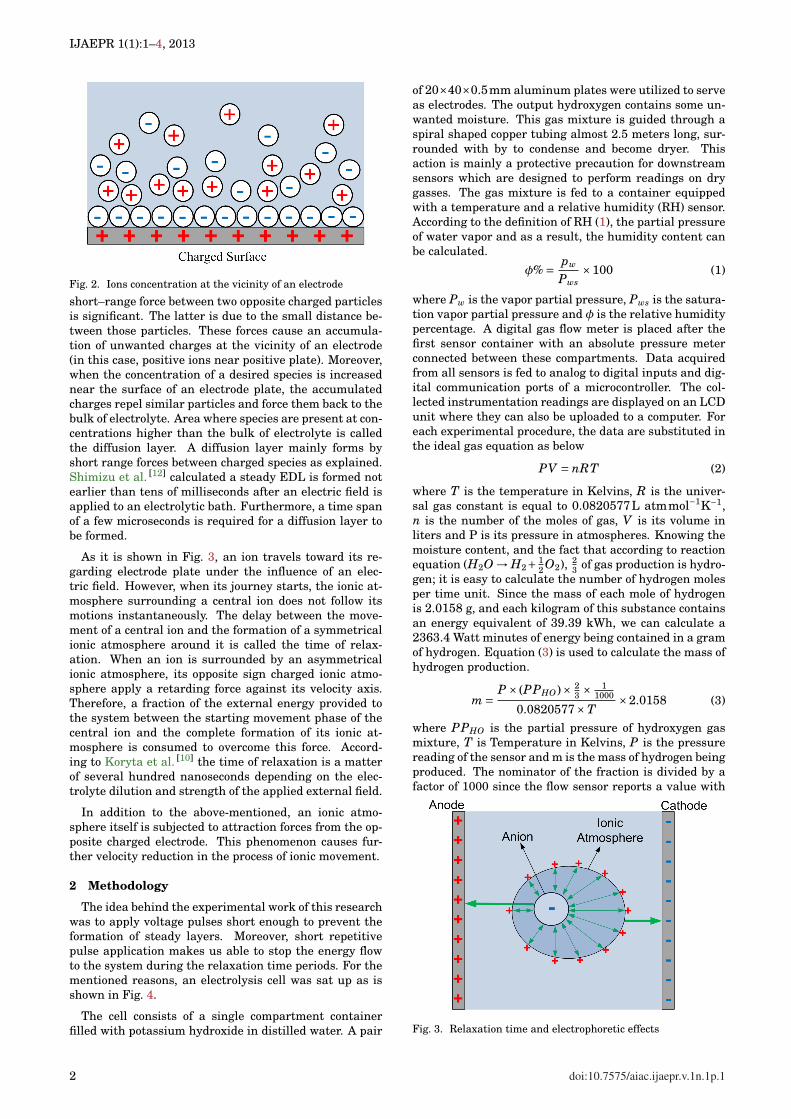
Fig. 2 shows the structure of an electrical double layerand diffusion layer. As in this figure, negative ions arecovering the surface of a positively charged electrodeplate. The interface between different signed species iscalled the EDL. On the other hand, the formation of astable EDL on an electrode plate comes with unwantedside effects. Concentration of in this case negative ionson the surface of the anode attracts positively chargedspecies. Although the charge of one ion is very small, the
IJAEPR 1(1):1–4, 2013
Fig. 2. Ions concentration at the vicinity of an electrode
short–range force between two opposite charged particlesis significant. The latter is due to the small distance be-tween those particles. These forces cause an accumula-tion of unwanted charges at the vicinity of an electrode(in this case, positive ions near positive plate). Moreover,when the concentration of a desired species is increasednear the surface of an electrode plate, the accumulatedcharges repel similar particles and force them back to thebulk of electrolyte. Area where species are present at con-centrations higher than the bulk of electrolyte is calledthe diffusion layer. A diffusion layer mainly forms byshort range forces between charged species as explained.Shimizu et al. [12] calculated a steady EDL is formed notearlier than tens of milliseconds after an electric field isapplied to an electrolytic bath. Furthermore, a time spanof a few microseconds is required for a diffusion layer tobe formed.
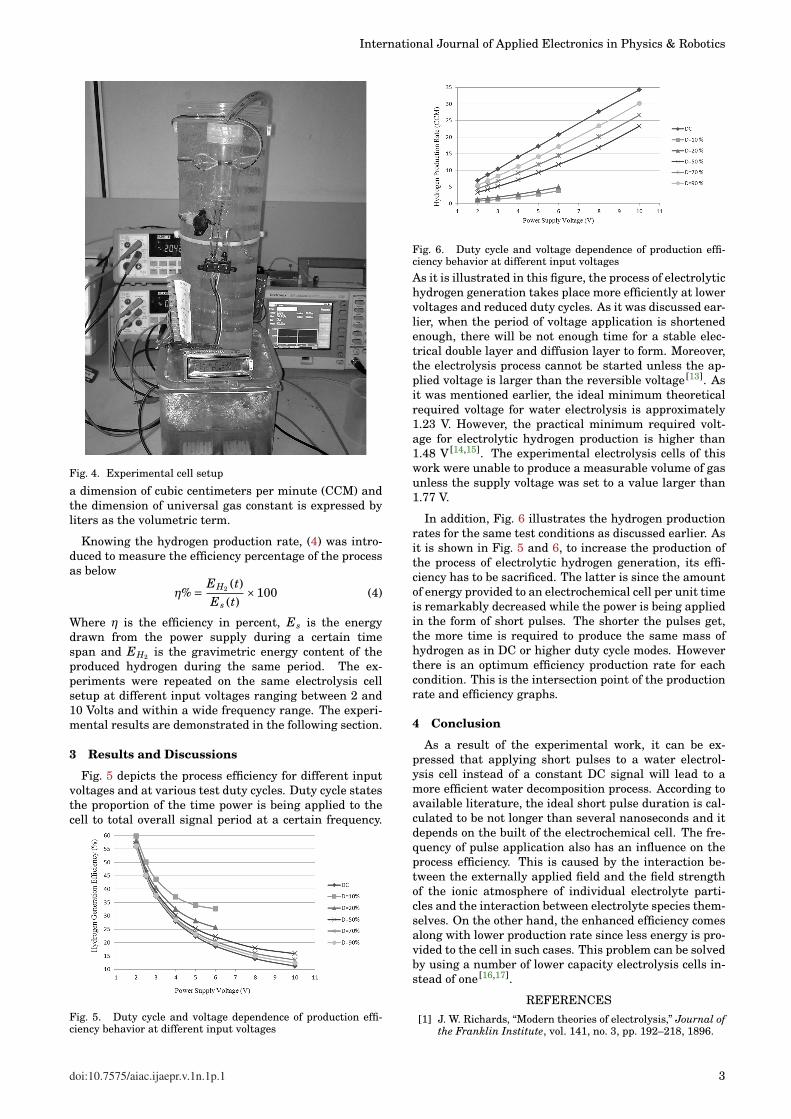
As it is shown in Fig. 3, an ion travels toward its re-garding electrode plate under the influence of an elec-tric field. However, when its journey starts, the ionic at-mosphere surrounding a central ion does not follow itsmotions instantaneously. The delay between the move-ment of a central ion and the formation of a symmetricalionic atmosphere around it is called the time of relax-ation. When an ion is surrounded by an asymmetricalionic atmosphere, its opposite sign charged ionic atmo-sphere apply a retarding force against its velocity axis.Therefore, a fraction of the external energy provided tothe system between the starting movement phase of thecentral ion and the complete formation of its ionic at-mosphere is consumed to overcome this force. Accord-ing to Koryta et al. [10] the time of relaxation is a matterof several hundred nanoseconds depending on the elec-trolyte dilution and strength of the applied external field.
In addition to the above-mentioned, an ionic atmo-sphere itself is subjected to attraction forces from the op-posite charged electrode. This phenomenon causes fur-ther velocity reduction in the process of ionic movement.
2 Methodology
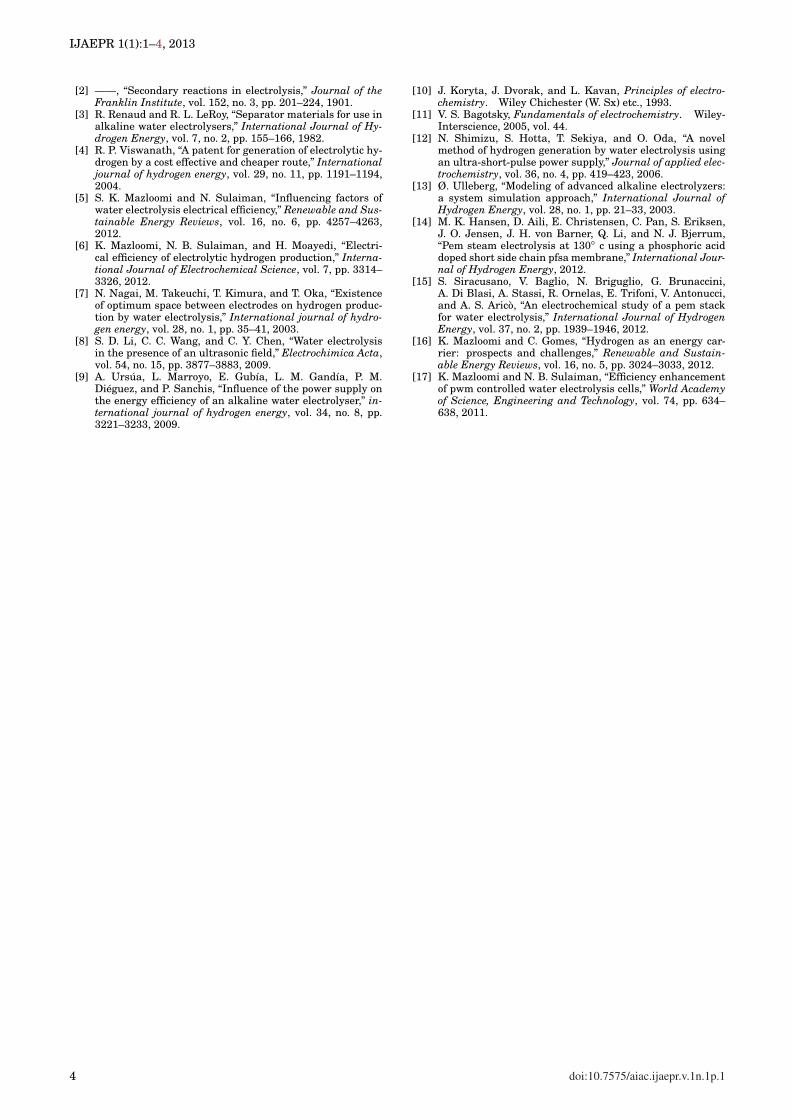
The idea behind the experimental work of this researchwas to apply voltage pulses short enough to prevent theformation of steady layers. Moreover, short repetitivepulse application makes us able to stop the energy flowto the system during the relaxation time periods. For thementioned reasons, an electrolysis cell was sat up as isshown in Fig. 4.
The cell consists of a single compartment containerfilled with potassium hydroxide in distilled water. A pair
of 20×40×0.5mm aluminum plates were utilized to serveas electrodes. The output hydroxygen contains some un-wanted moisture. This gas mixture is guided through aspiral shaped copper tubing almost 2.5 meters long, sur-rounded with by to condense and become dryer. Thisaction is mainly a protective precaution for downstreamsensors which are designed to perform readings on drygasses. The gas mixture is fed to a container equippedwith a temperature and a relative humidity (RH) sensor.According to the definition of RH (1), the partial pressureof water vapor and as a result, the humidity content canbe calculated.
φ%= pw
Pws×100 (1)
where Pw is the vapor partial pressure, Pws is the satura-tion vapor partial pressure and φ is the relative humiditypercentage. A digital gas flow meter is placed after thefirst sensor container with an absolute pressure meterconnected between these compartments. Data acquiredfrom all sensors is fed to analog to digital inputs and dig-ital communication ports of a microcontroller. The col-lected instrumentation readings are displayed on an LCDunit where they can also be uploaded to a computer. Foreach experimental procedure, the data are substituted inthe ideal gas equation as below
PV = nRT (2)
where T is the temperature in Kelvins, R is the univer-sal gas constant is equal to 0.0820577L atmmol−1K−1,n is the number of the moles of gas, V is its volume inliters and P is its pressure in atmospheres. Knowing themoisture content, and the fact that according to reactionequation (H2O → H2+ 1
2 O2), 23 of gas production is hydro-
gen; it is easy to calculate the number of hydrogen molesper time unit. Since the mass of each mole of hydrogenis 2.0158 g, and each kilogram of this substance containsan energy equivalent of 39.39 kWh, we can calculate a2363.4 Watt minutes of energy being contained in a gramof hydrogen. Equation (3) is used to calculate the mass ofhydrogen production.
m = P × (PPHO)× 23 × 1
1000
0.0820577×T×2.0158 (3)
where PPHO is the partial pressure of hydroxygen gasmixture, T is Temperature in Kelvins, P is the pressurereading of the sensor and m is the mass of hydrogen beingproduced. The nominator of the fraction is divided by afactor of 1000 since the flow sensor reports a value with
Fig. 3. Relaxation time and electrophoretic effects
2 doi:10.7575/aiac.ijaepr.v.1n.1p.1
International Journal of Applied Electronics in Physics & Robotics
Fig. 4. Experimental cell setup
a dimension of cubic centimeters per minute (CCM) andthe dimension of universal gas constant is expressed byliters as the volumetric term.
Knowing the hydrogen production rate, (4) was intro-duced to measure the efficiency percentage of the processas below
η%= EH2 (t)Es (t)
×100 (4)
Where η is the efficiency in percent, Es is the energydrawn from the power supply during a certain timespan and EH2 is the gravimetric energy content of theproduced hydrogen during the same period. The ex-periments were repeated on the same electrolysis cellsetup at different input voltages ranging between 2 and10 Volts and within a wide frequency range. The experi-mental results are demonstrated in the following section.
3 Results and Discussions
Fig. 5 depicts the process efficiency for different inputvoltages and at various test duty cycles. Duty cycle statesthe proportion of the time power is being applied to thecell to total overall signal period at a certain frequency.
Fig. 5. Duty cycle and voltage dependence of production effi-ciency behavior at different input voltages
Fig. 6. Duty cycle and voltage dependence of production effi-ciency behavior at different input voltagesAs it is illustrated in this figure, the process of electrolytichydrogen generation takes place more efficiently at lowervoltages and reduced duty cycles. As it was discussed ear-lier, when the period of voltage application is shortenedenough, there will be not enough time for a stable elec-trical double layer and diffusion layer to form. Moreover,the electrolysis process cannot be started unless the ap-plied voltage is larger than the reversible voltage [13]. Asit was mentioned earlier, the ideal minimum theoreticalrequired voltage for water electrolysis is approximately1.23 V. However, the practical minimum required volt-age for electrolytic hydrogen production is higher than1.48 V [14,15]. The experimental electrolysis cells of thiswork were unable to produce a measurable volume of gasunless the supply voltage was set to a value larger than1.77 V.
In addition, Fig. 6 illustrates the hydrogen productionrates for the same test conditions as discussed earlier. Asit is shown in Fig. 5 and 6, to increase the production ofthe process of electrolytic hydrogen generation, its effi-ciency has to be sacrificed. The latter is since the amountof energy provided to an electrochemical cell per unit timeis remarkably decreased while the power is being appliedin the form of short pulses. The shorter the pulses get,the more time is required to produce the same mass ofhydrogen as in DC or higher duty cycle modes. Howeverthere is an optimum efficiency production rate for eachcondition. This is the intersection point of the productionrate and efficiency graphs.
4 Conclusion
As a result of the experimental work, it can be ex-pressed that applying short pulses to a water electrol-ysis cell instead of a constant DC signal will lead to amore efficient water decomposition process. According toavailable literature, the ideal short pulse duration is cal-culated to be not longer than several nanoseconds and itdepends on the built of the electrochemical cell. The fre-quency of pulse application also has an influence on theprocess efficiency. This is caused by the interaction be-tween the externally applied field and the field strengthof the ionic atmosphere of individual electrolyte parti-cles and the interaction between electrolyte species them-selves. On the other hand, the enhanced efficiency comesalong with lower production rate since less energy is pro-vided to the cell in such cases. This problem can be solvedby using a number of lower capacity electrolysis cells in-stead of one [16,17].
REFERENCES[1] J. W. Richards, “Modern theories of electrolysis,” Journal of
the Franklin Institute, vol. 141, no. 3, pp. 192–218, 1896.
doi:10.7575/aiac.ijaepr.v.1n.1p.1 3
IJAEPR 1(1):1–4, 2013
[2] ——, “Secondary reactions in electrolysis,” Journal of theFranklin Institute, vol. 152, no. 3, pp. 201–224, 1901.
[3] R. Renaud and R. L. LeRoy, “Separator materials for use inalkaline water electrolysers,” International Journal of Hy-drogen Energy, vol. 7, no. 2, pp. 155–166, 1982.
[4] R. P. Viswanath, “A patent for generation of electrolytic hy-drogen by a cost effective and cheaper route,” Internationaljournal of hydrogen energy, vol. 29, no. 11, pp. 1191–1194,2004.
[5] S. K. Mazloomi and N. Sulaiman, “Influencing factors ofwater electrolysis electrical efficiency,” Renewable and Sus-tainable Energy Reviews, vol. 16, no. 6, pp. 4257–4263,2012.
[6] K. Mazloomi, N. B. Sulaiman, and H. Moayedi, “Electri-cal efficiency of electrolytic hydrogen production,” Interna-tional Journal of Electrochemical Science, vol. 7, pp. 3314–3326, 2012.
[7] N. Nagai, M. Takeuchi, T. Kimura, and T. Oka, “Existenceof optimum space between electrodes on hydrogen produc-tion by water electrolysis,” International journal of hydro-gen energy, vol. 28, no. 1, pp. 35–41, 2003.
[8] S. D. Li, C. C. Wang, and C. Y. Chen, “Water electrolysisin the presence of an ultrasonic field,” Electrochimica Acta,vol. 54, no. 15, pp. 3877–3883, 2009.
[9] A. Ursúa, L. Marroyo, E. Gubía, L. M. Gandía, P. M.Diéguez, and P. Sanchis, “Influence of the power supply onthe energy efficiency of an alkaline water electrolyser,” in-ternational journal of hydrogen energy, vol. 34, no. 8, pp.3221–3233, 2009.
[10] J. Koryta, J. Dvorak, and L. Kavan, Principles of electro-chemistry. Wiley Chichester (W. Sx) etc., 1993.
[11] V. S. Bagotsky, Fundamentals of electrochemistry. Wiley-Interscience, 2005, vol. 44.
[12] N. Shimizu, S. Hotta, T. Sekiya, and O. Oda, “A novelmethod of hydrogen generation by water electrolysis usingan ultra-short-pulse power supply,” Journal of applied elec-trochemistry, vol. 36, no. 4, pp. 419–423, 2006.
[13] Ø. Ulleberg, “Modeling of advanced alkaline electrolyzers:a system simulation approach,” International Journal ofHydrogen Energy, vol. 28, no. 1, pp. 21–33, 2003.
[14] M. K. Hansen, D. Aili, E. Christensen, C. Pan, S. Eriksen,J. O. Jensen, J. H. von Barner, Q. Li, and N. J. Bjerrum,“Pem steam electrolysis at 130◦ c using a phosphoric aciddoped short side chain pfsa membrane,” International Jour-nal of Hydrogen Energy, 2012.
[15] S. Siracusano, V. Baglio, N. Briguglio, G. Brunaccini,A. Di Blasi, A. Stassi, R. Ornelas, E. Trifoni, V. Antonucci,and A. S. Aricò, “An electrochemical study of a pem stackfor water electrolysis,” International Journal of HydrogenEnergy, vol. 37, no. 2, pp. 1939–1946, 2012.
[16] K. Mazloomi and C. Gomes, “Hydrogen as an energy car-rier: prospects and challenges,” Renewable and Sustain-able Energy Reviews, vol. 16, no. 5, pp. 3024–3033, 2012.
[17] K. Mazloomi and N. B. Sulaiman, “Efficiency enhancementof pwm controlled water electrolysis cells,” World Academyof Science, Engineering and Technology, vol. 74, pp. 634–638, 2011.
4 doi:10.7575/aiac.ijaepr.v.1n.1p.1