Retail Sweep Programs and Bank Reserves, 1994-1999 · Retail Sweep Programs and Bank Reserves,...
22
Retail Sweep Programs and Bank Reserves, 1994-1999 Richard G. Anderson and Robert H. Rasche I n January 1994, the Federal Reserve Board per- mitted a commercial bank to begin using a new type of computer software that dynamically reclassifies balances in its customer accounts from transaction deposits to a type of personal-saving deposit, the money market deposit account (MMDA). 1 This reclassification reduces the bank’s statutory required reserves while leaving unchanged its customers’ perceived holdings of transaction deposits. The use of deposit-sweeping software spread slowly between January 1994 and April 1995, but rapidly thereafter. Estimates of the amounts of transaction deposits reclassified as MMDAs at all U.S. depository institutions, prepared by the Board of Governors’ staff, are shown in Figure 1. 2 By late 1999, the amount was approximately $372 billion. In contrast, the aggregate amount of transaction deposits (demand plus other checkable deposits) in the published M1 monetary aggregate, as of December 1999, was $599.2 billion. In this analysis, we interpret the effects of deposit-sweeping software on bank balance sheets to be economically equivalent to a reduction in statutory reserve-requirement ratios. We seek to measure the amount by which such deposit- sweeping activity has reduced bank reserves (vault cash and deposits at Federal Reserve Banks). Currently, transaction deposits are subject to a 10 percent statutory reserve-requirement ratio on amounts over the low-reserve tranche ($44.3 mil- lion during 2000, $42.8 million during 2001), whereas personal-saving accounts, including MMDAs, are subject to a zero ratio. 3 To be useful in policy analysis and empirical studies, aggregate quantity data on bank reserves must be adjusted for the effects of changes in statutory reserve requirements on the quantity of reserves held by banks. 4 In the past, such adjustments were straightforward because changes in statutory reserve requirements applied simulta- neously and uniformly to groups of depository FEDERAL RESERVE BANK OF ST .LOUIS J ANUARY/F EBRUARY 2001 51 1 O’Sullivan (1998, p. 88) identifies this bank as First Union National Bank: “The trend started almost four years ago when First National Bank applied to the Federal Reserve to do something that became known as ‘the reserve sweep’.” First Union’s idea is reminiscent of the automatic-transfer-from-savings (ATS) account of the 1970s. It differs because transaction deposits are reclassified as MMDA de- posits, a category first created in 1982 by the Garn–St. Germain Act. 2 These data are updated monthly, with a one-month lag, and are avail- able on this Bank’s Web site at<www.stls.frb.org/research/swdata.html>. 3 The Monetary Control Act of 1980 imposed Federal reserve require- ments on net transaction deposits, which equals the sum of check- able deposits due to individuals, partnerships, corporations (includ- ing other depository institutions), the Treasury, state and local gov- ernments, and government agencies, minus the sum of cash items in process of collection and demand deposits due from other depos- itory institutions. So far as we are aware, data on net transaction deposits have not been published by the Federal Reserve Board since implementation of the Monetary Control Act. The statutory reserve requirements applicable to transaction deposits are tiered, with a zero rate applied to the reserve-exemption amount, a 3 per- cent rate applied to the low-reserve tranche, and since April 1992 a 10 percent rate applied to amounts that exceed the tranche. The reserve-exemption amount and the low-reserve tranche are adjusted each year using a formula set by law. For 1992-99, the reserve- exemption amounts were $3.6, 3.8, 4.0, 4.2, 4.3, 4.4, 4.7, and 4.9 million and the low-reserve tranche amounts were $42.2, 46.8, 51.9, 54.0, 52.0, 49.3, 47.8, and 46.5 million. Prior to April 1992, the marginal ratio applicable to transaction deposits was 12 percent. 4 A broad cross-country study illustrating the importance of such adjustments is McCallum and Hargraves (1995). Richard G. Anderson is a vice president and economist and Robert H. Rasche is a senior vice president and director of research at the Federal Reserve Bank of St. Louis. Marcela M. Williams provided research assistance. Sweeps of Transaction Deposits into MMDAs 1994 1995 1996 1997 1998 1999 2000 0 50 100 150 200 250 300 350 400 450 Board of Governors Staff Estimates, Jan. 1994 - Oct. 2000 Billions of Dollars Figure 1
Transcript of Retail Sweep Programs and Bank Reserves, 1994-1999 · Retail Sweep Programs and Bank Reserves,...

Retail Sweep Programsand Bank Reserves,1994-1999Richard G. Anderson andRobert H. Rasche
In January 1994, the Federal Reserve Board per-mitted a commercial bank to begin using a newtype of computer software that dynamically
reclassifies balances in its customer accounts fromtransaction deposits to a type of personal-savingdeposit, the money market deposit account(MMDA).1 This reclassification reduces the bank’sstatutory required reserves while leavingunchanged its customers’ perceived holdings oftransaction deposits.
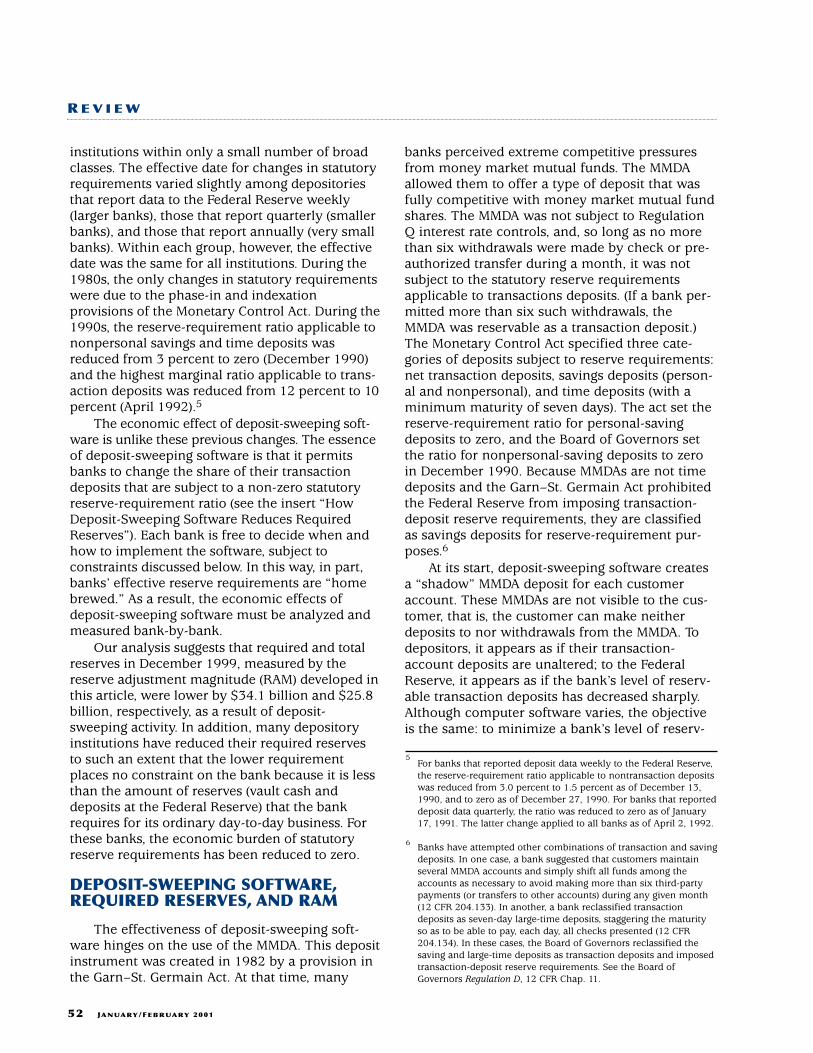
The use of deposit-sweeping software spreadslowly between January 1994 and April 1995, butrapidly thereafter. Estimates of the amounts oftransaction deposits reclassified as MMDAs at allU.S. depository institutions, prepared by the Boardof Governors’ staff, are shown in Figure 1.2 By late1999, the amount was approximately $372 billion.In contrast, the aggregate amount of transactiondeposits (demand plus other checkable deposits) inthe published M1 monetary aggregate, as ofDecember 1999, was $599.2 billion.
In this analysis, we interpret the effects ofdeposit-sweeping software on bank balance sheetsto be economically equivalent to a reduction instatutory reserve-requirement ratios. We seek tomeasure the amount by which such deposit-sweeping activity has reduced bank reserves (vaultcash and deposits at Federal Reserve Banks).Currently, transaction deposits are subject to a 10percent statutory reserve-requirement ratio onamounts over the low-reserve tranche ($44.3 mil-lion during 2000, $42.8 million during 2001),whereas personal-saving accounts, includingMMDAs, are subject to a zero ratio.3
To be useful in policy analysis and empiricalstudies, aggregate quantity data on bank reservesmust be adjusted for the effects of changes in
statutory reserve requirements on the quantity ofreserves held by banks.4 In the past, suchadjustments were straightforward because changesin statutory reserve requirements applied simulta-neously and uniformly to groups of depository
FEDERAL RESERVE BANK OF ST. LOUIS
JANUARY/FEBRUARY 2001 51
1O’Sullivan (1998, p. 88) identifies this bank as First Union NationalBank: “The trend started almost four years ago when First NationalBank applied to the Federal Reserve to do something that becameknown as ‘the reserve sweep’.” First Union’s idea is reminiscent ofthe automatic-transfer-from-savings (ATS) account of the 1970s. Itdiffers because transaction deposits are reclassified as MMDA de-posits, a category first created in 1982 by the Garn–St. GermainAct.
2 These data are updated monthly, with a one-month lag, and are avail-able on this Bank’s Web site at<www.stls.frb.org/research/swdata.html>.
3 The Monetary Control Act of 1980 imposed Federal reserve require-ments on net transaction deposits, which equals the sum of check-able deposits due to individuals, partnerships, corporations (includ-ing other depository institutions), the Treasury, state and local gov-ernments, and government agencies, minus the sum of cash itemsin process of collection and demand deposits due from other depos-itory institutions. So far as we are aware, data on net transactiondeposits have not been published by the Federal Reserve Boardsince implementation of the Monetary Control Act. The statutoryreserve requirements applicable to transaction deposits are tiered,with a zero rate applied to the reserve-exemption amount, a 3 per-cent rate applied to the low-reserve tranche, and since April 1992 a10 percent rate applied to amounts that exceed the tranche. Thereserve-exemption amount and the low-reserve tranche are adjustedeach year using a formula set by law. For 1992-99, the reserve-exemption amounts were $3.6, 3.8, 4.0, 4.2, 4.3, 4.4, 4.7, and 4.9million and the low-reserve tranche amounts were $42.2, 46.8, 51.9,54.0, 52.0, 49.3, 47.8, and 46.5 million. Prior to April 1992, themarginal ratio applicable to transaction deposits was 12 percent.
4 A broad cross-country study illustrating the importance of suchadjustments is McCallum and Hargraves (1995).
Richard G. Anderson is a vice president and economist and RobertH. Rasche is a senior vice president and director of research at theFederal Reserve Bank of St. Louis. Marcela M. Williams providedresearch assistance.
Sweeps of Transaction Depositsinto MMDAs
1994 1995 1996 1997 1998 1999 20000
50
100
150
200
250
300
350
400
450
Board of Governors Staff Estimates, Jan. 1994 - Oct. 2000
Bill
ion
s o
f Do
llars
Figure 1
52 JANUARY/FEBRUARY 2001
R E V I E W
institutions within only a small number of broadclasses. The effective date for changes in statutoryrequirements varied slightly among depositoriesthat report data to the Federal Reserve weekly(larger banks), those that report quarterly (smallerbanks), and those that report annually (very smallbanks). Within each group, however, the effectivedate was the same for all institutions. During the1980s, the only changes in statutory requirementswere due to the phase-in and indexationprovisions of the Monetary Control Act. During the1990s, the reserve-requirement ratio applicable tononpersonal savings and time deposits wasreduced from 3 percent to zero (December 1990)and the highest marginal ratio applicable to trans-action deposits was reduced from 12 percent to 10percent (April 1992).5
The economic effect of deposit-sweeping soft-ware is unlike these previous changes. The essenceof deposit-sweeping software is that it permitsbanks to change the share of their transactiondeposits that are subject to a non-zero statutoryreserve-requirement ratio (see the insert “HowDeposit-Sweeping Software Reduces RequiredReserves”). Each bank is free to decide when andhow to implement the software, subject toconstraints discussed below. In this way, in part,banks’ effective reserve requirements are “homebrewed.” As a result, the economic effects ofdeposit-sweeping software must be analyzed andmeasured bank-by-bank.
Our analysis suggests that required and totalreserves in December 1999, measured by thereserve adjustment magnitude (RAM) developed inthis article, were lower by $34.1 billion and $25.8billion, respectively, as a result of deposit-sweeping activity. In addition, many depositoryinstitutions have reduced their required reservesto such an extent that the lower requirementplaces no constraint on the bank because it is lessthan the amount of reserves (vault cash anddeposits at the Federal Reserve) that the bankrequires for its ordinary day-to-day business. Forthese banks, the economic burden of statutoryreserve requirements has been reduced to zero.
DEPOSIT-SWEEPING SOFTWARE,REQUIRED RESERVES, AND RAM
The effectiveness of deposit-sweeping soft-ware hinges on the use of the MMDA. This depositinstrument was created in 1982 by a provision inthe Garn–St. Germain Act. At that time, many
banks perceived extreme competitive pressuresfrom money market mutual funds. The MMDAallowed them to offer a type of deposit that wasfully competitive with money market mutual fundshares. The MMDA was not subject to RegulationQ interest rate controls, and, so long as no morethan six withdrawals were made by check or pre-authorized transfer during a month, it was notsubject to the statutory reserve requirementsapplicable to transactions deposits. (If a bank per-mitted more than six such withdrawals, theMMDA was reservable as a transaction deposit.)The Monetary Control Act specified three cate-gories of deposits subject to reserve requirements:net transaction deposits, savings deposits (person-al and nonpersonal), and time deposits (with aminimum maturity of seven days). The act set thereserve-requirement ratio for personal-savingdeposits to zero, and the Board of Governors setthe ratio for nonpersonal-saving deposits to zeroin December 1990. Because MMDAs are not timedeposits and the Garn–St. Germain Act prohibitedthe Federal Reserve from imposing transaction-deposit reserve requirements, they are classifiedas savings deposits for reserve-requirement pur-poses.6
At its start, deposit-sweeping software createsa “shadow” MMDA deposit for each customeraccount. These MMDAs are not visible to the cus-tomer, that is, the customer can make neitherdeposits to nor withdrawals from the MMDA. Todepositors, it appears as if their transaction-account deposits are unaltered; to the FederalReserve, it appears as if the bank’s level of reserv-able transaction deposits has decreased sharply.Although computer software varies, the objectiveis the same: to minimize a bank’s level of reserv-
5For banks that reported deposit data weekly to the Federal Reserve,the reserve-requirement ratio applicable to nontransaction depositswas reduced from 3.0 percent to 1.5 percent as of December 13,1990, and to zero as of December 27, 1990. For banks that reporteddeposit data quarterly, the ratio was reduced to zero as of January17, 1991. The latter change applied to all banks as of April 2, 1992.
6 Banks have attempted other combinations of transaction and savingdeposits. In one case, a bank suggested that customers maintainseveral MMDA accounts and simply shift all funds among theaccounts as necessary to avoid making more than six third-partypayments (or transfers to other accounts) during any given month(12 CFR 204.133). In another, a bank reclassified transactiondeposits as seven-day large-time deposits, staggering the maturityso as to be able to pay, each day, all checks presented (12 CFR204.134). In these cases, the Board of Governors reclassified thesaving and large-time deposits as transaction deposits and imposedtransaction-deposit reserve requirements. See the Board ofGovernors Regulation D, 12 CFR Chap. 11.
FEDERAL RESERVE BANK OF ST. LOUIS
JANUARY/FEBRUARY 2001 53
Let us consider a hypothetical $1 billionbank with $200 million in transaction deposits.We focus on two constraints faced by the bank:(i) to satisfy the Federal Reserve’s statutoryreserve requirements and (ii) to convert depositsinto currency and settle interbank debits (relatedto check clearing and wire transfers) usingdeposits at the Federal Reserve. Fortunately, theassets involved—vault cash and deposits at theFederal Reserve—do double duty.
The Bank Before Deposit-Sweeping Software.A bank’s statutory required reserves are calculat-ed from close-of-business data. Excluding anyspecial adjustments, the bank’s required reservesas of late January 1999 would be as follows:
• 0% on the first $4.9 million of transactiondeposits (the reserve-exemption amount);
• 3% on the next $41.6 million of transactiondeposits (up to the low-reserve tranche of $46.5 million), equal to $1.248 million;
• 10% on the amount in excess of $46.5 mil-lion, or $15.350 million.Banking industry data suggest that such a
bank might choose to hold vault cash equal toapproximately 5 percent of its transactiondeposits, or $10 million. If all vault cash is“applied” to satisfy reserve requirements, thebank would need to maintain at least $6.598 mil-lion on deposit at the Federal Reserve to satisfyits statutory reserve requirement. Its balancesheet might look like Table A (see page 55).
Payments Activity and the Reserve-Requirement Tax. Banking-industry data used inour analysis suggest that a typical bank, in theabsence of statutory reserve requirements, wouldtend to maintain deposits at the Federal Reserve
equal to approximately 1 percent of its transac-tion deposits (in the example, $2 million). Thedata also suggest that deposit-sweeping activitydoes not affect the amount of vault cash held,relative to the sum of transaction deposits plusthe amount of deposits being reclassified asMMDA. For the example bank, the reserve-requirement tax is the interest foregone by main-taining $7 million, rather than $2 million, ondeposit at the Federal Reserve.
Overnight Repurchase Agreement–BasedDeposit Sweeping. During the 1970s, manybanks began “sweeping” customer deposits intoovernight repurchase agreements (RPs). Let ussuppose that the bank in this example wishes, atthe behest of its large business customers, tosweep half its deposits each night. To do so, itmaintains an inventory of high-quality liquidsecurities, such as Treasury bills. Its balancesheet at 3 p.m., prior to sweeping, might looklike Table B1. At 6 p.m. after sweeping, it mightappear as Table B2.
This example includes the sale (lending) of$5 million in the federal funds market; the bankis assumed to retain $2 million in deposits toservice customer accounts and reduce the risk ofan overnight overdraft at the Federal Reserve. Ifthe bank’s customers routinely desire to engagein overnight RPs, the bank likely will reduce itsbalance at the Federal Reserve and this lendingwill vanish.
1990s MMDA-Based Sweeping. Our examina-tion of banking data suggests that MMDA-basedsweeping may reduce transaction deposits at atypical bank by two thirds or more. If the bank in
HOW DEPOSIT-SWEEPING SOFTWARE REDUCES REQUIRED RESERVES
able transaction deposits, subject to several con-straints. The general parameters of this optimiza-tion problem are as follows:
• The Federal Reserve calculates a bank’srequired reserves based on a 14-day average ofthe close-of-day level of its transactiondeposits.7
• Each calendar month, an unlimited number oftransfers may be made from a customer’stransaction deposit account into the shadowMMDA. However, only six transfers may bemade out of the shadow MMDA to thecustomer’s transaction-deposit account.
• Checks presented to the bank for payment are
only debited against the customer’s transaction-deposit account, not against the MMDA. If the
7 The computation of statutory required reserves involves two legallydefined time periods: the reserve computation period and the re-serve maintenance period. The former are 14-day periods that endevery other Monday; the latter are 14-day periods that end everyother Wednesday. Prior to August 1998, a bank’s required reserves, tobe maintained during a reserve maintenance period, were based ona bank’s deposits during the reserve computation period ending2 days prior to the end of the reserve maintenance period. As ofAugust 1998, the required reserves have been based on deposits dur-ing the reserve computation period ending 30 days before the end ofthe reserve maintenance period. Required reserves must be satisfiedby eligible vault cash and deposits held during the maintenance peri-od at Federal Reserve Banks. Eligible vault cash is vault cash held bya bank during the reserve computation period ending 30 days beforethe end of the maintenance period.
(Continued on p. 54)
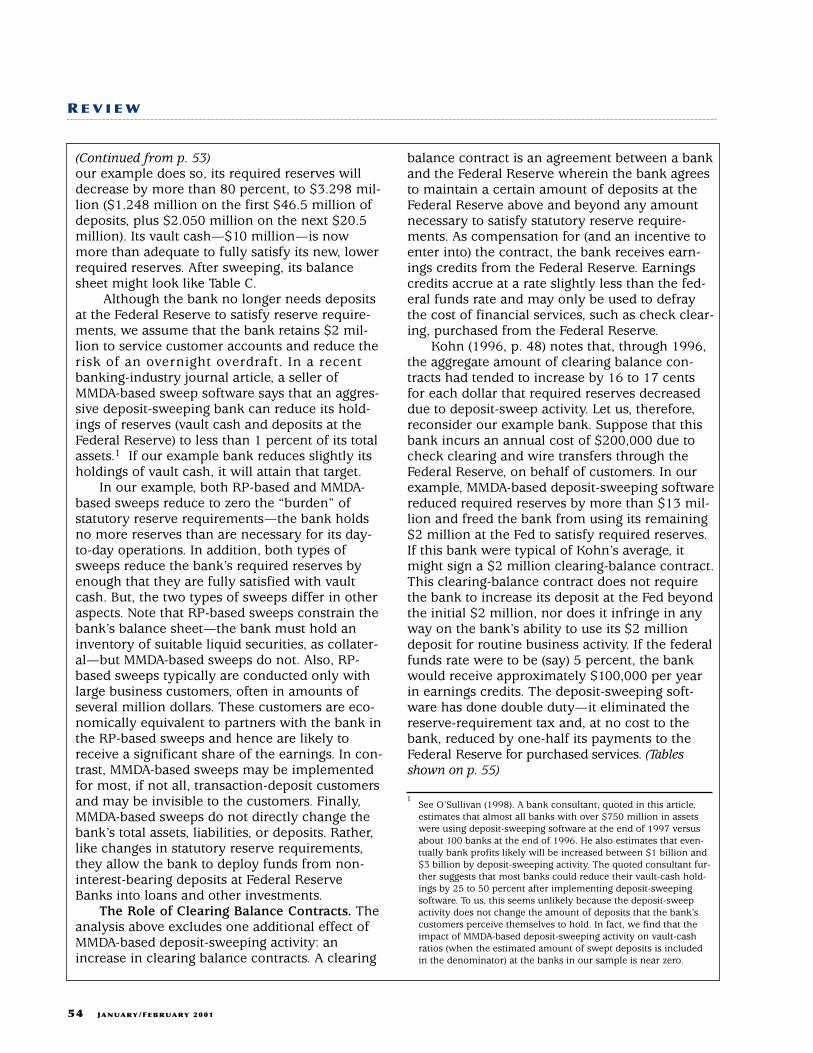
(Continued from p. 53)our example does so, its required reserves willdecrease by more than 80 percent, to $3.298 mil-lion ($1.248 million on the first $46.5 million ofdeposits, plus $2.050 million on the next $20.5million). Its vault cash—$10 million—is nowmore than adequate to fully satisfy its new, lowerrequired reserves. After sweeping, its balancesheet might look like Table C.
Although the bank no longer needs depositsat the Federal Reserve to satisfy reserve require-ments, we assume that the bank retains $2 mil-lion to service customer accounts and reduce therisk of an overnight overdraft. In a recentbanking-industry journal article, a seller ofMMDA-based sweep software says that an aggres-sive deposit-sweeping bank can reduce its hold-ings of reserves (vault cash and deposits at theFederal Reserve) to less than 1 percent of its totalassets.1 If our example bank reduces slightly itsholdings of vault cash, it will attain that target.
In our example, both RP-based and MMDA-based sweeps reduce to zero the “burden” ofstatutory reserve requirements—the bank holdsno more reserves than are necessary for its day-to-day operations. In addition, both types ofsweeps reduce the bank’s required reserves byenough that they are fully satisfied with vaultcash. But, the two types of sweeps differ in otheraspects. Note that RP-based sweeps constrain thebank’s balance sheet—the bank must hold aninventory of suitable liquid securities, as collater-al—but MMDA-based sweeps do not. Also, RP-based sweeps typically are conducted only withlarge business customers, often in amounts ofseveral million dollars. These customers are eco-nomically equivalent to partners with the bank inthe RP-based sweeps and hence are likely toreceive a significant share of the earnings. In con-trast, MMDA-based sweeps may be implementedfor most, if not all, transaction-deposit customersand may be invisible to the customers. Finally,MMDA-based sweeps do not directly change thebank’s total assets, liabilities, or deposits. Rather,like changes in statutory reserve requirements,they allow the bank to deploy funds from non-interest-bearing deposits at Federal ReserveBanks into loans and other investments.
The Role of Clearing Balance Contracts. Theanalysis above excludes one additional effect ofMMDA-based deposit-sweeping activity: anincrease in clearing balance contracts. A clearing
balance contract is an agreement between a bankand the Federal Reserve wherein the bank agreesto maintain a certain amount of deposits at theFederal Reserve above and beyond any amountnecessary to satisfy statutory reserve require-ments. As compensation for (and an incentive toenter into) the contract, the bank receives earn-ings credits from the Federal Reserve. Earningscredits accrue at a rate slightly less than the fed-eral funds rate and may only be used to defraythe cost of financial services, such as check clear-ing, purchased from the Federal Reserve.
Kohn (1996, p. 48) notes that, through 1996,the aggregate amount of clearing balance con-tracts had tended to increase by 16 to 17 centsfor each dollar that required reserves decreaseddue to deposit-sweep activity. Let us, therefore,reconsider our example bank. Suppose that thisbank incurs an annual cost of $200,000 due tocheck clearing and wire transfers through theFederal Reserve, on behalf of customers. In ourexample, MMDA-based deposit-sweeping softwarereduced required reserves by more than $13 mil-lion and freed the bank from using its remaining$2 million at the Fed to satisfy required reserves.If this bank were typical of Kohn’s average, itmight sign a $2 million clearing-balance contract.This clearing-balance contract does not requirethe bank to increase its deposit at the Fed beyondthe initial $2 million, nor does it infringe in anyway on the bank’s ability to use its $2 milliondeposit for routine business activity. If the federalfunds rate were to be (say) 5 percent, the bankwould receive approximately $100,000 per yearin earnings credits. The deposit-sweeping soft-ware has done double duty—it eliminated thereserve-requirement tax and, at no cost to thebank, reduced by one-half its payments to theFederal Reserve for purchased services. (Tablesshown on p. 55)
54 JANUARY/FEBRUARY 2001
R E V I E W
1See O’Sullivan (1998). A bank consultant, quoted in this article,estimates that almost all banks with over $750 million in assetswere using deposit-sweeping software at the end of 1997 versusabout 100 banks at the end of 1996. He also estimates that even-tually bank profits likely will be increased between $1 billion and$3 billion by deposit-sweeping activity. The quoted consultant fur-ther suggests that most banks could reduce their vault-cash hold-ings by 25 to 50 percent after implementing deposit-sweepingsoftware. To us, this seems unlikely because the deposit-sweepactivity does not change the amount of deposits that the bank’scustomers perceive themselves to hold. In fact, we find that theimpact of MMDA-based deposit-sweeping activity on vault-cashratios (when the estimated amount of swept deposits is includedin the denominator) at the banks in our sample is near zero.

Assets * Liabilities *Table A: A Bank with No Sweeping Activity
Vault cash $10,000 Transaction deposits $200,000Deposits at Federal Reserve 7,000 Savings deposits 400,000Other assets 983,000 Time deposits 300,000
Other liabilities and capital 100,000Total assets 1,000,000 Total liabilities 1,000,000
Memo: Required reserves 16,598Applied vault cash 10,000Surplus vault cash 0Applied Federal Reserve deposits 6,598Excess reserves (excl. vault cash) 402
Table B1: A Bank Preparing for RP-Based Sweep
Vault cash $10,000 Transaction deposits $200,000Deposits at Federal Reserve 7,000 Savings deposits 400,000Treasury bills 100,000 Time deposits 300,000Other assets 883,000 Other liabilities and capital 100,000Total assets 1,000,000 Total liabilities 1,000,000
Memo: Required reserves 16,598Applied vault cash 10,000Surplus vault cash 0Excess reserves (excl. vault cash) 402
Table B2: A Bank After RP-Based Sweep
Vault cash $10,000 Transaction deposits $100,000Deposits at Federal Reserve 2,000 Savings deposits 400,000Treasury bills 0 Time deposits 300,000Federal funds sold 5,000 Other liabilities and capital 100,000Other assets 883,000Total assets 900,000 Total liabilities 900,000
Memo: Required reserves 6,598Applied vault cash 6,598Surplus vault cash 3,402Excess reserves (excl. vault cash) 2,000
Table C: A Bank After MMDA-Based Sweep
Vault cash $10,000 Transaction deposits $67,000Deposits at Federal Reserve 2,000 Savings deposits, including MMDA 533,000Other assets 988,000 Time deposits 300,000
Other liabilities and capital 100,000Total assets 1,000,000 Total liabilities 1,000,00
Memo: Required reserves 3,298Applied vault cash 3,298 Surplus vault cash 6,702Excess reserves (excl. vault cash) 2,000
*As of close of business; dollar amounts are in thousands.
FEDERAL RESERVE BANK OF ST. LOUIS
JANUARY/FEBRUARY 2001 55
DEPOSIT-SWEEPING SOFTWARE AND BANK BALANCE SHEETS

56 JANUARY/FEBRUARY 2001
R E V I E W
amount of funds in the transaction deposit isinadequate, a transfer must be made from theMMDA.
• On the sixth transfer, all funds remaining inthe MMDA are moved to the transactiondeposit. (A seventh transfer would cause theMMDA to be subject to the reserverequirements applicable to transactiondeposits.)Because no debits are made to customer trans-
action deposits between just before the close ofbusiness on Friday and just before the opening ofbusiness on Monday, some early software simplyreclassified transaction deposits as shadow MMDAsprior to the close of business on Friday. Thisreduced a bank’s weekly average level of requiredreserves by 3
7 : its transaction deposit liabilities forFriday, Saturday, and Sunday, as reported to theFederal Reserve, were zero. About ten times eachyear, a Monday holiday allowed delaying the returnof funds to transaction deposits out of the MMDAuntil the opening of business on Tuesday. Latersoftware is more sophisticated and analyzes thereceipt and payment patterns of customers.8 Ofcourse, regardless of the efficiency of the software,the bank faces two additional constraints that limithow much it can reduce its reserves. It must keepon hand sufficient vault cash so as to be able toredeem customer deposits into currency, and itmust maintain sufficient deposits at FederalReserve Banks to avoid both excessive daylightoverdrafts and overdrawing its account at the endof the day.
To measure the effect of deposit-sweeping soft-ware on bank reserves, we need a benchmark, oralternative. RAM furnishes one such measurebecause it was designed to measure the changes inbank reserves caused by differences in statutoryreserve requirements—specifically, the differencesbetween those requirements in effect during thecurrent period and those for a specific benchmark,or base, period.9 The view that deposit-sweepingactivity should be analyzed as a change instatutory reserve requirements, and henceincluded within the framework of RAM, is not uni-versally held, however. The Board of Governors’staff, for example, does not publish reserve aggre-gates adjusted for the effects of deposit-sweepingactivity, apparently believing that the impact ofsuch activity is not to be interpreted aseconomically equivalent to a change in statutoryrequirements.10
In its economic aspects, deposit-sweeping soft-ware programs of the 1990s differ distinctly fromthe collateralized overnight-loan sweep programsof the 1970s—to borrow a phrase, they are not“your father’s Oldsmobile.” The business-orientedsweep programs of the 1970s essentially wereovernight collateralized loans to mutual funds andbanks, initiated by depositors (see Kohn, 1994,Chap. 9; or Stigum, 1990, Chap. 13). These loanswere made with the full participation of depositors,who received directly the lion’s share of the invest-ment return; the bank’s net earnings arose frombeing a middleman. Although such sweepsreduced banks’ required reserves, their primarypurpose was to simulate a legally prohibitedinterest-bearing demand deposit.11
The retail-oriented deposit-sweeping activity ofthe 1990s differs. First, except for competitivemarket pressures, it seems unlikely that bankshave directly passed along the earnings fromdeposit-sweeping activity to transaction-accountcustomers.12 In part, this may be due to few retaildepositors understanding the process, despitemany banks notifying customers via monthlystatement inserts (containing phrases such as“…your deposit may be reclassified for purposes ofcompliance with Federal Reserve Regulation D…”).Banks’ answers to question 12 of the FederalReserve’s May 1998 Senior Financial Officer Surveyare illustrative. On that question, banks responded
8O’Sullivan (1998) includes a description of one learning mecha-nism in recent software.
9 For further discussion of RAM, see Anderson and Rasche (1999,1996a, b) and earlier references therein.
10 Alternative measures of adjusted reserves currently are publishedby the Board of Governors of the Federal Reserve System and bythe Federal Reserve Bank of St. Louis. The measures differ withrespect to both the items included and the adjustment for changesin reserve requirements. See, for example, the annual benchmarkrelease Reserves of Depository Institutions (Division of MonetaryAffairs, Board of Governors of the Federal Reserve System).
11 We emphasize the economic effects of sweep activity. From theviewpoint of a bank manager, both RP- and MMDA-based sweepsfurnish a synthetic interest-bearing demand deposit for its cus-tomers; see, for example, Coyle (2000). Note that MMDA-basedsweeping may be very profitable for a bank if its customers areunaware of the practice and do not demand a share of the earn-ings. Some analysts have estimated that profit margins may be ashigh as 90 percent (O’Sullivan, 1998).
12 To test this hypothesis, we have examined scatter plots of bankoffering rates on other checkable deposits and time deposits, rela-tive to market yields on both short- and long-term Treasury issues.In monthly data, no change is apparent during the last decade.

that even if they were permitted to pay interest ondemand deposits and if the Fed paid interest ondeposits at Federal Reserve Banks, they most likelywould tier rates paid on demand deposits and thatthe highest rate “would still be considerably belowthe level of market interest rates.” Second, thesweeps of the 1970s required banks to maintain asignificant amount of high-quality liquid collateralfor use in repurchase agreements with largebusiness customers. The retail sweeps of the 1990sallow a bank to deploy into higher-earning assets,as it sees fit, the funds released by reducedrequired reserves. In the boxed insert “HowDeposit-Sweeping Software Reduces RequiredReserves,” for example, the bank’s earning assetsincrease with no increase in total deposits orfunding costs.
Linkages among retail deposit-sweepprograms, the Depression-era prohibition of thepayment of (explicit) interest on demand deposits,and the payment by the Fed of interest on depositsat Federal Reserve Banks have been discussed byFederal Reserve Governor Lawrence Meyer inrecent Congressional testimony.13 An importantissue is whether banks would reduce or eliminatethe use of deposit-sweeping software if the FederalReserve paid interest on reserve balances. Becausethe economic effects of deposit-sweeping softwareare similar to reductions in statutory reserverequirements, in our opinion such an outcome isunlikely. First, as noted above, it seems unlikelythat banks have passed much of the benefit from1990s-style deposit-sweeping activity on to theirtransaction-deposit customers. Second, becausenewly released funds may be invested as the banksees fit, including in consumer and business loans,it seems unlikely that deposits at Federal ReserveBanks, earning interest at the federal funds rate,would be an attractive investment. In question 10of the May 1998 Senior Financial Officer Survey,banks were asked whether they would dismantlesweep programs if the Federal Reserve paidinterest on deposits. In their summary of thesurvey, Board staff noted that “several” banks saidthat they would, or might, dismantle sweepprograms. More than half of the respondents, how-ever, said that interest paid at the federal funds ratewould be unattractive, relative to the higher returnsavailable on alternative investments. The staffsummary also notes, on page 8, that “the resultson this question seem qualitatively different from
the responses to a similar question on the May1996 Senior Financial Officer Survey. On thatsurvey, two thirds of the respondents indicated thatthey would dismantle their retail sweep programseither immediately or over time if interest werepaid on Fed account balances held to meet reserverequirements.” In our opinion, retail deposit-sweeping software is here to stay for the sameeconomic reasons that cause banks to preferdecreases, rather than increases, in statutoryreserve requirements.
Reserve-Requirement Ratios andEconomically Bound Banks
To measure the effect of deposit-sweepingsoftware on the amount of reserves held by banks,we need to separate banks wherein the quantity ofreserves demanded is sensitive to changes inreserve-requirement ratios from those in which itis not.14 When reserve requirements are “low,” adepository institution’s demand for reserves maybe largely, or even entirely, determined by its busi-ness needs (converting customer deposits into cur-rency, originating interbank wire transfers, settlinginterbank check collection debits) rather than bystatutory requirements. In the United States, thelevel of reserves held in the absence of statutory
FEDERAL RESERVE BANK OF ST. LOUIS
JANUARY/FEBRUARY 2001 57
13 See Meyer (1998, 2000). Meyer’s 2000 testimony was in regard toHouse Resolution 4209, a bill that would “require the payment ofinterest on reserves maintained at Federal reserve [sic] banks…”(106th Congress, 2nd Session, as reported with amendments onOctober 17, 2000). The text of the bill is available on the Library ofCongress’ “Thomas” legislative Web site. Although the FederalReserve does not pay explicit interest on deposits at FederalReserve Banks, banks that enter into clearing balance contracts docurrently receive at approximately the federal funds rate “earningscredits” on those deposits that are obligated under clearing balancecontracts. A clearing-balance contract is a contractual agreementbetween a depository institution and a Federal Reserve Bank. In thecontract, the depository agrees to maintain a specific amount ofdeposits at the Federal Reserve Bank above and beyond theamount, if any, necessary to satisfy its statutory reserve require-ment. In turn, the depository institution accrues earnings creditswhich may be used to defray the cost of services purchased fromthe Federal Reserve such as check clearing and wire transfers.Earnings credits may not be converted to cash and have no cashvalue except in exchange for Federal Reserves services. Penaltiesapply for entering into such a contract and subsequently not hold-ing sufficient deposits (Stevens, 1993). A bill now pending inCongress (H.R. 4209) would eliminate earnings credits in favor ofcash interest payments.
14 Note that in this analysis the term “total reserves” includes all vaultcash held by depository institutions. In Board of Governors’ publi-cations, however, reserves includes only the amount of vault cashthat is applied to satisfy statutory reserve requirements—any “sur-plus” amount is excluded.

58 JANUARY/FEBRUARY 2001
R E V I E W
reserve requirements might be very small indeedbecause banks are permitted daylight overdraftson their deposit accounts at the Federal ReserveBanks (Emmons, 1997; Furfine, 2000). Whenstatutory reserve requirements are “high,” theamount of reserves held will be approximatelyequal to its required reserves. (This statementassumes that all base money held by depositoryinstitutions can be used to satisfy reserve require-ments. In the United States, member banks couldnot apply vault cash to satisfy reserve require-ments between 1917 and 1959.) Hence, measuringRAM requires a model of banks’ demand forreserves that includes an explicit role for statutoryrequirements.
Let us denote a depository institution’sreserve demand function as TRD(D,rr), where Ddenotes the institution’s deposit liabilities and rrthe statutory reserve-requirement ratio. Further,omitting all tiering of reserve requirements, let usdenote its required reserves as RR(D,rr) = rr D.Then, when rr is relatively large,
such that statutory reserve requirements are, at themargin, the binding constraint that determines theamount of reserves held.15 When rr is relativelysmall, we assume that
such that the bank’s business needs, rather thanstatutory requirements, are the binding constraint.In Anderson and Rasche (1996b), we introducedthe term economically nonbound to describe bankswhere
and economically bound to describe banks where
To measure RAM, we must know (or infer) thesign of the derivative
at all dates and for all banks in our sample. To bespecific, for an individual bank, let RR(Dt,rr0) andRR(Dt,rrt) and denote the period t levels of
required reserves when the statutory requirementsof a base period, 0, and of period t, respectively,are in effect. For all cases, assume that sufficientdata on reservable liabilities during period t existso as to permit calculation of the quantityRR(Dt,rr0). Then, consider four cases:
Case 1: If rr0=rrt , that is, reserve requirementshave not changed, RAM = 0.
Case 2: If
that is, if the business needs of the bank were thebinding constraint in both the base period 0 andperiod t, then RAM = 0.
Case 3: If both
that is, if the statutory requirements were abinding constraint on the bank in both the baseperiod 0 and period t, then the RAM adjustmentfor period t (conditional on the choice of period 0as the base period) is
Case 4: If
that is, if the statutory requirements were bindingin the base period but not in period t, then tomeasure RAM we must find the smallest reserve-requirement ratio, say rr*, for which
Then,
The above analysis is applicable to cases where theonly change in statutory reserve requirements be-tween two periods is the reserve-requirement ratio,rr, and data exist to calculate the counterfactual level
RAM RR D rr RR D rrt t t= ( ) − ( ), , .*0
∂ ( )∂
>==
TR D rr
rr
D
D Drr rr
t
t
,.
*
0
∂ ( )∂
>∂ ( )
∂=
==
==
TR D rr
rr
TR D rr
rr
D
D Drr rr
D
D Drr rr
tt
, ,
00
0 0but ,
RAM RR D rr RR D rrt t t t= ( ) − ( ), , .0
∂ ( )∂
>∂ ( )
∂>
==
==
TR D rr
rr
TR D rr
rr
D
D Drr rr
D
D Drr rr
tt
, ,
00
0 0and ,
∂ ( )∂
=∂ ( )
∂=
==
==
TR D rr
rr
TR D rr
rr
D
D Drr rr
D
D Drr rr
tt
, ,
00
0 0and ,
∂ ( )∂
TR D rr
rr
D ,
∂ ( )∂
>TR D rr
rr
D ,.0
∂ ( )∂
=TR D rr
rr
D ,0
∂ ( )∂
=TR D rr
rr
D ,,0
∂ ( )∂
≅∂ ( )
∂= >
TR D rr
rr
RR D rr
rrD
D , ,,0
×
15 Throughout this analysis, we assume that the response of excessreserves at economically bound banks to changes in the statutoryreserve-requirement ratio is zero (see Anderson and Rasche,1996b). Excess reserves at economically nonbound banks typicallyare positive and an inverse function of the statutory reserve-requirement ratio.

FEDERAL RESERVE BANK OF ST. LOUIS
JANUARY/FEBRUARY 2001 59
of required reserves, RR(Dt,rr0). For analysis of othercases, see Anderson and Rasche (1999).
An empirical criterion for measuring RAM inCase 4, for dates beginning November 1980, wasdeveloped by Anderson and Rasche (1996b) basedon statistical analysis of a large panel dataset. Thatanalysis suggested that a bank was economicallybound during a reserve maintenance period if thebank was legally bound and had more than $135million in net transaction deposits.
Empirical Analysis
Because the design, implementation, andoperation of sweep software is idiosyncratic, ouranalysis focuses on a longitudinal panel of 1231depository institutions between January 1991 andDecember 1999. A depository institution is includ-ed in the panel if, during at least one reserve-maintenance period, it was either economically orlegally bound.16 Our panel is a subset of a largerdataset containing more than 7500 depositoryinstitutions, which, in turn, is an updated versionof the dataset used in Anderson and Rasche(1996b). For some banks, data begin after January1991 because the bank opened for business at thatpoint, was created by the merger of existingbanks, or only then began reporting data to theFederal Reserve. For others, the data stop beforeDecember 1999 because the bank failed, mergedwith another bank, or was dropped from thereporting panel. For each such bank, we use theFederal Reserve’s bank structure database to tracepredecessors and successors. When a bank withdeposit-sweeping activity is acquired by anotherbank, we add the amount of activity at theacquired bank to the amount at the acquiringbank. In all cases, we focus special attention onthose institutions where deposit-sweeping soft-ware has reduced the level of transaction depositsto such an extent that the level of the depository’srequired reserves is less than the amount ofreserves (vault cash and deposits at the FederalReserve) that the bank requires for its ordinaryday-to-day business.
RAM 1991-93
We begin by re-examining RAM from January1991 through December 1993. Our previous meas-ure of RAM was based on the statistical models ofAnderson and Rasche (1996b). Those results sug-gested that economically bound banks (the onlyones included in that measure of RAM) were char-
acterized by two features: (i) a level of requiredreserves that exceeded their vault cash and (ii)having more than $135 million in net transactiondeposits. This framework allowed us to classifybanks into broad groups without tedious examina-tion of time-series data for individual banks.
In this analysis, we revise our measure for1991-93 for two reasons. First, because deposit-sweeping software allows banks to home-brewreserve requirements, our analysis for 1994-99must necessarily be based on the examination ofdata for individual banks. It is important to assesswhether this change in procedure—from usingaggregated data for groups of banks to usingindividual-bank data—has any effect on measuredRAM. The 1991-93 period provides an exper-imental control for this change in procedure.Second, we seek to reduce the number of occur-rences when a bank, as well as its deposits, movesfrom being included in RAM to being excluded. Itseems unlikely that a bank’s responsiveness topossible changes in a statutory reserve-requirement ratio fluctuates very much fromperiod to period. Absent changes in statutoryreserve requirements (or a merger), we assumethat a typical bank switches infrequently betweeneconomically nonbound and bound.
The most reliable indicator of a bank’seconomically bound or nonbound status is itsresponse to a change in statutory reserverequirements. An economically bound bank willreduce its holdings of reserves, following a reduc-tion in reserve requirements, by approximately thesame amount as the decrease in its requiredreserves. An economically nonbound bank willnot, although it might reduce its holdings by asmaller amount. Between January 1991 andDecember 1993, there were only two ways that thestatutory reserve-requirement ratio for a bankcould change:
• In April 1992, the Federal Reserve reduced thestatutory reserve-requirement ratio on transac-tion deposits above the low-reserve tranchefrom 12 percent to 10 percent. If a bankreduced its deposits at Federal Reserve Banks(relative to transaction deposits) following theApril 1992 reduction in reserve requirementsand did not begin or increase the size of aclearing-balance contract, we classified the
16 A bank is said to be legally bound if the amount of its requiredreserves exceeds the amount of vault cash that is legally permittedto apply to satisfy its reserve requirement.

bank as economically bound from January1991 to December 1993. If the bank began orincreased the amount of a clearing balancecontract, we classified the bank aseconomically nonbound from the date of thatincrease through the end of December 1993.An increase in the bank’s clearing balance con-tract at the time of the reduction indicated thatpayments activity, not statutory reserverequirements, had been determining the levelof reserves held by the bank.
• The second change affected only banks thatacquired another bank. Federal Reserve regula-tions permit an acquiring bank to “amortize”over eight quarters the reserve exemptionamount and low-reserve tranche of theacquired bank.17 For an acquirer with transac-tion deposits greater than the low-reservetranche, the amortization reduces theacquirer’s required reserves. If an acquirer didnot reduce its holdings of reserves so as tomatch the reduced required reserves, we clas-sified the bank as nonbound beginning in thatmaintenance period.Finally, we also classified a bank as
economically nonbound in a reserve-maintenanceperiod if it is legally nonbound (that is, if itseligible vault cash exceeds its required reserves).Because some banks alternate between legallybound and nonbound, we modify this presump-tion by judgmentally smoothing changes in status.
Figure 2 compares two measures of RAM for1991-93. One is based on our 1996 method, andthe other on the method outlined above. The twomeasures, for all practical purposes, are the same.
RAM 1994-99Deposit-sweeping activity by banks substan-
tially complicates measuring RAM for 1994-99. Tocope, we follow a three-step procedure. First, weidentify the dates (reserve-maintenance periods)affected by new or expanded deposit-sweepingactivity and estimate the amounts of transactiondeposits relabeled as MMDA. Second, we classifyeach bank, for each reserve-maintenance periodbetween January 1994 and December 1999, aseconomically bound or nonbound. This procedureis similar to our revised measure for RAM during1991-93 and relies heavily on the observedresponse of the bank to changes in reserve-requirement ratios and the effects of implement-ing its deposit-sweeping software. Finally, we cal-culate RAM based on the framework of Cases 1, 2,3, and 4 introduced above.
Sweep Dates and AmountsOur first task is to identify the dates on which
banks either began or changed their deposit-sweeping activity. Although the date of the firstsuch deposit-sweep program is known (January1994), banks are not required to notify the FederalReserve when a program is implemented, expand-ed, or discontinued; nor are they required toreport the amount of deposits affected.18 To identi-fy those dates when deposit-sweeping activityeither began or was expanded, we visually ana-lyzed time-series data for each bank. The variablesexamined were changes in the levels of transac-tion and savings deposits, changes in the size of aclearing-balance contract, and the ratios of vaultcash and deposits at Federal Reserve Banks totransaction deposits.19 For a typical bank, the data
60 JANUARY/FEBRUARY 2001
R E V I E W
Bill
ion
s o
f Do
llars
RAM, 1991-93
1991 1992 1993-1.6
0.0
1.6
3.2
4.8
6.4
8.0
9.6
11.2
RAM, 1996 Method
RAM, 2000 Method
Figure 2
17 Under Federal Reserve Regulation D, when a bank acquires anoth-er, the required reserves of the survivor are reduced by a trancheloss adjustment. The initial value of the adjustment equals the dif-ference, during the reserve maintenance period immediately pre-ceding the merger, between the required reserves of the survivorbank (computed as if the merger had been completed) and therequired reserves of the acquired bank(s). The reduction is phasedout over eight quarters: During the first quarter, the survivor’srequired reserves are reduced by seven eigths of the adjustment,during the next quarter by three quarters of the adjustment, etc.
18 The staff of the Board of Governors maintains a database of sweepdates and amounts at individual banks, gleaned from deposit-reportdata and interviews with staff of individual banks. This databasewas not available for our research.
19 We also experimented with statistical methods, including vectorautoregressions containing transactions and savings deposits. Theidentification error rates from these methods, in our opinion, wereunacceptably high.

signature of deposit-sweeping activity consists oftwo simultaneous changes:
• The level of transaction deposits decreases andthe level of savings deposits increases, duringthe same reserve-maintenance period and byapproximately the same dollar amount, whilethe bank’s level of total deposits is approx-imately unchanged. It is important to conditionthe analysis on the level of total depositsbecause, in some cases, mergers of banks withdifferent mixtures of deposits otherwise createfalse signals.
• The ratio of vault cash to reported transactiondeposits (that is, transaction deposits notreclassified as MMDAs) increases sharply. Thismost likely occurs because the amount of vaultcash held by a bank depends on its customers’perceived amount of transaction deposits, notthe amount of reservable transaction depositsreported by the bank to the Federal Reserve.
For each so-identified maintenance period, ourestimate of the amount of deposits affected is thesmaller of the increase in savings deposits and (theabsolute value of) the decrease in transaction
deposits. For some identified periods, however,transaction deposits increased, savings depositsdecreased, and the ratio of vault cash totransaction deposits fell. We interpret thesechanges to indicate that deposit sweeping was dis-continued or reduced in amount. The amount ofthe change in deposit-sweeping activity iscalculated as the negative of the abovecalculations, but is capped at the maximumamount that we estimate the bank previously hadbeen sweeping.
ResultsOverall, we observed deposit-sweeping activity
at 680 of the 1231 banks in our panel dataset.20
Due to mergers, acquisitions, and liquidations, as of
1994 1995 1996 1997 1998 19990.5
0.6
0.7
0.8
0.9
1.0
St. Louis Sweeps / BOG Sweeps
1994 1995 1996 1997 1998 19990
50
100
150
200
250
300
350
400
St. Louis, Sample of 1231 Banks
BOG, All Banks
A. Sweeps of Transaction Deposits into MMDAs
Bill
ion
s o
f Do
llars
B. Ratio of St. Louis to Board of Governors (BOG) Staff Sweeps Estimates
FEDERAL RESERVE BANK OF ST. LOUIS
JANUARY/FEBRUARY 2001 61
Figure 3
20 For 671 banks, we have identified specific reserve-maintenanceperiods in which we believe deposit-sweeping activity began or wasexpanded. For 9 banks, deposit-sweeping activity is inferredbecause they acquired other banks with deposit-sweeping activity.Among the 671 banks, there were 425 acquisitions of banks by oth-ers between January 1994 and December 1999. (This numberincludes acquired banks that later were acquired by others amongthe 671.) Bank mergers and acquisitions are handled by assumingthat the acquirer continues to sweep the same amount of depositsas was being swept by the acquired bank.
62 JANUARY/FEBRUARY 2001
R E V I E W
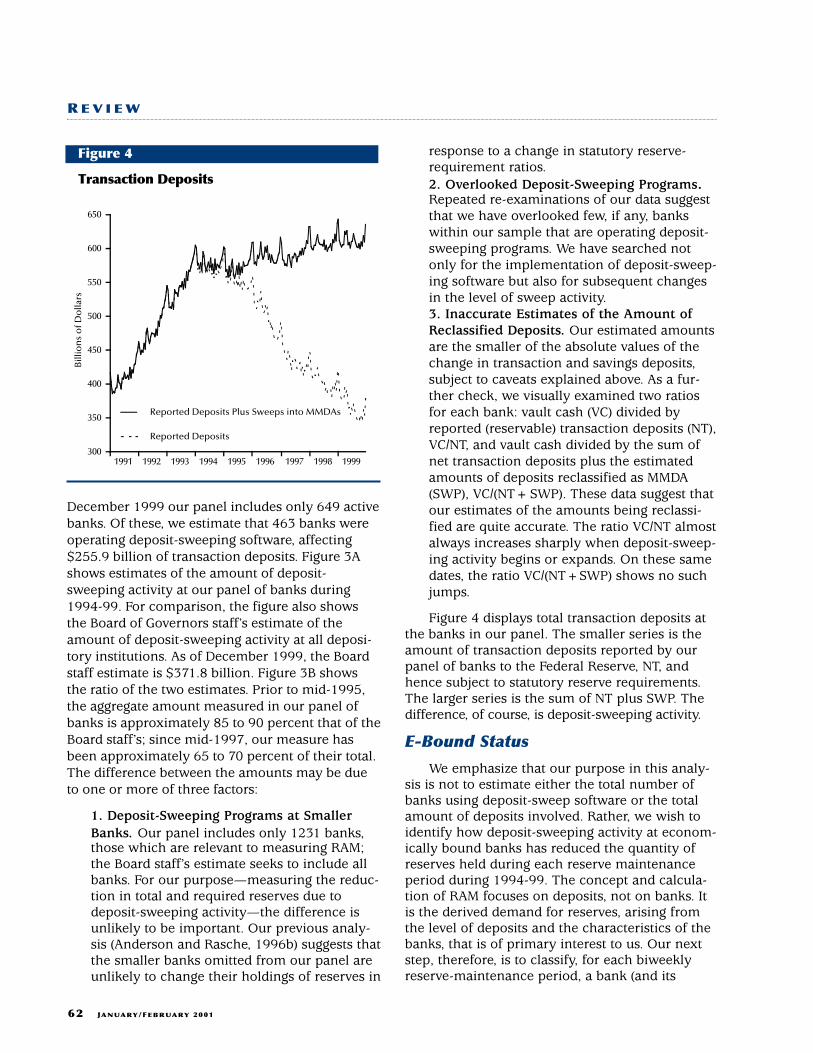
December 1999 our panel includes only 649 activebanks. Of these, we estimate that 463 banks wereoperating deposit-sweeping software, affecting$255.9 billion of transaction deposits. Figure 3Ashows estimates of the amount of deposit-sweeping activity at our panel of banks during1994-99. For comparison, the figure also showsthe Board of Governors staff’s estimate of theamount of deposit-sweeping activity at all deposi-tory institutions. As of December 1999, the Boardstaff estimate is $371.8 billion. Figure 3B showsthe ratio of the two estimates. Prior to mid-1995,the aggregate amount measured in our panel ofbanks is approximately 85 to 90 percent that of theBoard staff’s; since mid-1997, our measure hasbeen approximately 65 to 70 percent of their total.The difference between the amounts may be dueto one or more of three factors:
1. Deposit-Sweeping Programs at SmallerBanks. Our panel includes only 1231 banks,those which are relevant to measuring RAM;the Board staff’s estimate seeks to include allbanks. For our purpose—measuring the reduc-tion in total and required reserves due todeposit-sweeping activity—the difference isunlikely to be important. Our previous analy-sis (Anderson and Rasche, 1996b) suggests thatthe smaller banks omitted from our panel areunlikely to change their holdings of reserves in
response to a change in statutory reserve-requirement ratios.2. Overlooked Deposit-Sweeping Programs.Repeated re-examinations of our data suggestthat we have overlooked few, if any, bankswithin our sample that are operating deposit-sweeping programs. We have searched notonly for the implementation of deposit-sweep-ing software but also for subsequent changesin the level of sweep activity.3. Inaccurate Estimates of the Amount ofReclassified Deposits. Our estimated amountsare the smaller of the absolute values of thechange in transaction and savings deposits,subject to caveats explained above. As a fur-ther check, we visually examined two ratiosfor each bank: vault cash (VC) divided byreported (reservable) transaction deposits (NT),VC/NT, and vault cash divided by the sum ofnet transaction deposits plus the estimatedamounts of deposits reclassified as MMDA(SWP), VC/(NT+SWP). These data suggest thatour estimates of the amounts being reclassi-fied are quite accurate. The ratio VC/NT almostalways increases sharply when deposit-sweep-ing activity begins or expands. On these samedates, the ratio VC/(NT+SWP) shows no suchjumps.
Figure 4 displays total transaction deposits atthe banks in our panel. The smaller series is theamount of transaction deposits reported by ourpanel of banks to the Federal Reserve, NT, andhence subject to statutory reserve requirements.The larger series is the sum of NT plus SWP. Thedifference, of course, is deposit-sweeping activity.
E-Bound Status
We emphasize that our purpose in this analy-sis is not to estimate either the total number ofbanks using deposit-sweep software or the totalamount of deposits involved. Rather, we wish toidentify how deposit-sweeping activity at econom-ically bound banks has reduced the quantity ofreserves held during each reserve maintenanceperiod during 1994-99. The concept and calcula-tion of RAM focuses on deposits, not on banks. Itis the derived demand for reserves, arising fromthe level of deposits and the characteristics of thebanks, that is of primary interest to us. Our nextstep, therefore, is to classify, for each biweeklyreserve-maintenance period, a bank (and its
Transaction Deposits
1991 1992 1993 1994 1995 1996 1997 1998 1999300
350
400
450
500
550
600
650
Reported Deposits Plus Sweeps into MMDAs
Reported Deposits
Bill
ion
s o
f Do
llars
Figure 4

FEDERAL RESERVE BANK OF ST. LOUIS
JANUARY/FEBRUARY 2001 63
deposits) as either economically nonbound oreconomically bound. To do so, we visually ana-lyzed time-series data, for individual banks, on aperiod-by-period basis from 1994-99. Similar to1991-93, we believe that banks should not (and donot) alternate often between bound and non-bound status.
The most important indicator of the bank’sbound and nonbound status is the change in itsholdings of reserves, relative to the change in itsrequired reserves.
• If a bank acquired another bank, did it makeuse of the reduction in required reserves asprovided for by Federal Reserve regulations? Ifnot, then the acquiring bank is revealed to beeconomically nonbound during those periods.In most cases, such a bank is classified as eco-nomically nonbound in all subsequentperiods.
• If a bank implemented a sweep program, didits ratio of reserves to reported transactiondeposits (after subtracting required reservesagainst the low-reserve tranche from thenumerator and the deposit-amount of the low-reserve tranche from the denominator)increase above 10 percent? If so, the bank isrevealed to be economically nonboundbecause it holds more reserves than isnecessary to satisfy statutory reserve require-ments. In most cases, such a bank is classifiedas economically nonbound for all subsequentperiods.
• If a bank implemented a sweep program, did itincrease its required clearing-balancecontract? If so, the bank is revealed to be eco-nomically nonbound because it voluntarilyincreased its reserves above the amount neces-sary to satisfy legal requirements. In mostcases, the bank is classified as economicallynonbound for all subsequent periods unless itreduces or eliminates its clearing balance con-tract.
• If a bank implemented a sweep program, didits required reserves decrease below its vaultcash (that is, did the bank become legally non-bound)? If so, the bank is revealed to beeconomically nonbound because the amountof vault cash necessary for its ordinarybusiness exceeds its required reserves. Thebank is classified as economically nonboundfor all periods in which it is legally nonbound.
In general, if a bank is reclassified to economi-cally nonbound from economically bound, itremains nonbound through to the end of thesample. We observed, however, that a few bankssubsequently sharply reduced their excessreserves and began responding to changes inreserve requirements. Although the reasons forsuch changes in behavior are unknown to us, wereclassified these banks as economically boundbeginning at the date of the change.
Banks that neither implemented a deposit-sweep program nor acquired another bank during1994-99 experienced no change in their statutoryrequired-reserve ratio. Hence, we use different cri-teria to classify these as economically bound ornonbound. For most banks, their status as ofDecember 1993 is extended forward throughDecember 1999. A bank’s status might be changedif it significantly changes its level of excessreserves, enters into a clearing-balance contract,or experiences a major change in its level or mix-ture of deposits. In our sample, there are 551 suchbanks; 88 of these had their classification changedbetween January 1994 and December 1999.
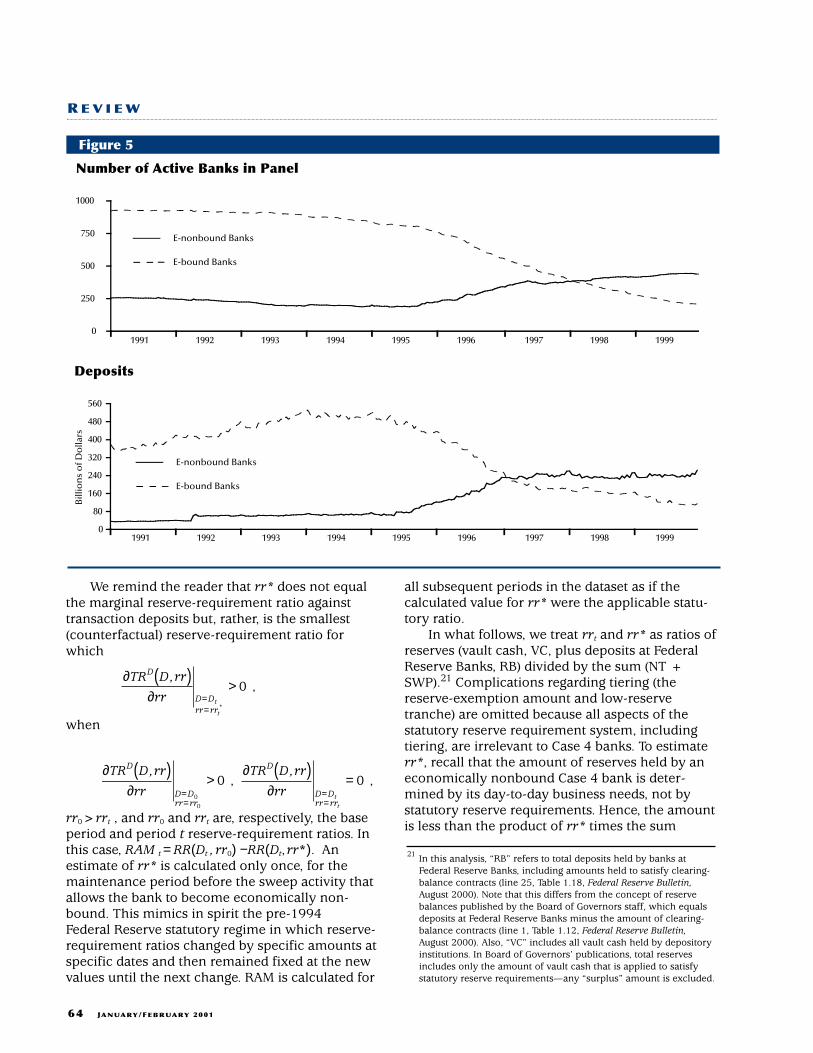
Figure 5 shows the numbers of banks in ourpanel classified as economically bound andnonbound and the amounts of their reservabletransaction deposits. Changes in the numbers ofbanks should not be over-interpreted because ofthe large number of bank mergers andacquisitions since 1995. Regardless, the figureshows clearly that a major shift has occurred sincedeposit-sweeping computer software began tospread rapidly through the U.S. banking industry.In late 1994, for example, deposits in our panel’seconomically bound banks totaled approximately$500 billion, whereas deposits in economicallynonbound banks were less than $100 billion. Bylate 1999, reported transaction deposits (subject tostatutory reserve requirements) in economicallybound banks totaled less than $100 billion, andreported transaction deposits in economicallynonbound banks were approximately $250 billion.
Estimate rr*
The above analysis allows us to classify eachbank in our dataset, during each reserve-maintenance period, as being in Case 1, 2, 3, or 4.For those banks in Cases 1 and 2, RAM=0. Forthose in Case 3, calculation of RAM is straightfor-ward, as shown above. For banks in Case 4, itremains to estimate rr*.
64 JANUARY/FEBRUARY 2001
R E V I E W
We remind the reader that rr* does not equalthe marginal reserve-requirement ratio againsttransaction deposits but, rather, is the smallest(counterfactual) reserve-requirement ratio forwhich
when
rr0>rrt , and rr0 and rrt are, respectively, the baseperiod and period t reserve-requirement ratios. Inthis case, RAM t = RR(Dt , rr0) −RR(Dt,rr*). Anestimate of rr* is calculated only once, for themaintenance period before the sweep activity thatallows the bank to become economically non-bound. This mimics in spirit the pre-1994 Federal Reserve statutory regime in which reserve-requirement ratios changed by specific amounts atspecific dates and then remained fixed at the newvalues until the next change. RAM is calculated for
all subsequent periods in the dataset as if thecalculated value for rr* were the applicable statu-tory ratio.
In what follows, we treat rrt and rr* as ratios ofreserves (vault cash, VC, plus deposits at FederalReserve Banks, RB) divided by the sum (NT +SWP).21 Complications regarding tiering (thereserve-exemption amount and low-reservetranche) are omitted because all aspects of thestatutory reserve requirement system, includingtiering, are irrelevant to Case 4 banks. To estimaterr*, recall that the amount of reserves held by aneconomically nonbound Case 4 bank is deter-mined by its day-to-day business needs, not bystatutory reserve requirements. Hence, the amountis less than the product of rr* times the sum
∂ ( )∂
>∂ ( )
∂=
==
==
TR D rr
rr
TR D rr
rr
D
D Drr rr
D
D Drr rr
tt
, ,
00
0 0, ,
∂ ( )∂
>==
TR D rr
rr
D
D Drr rr
t
t
,
*
0 ,
21 In this analysis, “RB” refers to total deposits held by banks atFederal Reserve Banks, including amounts held to satisfy clearing-balance contracts (line 25, Table 1.18, Federal Reserve Bulletin,August 2000). Note that this differs from the concept of reservebalances published by the Board of Governors staff, which equalsdeposits at Federal Reserve Banks minus the amount of clearing-balance contracts (line 1, Table 1.12, Federal Reserve Bulletin,August 2000). Also, “VC” includes all vault cash held by depositoryinstitutions. In Board of Governors’ publications, total reservesincludes only the amount of vault cash that is applied to satisfystatutory reserve requirements—any “surplus” amount is excluded.
1991 1992 1993 1994 1995 1996 1997 1998 19990
80
160
240
320
400
480
560
E-nonbound Banks
E-bound Banks
Deposits
1991 1992 1993 1994 1995 1996 1997 1998 19990
250
500
750
1000
E-nonbound Banks
E-bound Banks
Number of Active Banks in Panel
Bill
ion
s o
f Do
llars
Figure 5

FEDERAL RESERVE BANK OF ST. LOUIS
JANUARY/FEBRUARY 2001 65
(NT + SWP):
Note that the opposite is true for an economicallybound Case 3 bank where, at the margin, theamount of reserves is determined by the statutoryreserve-requirement ratio rrt: 22
These two relationships are not sufficient, how-ever, to provide an estimator for rr*. To do so, weimpose one additional condition: We assume thatthe amount of a bank’s vault cash is determined byits day-to-day retail business needs and is notaffected by statutory reserve requirements ordeposit-sweeping activity. Conditional on this
assumption, we examine separately the ratiosVC/(NT + SWP) and RB/(NT + SWP). From theseratios, we infer upper and lower boundaries for rr*and, thereafter, a value for rr* itself.
We begin by comparing the reserves held bybanks before and after they implemented deposit-sweeping software. Selection of the appropriate“before” and “after” reserve-maintenance periodsrequires some judgement. Our data suggest thatat many banks deposit-sweeping activity wasphased-in during a number of reserve-
VC RB rr NT SWPt+ ≥ × +( )( ) .
VC RB rr NT SWP+ < × +( )( *) .
0.0
0.1
0.2
0.3
0.4
0.5
-4 -2 0 2 4Normalized Value
After Sweep
Normal (0,1)
0.0
0.1
0.2
0.3
0.4
0.5
0.000 0.025 0.050 0.075 0.100 0.125 0.150 Value
After Sweep
Before Sweep
0.0
0.1
0.2
0.3
0.4
0.5
-4 -2 0 2 4Normalized Value
Before Sweep
Normal (0,1)
Panel B
0.000
0.025
0.050
0.075
0.100
0.125
0.150
0.000 0.025 0.050 0.075 0.100 0.125 0.150After Sweep
Panel D
Panel CPanel A
Den
sity
Den
sity
Den
sity
Bef
ore
Sw
eep
Vault Cash/(Reported Net Transaction Deposits + Sweeps)Banks E-bound Before to E-nonbound After Sweep, Obs=458
Figure 6
22 This analysis ignores the carryover provision of Federal Reserveaccounting. That provision allows a bank’s required reserves duringa reserve maintenance period to exceed the sum of its eligible vaultcash and deposits at Federal Reserve Banks so long as the deficien-cy is offset (made up) during the following period.
maintenance periods. Also, we observed somebanks increasing their sweep activity at later dates,often a year or more after the initial implemen-tation.23 For each deposit-sweeping bank, wevisually searched the data to select the first(“before”) reserve-maintenance and last (“after”)reserve-maintenance periods affected by changesin the intensity of deposit-sweeping activity—thatis, the period before sweep activity began and theperiod during which the bank’s transaction andsavings deposits later settled down to new levels ortrends. We inferred from the ratios VC/(NT + SWP)and RB/(NT + SWP) whether the economicallybound status of the bank was changed byimplementation of deposit-sweeping software. Weclassified 458 banks that were economically bound
before implementing deposit-sweeping software aseconomically nonbound after (Case 4); 155 banksthat were economically bound before as remainingbound after (Case 3); 53 banks that were economi-cally nonbound before as remaining nonboundafter; and 2 banks that were economicallynonbound before as bound after.24
Data for the 458 banks that changed status
66 JANUARY/FEBRUARY 2001
R E V I E W
0.00
0.08
0.16
0.24
0.32
0.40
0.48
0.56
0.64
-4 -2 0 2 40.00
0.08
0.16
0.24
0.32
0.40
0.48
0.56
0.64
0.000 0.025 0.050 0.075 0.100 0.125 0.150
0.00
0.08
0.16
0.24
0.32
0.40
0.48
0.56
0.64
-4 -2 0 2 40.000
0.025
0.050
0.075
0.100
0.125
0.150
0.000 0.025 0.050 0.075 0.100 0.125 0.150
Deposits at the Federal Reserve/(Reported Net Transaction Deposits + Sweeps)Banks E-bound Before to E-nonbound After Sweep, Obs=458
Normalized Value Value
Normalized Value
Panel B
After Sweep
Panel CPanel A
Den
sity
Den
sity
Den
sity
Bef
ore
Sw
eep
Panel D
After Sweep
Normal (0,1)After Sweep
Before Sweep
Before Sweep
Normal (0,1)
Figure 7
23 The ongoing tuning and expansion of deposit-sweep programs isdiscussed in O’Sullivan (1998).
24 Note that these banks differ with respect to the number of periodsbetween the “before” and “after” dates, and the first and last peri-ods in which data were reported. Twelve of the 680 identifiedsweeping banks are omitted (the figures in the text sum to 668)because data were not available for periods before and after theimplementation of their sweep programs.
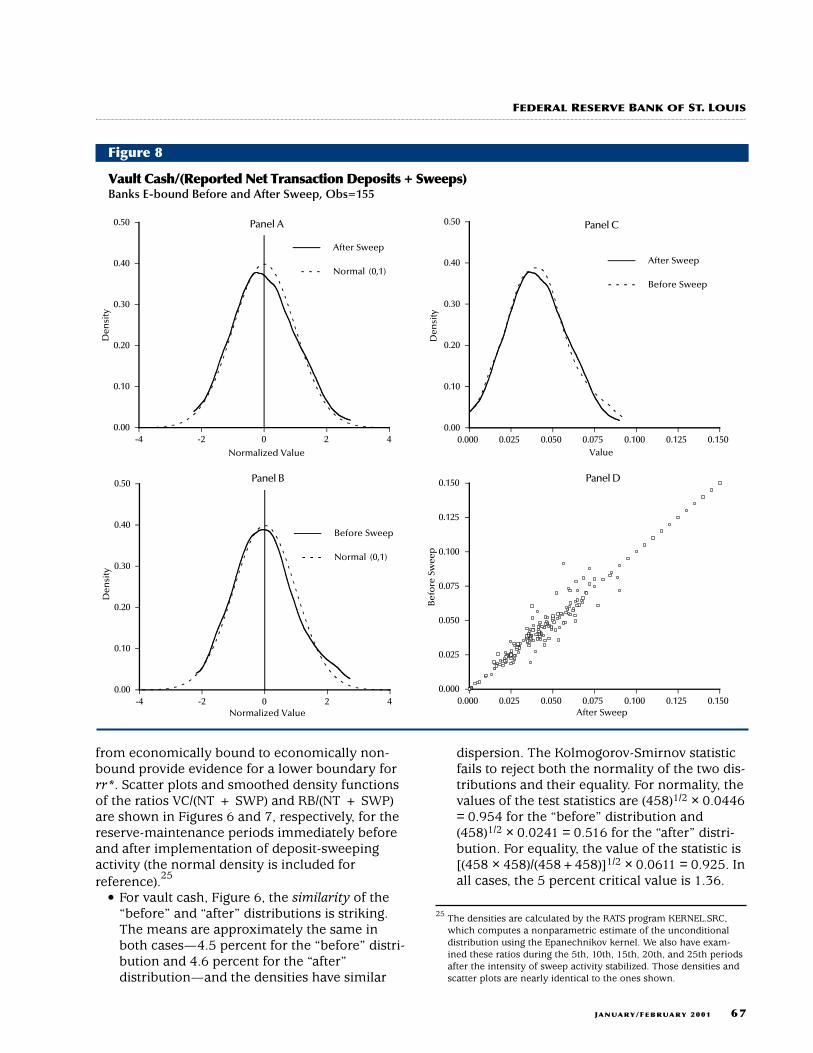
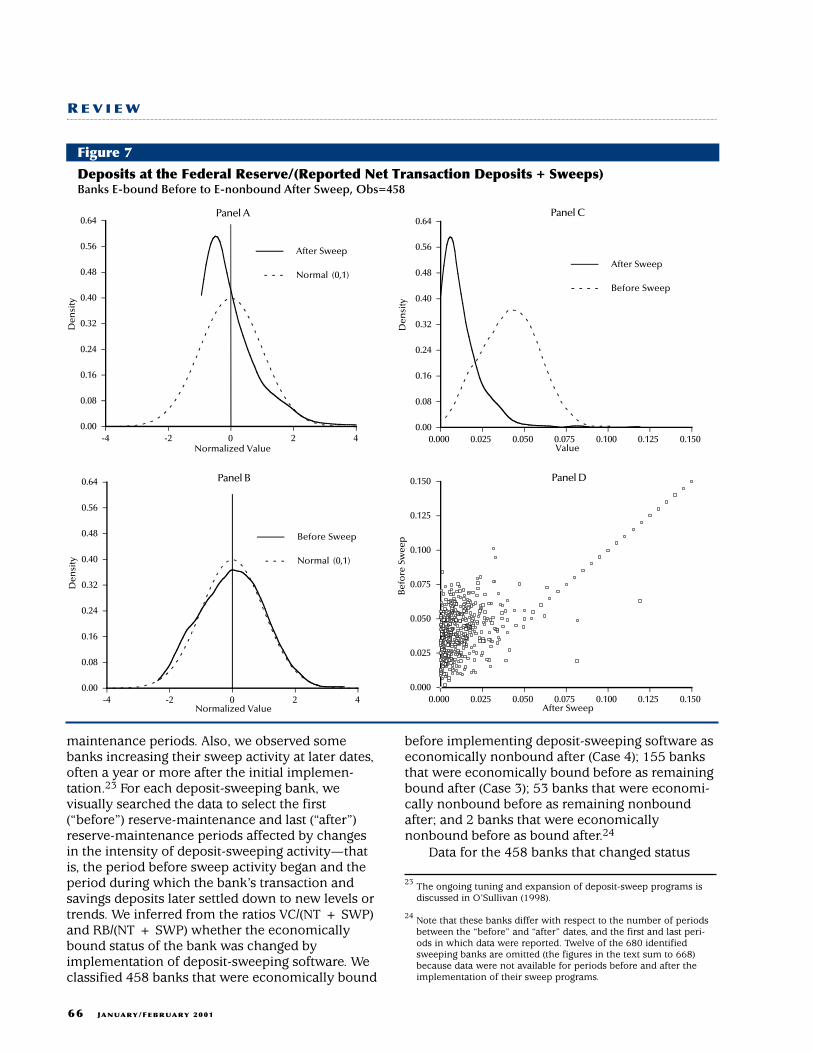
from economically bound to economically non-bound provide evidence for a lower boundary forrr*. Scatter plots and smoothed density functionsof the ratios VC/(NT + SWP) and RB/(NT + SWP)are shown in Figures 6 and 7, respectively, for thereserve-maintenance periods immediately beforeand after implementation of deposit-sweepingactivity (the normal density is included forreference).25
• For vault cash, Figure 6, the similarity of the“before” and “after” distributions is striking.The means are approximately the same inboth cases—4.5 percent for the “before” distri-bution and 4.6 percent for the “after”distribution—and the densities have similar
dispersion. The Kolmogorov-Smirnov statisticfails to reject both the normality of the two dis-tributions and their equality. For normality, thevalues of the test statistics are (458)1/2 × 0.0446= 0.954 for the “before” distribution and(458)1/2 × 0.0241 = 0.516 for the “after” distri-bution. For equality, the value of the statistic is[(458 × 458)/(458+458)]1/2 × 0.0611 = 0.925. Inall cases, the 5 percent critical value is 1.36.
FEDERAL RESERVE BANK OF ST. LOUIS
JANUARY/FEBRUARY 2001 67
0.00
0.10
0.20
0.30
0.40
0.50
-4 -2 0 2 40.00
0.10
0.20
0.30
0.40
0.50
0.000 0.025 0.050 0.075 0.100 0.125 0.150
0.00
0.10
0.20
0.30
0.40
0.50
-4 -2 0 2 40.000
0.025
0.050
0.075
0.100
0.125
0.150
0.000 0.025 0.050 0.075 0.100 0.125 0.150
After Sweep
Normal (0,1)After Sweep
Before Sweep
Before Sweep
Normal (0,1)
Normalized Value Value
Normalized Value
Panel B
After Sweep
Panel CPanel A
Den
sity
Den
sity
Den
sity
Bef
ore
Sw
eep
Panel D
Vault Cash/(Reported Net Transaction Deposits + Sweeps)Banks E-bound Before and After Sweep, Obs=155
Figure 8
25 The densities are calculated by the RATS program KERNEL.SRC,which computes a nonparametric estimate of the unconditionaldistribution using the Epanechnikov kernel. We also have exam-ined these ratios during the 5th, 10th, 15th, 20th, and 25th periodsafter the intensity of sweep activity stabilized. Those densities andscatter plots are nearly identical to the ones shown.

68 JANUARY/FEBRUARY 2001
R E V I E W
The Jarque-Bera test also suggests normality.Values of the statistic for the “before” and“after” distributions, respectively, are 5.54 (p-value 0.0628) and 4.89 (p-value 0.0866).
• For deposits at Federal Reserve Banks, Figure7, the difference between the “before” and“after” distributions is striking.26 The meansdiffer: 4.2 percent for the “before” distributionand 1.2 percent for the “after” distribution (themedian for the “after” distribution is 0.8percent). The Kolmogorov-Smirnov statisticfails to reject normality of the “before”distribution, with a value of (458)1/2 × 0.031=0.663. Normality of the “after” distribution iseasily rejected, with a value of (458)1/2 × 0.173
= 3.70. (In all cases, the 5 percent criticalvalue is 1.36.) The Jarque-Bera statistic yieldssimilar results for normality, with values of2.03 (p-value 0.363) and 5059.7 (p-value of 0).
These distributions suggest that the mean of rr*likely is not less than 5.8 (= 4.6 + 1.2) percent.
Data for the 155 economically bound banksthat remained bound after implementing sweepprograms provide evidence in favor of an upperboundary for rr*. Scatter plots and smoothed den-sity functions of the ratios VC/(NT + SWP) and
0.00
0.08
0.16
0.24
0.32
0.40
0.48
0.56
0.64
-4 -2 0 2 40.00
0.08
0.16
0.24
0.32
0.40
0.48
0.56
0.64
0.000 0.025 0.050 0.075 0.100 0.125 0.150
0.00
0.08
0.16
0.24
0.32
0.40
0.48
0.56
0.64
-4 -2 0 2 40.000
0.025
0.050
0.075
0.100
0.125
0.150
0.000 0.025 0.050 0.075 0.100 0.125 0.150
Normalized Value
After Sweep
Normal (0,1)
Value
After Sweep
Before Sweep
Normalized Value
Before Sweep
Normal (0,1)
Panel B
After Sweep
Panel D
Panel CPanel A
Den
sity
Den
sity
Den
sity
Bef
ore
Sw
eep
Deposits at the Federal Reserve/(Reported Net Transaction Deposits + Sweeps)Banks E-bound Before and After Sweep, Obs=155
Figure 9
26Note that the inclusion of deposits at the Federal Reserve used tosatisfy required clearing balance contracts gives the distributionsthick right tails.

FEDERAL RESERVE BANK OF ST. LOUIS
JANUARY/FEBRUARY 2001 69
RB/(NT + SWP) are shown in Figures 8 and 9,respectively, for the reserve-maintenance periodsimmediately before and after implementation ofdeposit-sweeping activity.
• For the vault-cash ratio, the means of the“before” and “after” distributions are equal, at4.1 percent. Normality of the distributions is notrejected, with Kolmogorov-Smirnov teststatistics equal to 1.03 and 0.980, respectively,and equality is not rejected with a value of0.040. (In all cases, the 5 percent critical value is1.36.) The Jarque-Bera statistic also does notreject normality, with values of 2.04 (p-value0.361) and 0.719 (p-value 0.698).
• For deposits at Federal Reserve Banks, themeans of the “before” and “after” distributionsare 5.0 and 2.1 percent, respectively. Normalityof the “before” distribution is not rejected with astatistic of 1.11, but normality of the “after” dis-tribution is rejected with a value of 1.74.Normality of both distributions is rejected by theJarque-Bera statistic, however, with values of1752.4 (p-value 0) and 4187.2 (p-value 0).
These data suggest that the mean of rr* likely isnot more than 6.2 (= 4.1+ 2.1) percent.
These statistics suggest that, in the absence of
statutory reserve requirements, a typical bank inour sample likely would maintain approximately a1 percent ratio of deposits at Federal ReserveBanks (including deposits used to satisfy clearing-balance contracts) to total net transaction deposits(including any amounts reclassified as MMDA).Hence, we conclude that a reasonable estimator forrr* for a Case 4 bank is the sum of 1 percent plusthe bank’s vault-cash ratio during the reserve-maintenance period immediately before the period(or sequence of periods) during which the bankbegan (or changed the intensity of) its deposit-sweeping activity. Applying this rule to our sampleof 680 identified sweeping banks, we estimate rr*for 454 banks where, during the reserve-mainten-ance period immediately prior to beginning sweepactivity, (i) the bank is classified as economicallybound and (ii) the level of required reserves is lessthan the sum of vault cash plus 1 percent of trans-action deposits plus sweeps:
where RR denotes the bank’s required reserves, VCits vault cash, and SWP the estimated amountswept. The mean of these rr* estimates is 5.79
RRNT SWP
VCNT SWP+
<+
+τ τ
0 01. ,
1991 1992 1993 1994 1995 1996 1997 1998 1999-5
0
5
10
15
20
25
30
35
1. RAM, 2000 Method
2. 2000 Method, No rr* Adjustment
3. RAM, 1996 Method
4. 1996 Method, No rr* Adjustment
RAM, 1991-99
1.
2.
3.
4.
Bill
ion
s o
f Do
llars
Figure 10

percent, exactly the lower boundary discussedabove, with a standard deviation of 1.96.
As of December 1999, after numerous mer-gers, our panel contained 649 active banks. Ofthese, 269 were classified as Case 4, 199 as Case 3,60 as Case 2, and 121 as Case 1. The mean of theestimated rr* for the 269 banks classified as Case4 is 5.62 percent.
RAMTo illustrate the importance of our adjustments
for deposit-sweeping activity and for banks fallingbelow frictional levels of reserve demand (the rr*correction, in Case 4), four alternative RAM seriesare shown in Figure 10.27
• Our preferred measure, which includes theeffects of deposit-sweeping activity and rr*, islabeled “1. RAM, 2000 method.” This measuresuggests that bank reserves in December 1999were lower by $25.8 billion, relative to whatmight be expected in the absence of deposit-sweeping software.
• The series labeled “2.” is the same calculationas “1.” except that it ignores the rr* adjust-ment. That is, it assumes for each bank thatthe amount of reserves freed by deposit-sweeping activity equals the reduction inrequired reserves. Our analysis shows, howev-er, that deposit-sweeping software often is ableto reduce a bank’s required reserves to a level
below the reserves necessary for the bank’sday-to-day business. This measure suggeststhat banks’ required reserves in December1999 were lower by $34.1 billion, relative towhat might be expected in the absence ofsuch software.
• The series labeled “3.” is RAM according to themethod of Anderson and Rasche (1996b). Thisseries ignores deposit-sweeping activity.
• The series labeled “4.” is the same as “3.”except that it adjusts for rr*-type behavior.The very small difference between series “3.”and “4.” ($1.9 billion in December 1999)emphasizes that a correct RAM adjustmentmust include the effects of interaction betweenreductions in reserve requirements and banksrealizing that their required reserves have fall-en below the amount necessary for day-to-daybusiness.
SUMMARY AND CONCLUSIONS
This analysis has examined the extraordinary
70 JANUARY/FEBRUARY 2001
R E V I E W
27 These estimates differ from reserve measures published by theFederal Reserve Board. In that data, total and required reserves(adjusted for changes in reserve requirements and seasonal varia-tion) both decreased from January 1994 to December 1999 by $19billion. Note that the Board’s measure does not include “surplus”vault cash, that is, vault cash held by depositories but not used tosatisfy reserve requirements. The Board’s measures also include anadjustment for the effect of changes in the low-reserve tranchebetween January 1995 and December 1999 of approximately $700million (during this period, decreases in the size of the trancheincreased required reserves).
During the 1990s, Federal Reservepublications have documented the spread ofdeposit-sweeping software through the U.S.banking industry. The July 1994 Humphrey-Hawkins Act monetary-policy report introduceddeposit-sweep programs in a single sentence. TheJuly 1995 report noted that approximately $12billion of deposits were involved in sweep activityand, as a result, that deposits at Federal ReserveBanks had decreased by about $1.2 billion. It alsoraised concern regarding an increase in federalfunds rate volatility if deposits decreased further.The July 1996 report included a special appendixon the operation of sweep programs. TheFebruary 1997 report noted that the aggregateamount of deposits affected by sweep programs
had increased to approximately $116 billion,compared with $45 billion in 1995. The July1997 report noted the introduction of deposit-sweep programs for household demand depositsand noted that some banks were increasing thesize of their clearing balance contracts whensweep programs reduced their required reserves.Subsequent reports have repeated these themes,along with an appeal that the Congress allow theFederal Reserve to pay interest on reservebalances (Meyer, 1998, 2000). In addition,deposit-sweep activity also has been highlightedin the annual reports of the Open Market Desk(see, for example, Hilton 1999, and Bennett andHilton, 1997) and in the Federal Reserve Bulletin(Edwards, 1997).
FEDERAL RESERVE PUBLICATIONS AND DEPOSIT-SWEEP PROGRAMS
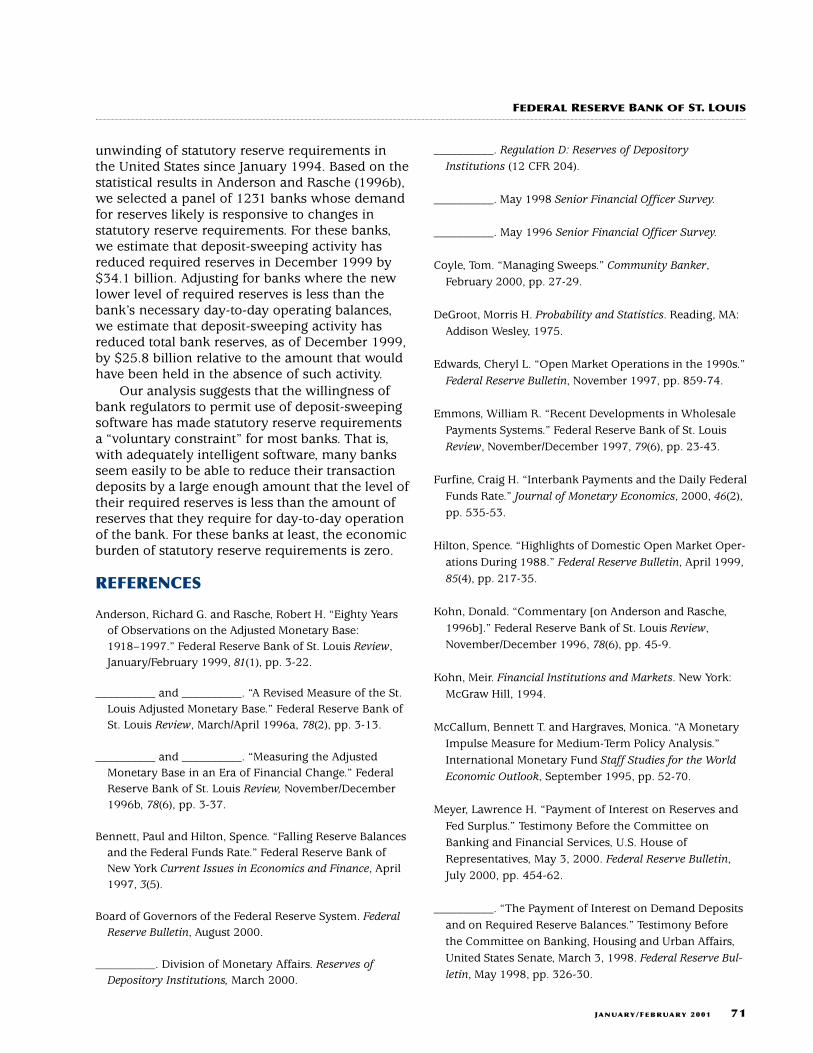
FEDERAL RESERVE BANK OF ST. LOUIS
JANUARY/FEBRUARY 2001 71
unwinding of statutory reserve requirements inthe United States since January 1994. Based on thestatistical results in Anderson and Rasche (1996b),we selected a panel of 1231 banks whose demandfor reserves likely is responsive to changes instatutory reserve requirements. For these banks,we estimate that deposit-sweeping activity hasreduced required reserves in December 1999 by$34.1 billion. Adjusting for banks where the newlower level of required reserves is less than thebank’s necessary day-to-day operating balances,we estimate that deposit-sweeping activity hasreduced total bank reserves, as of December 1999,by $25.8 billion relative to the amount that wouldhave been held in the absence of such activity.
Our analysis suggests that the willingness ofbank regulators to permit use of deposit-sweepingsoftware has made statutory reserve requirementsa “voluntary constraint” for most banks. That is,with adequately intelligent software, many banksseem easily to be able to reduce their transactiondeposits by a large enough amount that the level oftheir required reserves is less than the amount ofreserves that they require for day-to-day operationof the bank. For these banks at least, the economicburden of statutory reserve requirements is zero.
REFERENCES
Anderson, Richard G. and Rasche, Robert H. “Eighty Yearsof Observations on the Adjusted Monetary Base:1918–1997.” Federal Reserve Bank of St. Louis Review,January/February 1999, 81(1), pp. 3-22.
__________ and __________. “A Revised Measure of the St.Louis Adjusted Monetary Base.” Federal Reserve Bank ofSt. Louis Review, March/April 1996a, 78(2), pp. 3-13.
__________ and __________. “Measuring the AdjustedMonetary Base in an Era of Financial Change.” FederalReserve Bank of St. Louis Review, November/December1996b, 78(6), pp. 3-37.
Bennett, Paul and Hilton, Spence. “Falling Reserve Balancesand the Federal Funds Rate.” Federal Reserve Bank ofNew York Current Issues in Economics and Finance, April1997, 3(5).
Board of Governors of the Federal Reserve System. FederalReserve Bulletin, August 2000.
__________. Division of Monetary Affairs. Reserves ofDepository Institutions, March 2000.
__________. Regulation D: Reserves of DepositoryInstitutions (12 CFR 204).
__________. May 1998 Senior Financial Officer Survey.
__________. May 1996 Senior Financial Officer Survey.
Coyle, Tom. “Managing Sweeps.” Community Banker,February 2000, pp. 27-29.
DeGroot, Morris H. Probability and Statistics. Reading, MA:Addison Wesley, 1975.
Edwards, Cheryl L. “Open Market Operations in the 1990s.”Federal Reserve Bulletin, November 1997, pp. 859-74.
Emmons, William R. “Recent Developments in WholesalePayments Systems.” Federal Reserve Bank of St. LouisReview, November/December 1997, 79(6), pp. 23-43.
Furfine, Craig H. “Interbank Payments and the Daily FederalFunds Rate.” Journal of Monetary Economics, 2000, 46(2),pp. 535-53.
Hilton, Spence. “Highlights of Domestic Open Market Oper-ations During 1988.” Federal Reserve Bulletin, April 1999,85(4), pp. 217-35.
Kohn, Donald. “Commentary [on Anderson and Rasche,1996b].” Federal Reserve Bank of St. Louis Review,November/December 1996, 78(6), pp. 45-9.
Kohn, Meir. Financial Institutions and Markets. New York:McGraw Hill, 1994.
McCallum, Bennett T. and Hargraves, Monica. “A MonetaryImpulse Measure for Medium-Term Policy Analysis.”International Monetary Fund Staff Studies for the WorldEconomic Outlook, September 1995, pp. 52-70.
Meyer, Lawrence H. “Payment of Interest on Reserves andFed Surplus.” Testimony Before the Committee onBanking and Financial Services, U.S. House ofRepresentatives, May 3, 2000. Federal Reserve Bulletin,July 2000, pp. 454-62.
__________. “The Payment of Interest on Demand Depositsand on Required Reserve Balances.” Testimony Beforethe Committee on Banking, Housing and Urban Affairs,United States Senate, March 3, 1998. Federal Reserve Bul-letin, May 1998, pp. 326-30.
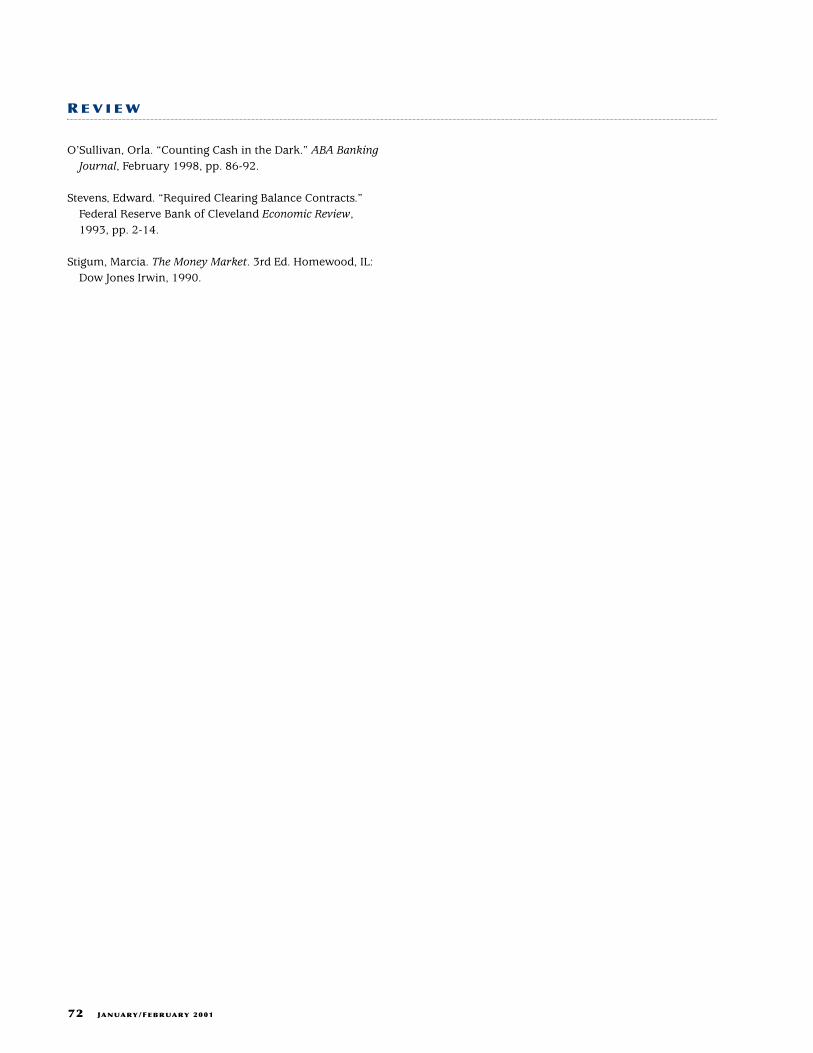
72 JANUARY/FEBRUARY 2001
R E V I E W
O’Sullivan, Orla. “Counting Cash in the Dark.” ABA BankingJournal, February 1998, pp. 86-92.
Stevens, Edward. “Required Clearing Balance Contracts.”Federal Reserve Bank of Cleveland Economic Review,1993, pp. 2-14.
Stigum, Marcia. The Money Market. 3rd Ed. Homewood, IL:Dow Jones Irwin, 1990.