Retail Shelf Analytics Through Image Processing and Deep ...
79
Retail Shelf Analytics Through Image Processing and Deep Learning Master Thesis Department of Information Engineering University of Padua, Italy Student Alvise De Biasio Supervisor Carlo Fantozzi February 2019 A.Y. 2018/2019
Transcript of Retail Shelf Analytics Through Image Processing and Deep ...
Retail Shelf Analytics Through ImageProcessing and Deep Learning
Master Thesis
Department of Information EngineeringUniversity of Padua, Italy
StudentAlvise De Biasio
SupervisorCarlo Fantozzi
February 2019
A.Y. 2018/2019


Dedicated to my girlfriend, my family and my friends.Best ideas shine with the passion of their creators.


Preface
This work is for people who love reasoning and who like to discover how things work.When we dive deep into the deep learning world we are immediately fascinated by the continuous
research of the first principle, the triggering factor, the cutting-edge technique and above all theelegant rules that govern complex systems. We could find these themes that appear technical andsophisticated in many fields of our daily life. In particular, AI and deep learning are still thesymbol of a revolution that accelerates the innovative development of different architectures suchas industrial automation systems, medical devices, chatbots and enterprise management systems.The present thesis aims to promote an innovative approach based on modern deep learning and
image processing techniques for retail shelf analytics within an actual business context. To achievethis goal, the research focused on recent developments in computer vision while maintaining abusiness-oriented approach. In particular, some of the themes that will be discussed in the followingchapters that could be considered the most valuable and the most expensive part of this work arerespectively the construction of a dataset able to adapt to the Customer’s business domain, thestudy of the algorithmic component and the business integration project between the Customerand Supplier IT systems. The project involved the full-stack software development of a SAP-based B2B product to analyze structured and unstructured data and provide business intelligenceservices for retail products analytics. This project comes from the collaboration of three differentparties that have contributed to its success. The research and business world met respectively inthe robes of the University of Padua and the Supplier and Customer companies. During the entireproject, interaction between the parties was constant in order to integrate the R&D work withthe Customer’s processes. Particular attention was given to the development of a deep learningarchitecture based on TensorFlow able to work at scale. The results from the deep learning softwareare based on a system integration project between IT Customer and Supplier systems. The softwaredeveloped in this project has been purchased by the Customer and will be further developed in thefollowing months. Future work will be based on recent scientific advancements in deep learningand will focus on the development of the Customer’s business growth strategy. To achieve thisgoal, we will study the integration of new value-drivers into the current system that will allowthe Customer to have a competitive advantage in the market. First of all, KPIs will be definedto evaluate the sales performance of individual products on different customers target groups.Based on the defined KPIs and the sales forecasts of the different products, a recommendationsystem will be studied to suggest promotions and discounts to the final customers. More in-depthconsiderations on these themes will be described in the conclusion chapter.
iii

Acknowledgements
A special thanks to all those who will venture in the reading of this thesis, I hope this product canthrill you and provide new key insights.First of all, I would like to thank Prof. C. Fantozzi for giving me the opportunity to develop this
work. Deep expert of the subject and patient reference throughout the duration of the journey,he gave me valuable suggestions stimulating a natural attitude to curiosity. I really appreciatedyour help and your support in the various phases of this project. Thank you very much for theconstructive comparisons, the key insights and the ideas provided to this work, as well as for theavailability shown throughout this thesis period. It was a pleasure and an honor for me to havehad the opportunity to collaborate in this work.Afterwards, I am pleased to thank Dr. A. Bergamo, Dr. S. Citron, Dr. P. Trevisan and the
entire Estilos srl team. An engaging international valuable team that has been able to coordinatethe interactions with the Customer and has provided methods and techniques in an enterprisescenario. In particular, a grateful thanks goes to Dr. A. Montagna with whom I have been ableto get in touch on the most interesting themes in the business logic world.I would also like to thank all the people with whom I have been able to interact during this
period, for the encouragement and for contributing positively to this work. Especially i would liketo thank my girlfriend Anna for being the most patient, kind and loving person with whom I havebeen in contact during these years. A heartfelt thanks for being with me in happy and difficulttimes. I thank you for your honesty, your courage and the love you put into everything you do.I am also delighted to thank Prof. S. Ghidoni for being a support and a friend in my master’sdegree studies. During my bachelor’s degree he disrupted my previous vision and changed my way,getting me closer to the computer industry. Finally, my biggest thanks go to my family, especiallyto my mother, my friends and all the people dearest to me. Thank you for supporting me everyday: part of this work is also yours.
iv

Contents
Abstract vii
1 Introduction 11.1 Related Work . . . . . . . . . . . . . . . . . . . . . . . . . . . . . . . . . . . . . . . 2
2 A Deep Learning Survey 72.1 Deep Learning Development Scenarios . . . . . . . . . . . . . . . . . . . . . . . . . 72.2 Neural Networks Basics . . . . . . . . . . . . . . . . . . . . . . . . . . . . . . . . . 8
2.2.1 Structure of Feedforward Neural Networks . . . . . . . . . . . . . . . . . . . 92.3 Convolutional Neural Networks . . . . . . . . . . . . . . . . . . . . . . . . . . . . . 11
2.3.1 Traditional CNN Architectures . . . . . . . . . . . . . . . . . . . . . . . . . 122.3.2 The CNN Evolution . . . . . . . . . . . . . . . . . . . . . . . . . . . . . . . 142.3.3 Transfer Learning . . . . . . . . . . . . . . . . . . . . . . . . . . . . . . . . 17
2.4 Hardware, Frameworks and Datasets . . . . . . . . . . . . . . . . . . . . . . . . . . 192.4.1 Hardware: from CPU to GPU/TPU . . . . . . . . . . . . . . . . . . . . . . 192.4.2 Frameworks and Dataset Zoos . . . . . . . . . . . . . . . . . . . . . . . . . 202.4.3 International Challenges and Datasets . . . . . . . . . . . . . . . . . . . . . 23
3 Object Detection: State of the Art 253.1 An Object Detection Review . . . . . . . . . . . . . . . . . . . . . . . . . . . . . . 253.2 Region-Based Detectors . . . . . . . . . . . . . . . . . . . . . . . . . . . . . . . . . 27
3.2.1 R-CNN . . . . . . . . . . . . . . . . . . . . . . . . . . . . . . . . . . . . . . 273.2.2 SPP-net . . . . . . . . . . . . . . . . . . . . . . . . . . . . . . . . . . . . . . 293.2.3 Fast R-CNN . . . . . . . . . . . . . . . . . . . . . . . . . . . . . . . . . . . 293.2.4 Faster R-CNN . . . . . . . . . . . . . . . . . . . . . . . . . . . . . . . . . . 303.2.5 Mask R-CNN . . . . . . . . . . . . . . . . . . . . . . . . . . . . . . . . . . . 32
3.3 Single-Stage Detectors . . . . . . . . . . . . . . . . . . . . . . . . . . . . . . . . . . 333.3.1 YOLO . . . . . . . . . . . . . . . . . . . . . . . . . . . . . . . . . . . . . . . 343.3.2 SSD . . . . . . . . . . . . . . . . . . . . . . . . . . . . . . . . . . . . . . . . 35
4 Design 374.1 Requirements Analysis . . . . . . . . . . . . . . . . . . . . . . . . . . . . . . . . . . 37
4.1.1 Objectives and Description of the System . . . . . . . . . . . . . . . . . . . 374.1.2 Functional Requirements . . . . . . . . . . . . . . . . . . . . . . . . . . . . 384.1.3 Non-Functional Requirements . . . . . . . . . . . . . . . . . . . . . . . . . . 394.1.4 Constraints . . . . . . . . . . . . . . . . . . . . . . . . . . . . . . . . . . . . 39
4.2 Data Logic . . . . . . . . . . . . . . . . . . . . . . . . . . . . . . . . . . . . . . . . 394.2.1 Entity-Relationship Schema . . . . . . . . . . . . . . . . . . . . . . . . . . . 39
4.3 Presentation Logic . . . . . . . . . . . . . . . . . . . . . . . . . . . . . . . . . . . . 404.3.1 Mock-Ups . . . . . . . . . . . . . . . . . . . . . . . . . . . . . . . . . . . . . 40
4.4 Business Logic . . . . . . . . . . . . . . . . . . . . . . . . . . . . . . . . . . . . . . 414.4.1 System Overview . . . . . . . . . . . . . . . . . . . . . . . . . . . . . . . . . 42
4.5 Dataset Creation . . . . . . . . . . . . . . . . . . . . . . . . . . . . . . . . . . . . . 44
v

5 Experimental Results 475.1 Experimental Evaluation . . . . . . . . . . . . . . . . . . . . . . . . . . . . . . . . . 47
5.1.1 Experimental Evaluation in Object Detection . . . . . . . . . . . . . . . . . 485.2 Experimental Tests . . . . . . . . . . . . . . . . . . . . . . . . . . . . . . . . . . . . 49
5.2.1 Training Configuration and Image Resolution . . . . . . . . . . . . . . . . . 505.2.2 Dataset Studies . . . . . . . . . . . . . . . . . . . . . . . . . . . . . . . . . . 515.2.3 Fine-Tuning . . . . . . . . . . . . . . . . . . . . . . . . . . . . . . . . . . . . 535.2.4 Final Configuration . . . . . . . . . . . . . . . . . . . . . . . . . . . . . . . 56
5.3 Business Intelligence and Visualization . . . . . . . . . . . . . . . . . . . . . . . . . 575.3.1 Basic KPIs . . . . . . . . . . . . . . . . . . . . . . . . . . . . . . . . . . . . 585.3.2 Advanced KPIs . . . . . . . . . . . . . . . . . . . . . . . . . . . . . . . . . . 58
6 Conclusion 636.1 Future Work . . . . . . . . . . . . . . . . . . . . . . . . . . . . . . . . . . . . . . . 64
References 65

Abstract
Recently, deep learning has emerged as a disruptive growth potential for the development of newbusiness domains. Modern AI techniques are used in the most innovative projects of the largestmarket players in all the industrial fields. In particular, automated retail analytics applicationsare still integrated in enterprise solutions targeted towards a specific business audience.This work represents a concrete case where the business world meets the research world. In
particular, the project has been developed in collaboration with the University of Padua, for aCustomer company that plays a role of strategic importance in the international pharmaceuticalretail market. The themes that will frequently occur within this work and which they have con-stituted the most valuable and the most expensive part are respectively the creation of a datasetable to adapt to the Customer’s business domain and the business integration project between theCustomer and Supplier IT systems. As for the dataset, a lot of time has been invested to plan everysingle feature in detail, respecting the requirements defined in the design phase. In particular, inaddition to the manual pixel-wise labeling of all the images, design activities have been followedregarding the selection of the tools for the construction of the same as well as planned experi-mental tests to investigate the effects of automatic labeling on the final deep learning predictions.Again with regard to the latter topic, a deep learning pipeline has been studied to integrate thetraditional inference process in order to obtain accurate predictions without the need to own largeamounts of data for the training of the neural networks stack.Regarding the business integration project, the work has been sold through a Supplier company
with a SAP based B2B product. The design involved the full stack development of an innovativesoftware solution for the automated analysis of shelf products in store images based on deep learningand image processing techniques. According to the specifications, the system model aims to analyzestructured and unstructured data to provide key insights on the Customer brand impact over finalsales points. Development proceeded with the design of a convolutional networks stack to detectand segment different product instances in store shelf pictures. The proposed approach evaluateddifferent alternatives that make a more or less intensive use of structured manual annotations.The prototyping exploited an experimental evaluation system for performance benchmarking tofine-tune the network architecture according to the studied business domain. In this context,several tests investigated the final system trade-off between precision and recall to reach the bestresults for the Customer activities. The current system is able to provide processing at scale byintegrating directly into a standardized data flow between the Customer and Supplier systems. Theresults can be consulted directly in the cloud through a SAP-based presentation logic layer. Theautomated reporting provides a series of KPIs that assess the effectiveness of the Customer brandon the market. This business intelligence information could be used directly by the Customer togain competitive advantage over its business competitors. Future work will see a more targetedintegration within the Customer processes to evaluate the correlation of the stands with the finalsales performance of the individual products. A recommendation application will be studied tosuggest the optimal products exposure on store shelves based on sales forecasts. Other value-driversconcerning the development of the Customer business which will be integrated directly into thecurrent system, will be presented in the conclusion chapter.
vii


Chapter 1
Introduction
In recent decades, technology has assumed an increasingly important role in daily life. The scalingof electronic components has made it possible to use hardware infrastructures that provide complexresults quickly and at affordable costs. New performing systems have been introduced on themarket, based on AI and deep learning for image processing, that have been able to draw from amature and multidisciplinary articulated environment such as computer vision.Being able to identify with a few words the main domains of AI and computer vision is com-
plicated because the fields of interest are many and in continuous expansion. In particular, theyrange from pure entertainment to industrial robotics and enterprise systems exploring issues insecurity, medicine, architecture, art and education. These themes are just some of the most pop-ular ones, but there are many hybrids born through a combination of the above. Moreover, whatsurprises every time is the fact that every innovation inevitably affects at least one other disci-pline. So it happens, for example, that research and development groups create such sophisticatedalgorithms to give new life to the world of retail or enterprise management systems. This could inturn renew the rules of video surveillance, or create new innovative techniques for medical imagesanalytics through an absolutely dynamic and unexpected process [69, 39]. This happens becauseeach technique is increasingly interconnected and innovation reverberates over adjacent businessareas. The benefits deriving from such advanced technologies are evident. The constancy, relia-bility and objectivity of the technological architectures facilitate human intervention in processesthat require multiple repetitive control operations. In particular, automated retail systems haverecently reached very high levels of accuracy and practicality, managing to manipulate a growingnumber of information [26, 69]. This continuous development has allowed to explore ever widerfields, mitigating the problems of scalability and technological efficiency from time to time.This thesis stands as a contact point between business and research. In particular, in the
following chapters a concrete case of implementation of a retail shelf analytics system will bediscussed (Chapters 4 and 5). The system has been sold to – and is currently used by – animportant player in the international retail pharmaceutical market, from now on referred to as theCustomer. The project is part of a context of innovative improvement of the Customer businessprocesses. The development has been followed in collaboration with the University of Padua by aconsulting company referred from now as the Supplier.The parts of this work that make up the most valuable and the most expensive component are
respectively the instance segmentation dataset creation to train the deep learning model based onMask R-CNN [30] at the base of the elaborations of the system model and the business integrationproject to supplement the IT Customer and Supplier systems. The design of the dataset (Sec-tion 4.5) has been one of the most precious investments of this work. In particular, an instancesegmentation dataset has been built targeted on Customer business processes that can be usedto train deep learning models for pixel-wise predictions of Customer and Competitors productson store shelves images. The activity has been necessary because as highlighted in Section 1.1there are currently no publicly released datasets able to obtain satisfactory performance on thebusiness domain considered. Along with the manual labeling activity for every single pixel of all
1

2 1.1. Related Work
the images of the dataset, other design activities have been followed regarding the developmentof experimental tests to assess the effects of automatic labeling tecniques on the final deep learn-ing predictions (Subsection 5.2.2). Regarding the latter topic, as described in Section 4.4, a deeplearning pipeline has also been studied to abstract the traditional inference chain in order to obtainaccurate brand-level predictions without the need to own large amounts of data for the training ofthe Mask R-CNN neural networks stack.As far as the business integration project (Section 4.4) is concerned, all the design phases of a full-
stack R&D solution that integrates the traditional Customer’s business processes have been takencare of. As described in Chapter 4, the data logic, the business logic and the presentation logichave been designed in detail in compliance with the SAP architecture agreed in the requirementsanalysis (Section 4.1). All the consulting activities with the various Customer departments havealso been followed. In compliance with the confidentiality constraints imposed by Customer andSupplier, some of the most important details have been obscured to maintain anonymity whererequired. However, as for the construction of the dataset, this activity has also been a very valuableinvestment for the success of this work.The designed system is able to process images of in store shelves products at scales and integrates
directly with the IT Customer and Supplier systems through a dedicated data flow. The work takesadvantage of the modern instance segmentation techniques [20, 30] that will be used to identifyand segment the different instances of shelf products exposed in pharmacies. These techniques willbe described in detail in Chapters 3 and 4 respectively and represent the core processing of thesystem model that aims to extract metrics and KPIs of strategic importance for the Customer. Asdescribed in Chapter 4, this approach has been preferred to the more common object detectionapproach by the Supplier in the requirements analysis phase. In particular, the Mask R-CNNalgorithm [30] has been chosen for the possibility of having pixel-wise predictions and consequentlyto calculate with greater precision the exposed surface for the various products in the pictures. Asa result of the algorithm elaborations, from the images a complete series of key insights is extractedthat bind to the Customer business processes to investigate the visibility of the Customer brand inretail stores (Section 5.3). The results can be consulted directly in the cloud within an automatedbusiness intelligence reporting in a SAP-based B2B product.The rest of the thesis is organized as follows. In the present chapter we illustrate the state of
the art of modern shelf product recognition systems (Section 1.1). The main techniques, and thedatasets available with an open license, are described. An Ad-Hoc dataset, built during the workfor this thesis and addressing the issues of available datasets, is presented. Then, Chapters 2 and 3are dedicated, respectively, to a short survey on deep learning and to the state of the art of modernobject detection algorithms. The former chapter is a self-consistent kernel for the understanding ofmodern architectures based on neural networks, and in particular on convolutional neural networks.The latter is a path that discusses the recent discoveries in the object detection field by presentingthe main strategies from an evolutionary point of view. Chapters 4 and 5 are dedicated to thedetailed description of the system model we developed, and to the main results achieved. Thevarious development phases are described in detail and particular care is taken in the descriptionof the deep learning algorithms used and in the integration of the latter with the IT Customerand Supplier systems. Finally, the main results and key insights from the experimental teststhat explore the optimal configuration of the network architecture stack as well as the businessintelligence and visual analytics results on the Customer processes will be presented.
1.1 Related Work
Retail is a very profitable business that develops many innovative themes in the 4.0 industry fieldwith specialized commercial products or automated retail infrastructures such as Amazon Go, apartially-automated grocery stores chain where customers can buy products without having to gothrough any kind of checkout station [26]. Amazon Go exploits advanced computer vision and deeplearning techniques combined with specific sensors to automate the purchase of in-store products.However, even if there are many commercial products, at present retail has not been studied
Chapter 1. Introduction 3
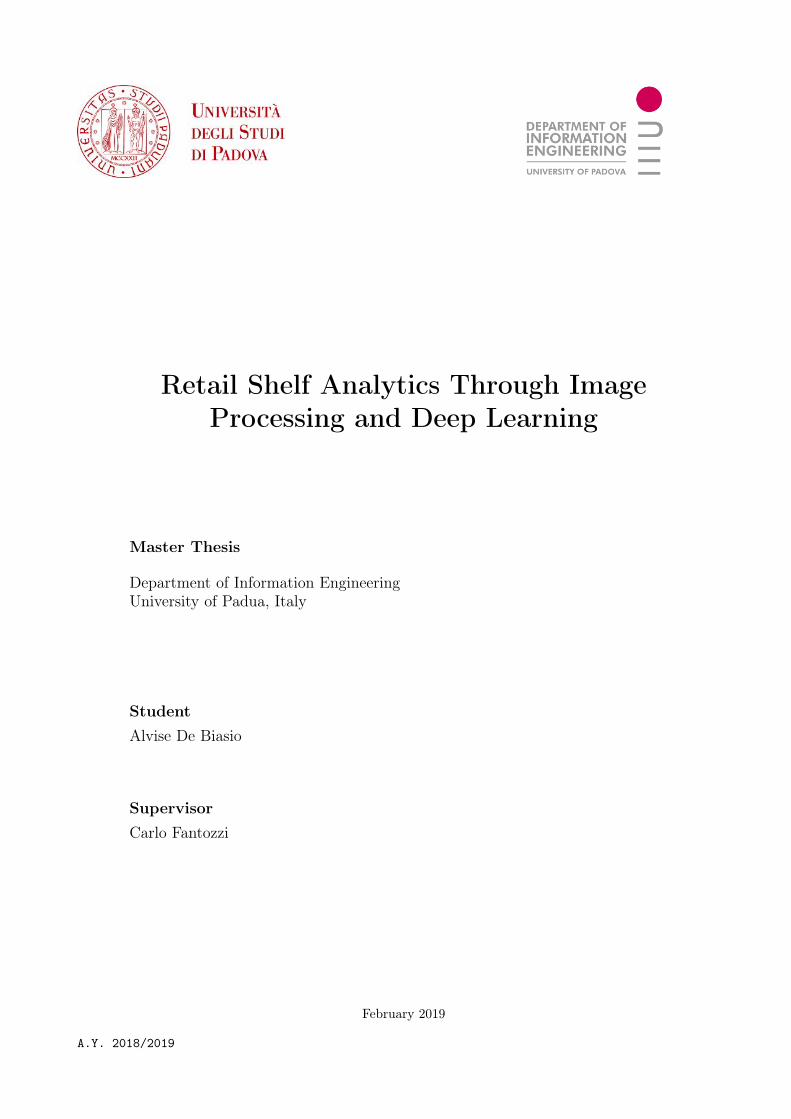
Figure 1.1: Image classification of in-storeproducts – Freiburg Groceries Dataset [38].
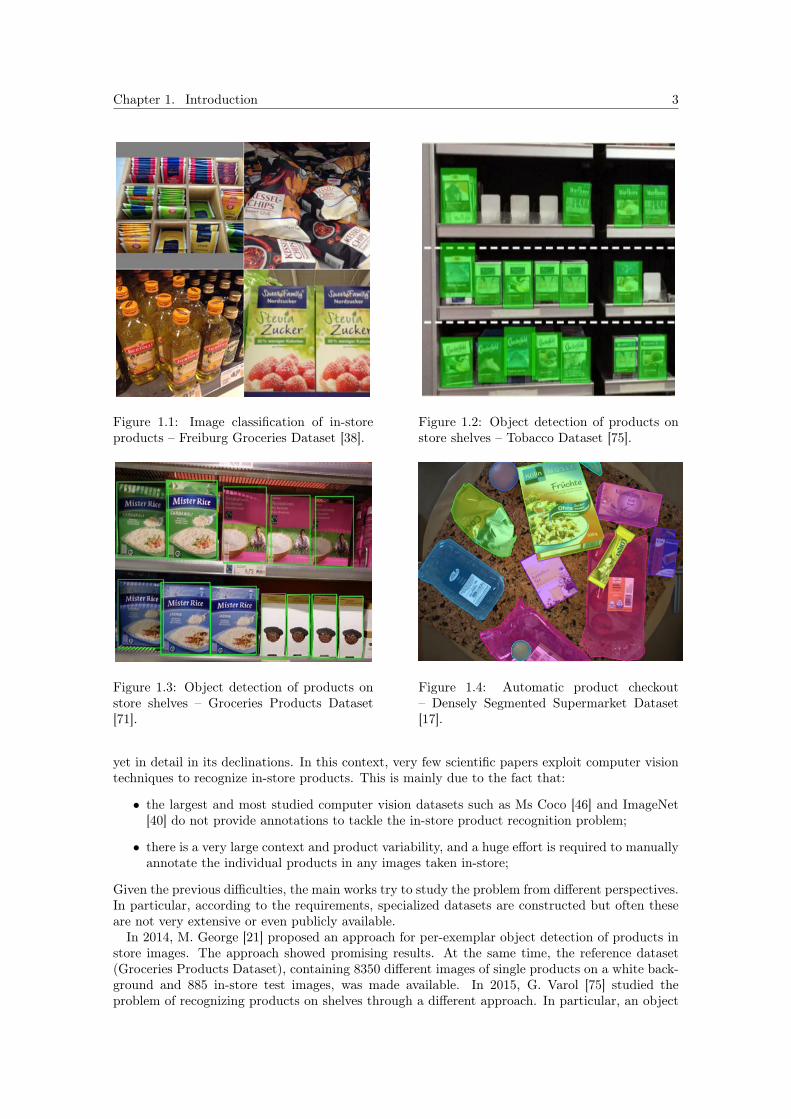
Figure 1.2: Object detection of products onstore shelves – Tobacco Dataset [75].
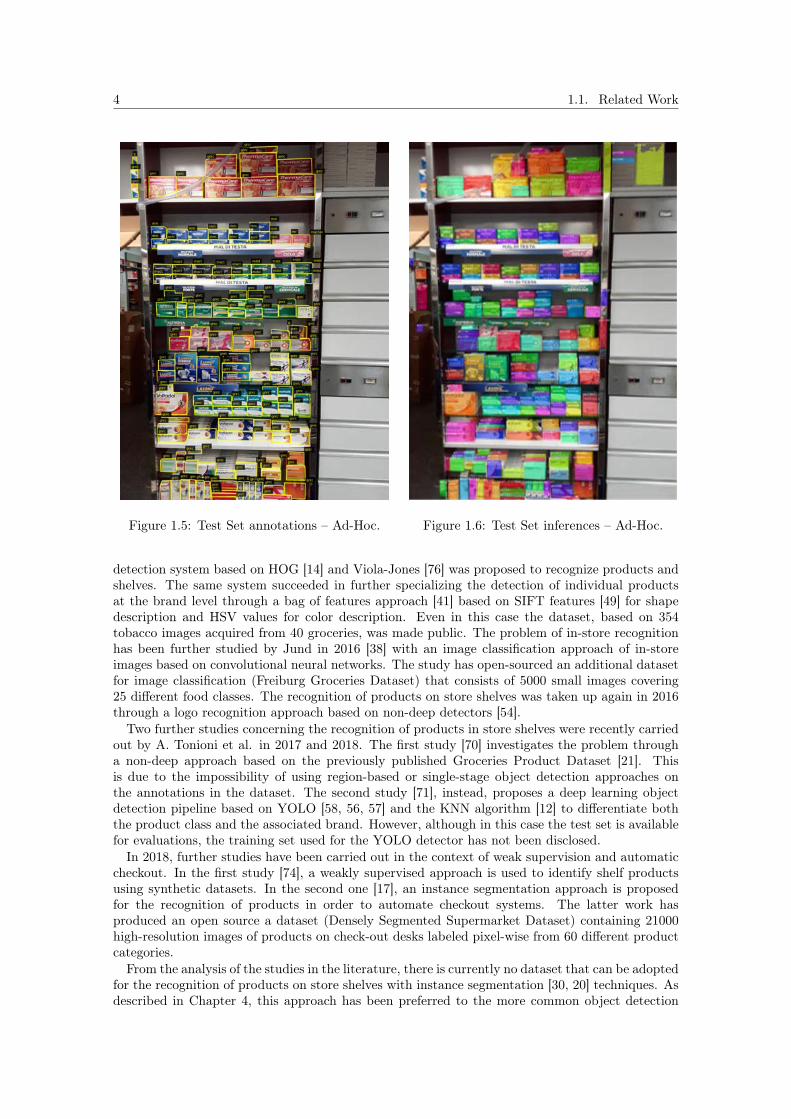
Figure 1.3: Object detection of products onstore shelves – Groceries Products Dataset[71].
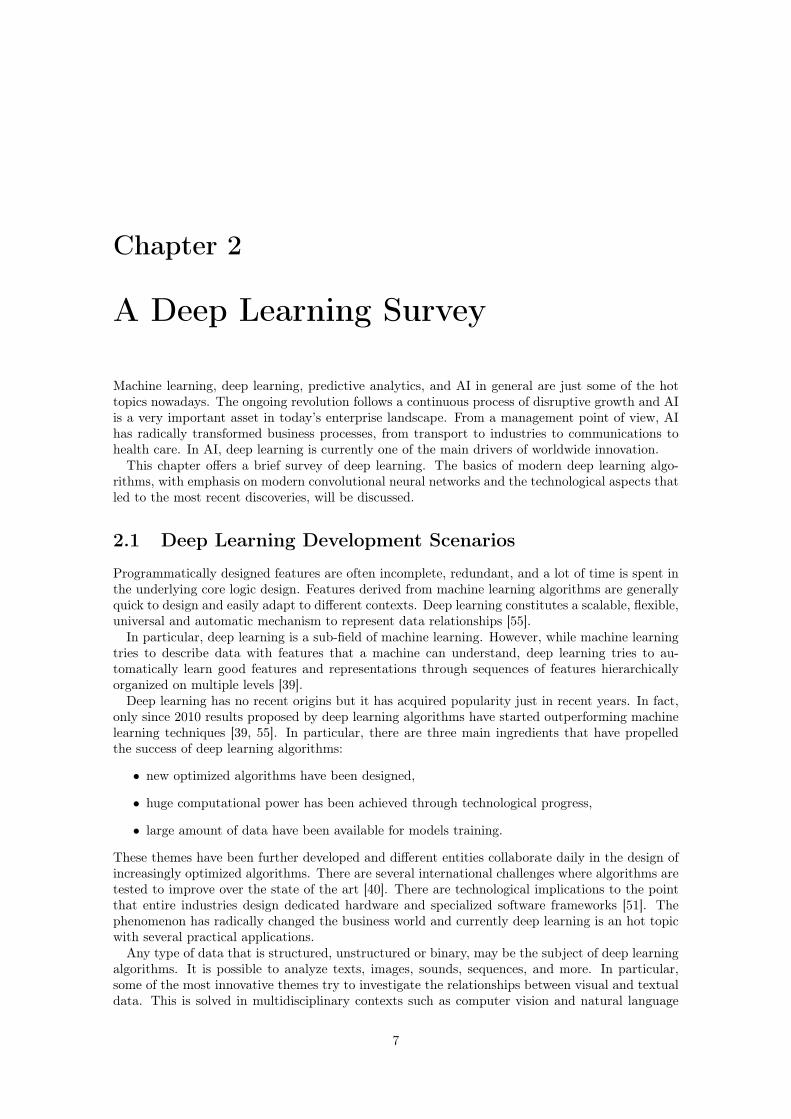
Figure 1.4: Automatic product checkout– Densely Segmented Supermarket Dataset[17].
yet in detail in its declinations. In this context, very few scientific papers exploit computer visiontechniques to recognize in-store products. This is mainly due to the fact that:
• the largest and most studied computer vision datasets such as Ms Coco [46] and ImageNet[40] do not provide annotations to tackle the in-store product recognition problem;
• there is a very large context and product variability, and a huge effort is required to manuallyannotate the individual products in any images taken in-store;
Given the previous difficulties, the main works try to study the problem from different perspectives.In particular, according to the requirements, specialized datasets are constructed but often theseare not very extensive or even publicly available.In 2014, M. George [21] proposed an approach for per-exemplar object detection of products in
store images. The approach showed promising results. At the same time, the reference dataset(Groceries Products Dataset), containing 8350 different images of single products on a white back-ground and 885 in-store test images, was made available. In 2015, G. Varol [75] studied theproblem of recognizing products on shelves through a different approach. In particular, an object
4 1.1. Related Work
Figure 1.5: Test Set annotations – Ad-Hoc. Figure 1.6: Test Set inferences – Ad-Hoc.
detection system based on HOG [14] and Viola-Jones [76] was proposed to recognize products andshelves. The same system succeeded in further specializing the detection of individual productsat the brand level through a bag of features approach [41] based on SIFT features [49] for shapedescription and HSV values for color description. Even in this case the dataset, based on 354tobacco images acquired from 40 groceries, was made public. The problem of in-store recognitionhas been further studied by Jund in 2016 [38] with an image classification approach of in-storeimages based on convolutional neural networks. The study has open-sourced an additional datasetfor image classification (Freiburg Groceries Dataset) that consists of 5000 small images covering25 different food classes. The recognition of products on store shelves was taken up again in 2016through a logo recognition approach based on non-deep detectors [54].Two further studies concerning the recognition of products in store shelves were recently carried
out by A. Tonioni et al. in 2017 and 2018. The first study [70] investigates the problem througha non-deep approach based on the previously published Groceries Product Dataset [21]. Thisis due to the impossibility of using region-based or single-stage object detection approaches onthe annotations in the dataset. The second study [71], instead, proposes a deep learning objectdetection pipeline based on YOLO [58, 56, 57] and the KNN algorithm [12] to differentiate boththe product class and the associated brand. However, although in this case the test set is availablefor evaluations, the training set used for the YOLO detector has not been disclosed.In 2018, further studies have been carried out in the context of weak supervision and automatic
checkout. In the first study [74], a weakly supervised approach is used to identify shelf productsusing synthetic datasets. In the second one [17], an instance segmentation approach is proposedfor the recognition of products in order to automate checkout systems. The latter work hasproduced an open source a dataset (Densely Segmented Supermarket Dataset) containing 21000high-resolution images of products on check-out desks labeled pixel-wise from 60 different productcategories.From the analysis of the studies in the literature, there is currently no dataset that can be adopted
for the recognition of products on store shelves with instance segmentation [30, 20] techniques. Asdescribed in Chapter 4, this approach has been preferred to the more common object detection

Chapter 1. Introduction 5
Name Description Size Class Tasks Format
Groceries Products Per-exemplar object detection 9K 8.3K Image classification,object detection
RGB
Tobacco Groceries Object detection on store shelves 354 10 Object detection RGBFreiburg Groceries Small images, various classes 5K 25 Image classification RGBD2S Automatic checkout 21K 60 Object detection, in-
stance segmentationRGB
Ad-Hoc Instance segmentation on storeshelves
410 8 Object detection, in-stance segmentation
RGB
Table 1.1: Main deep learning object detection open-source retail datasets [38, 75, 71, 17].
approach by the Supplier and the Customer in the requirements analysis phase (Section 4.1). Inparticular, the Mask R-CNN algorithm [30] has been chosen for the possibility to calculate withgreater precision the exposed surface for the various products in the pictures. This is due inparticular to the characteristics of the algorithm to make pixel-wise predictions for each objectidentified in the images (Subsection 3.2.5). The system model described below aims to addressthis survey dimension and implement an instance segmentation architecture of shelf products usingadvanced deep learning techniques based on the Mask R-CNN algorithm. Given the impossibilityof finding a suitable dataset, an ad-hoc one has been designed based on images provided by theCustomer (Section 4.5). The dataset extends the landscape of the possible applications of thealgorithms of object detection and instance segmentation and as discussed in Chapter 5, goodresults have been obtained in the inferences of all its classes. This consists of 410 segmented pixel-wise high-resolution images for a total of 8 categories. For model selection purposes this datasethas been further divided into a 300-image training set and a test set with 110 images. The datasethas proved to be robust to use in the business domain under investigation and is currently the mostimportant resource for training the network architecture stack at the base of the designed systemmodel. The importance and the key features that this dataset offer, as well as the main challengesit implies, will be reported in Chapters 4 and 5. In particular, while the first will give a designoverview, the second will present some experimental tests. With respect to the last two points,in addition to the manual labeling of every pixel of all the images many of the efforts were madein attempts to automate the dataset labeling process as well as in designing a pipeline capableof recognizing shelf products without owning large amounts of data for the training of the neuralnetworks. To defend the intellectual property of the Customer, this dataset will remain proprietaryand will not be disclosed.This work proposes an automated retail shelf analytics system based on the ad-hoc dataset
described above. Two different alternatives will be presented that exploit a more or less intenseuse of manual annotations. This fact translates into a performance trade-off between level of detailand accuracy of the final inferences, which will be discussed in Chapter 5. Both architecturesare based on the recent results of Mask R-CNN [30] and can recognize and segment the differentinstances of products in store images. The elaborations has been integrated directly into thebusiness processes of the Customer and will allow to obtain key insights of strategic importance toevaluate the impact of the Customer brand in the final sale points (Section 5.3).

6 1.1. Related Work
Chapter 2
A Deep Learning Survey
Machine learning, deep learning, predictive analytics, and AI in general are just some of the hottopics nowadays. The ongoing revolution follows a continuous process of disruptive growth and AIis a very important asset in today’s enterprise landscape. From a management point of view, AIhas radically transformed business processes, from transport to industries to communications tohealth care. In AI, deep learning is currently one of the main drivers of worldwide innovation.This chapter offers a brief survey of deep learning. The basics of modern deep learning algo-
rithms, with emphasis on modern convolutional neural networks and the technological aspects thatled to the most recent discoveries, will be discussed.
2.1 Deep Learning Development Scenarios
Programmatically designed features are often incomplete, redundant, and a lot of time is spent inthe underlying core logic design. Features derived from machine learning algorithms are generallyquick to design and easily adapt to different contexts. Deep learning constitutes a scalable, flexible,universal and automatic mechanism to represent data relationships [55].In particular, deep learning is a sub-field of machine learning. However, while machine learning
tries to describe data with features that a machine can understand, deep learning tries to au-tomatically learn good features and representations through sequences of features hierarchicallyorganized on multiple levels [39].Deep learning has no recent origins but it has acquired popularity just in recent years. In fact,
only since 2010 results proposed by deep learning algorithms have started outperforming machinelearning techniques [39, 55]. In particular, there are three main ingredients that have propelledthe success of deep learning algorithms:
• new optimized algorithms have been designed,
• huge computational power has been achieved through technological progress,
• large amount of data have been available for models training.
These themes have been further developed and different entities collaborate daily in the design ofincreasingly optimized algorithms. There are several international challenges where algorithms aretested to improve over the state of the art [40]. There are technological implications to the pointthat entire industries design dedicated hardware and specialized software frameworks [51]. Thephenomenon has radically changed the business world and currently deep learning is an hot topicwith several practical applications.Any type of data that is structured, unstructured or binary, may be the subject of deep learning
algorithms. It is possible to analyze texts, images, sounds, sequences, and more. In particular,some of the most innovative themes try to investigate the relationships between visual and textualdata. This is solved in multidisciplinary contexts such as computer vision and natural language
7

8 2.2. Neural Networks Basics
Figure 2.1: Tesla self-driving car insights. Figure 2.2: Google assistant.
processing for both research and enterprise applications. Self driving cars, robotics, sentimentanalysis, chatbots and process automation are just some of the possible derivations of deep learning.Deep learning is the key to the most innovative projects of prestigious universities such as Stanford[39, 55] as well as well-known software industries such as Google [51] and many others.
2.2 Neural Networks Basics
A neural network is a statistical model that is traditionally used to solve engineering problemsrelated to artificial intelligence. Currently, neural networks are a multidisciplinary research areathat exploits different concepts related to mathematics, statistics, engineering, computer science,biology, psychology and other disciplines [39, 55].According to biological interpretations, neural networks are computational models based on bi-
ological networks mechanisms and constitute a simplified model of the brain. Specifically, neuralnetworks are adaptive systems based on interconnections of artificial neurons. Such interconnec-tions are capable of modifying their structure based on both internal and external data.The working principle of neural networks is the exchange of information between elementary
computational units called artificial neurons. An artificial neuron is a mathematical model pro-posed by McCulloch and Pitts in 1943 [52] to simulate the logical mechanism of a biological neuron.The artificial neuron receives one or more inputs representing post-synaptic potentials at neuraldendrites and sums them to produce an output, representing the neuron’s action potential whichis transmitted along its axon.The Perceptron model, proposed by Frank Rosenblatt in 1958 [60] and the subsequent refine-
ments proposed by Minsky and Papert in 1969 [53], constitute a more general computationalmodel than McCulloch-Pitts neuron. In particular, the Perceptron overcomes some of the limita-tions related to the previous model by introducing the concept of numerical input weights and amechanism for learning those weights. In 1959, the Mark I Perceptron [28], that currently residesin the Smithsonian Institute, was the first hardware implementation of the model. This allowedthe study of the effects of combinations of input features from the experimental point of view.
Figure 2.3: Biological neuron schema [39]. Figure 2.4: Artificial neuron schema [39].
Chapter 2. A Deep Learning Survey 9
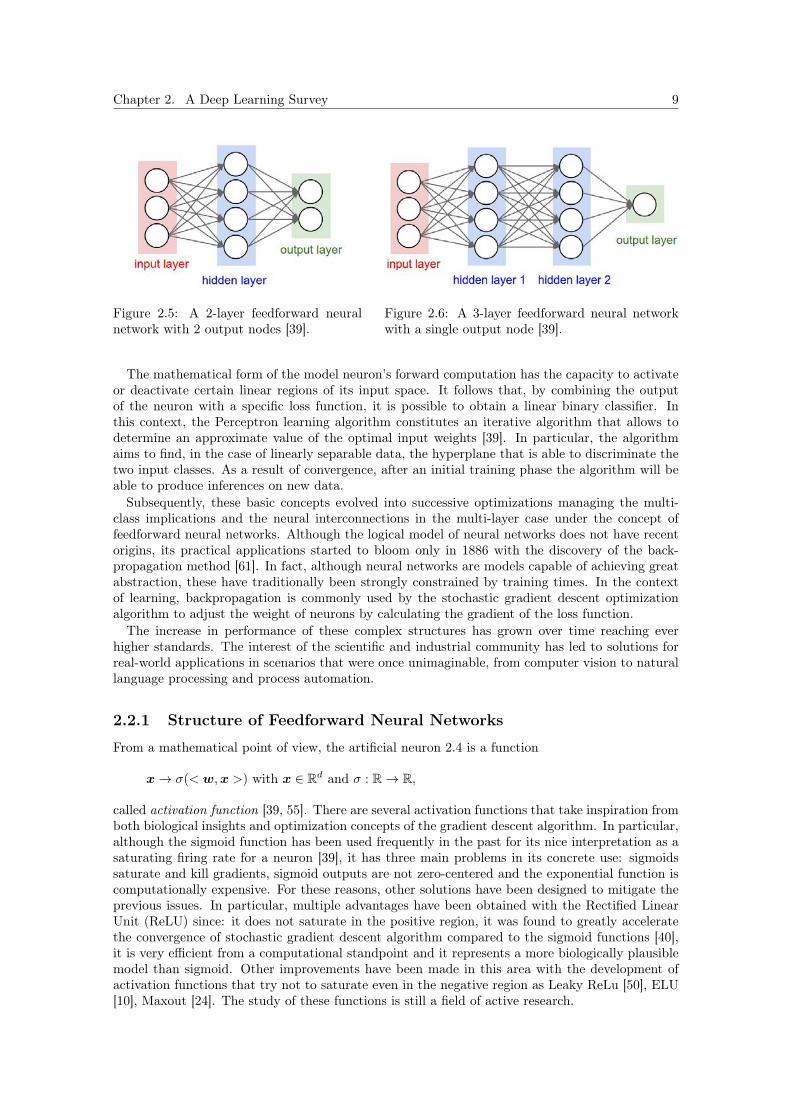
Figure 2.5: A 2-layer feedforward neuralnetwork with 2 output nodes [39].
Figure 2.6: A 3-layer feedforward neural networkwith a single output node [39].
The mathematical form of the model neuron’s forward computation has the capacity to activateor deactivate certain linear regions of its input space. It follows that, by combining the outputof the neuron with a specific loss function, it is possible to obtain a linear binary classifier. Inthis context, the Perceptron learning algorithm constitutes an iterative algorithm that allows todetermine an approximate value of the optimal input weights [39]. In particular, the algorithmaims to find, in the case of linearly separable data, the hyperplane that is able to discriminate thetwo input classes. As a result of convergence, after an initial training phase the algorithm will beable to produce inferences on new data.Subsequently, these basic concepts evolved into successive optimizations managing the multi-
class implications and the neural interconnections in the multi-layer case under the concept offeedforward neural networks. Although the logical model of neural networks does not have recentorigins, its practical applications started to bloom only in 1886 with the discovery of the back-propagation method [61]. In fact, although neural networks are models capable of achieving greatabstraction, these have traditionally been strongly constrained by training times. In the contextof learning, backpropagation is commonly used by the stochastic gradient descent optimizationalgorithm to adjust the weight of neurons by calculating the gradient of the loss function.The increase in performance of these complex structures has grown over time reaching ever
higher standards. The interest of the scientific and industrial community has led to solutions forreal-world applications in scenarios that were once unimaginable, from computer vision to naturallanguage processing and process automation.
2.2.1 Structure of Feedforward Neural Networks
From a mathematical point of view, the artificial neuron 2.4 is a function
x→ σ(< w,x >) with x ∈ Rd and σ : R→ R,
called activation function [39, 55]. There are several activation functions that take inspiration fromboth biological insights and optimization concepts of the gradient descent algorithm. In particular,although the sigmoid function has been used frequently in the past for its nice interpretation as asaturating firing rate for a neuron [39], it has three main problems in its concrete use: sigmoidssaturate and kill gradients, sigmoid outputs are not zero-centered and the exponential function iscomputationally expensive. For these reasons, other solutions have been designed to mitigate theprevious issues. In particular, multiple advantages have been obtained with the Rectified LinearUnit (ReLU) since: it does not saturate in the positive region, it was found to greatly acceleratethe convergence of stochastic gradient descent algorithm compared to the sigmoid functions [40],it is very efficient from a computational standpoint and it represents a more biologically plausiblemodel than sigmoid. Other improvements have been made in this area with the development ofactivation functions that try not to saturate even in the negative region as Leaky ReLu [50], ELU[10], Maxout [24]. The study of these functions is still a field of active research.
10 2.2. Neural Networks Basics
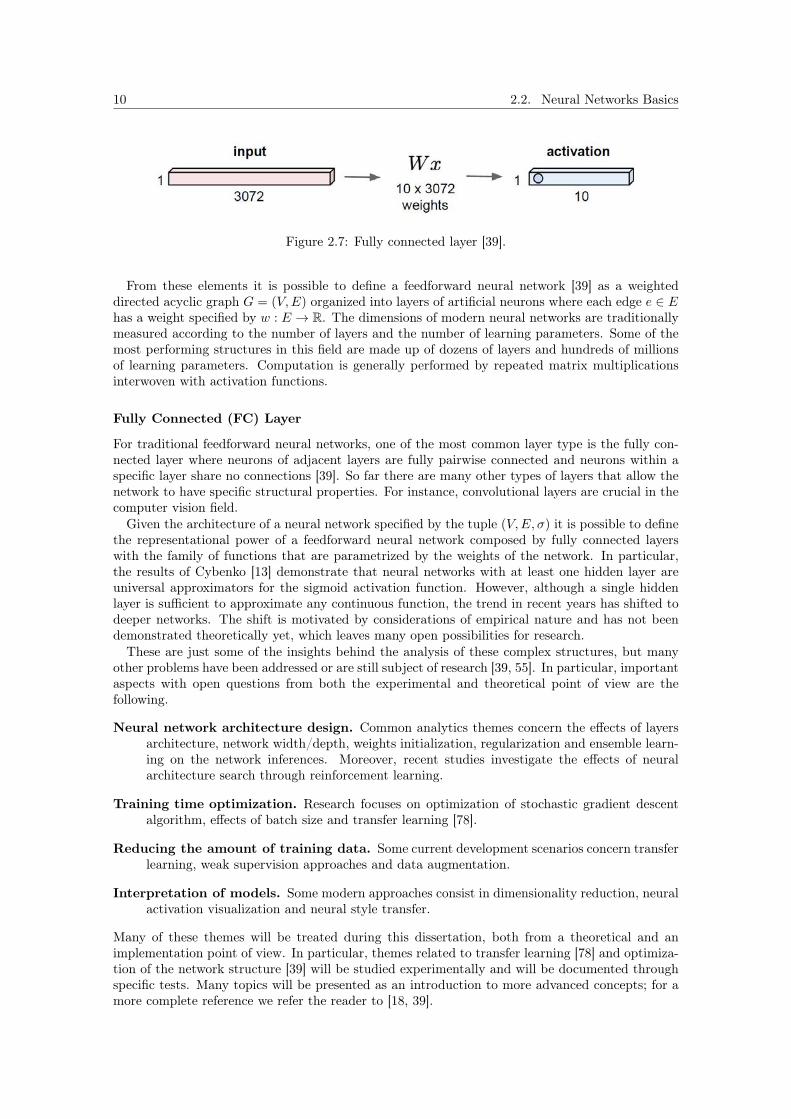
Figure 2.7: Fully connected layer [39].
From these elements it is possible to define a feedforward neural network [39] as a weighteddirected acyclic graph G = (V,E) organized into layers of artificial neurons where each edge e ∈ Ehas a weight specified by w : E → R. The dimensions of modern neural networks are traditionallymeasured according to the number of layers and the number of learning parameters. Some of themost performing structures in this field are made up of dozens of layers and hundreds of millionsof learning parameters. Computation is generally performed by repeated matrix multiplicationsinterwoven with activation functions.
Fully Connected (FC) Layer
For traditional feedforward neural networks, one of the most common layer type is the fully con-nected layer where neurons of adjacent layers are fully pairwise connected and neurons within aspecific layer share no connections [39]. So far there are many other types of layers that allow thenetwork to have specific structural properties. For instance, convolutional layers are crucial in thecomputer vision field.Given the architecture of a neural network specified by the tuple (V,E, σ) it is possible to define
the representational power of a feedforward neural network composed by fully connected layerswith the family of functions that are parametrized by the weights of the network. In particular,the results of Cybenko [13] demonstrate that neural networks with at least one hidden layer areuniversal approximators for the sigmoid activation function. However, although a single hiddenlayer is sufficient to approximate any continuous function, the trend in recent years has shifted todeeper networks. The shift is motivated by considerations of empirical nature and has not beendemonstrated theoretically yet, which leaves many open possibilities for research.These are just some of the insights behind the analysis of these complex structures, but many
other problems have been addressed or are still subject of research [39, 55]. In particular, importantaspects with open questions from both the experimental and theoretical point of view are thefollowing.
Neural network architecture design. Common analytics themes concern the effects of layersarchitecture, network width/depth, weights initialization, regularization and ensemble learn-ing on the network inferences. Moreover, recent studies investigate the effects of neuralarchitecture search through reinforcement learning.
Training time optimization. Research focuses on optimization of stochastic gradient descentalgorithm, effects of batch size and transfer learning [78].
Reducing the amount of training data. Some current development scenarios concern transferlearning, weak supervision approaches and data augmentation.
Interpretation of models. Some modern approaches consist in dimensionality reduction, neuralactivation visualization and neural style transfer.
Many of these themes will be treated during this dissertation, both from a theoretical and animplementation point of view. In particular, themes related to transfer learning [78] and optimiza-tion of the network structure [39] will be studied experimentally and will be documented throughspecific tests. Many topics will be presented as an introduction to more advanced concepts; for amore complete reference we refer the reader to [18, 39].
Chapter 2. A Deep Learning Survey 11
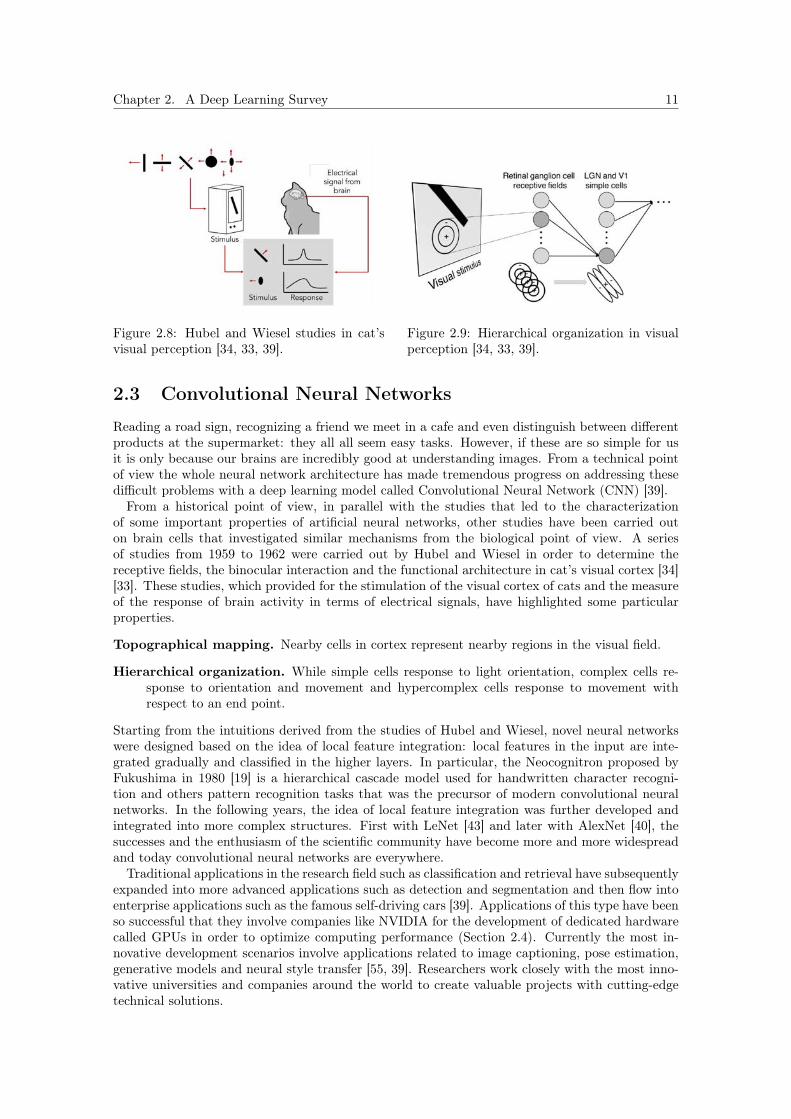
Figure 2.8: Hubel and Wiesel studies in cat’svisual perception [34, 33, 39].
Figure 2.9: Hierarchical organization in visualperception [34, 33, 39].
2.3 Convolutional Neural Networks
Reading a road sign, recognizing a friend we meet in a cafe and even distinguish between differentproducts at the supermarket: they all all seem easy tasks. However, if these are so simple for usit is only because our brains are incredibly good at understanding images. From a technical pointof view the whole neural network architecture has made tremendous progress on addressing thesedifficult problems with a deep learning model called Convolutional Neural Network (CNN) [39].From a historical point of view, in parallel with the studies that led to the characterization
of some important properties of artificial neural networks, other studies have been carried outon brain cells that investigated similar mechanisms from the biological point of view. A seriesof studies from 1959 to 1962 were carried out by Hubel and Wiesel in order to determine thereceptive fields, the binocular interaction and the functional architecture in cat’s visual cortex [34][33]. These studies, which provided for the stimulation of the visual cortex of cats and the measureof the response of brain activity in terms of electrical signals, have highlighted some particularproperties.
Topographical mapping. Nearby cells in cortex represent nearby regions in the visual field.
Hierarchical organization. While simple cells response to light orientation, complex cells re-sponse to orientation and movement and hypercomplex cells response to movement withrespect to an end point.
Starting from the intuitions derived from the studies of Hubel and Wiesel, novel neural networkswere designed based on the idea of local feature integration: local features in the input are inte-grated gradually and classified in the higher layers. In particular, the Neocognitron proposed byFukushima in 1980 [19] is a hierarchical cascade model used for handwritten character recogni-tion and others pattern recognition tasks that was the precursor of modern convolutional neuralnetworks. In the following years, the idea of local feature integration was further developed andintegrated into more complex structures. First with LeNet [43] and later with AlexNet [40], thesuccesses and the enthusiasm of the scientific community have become more and more widespreadand today convolutional neural networks are everywhere.Traditional applications in the research field such as classification and retrieval have subsequently
expanded into more advanced applications such as detection and segmentation and then flow intoenterprise applications such as the famous self-driving cars [39]. Applications of this type have beenso successful that they involve companies like NVIDIA for the development of dedicated hardwarecalled GPUs in order to optimize computing performance (Section 2.4). Currently the most in-novative development scenarios involve applications related to image captioning, pose estimation,generative models and neural style transfer [55, 39]. Researchers work closely with the most inno-vative universities and companies around the world to create valuable projects with cutting-edgetechnical solutions.

12 2.3. Convolutional Neural Networks
Figure 2.10: Convolutional neural network structure [39].
2.3.1 Traditional CNN ArchitecturesConvolutional networks are neural networks that use convolution in place of general matrix multi-plication in at least one layer. This type of operator is traditionally used in fields such as computervision and more generally signal processing as a form of filtering. Assume an input I ∈ R2 and afunction K ∈ R2 called kernel: the discrete convolution S of I and K is
S(i, j) =∑m
∑n
I(i+m, j + n)K(m,n).
Other types of layers in addition to the convolutional ones participate in the architectural stack ofmodern CNNs. In particular, convolutional neural networks are made up of convolutional, poolingand fully connected layers [39]. Other layers (e.g., dropout, normalization, flatten) are widely usedboth to solve a specific case-study and to optimize the whole architecture. Below we will analyzethe main layers and the current trends.
Convolutional (CONV) Layer
From the logical point of view, a convolutional layer [39]
• accepts an input volume of size W1 ×H1 ×D1;
• specifies four hyperparameters: the number of filter K, their spatial extension F , their strideS and the amount of zero padding P ;
• produces an output volume of size W2 × H2 × D2 where W2 = (W1 − F + 2P )/S + 1,H2 = (H1 − F + 2P )/S + 1 and D2 = K;
• introduces F × F ×D1 ×K weights and K biases as learning parameters.
The convolutional layer’s parameters consist of a set of learnable filters. Each filter in the forwardpass is slided across the input volume computing the dot products between the input and thefilter’s entries. As a result, in the forward pass, for every filter an activation map that gives theresponse of that filter at every spatial input location is produced. Therefore, the activation mapsare stacked together along the depth dimension to produce the output volume – Figures 2.11 and2.12. Through this type of architecture, scientific studies reveal that the network will learn kernelsthat activate when they encounter specific visual patterns (like a change of color or orientation) inthe lower layers to get to distinguish semantically stronger features in the higher layers.The convolution operation and the concept of hierarchical organization of the structure of con-
volutional neural networks, over just fully connected layers, lead to particular useful properties.Let’s briefly illustrate these important properties with an example [39].

Chapter 2. A Deep Learning Survey 13
Figure 2.11: Convolutional layer [39]. Figure 2.12: Convolutional layer example [39].
Example 1:Consider a small RGB image I ∈ R32×32×3. Let’s imagine now, regarding the concept of
hierarchical representations of features, to apply a function that allows to reduce the sizeof the input in order to obtain more hierarchically high-level features and call this outputO ∈ R28×28×6. If, therefore, to construct this architecture, we used a classic feedforwardneural network, we would obtain 32 × 32 × 3 × 28 × 28 × 6 ∼= 14M learning parameters.Today it is not impractical to train neural networks with even more than 14M parameters,but consider that this is just a pretty small image and a small architecture. In this context,practical cases with images I ∈ R1024×768×3 would be unmanageable with such a large amountof parameters to learn. However, if we look at the learning parameters of the convolutionallayer that could map I ∈ R32×32×3 in O ∈ R28×28×6 it is sufficient to use 6 kernels K ∈ R5×5
which is equivalent to just 5× 5× 6 ∼= 150 learning parameters.
In particular, the main reasons that led to the success of convolutional neural networks are asfollows [39].
Parameter sharing. The same parameter is used for more than one function in a model. Thisis motivated by the fact that a feature detector (e.g. a convolutional kernel) that is useful inone part of the image is probably useful in another part of the image.
Sparse interactions. In each layer, an output value depends only on a small number of inputvalues.
The combination of the previous properties has the consequence that a much lower number oflearning parameters is required and the convolutional neural network architecture better capturesa translation invariance property. The property stems from the fact that an image shifted a fewpixels should result in pretty similar features.
Pooling (POOL) Layer
Another important layer in moderns convolutional neural networks is the Pooling layer. From amathematical point of view, this layer [39]:
• accepts an input volume of size W1 ×H1 ×D1;
• specifies two hyperparameters: the spatial extension F and the stride S;
• produces an output volume of size W2 × H2 × D2 where W2 = (W1 − F )/S + 1, H2 =(H1 − F )/S + 1 and D2 = D1.
This operates as a form of downsampling over each activation map computed by the convolutionallayers to make the representations smaller and more manageable. Traditional downsampling op-erations for pooling layer consist in max, avg and L2-norm. Among these the most used is themax operation since it performs better in practical cases [39]. However, although this layer has

14 2.3. Convolutional Neural Networks
Figure 2.13: Pooling layer [39]. Figure 2.14: Max Pooling layer example [39].
some nice properties as it achieves almost scale-invariant features representation and reduces thenumber of learning parameters, the trend is to get rid of it [66]. In fact, it is possible to reducethe size of the representations using just convolutional layers with larger stride, thus avoiding theinformation loss due to the downsampling operation.Another trend that has a different purpose but arises from similar observations is to eliminate,
in addition to the pooling layers, even the fully connected ones [39]. The only difference betweenfully connected and convolutional layers is the fact that in the latter case neurons are connectedonly to a local input region and many of them share parameters. However, the function of bothkinds of layers is identical since they both compute dot products, hence it is possible to convertfully connected layers into convolutional ones. Consequently, a fully convolutional [48] architecturewould be obtained that allows to obtain higher computing performance.Recently, in addition to the previous trends we see many other design choices that undermine the
conventional paradigms in favor of more intricate and different connectivity structures such as theinception module of GoogLeNet [67] and the residual connections in modern ResNets [29]. However,although there are many topologies of convolutional neural networks and the possibilities of choiceare very wide, in most practical scenarios it is rare to train and build a completely customizedarchitecture. In fact, in most cases it is sufficient to fine-tune an existing pre-trained networkwith respect to the problem of interest [39, 78] thus reducing training and development times andachieving satisfactory performance.
2.3.2 The CNN Evolution
The structure of modern convolutional neural networks has evolved from the architecture proposedin 1988 by LeCun[43], who exploited the traditional paradigm described above. In this evolutionthere have been a series of experimental studies that have refined the structure optimizing theperformance in terms of precision of the inferences and number of parameters, succeeding to beatthe human eye [63] in 2015.ImageNet Large Scale Visual Recognition Challenge (ILSVRC) is an international challenge that
is run annually since 2010 and aims to measure the progress of computer vision algorithms for imageclassification and object detection at large scale [62]. This competition follows a previous smaller-scale competition, PASCAL VOC [16], established in 2005, which proposed similar objectives andwas based on a dataset containing about 20 thousands images for 20 classes. ILSVRC is based onthe ImageNet [40] visual database, that contains more than 14 million images for more than 20,000classes. A trimmed list with 1000 non-overlapping classes is customarily used for the competition.It is possible to follow in detail the succession of architectures in ILSVRC monitoring the struc-
tural trends and the improvements that each case study has provided [39]. Results are generallycharacterized by the analysis of the performances both of the inferences accuracy and the compu-tational efficiency. A recent analysis [7] highlights other aspects from an practical point of viewby measuring the power consumption required to train such networks. Below we will examine themain contributions to the establishment of modern convolutional neural networks.

Chapter 2. A Deep Learning Survey 15
Figure 2.15: ImageNet Large Scale Visual Recognition Challenge winners [62, 39].
AlexNet
The deep learning revolution starts in 2012 with the AlexNet neural network [40]. The networkpresents an 8-layer structure hierarchically organized. This historically presented a whole series ofhardware-side memory issues that required the neural architecture to be split into 2 distinct GPUGTX 580s. From the input image the features were extracted passing through a convolutionalbackbone that gradually presented semantically stronger features according to the principles de-scribed above. From the last layer of the backbone, 3 fully connected layers were connected forthe classification of the 1000 classes mandated by ILSVRC’12. AlexNet was the first winner ofILSVRC to be based on a convolutional architecture with a 16.4% inference error and this wasfollowed by many others.
VGGNet
Although the good results obtained from the improvement of AlexNet hyperparameters presentedby Zeiler and Fergus in 2013 [79], even better results were obtained with deeper networks. Inparticular, Simonyan and Zisserman in 2014 [65] proposed a 19-layer network architecture obtaininga 7.3% error. The network was based on the concept that a stack of three 3x3 convolutional layershas the same receptive field as one 7x7 convolutional layer. The main advantage, with the samereceptive field, was that with the increase in depth there was also an increase in non-linearitieswith consequent increases in performance. However, a downside of the deeper architecture is theincreased number of parameters and consequently of memory consumption. According to this lastconstraint it is possible to further optimize the architecture, with no performance downgrade, by
Figure 2.16: AlexNet architecture [39, 40].

16 2.3. Convolutional Neural Networks
Figure 2.17: VGGNet architecture [39, 65].
removing the last fully connected layers, thus reducing the number of parameters and propellingfor an almost fully convolutional architecture.
GoogLeNet
A network that demonstrates both good results from the accuracy point of view and from thecomputational efficiency is GoogLeNet, proposed by Szegedy et al. in 2014 [67]. In particularits main contribution has been the development of the Inception Module and the removal of fullyconnected layers that dramatically reduced the number of parameters in the network. The inceptionmodule was designed in favor of a good local network topology that apply parallel filter operationson the input from previous layers with multiple receptive field sizes for convolutions (1x1, 3x3, 5x5)and a 3x3 max pooling operation concatenating together all filter outputs depth-wise. Since thisis very inefficient computationally, 1x1 convolutional layers are applied as a form of bottleneck toreduce feature depth. The full architecture is a 22-layer structure that stacks inception modules ontop of each other from a first convolutional stem network to the softmax classifier output. Auxiliaryclassification outputs are used to inject additional gradient at lower layers.GoogLeNet has been the ILSVRC’14 classification winner with a 6,7% error. Newer solutions
as Inception-v4 [68] optimize the original version, further increasing performance.
ResNet
Since 2015 there have been a series of networks based on even deeper architectures than the pre-vious ones, and achieving even better results. The contributions of He in 2015 [29] led to theestablishment of a 152-layer network (ResNet) that outperforms previous models with a 3.6% er-ror. The network, which takes its name from the technique used, features the famous residualconnections technique to optimize the training process. In particular, it has been observed that
Figure 2.18: GoogLeNet architecture [39, 67].

Chapter 2. A Deep Learning Survey 17
Figure 2.19: ResNet architecture [29, 39].
stacking deeper convolutional layers on a plain convolutional neural network exhibits worse perfor-mance both on training and test error with respect to a simpler model. This phenomenon, whichmay seem to be due to overfitting, is instead due to the fact that deeper models are harder tooptimize. In fact, given the insight that deeper models should be able to perform at least as well assimpler model, the solution to the optimization problem has been to copy the learned layers fromthe simpler model and to set additional layers to identity mapping. The technique fits a residualmapping to upper layers instead of directly trying to fit a desired underlying mapping.The full ResNet architecture stacks together residual blocks composed by two 3x3 convolutional
layers from a first convolutional layer at the beginning to the softmax output. Bottlenecks 1x1convolutional layers further improve efficiency in a GoogLeNet-like fashion.Residual networks are currently the state of the art of convolutional neural networks for image
classification, and are a good default choice for practical scenarios. The structures of more recentconvolutional neural networks are inspired by this model and develop innovative features with newResNet-based topologies [77]. A significant part of the world-wide research in this area focus onthe design of residual connections to improve the gradient flow and investigate the effects of widerand deeper models on output results [39]. Even newer trends concern the design of meta-learningalgorithms to further improve performances.
2.3.3 Transfer LearningTransfer learning is a technique that aims to transfer knowledge from an already learned taskto a new one. This technique has been studied and quantified for modern convolutional neuralnetworks in [78]: this work investigated artificial neurons transition from general to specific in deepconvolutional neural networks. In particular, in the AlexNet case it has been observed that, whilefirst-layer features are general purpose, last-layer ones are task-specific. The technique has beenused by subsequent works [23] that confirmed the results, and is currently very popular in thedeep learning field. Nowadays, in fact, there is a tendency to avoid training convolutional neuralnetworks from scratch. This is because it is very difficult to have large datasets. In practice [39],convolutional neural networks are pre-trained on large generic datasets and subsequently eitherfine-tuned or used as feature extractors for the task of interest.
Feature extraction. The technique aims to remove the last fully connected layer of a convolu-tional neural network pre-trained on a large dataset (e.g. ImageNet) to treat the rest ofthe network as a feature extractor for a new dataset. Subsequently, a task-specific classifier(often, a linear one) is trained on the features extracted from the network.
Fine-tuning With fine-tuning, the on-top classifier of the pre-trained convolutional neural net-work is not only replaced and retrained, but some of the previous layers are retrained too.This is due to the fact that, as described in [78], convolutional layers become progressivelymore specific to the trained dataset.
Moreover, as we will discuss later in Section 2.4, a zoo of pre-trained models is available fordevelopers to take advantage of open-source contributions.The applicability of the Transfer Learning technique depends several factors, and chiefly the size
of the new dataset and its similarity with the original one [39]. The size of the dataset implies thepossibility or not to fine-tune due to overfitting concerns. Depending on the size of the dataset, it
18 2.3. Convolutional Neural Networks
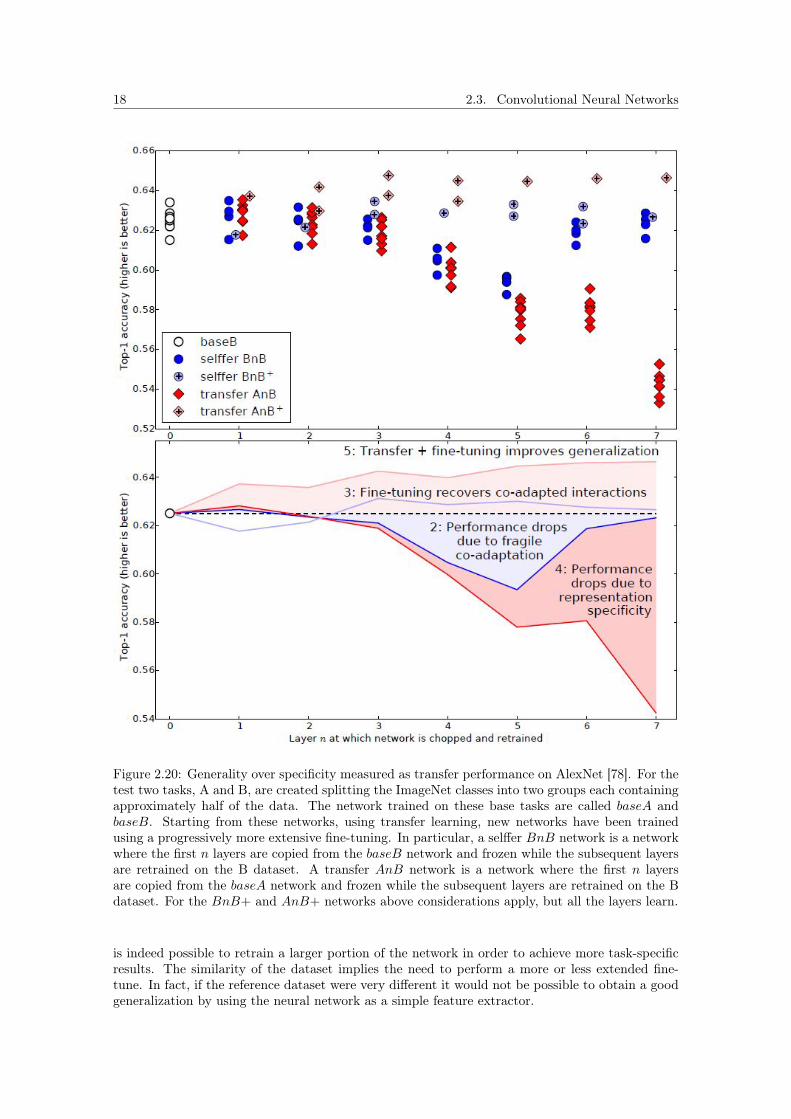
Figure 2.20: Generality over specificity measured as transfer performance on AlexNet [78]. For thetest two tasks, A and B, are created splitting the ImageNet classes into two groups each containingapproximately half of the data. The network trained on these base tasks are called baseA andbaseB. Starting from these networks, using transfer learning, new networks have been trainedusing a progressively more extensive fine-tuning. In particular, a selffer BnB network is a networkwhere the first n layers are copied from the baseB network and frozen while the subsequent layersare retrained on the B dataset. A transfer AnB network is a network where the first n layersare copied from the baseA network and frozen while the subsequent layers are retrained on the Bdataset. For the BnB+ and AnB+ networks above considerations apply, but all the layers learn.
is indeed possible to retrain a larger portion of the network in order to achieve more task-specificresults. The similarity of the dataset implies the need to perform a more or less extended fine-tune. In fact, if the reference dataset were very different it would not be possible to obtain a goodgeneralization by using the neural network as a simple feature extractor.

Chapter 2. A Deep Learning Survey 19
Figure 2.21: Hardware performance FP32 over years [39].
2.4 Hardware, Frameworks and Datasets
Modern neural networks are the result of a continuous technological improvement process madepossible by an evolution of dedicated hardware and software. Deep learning solutions can be foundtoday in our computers, smartphones, tablets and servers of the most innovative companies aroundthe world. In particular, while hardware progress sees the development of more and more special-ized architectures through the now famous NVIDIA GPUs, software development is entrusted toframeworks such as TensorFlow [51] and Pytorch. There are also many contributions from theopen source community that make new dataset and pre-trained models available every year thatcan be used by anyone for the development of customized solutions in a short time.Below, we will briefly present the history of technological improvements for hardware, software
and datasets.
2.4.1 Hardware: from CPU to GPU/TPU
There are two distinct phases that make it possible to use modern neural networks: Training andInference, where the network is tuned to solve a specific task and where the network is actuallyused as an inferential engine, respectively. The training phase, in particular, is much more compu-tationally demanding than the inference phase, and can take days. Hardware optimization tries toimprove the performance of both phases, obtaining both real-time inferences and faster training.However, while training requires almost exclusively the use of very powerful servers, the inferencecan easily be performed even in multi-core CPUs of modern smartphones or tablets [39].The Central Processing Units (CPUs) are the traditional computational units that centrally
coordinate all the processing tasks in computer hardware architectures. In particular, while mostdesktop devices mount multi-core CPUs with 2 to 8 cores, the current trend sees a further increase inthe number of cores if we think of recent Intel Core i9 and AMD Ryzen Threadripper architectures.In computer servers, Intel Xeon and AMD EPYC already offer better performance with a number ofcores traditionally superior to the desktop market and other useful technology such as ECC memoryand multi-processor configurations. However, currently, CPUs are not the dominant technologyin the hardware market of deep learning. Some approaches try to use cluster of CPUs like Intel’s

20 2.4. Hardware, Frameworks and Datasets
Product Cores ClockSpeed
Memory Price Speed
Intel Core i7-7700k 8 (hyper) 4.2 GHz System RAM $339 ∼540 GFLOP/s (FP32)NVIDIA GTX 1080 Ti 3584 1.6 GHz 11 GB GDDR5X $699 ∼11.4 TFLOP/s (FP32)NVIDIA TITAN V 5120 CUDA,
640 Tensor1.5 GHz 12 GB HBM2 $2999 ∼14 TFLOP/s (FP32),
∼112 TFLOP/s (FP16)Google Cloud TPU v2 - - 64 GB HBM $6.5 (hour) ∼180 TFLOP/s
Table 2.1: Deep learning hardware comparison [39].
BigDL or software libraries specialized for deep learning on CPUs, but the results are not verypromising and have practical use only in case there is already a CPU-based supercomputing center.The hardware market for deep learning is currently dominated by Graphics Processing Units
(GPUs). Originally created for the computer graphics industry, GPUs are specialized computa-tional units with a number of cores two orders of magnitude higher than classical CPUs [39]. Thehigh number of cores and the high degree of parallelism that results makes GPUs a central tech-nology for the efficient execution of algorithms based on matrix operations and convolutions, asit is the case in deep neural networks. NVIDIA GPUs are undoubtedly the most used processingunits in deep learning frameworks, while AMD GPUs don’t enjoy the same popularity.Modern deep learning systems currently see an integration of CPUs and GPUs where the CPU
oversees the loading and management of the computation and the GPU is responsible for thecomputational load [39]. This trend is so clear that we are witnessing three distinct phenomena:
• the design of distributed computing clusters that can be used in the cloud, such as AWS, MsAzure and GCP, and powerful supercomputers such as IBM Summit;
• the development of dedicated computing accelerators for deep learing, such as Google’s TensorProcessing Unit (TPU) and Neural Processing Unit (NPU), to get faster training on serversand low latency inferences on smartphones;
• an increase in accessibility towards the creation of scalable computing infrastructures builtspecifically for businesses or individuals by reducing the costs of the various components.
In parallel to the development of the previous points, research also explores alternative solutions[39] based mainly on concepts such as distributed model training, neuromorphic computing andquantum computing.
2.4.2 Frameworks and Dataset ZoosIn order to make the best use of specialized deep learning hardware, it is necessary to exploitstrongly engineered, parallel programming concepts that have a whole series of implications on thesoftware side [35]. In particular, while low-level computing processes can be managed directly onGPUs using parallel computing platforms such as CUDA and optimized libraries for deep learningsuch as cuDNN and NCCL, high-level modern frameworks offer a fundamental abstraction thatallows the developer to focus directly on the design of the network architecture.Almost every year a new framework is released for generic or task-specific deep learning [35].
This is due to the fact that the major global entities involved in innovative projects in AI benefitfrom specialized software. TensorFlow, PyTorch, Keras, Caffe, MXNet, CNTK are just some ofthe names that are mentioned in the development portfolios of modern deep learning applications[35, 39]. While some frameworks like Caffe, Theano and Torch were born in the academia, themost famous ones such as TensorFlow, PyTorch and CNTK – that in some cases derive from theprevious ones – were developed by large specialized software companies such as Google, Facebookand Microsoft.TensorFlow, PyTorch and other deep learning frameworks, including Microsoft Cognitive Toolkit,
are released under open-source licenses [39]. More generally, the deep learning world follows a pre-dominantly open-source philosophy and many works by large companies such as Google, Facebook

Chapter 2. A Deep Learning Survey 21
Figure 2.22: Main machine learning frameworks.
and Microsoft are published through research papers. This makes it possible to know the algorithmsin detail and to exploit this knowledge on the research side proposing new innovative solutions, oron the business side with solutions targeted to customers. Research in the field moves at a fastpace and every year innovative discoveries are proposed that promptly provide new interpretationsand contribute to everyday applications.In particular, beyond the specific software libraries, frameworks generally provide:
• portfolios of high-level APIs that extend basic features;
• pre-trained models and training configurations;
• datasets to train the models from scratch.
The high-level APIs are traditionally linked to a specific domain of interest such as computer visionor natural language processing, and allow a very fast prototyping of the neural networks. Thesecan be developed directly by the framework’s developers (eg. Google Brain) such as TensorFlow’sobject detection APIs [32] or released open-source by third parties as for example the Matterport’s[1] implementation of the Mask R-CNN algorithm [30] in TensorFlow. Pre-trained models, on theother hand, are grouped in zoos and can be used directly for inferences or can be exploited to dotransfer learning or network surgery to solve a specific task. In this, the datasets play a key rolein models training and in the world of deep learning. The latter assume both a development rolein case the specific application requires to perform fine-tuning or domain transfer, and a role ofverification of models performances as a form of certification.Each framework has distinct characteristics that make it usable in a particular domain of in-
terest. It is therefore possible to compare the various architectures regarding hardware support,software compatibility, computational efficiency, ease of use, documentation and interest from thecommunity [64, 4]. In particular, although all points are touched differently from each framework,what currently emerges from a cross analysis is the popularity of TensorFlow, Keras, and PyTorch.The interest of the deep learning community is diversified and rewards the TensorFlow documen-tation and guidelines, which makes it an excellent tool in production, and the architectural style

22 2.4. Hardware, Frameworks and Datasets
Figure 2.23: Main machine learning frameworks trends [25].
of PyTorch, which makes it a great research tool. Keras, instead, is a Python library that canbe used on top of TensorFlow and other frameworks (PyTorch is not among them, however), andallows an agile and lightweight prototyping of models thanks to its high-level APIs.In what follows we will focus more on TensorFlow for its ability to support deep learning models
at scale, but we will make comparisons with PyTorch to highlight its peculiarities and softwarestructure.
TensorFlow
TensorFlow is a software library for machine learning developed by Google Brain and releasedunder the Apache 2.0 open-source license [51]. The library provides tested and optimized modulesuseful in the implementation of AI algorithms for different tasks and is widely used in manycommercial products of well-known international companies. TensorFlow provides both low-leveland high-level APIs [51], the latest available via Keras. It is used to build deep learning modelsto make inferences on structured, unstructured and binary data such as text, images and audio,as well as to build generative models – through the famous GANs, for instance. It is possible todesign both research applications with Eager Execution and large-scale deployments in productionenvironments through Estimators.TensorFlow [51] supports the major 64-bit operating systems Windows, Linux and MacOS and
provides native APIs in Python, C/C++, Java, Go and third-party APIs available in C#, Julia,Ruby and Scala. There is also an ongoing project to integrate TensorFlow directly in Swift.Different projects are also dedicated to web and mobile development, respectively TensorFlow.js,which allows training and deploying of models in web applications through Node.js, and TensorFlowLite, which represents the official solution for running models on mobile and embedded devices suchas Android and iOS.From a technical point of view, the key principles on which TensorFlow is based are [35]:
• the definition of computational graphs composed of n-dimensional base units called tensorsthat abstract the underlying architecture and can be run on CPUs or GPUs;
• the automatic computation of the gradient and other mathematical utilities for the design ofcomputational graphs.

Chapter 2. A Deep Learning Survey 23
Figure 2.24: TensorFlow architecture [51].
For computational graphs, TensorFlow traditionally follows the "define and run" paradigm thatallows to define a static computational graph and then use it in every iteration. The graph can bedefined node by node through the low-level APIs [35], or sequentially as a succession of predefinedlayers through the high-level routines included in Keras. This is opposed to PyTorch’s vision wherecomputational graphs are dynamically defined according to the "define by run" paradigm [35]. Ifthe definition of static computational graphs allows the underlying framework to perform a seriesof optimizations before execution, the dynamic variant allows greater flexibility for algorithms thatare dynamic by definition such as modern recurrent neural networks. However, this traditionalistvision was overcome with TensorFlow 1.7 through the Eager Execution that allows the definitionof dynamic graphs overcoming the previous problems.In addition to the base library, a suite of specific and general purpose software development tools
and APIs are available for developers [51]: Tensorboard for learning visualization, monitoring andmodel inspection; TensorFlow Debugger for a specialized debugging; TensorFlow Serving for thedeployment of deep learning models in production environments through the classic client-serverarchitecture; and other utilities. It is also possible to take advantage of the multi-GPU distributedtraining features and of more advanced utilities for training on Google Cloud TPUs [39, 51].
2.4.3 International Challenges and DatasetsBelow we will give a brief overview of the most famous datasets and international challenges thatsee them involved. We will only analyze datasets in the object detection field, as this deep learningproject falls into such field. Dedicated datasets in the retail systems analytics field will be treatedlater in the chapters that describe the system model.Every year new datasets over specific contexts are created; new international challenges arise
and researchers from all over the world challenge each other to design cutting-edge targeted solu-tions. The major international challenges in computer vision are mainly focused on topics such asimage classification, object detection and semantic segmentation. Parallel to the main tasks, newchallenges arise that integrate the same tasks in different contexts. This is the case for instancesegmentation, image captioning and many other challenges.Currently, the main datasets that see the greatest number of international challenges derive
from a succession of datasets in the computer vision field started in 1998 with the famous MNISTdataset for handwritten digits recognition [42]. After MNIST, other datasets, such as ImageNet[40] and PASCAL VOC [16], respectively in the image classification and object detection fields,have been created. These have subsequently integrated other types of challenges and ImageNet

24 2.4. Hardware, Frameworks and Datasets
Figure 2.25: Images and annotations from Microsoft COCO.
Name Description Size Class Tasks Format
MNIST Handwritten digits recognition 60K 10 Image classification 28× 28 GrayFashion MNIST Fashion products recognition 60K 10 Image classification 28× 28 GrayCIFAR-10 Small images, various classes 60K 10 Image classification 32× 32 RGBCIFAR-100 Small images, various classes 60K 100 Image classification 32× 32 RGBCaltech-101 Small images, various classes 9K 101 Image classification Small RGBCaltech-256 Small images, various classes 30K 256 Image classification Small RGBPASCAL VOC Various themes 11.5K 20 Image classification,
object detection, in-stance segmentation,action classification
Small RGB
ImageNet Visual Recognition at scale 14M 21K Image classification,object detection
RGB
Ms COCO Complex everyday scenes of com-mon objects in natural context
330K 171 Object detection, se-mantic segmentation,instance segmentation,keypoint detection
RGB
Open Images Unified image classification, ob-ject detection, and visual rela-tionship detection at scale
9M 19.8K Image classification,object detection,visual relationshipdetection
RGB
SUN Very large scene and objectrecognition database
131K 4.7K Object detection, in-stance segmentation
RGB
Cityscapes Semantic understanding of ur-ban street scenes
25K 30 Object detection, in-stance segmentation
RGB
DAVIS Densely annotated video seg-mentation
10.5K - Object detection, in-stance segmentation,video segmentation
RGB
LabelMe Dynamic dataset of annotatednatural scenes
187K - Object detection, in-stance segmentation
RGB
Visual Genome Connecting language and visionwith dense image annotations
108K 33.9K Object detection, im-age captioning
RGB
Table 2.2: Famous deep learning image classification and object detection datasets [11].
currently in addition to image classification is used for object detection while PASCAL VOC hasalso been able to integrate instance segmentation. Starting from these datasets, in 2014 MicrosoftCOCO – Common Objects in COntext – has been created [46]. This has resized the conceptsof instance segmentation started by PASCAL VOC at scale and is currently the main referencedataset together with ImageNet all over the world.

Chapter 3
Object Detection: State of the Art
With the recent advancements in deep learning, modern object detection methods have becomevery popular for the outstanding results achieved. These are applied in different contexts in theindustrial field as the core of the most innovative projects by the main market players. Videosurveillance, self-driving cars, robotic process automation and retail systems analytics are justsome of the recent declinations of these algorithms.This chapter contains a technical overview of all the main themes in the object detection land-
scape. The most performing object detection algorithms as well as activities ranging from clas-sification to semantic segmentation that often act as an integration to the proposed algorithmswill be treated. The contents of this chapter will be the core innovation engine of subsequentdevelopments in the retail products analytics area proposed by our work.
3.1 An Object Detection Review
Object detection [39] is currently one of the main tasks of computer vision. This is the naturalevolution of image classification, another very well known task in the computer vision field thatprovides for the assignment of a specific label to an image to characterize its content. Objectdetection differs from the latter because it aims to determine, for an arbitrary image, both thelabel and the bounding box that defines each entity in the scene. Besides object detection, othertasks have assumed great importance nowadays. These are semantic segmentation and instancesegmentation which provide to make per-pixel predictions to identify for a generic image respec-tively all the pixels belonging to a given class and all the pixels belonging to a given class instance.Other declinations see the extension of these tasks from the 2D world to the 3D world, introducingalso advanced domain-specific challenges as video streaming understanding.Given the semantic gap between what a human being is able to understand and what a computer
is able to process, a series of issues are defined that make these tasks extremely challenging.In particular, computer vision algorithms traditionally have troubles dealing with [39] viewpointvariation, different illumination and deformation conditions, occlusion, intraclass variation andmany other challenges. Therefore actually there is no obvious way to hard-code algorithms tosolve the previous tasks except in a restricted domain.Object detection – and, more generally, computer vision algorithms – have evolved over time from
heuristic analytics techniques based on empirically defined rules to reach the modern data-drivenapproach [39]. The latter aims to train a classifier on a set of reference images and annotationscalled dataset and currently is very successful in terms of results achieved. The following constitutesa basic yet standard-compliant overview of the evolution of object detection approaches.
Geometric invariants. This class of algorithms exploits invariant geometric characteristics ofclasses of distinct geometric objects such as circles and rectangles to identify specific patternsin the images. Hough Transform and Generalized Hough Transform algorithms are part ofthis algorithmic class [36]. The latter in particular constitute a template matching approach
25

26 3.1. An Object Detection Review
Figure 3.1: Image classification [20]. Figure 3.2: Object detection [20].
Figure 3.3: Semantic segmentation [20]. Figure 3.4: Instance segmentation [20].
to determine which objects belong to the same class through an evaluation procedure of eachcandidate in a parametric space.
Feature based. Starting from an image it is possible to identify special points called keypointsthrough features detectors, as well as to associate these points based on the surroundingarea through features descriptors. The detector provides a stable keypoints identification,insensitive to light changes and geometrically accurate. The descriptor, based on informationfrom color, texture and orientation, instead provides a vector representation of a specificpart of an image from the keypoints identified by the detector. The main application ofthe previous algorithms consists in comparing specific patterns in different images througha matcher. SIFT [49], SURF [5], HOG [14]: these names are all part of a famous pool ofalgorithms for object detection based on features.
Bag of features. The bag of features approach [41] is inspired by the famous bag of words methodand combines both the data-driven approach and the feature-based one. The initial step ofthis approach involves learning a visual vocabulary based on features extracted from feature-based algorithms. Subsequently, it is possible to perform the classification and the detectionby appropriately aggregating the visual vocabulary identified in the image through furtherdata elaborations.
Deep learning. The data-driven approach has been developed over the years attaining increas-ingly higher goals. This was initially developed as a classification problem based on theconcept of proposals and subsequently it has recently been formulated in an alternativeway as a regression problem [39]. The first category includes the two-stage region-basedapproaches that perform entities detection on the basis of candidate image portions calledregions. The second solution instead belong to single-stage approaches that simplify the can-
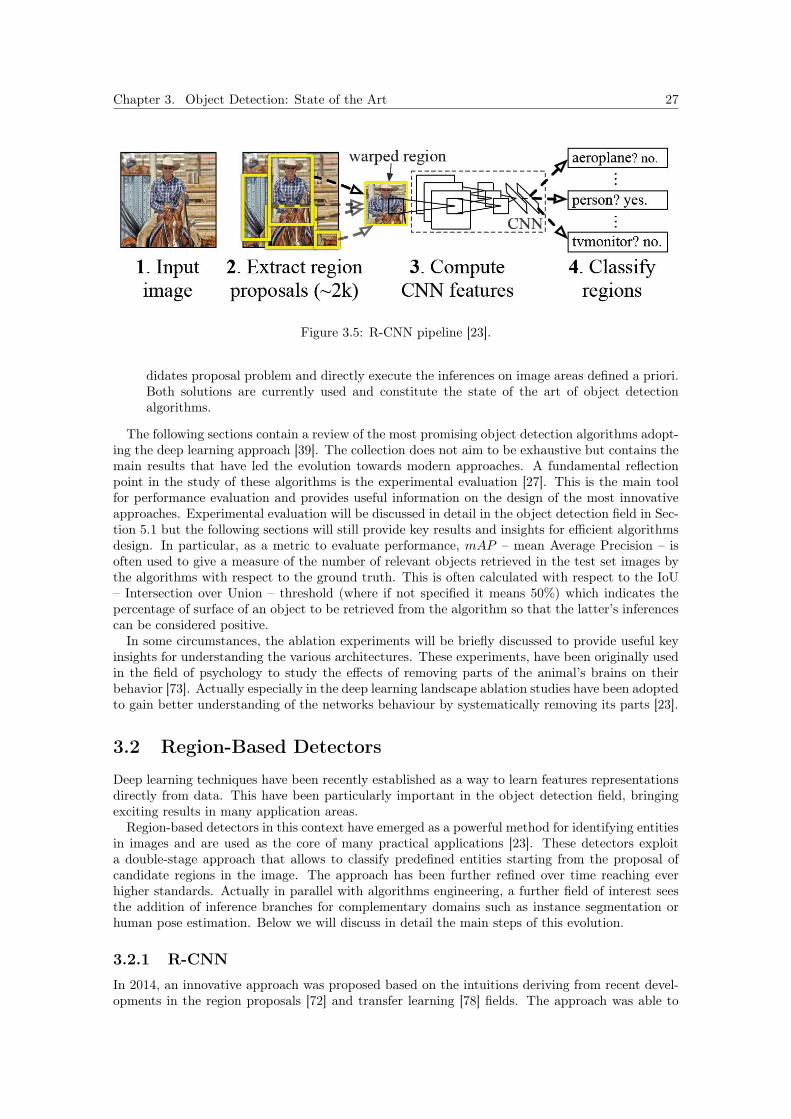
Chapter 3. Object Detection: State of the Art 27
Figure 3.5: R-CNN pipeline [23].
didates proposal problem and directly execute the inferences on image areas defined a priori.Both solutions are currently used and constitute the state of the art of object detectionalgorithms.
The following sections contain a review of the most promising object detection algorithms adopt-ing the deep learning approach [39]. The collection does not aim to be exhaustive but contains themain results that have led the evolution towards modern approaches. A fundamental reflectionpoint in the study of these algorithms is the experimental evaluation [27]. This is the main toolfor performance evaluation and provides useful information on the design of the most innovativeapproaches. Experimental evaluation will be discussed in detail in the object detection field in Sec-tion 5.1 but the following sections will still provide key results and insights for efficient algorithmsdesign. In particular, as a metric to evaluate performance, mAP – mean Average Precision – isoften used to give a measure of the number of relevant objects retrieved in the test set images bythe algorithms with respect to the ground truth. This is often calculated with respect to the IoU– Intersection over Union – threshold (where if not specified it means 50%) which indicates thepercentage of surface of an object to be retrieved from the algorithm so that the latter’s inferencescan be considered positive.In some circumstances, the ablation experiments will be briefly discussed to provide useful key
insights for understanding the various architectures. These experiments, have been originally usedin the field of psychology to study the effects of removing parts of the animal’s brains on theirbehavior [73]. Actually especially in the deep learning landscape ablation studies have been adoptedto gain better understanding of the networks behaviour by systematically removing its parts [23].
3.2 Region-Based Detectors
Deep learning techniques have been recently established as a way to learn features representationsdirectly from data. This have been particularly important in the object detection field, bringingexciting results in many application areas.Region-based detectors in this context have emerged as a powerful method for identifying entities
in images and are used as the core of many practical applications [23]. These detectors exploita double-stage approach that allows to classify predefined entities starting from the proposal ofcandidate regions in the image. The approach has been further refined over time reaching everhigher standards. Actually in parallel with algorithms engineering, a further field of interest seesthe addition of inference branches for complementary domains such as instance segmentation orhuman pose estimation. Below we will discuss in detail the main steps of this evolution.
3.2.1 R-CNNIn 2014, an innovative approach was proposed based on the intuitions deriving from recent devel-opments in the region proposals [72] and transfer learning [78] fields. The approach was able to

28 3.2. Region-Based Detectors
Figure 3.6: R-CNN architecture [23, 39].
improve the performances measured on the PASCAL VOC 2010 [16] dataset by 30% compared toprevious algorithms, achieving a mAP of 53.7% [23].
The algorithm architecture is based on three distinct stages [23].
Region proposals. The Selective Search algorithm is responsible for proposing possible non-categoric candidate regions for a subsequent classification [72]. The algorithm exploits colorand texture similarities and other image features to return blobby image regions that arelikely to contain objects. Relatively fast to run, Selective Search returns about 2000 regionproposals in few seconds.
Features extraction. A backbone consisting of an AlexNet [40] convolutional neural networktopology is used as a feature extractor on previous warped region proposals. The use ofdifferent backbones has been further investigated in the ablation studies and positive effectshave been found in other topologies.
Classification. The features extracted are subsequently classified by a collection of SVMs, one foreach class in the dataset. Inferences are then aggregated through non-maxima suppressionto return final predictions.
Ablation Studies:Ablation studies by the authors also confirmed the usefulness of transfer learning [78] and
further algorithmic optimizations. With regard to transfer learning, positive effects wereobtained by pre-training the convolutional backbone on a large auxiliary dataset (ILSVRC2012[62]) and subsequently adapting the CNN to the new domain (PASCAL VOC 2010 [16])with a domain-specific fine-tuning. The results of the final classification by means of SVMs

Chapter 3. Object Detection: State of the Art 29
Figure 3.7: SPP-net architecture [31, 39]. Figure 3.8: SPP layer [31].
were compared with a more traditional classification by softmax and found a performancedegradation in the softmax case of about 3.3% on PASCAL VOC 2007. The introduction ofa further linear regression inference branch as a refinement of the bounding box coordinatespreviously determined by the Selective Search region-proposals algorithm has found an increasein performance on the PASCAL VOC dataset of about 3.5% compared to the base case. Thethreshold that regulated the degree of IoU – Intersection over Union – of the overlappingregions was a fundamental parameter to obtain good inference performances. A grid searchover {0, 0.1, · · · , 0.5} showed good results with a 0.3 threshold.
Starting from R-CNN other algorithms have been developed that have improved various aspectsof the original architecture. In particular, the inference speed has been further optimized in parallelwith the possibility of performing end-to-end training, achieving higher performance standards.
3.2.2 SPP-net
SPP-net and the concept of Spatial Pyramid Pooling had been proposed by He in 2014 as an opti-mization of traditional convolutional neural networks [31]. The approach eliminates the constraintof fixed-size input of the convolutional neural networks generating a fixed-length representationregardless of image size and scale. In particular, the fixed-size input constraint is relative only tothe fully-connected layers while it does not apply to convolutional ones. To adapt CNNs to imagesof any size, the Spatial Pyramid Pooling layer is introduced as an interface to the fully-connectedlayers that pools the output of feature maps in local spatial bins.In particular, the usefulness of SPP-net in the object detection field has been pointed out by
proposing an optimization that accelerates R-CNN from 10× to 100× at test time and by 3× attraining time. Since R-CNN is slow because it does not share computations between convolutionalregion-proposal forward passes, the SPP method classifies each region proposal using a featurevector extracted from a shared convolutional feature map. Multiple region-proposal output featuresizes are pooled and concatenated into a fixed-size output through a Spatial Pyramid Pooling layer.
3.2.3 Fast R-CNN
Fast R-CNN [22] was proposed by Ross Girshick as a R-CNN and SPP-net optimization in 2015.According to the author, Fast R-CNN is 9× faster than R-CNN in training and 213× in inferenceand achieves also higher accuracy performances obtaining 66% mAP on PASCAL VOC 2012 [16].

30 3.2. Region-Based Detectors
Figure 3.9: Fast R-CNN pipeline [22].
The main drawbacks of R-CNN and SPP-net underlined by Girshick concern the multi-stagetraining pipeline and the inefficiency in time and space recorded in the various phases of thealgorithm. For the second in particular, this requires caching the features extracted from the SPPlayer to fine-tune the FC layers on top and then train the SVMs and linear regressors. In fact, oneof the main disadvantages of the method proposed by He is that the fine-tuning algorithm cannotupdate the convolutional layers that precede the SPP layer and this strongly limited the accuracyof very deep neural networks. This is due to the inefficiency introduced in the backpropagationalgorithm when each ROI training sample comes from a different image, as highlighted in [22].The improvements of Girshick [22] over SPP-net [31] are mainly training optimizations. The
architecture of the network is reviewed in favor of a simpler structure that allows end-to-end andtraining. This is achieved using multi-task loss on softmax and bounding box regression outputlayers where softmax takes the place of previous SVMs. SPP layer also changes in favor of a reducedconfiguration called ROI Pooling layer which consists of an SPP layer with a unique pyramid levelcompatible with the net’s first fully connected layer. Furthermore, a more intelligent fine-tuningalgorithm is proposed to overcome the constraint of SPP-net relative to the update of the layerspreceding the SPP one – in this case, ROI Pooling. This exploits feature sharing during trainingto use more than one ROI per image in each mini-batch, thus significantly reducing the trainingtime.
Ablation Studies:Ablation experiments are particularly interesting and highlight key properties of convo-
lutional neural networks. The scale-invariance property has been examined in detail andexperiments have preferred a ROI Pooling based architecture compared to the previous onebased on Spatial Pyramid Pooling, arguing that deep convolutional neural networks directlylearn scale invariance. Further studies on fine-tuning of deep convolutional neural networks(in this case VGG16 [65]) have shown that to obtain good results from the approach it ispreferable to extend the range of the layers involved in training. Also other studies show thatmulti-task training has the potential to improve results through tasks mutual influence andthat SVMs do not outperform softmax classifier learnt with fine-tuning technique. Finally,further studies have highlighted the trade-off between precision and recall taking into accountthe generation of a defined number of region proposals.
3.2.4 Faster R-CNNThe optimization of the region-based approach evolved further in 2015 when Ren proposed avariant of the original algorithm capable of achieving almost real-time performance [59]. Theauthor declares a frame rate of 5 fps on GPU while achieving a mAP of 78.8% on PASCAL VOC

Chapter 3. Object Detection: State of the Art 31
Figure 3.10: Faster R-CNN architecture [59, 39].
2007 [16] dataset using as a convolutional backbone VGG16 [65] demonstrating the validity of theapproach also in the case of deep convolutional backbones.Faster R-CNN introduces the RPN – Region Proposal Network – to optimize the speed of region
proposals generation that, previously based on Selective Search, had become the main bottleneckof Fast R-CNN. RPN is a Fully Convolutional Network (FCN) that generates cost-free regionproposals through convolutional features sharing with the on-top detector. This can be optimizedthrough multi-task loss on end-to-end training and predicts region proposals with a variety of scalesand aspect ratios using the concept of anchor boxes. In particular, to generate region proposals, asliding window on top of the convolutional feature map output of the last backbone convolutionallayer is used. The sliding window is connected to the fully connected layers used respectively forbounding box regression and class-generic object classification that predict 4k boxes and 2k scores(object vs non-object) with k number of anchors boxes. Subsequently, the non maxima suppressionis used to remove boxes that overlap with other boxes that exhibit higher scores. The remainingregions are then propagated through the class-specific detection phase that exploits the originalFast R-CNN detector. The training phase, although end-to-end, optimizes separately the RPN andthe subsequent detector or jointly in an approximate way in the case a fine-tuning is performedwith the underlying convolutional backbone.
Ablation Studies:Ablation studies emphasize above all the importance of the RPN. The preferred number
of scales and aspect ratios is determined through grid search by opting for 3 distinct scales{1282, 2562, 5122} and aspect ratios {2:1, 1:1, 1:2}. The scalability of the approach is under-lined in case the backbone is constituted by a very deep convolutional neural network. Thevalidity of the approach two-stage proposals and detection is confirmed with respect to thecase single stage detection where the RPN is used to make class-specific inferences arguing infavor of the double-stage case for faster inferences and better accuracy. Finally, further studies
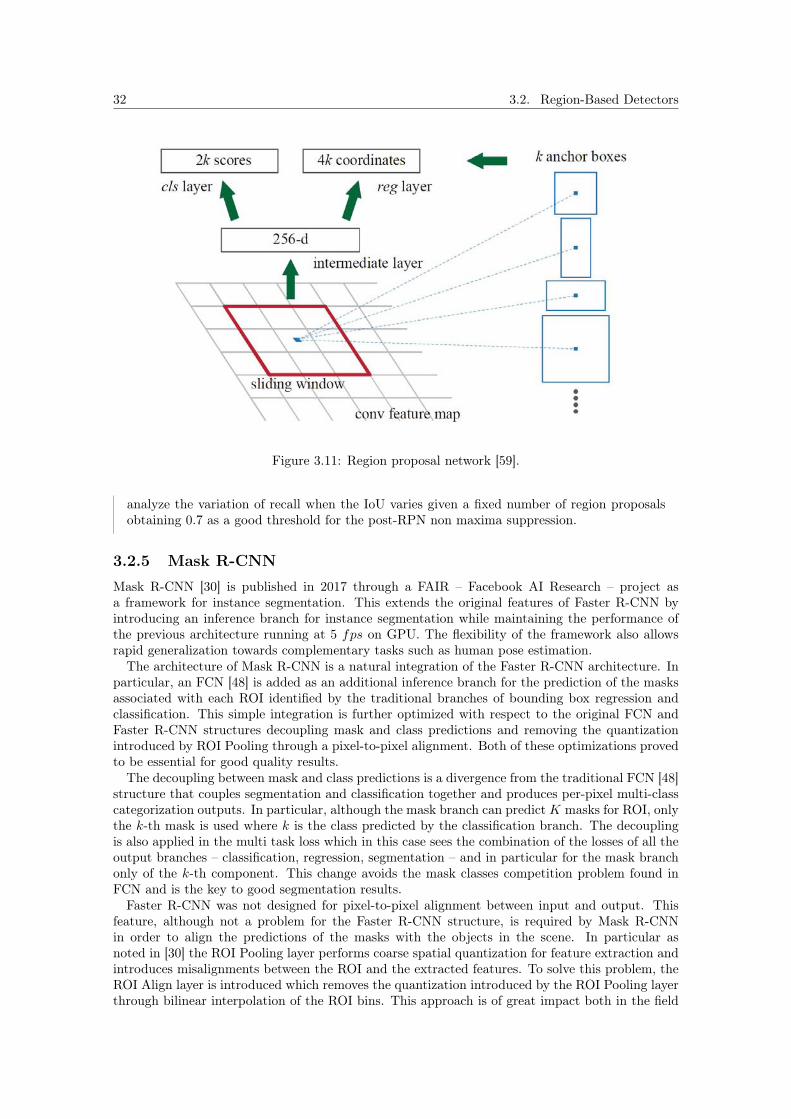
32 3.2. Region-Based Detectors
Figure 3.11: Region proposal network [59].
analyze the variation of recall when the IoU varies given a fixed number of region proposalsobtaining 0.7 as a good threshold for the post-RPN non maxima suppression.
3.2.5 Mask R-CNN
Mask R-CNN [30] is published in 2017 through a FAIR – Facebook AI Research – project asa framework for instance segmentation. This extends the original features of Faster R-CNN byintroducing an inference branch for instance segmentation while maintaining the performance ofthe previous architecture running at 5 fps on GPU. The flexibility of the framework also allowsrapid generalization towards complementary tasks such as human pose estimation.The architecture of Mask R-CNN is a natural integration of the Faster R-CNN architecture. In
particular, an FCN [48] is added as an additional inference branch for the prediction of the masksassociated with each ROI identified by the traditional branches of bounding box regression andclassification. This simple integration is further optimized with respect to the original FCN andFaster R-CNN structures decoupling mask and class predictions and removing the quantizationintroduced by ROI Pooling through a pixel-to-pixel alignment. Both of these optimizations provedto be essential for good quality results.The decoupling between mask and class predictions is a divergence from the traditional FCN [48]
structure that couples segmentation and classification together and produces per-pixel multi-classcategorization outputs. In particular, although the mask branch can predictK masks for ROI, onlythe k-th mask is used where k is the class predicted by the classification branch. The decouplingis also applied in the multi task loss which in this case sees the combination of the losses of all theoutput branches – classification, regression, segmentation – and in particular for the mask branchonly of the k-th component. This change avoids the mask classes competition problem found inFCN and is the key to good segmentation results.Faster R-CNN was not designed for pixel-to-pixel alignment between input and output. This
feature, although not a problem for the Faster R-CNN structure, is required by Mask R-CNNin order to align the predictions of the masks with the objects in the scene. In particular asnoted in [30] the ROI Pooling layer performs coarse spatial quantization for feature extraction andintroduces misalignments between the ROI and the extracted features. To solve this problem, theROI Align layer is introduced which removes the quantization introduced by the ROI Pooling layerthrough bilinear interpolation of the ROI bins. This approach is of great impact both in the field

Chapter 3. Object Detection: State of the Art 33
Figure 3.12: Mask R-CNN architecture [30, 39].
of instance segmentation and object detection.
Ablation Studies:Ablation experiments demonstrate the validity of the Mask R-CNN approach both in the
instance segmentation and in the object detection landscapes.The performances of the framework are studied with different network topologies both for
the backbone and the head. For the backbone, the effects of deep network topologies suchas ResNet [29] and ResNeXt [77] at depth 50 and 101, as well as the FPN [44] topology arestudied. The latter approach is a top down architecture with lateral connections that aimsto build high-level semantic features at different scales. For the head, the framework rely onprevious works that aims to integrate ResNets [29] and FPN [44] backbones on the originalFaster R-CNN architecture [29, 44].Other studies investigate the effects of multinomial and independent masks as well as class-
specific and class-agnostic masks further supporting the mask and class decoupling approach[30]. The changes in performance introduced by the ROI Align layer were examined in detailtoo, confirming the positive effects introduced by ROI Align both in the instance segmentationand in the object detection field.
Mask R-CNN is a general purpose modular framework [30] that outperforms all existing, single-model entries on every task of the COCO 2016 [46] challenges, including instance segmentation,bounding box object detection and person keypoint detection. The framework can be easily ex-tended to tasks different than instance segmentation as human pose estimation and represents anexcellent baseline for research and industrial projects.
3.3 Single-Stage Detectors
Single-stage detectors simplify the object detection problem, originally conceived in a double-stageway by region-based detectors, revisiting it in a regression fashion. Pipeline simplification meansfaster inference but less accurate results than region-based approaches. These considerations havebeen confirmed by experimental results in many works [32] but recently further optimizations havebeen proposed that have challenged previous works [45].The main single-stage architectures are YOLO – You Only Look Once – revisited in three
different versions [58, 56, 57] and SSD – Single Shot multibox Detector [47]. Below we will brieflyintroduce the main features of the two architectures.
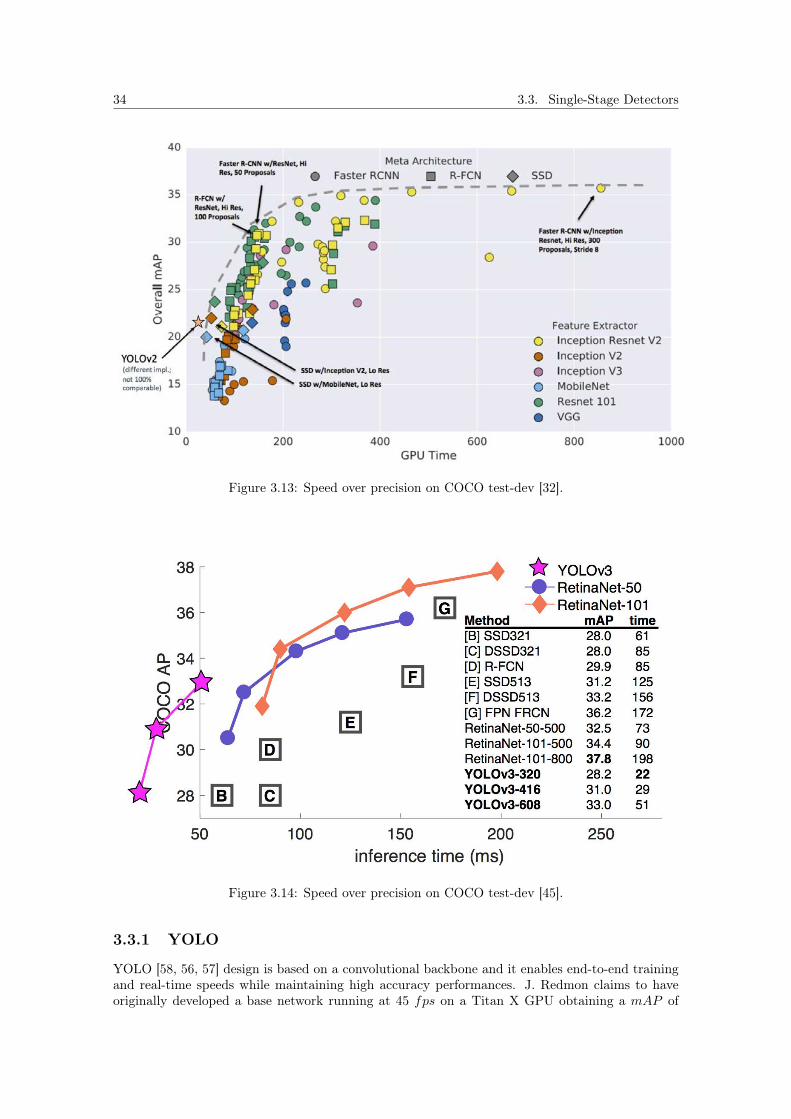
34 3.3. Single-Stage Detectors
Figure 3.13: Speed over precision on COCO test-dev [32].
Figure 3.14: Speed over precision on COCO test-dev [45].
3.3.1 YOLO
YOLO [58, 56, 57] design is based on a convolutional backbone and it enables end-to-end trainingand real-time speeds while maintaining high accuracy performances. J. Redmon claims to haveoriginally developed a base network running at 45 fps on a Titan X GPU obtaining a mAP of

Chapter 3. Object Detection: State of the Art 35
Figure 3.15: YOLO pipeline [58, 56, 57].
63.4% on the PASCAL VOC 2007 [16] dataset and a faster network exceeding 150 fps with amAP of 52.7% [58]. Subsequent optimization have further developed the architecture by obtaininga trade-off between speed, precision and recall [56, 57].Differently from region-based approaches, YOLO reasons globally on an image when making
predictions. The original inference pipeline is described below.
• resize the input image and divide it into an S × S grid.
• for each cell predict C class probabilities and B bounding boxes each with 5 predictions: theROI constraints and a confidence prediction that represents the IoU between the predictedbox and any ground truth box.
• multiply the conditional class probabilities and the individual box confidence predictions toencode the class probability map.
• aggregate the final results through non maxima suppression over the class probability map.
Although very elaborate, the original YOLO architecture imposes strong spatial constraints onbounding box predictions that limits the number of nearby objects that the model can predict. Infact, one of the main issues of YOLO is the accurate detection of small objects in groups. Thisgenerally involves low recall compared to region-based approaches.Successive optimizations [56, 57] succeeded in mitigating the negative effects of the original
architecture. A trade-off between speed and inference has been obtained by introducing a custombackbone called Darknet, predictions at different scales and aspect ratios, and an alternative lossfunction which gives greater weight to the contributions of small-sized objects.
3.3.2 SSD
Single Shot multibox Detector [47] is a single-stage detector that is designed to achieve real-timeperformance and high accuracy inferences. The authors claim to have developed an architecture
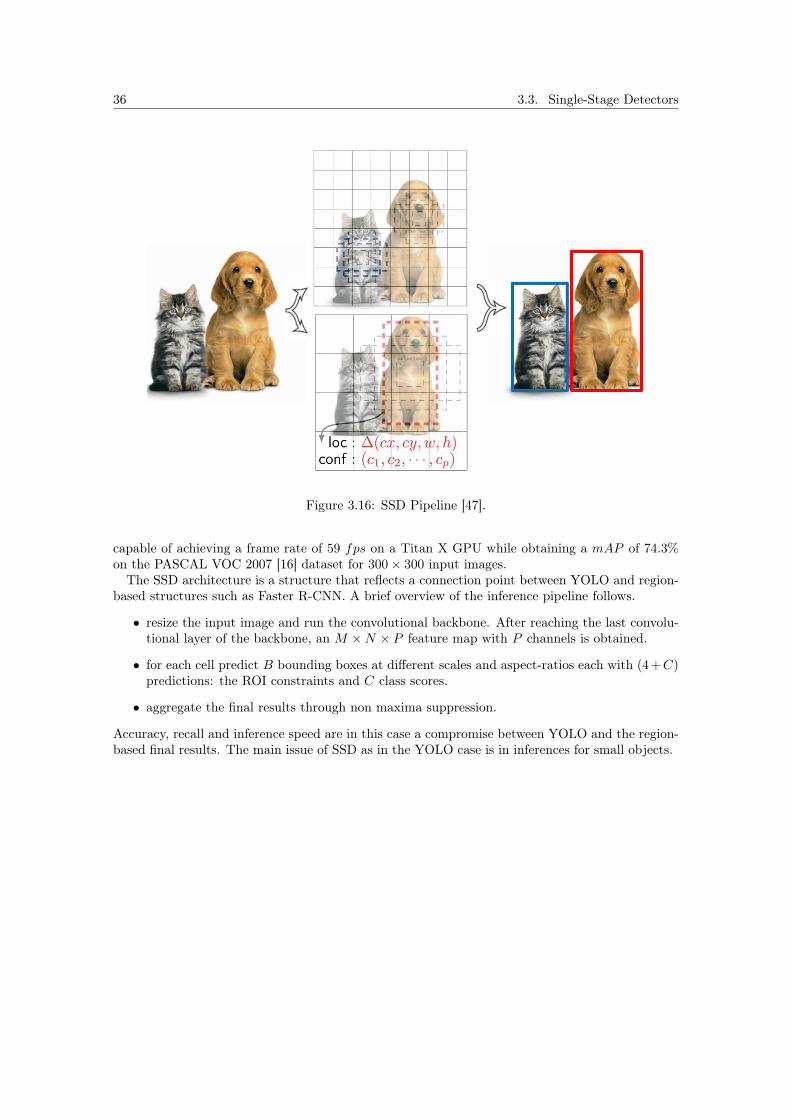
36 3.3. Single-Stage Detectors
Figure 3.16: SSD Pipeline [47].
capable of achieving a frame rate of 59 fps on a Titan X GPU while obtaining a mAP of 74.3%on the PASCAL VOC 2007 [16] dataset for 300× 300 input images.
The SSD architecture is a structure that reflects a connection point between YOLO and region-based structures such as Faster R-CNN. A brief overview of the inference pipeline follows.
• resize the input image and run the convolutional backbone. After reaching the last convolu-tional layer of the backbone, an M ×N × P feature map with P channels is obtained.
• for each cell predict B bounding boxes at different scales and aspect-ratios each with (4+C)predictions: the ROI constraints and C class scores.
• aggregate the final results through non maxima suppression.
Accuracy, recall and inference speed are in this case a compromise between YOLO and the region-based final results. The main issue of SSD as in the YOLO case is in inferences for small objects.

Chapter 4
Design
Recently, automated retail systems have been proposed with cross-cutting approaches in systemsintegration, process automation and big data analytics. In this context, modern deep learningtechniques play a key role in the design of innovative systems according to a data-driven approach.Following are presented all the design phases that have defined the development of the retail shelfanalytics system for the Customer. The system model aims to analyze images and data from theCustomer’s management processes in order to provide business intelligence services in a systemintegration fashion between Customer and Supplier architectures. Recent developments in theinstance segmentation field described in the previous chapters will be exploited in order to designa system for the analysis of products on store shelves.The chapter is organized as follows. The development of the retail shelf analytics system will
be discussed in all the design phases from the requirements analysis to the final implementation ofthe system architecture. The privacy of the Customer will be maintained by obscuring sensitiveinformation. Software and configuration issues will not be treated, but these have made up muchof the work in terms of integration between Customer and Supplier IT systems.
4.1 Requirements Analysis
The following is a standard-compliant requirements analysis based on official documentation. Theexisting system, functional and non-functional requirements and architectural constraints will beanalyzed in detail, while maintaining the privacy of the Supplier and the Customer.
4.1.1 Objectives and Description of the System
The purpose of this project is the design of a Proof Of Concept (POC) that integrates an existingretail system analytics architecture with advanced analytics functionalities based on deep learning.The project is defined in terms of end-to-end integration with the business activities of the Cus-tomer. The Customer has a relevant presence in national pharmacies. The operations that affectthis business activity are many and aim to propose, through agents and merchandisers, commercialpromotions targeting certain topics, such as oral health, intimate wellness, and pain relief. Cur-rently there is an activity on the Customer side that aims to provide business intelligence servicesthrough a SAP Customer Relationship Management (CRM) system. This system develops a wholeseries of KPIs based on data entered by the agents. These data, in the development scenario of ourwork, aim to describe the set-up activities within the pharmacy chain. Other intelligence activitiesbased on other types of data such as revenue and other economic indicators are currently presentbut will not be treated for privacy reasons.The data currently present in the intelligence process considered are structured (database entries)
and unstructured (images and text). At each visit that an agent or merchandiser performs in apharmacy, he/she is required to fill in a questionnaire related to the campaign and/or shoot asequence of images related to the promotional activity carried out in the pharmacy. The images,
37
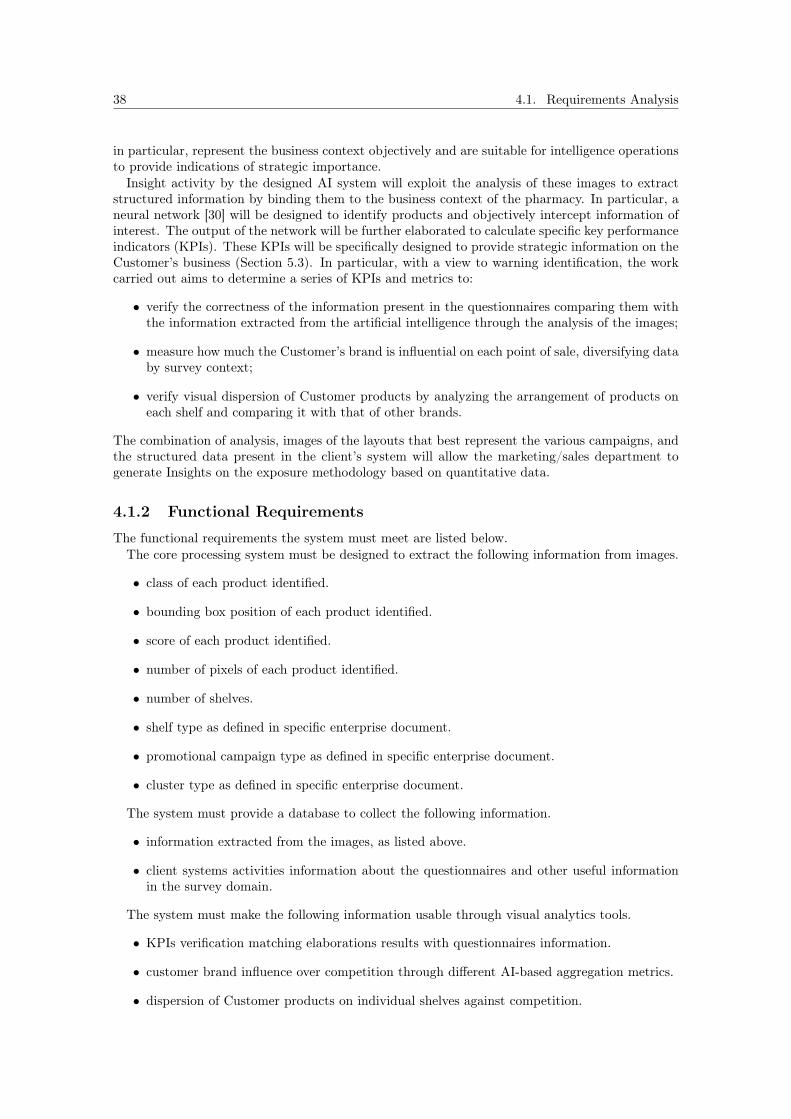
38 4.1. Requirements Analysis
in particular, represent the business context objectively and are suitable for intelligence operationsto provide indications of strategic importance.Insight activity by the designed AI system will exploit the analysis of these images to extract
structured information by binding them to the business context of the pharmacy. In particular, aneural network [30] will be designed to identify products and objectively intercept information ofinterest. The output of the network will be further elaborated to calculate specific key performanceindicators (KPIs). These KPIs will be specifically designed to provide strategic information on theCustomer’s business (Section 5.3). In particular, with a view to warning identification, the workcarried out aims to determine a series of KPIs and metrics to:
• verify the correctness of the information present in the questionnaires comparing them withthe information extracted from the artificial intelligence through the analysis of the images;
• measure how much the Customer’s brand is influential on each point of sale, diversifying databy survey context;
• verify visual dispersion of Customer products by analyzing the arrangement of products oneach shelf and comparing it with that of other brands.
The combination of analysis, images of the layouts that best represent the various campaigns, andthe structured data present in the client’s system will allow the marketing/sales department togenerate Insights on the exposure methodology based on quantitative data.
4.1.2 Functional Requirements
The functional requirements the system must meet are listed below.The core processing system must be designed to extract the following information from images.
• class of each product identified.
• bounding box position of each product identified.
• score of each product identified.
• number of pixels of each product identified.
• number of shelves.
• shelf type as defined in specific enterprise document.
• promotional campaign type as defined in specific enterprise document.
• cluster type as defined in specific enterprise document.
The system must provide a database to collect the following information.
• information extracted from the images, as listed above.
• client systems activities information about the questionnaires and other useful informationin the survey domain.
The system must make the following information usable through visual analytics tools.
• KPIs verification matching elaborations results with questionnaires information.
• customer brand influence over competition through different AI-based aggregation metrics.
• dispersion of Customer products on individual shelves against competition.

Chapter 4. Design 39
Entity Description Attributes
Task Single activity of the Customer system that in our domainof interest, it constitutes the set of activities of Merchan-disers and Agents for the operations on in-store products
Task ID, SubTask ID, Task De-scription, Task Date
Task Type Customer’s Task Type TaskType ID, TaskType De-scription
Client Pharmacies selling products of Customer Client ID, Client Name, Loca-tion, Province
Survey Questionnaire related to Customer activities Survey ID, Survey DescriptionQuestion Question in the Survey Question ID, Question Descrip-
tionAnswer Question’s Answer Answer ID, Answer DescriptionPicture Image taken in the single Task Picture ID, Picture PathMetrics Metrics calculated on the single Picture Shelves Number, Cluster, Shelf
Type, Promotional CampaignObject Object identified in the Picture Object ID, Class, Score, Top,
Left, Width, Height, PixelsNumber, Shelf
Table 4.1: Data dictionary – entity table.
4.1.3 Non-Functional RequirementsThe non-functional requirements are described below.
• the system must perform the operations completely into the Supplier company’s systemsreplicating Customer data if necessary.
• the system must be designed to provide a daily computation run to process the new dataentered into the system in batch.
4.1.4 ConstraintsThe main constraints of the system follow.
• the system must be delivered in six months.
• the core processing engine must be based on TensorFlow.
• the system must be integrated into the Supplier’s SAP systems.
• the results produced by the system must be accessible in the cloud through SAC – SAPAnalytics Cloud.
4.2 Data Logic
The following is a brief summary of the data layer on which the existing system is integrated. Asagreed, only aspects related to the domain of interest will be treated, maintaining anonymity andconfidentiality on the overall system.
4.2.1 Entity-Relationship SchemaThe ER Schema represents the mini-world of interest. We can define in detail the key entities thatconstitute our model and how they interact with one another.In particular, we can observe that the main entity is the Task. This constitutes the set of
activities of the Customer system that in our domain of interest are related to the activities ofpreparation and maintenance of store shelves by agents and merchandisers. The Task is associatedwith a Task Type, an end Client and a set of Pictures and Surveys. We have emphasized with

40 4.3. Presentation Logic
Figure 4.1: Entity-Relationship schema.
different shades the entities and relationships that respectively involve the Surveys and the Picturesassociated with each Task. The Pictures are characterized by a set of attributes that specify theKPIs identified by the AI algorithm in terms of Shelf Type, Promotional Campaign, Cluster andShelf Number as previously established. A further entity connected to these constitutes the set ofObjects identified by the algorithm in each Picture, characterized in terms of Class, Score, Top,Left, Width, Height, Pixels Number and Shelf. The Survey is linked to the Questions that defineit while the latter are associated with the Answers.
4.3 Presentation Logic
The development of the presentation logic starts from the requirements analysis and defines thefunctionality of the graphic objects and how these interact to guarantee the services that the systemintends to make available to the Customer. The front-end follows with the mock-ups.
4.3.1 Mock-Ups
Mock-ups map user interaction in the various application screens. Specific models have beenconstructed to define the services associated with each screen. Below are just some of the basicmodels, while the final models will be discussed in more detail in Section 5.3. The proposed mock-ups follow a basic template consisting of a page filter and the associated graphic objects. Usingthe page filter it is possible to filter the results for the specific KPIs selected. The user interfaceis dynamically transformed according to the selected KPIs proposing customized display modes inreal time according to the needs of the Customer.The first mock-up proposes the representation of the presence of Customer products in pharma-
cies according to various aggregation methods. Presence will be defined in terms of the numberof products and the number of pixels. The aggregation methods used will instead investigate the

Chapter 4. Design 41
Figure 4.2: Mock-up – Product insights in stores.
Figure 4.3: Mock-up – Product positioning on shelves.
previously defined metrics in terms of Installation Type, Promotional Campaign and Cluster ac-cording to previously approved document. The results will be proposed through stacked bar plotsand it will be possible to analyze in detail each single component with a simple click. The graphswill be dynamically transformed depending on the KPIs selected in the page filter.
The second mock-up represents the positioning of products on individual shelves in the complexof pharmacies analyzed. This allows to define in terms of Installation Type, Promotional Campaign,Cluster and in the global complex the influence of the Customer’s brand with respect to competitorsthrough an heat map representation. The variation of colors in the heat map allows to analyticallyvisualize in which shelves the various products are concentrated and check if this complies withthe official agreements. Also in this case the results will be displayed dynamically depending onthe status of the page filter.
4.4 Business Logic
A privacy-compliant description of the business logic follows. A brief overview of the Supplier andCustomer IT systems will be presented. Then, the algorithmic implementation will be described.

42 4.4. Business Logic
Figure 4.4: Business logic – Model view controller.
4.4.1 System Overview
The main entities in the system are the Customer and Supplier IT systems. These are based onSAP software products that expose multiple services through an MVC logic.The Customer infrastructure is based on SAP CRM, which allows to manage the user experi-
ence at the sales, marketing, customer service and digital commerce activities levels. This productspecifically tracks the way in which businesses interact with customers with analytics, e-commerceand social media tools. This architecture hosts the intelligence data in the form of KPIs, question-naires and images that will be processed by the Supplier system. Data will be processed daily bythe Supplier system in a synchronized way through a data flow between the two systems.The Supplier system is also integrated in a SAP solution. In particular, in our domain of
interest while originally it used two core products of the suite respectively for database managementsystems and analytics, actually due to some performance constraints on the Supplier server side, thedatabase relies on Microsoft technology. Intermediate solutions based on MySQL have also beendeveloped but being based on open-source technology they have not been formally approved byCustomer and it has been necessary to redesign the database according to a commercial alternative.Because of this limitation, the data layer is currently based on Microsoft SQL Server but accordingto the original proposal it is already planned to migrate it to a SAP HANA system when theSupplier systems will return to the original configuration. This system is particularly performing asit consists of an in-memory database optimized for high performance computing. At the applicationlevel, instead, SAP Analytics Cloud (SAC) is used with a front-end logic to provide interactiveresults in cloud based on the associated data layer. The product provides finance, HR, operations,sales and marketing solutions and is particularly useful as a centralized storytelling tool.The software architecture is integrated into IT Supplier systems and is based on TensorFlow
[51]. In particular, there is an open-source library stack on which the Supplier software leans.Object detection APIs [32] are used as an abstraction layer to create deep learning models ableto locate and identify multiple objects in images. The COCO APIs [46] are instead a supportpackage to load, parse, and visualize COCO-like annotations to images. These are a de factostandard because the COCO dataset is used for the most popular challenges in the field of objectdetection, instance segmentation and Keypoints Detection. On top of COCO APIs, we integratedan open-source implementation [1] of the Mask R-CNN [30] algorithm. The code has been released
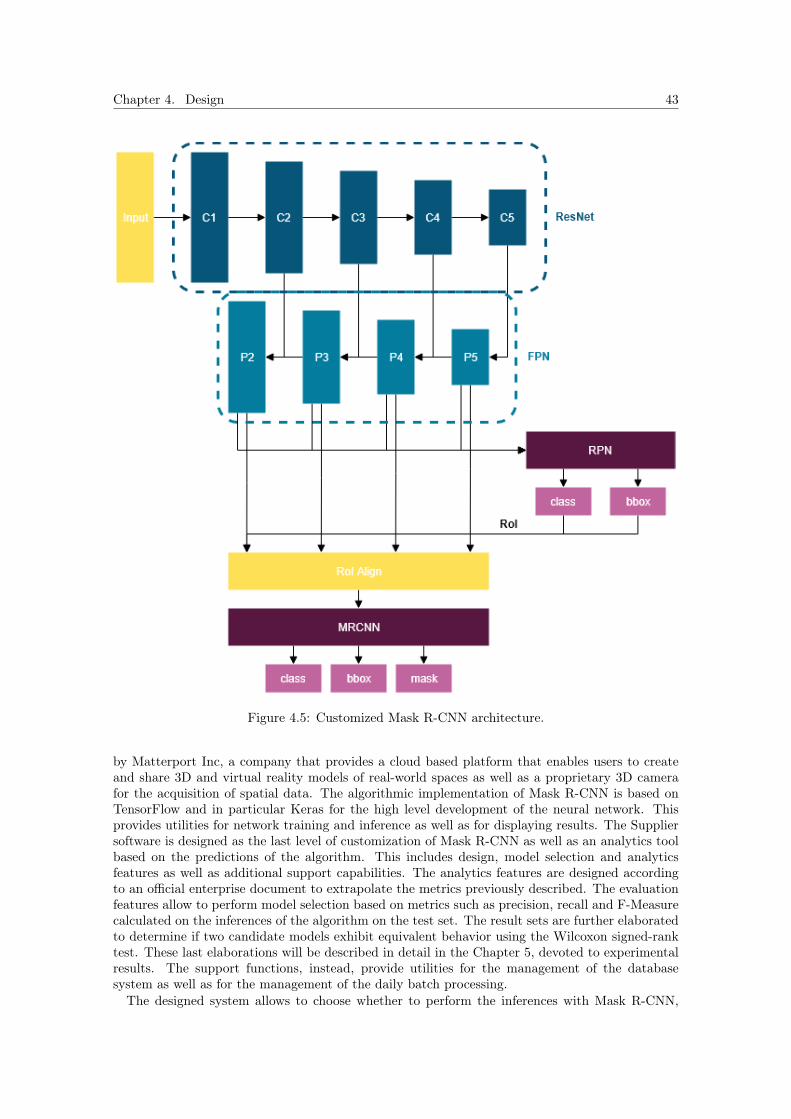
Chapter 4. Design 43
Figure 4.5: Customized Mask R-CNN architecture.
by Matterport Inc, a company that provides a cloud based platform that enables users to createand share 3D and virtual reality models of real-world spaces as well as a proprietary 3D camerafor the acquisition of spatial data. The algorithmic implementation of Mask R-CNN is based onTensorFlow and in particular Keras for the high level development of the neural network. Thisprovides utilities for network training and inference as well as for displaying results. The Suppliersoftware is designed as the last level of customization of Mask R-CNN as well as an analytics toolbased on the predictions of the algorithm. This includes design, model selection and analyticsfeatures as well as additional support capabilities. The analytics features are designed accordingto an official enterprise document to extrapolate the metrics previously described. The evaluationfeatures allow to perform model selection based on metrics such as precision, recall and F-Measurecalculated on the inferences of the algorithm on the test set. The result sets are further elaboratedto determine if two candidate models exhibit equivalent behavior using the Wilcoxon signed-ranktest. These last elaborations will be described in detail in the Chapter 5, devoted to experimentalresults. The support functions, instead, provide utilities for the management of the databasesystem as well as for the management of the daily batch processing.The designed system allows to choose whether to perform the inferences with Mask R-CNN,

44 4.5. Dataset Creation
Figure 4.6: Deep learning brand recognition pipeline.
to recognize generic or specific products superclasses, or to use a double-stage brand detector toobtain a greater level of detail. Mask R-CNN [30] has been customized to the task of interestthrough an optimized network configuration. Specific experimental tests have been designed tofine-tune the network and will be described in the related sections. The final network configurationincludes a ResNet-50 [29] convolutional backbone with an FPN [44] topology. Many of the RPN[59] configuration parameters such as anchor scales and anchor ratios as well as the non-maximasuppression threshold have been determined by model selection or visual analytics in order tomaximize precision, recall or F-measure calculated over the whole test set. On top of Mask R-CNN, a brand detector similar in spirit to the one of Tonioni [71] has been implemented. Thisexploits the KNN [12] algorithm to classify the objects identified by Mask R-CNN at the brandlevel through a feature extractor based on VGG16 [65]. In particular, the regions extracted byMask R-CNN are sent to VGG16 which extracts the features. These are compared with theproducts features previously extracted by VGG16 in a query dataset through the KNN algorithm.This solution is currently in prototype form but some results will be presented in the Chapter 5.In particular, the detector allows us to abstract the retail context and classify different productswithout having to own a specialized dataset with the annotations of the various classes. This resultcan indeed be obtained by having a unique dataset with annotations related to the recognition ofa generic product superclass accompanied by a query dataset of reduced dimensions of images ofreal products from the Customer catalog to be recognized. Given the reduced number of images inthe Ad-Hoc dataset, this approach is currently the only one that can classify objects at the brandlevel in the Customer business domain.
4.5 Dataset Creation
The creation of the dataset is a central problem in supervised learning and in particular in thetraining of modern neural networks [39, 55]. Currently it is possible to take advantage of different

Chapter 4. Design 45
Figure 4.7: Ad-Hoc dataset customer product histogram.
strategies to reduce the number of necessary annotations. Among these, transfer learning [78]is undoubtedly the main development tool that allows to reduce both annotations and trainingtime considerably. However, especially for neural networks the number of necessary annotationsremains high and other directions such as weak supervision, data augmentation and synthetic dataconstitute a very active research field to further optimize training performance.In parallel to the study of modern techniques able to optimize training, new services and spe-
cialized companies in dataset creation are developed on the business side. Amazon MechanicalTurk (MTurk) [6], in particular, is a marketplace for strategic outsourcing of business processesbased on task crowdsourcing on a distributed workforce around the world. This allows to delegatesimple time-consuming tasks to a specialized workforce, considerably reducing time with low costs.MTurk is one of the main tools used by data scientists to obtain annotations on training data ina short time. The annotations are then evaluated on job quality metrics in order to rule out anyerrors due to possible workers distraction [37].The creation of the dataset in the Customer scenario has been particularly critical given the
impossibility to use services such as MTurk for privacy issues on Customer data. In particular, theconstruction of the dataset has been an iterative process where a lot of energy has been investedand several experimental tests have been carried out to evaluate various alternatives (Subsection5.2.2). Attempts have been made to automate the annotation process but proved to be inadequate.In particular, as described in Section 1.1, it was not possible to use the annotations from otherretail datasets to obtain a suboptimal solution since the latter targeted different scenarios. Otherattempts at automation have been implemented in terms of weak supervision, but even these havenot proved to be optimal. The Ad-Hoc dataset is therefore currently the only resource availablefor training the neural networks on the Customer business processes.In addition to the automation tests (Chapter 5) of the dataset annotation process, the main
activity, given the previous premises and the peculiarity of the type of application, involved themanual annotation of the images coming from the Customer’s business processes. This has been agreat investment both in terms of time and energies given that to label all the pixels of every single

46 4.5. Dataset Creation
image, considering the high number of items present in the images (157 in mean) and the type ofannotation (pixel-wise) an average of 30 minutes has been spent on each image. Moreover, otherepisodes related to the main consultancy activity with Customer have further delayed the processgiven the impossibility of initially having the requested images. While respecting the privacyrestrictions with Supplier and Customer, and wishing to maintain confidentiality, these sensitivedetails will not be treated, but giving an hint, it is possible to say that a lot of time has beeninvested also in the relations with the different Customer entities in order to obtain good qualityimages. In fact, since initially the images that Customer had provided were not considered adequategiven the poor quality as well as sometimes the absence of the pharmaceutical background, newones have been required to meet these limitations.Currently the Customer dataset consists of both types: low resolution images (not labeled) and
high resolution images (labeled). The former are the most consistent part of the dataset but giventhe previous limitations have not yet been directly used. Some of the experiments presented inChapter 5 will try to define a trade-off between the performance of the algorithm inferences and thequality of the images used for the training and the test. As for the good quality image pool, theseare currently the only ones used for the training of Mask R-CNN [30]. Currently, as anticipatedin Chapter 1, the main dataset (good quality images) consists of 410 images. For model selectionpurposes this dataset has been further divided into a 300-image training set and a test set with 110images. Considering the total size of the good quality image pool conferred by Customer (550), ithas been decided to keep the test set of 110 images to make all the results comparable as a resultof possible future extensions of the training set. The latter, currently composed of 300 images,may in future be extended by the remaining 140 non-annotated images for a total of 440 images.As we can see from Figure 4.7, the overall dataset is made up of 8 different classes of Customerproducts to which a class of competitors products (not shown) is added. The distribution of theproducts is clearly unbalanced with respect to the products A and B which constitute the core ofthe Customer business as we will discuss in Section 5.3. However, although this imbalance does notallow to obtain statistically significant results for each case, all the products have been consideredequally in the final analysis.In addition to manual labeling, given the great amount of work necessary to annotate all the
images, the design phase of the dataset also involved other activities for selecting the annotationtools that are preferable for a fast construction of the dataset. The annotation tools availableonline are various, some available open-source and others based on proprietary license. As for thespecific tools that can annotate the main applications of object detection presented in Chapter3, these are able to label images for tasks such as image classification, object detection, semanticsegmentation, instance segmentation and others. Furthermore, the variability of the tool is alsogiven by the different methods able to obtain the same annotations output. In particular, as regardsthe landscape of the semantic segmentation and instance segmentation given the peculiarity of thefields, there are currently 3 different types of tool available. Specifically for pixel-wise labeling,there are tools that take advantage of geometric segmentations [15], tools that take advantage ofthe watershed algorithm [3] and more modern tools that use neural network models [2] to returnthe final annotations once again in the form of geometric segmentations. Given the peculiarity ofthe business domain studied and being that all the products for which Customer has requestedidentification are based on a rectangular form, among all the available open-source tools, VIA[15] has been chosen to obtain instance segmentation annotations starting from geometric imagessegmentations. Having made tests (not reported) to monitor the annotation time with each toolavailable, VIA has been chosen using as a selection criterion as well as the quality of the annotations,the reduced effort in terms of time compared to the remaining tools. In particular, although theother tools allowed to obtain very precise annotations, much effort have been necessary in thefinal manual remodeling of the annotations starting from the inferences of the core algorithms. Asfor the tool based on neural networks, although it has been very promising, it presented the sameproblem due to the manual remodeling of the annotations following the inferences of the algorithm.In this case, higher performances could be obtained following a fine-tuning of the model based onRecurrent Neural Networks (RNN) but not having at the time available an adequate number ofimages initially for model training, the VIA tool has been preferred.

Chapter 5
Experimental Results
Experimental evaluation is the main tool for model performance benchmarking. This is usedin the main object detection international challenges to reward the most innovative solutions.Experimental evaluation makes it possible both to confirm theoretical properties and to give anexperimental value to properties for whom it is not possible to reach a formal demonstration. Themost innovative research projects exploit experimental evaluation techniques to improve the stateof the art and reach higher performance standards.This chapter will cover the following topics. First of all, an introduction to the main object
detection experimental evaluation techniques with reference to the Customer use-case will be pre-sented. Then, the experimental tests that helped determine the final network architecture will bediscussed. These will cover the attempts to automate the manual labeling process of the dataset,the fine-tuning of the network and the final configurations. Other tests in line with the optimizationof the training time and the Customer data analytics investigate the effects of the training configu-rations and the resolution of images on final performances. Finally, the main business intelligenceand visualization results obtained on the Customer data will be presented.
5.1 Experimental Evaluation
The basis of the experimental evaluation were developed in the Information Retrieval field throughthe famous Cranfield paradigm, in the years 1958-1966 [8, 9]. This discipline studies the effective-ness measures and the experimental tests that allow to determine how a system behaves accordingto the different information retrieval situations in which it could be used [27]. With these tests it istherefore possible to evaluate the performances of the models and to make a selection to determinethe best solution in the development scenario. In particular, starting from a corpus of items calledpool it is possible to evaluate the output of the retrieval system called run, on the basis of thecontingency table through the following measures.
Precision. Indicates how many relevant documents have been retrieved in response to a querycompared to all those retrieved:
Precision =TP
TP + FP.
Recall. Indicates how many relevant documents have been retrieved in response to a query com-pared to all the relevant ones in the collection:
Recall =TP
TP + FN.
F-Measure (F1). The harmonic mean of Precision and Recall:
F1 = 2 · Precision ·RecallPrecision+Recall
.
47

48 5.1. Experimental Evaluation
Relevant Not Relevant
Retrieved True Positive – TP False Positive – FPNot Retrieved False Negative – FN True Negative – TN
Table 5.1: Contingency table.
Based on such measures, it is possible to define further metrics.
Average Precision (AP ). Indicates a global precision measure of the run in output from thesystem. It can be calculated as the average of all the precision values defined on the run oras the average of the precision values interpolated to fixed cut-off levels:
AP =1
N·
N∑i=0
Precisioni.
Mean Average Precision (mAP ). It is the average on all APs calculated for each topic in thecollection:
mAP =1
|T |·∑t∈T
APt.
The metrics defined above are the main model evaluation tool in the information retrieval fieldbut many other metrics can be used concurrently with the former to further deepen the analysistowards adjacent survey areas. These are generally contextualized in a specific evaluation pipelinedepending on the considered use-case. Below we will discuss the main model evaluation pipelinein the object detection field.
5.1.1 Experimental Evaluation in Object Detection
Experimental evaluation can be easily extended in other investigation dimensions. In particular, inthe object detection field, it is also necessary to contextualize these metrics based on the predictionsof the models [39]. Precision, Recall, F-Measure and aggregated metrics are in fact defined incompliance with a further metric called IoU – Intersection over Union – of how much two boundingboxes or masks are overlapping. Specifically, in most of the cases in literature, the best model isselected through an average precision measure according to a previously defined intersection overunion threshold – mAP@IoU .
Intersection over Union (IoU). Given a ground truth bounding box Bgt and a predicted oneBp the IoU indicates the ratio between the overlapping area of the boxes and the sum of theareas of the boxes:
IoU =area(Bp ∩Bgt)
area(Bp ∪Bgt).
The effects of the latter threshold in particular are studied differently depending on the context ofinternational challenge considered (e.g., PASCAL VOC [16], ILSVRC [62], Ms COCO [46]) sincedifferent challenges have different evaluation rules. In particular, while for PASCAL VOC considersas an evaluation metric mAP@IoU = 0.5, Ms COCO selects mAP@IoU = [0.5 : 0.95], where thelatter is an aggregated metric on different degrees of intersection over union. The evaluation stepsof a classic object detection challenge are therefore the following for every submitted model.
1. Model predictions are computed over a reference test set.
2. Predictions are sorted by decreasing confidence.

Chapter 5. Experimental Results 49
3. Predictions are assigned pairwise to the ground-truth items in the test set according to thefixed Intersection over Union threshold.
4. Given the IoU, AP is computed for each class.
5. Mean average precision is computed by averaging the APs of all classes on a target IoU.
6. Further context-specific metrics are eventually computed.
With reference to the last point, in the Customer use-case other metrics have been developed inorder to obtain a more detailed evaluation on target investigation areas. These include:
(Mean) Average Recall (mAR). Indicates a global recall measure of the run in output fromthe system. It can be calculated as the average of all the maximum recalls obtained for eachclass:
AR =N
maxi=0
Recalli mAR =1
|T |·∑t∈T
ARt.
(Mean) Average F-Measure (mAF1) Indicates a global F-Measure of the run in output fromthe system. It can be calculated as the F-Measure of the aggregated precision and recallmetrics:
mAF1 = 2 · mAP ·mARmAP +mAR
.
Wilcoxon signed rank. In terms of model selection, the Wilcoxon signed rank hypothesis testis an excellent tool for evaluating model performance. This is used as a non-parametrichypothesis test to compare the series of measurements in output from two different systems.In particular, this test is used in this context to determine whether or not model predictionscome from the same probability distribution.
Based on these metrics, it is possible to define the following extended evaluation pipeline in theCustomer use-case.
1. Model predictions are computed over a reference test set.
2. Mean average precision is computed by averaging the APs of all classes on a target IoU.
3. Mean average recall and mean average F-Measure are computed by averaging over all classeson a target IoU.
4. A final measure for mAP@@IoU = [0.5 : 0.95], mAR@IoU = [0.5 : 0.95] and mAF1@IoU =[0.5 : 0.95] is computed by aggregating the previous measures on a target IoU threshold set.
5. Wilcoxon Signed Rank test is used to evaluate the submitted model with a target one inorder to ensure that the predictions do not come from the same distribution.
In the following sections, the experimental evaluation of the models in the Customer scenariostarting from the previously defined pipeline will therefore integrate the metrics built ad-hoc tofine-tune the network architecture and determine the best model.
5.2 Experimental Tests
The experimental results are based on a specialized evaluation pipeline. This integrates the tradi-tional metrics calculated for the evaluation of object detection models with measures defined onthe target survey areas. The main results will be analyzed in detail below.

50 5.2. Experimental Tests
Detection Segmentation
Configuration Time mAP mAR mAF mAP mAR mAFSquare@1024 4.7 h 52.1% 35.8% 42.2% 52.1% 36.1% 42.6%Square@1792 13.0 h 57.4% 37.1% 45.0% 58.2% 38.2% 46.0%Crop@512 2.8 h 52.6% 41.3% 46.1% 53.7% 42.5% 47.3%Crop@1024 4.6 h 57.3% 40.3% 47.1% 58.8% 41.9% 48.8%
Table 5.2: Effects of different training configurations on final performances.
5.2.1 Training Configuration and Image Resolution
One of the main limitations of any system based on neural networks is training time [39]. This isa very strong constraint for experimental tests that have to explore a vast design space, which isalso the case for the system described in the Chapter 2. Training time optimization is currentlyan active research area and some progress on the hardware and software side has been made buta lot of work is still to be done. One of the main limitations to training time in the Customeruse-case in particular is due to the size of the images. The problem has been much studied in theliterature and in particular the use of high-resolution images during training is to be evaluatedcarefully, given that training times increase considerably. One of the objectives of this section is toinvestigate the effects of different training configurations in order to determine a preferential onefor the network training.Another aspect to consider for the training of neural networks, is the size of the training set
[39]. Taking as reference what is described in Section 2.3.3, and wanting to exploit the potentialof transfer learning [78] all following tests use the same neural network training configuration. Inparticular, as a training mode, a fine tuning has been chosen starting from a pre-trained modelof Mask R-CNN [30] with the weight of the last layer initially assigned randomly. This choicewas made considering respectively the reduced dimensions of the Ad-Hoc dataset and the littlesimilarity of the latter with the one used to train the pre-trained Mask R-CNN model (MicrosoftCOCO [46]).Since the dataset used for training (Section 4.5) is composed entirely of high-resolution images
with a view to optimization, we have monitored various training configurations. In particular,we compared the performance of various configurations to obtain a trade-off between accuracy ofinferences and training time while maintaining the comparability of the models. In the Matterport’simplementation [1] of the Mask R-CNN algorithm [30] there are two main training modes: Squareand Crop. In the first mode, the networks are trained by augmenting the input images so thatthey become square. In this case, an image is built so that the long side coincides with the originaldimension and the short side reaches the same dimension by zero padding. The Crop mode, onthe other hand, requires that the network receives in input a random crop of the original imagewith square dimensions. All images input to the network must have sizes multiple of 64 to meetthe requirement placed by the FPN [44]. Furthermore, all images must have the same dimensionswithin the same batch in training mode. The latter is an hyperparameter that regulates the numberof training samples used for the network training at each iteration of the stochastic gradient descentalgorithm [55, 39].For this test, the Square and Crop modes have been both analyzed, declaring strategic dimensions
for the data input to the network. In particular, the training predictions have been compared inSquare@1024 and Square@1792 modes with those in Crop@512 and Crop@1024 mode, where thesuffix indicates the dimensions of the image side in input to the network. The size of the inputimage side has been chosen by comparing the maximum value of the image side (i.e., 1792 for Squaremode) with lower values, multiples of 64, that are used most frequently for the convolutional neuralnetworks training in the computer vision field. The test has been carried out by training the modelsfor at least 150 epochs with a training set consisting of 50 manually annotated images. The finaltraining epoch has been controlled by a customized callback that extended the traditional earlystopping [55, 39] regularization tecnique through a moving average on the validation loss. Model

Chapter 5. Experimental Results 51
Detection Segmentation
Configuration mAP mAR mAF mAP mAR mAFSquare@640 53.7% 24.7% 33.7% 55.9% 26.8% 36.1%Pad64 57.3% 40.3% 47.1% 58.8% 41.9% 48.8%
Table 5.3: Effects of different image resolutions on final performances.
inferences have been evaluated on a test set of 110 manually annotated images. Being originallythe entire dataset consisting of 550 images (including 410 hand labeled and 140 not labeled), asingle test set of 110 images has been maintained, regardless of the number of images used in thedifferent subsets of the training set used to make all the results of the various tests comparable toeach other (Section 4.5).For the inferences, as previously, with respect to the Matterport’s implementation [1] of Mask
R-CNN [30], it is possible to exploit two types of configuration, Square and Pad64. Square modein inference works exactly like training and does not need further details. The Pad64 mode, on theother hand, evaluates the images in their original dimensions without any resize with the exceptionof a zero padding as long as the final dimensions are not multiple of 64. Square mode is used toevaluate the predictions of the models trained respectively in Square@1024 and Square@1792. Inthis way the images in input to the networks are placed in the same conditions for training andfor inference. Pad64 mode, instead, is particularly recommended if the training is done in Cropmode because the original dimensions of the image are maintained without any resize. Amongall the various configurations we can see that the Crop@1024 configuration is a good compromisebetween training times and quality of final predictions. This allows obtaining comparable resultsin a relatively short time and is a good starting point for experimental tests. All subsequent testspresented in this section refer to this last training configuration.Another study has evaluated the impact of low vs high resolution images on the final predictions
of the model. In particular, although the training set is composed entirely of high-resolutionimages, the Customer also owns many low-resolution images in its systems. This is due to thefact that in the past the data collection tool in SAP Customer systems involved the acquisitionof low- rather than high-resolution images. In order to analyze the entire time series of data formarketing purposes, it is therefore necessary to quantify the effects low-resolution images on thefinal performance. To provide a comparison metric, the images in the high-resolution datasetmainly are 1792× 1536, low-resolution images are about 640× 480.
The study is structured as follows.
• only the high-resolution dataset during training and inference is considered.
• the training is done in Crop@1024 mode as indicated by previous results.
• with the same training model, the performances between the inference in Pad64 mode andin Square@640 mode are compared.
This takes advantage of the scaling provided by the Square@640 mode to see how low-resolutionimages impact the final results. In particular, it is clear that, keeping the model configurationsunaltered, all the performances degrade if the input images have low resolution. As we can observein Table 5.3, the main critical point is the recall, which decreases considerably. This also stronglydepends on the other configuration parameters of the model, and probably also on the fact thatthe input dataset consists mainly of high resolution images. Further tests are currently planned inorder to investigate this problem more accurately and correct it.
5.2.2 Dataset Studies
As discussed in Section 4.5, the creation of the dataset is a central problem in supervised learningand in particular in the training of modern neural networks. The main experimental results on

52 5.2. Experimental Tests
Figure 5.1: Effects of automatically annotated images on network performances.
Figure 5.2: Effects of manually annotated images on network performances.
the construction of the dataset are presented below. The experiments involved the neural networktrained on images of generically labeled products, that is, by maintaining a single label rather thandiscriminating for each class. This made it possible to obtain a more accurate evaluation of theresults for small training sets. The results have been subsequently scaled in the multi-class contextand will be presented in the following sections. All evaluations refer to a single test set consistingof 110 manually annotated images.In terms of automation of the dataset construction process the first experiment wants to investi-
gate the effects of images automatically annotated by the network on the final performances. Theautomatic annotations have been obtained by running the network inferences on the unlabeledimages and obtaining the segmentations and the bounding boxes of the various products directlyfrom the latter through image processing techniques. Starting from a baseline of manually an-

Chapter 5. Experimental Results 53
Figure 5.3: Ad-Hoc dataset insights on differentitems scales.
Figure 5.4: Ad-Hoc dataset insights on differentitems aspect ratios.
notated images, the graph presented in Figure 5.1 presents the mAP, mAR, mAF measurementsaveraged on the IoU range [0.5 : 0.95] over subsequent batches of automatically annotated images.In particular, starting from 50 manually annotated images, the performances on the metrics havebeen monitored by adding batches of 50 images automatically labeled by the network to reacha total of 300 training images. All the models have been also evaluated through the Wilcoxonsigned rank test compared to the base model trained on the 50 manually annotated images inorder to ensure that predictions do not come from the same distribution. As it can be seen, theperformances obtained from this experimental test are disappointing for both evaluations carriedout on the bounding box and segmentation tasks. In particular, mAP and mAF decrease eachtime a further batch of automatically annotated images is added. The automatic annotation inthe Customer use-case does not therefore constitute a valid approach to decrease the number ofnecessary annotations. Further tests are planned in these scenarios to investigate the effects ofdata augmentation techniques and the use of synthetic datasets on the final performances.In order to determine quantitative information on the number of images necessary to obtain
satisfactory performances in the Customer use-case, the previous test has been replicated withfully hand-annotated images. In particular, for this test the same images (albeit not the sameannotations) have been used, and the same batches of the previous test have been kept. It can beobserved in Figure 5.2 that in this case, the addition of further images to the training set tendsto improve all the metrics of interest. As expected, this improvement ends to saturate as moreimages are added to the training set. From this test, it emerges that currently for the Customeruse-case, the addition of manually annotated images is the only method that can improve inferenceperformance by increasing the size of the dataset.
5.2.3 Fine-Tuning
Fine-tuning is a crucial method for improving model inference performance (Subsection 2.3.3). Inparticular, experimental tests may be performed to determine the optimal configuration of thenetwork architecture on a predefined search space. It is possible to use complex techniques basedon grid search or random search [39] but in our case, given the very long training times, we decidedto investigate a parameter space defined ad-hoc. The following tests further extend the surveydimensions provided by the ablation experiments of the network architectures presented in theprevious sections. All tests have been performed on a reduced dataset of 50 images to optimizethe training time while maintaining comparable performance. These refer to the same test set

54 5.2. Experimental Tests
Detection Segmentation
Anchor Scales mAP mAR mAF mAP mAR mAF{2, 4, 8, 16, 32} 53.5% 30.9% 39.0% 54.8% 32.2% 40.5%{4, 8, 16, 32, 64} 53.4% 32.8% 40.5% 53.6% 33.7% 41.3%{8, 16, 32, 64, 128} 57.3% 40.3% 47.1% 58.8% 41.9% 48.8%{16, 32, 64, 128, 256} 62.9% 42.6% 50.6% 62.2% 42.7% 50.5%{32, 64, 128, 256, 512} 64.2% 41.4% 50.2% 64% 41.3% 50.1%
Table 5.4: Instance segmentation results using different anchor scales settings.
Detection Segmentation
Anchor Ratios mAP mAR mAF mAP mAR mAF{0.3, 1, 2} 58.7% 40.8% 47.4% 60.0% 41.2% 48.7%{0.3, 1, 2.5} 55.5% 36.8% 44.1% 57.1% 38.4% 45.9%{0.5, 1, 2} 57.3% 40.3% 47.1% 58.8% 41.9% 48.8%{0.5, 1, 2.5} 60.1% 40.4% 48.2% 61.7% 42.1% 50.0%
Table 5.5: Instance segmentation results using different anchor ratios settings.
consisting of 110 manually annotated images presented in the previous sections. Also in this casedataset annotations maintain a single label rather than discriminating for each class to obtain moreaccurate results for small training sets and the mAP, mAR and mAF measurements are averagedon a prefixed IoU range [0.5 : 0.95]. For all the tests presented below, precision/recall trade-offhas been investigated in detail as the main limit identified in the architecture. In particular, it isevident that while for any configuration the precision is relatively satisfactory, recall is the mainproblem. This may be due to various issues and below we will present the main investigation areas.
Mask R-CNN [30] has many parameters to be configured appropriately. Two of these are thedimensions of anchor scales and anchor ratios of the output RPN [59] regions. For this test, abasic configuration has been first defined by visual inspection of the histograms in Figures 5.3 and5.4. These show the dimensions of the survey parameters of the candidate regions in the ad-hocdataset. As we can observe, the data are sufficiently concentrated to suggest a basic configurationfor anchor scales and anchor ratios depending on the two distributions analyzed. Starting from thebasic configuration, the parameter space has been modified to check the performance of adjacentconfigurations. All configurations have also been chosen according to the constraints of the featurepyramid network based overall topology that requires only 5 values for the anchor scales. Further-more, another constraint has been imposed by the fine-tuning of the region proposals network ontop of the FPN [44] which, previously trained on the Ms COCO [46], required only 3 values for theanchor ratios. Tables 5.4 and 5.5 show the performances of the various configurations tested andthe configurations that show the best precision/recall trade-off are highlighted. In particular, asexpected, the results tend to prefer the configurations that capture the maximum variance betweenthe data – anchor scales:{16, 32, 64, 128, 256}, anchor ratios:{0.5, 1, 2.5}. These values will beused in the final configuration presented later.The precision/recall trade-off has been investigated in detail with subsequent tests. For these
tests, the basic configuration starts from the optimal values determined in the ablation experimentspresented in the previous sections. Subsequently, the search space has been investigated in moredetail, trying to remedy the main limit identified in the system. In particular, given the architectureof Mask R-CNN and more generally of modern detectors, in the Customer context is particularlydifficult for the network to detect occluded objects in the background. This is mainly due tothe overlapping limit of regions dictated by the NMS thresholds of the RPN and the final layers,respectively. Other related search parameters result to be the number of region proposals in outputto the RPN and the confidence for which the final inferences can be considered valid. All these

Chapter 5. Experimental Results 55
Figure 5.5: Instance segmentation results usingdifferent RPN non-maxima suppression thresh-olds.
Figure 5.6: Instance segmentation results us-ing different MRCNN non-maxima suppressionthresholds.
Figure 5.7: Instance segmentation results usingdifferent post non-maxima suppression numberof RoIs threshold.
Figure 5.8: Instance segmentation results usingdifferent minimum detection confidences.
tests are presented in Figures 5.5, 5.6, 5.7 and 5.8. As can be observed for the NMS, in both cases(Figures 5.5 and 5.6) the precision tends to increase as the NMS threshold is higher. The latterconsideration should be contextualized keeping in mind that in the Matterport’s implementation[1] of Mask R-CNN [30], the NMS threshold applied subsequently to the RPN layers is higher asmuch as the value is close to 1 while the same threshold applied subsequently to the final layers(MRCNN) is higher as much as the value is close to 0. In both cases, this does not seem to affectthe recall too heavily and it is possible to find a compromise that maximizes the F-Measure byimposing as thresholds 0.8 and 0.2, respectively. Concerning the number of RoIs maintained afterthe NMS phase in output to the RPN and the minimum detection confidence required so that aninstance in output to MRCNN can be considered positive (Figures 5.7 and 5.8), it is also possible todefine two thresholds. In particular, as previously, the values that maximized the F-Measure havebeen selected, preferring a greater recall in case of multiple candidate values. This has been solved

56 5.2. Experimental Tests
Gnrc A B C D E F G H Mean
[email protected]:0.95 55.9% 80.9% 82.7% 70.8% 73.8% 70.4% 75.6% 68.9% 76.6% 72.8%[email protected]:0.95 42.9% 75.3% 75.0% 68.8% 69.3% 61.5% 62.8% 57.0% 65.6% 64.3%[email protected]:0.95 48.4% 78.0% 78.6% 69.7% 71.4% 65.4% 68.4% 62.4% 70.5% 68.1%
Table 5.6: Per-class detection results on multiple class scenario.
Gnrc A B C D E F G H Mean
[email protected]:0.95 57.0% 81.1% 81.2% 72.2% 76.5% 70.5% 76.2% 67.7% 76.5% 73.2%[email protected]:0.95 44.2% 75.5% 75.3% 70.0% 72.3% 64.4% 64.1% 55.4% 68.3% 65.6%[email protected]:0.95 49.6% 78.2% 78.1% 71.0% 74.6% 67.2% 69.5% 60.9% 72.0% 69.0%
Table 5.7: Per-class segmentation results on multiple class scenario.
Gnrc A B C D E F G H Mean
[email protected]:0.95 48.7% 82.4% 79.2% 72.8% 5.65% 8.12% 77.4% 22.2% 71.6% 52.0%[email protected]:0.95 39.6% 52.0% 45.5% 17.5% 48.2% 44.1% 8.55% 33.6% 14.5% 33.7%[email protected]:0.95 43.5% 63.8% 57.7% 28.2% 10.1% 13.7% 15.4% 26.7% 24.2% 40.9%
Table 5.8: Per-class aggregated detection results on multiple brand scenario.
Gnrc A B C D E F G H Mean
[email protected]:0.95 49.7% 82.4% 78.1% 79.1% 5.80% 8.16% 79.2% 21.9% 66.2% 52.3%[email protected]:0.95 40.8% 51.1% 45.3% 19.2% 50.4% 45.6% 8.61% 33.3% 13.4% 34.2%[email protected]:0.95 44.7% 63.1% 57.3% 30.8% 10.4% 13.8% 15.6% 26.4% 22.3% 41.4%
Table 5.9: Per-class aggregated segmentation results on multiple brand scenario.
by choosing 1500 as the number of RoIs limit in output to the RPN and 0.5 as the threshold forthe minimum detection confidence for which an instance in output to MRCNN can be consideredpositive. As previously, all these values will be used for the final configuration tests presented later.The tests discussed above have investigated several configurable parameters in the network
architecture, but further tests are planned to extend the survey area.
5.2.4 Final Configuration
The previous results gave indications for the the main configuration parameters of the networkarchitecture. The final results in the context of multi-class inference are shown below by takinginto consideration the best model configurations previously identified. It is important to note thatin the dataset (Figure 4.7) superclasses of Customer products have been defined that are sufficientlylarge to obtain, in most cases, significant results in output. The list of products has been previouslyagreed directly with the Customer and represent the core business of the Customer. The resultsof the Mask R-CNN network inferences trained in a multi-class scenario have been comparedwith those of the Mask R-CNN network trained in a single-class case but aggregating the lastinferences through the double stage architecture presented in the previous sections. For the test,in both inference scenarios, performance by class and aggregate final performance are reported. Afurther test was also planned to evaluate the effectiveness of our detector based on Mask R-CNNcompared to that presented by Tonioni [71] but it was not possible to perform it because thedataset mentioned in the paper turned out to be proprietary and could not be disclosed to us incompliance with the privacy policies.In Tables 5.6 and 5.7 we can examine the per-class instance segmentation results as well as the
final ones obtained by evaluating the inferences of the network composed only by the Mask R-CNN[30] stack. In particular, it is evident that the performance of the network in the recognition ofCustomer products is much higher than that on generic competitors products. These results are

Chapter 5. Experimental Results 57
very important because they can suggest a conceptual link to the occlusion and illumination issuesmentioned in Chapter 3. At present, no formal metric has yet been defined for the Ad-Hoc datasetto measure it but examining in a visual way the dataset we can indeed notice that Customerproducts are always positioned in the foreground and there are no annotations for the Customerproducts in background in the test set. In particular, by examining the products in the backgroundwe can see that the annotations in the dataset belong exclusively to the competitors product class(Gnrc) and the corresponding instances are often subject to occlusion phenomena as well as tolow light conditions. Overall, even if recall is still the most critical aspect, the results obtained aresatisfactory for all classes and constitute a good solution for the analysis of the Customer brandthat we will present in the following section.In order to evaluate the quality of the brand detector with respect to the product detector, it
has been decided to aggregate the brand detector inferences on the same superclasses of productsidentified by the product detector. This decision has been adopted to make the results of the twodetectors comparable. In particular, the main constraint that motivates this choice is due to thefact that currently the Ad-Hoc dataset does not have a number of annotations adequate to be ableto compare the two detectors inferences on the different subclasses since only the brand detectorcould achieve good results in this challenge. In addition, given that products have great variabilityamong themselves within the same superclass according to the type of package or promotionalcampaign, a class balancing attempt has been made before registering the final inferences of thebrand detector. In particular, the query dataset used in the classification pipeline of the branddetector has been built in a balanced way by inserting 10 different instances for each superclassof Customer product and 50 different instances for competitors products under various conditions.This change in the construction of the query dataset that deviates from the work initially proposedby A. Tonioni [70, 71], has been carried out after recording very disappointing results (not shown)if a single product image was maintained for each subclass in the dataset. In Tables 5.8 and 5.9we can see the final results. It is apparent that the performances are not yet comparable withthose of the product detector – Tables 5.6 and 5.7 – nor with those registered by Tonioni [70, 71].However, the approach offers potential for improvement if developed more carefully. In particular,it is possible, for example, to fine-tune the network architecture for feature extraction, or to usespecialized heuristics. Moreover, one of the fundamental observations that could be made refers tothe fact that currently, there are no good quality product images in the query dataset. This lastfact is due mainly to the impossibility of currently having, for lack of authorization, good qualityimages from the Customer’s products catalog but soon the problem will be studied in greater detailas described in Chapter 6. In any case, the brand detector approach actually remains the onlyarchitecture still available to recognize the product brand without exploiting expensive amountsof annotations in the Customer business domain.
5.3 Business Intelligence and Visualization
Business Intelligence (BI) includes all the business processes that aim to collect data and analyzestrategic enterprise information. BI technologies are used for different purposes, such as as dataanalytics, performance benchmarking, process mining and predictive analytics. The results aretraditionally made available in the form of automated reporting and allow to support a wide rangeof business decisions. These include product positioning, pricing, priorities, targets and all the keyinsights that allow a company to gain a competitive market advantage over its competitors.In our domain, business intelligence results are available in respect of the privacy of Customer
and Supplier data and therefore sensitive information is obscured. The results are currently madeavailable in cloud through SAP Analytics Cloud for direct consultation (Section 4.4). Data arepresented in the form of storytelling and the main pages have been briefly described in Section 4.3,dedicated to the presentation logic. With reference to the mock-ups, in addition to the initiallyagreed pages, others have been implemented. For brevity, the various pages are not presentedindividually, but the main results available are described in detail. In order to analyze a singlebusiness process, the following results refer to an historical series initially defined composed by

58 5.3. Business Intelligence and Visualization
Figure 5.9: Customer basic KPIs.
521 Customer activities. This series has been chosen to make the results available in the form ofa Proof Of Concept mainly composed of high resolution images. These results will be integratedwith the analysis of other business processes as soon as the Customer makes the data available.Initially, these results will be extended to the historical series of all the activities available in theIT Customer systems. Subsequently, the data will have a broader investigation area and it willbe possible to correlate the single product present within an activity with the revenue of eachpharmacy. The results presented below are aimed at enhancing the potential of AI as a tool foranalyzing business processes. Basic KPIs have been defined which can be obtained by viewingthe questionnaires associated with the activities. More advanced KPIs have been obtained onlythrough AI image processing and deep learning techniques.With reference to the requirements defined in Section 4.1, all functional and non-functional re-
quirements have been implemented with respect to the agreed constraints. Regarding specificallythe visual analytics requirements about KPIs verification matching on the deep learning elabo-rations results with the questionnaires it has been decided to not include the information in thiswork at the moment. The requirement has been correctly implemented as requested but since thedata entered in the questionnaires by commercial agents were often incorrect or incomplete, it wasnot possible to obtain reliable measurements. However, a specific activity has been planned toovercome this lack of information which involves re-elaborating the whole series of questionnairesconsidered for the considered Customer’s business processes.
5.3.1 Basic KPIs
Results described in Figure 5.9 refer to the information previously available to the Customer.The information contained in the questionnaires attached to the activities were aggregated andpresented in the form of histograms to define strategic metrics of interest. In particular, finalresults allow to observe the distribution of product clusters and promotional campaigns over theshelf type. This information is very important because it is the basis of further recommendationprocesses on specific market targets. However, although a standard document was available toregulate the type of information to be included in the Customer systems, the agents in chargewere not sufficiently precise and the data entered were occasionally inaccurate or incorrect. In thiscase AI is a useful tool for more objective and accurate analysis, being able to provide the sameinformation by applying computer vision techniques to the images associated with the activities.
5.3.2 Advanced KPIs
More advanced KPIs and AI-based metrics provide a greater level of detail than previous ones.In an era where information is considered a very important asset, companies invest large sums of

Chapter 5. Experimental Results 59
Figure 5.10: Per product Customer brand influence over shelf type.
Figure 5.11: Per product Customer brand influence over promotional campaign.
Figure 5.12: Per product Customer brand influence over cluster.
money to obtain strategic information that can guarantee a competitive advantage in the market.Through this information it is possible to promptly move large flows of operations and capital toobtain business results quickly. The designed system arises the objective of obtaining intelligenceinformation useful for making strategic decisions in the Customer’s business processes. Some ofthe currently available key insights will be presented below.

60 5.3. Business Intelligence and Visualization
Figure 5.13: Products insights on store shelves.
The diagrams in Figures 5.10, 5.11 and 5.12 analyze the presence of Customer products in phar-macies in terms of number of identified objects and number of pixels. This allows to obtain awhole series of key insights on the Customer’s activity, suitably aggregating the inferences of thealgorithm. In particular, the products identified in the images are aggregated for shelf type, pro-motional campaign and cluster. It must be noted that the importance of the brand calculated bynumber of products is not always the same as the one calculated by number of pixels per prod-uct. This is particularly evident if we take into consideration product G which assumes strategicimportance in the Customer brand together with product H. In fact, product G and product Hcategories make up the majority of the area exposed by the Customer in pharmacies regardless ofthe shelf type and the considered cluster. Even cluster 4 is entirely dedicated to product G andproduct H and does not host other product categories. Moreover, specific promotional campaignsaim to promote these two products compared to the rest, as we can see in Figure 5.11. However,all the remaining products constitute, if considered as a whole, a very influential range of productsin the Customer brand. These are present at the same time, each with different importance, in thefinal pharmacies and also to products A, B, C, D, E, F (considered together) is dedicated a pro-motional campaign targeted on a specific market segment. Other types of insights can be obtainedby correlating these KPIs with the knowledge of the Customer’s business domain. In particular,it is very important to note that in the aggregated results for promotional campaigns, campaign 1and campaign 2 are not exclusively dedicated to product G and product H. Furthermore, there isa significant presence of product H also in campaign 3. From cross-analysis directly on the imageswe can see that the outliers identified by the algorithm are correct. This is particularly problematicfor the Customer brand and indicates that the agents appointed to set up the stores performedmistakes and even harmful operations. On the basis of this information it is possible to define tol-erance thresholds and promptly intervene in the single pharmacy through maintenance operationsto resolve any dangerous situations that may arise. Furthermore, by correlating these KPIs withthe revenues of the individual sales points, it will be possible to provide future recommendationsfor the preparation of set-ups in pharmacies.Other metrics of strategic importance for the Customer concern the products positioning on
each store shelf. As with the previous case it is possible to extract this information directly fromthe images through the designed system. Results are always available via automated reporting

Chapter 5. Experimental Results 61
Figure 5.14: Products insights on store shelves over shelf type.
Figure 5.15: Products insights on store shelves over promotional campaign.
by aggregating data according to the desired level of detail, as shown in Figures 5.13, 5.14 and5.15. In particular, as we can see in Figure 5.13, it is immediately important to note that whileCustomer products tend to be concentrated in the upper shelves, those of the competitors cover alarger surface area. This insight provides a competitive advantage because traditionally productspositioned at face height have greater visibility. Other key insights can be obtained from theanalysis of products positioning on store shelves over shelf type and promotional campaign. Inparticular, it can be noted that both for the Customer and for the competitors, shelf type 2 tendsto concentrate the products in the highest shelves while shelf type 1 tends to disperse them overa larger surface (Figure 5.14). The dispersion of the products also depends on the promotionalcampaign considered, as it is possible to observe from Figure 5.15. In particular, the Customerproducts identified in campaign 2 are positioned too high with respect to those of the competitors.This is particularly problematic because products positioned too high are less visible and this hasa negative effect on final sales and on the Customer brand. Similar information had already beencorrelated in the past with the sales potential of the Customer products and in this case there isdefinitely a positive feedback.The potential of the designed system is greater compared to the system previously available for
Customer where only the basic KPI information is present. Starting from these considerationsmany other key insights based on the designed system will be available in the future. In particular,one of the main objectives is to determine the ideal configuration for each product and for eachshelf type and promotional campaign based on sales forecasts. With respect to this last point, allthe considerations on future developments of this work will be discussed in Chapter 6.

62 5.3. Business Intelligence and Visualization
Chapter 6
Conclusion
This work proposes an automated retail shelf analytics system based on modern deep learningand image processing techniques (Chapters 4 and 5). In particular, the system model is based onMask R-CNN [30] and allows to obtain instance segmentation inferences of shelf products fromstore pictures. The network architecture has been customized through fine tuning to adapt to theagreed business domain and the system can analyze business processes images at scale detectingand segmenting each product instance. Starting from the image processing, business intelligenceKPIs are calculated to provide key insights on the retail business world (Section 5.3). The systemhas been designed in collaboration with the University of Padua for a Customer company that playsa role of strategic importance in the international pharmaceutical retail market. The work has beensold from a Supplier consulting company according to a business integration project between the ITCustomer and Supplier systems. The system consists of an algorithmic kernel based on TensorFlow[51, 1] and integrates directly into a SAP architecture to manage both server and client sides dataflows from the two business systems. Starting from this work many developments will follow inthe coming months to further improve the promotional activities that Customer performs daily.A part of this work that has been a precious time investment and that contributed to the success
of this project has been the creation of a proprietary instance segmentation dataset (Section 4.5),built ad hoc to effectively adapt the system model inferences to the Customer business domain.In addition to manual pixel-wise labeling of all images in the dataset, various design alternativeshave been examined in detail, focusing on the trade-off between the accuracy of predictions andthe amount of annotations required for the training of the neural networks. With respect tothis point have been studied, the effects of the automatic labeling of the dataset images on finalpredictions (Subsection 4.4) that can be integrated into the Mask R-CNN chain of inferences ableto identify products, on store shelves without the need to own large amounts of data for the neuralnetworks stack training. Both these latest design alternatives will be studied in more detail infuture developments to obtain more specialized results on the business domain.Another part that proved to be very important for this work and which has been a strategic
investment both in terms of time and money has been the design of a business integration system(Section 4.4) between the IT Customer and Supplier systems. In particular, besides having fol-lowed all the design phases of an R&D solution that integrates the traditional Customer’s businessprocesses, also all the consulting activities with the various Customer departments have been takencare of. According to specifications, the design has been conceived in a full-stack perspective andis based on a data flow between the SAP systems, which is aimed at the automated reportingof results in cloud through a dedicated SAP architecture. From the processing, business intelli-gence KPIs are extracted for the assessment of the impact of the Customer brand in the stores(Section 5.3) according to different interpretations meeting all the functional and non-functionalrequirements defined in the requirements analytics phase (Section 4.1). In compliance with theconfidentiality constraints imposed by Customer and Supplier, some of the most important de-tails with regards to the business integration project have been obscured to defend the intellectualproperty of the various parties where required.
63

64 6.1. Future Work
6.1 Future Work
Future work will see an even more specialized data-driven integration within the Customer’s busi-ness processes. As a first integration of the current system further KPIs will be defined to evaluatethe sales performance of the products on different customer target groups. Based on the definedKPIs and the sales forecasts of the products in the various geographical areas, a recommendationsystem will be studied to suggest promotions and discounts to the various customers. Followingan integration to the system able to provide managerial guidelines for the optimal arrangement ofproducts on store shelves, based as for the previous points on sales forecasts, will be proposed. Thesystem will be designed for the Customer’s marketing and sales department and will allow to makestrategic decisions to enhance the visibility effects of the Customer’s brand over its competitors.Furthermore, a process automation system able to replace the traditional questionnaires fillingprocess that commercial agents visiting the stores fill out daily will be studied. This system, inaddition to calculating a good part of the KPIs that are currently automatically determinable bythe designed system model, will be able to determine possible out-of-stock by sending appropri-ate reports to commercial agents in real time. Even the architecture will be improved both fromthe algorithmic and the system integration point of view. As far as the algorithmic componentis concerned, an R&D activity has been planned for the upgrade of the system model chain ofinferences. This will primarily concern a more in-depth study of the deep learning pipeline basedon the query dataset proposed in Chapter 4. Through the latter it will be possible to make brandpredictions in order to classify all the products of the Customer suite as well as all the competitorproducts. The identification will subsequently be extended to baselines and prices to obtain fur-ther intelligence information able to monitor the promotional activities of Customer. As for thesystem integration component, in addition to the data layer migration in SAP HANA as describedin Chapter 4, another architecture integration activity has been planned through another productof the SAP suite. In particular, the potential of the SAP Data Hub will be exploited to orchestratethe data flows coming from the IT Customer and Supplier systems, obtaining benefits as regardsthe scalability of the whole system and an easier prototyping of new features.

Bibliography
[1] Waleed Abdulla. Mask R-CNN for object detection and instance segmentation on Keras andTensorFlow. https://github.com/matterport/Mask_RCNN. 2017.
[2] David Acuna et al. “Efficient Interactive Annotation of Segmentation Datasets with Polygon-RNN++”. In: (2018).
[3] Amaury. Pixel Annotation Tool. https://github.com/abreheret/PixelAnnotationTool.2017.
[4] Soheil Bahrampour et al. “Comparative study of deep learning software frameworks”. In:arXiv preprint arXiv:1511.06435 (2015).
[5] Herbert Bay, Tinne Tuytelaars, and Luc Van Gool. “Surf: Speeded up robust features”. In:European conference on computer vision. Springer. 2006, pp. 404–417.
[6] Michael Buhrmester, Tracy Kwang, and Samuel D Gosling. “Amazon’s Mechanical Turk: Anew source of inexpensive, yet high-quality, data?” In: Perspectives on psychological science6.1 (2011), pp. 3–5.
[7] Alfredo Canziani, Adam Paszke, and Eugenio Culurciello. “An analysis of deep neural networkmodels for practical applications”. In: arXiv preprint arXiv:1605.07678 (2016).
[8] Cyril W Cleverdon. “The significance of the Cranfield tests on index languages”. In: Proceed-ings of the 14th annual international ACM SIGIR conference on Research and developmentin information retrieval. Citeseer. 1991, pp. 3–12.
[9] Cyril W Cleverdon, Jack Mills, and E Michael Keen. “Factors determining the performanceof indexing systems,(Volume 2: Test Results)”. In: Cranfield: College of Aeronautics (1966),p. 28.
[10] Djork-Arné Clevert, Thomas Unterthiner, and Sepp Hochreiter. “Fast and accurate deepnetwork learning by exponential linear units (elus)”. In: arXiv preprint arXiv:1511.07289(2015).
[11] Computer Vision Datasets on the Web. url: http://www.cvpapers.com/datasets.html.
[12] Thomas M Cover, Peter E Hart, et al. “Nearest neighbor pattern classification”. In: IEEEtransactions on information theory 13.1 (1967), pp. 21–27.
[13] George Cybenko. “Approximation by superpositions of a sigmoidal function”. In:Mathematicsof control, signals and systems 2.4 (1989), pp. 303–314.
[14] Navneet Dalal and Bill Triggs. “Histograms of oriented gradients for human detection”. In:international Conference on computer vision & Pattern Recognition (CVPR’05). Vol. 1. IEEEComputer Society. 2005, pp. 886–893.
[15] A. Dutta, A. Gupta, and A. Zissermann. VGG Image Annotator (VIA). http://www.robots.ox.ac.uk/~vgg/software/via/. 2016.
[16] M. Everingham et al. The PASCAL Visual Object Classes Challenge 2012 (VOC2012) Re-sults. http://www.pascal-network.org/challenges/VOC/voc2012/workshop/index.html.
[17] Patrick Follmann et al. “MVTec D2S: Densely Segmented Supermarket Dataset”. In: arXivpreprint arXiv:1804.08292 (2018).
65
66 Bibliography
[18] Jerome Friedman, Trevor Hastie, and Robert Tibshirani. The elements of statistical learning.Vol. 1. 10. Springer series in statistics New York, NY, USA: 2001.
[19] Kunihiko Fukushima and Sei Miyake. “Neocognitron: A self-organizing neural network modelfor a mechanism of visual pattern recognition”. In: Competition and cooperation in neuralnets. Springer, 1982, pp. 267–285.
[20] Alberto Garcia-Garcia et al. “A review on deep learning techniques applied to semanticsegmentation”. In: arXiv preprint arXiv:1704.06857 (2017).
[21] Marian George and Christian Floerkemeier. “Recognizing products: A per-exemplar multi-label image classification approach”. In: European Conference on Computer Vision. Springer.2014, pp. 440–455.
[22] Ross Girshick. “Fast r-cnn”. In: Proceedings of the IEEE international conference on computervision. 2015, pp. 1440–1448.
[23] Ross Girshick et al. “Rich feature hierarchies for accurate object detection and semanticsegmentation”. In: Proceedings of the IEEE conference on computer vision and pattern recog-nition. 2014, pp. 580–587.
[24] Ian J Goodfellow et al. “Maxout networks”. In: arXiv preprint arXiv:1302.4389 (2013).
[25] Google. Google Trends. 2012. url: http://trends.google.com/trends.
[26] Dhruv Grewal, Anne L Roggeveen, and Jens Nordfält. “The future of retailing”. In: Journalof Retailing 93.1 (2017), pp. 1–6.
[27] Donna Harman. “Information retrieval evaluation”. In: Synthesis Lectures on InformationConcepts, Retrieval, and Services 3.2 (2011), pp. 1–119.
[28] John C Hay, Ben E Lynch, and David R Smith. Mark I perceptron operators’ manual. Tech.rep. CORNELL AERONAUTICAL LAB INC BUFFALO NY, 1960.
[29] Kaiming He et al. “Deep residual learning for image recognition”. In: Proceedings of the IEEEconference on computer vision and pattern recognition. 2016, pp. 770–778.
[30] Kaiming He et al. “Mask r-cnn”. In: Computer Vision (ICCV), 2017 IEEE InternationalConference on. IEEE. 2017, pp. 2980–2988.
[31] Kaiming He et al. “Spatial pyramid pooling in deep convolutional networks for visual recog-nition”. In: European conference on computer vision. Springer. 2014, pp. 346–361.
[32] Jonathan Huang et al. “Speed/accuracy trade-offs for modern convolutional object detectors”.In: IEEE CVPR. Vol. 4. 2017.
[33] David H Hubel and Torsten N Wiesel. “Receptive fields, binocular interaction and functionalarchitecture in the cat’s visual cortex”. In: The Journal of physiology 160.1 (1962), pp. 106–154.
[34] David H Hubel and Torsten N Wiesel. “Receptive fields of single neurones in the cat’s striatecortex”. In: The Journal of physiology 148.3 (1959), pp. 574–591.
[35] Straka Huyen. “Stanford University CS20: Tensorflow for Deep Learning Research”. In: ().url: http://web.stanford.edu/class/cs20si/syllabus.html.
[36] John Illingworth and Josef Kittler. “A survey of the Hough transform”. In: Computer vision,graphics, and image processing 44.1 (1988), pp. 87–116.
[37] Panagiotis G Ipeirotis, Foster Provost, and Jing Wang. “Quality management on amazonmechanical turk”. In: Proceedings of the ACM SIGKDD workshop on human computation.ACM. 2010, pp. 64–67.
[38] Philipp Jund et al. “The Freiburg Groceries Dataset”. In: arXiv preprint arXiv:1611.05799(2016).
[39] Andrej Karpathy. “Stanford University CS231n: Convolutional Neural Networks for VisualRecognition”. In: (). url: http://cs231n.stanford.edu/syllabus.html.

Bibliography 67
[40] Alex Krizhevsky, Ilya Sutskever, and Geoffrey E Hinton. “Imagenet classification with deepconvolutional neural networks”. In: Advances in neural information processing systems. 2012,pp. 1097–1105.
[41] Svetlana Lazebnik, Cordelia Schmid, and Jean Ponce. “Beyond bags of features: Spatialpyramid matching for recognizing natural scene categories”. In: 2006 IEEE Computer SocietyConference on Computer Vision and Pattern Recognition (CVPR’06). Vol. 2. IEEE. 2006,pp. 2169–2178.
[42] LeCun. “THE MNIST DATABASE of handwritten digits”. In: http: // yann. lecun. com/exdb/ mnist/ (). url: %5Curl%7Bhttps://ci.nii.ac.jp/naid/10027939599/en/%7D.
[43] Yann LeCun et al. “Gradient-based learning applied to document recognition”. In: Proceedingsof the IEEE 86.11 (1998), pp. 2278–2324.
[44] Tsung-Yi Lin et al. “Feature Pyramid Networks for Object Detection.” In: CVPR. Vol. 1. 2.2017, p. 4.
[45] Tsung-Yi Lin et al. “Focal loss for dense object detection”. In: IEEE transactions on patternanalysis and machine intelligence (2018).
[46] Tsung-Yi Lin et al. “Microsoft coco: Common objects in context”. In: European conferenceon computer vision. Springer. 2014, pp. 740–755.
[47] Wei Liu et al. “Ssd: Single shot multibox detector”. In: European conference on computervision. Springer. 2016, pp. 21–37.
[48] Jonathan Long, Evan Shelhamer, and Trevor Darrell. “Fully convolutional networks for se-mantic segmentation”. In: Proceedings of the IEEE conference on computer vision and patternrecognition. 2015, pp. 3431–3440.
[49] David G Lowe. “Distinctive image features from scale-invariant keypoints”. In: Internationaljournal of computer vision 60.2 (2004), pp. 91–110.
[50] Andrew L Maas, Awni Y Hannun, and Andrew Y Ng. “Rectifier nonlinearities improve neuralnetwork acoustic models”. In: Proc. icml. Vol. 30. 1. 2013, p. 3.
[51] Martín Abadi et al. TensorFlow: Large-Scale Machine Learning on Heterogeneous Systems.Software available from tensorflow.org. 2015. url: https://www.tensorflow.org/.
[52] Warren S McCulloch and Walter Pitts. “A logical calculus of the ideas immanent in nervousactivity”. In: The bulletin of mathematical biophysics 5.4 (1943), pp. 115–133.
[53] Marvin Minsky and Seymour A Papert. Perceptrons: An introduction to computational ge-ometry. MIT press, 2017.
[54] Trisha Mittal, B Laasya, and J Dinesh Babu. “A Logo-Based Approach for Recognising Mul-tiple Products on a Shelf”. In: Proceedings of SAI Intelligent Systems Conference. Springer.2016, pp. 15–22.
[55] Katanforoosh Ng. “Stanford University CS230: Deep Learning”. In: (). url: http://cs230.stanford.edu/syllabus/.
[56] Joseph Redmon and Ali Farhadi. “YOLO9000: better, faster, stronger”. In: arXiv preprint(2017).
[57] Joseph Redmon and Ali Farhadi. “Yolov3: An incremental improvement”. In: arXiv preprintarXiv:1804.02767 (2018).
[58] Joseph Redmon et al. “You only look once: Unified, real-time object detection”. In: Pro-ceedings of the IEEE conference on computer vision and pattern recognition. 2016, pp. 779–788.
[59] Shaoqing Ren et al. “Faster r-cnn: Towards real-time object detection with region proposalnetworks”. In: Advances in neural information processing systems. 2015, pp. 91–99.
[60] Frank Rosenblatt. “The perceptron: a probabilistic model for information storage and orga-nization in the brain.” In: Psychological review 65.6 (1958), p. 386.

[61] David E Rumelhart, Geoffrey E Hinton, and Ronald J Williams. “Learning representationsby back-propagating errors”. In: nature 323.6088 (1986), p. 533.
[62] Olga Russakovsky et al. “ImageNet Large Scale Visual Recognition Challenge”. In: Interna-tional Journal of Computer Vision (IJCV) 115.3 (2015), pp. 211–252. doi: 10.1007/s11263-015-0816-y.
[63] Olga Russakovsky et al. “Imagenet large scale visual recognition challenge”. In: InternationalJournal of Computer Vision 115.3 (2015), pp. 211–252.
[64] Shaohuai Shi et al. “Benchmarking state-of-the-art deep learning software tools”. In: 2016 7thInternational Conference on Cloud Computing and Big Data (CCBD). IEEE. 2016, pp. 99–104.
[65] Karen Simonyan and Andrew Zisserman. “Very deep convolutional networks for large-scaleimage recognition”. In: arXiv preprint arXiv:1409.1556 (2014).
[66] Jost Tobias Springenberg et al. “Striving for simplicity: The all convolutional net”. In: arXivpreprint arXiv:1412.6806 (2014).
[67] Christian Szegedy et al. “Going deeper with convolutions”. In: Proceedings of the IEEE con-ference on computer vision and pattern recognition. 2015, pp. 1–9.
[68] Christian Szegedy et al. “Inception-v4, inception-resnet and the impact of residual connec-tions on learning.” In: AAAI. Vol. 4. 2017, p. 12.
[69] Richard Szeliski. Computer vision: algorithms and applications. Springer Science & BusinessMedia, 2010.
[70] Alessio Tonioni and Luigi Di Stefano. “Product recognition in store shelves as a sub-graph iso-morphism problem”. In: International Conference on Image Analysis and Processing. Springer.2017, pp. 682–693.
[71] Alessio Tonioni, Eugenio Serro, and Luigi di Stefano. “A deep learning pipeline for productrecognition on store shelves”. In: CoRR abs/1810.01733 (2018). arXiv: 1810.01733. url:http://arxiv.org/abs/1810.01733.
[72] Jasper RR Uijlings et al. “Selective search for object recognition”. In: International journalof computer vision 104.2 (2013), pp. 154–171.
[73] Holger Ursin. “The temporal lobe substrate of fear and anger. A review of recent stimulationand ablation studies in animals and humans”. In: Acta Psychiatrica Scandinavica 35.3 (1960),pp. 378–396.
[74] Srikrishna Varadarajan and Muktabh Mayank Srivastava. “Weakly Supervised Object Lo-calization on grocery shelves using simple FCN and Synthetic Dataset”. In: arXiv preprintarXiv:1803.06813 (2018).
[75] Gül Varol and Rıdvan Salih Kuzu. “Toward retail product recognition on grocery shelves”. In:Sixth International Conference on Graphic and Image Processing (ICGIP 2014). Vol. 9443.International Society for Optics and Photonics. 2015, p. 944309.
[76] Paul Viola and Michael Jones. “Rapid object detection using a boosted cascade of simplefeatures”. In: null. IEEE. 2001, p. 511.
[77] Saining Xie et al. “Aggregated residual transformations for deep neural networks”. In: Com-puter Vision and Pattern Recognition (CVPR), 2017 IEEE Conference on. IEEE. 2017,pp. 5987–5995.
[78] Jason Yosinski et al. “How transferable are features in deep neural networks?” In: Advances inNeural Information Processing Systems 27. Ed. by Z. Ghahramani et al. Curran Associates,Inc., 2014, pp. 3320–3328. url: http://papers.nips.cc/paper/5347-how-transferable-are-features-in-deep-neural-networks.pdf.
[79] Matthew D Zeiler and Rob Fergus. “Visualizing and understanding convolutional networks”.In: European conference on computer vision. Springer. 2014, pp. 818–833.

Department of Information EngineeringUniversity of Padua, ItalyA. De Biasio, Prof. C. Fantozzi
Master Thesis:
Retail Shelf Analytics Through Image Processing and Deep Learning
Thesis type and date:
Master Thesis, February 2019
Supervisor:
Carlo Fantozzi
Student:
Name: Alvise De BiasioE-mail: [email protected] ID: 1156401