Retail Sales (Measures changes in Consumer Spending Patterns) Web: Large revisions with annual...
25
Retail Sales (Measures changes in Consumer Spending Patterns) Web: www.census.gov/svsd/www/advtable.html Large revisions with annual changes in March Retail sales represents 1/3 of consumer spending, PCE, which makes up 70% of the economy Census bureau surveys 5000 retailers 3 days after month end for their latest sales numbers. Retail sales represent spending on goods only, not services – air travel, medical care, dental care, haircuts, insurance, movies, etc. – which represent 2/3 of personal expenditures. Measured in nominal/current dollars P t Y t (not inflation adjusted) so don’t know if change is due to change in prices, change in volume or both. But economic performance is based on real growth rates (volume effect). So subtract percentage change in consumer price index to get good approximation of real percentage change in sales. Retail sales = Total sales receipts – returned merchandise – rebates – sales tax – excise tax – finance charges. Adjusted for seasonal variations (holidays, winter, etc.) Use a 3-month moving average to get more accurate sense of underlying trend. Strong correlation between change real retail sales and real GDP (GDP/GDP) E t+1 = F [PCE = f (retail sales)] Subtract out the large (25%) but volatile motor vehicle category to better track underlying consumer spending trend. Watch for changes in gas prices which can change retail sales. P Gas => retail sales but non-gas retail sales (PY) = PY 1 + YP 1 + PY (PY) = PY 1 + YP 1 + P Y P 1 Y 1 P 1 Y 1 P 1 Y 1 P 1 Y 1 (PY) = P + Y + 0 if P and Y are small P 1 Y 1 P 1 Y 1 Y = (PY) – P Y 1 P 1 Y 1 P 1 -------------------------------------------------------------------------------------------------------------------- ------ Market Analysis Bonds: retail sales => Y/Y => P/P => D Bonds => i Bonds Stocks: retail sales => revenues => profits => P Stocks Many goods are imported => demand for euros/supply of dollars => P $ Dollar: income => imports => retail sales and trade deficit Economic Indicator 3
-
Upload
egbert-todd -
Category
Documents
-
view
215 -
download
0
Transcript of Retail Sales (Measures changes in Consumer Spending Patterns) Web: Large revisions with annual...

Retail Sales(Measures changes in Consumer Spending Patterns)
Web: www.census.gov/svsd/www/advtable.htmlLarge revisions with annual changes in March
Retail sales represents 1/3 of consumer spending, PCE, which makes up 70% of the economyCensus bureau surveys 5000 retailers 3 days after month end for their latest sales numbers. Retail sales represent spending on goods only, not services – air travel, medical care, dental care, haircuts, insurance, movies, etc. – which represent 2/3 of personal
expenditures.Measured in nominal/current dollars PtYt (not inflation adjusted) so don’t know if change is due to change in prices, change in volume or both. But economic
performance is based on real growth rates (volume effect). So subtract percentage change in consumer price index to get good approximation of real percentage change in sales.
Retail sales = Total sales receipts – returned merchandise – rebates – sales tax – excise tax – finance charges.Adjusted for seasonal variations (holidays, winter, etc.)
Use a 3-month moving average to get more accurate sense of underlying trend.
Strong correlation between change real retail sales and real GDP(GDP/GDP)E
t+1 = F [PCE = f (retail sales)]Subtract out the large (25%) but volatile motor vehicle category to better track underlying consumer spending trend.Watch for changes in gas prices which can change retail sales. PGas => retail sales but non-gas retail sales
(PY) = PY1 + YP1 + PY (PY) = PY1 + YP1 + PY P1Y1 P1Y1 P1Y1 P1Y1
(PY) = P + Y + 0 if P and Y are small P1Y1 P1 Y1
Y = (PY) – P Y1 P1Y1 P1
--------------------------------------------------------------------------------------------------------------------------Market AnalysisBonds: retail sales => Y/Y => P/P => DBonds => iBonds
Stocks: retail sales => revenues => profits => PStocks
Many goods are imported => demand for euros/supply of dollars => P$ Dollar: income => imports => retail sales and trade deficit
EconomicIndicator 3
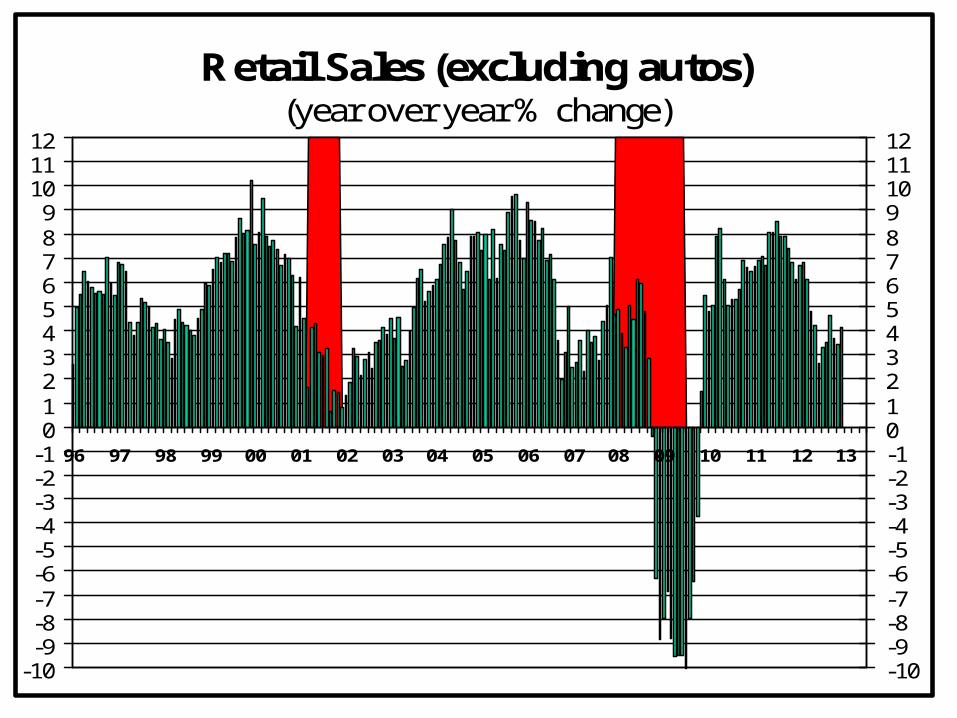
Retail Sales (excluding autos)(year over year % change)
-10-9-8-7-6-5-4-3-2-10123456789
101112
96 97 98 99 00 01 02 03 04 05 06 07 08 09 10 11 12 13
-10-9-8-7-6-5-4-3-2-10123456789101112

Y
X
Production Function,… y = f (x),….technology
Inputs / Resources / Factors of Production
Outputs
The Essence of EconomicsLimited Resources => Limited Goods/Services < Unlimited Desires
Scarcity/Constraints
Scarcity => Tradeoffs => Choice
Economics The study of the choices people make to attain their goals, given their scarce resources.
Scarcity The situation in which unlimited wants exceed the limited resources available to fulfill those wants.Trade-off The idea that because of scarcity, producing more of one good or service means producing less of another good or service.
Decreasing Marginal Product => Increasing Marginal Cost => Upward Sloping Supply Curve

U.S Poverty Rate% Below Poverty Level
(46.2 million in poverty)
13.413.0
12.8
13.5
14.2
15.1
14.5
13.8 13.7
13.3
12.7
11.9
11.3
11.712.1
12.512.7 12.6
12.312.5
13.2
14.3
15.1 15.014.8
8
9
10
11
12
13
14
15
16
87 88 89 90 91 92 93 94 95 96 97 98 99 00 01 02 03 04 05 06 07 08 09 10 11
Source: U.S Censu Bureau
ScarcityLimited Resources => Limited Goods/Services < Wants
PovertyLimited Resources => Limited Goods/Services < Needs

Production Function
0
1
2
3
4
0 1 2 3 4 5 6 7 8 9Input, X
Out
put,
Y

Production Function
0
1
2
3
4
0 1 2 3 4 5 6 7 8 9Input, X
Out
put,
Y

16 Economic Principles#1 Choices are necessary because resources are scarceA resource is anything that can be used to produce something else: land labor, capital, and human
capital. Resources are scarce – the quantity available is not large enough to satisfy all productive uses.
#2 The true cost of something is its opportunity costThe real cost of an item is its opportunity cost: what you must give up in order to get it. Opportunity
cost is not only monetary cost.

16 Economic Principles#3 “How much” is a decision at the margin
Most decisions of interest to economists involve decisions at the margin. You make a tradeoff when you compare the costs with the benefits of doing something. Decisions about whether to do a bit more or a bit less of an activity are marginal decisions. The study of such decisions is known as marginal analysis. Marginal Analysis: Compare marginal costs to marginal benefitsOptimal decisions are made on the margin,…spend a little more, save a little less vs. all or nothing. An activity should be continued to the point where the marginal benefit is equal to the marginal cost.
#4 People usually respond to incentives, exploiting opportunities to make themselves better off
1. People will exploit opportunities until the opportunities are fully exhausted. People respond to incentives. An incentive is anything that offers a reward to people who change their behavior. Incentives Matter•Q. D. = F( P; Income, tastes, expectations,…..)•Q. S. = F( P; technology,……)

16 Economic Principles#5 There are gains from tradeIn a market economy individuals engage in trade – they provide goods and services to others and
receive goods and services in return. There are gains from trade – people can get more of what they want through trade than they could if they tried to be self-sufficient. This increase in output is due to specialization – each person specializes in the task that he or she is good at performing.
#6 Markets move towards equilibriumAn economic situation is in equilibrium when no individual would be better off taking a different
action.

16 Economic Principles#7 Resources should be used efficiently to achieve society’s goalsAn economy is efficient if it takes all opportunities to make some people better off without making
others worse off. When an economy is efficient, it is producing the maximum gains from trade possible, given the resources available. There are tradeoffs between using resources efficiently and attaining equity in the distribution of goods
#8 Markets usually lead to efficiencyThe incentives built into a market economy ensure that resources are usually put to good use, that all
opportunities to make everyone better off have been exploited. The economy as a whole benefits if each individual specializes in a task and trades with others.

16 Economic Principles#9 When markets don’t achieve efficiency, government
intervention can improve society’s welfareMarkets fail to achieve for three principal reasons
1. Externalities - Individual actions have side effects that are not properly taken into account.
2. Competition - Some markets are not competitive so one party attempts to capture a greater share of resources for itself.
3. Public goods – some goods by their very nature are unsuited for efficient management by markets.
4. Asymmetric information – not all market participants have full information when making decisions
#10 One person’s spending is another person’s income
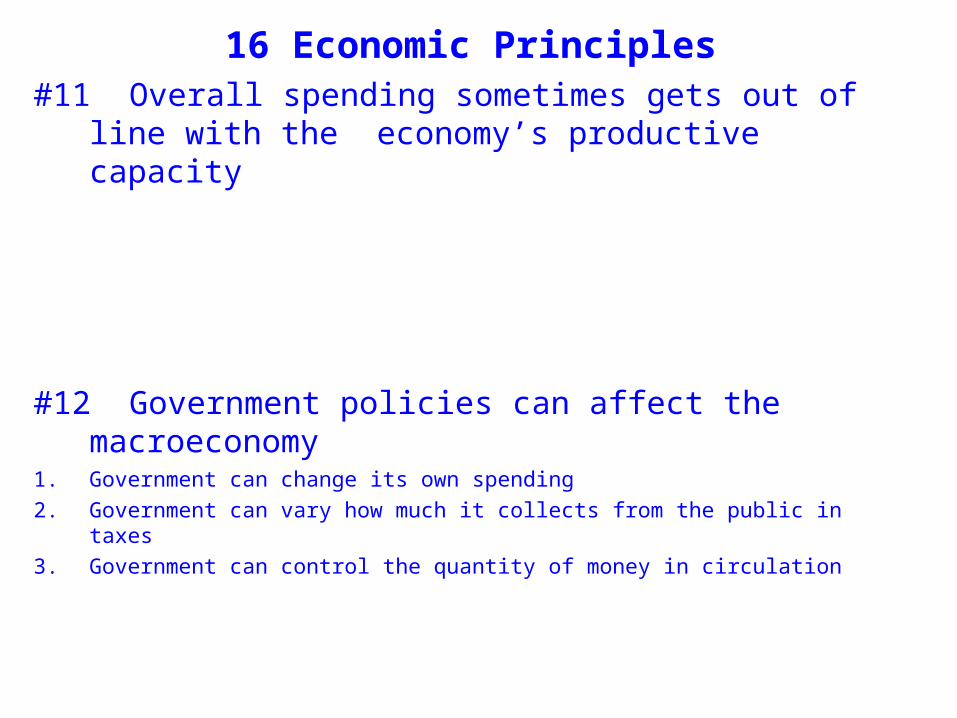
16 Economic Principles#11 Overall spending sometimes gets out of line with the
economy’s productive capacity
#12 Government policies can affect the macroeconomy1. Government can change its own spending
2. Government can vary how much it collects from the public in taxes
3. Government can control the quantity of money in circulation

16 Economic Principles#13 Information is scarce => uncertainty is fact of life
#14 Economic events => primary and secondary effects• Law of unintended consequences• Effective policy evaluation looks for indirect effects
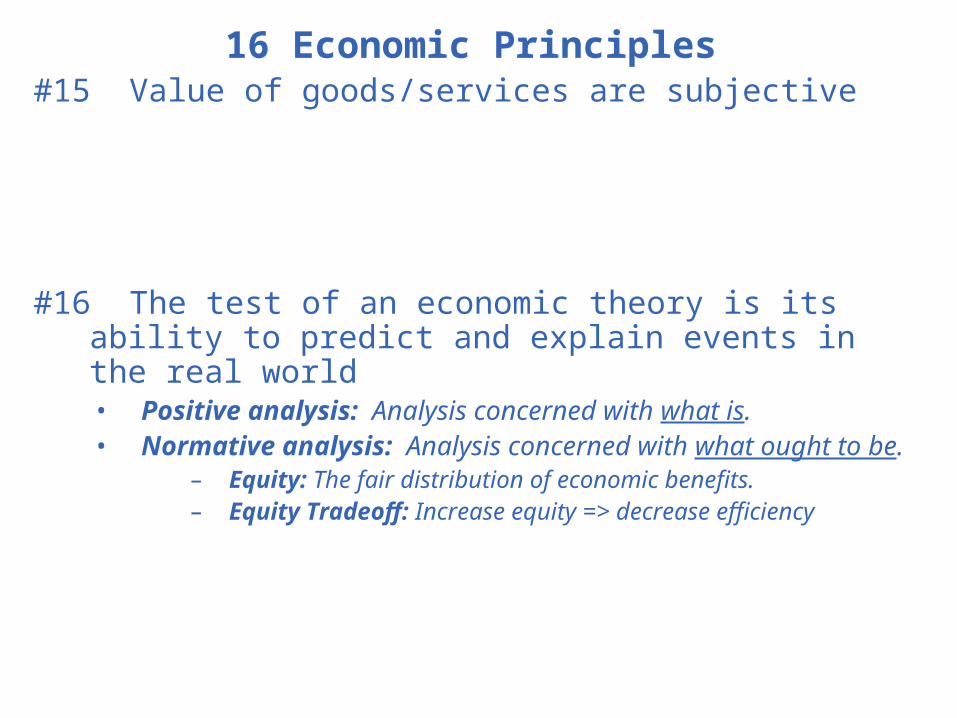
16 Economic Principles#15 Value of goods/services are subjective
#16 The test of an economic theory is its ability to predict and explain events in the real world• Positive analysis: Analysis concerned with what is.• Normative analysis: Analysis concerned with what ought to be.
– Equity: The fair distribution of economic benefits.– Equity Tradeoff: Increase equity => decrease efficiency

4 Pitfalls to avoid in Economic Thinking
1. Violation of Ceteris Paribus.• Hold “other things equal”
2. Good intentions do not guarantee desirable outcomes• Unsound proposal => undesirable outcomes• Political games
3. Fallacy of Composition• Erroneous view that what is true for the individual is also true for
the whole• Micro vs Macro Economics
4. Association is not Causation• Logical fallacy: Post Hoc Ergo Propter Hoc

The Scientific Method Applied to Social SciencesEconomic Model – simplified version of reality.
Economic models/theories make behavioral assumptions about economic agent motives.
5 Steps to Develop and Test an Economic Model1. Decide on the assumptions to be used in developing the model.
2. Formulate a testable hypothesis - is a statement that may be either correct or incorrect about an economic variable. Economic hypothesis are usually about a causal relationship; X => Y
3. Use economic data to test hypothesis – analyze statistics on relevant economic variables to access the question, did X cause Y?
4. Revise the model if it fails to explain well the economic data.
5. Retain the revised model to help answer similar economic questions in the future.

Interest Rates and Recessions 1988-2011
0
1
2
3
4
5
6
7
8
9
10
88 89 90 91 92 93 94 95 96 97 98 99 00 01 02 03 04 05 06 07 08 09 10 11 12
0
1
2
3
4
5
6
7
8
9
10
Recession Baa Fed Funds 10-yr Treas

Real Fed Funds (fed funds - core CPI)
-8
-6
-4
-2
0
2
4
6
8
10
12
70 72 74 76 78 80 82 84 86 88 90 92 94 96 98 00 02 04 06 8 10 12
0.10% - 2.0% = -1.9%
4% = Recession causing level
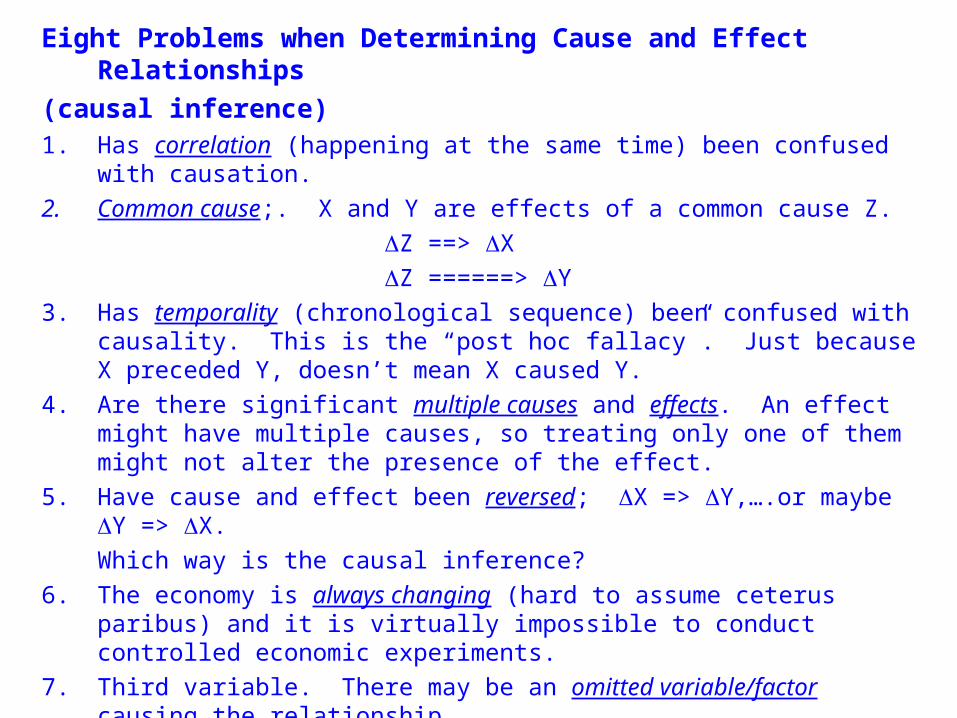
Eight Problems when Determining Cause and Effect Relationships
(causal inference)1. Has correlation (happening at the same time) been confused with causation.
2. Common cause;. X and Y are effects of a common cause Z.
Z ==> X
Z ======> Y
3. Has temporality (chronological sequence) been confused with causality. This is the “post hoc fallacy”. Just because X preceded Y, doesn’t mean X caused Y.
4. Are there significant multiple causes and effects. An effect might have multiple causes, so treating only one of them might not alter the presence of the effect.
5. Have cause and effect been reversed; X => Y,….or maybe Y => X.
Which way is the causal inference?
6. The economy is always changing (hard to assume ceterus paribus) and it is virtually impossible to conduct controlled economic experiments.
7. Third variable. There may be an omitted variable/factor causing the relationship.
8. Are there intervening or counteracting causes. Both will reduce causal force brought to bear on the alleged effect.
If statistical analysis confirms hypothesis, then accept economic model/theory.
Rather than being “accepted”, hypothesis are considered “not rejected” .

P*
S
D
Quantity Demanded/Supplied
Price
Q*
Determined by Profit MaximizationMarginal Cost per unitMinimum willing to receive
Determined by Utility MaximizationMarginal Benefit per unitMaximum willingness to pay
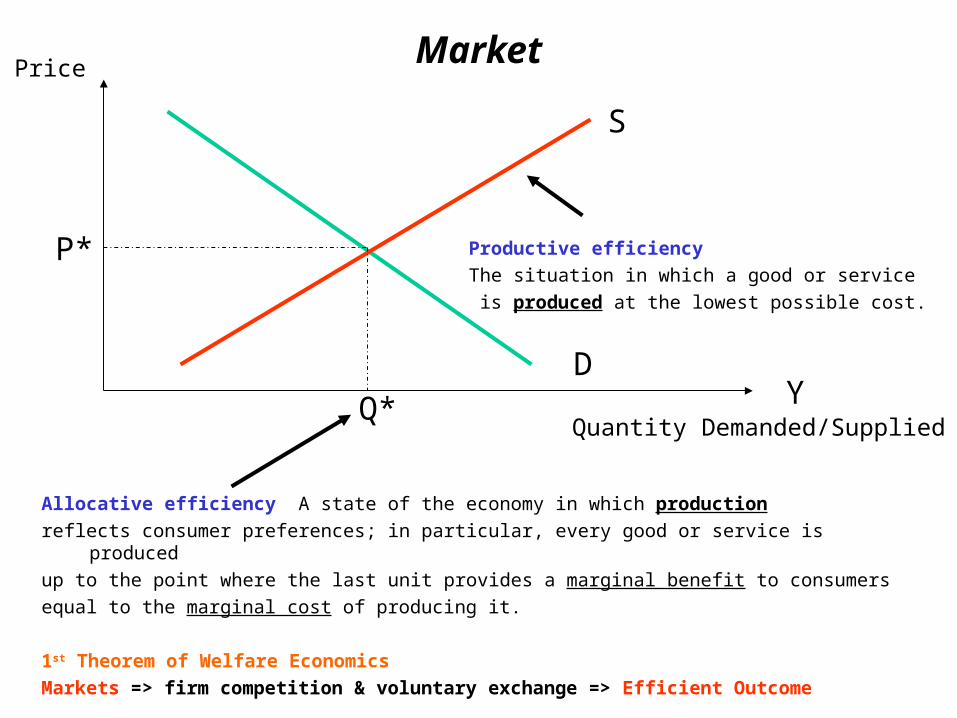
The Market A group of buyers and sellers of a good or service and the institution or arrangement by which they come together to trade.
Voluntary exchange The situation that occurs in markets
when both the buyer and seller of a product
are made better off by the transaction.

The Market Economy & Resource Allocation
P*
S
D
Quantity Demanded/Supplied
Price
Q*
Determined by profit Maximization
Determined by Utility Maximization
Production Function
Inputs
Y
X
Market economy An economy in which the decisions of households and firms interacting in markets allocate economic resources.
Centrally planned economy An economy in which the government decides how economic resources will be allocated.
Market
P*
S
D
Quantity Demanded/Supplied
Price
Q* Y
Allocative efficiency A state of the economy in which productionreflects consumer preferences; in particular, every good or service is producedup to the point where the last unit provides a marginal benefit to consumers equal to the marginal cost of producing it.
1st Theorem of Welfare EconomicsMarkets => firm competition & voluntary exchange => Efficient Outcome
Productive efficiencyThe situation in which a good or service is produced at the lowest possible cost.

Quantity Supplied per yearInflow/Production
Quantity demandedper yearOutflow/Sales
Water/Inventory/Stock
Valve = Price# of threads = elasticity
Equilibrium ConditionInflow = Outflow
QS = QDDetermines Price/Valve turns
Adam Smith’s Invisible Hand

Personal Income, Spending & Savings(Gauge of Economic Activity)
Web: www.bea.doc.gov/bea/newsreleases/rels.htmRevisions for several months after initial release. Annual revisions done every summer. Benchmarked every 5 years.
Income + Debt = Taxes + Debt Interest + Spending + SavingsWages & salaries 51% Durable goods 10% - 15%Proprietors income 8% Nondurable goods 20% - 25%Rental income 3% Services 60% - 70% Dividend income 5% Interest income 8%Transfer payments 17%Other labor income 8%
Debt = borrowing future income for current consumptionDebt Interest = interest payments on consumer loans to creditors (consumption expense). If Interest payments-to-DPI > 2.5%, then households may be experiencing financial stress
and future spending may suffer.Spending = Personal Consumption Expenditures, PCE, make up over 70% of total GDP
Savings = residual = Y – T – C – I = S – D. Does not include capital gains on stocks, bonds, real estate.
Spending is a function of income, Wealth and P/P. Incomet => C t+1
If PStock = $1, then C = 3-6 centsIf PHouse = $1, then C = 2-4 cents
Real disposable personal income is a better portent of future consumer demand. Best measure of true consumer purchasing power. real DPI foreshadows spending
Watch for precipitous changes in savings rates. Indicator of households’ concerns of financial future income/job security => savings rate => C optimism => savings rate => interest rates => investment
Durable goods are expensive, often involve financing, and are sensitive to swings in the economy income/job stability => durable goods orders => productionExcellent predictor of economic turning points durable good orders =>(6-12 months) recession onset durable good orders =>(1-2 months) recession ends/recovery begins
The latest 3-month change in real PCE is a good indicator of quarterly GDP
PCE Price index – Best measure of consumer inflation. Federal Reserve uses when setting interest rate policy. Typically 0.3 percentage points lower than CPI because it takes account of changing buying habits as relative prices change (substitution effect). Fed targets the PCE Price Index in the 1.75%-2.0% range.
------------------------------------------------------------------------------------------------------------------------------------------------------------------------------------------------------------------------------------------------------------------------------------------------------------
Market AnalysisBonds: Strong income/spending numbers => Y/Y => P/P => Federal Reserve rates => DBonds=> iBonds
Stocks: Strong income/spending numbers => Y/Y => profits => PStocks
Dollar: Strong income/spending numbers => Y/Y => iBonds => DDollar => PDollar
EconomicIndicator 4

Personal Income & Consumption Expenditures[Year Over Year % Change]
-6
-5
-4
-3
-2
-1
0
1
2
3
4
5
6
7
8
9
10
88 89 90 91 92 93 94 95 96 97 98 99 00 01 02 03 04 05 06 07 08 09 10 11 12 13
-6
-5
-4
-3
-2
-1
0
1
2
3
4
5
6
7
8
9
10
Recession Consumption Income