RETAIL RESEARCH JK Tyre & Industries Ltd - HDFC … RESEARCH Pick of the Week 22 May 2017 JK Tyre &...
18
RETAIL RESEARCH Pick of the Week 22 May 2017 JK Tyre & Industries Ltd RETAIL RESEARCH Page | 1 Industry CMP Recommendation Add on Dips to band Sequential Targets Time Horizon Tyres Rs. 175 Buy at CMP and add on declines Rs. 153-157 Rs. 203 & Rs. 227 2-3 quarters JK Tyre & Industries (JKTL) is the flagship company of the JK organization which has other interests in paper, cement, seeds and dairy. It is one of India’s leading tyre brands (pioneer in truck radials) and among the 25 largest tyre companies in the world. JKTL started manufacturing tyres in 1977 with a capacity of 0.5 mn tyres per annum which has grown to 35 mn tyres per annum currently through organic and inorganic route. The company is the market leader in truck/bus radial tyres. It has 9 manufacturing plants in India strategically located across the country – Mysuru, Banmore, Kankroli, Chennai and Haridwar and 3 in Mexico. Investment Rationale: Improvement in road infrastructure to drive higher sales of CVs Cavendish acquisition facilitates 2/3W segment entry and capacities for TBB/TBR Increasing radialisation in commercial vehicles Capex completed, revenue growth to kick in Price hikes taken to compensate increase in rubber prices Signs of dumping by China fading away Concerns: Raw material price volatility Dumping of tyres by China Slowdown in automobile growth High competition from peer companies Tornell unit could come under US trade restrictions Financial Summary - Consolidated (Rs Cr) Q4FY17 Q4FY16 YoY (%) Q3FY17 QoQ (%) FY16 FY17 FY18E FY19E Operating Income 2152.5 1732.3 24.3 1837.7 17.1 6953.1 7689.4 8441.3 9264.1 EBITDA 200.1 273.7 -26.9 252.7 -20.8 1141.5 1132.4 1350.6 1463.7 PAT 88.8 123.4 -28.1 86.2 3.0 463.8 375.4 438.9 541.7 EPS (Rs) 19.6 27.2 19.0 20.4 16.6 19.4 23.9 P/E (x) 8.6 10.6 9.0 7.3 EV/EBITDA (x) 5.9 8.3 6.5 5.6 RoNW (%) 16.4 14.7 16.0 15.8 (Source: Company, HDFC sec) HDFC Scrip Code JKTYREEQNR BSE Code 530007 NSE Code JKTYRE Bloomberg JKI IN CMP as on 19 May 17 174.70 Eq. Capital (Rs crs) 45.36 Face Value (Rs) 2 Equity Sh. Outs (Cr) 22.68 Market Cap (Rs crs) 3962.43 Book Value (Rs) 93.02 Avg. 52 Week Vol 22,10,000 52 Week High 184.75 52 Week Low 79.40 Shareholding Pattern-% (Mar-2017) Promoters 52.34 Institutions 13.60 Non Institutions 34.06 Total 100.0 Research Analyst: Atul Karwa [email protected]
Transcript of RETAIL RESEARCH JK Tyre & Industries Ltd - HDFC … RESEARCH Pick of the Week 22 May 2017 JK Tyre &...

RETAIL RESEARCH Pick of the Week 22 May 2017
JK Tyre & Industries Ltd
RETAIL RESEARCH P a g e | 1
Industry CMP Recommendation Add on Dips to band Sequential Targets Time Horizon
Tyres Rs. 175 Buy at CMP and add on declines Rs. 153-157 Rs. 203 & Rs. 227 2-3 quarters
JK Tyre & Industries (JKTL) is the flagship company of the JK organization which has other interests in paper, cement, seeds and dairy. It is one of India’s leading tyre brands (pioneer in truck radials) and among the 25 largest tyre companies in the world. JKTL started manufacturing tyres in 1977 with a capacity of 0.5 mn tyres per annum which has grown to 35 mn tyres per annum currently through organic and inorganic route. The company is the market leader in truck/bus radial tyres. It has 9 manufacturing plants in India strategically located across the country – Mysuru, Banmore, Kankroli, Chennai and Haridwar and 3 in Mexico. Investment Rationale:
Improvement in road infrastructure to drive higher sales of CVs Cavendish acquisition facilitates 2/3W segment entry and capacities for TBB/TBR Increasing radialisation in commercial vehicles Capex completed, revenue growth to kick in Price hikes taken to compensate increase in rubber prices Signs of dumping by China fading away
Concerns:
Raw material price volatility Dumping of tyres by China Slowdown in automobile growth High competition from peer companies Tornell unit could come under US trade restrictions
Financial Summary - Consolidated (Rs Cr) Q4FY17 Q4FY16 YoY (%) Q3FY17 QoQ (%) FY16 FY17 FY18E FY19E Operating Income 2152.5 1732.3 24.3 1837.7 17.1 6953.1 7689.4 8441.3 9264.1 EBITDA 200.1 273.7 -26.9 252.7 -20.8 1141.5 1132.4 1350.6 1463.7 PAT 88.8 123.4 -28.1 86.2 3.0 463.8 375.4 438.9 541.7 EPS (Rs) 19.6 27.2 19.0 20.4 16.6 19.4 23.9 P/E (x) 8.6 10.6 9.0 7.3 EV/EBITDA (x) 5.9 8.3 6.5 5.6 RoNW (%) 16.4 14.7 16.0 15.8
(Source: Company, HDFC sec)
HDFC Scrip Code JKTYREEQNR
BSE Code 530007
NSE Code JKTYRE
Bloomberg JKI IN
CMP as on 19 May 17 174.70
Eq. Capital (Rs crs) 45.36
Face Value (Rs) 2
Equity Sh. Outs (Cr) 22.68
Market Cap (Rs crs) 3962.43
Book Value (Rs) 93.02
Avg. 52 Week Vol 22,10,000
52 Week High 184.75
52 Week Low 79.40
Shareholding Pattern-% (Mar-2017) Promoters 52.34
Institutions 13.60
Non Institutions 34.06
Total 100.0 Research Analyst: Atul Karwa [email protected]

RETAIL RESEARCH
RETAIL RESEARCH P a g e | 2
View and Valuation The acquisition of Cavendish (from Kesoram Industries Ltd) in April 2016 has given the company entry into the high volume 2/3W segment and additional TBR capacity which would drive its growth in the near term. Capacity expansions at its Chennai has also been completed and capacity utilization has been ramped up. The dwindling threat of Chinese imports should result in higher volumes and better margins for the company. Softening raw material prices and recent price hikes taken would lead to higher revenues and better margins in the coming year/s. The management is focusing on reducing debt which at 2.8x is the highest amongst the listed peer companies. JK Tyres has a successful track record of inorganic growth (Tornell in the past) and would soon succeed in reaping the benefits of Cavendish acquisition. The whole tyre sector trades at low P/E multiple, we see scope for a rerating of the sector. Easing competitive intensity and price aggression leading to cross‐cycle margin flexibility could lead the rerating for a sector that otherwise enjoys healthy return ratios and has a very high exposure to the lucrative after‐market (like the battery sector, which trades at a 100%+ premium to tyres). JK Tyres quotes at an even lower P/E compared to its peers probably due to the high debt on its books. The brand names of the tyres remain visible in the vehicles resulting in brand recall (contrary to a lot of other auto ancilliary items including Batteries which are hidden in the vehicle). At CMP of Rs 175 the stock quotes at 7.3x FY19E EPS (5.6xFY19 EV/EBITDA). We feel investors could buy the stock at the CMP and add on dips to Rs 153-157 band (6.5xFY19E EPS; equivalent to 5.3xFY19 EV/EBITDA) for sequential targets of Rs. 203 (8.5xFY19E EPS; equivalent to 6xFY19 EV/EBITDA) and Rs 227 (9.5xFY19E EPS; equivalent to 6.4xFY19 EV/EBITDA) in 2-3 quarters. Company Description JK Tyre & Industries (JKTL) is the flagship company of the JK organization which has other interests in paper, cement, seeds and dairy. It is one of India’s leading tyre brands (pioneer in truck radials) and among the 25 largest tyre companies in the world. It started manufacturing tyres in 1977 with a capacity of 0.5 mn tyres p.a. which has grown to 35 mn tyres p.a. through organic and inorganic route. The company is the market leader in truck/bus radial tyres. It has 9 manufacturing plants in India strategically located across the country – Mysuru, Banmore, Kankroli, Chennai and Haridwar and 3 in Mexico. JK Tyre acquired a tyre company Tornel with three manufacturing plants in Mexico in 2008 for Rs 270 cr. The acquisition enhanced its capacity at a low cost and establish its international manufacturing footprint. JK Tornel has a capacity of 8.3 mn tyres per annum and enjoys strategic tie-ups with leading OEMs including Chrysler, Volkswagen, Nissan (car/light truck radial) and John Deere (Farm). In April 2016 JKTL acquired Cavendish Industries Ltd. (CIL) from a unit of BK Birla Group’s Kesoram Industries Ltd for an enterprise value of Rs 2170 cr. CIL possesses 3 manufacturing units at Haridwar with excise benefits and gives JKTL an entry into the high volume 2/3W segment apart from TBR and Truck Nylon (Bias) capacities.
RETAIL RESEARCH
RETAIL RESEARCH P a g e | 3
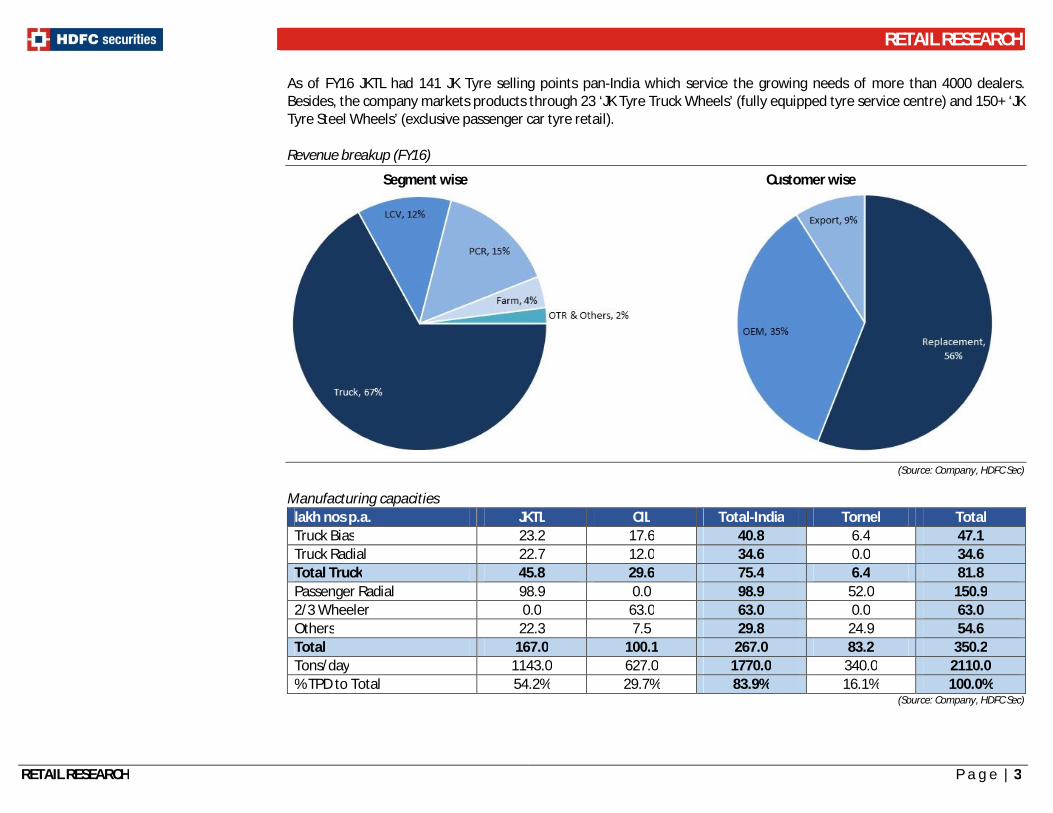
As of FY16 JKTL had 141 JK Tyre selling points pan-India which service the growing needs of more than 4000 dealers. Besides, the company markets products through 23 ‘JK Tyre Truck Wheels’ (fully equipped tyre service centre) and 150+ ‘JK Tyre Steel Wheels’ (exclusive passenger car tyre retail). Revenue breakup (FY16)
Segment wise Customer wise
(Source: Company, HDFC Sec) Manufacturing capacities
lakh nos p.a. JKTL CIL Total-India Tornel Total Truck Bias 23.2 17.6 40.8 6.4 47.1 Truck Radial 22.7 12.0 34.6 0.0 34.6 Total Truck 45.8 29.6 75.4 6.4 81.8 Passenger Radial 98.9 0.0 98.9 52.0 150.9 2/3 Wheeler 0.0 63.0 63.0 0.0 63.0 Others 22.3 7.5 29.8 24.9 54.6 Total 167.0 100.1 267.0 83.2 350.2 Tons/day 1143.0 627.0 1770.0 340.0 2110.0 % TPD to Total 54.2% 29.7% 83.9% 16.1% 100.0%
(Source: Company, HDFC Sec)
RETAIL RESEARCH
RETAIL RESEARCH P a g e | 4
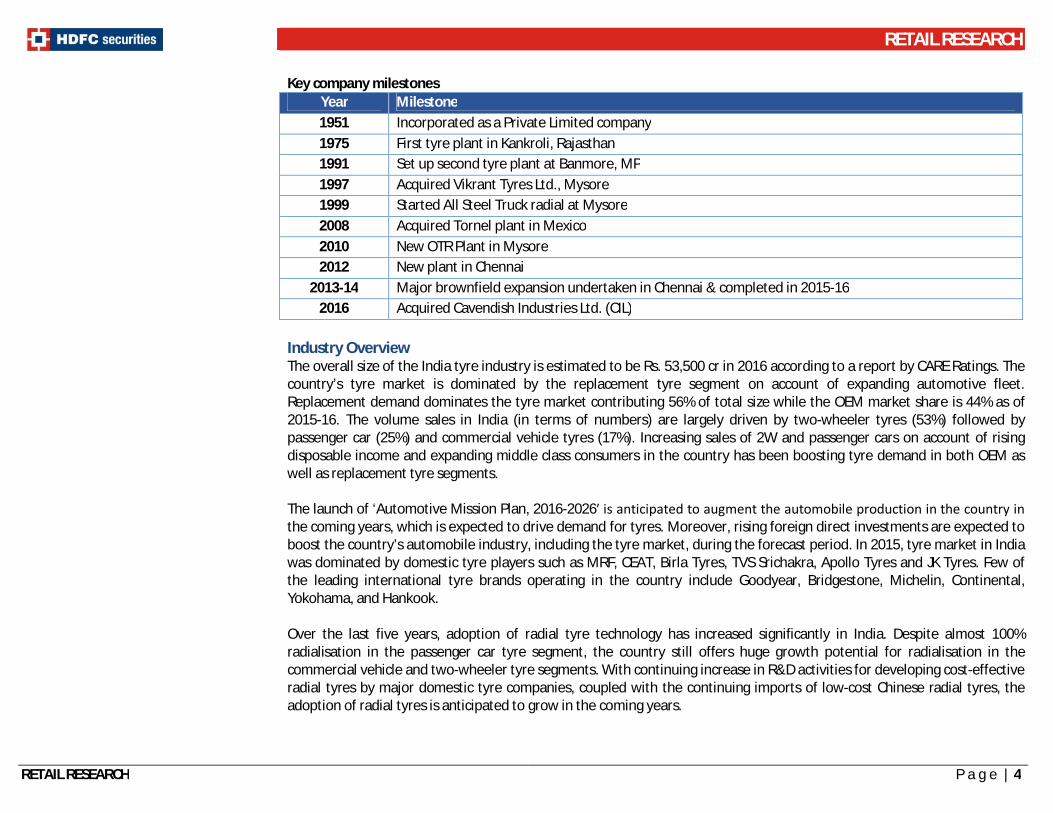
Key company milestones Year Milestone 1951 Incorporated as a Private Limited company 1975 First tyre plant in Kankroli, Rajasthan 1991 Set up second tyre plant at Banmore, MP 1997 Acquired Vikrant Tyres Ltd., Mysore 1999 Started All Steel Truck radial at Mysore 2008 Acquired Tornel plant in Mexico 2010 New OTR Plant in Mysore 2012 New plant in Chennai
2013-14 Major brownfield expansion undertaken in Chennai & completed in 2015-16 2016 Acquired Cavendish Industries Ltd. (CIL)
Industry Overview The overall size of the India tyre industry is estimated to be Rs. 53,500 cr in 2016 according to a report by CARE Ratings. The country’s tyre market is dominated by the replacement tyre segment on account of expanding automotive fleet. Replacement demand dominates the tyre market contributing 56% of total size while the OEM market share is 44% as of 2015-16. The volume sales in India (in terms of numbers) are largely driven by two-wheeler tyres (53%) followed by passenger car (25%) and commercial vehicle tyres (17%). Increasing sales of 2W and passenger cars on account of rising disposable income and expanding middle class consumers in the country has been boosting tyre demand in both OEM as well as replacement tyre segments. The launch of ‘Automotive Mission Plan, 2016-2026′ is anticipated to augment the automobile production in the country in the coming years, which is expected to drive demand for tyres. Moreover, rising foreign direct investments are expected to boost the country’s automobile industry, including the tyre market, during the forecast period. In 2015, tyre market in India was dominated by domestic tyre players such as MRF, CEAT, Birla Tyres, TVS Srichakra, Apollo Tyres and JK Tyres. Few of the leading international tyre brands operating in the country include Goodyear, Bridgestone, Michelin, Continental, Yokohama, and Hankook. Over the last five years, adoption of radial tyre technology has increased significantly in India. Despite almost 100% radialisation in the passenger car tyre segment, the country still offers huge growth potential for radialisation in the commercial vehicle and two-wheeler tyre segments. With continuing increase in R&D activities for developing cost-effective radial tyres by major domestic tyre companies, coupled with the continuing imports of low-cost Chinese radial tyres, the adoption of radial tyres is anticipated to grow in the coming years.

RETAIL RESEARCH
RETAIL RESEARCH P a g e | 5
Tyre production trend
(Source: ATMA, HDFC Sec)
There were 39 companies (2014-15) in the domestic tyre industry as per ATMA with the top 10 companies accounting for 85-90% of the market share. The export revenues stood at around Rs 10,000 cr during the year FY16. The Indian tyre industry underwent a structural change during FY11-16 wherein pricing discipline assumed centre stage.
(lakh units) 2010-11 2011-12 2012-13 2013-14 2014-15 2015-16 5 yr CAGR Truck & Bus 156.7 160.9 165.3 164.7 171.1 167.6 1.4% LCV 60.3 66.9 82.0 93.5 102.0 97.3 10.0% Passenger Car 277.0 287.4 320.8 316.7 357.4 387.0 6.9% Farm/Tractor 54.2 56.7 56.3 67.2 59.8 58.1 1.4% 2/3 Wheeler 632.6 670.5 590.9 634.4 759.9 799.4 4.8% OTR 1.9 2.0 3.6 4.7 4.3 5.0 21.1% Total 1192.0 1254.0 1227.8 1288.8 1461.5 1520.3 5.0%
(Source: ATMA, HDFC Sec)

RETAIL RESEARCH
RETAIL RESEARCH P a g e | 6
Investment Rationale Improvement in road infrastructure to drive higher sales of commercial vehicles The Modi government has placed high importance on upgrading the road infrastructure in India. Budget of 2017 has allocated Rs 64,900 cr for the highway sector. The government is looking to build 2000 km of coastal roads. Highway construction in 2016-17 touched all time high at 8,144 km, which is 33% more than last year. Similarly award of works also increased to the maximum at 16,031 km, which is 60% more than last year. Construction of roads on such a large scale would pep up demand for commercial vehicles. Once the new roads are constructed it would provide easier last mile connectivity and give a push to commercial vehicle as well as passenger car demand. Indian Tyre Sales breakup
(Source: Company, HDFC Sec) Cavendish acquisition facilitates 2/3W segment entry and capacities for TBB/TBR JK Tyre along with its wholly owned subsidiary JK Asia Pacific (S) Pte Ltd. acquired the tyre, tube and flap maker Cavendish Industries (CIL), a unit of BK Birla Group’s Kesoram Industries Ltd. with effect from 13th April 2016 for an enterprise value of Rs 2170 cr. This acquisition has given JKTL a strategic entry into the very fast moving 2/3W segment which was lacking in its portfolio. JK Tyre will hold a 64% stake in Cavendish, while the rest will be held by Bengal & Assam and Valiant (JK Tyres holds 49% stake in this LLP). The deal will add a capacity to produce 10 mn tyres p.a. (6.3 mn 2/3W, 1.8 mn TBB, 1.2 mn TBR, 0.7 mn others) at Laksar (Haridwar) and will also boost its capacity to produce truck and bus radials. With the Cavendish acquisition JK Tyres’ domestic capacity has gone up by as much as above between 50-60% totally. The 2/3 wheeler capacity can be increased by adding some balancing equipment.

RETAIL RESEARCH
RETAIL RESEARCH P a g e | 7
The deal was structured in a way that JK Tyre had invested Rs.450 cr in the deal, but it had not taken any debt on its books. Money has been raised by Cavendish itself as well as JK Group’s associate firms such as Bengal & Assam Co. Ltd (the holding company) and Valiant Pacific LLC, a trading firm. The management has been able to turn around the company. The unit was shut before it was taken over by JK Tyres. After starting at a low utilization levels, the units have now reached 55-60% utilization levels (except TBB where the utilization is low @~35%). The unit has turned PBT positive in Q4FY17. Further the unit has excise exemption till FY20. With JKTL having a 64% stake in the unit, it should help in higher margins for the company on a consolidated basis. The unit has now started a new brand Challenger (low price tyres to compete with Chinese), which has been well received.
Cavendish deal structure
(Source: Company, HDFC Sec)
Capex completed, revenue growth to kick in JKTL undertook expansion of its all-radial Chennai plant in FY14. The Rs 1430 cr expansion to increase the capacity of its Truck/Bus and Passenger car radials by 0.8 mn and 1.8 mn units respectively was completed in FY16. It expanded its Passenger car radial capacity in Mexico as well from 3.5 mn units per annum to 5 mn units at an expenditure of US$22 mn. As the capacities were at optimum utilization levels before expansion we expect the ramp-up in utilization of new capacities to be quick and volume growth to be strong going forward.

RETAIL RESEARCH
RETAIL RESEARCH P a g e | 8
Capacity addition in TBR and PCR Capacity (Lac nos p.a.) Before Expansion Addition After Expansion
TBR 14.65 8.00 22.65 PCR/LTR 81.10 17.75 98.85
PCR (Mexico) 35.00 15.00 50.00 (Source: Company, HDFC Sec)
With most capex completed, focus will now be on sweating these assets including the Cavendish assets for the next 1-1.5 years post which plans for next capex would be finalized. In the meanwhile the cashflows will be utilized to pare down the debt on books. Increasing radialization in commercial vehicles After radialization in the passenger car segment the trend is now catching up in the commercial vehicle segment. The manufacturers have been introducing next generation better equipped trucks and buses which require premium products. The Indian CV industry has been moving away from looking at the initial cost towards cost of ownership over the life of the vehicle. The increasing awareness of cost-benefits of radial tyres over bias tyres is also resulting in strong growth of radial tyres in the replacement markets as well. At the end of H1FY17 ~75% of the tyres supplied to OEM manufacturers of M&HCV were radial tyres as compared to ~50% three years ago. Including the replacement market radialization levels have reached 46% by Sep-2017 compared to 26% at the end of FY14. As per industry estimates OEM radialization is expected to reach 88% by FY21 while overall radialization is likely to be 77%.
Radialization in Truck/Buses to reach ~90% by FY21
(Source: Company, HDFC Sec)
RETAIL RESEARCH
RETAIL RESEARCH P a g e | 9
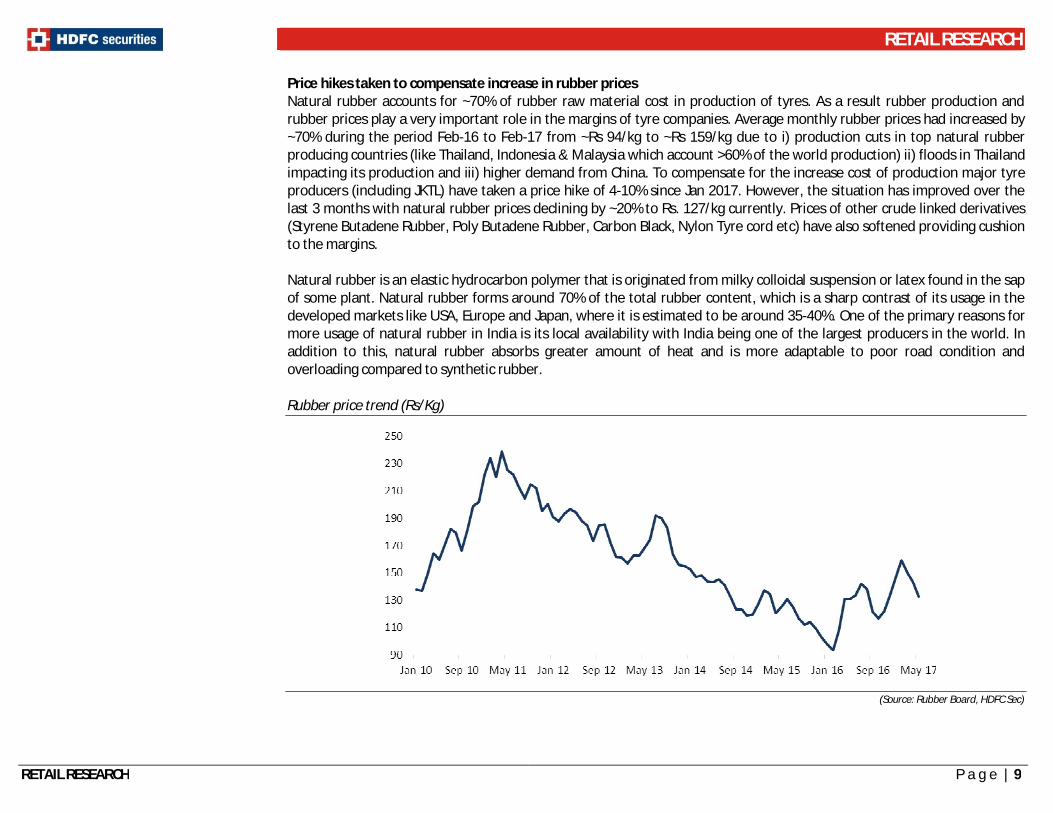
Price hikes taken to compensate increase in rubber prices Natural rubber accounts for ~70% of rubber raw material cost in production of tyres. As a result rubber production and rubber prices play a very important role in the margins of tyre companies. Average monthly rubber prices had increased by ~70% during the period Feb-16 to Feb-17 from ~Rs 94/kg to ~Rs 159/kg due to i) production cuts in top natural rubber producing countries (like Thailand, Indonesia & Malaysia which account >60% of the world production) ii) floods in Thailand impacting its production and iii) higher demand from China. To compensate for the increase cost of production major tyre producers (including JKTL) have taken a price hike of 4-10% since Jan 2017. However, the situation has improved over the last 3 months with natural rubber prices declining by ~20% to Rs. 127/kg currently. Prices of other crude linked derivatives (Styrene Butadene Rubber, Poly Butadene Rubber, Carbon Black, Nylon Tyre cord etc) have also softened providing cushion to the margins. Natural rubber is an elastic hydrocarbon polymer that is originated from milky colloidal suspension or latex found in the sap of some plant. Natural rubber forms around 70% of the total rubber content, which is a sharp contrast of its usage in the developed markets like USA, Europe and Japan, where it is estimated to be around 35-40%. One of the primary reasons for more usage of natural rubber in India is its local availability with India being one of the largest producers in the world. In addition to this, natural rubber absorbs greater amount of heat and is more adaptable to poor road condition and overloading compared to synthetic rubber. Rubber price trend (Rs/Kg)
(Source: Rubber Board, HDFC Sec)
RETAIL RESEARCH
RETAIL RESEARCH P a g e | 10
Signs of dumping by China fading away With the threat of anti-dumping duty being imposed by US International Trade Commission (USITC), Chinese manufacturers had turned their attention to India. Average monthly TBR imports from China surged to 166,000 tyres in June-16 from 54,000 tyres in CY13 as the price difference between the imported tyres and domestically manufactured tyres was almost 30%. The demonetization of Indian currency put a huge dent in the imports as these were mostly cash based resorting to under invoicing to reduce incidence of import duties.
Further, the USITC has ruled against levying anti-dumping duty against Chinese imports into USA at this point of time as they did not find any conclusive evidence of Chinese imports impacting their domestic industries. Consequently, the Chinese manufacturers have once again increased their exports to US where the margins are more lucrative. Also they had increased their prices by 10-15% thereby reducing the price differential. The Automotive Tyre Manufacturers Association (ATMA) had also made a presentation to the Government to levy anti-dumping duty on Chinese imports, the outcome of which is expected in the coming months. Reduction of Chinese imports is positive for JKTL as it derives 75-80% of its revenues from TBR segment.
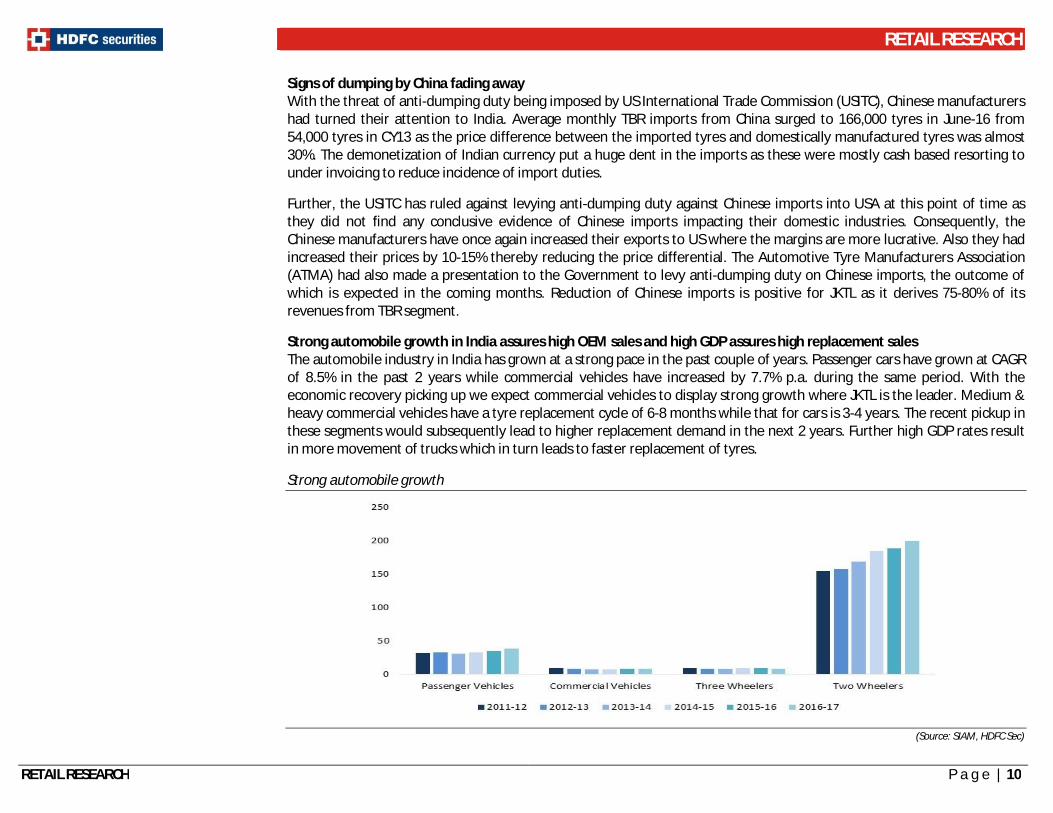
Strong automobile growth in India assures high OEM sales and high GDP assures high replacement sales The automobile industry in India has grown at a strong pace in the past couple of years. Passenger cars have grown at CAGR of 8.5% in the past 2 years while commercial vehicles have increased by 7.7% p.a. during the same period. With the economic recovery picking up we expect commercial vehicles to display strong growth where JKTL is the leader. Medium & heavy commercial vehicles have a tyre replacement cycle of 6-8 months while that for cars is 3-4 years. The recent pickup in these segments would subsequently lead to higher replacement demand in the next 2 years. Further high GDP rates result in more movement of trucks which in turn leads to faster replacement of tyres.
Strong automobile growth
(Source: SIAM, HDFC Sec)

RETAIL RESEARCH
RETAIL RESEARCH P a g e | 11
Debt levels peaked out; Deleveraging to result in lower finance expenses Total consolidated debt of JKTL jumped from ~Rs 3000 cr in FY16 to ~Rs 5200 cr at the end of H1FY17 on account of the expansion at Chennai plant and acquisition of Cavendish which was completed in April-16. With the expansion of the Chennai plant and acquisition of CIL completed, debt seems to be at peak level as the company does not have any near term plans of further expansion. The improvement in CIL’s financials and growing sales of TBR tyres would lead to higher cash flows which will be utilized for debt repayments in FY18. This is likely to bring down interest expenses and consequently PAT margins are likely to expand by 30-90 bps in the coming years.
Creating a brand through awareness campaigns JKTL has launched an ad campaign with the tagline ‘Ab se tyres mein sirf JK is OK’ which takes forward its image of ‘Total Control’. It would enable the company to create a strong brand among consumers who have traditionally been indifferent when it comes to choosing a tyre for their bikes. The domestic 2/3 wheeler tyre market has grown at 7.4% over last 2 years & is expected to grow at 8% going forward. The promotion campaign should result in better brand recall and give the company a strong foothold in this high volume segment. The management expects to cover 75%-80% of the domestic two-wheeler tyres replacement market demand.
Supplies to all the key OEMs in India JKTL is a partner to all the key OEMs in India and Mexico in the passenger car, commercial vehicles as well as tractors, OTR and other vehicles. The acquisition of CIL has given the company an entry in the high volume 2W/3W segment which was lacking in its portfolio.
Customers include the top names in Automobile industry
(Source: Company, HDFC Sec)

RETAIL RESEARCH
RETAIL RESEARCH P a g e | 12
Concerns Raw material price volatility The prices of raw material consumed by the company like natural rubber, carbon black, synthetic rubber, etc. are extremely volatile and could impact the margins if the company is not able to pass on the increase. Margins of Tyre companies are normally inversely related to raw material prices.
Operating margins of tyre players are inversely related to Natural rubber prices
(Source: Company, HDFC Sec)
Dumping of tyres by China Until recently, there were huge imports of TBR tyres from China as the landed recorded cost was significantly lower than domestic prices. Although the Chinese manufacturers have shifted their focus to US markets, dumping cannot be ruled out in the future in the absence of anti-dumping duties.
Slowdown in automobile growth The last couple of years have witnessed strong growth in the automobile industry leading to strong replacement demand for tyres. Any slowdown in the industry could result in lower growth for JKTL. High competition from peer companies There is huge competition among the major players in the market and JKTL needs to make continuous efforts for network expansion, consumer tie ups and new product launches. Delays in expanding network could result in loss of market share.
RETAIL RESEARCH
RETAIL RESEARCH P a g e | 13
During FY2014-17, the industry commissioned Rs. 11,500 cr worth of projects. The next four years FY2017-20 is expected to witness commissioning of another Rs. 21,000 cr worth of projects, of which project closer to completion are the Rs. 2,500 cr Maxxis Sanad 2W and PCR project (FY2018), the Rs. 650 cr Halol CEAT plant for PCR and TBR (FY2018), the Rs. 800 cr Butobori CEAT 2W project (FY2018), the Rs. 2,800 cr PCR/TBR Bridgestone project (FY2018) and the Rs. 800 cr Balasore PCR Kesoram project (FY2018). Continous capacity addition by the players could result in oversupply and undercutting going forward. Apart from this, it would also force JK Tyres to keep adding capacity to maintain its market share. On back of low cyclicality in demand, much stronger margin relative to other segments and relatively lower competitive intensity MRF, CEAT and TVS Srichakra made best out of 2/3 wheeler tyres space over past three years amid a weak demand environment for TBB. Thus on back of this over past six months Apollo Tyres, JK Tyres (though acquisition of Birla Tyres), Balkrishna Industries (BIL), Bridgestone, Michelin and even an ancilliary player like Gabriel have entered this space. This signifies the quantum of competitive intensity set to increase in this space ahead resulting in weaker pricing power and margin in turn. Foreign exchange fluctuations JKTL has a subsidiary in Mexico. Also it derives ~20% of its revenues from exports. The company normally hedges ~70% of net next 6 months exposure. Change in the exchange rate of rupee could impact its financials. High debt to equity ratio JKTL has taken on huge debt for the acquisition of CIL. The consolidated debt-equity ratio has jumped from 1.7x in FY16 to 2.8x in H1FY17. This would lead to higher interest cost and could impact its profitability. Capacity utilization of TBB (Truck and Bus Bias) going down across the industry The truck bias (TBB) tyre capacity as percentage of systemic capacity declined at a rapid pace to ~20-30% levels from ~40-50% levels five years back and is expected to come down further in years to come with rising acceptance of radialisation in replacement market. Capacities of TBB and TBR are not fungible in nature as shifting a TBB capacity to TBR asks for capex cost similar to fresh TBR capacity addition to the tune of Rs 9-10 cr/TPD. Thus barring changing from TBB to bias off-the road (OTR) applications, utilisation for TBB would continue to decline gradually in the longer run. JK Tyres has capacity of 47.1 lakh TBB p.a. across facilities. These facilities currently are used to service replacement markets in India and exports. The capacity utilization at these plants has been falling in line with that of the industry. In future, JK tyres will have to take a call to scrap these capacities and set up TBR capacities in their place necessitating capex. Tornell unit could come under trade restrictions from US Currently 10-15% of revenues of the Tornell unit comes from exports to the US. Any adverse policy action by the Trump administration on imports from Mexico into US could hurt the revenues and margins of Tornell unit.
RETAIL RESEARCH
RETAIL RESEARCH P a g e | 14
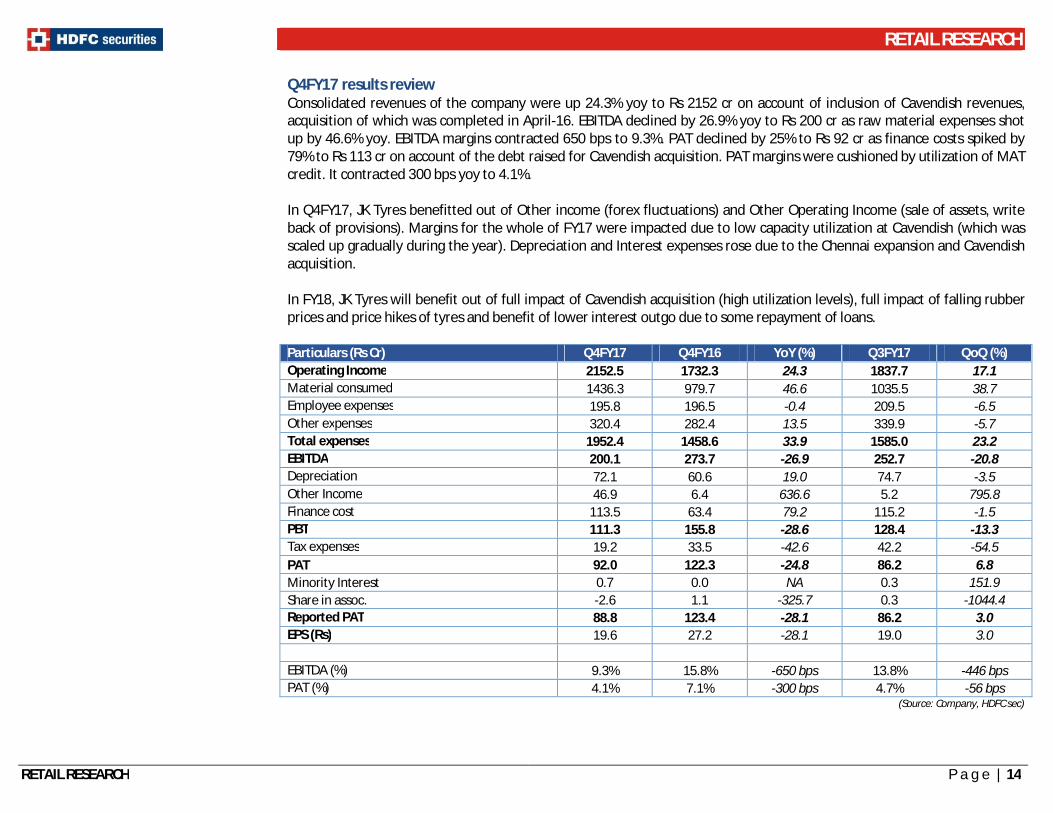
Q4FY17 results review Consolidated revenues of the company were up 24.3% yoy to Rs 2152 cr on account of inclusion of Cavendish revenues, acquisition of which was completed in April-16. EBITDA declined by 26.9% yoy to Rs 200 cr as raw material expenses shot up by 46.6% yoy. EBITDA margins contracted 650 bps to 9.3%. PAT declined by 25% to Rs 92 cr as finance costs spiked by 79% to Rs 113 cr on account of the debt raised for Cavendish acquisition. PAT margins were cushioned by utilization of MAT credit. It contracted 300 bps yoy to 4.1%. In Q4FY17, JK Tyres benefitted out of Other income (forex fluctuations) and Other Operating Income (sale of assets, write back of provisions). Margins for the whole of FY17 were impacted due to low capacity utilization at Cavendish (which was scaled up gradually during the year). Depreciation and Interest expenses rose due to the Chennai expansion and Cavendish acquisition. In FY18, JK Tyres will benefit out of full impact of Cavendish acquisition (high utilization levels), full impact of falling rubber prices and price hikes of tyres and benefit of lower interest outgo due to some repayment of loans. Particulars (Rs Cr) Q4FY17 Q4FY16 YoY (%) Q3FY17 QoQ (%) Operating Income 2152.5 1732.3 24.3 1837.7 17.1 Material consumed 1436.3 979.7 46.6 1035.5 38.7 Employee expenses 195.8 196.5 -0.4 209.5 -6.5 Other expenses 320.4 282.4 13.5 339.9 -5.7 Total expenses 1952.4 1458.6 33.9 1585.0 23.2 EBITDA 200.1 273.7 -26.9 252.7 -20.8 Depreciation 72.1 60.6 19.0 74.7 -3.5 Other Income 46.9 6.4 636.6 5.2 795.8 Finance cost 113.5 63.4 79.2 115.2 -1.5 PBT 111.3 155.8 -28.6 128.4 -13.3 Tax expenses 19.2 33.5 -42.6 42.2 -54.5 PAT 92.0 122.3 -24.8 86.2 6.8 Minority Interest 0.7 0.0 NA 0.3 151.9 Share in assoc. -2.6 1.1 -325.7 0.3 -1044.4 Reported PAT 88.8 123.4 -28.1 86.2 3.0 EPS (Rs) 19.6 27.2 -28.1 19.0 3.0 EBITDA (%) 9.3% 15.8% -650 bps 13.8% -446 bps PAT (%) 4.1% 7.1% -300 bps 4.7% -56 bps
(Source: Company, HDFC sec)

RETAIL RESEARCH
RETAIL RESEARCH P a g e | 15
Peer comparison (FY17 numbers)
Company CMP (Rs)
Mcap (Rs Cr)
Total Inc (Rs Cr)
OPM (%)
PATM (%)
EPS (Rs)
BV (Rs)
P/E (x)
P/B (x)
EV/EBITDA (x)
Apollo Tyres 234.5 11936.6 13063.0 14.0 8.3 21.6 143.2 10.9 1.6 8.0 Ceat Ltd 1775.1 7180.3 5722.3 11.2 6.3 89.3 597.0 19.9 3.0 12.5 JK Tyre 174.7 3962.4 7689.4 14.7 4.9 16.6 86.6 10.6 2.0 8.3 MRF Ltd 65877.9 27932.2 13405.8 19.6 11.1 3504.3 20373.7 18.8 3.2 11.3 View and Valuation The acquisition of Cavendish (from Kesoram Industries Ltd) in April 2016 has given the company entry into the high volume 2/3W segment and additional TBR capacity which would drive its growth in the near term. Capacity expansions at its Chennai has also been completed and capacity utilization has been ramped up. The dwindling threat of Chinese imports should result in higher volumes and better margins for the company. Softening raw material prices and recent price hikes taken would lead to higher revenues and better margins in the coming year/s. The management is focusing on reducing debt which at 2.8x is the highest amongst the listed peer companies. JK Tyres has a successful track record of inorganic growth (Tornell in the past) and would soon succeed in reaping the benefits of Cavendish acquisition. The whole tyre sector trades at low P/E multiple, we see scope for a rerating of the sector. Easing competitive intensity and price aggression leading to cross‐cycle margin flexibility could lead the rerating for a sector that otherwise enjoys healthy return ratios and has a very high exposure to the lucrative after‐market (like the battery sector, which trades at a 100%+ premium to tyres). JK Tyres quotes at an even lower P/E compared to its peers probably due to the high debt on its books. The brand names of the tyres remain visible in the vehicles resulting in brand recall (contrary to a lot of other auto ancilliary items including Batteries which are hidden in the vehicle). At CMP of Rs 175 the stock quotes at 7.3x FY19E EPS (5.6xFY19 EV/EBITDA). We feel investors could buy the stock at the CMP and add on dips to Rs 153-157 band (6.5xFY19E EPS; equivalent to 5.3xFY19 EV/EBITDA) for sequential targets of Rs. 203 (8.5xFY19E EPS; equivalent to 6xFY19 EV/EBITDA) and Rs 227 (9.5xFY19E EPS; equivalent to 6.4xFY19 EV/EBITDA) in 2-3 quarters.

RETAIL RESEARCH
RETAIL RESEARCH P a g e | 16
Financial Statements
Income Statement Cash Flow statement Particulars FY15 FY16 FY17E FY18E FY19E Particulars FY15 FY16 FY17E FY18E FY19E Income from operations 7383.7 6953.1 7689.4 8441.3 9264.1 Profit Before Tax 485.6 669.0 535.2 618.2 768.4 Cost of materials consumed 4571.6 3869.4 4343.1 4668.1 5178.6 Depreciation 157.8 196.1 291.3 306.8 317.2 Employee Cost 728.9 780.7 854.3 953.9 1019.0 Others 272.4 263.8 527.5 533.0 431.9 Other expenses 1152.5 1161.5 1359.6 1468.8 1602.7 Change in working capital -50.6 -65.6 -968.7 61.5 66.4 Total expenses 6453.0 5811.6 6557.0 7090.7 7800.4 Tax expenses -131.0 -160.3 -66.8 -179.3 -226.7 EBITDA 930.8 1141.5 1132.4 1350.6 1463.7 CF from Operating activities 734.2 903.0 318.6 1340.2 1357.2 Depreciation 157.8 196.1 291.3 306.8 317.2 Net Capex -810.2 -558.8 -2552.5 -225.0 -195.0 Other Income 789.9 962.1 906.5 1077.6 1192.8 Other investing activities 26.0 19.2 81.6 -100.0 -100.0 EBIT 16.9 16.7 65.4 33.8 46.3 CF from Investing activities -805.7 -511.3 -2470.9 -325.0 -295.0 Finance Cost 257.4 245.4 440.4 459.4 424.5 Proceeds from Eq Cap 0.0 0.0 0.0 0.0 0.0 Profit Before Tax 485.6 669.0 535.2 618.2 768.4 Borrowings / (Repayments) 252.9 -130.9 2816.6 -515.0 -775.0 Tax Expenses 161.7 215.7 155.4 179.3 226.7 Dividends paid -24.0 -41.0 -68.0 -81.6 -95.3 Profit After Tax 323.9 453.3 379.8 438.9 541.7 Interest paid -267.2 -250.5 -440.4 -459.4 -424.5 Adj. PAT 329.7 463.8 375.4 438.9 541.7 CF from Financing activities -1.2 -422.4 2308.2 -1056.0 -1294.7 EPS 14.5 20.4 16.6 19.4 23.9 Net Cash Flow -72.8 -30.7 155.9 -40.9 -232.6
Balance Sheet Financial Ratios
Particulars FY15 FY16 FY17E FY18E FY19E Particulars FY15 FY16 FY17E FY18E FY19E EQUITY AND LIABILITIES EPS (Rs) 14.5 20.4 16.6 19.4 23.9 Share Capital 45.4 45.4 45.4 45.4 45.4 Cash EPS (Rs) 21.5 29.1 29.4 32.9 37.9 Reserves and Surplus 1355.7 1703.1 2064.4 2421.7 2868.1 BVPS (Rs) 61.8 77.1 93.0 108.8 128.5 Shareholders' Funds 1401.0 1748.5 2109.8 2467.1 2913.5 Long Term borrowings 1769.0 1798.2 3920.3 3605.3 3080.3 PE (x) 12.0 8.6 10.6 9.0 7.3 Deferred Tax Liabilities (Net) 319.8 435.5 586.4 586.4 586.4 P/BV (x) 2.8 2.3 1.9 1.6 1.4 Other Long Term Liabilities 330.1 306.5 372.4 417.1 458.2 Mcap/Sales (x) 0.5 0.6 0.5 0.5 0.4 Long Term Provisions 80.6 78.7 118.9 182.4 180.4 EV/EBITDA 7.3 5.9 8.3 6.5 5.6 Non-current Liabilities 2499.5 2619.0 4998.1 4791.3 4305.3 Short Term Borrowings 1205.8 1111.3 1805.7 1605.7 1355.7 EBITDAM (%) 12.6 16.4 14.7 16.0 15.8 Trade Payables 1054.5 955.4 1213.7 1256.9 1380.8 EBITM (%) 10.7 13.8 11.8 12.8 12.9 Other Current Liabilities 486.2 504.5 467.1 594.2 627.6 PATM (%) 4.5 6.7 4.9 5.2 5.8 Short Term Provisions 256.8 406.0 30.0 46.1 45.6 Current. Liabilities 3003.4 2977.1 3516.6 3502.9 3409.7 ROCE (%) 19.3 21.3 14.5 13.9 15.9 TOTAL 6903.8 7344.6 10624.4 10761.2 10628.4 RONW (%) 26.4 29.5 19.5 19.2 20.1
RETAIL RESEARCH
RETAIL RESEARCH P a g e | 17
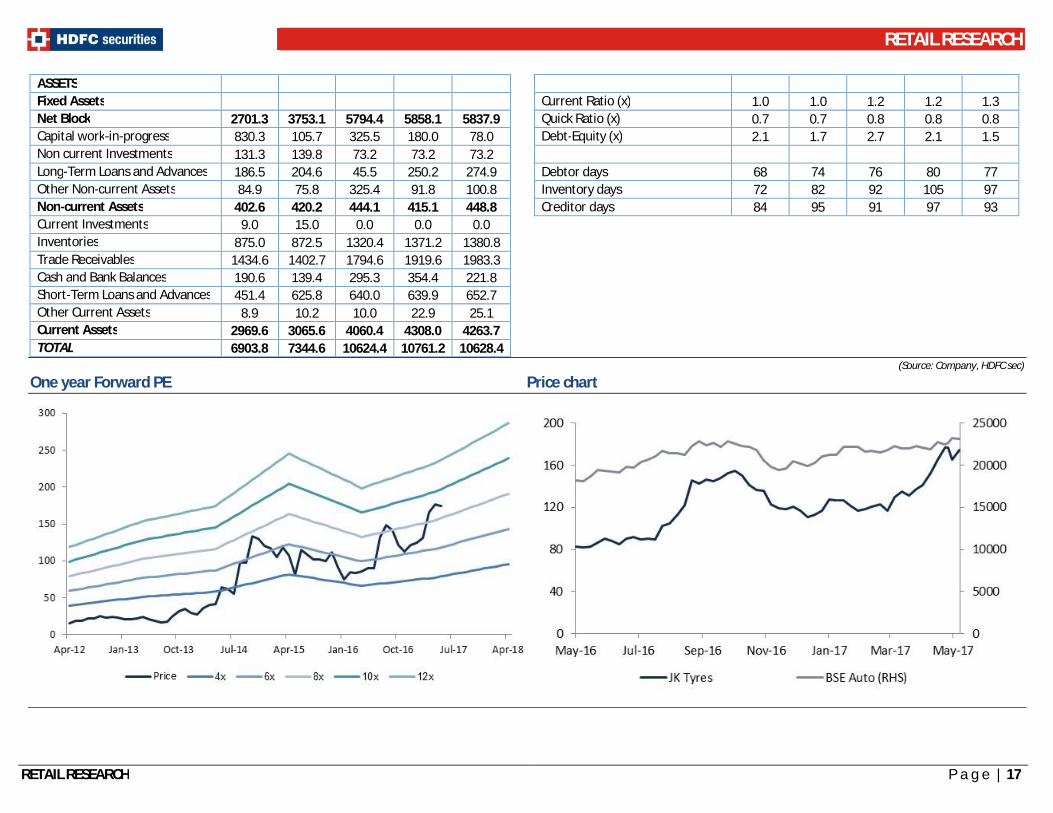
ASSETS Fixed Assets Current Ratio (x) 1.0 1.0 1.2 1.2 1.3 Net Block 2701.3 3753.1 5794.4 5858.1 5837.9 Quick Ratio (x) 0.7 0.7 0.8 0.8 0.8 Capital work-in-progress 830.3 105.7 325.5 180.0 78.0 Debt-Equity (x) 2.1 1.7 2.7 2.1 1.5 Non current Investments 131.3 139.8 73.2 73.2 73.2 Long-Term Loans and Advances 186.5 204.6 45.5 250.2 274.9 Debtor days 68 74 76 80 77 Other Non-current Assets 84.9 75.8 325.4 91.8 100.8 Inventory days 72 82 92 105 97 Non-current Assets 402.6 420.2 444.1 415.1 448.8 Creditor days 84 95 91 97 93 Current Investments 9.0 15.0 0.0 0.0 0.0 Inventories 875.0 872.5 1320.4 1371.2 1380.8 Trade Receivables 1434.6 1402.7 1794.6 1919.6 1983.3 Cash and Bank Balances 190.6 139.4 295.3 354.4 221.8 Short-Term Loans and Advances 451.4 625.8 640.0 639.9 652.7 Other Current Assets 8.9 10.2 10.0 22.9 25.1 Current Assets 2969.6 3065.6 4060.4 4308.0 4263.7 TOTAL 6903.8 7344.6 10624.4 10761.2 10628.4
(Source: Company, HDFC sec)
One year Forward PE Price chart
RETAIL RESEARCH
RETAIL RESEARCH P a g e | 18
Disclosure: I, Atul Karwa, MMS, authors and the names subscribed to this report, hereby certify that all of the views expressed in this research report accurately reflect our views about the subject issuer(s) or securities. HSL has no material adverse disciplinary history as on the date of publication of this report. We also certify that no part of our compensation was, is, or will be directly or indirectly related to the specific recommendation(s) or view(s) in this report. Research Analyst or his/her relative or HDFC Securities Ltd. does have/ does not have any financial interest in the subject company. Also Research Analyst or his relative or HDFC Securities Ltd. or its Associate may have beneficial ownership of 1% or more in the subject company at the end of the month immediately preceding the date of publication of the Research Report. Further Research Analyst or his relative or HDFC Securities Ltd. or its associate does have/does not have any material conflict of interest. Any holding in stock – Yes/ No HDFC Securities Limited (HSL) is a SEBI Registered Research Analyst having registration no. INH000002475. Disclaimer: This report has been prepared by HDFC Securities Ltd and is meant for sole use by the recipient and not for circulation. The information and opinions contained herein have been compiled or arrived at, based upon information obtained in good faith from sources believed to be reliable. Such information has not been independently verified and no guaranty, representation of warranty, express or implied, is made as to its accuracy, completeness or correctness. All such information and opinions are subject to change without notice. This document is for information purposes only. Descriptions of any company or companies or their securities mentioned herein are not intended to be complete and this document is not, and should not be construed as an offer or solicitation of an offer, to buy or sell any securities or other financial instruments. This report is not directed to, or intended for display, downloading, printing, reproducing or for distribution to or use by, any person or entity who is a citizen or resident or located in any locality, state, country or other jurisdiction where such distribution, publication, reproduction, availability or use would be contrary to law or regulation or what would subject HSL or its affiliates to any registration or licensing requirement within such jurisdiction. If this report is inadvertently send or has reached any individual in such country, especially, USA, the same may be ignored and brought to the attention of the sender. This document may not be reproduced, distributed or published for any purposes without prior written approval of HSL. Foreign currencies denominated securities, wherever mentioned, are subject to exchange rate fluctuations, which could have an adverse effect on their value or price, or the income derived from them. In addition, investors in securities such as ADRs, the values of which are influenced by foreign currencies effectively assume currency risk. It should not be considered to be taken as an offer to sell or a solicitation to buy any security. HSL may from time to time solicit from, or perform broking, or other services for, any company mentioned in this mail and/or its attachments. HSL and its affiliated company(ies), their directors and employees may; (a) from time to time, have a long or short position in, and buy or sell the securities of the company(ies) mentioned herein or (b) be engaged in any other transaction involving such securities and earn brokerage or other compensation or act as a market maker in the financial instruments of the company(ies) discussed herein or act as an advisor or lender/borrower to such company(ies) or may have any other potential conflict of interests with respect to any recommendation and other related information and opinions. HSL, its directors, analysts or employees do not take any responsibility, financial or otherwise, of the losses or the damages sustained due to the investments made or any action taken on basis of this report, including but not restricted to, fluctuation in the prices of shares and bonds, changes in the currency rates, diminution in the NAVs, reduction in the dividend or income, etc. HSL and other group companies, its directors, associates, employees may have various positions in any of the stocks, securities and financial instruments dealt in the report, or may make sell or purchase or other deals in these securities from time to time or may deal in other securities of the companies / organizations described in this report. HSL or its associates might have managed or co-managed public offering of securities for the subject company or might have been mandated by the subject company for any other assignment in the past twelve months. HSL or its associates might have received any compensation from the companies mentioned in the report during the period preceding twelve months from t date of this report for services in respect of managing or co-managing public offerings, corporate finance, investment banking or merchant banking, brokerage services or other advisory service in a merger or specific transaction in the normal course of business. HSL or its analysts did not receive any compensation or other benefits from the companies mentioned in the report or third party in connection with preparation of the research report. Accordingly, neither HSL nor Research Analysts have any material conflict of interest at the time of publication of this report. Compensation of our Research Analysts is not based on any specific merchant banking, investment banking or brokerage service transactions. HSL may have issued other reports that are inconsistent with and reach different conclusion from the information presented in this report. Research entity has not been engaged in market making activity for the subject company. Research analyst has not served as an officer, director or employee of the subject company. We have not received any compensation/benefits from the subject company or third party in connection with the Research Report. This report is intended for non-Institutional Clients only. The views and opinions expressed in this report may at times be contrary to or not in consonance with those of Institutional Research or PCG Research teams of HDFC Securities Ltd. and/or may have different time horizons HDFC securities Limited, I Think Techno Campus, Building - B, "Alpha", Office Floor 8, Near Kanjurmarg Station, Opp. Crompton Greaves, Kanjurmarg (East), Mumbai 400 042 Phone: (022) 3075 3400 Fax: (022) 2496 5066 Compliance Officer: Binkle R. Oza Email: [email protected] Phone: (022) 3045 3600 HDFC Securities Limited, SEBI Reg. No.: NSE-INB/F/E 231109431, BSE-INB/F 011109437, AMFI Reg. No. ARN: 13549, PFRDA Reg. No. POP: 04102015, IRDA Corporate Agent License No.: HDF 2806925/HDF C000222657, SEBI Research Analyst Reg. No.: INH000002475, CIN - U67120MH2000PLC152193 Mutual Funds Investments are subject to market risk. Please read the offer and scheme related documents carefully before investing.
Fundamental Research Analyst: Atul Karwa, [email protected]