Retail Policing: Analysis of Dispatches to Walmart, the ... · Retail Policing: Analysis of...
18
Retail Policing: Analysis of Dispatches to Walmart, the most Frequent Location of Calls for Police Services in Rochester Working Paper # 10 September 2011 Mike Juchniewicz Center for Public Safety Initiatives Greg Drake Center for Public Safety Initiatives John Klofas Center for Public Safety Initiatives Rochester Institute of Technology 585-475-2432 [email protected]
Transcript of Retail Policing: Analysis of Dispatches to Walmart, the ... · Retail Policing: Analysis of...

Retail Policing: Analysis of Dispatches to Walmart,
the most Frequent Location of
Calls for Police Services in Rochester
Working Paper # 10
September 2011
Mike Juchniewicz
Center for Public Safety Initiatives
Greg Drake
Center for Public Safety Initiatives
John Klofas
Center for Public Safety Initiatives
Rochester Institute of Technology
585-475-2432

2
Retail Policing: Analysis of Dispatches to Walmart, the most Frequent Location of
Calls for Police Services in Rochester
Introduction
This paper will examine calls for service made to the Monroe County 911 Center from
the Walmart located at 1490 Hudson Avenue in Rochester, New York. In 2010 this was the
leading location for calls for police services in Rochester. This research grew out of an interest in
considering high volume locations for calls for service and was further encouraged in discussions
during the Center for Public Safety Initiative’s work with the local Rochester community
organization, Group 14621. Citizens in the 14621 community felt that the nearby Walmart,
located on the northern boundary of the 14621 area, was a common location for police calls for
service and were interested in how this may affect policing services in the neighborhood.
Excluding police sub-station locations, the Hudson Avenue Walmart was the most
common location for Rochester calls for service in 2010. The Hudson Avenue Walmart recorded
twice as many calls as the next highest location. Even with that volume, this accounted for .25%
of the total of 460,448 Rochester related calls for service received in 2010. The goals of this
research will be to describe the nature of calls for service and the response to them at the Hudson
Avenue Walmart.
Call Volume and Nature
This study uses 2010 calls for service (CFS) data for the 1490 Hudson Avenue Walmart.
There were 1114 total calls for service at this Walmart in 2010. Of those, 991 were non-
administrative in nature. The 123 administrative calls do not involve police responding to a
critical situation and were removed from the analysis. Without the administrative requests,
police were called to the 1490 Hudson Avenue Walmart on 334 days in 2010. On two particular
days, police were called to Walmart 10 different times. There were also 79 days in which 5 or
more calls for service were received. The average was 2.7 calls per day for the full year.
A total of 47,081 minutes of service (785 hours) were allocated to the 991 calls for
service. An average of 2.3 officers responded per call for service resulting in a total of 106,935
total minutes (1,782 hours) of services rendered for the 991 calls. Each call for service lasted an
average of 47 minutes from time of dispatch to time of clearance. Considering that multiple
officers respond to each call, an average of 107.9 total service minutes were allocated to each
call. The nature of the total 991 calls is depicted in Figure 1 below. The largest number of calls

3
for service (466) concerned calls for larcenies. The next largest category (95) involved incidents
with motor vehicles. No other category amounted to more than ten percent of all calls for service.
The graph below shows the distribution of calls for service across days of the week.
There is relatively little variation across the days. Friday was the day most calls were made
(165, 17%) and Thursday was the day the least calls were made (118, 12%).
The following graph shows the distribution of all calls for service throughout the day.
The majority of calls for service were made between 11am and 8pm, showing a steady increase
in the number of calls from 10am until roughly 6pm and then showing a steady decline into the
4
evening. Very few calls for service were made between 11pm and 8am because of this particular
Walmart’s hours of operation, 7am to 11pm. The calls that did occur throughout the night are
calls that are reported in the parking lot or street nearby.
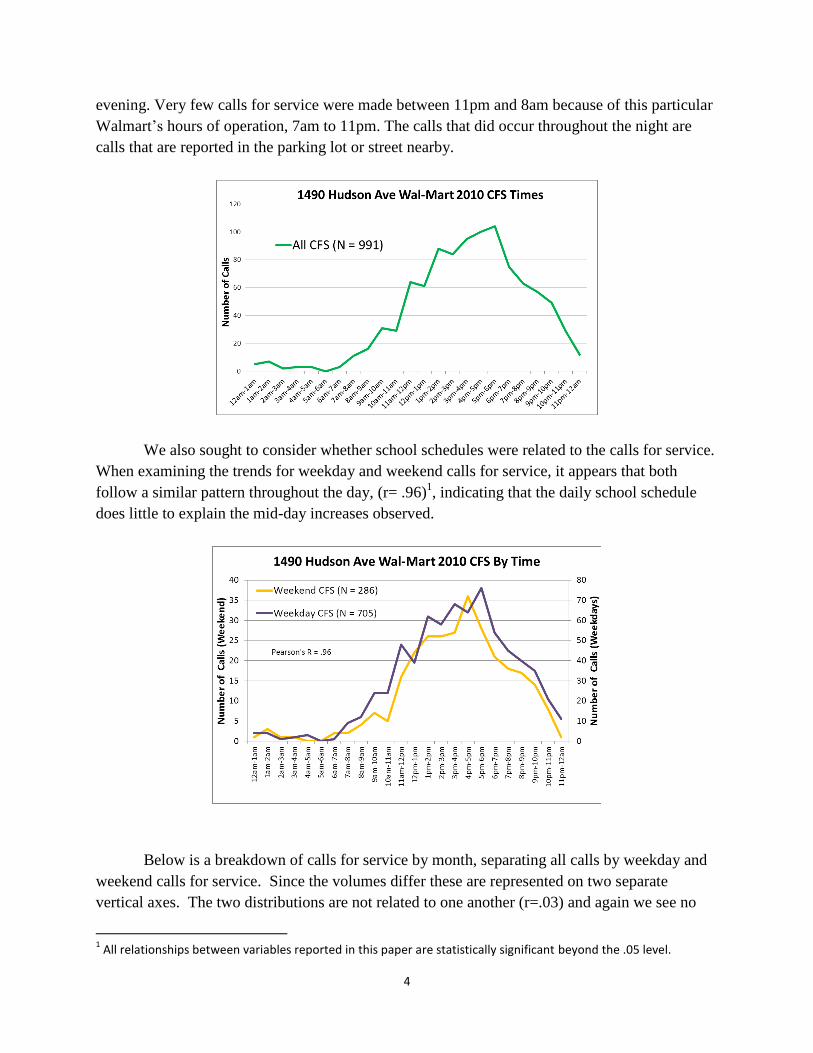
We also sought to consider whether school schedules were related to the calls for service.
When examining the trends for weekday and weekend calls for service, it appears that both
follow a similar pattern throughout the day, (r= .96)1, indicating that the daily school schedule
does little to explain the mid-day increases observed.
Below is a breakdown of calls for service by month, separating all calls by weekday and
weekend calls for service. Since the volumes differ these are represented on two separate
vertical axes. The two distributions are not related to one another (r=.03) and again we see no
1 All relationships between variables reported in this paper are statistically significant beyond the .05 level.

5
discernible pattern for weekend calls (r=.03), but the weekday calls are highest during the
summer months. This suggests the yearly school calendar may be more significant than the daily
schedule.
Larceny and Non-Larceny Calls for Service
Since larcenies in the form of shoplifting account for the largest number of calls for
service at the 1490 Hudson Avenue Walmart we examined these more closely. Of the 991 calls
for service, 466 (47%) were identified as relating to larceny. Analysis of a sample, as discussed
below, suggests that all of these cases involved shoplifting.
In 2010 a total of 7620 larcenies were officially recorded by the Rochester Police
Department. In the FBI’s Uniform Crime Report national crime tally, approximately 14% of
larcenies involve shoplifting. That allows at least a rough estimate of the overall number of
shoplifting cases recorded in Rochester. We estimate, then, that in 2010 about 1066 of the
officially reported larcenies involved shoplifting. That would mean that the Hudson Avenue
Walmart accounted for nearly 44% of all officially recorded cases of shoplifting.
The following graph shows the calls for service across the hours of the day and broken
down into larceny and non-larceny related calls. For the most part, patterns remain very close
throughout the day (r=.89). This suggests the influence of shopping patterns overall and not a
particular pattern of larcenies. In an additional analysis we also found that there was no
relationship between the ages of those arrested on larceny charges at Walmart and the time of
day. This held for weekdays and weekends, and provides further evidence that the daily school
schedule is not related to the volume of larceny arrests.

6
We also found similarity across larceny and non-larceny calls for service using days of
the weeks and months of the year. This is consistent with the view that larceny does not show a
pattern that differs significantly from regular shopping patterns across time.
In our analysis we also sought to examine the amount of time linked to responding to
calls for service and to develop rough cost estimates for services at the location of the greatest
number of calls. Police officers averaged 57 minutes of service time allocated per larceny call
for service, compared to 39 minutes per non-larceny call. On average, 2.5 officers responded to
each larceny call compared to 1.9 officers per non-larceny call. When accounting for multiple
officers responding to calls, a total of 1784 service hours were needed for all calls, with 1128
hours allocated for larceny and 651 hours used for non-larceny calls for service. The chart below
offers a comparison of police resource allocation for both larceny and non-larceny calls for
service.
Estimated Costs of 2010 Calls for Service at 1490 Hudson Ave. Walmart
Larceny (N = 466)
Non-Larceny (N = 525)
Total (N = 991)
Low est High est Low est High est Low est High est
Est. Annual Ave. RPD Total
Compensation Range (inc. benefits)
$62,500 $78,125 $62,500 $78,125 $62,500 $78,125
Est. Hourly cost per Officer $30.00 $37.50 $30.00 $37.50 $30.00 $37.50
Ave. Dispatch to Clearance Time (Hrs) .95 .95 .65 .65 .8 .8
Ave. # of Resp. Officers 2.5 2.5 1.9 1.9 2.3 2.3
Ave. Total Time required all Offs (Hrs) 2.42 2.42 1.24 1.24 1.80 1.80
Ave. total Cost per Call $72.60 $90.75 $31.12 $38.90 $44.96 $56.20
Total 2010 Call For Service Cost $33,842 $35,274 $19,530 $24,412 $53,514 $66,892 Totals may differ due to rounding

7
Information about the outcome of the larceny calls for service is shown below. The
majority of cases, 55%, or 265 cases, resulted in arrest. Of all those arrested, we estimate based
on a sample that 50% of the subjects were given an appearance ticket and were not taken into
custody. An additional 4% were found to have warrants at the time of their arrest. The levels of
arrest may account for the significant difference in the number of officers recorded as responding
to larceny calls for service and the significantly higher amount of time taken to dispose of
larceny calls for service.
Analysis of a Sample of Larceny Cases
To further understand the calls for service we examined a sample of larceny related calls.
A representative sample (95% confidence level) of 211 calls for service was chosen at random
out of the total larceny related calls for service to the 1490 Hudson Avenue Walmart in 2010.
Of the 211 larceny calls for service, 136 had corresponding arrest reports. The 75 calls for
service not accounted for in the arrest report files are broken down below, alongside a depiction
of the 136 calls for service that have corresponding arrest reports. The next figure then depicts
the outcome of the calls-for-service and shows how the case involving each individual is
handled.

8
As shown below, 75 calls for service resulted in no arrest report being taken at the scene.
Most commonly, no arrest was made because Walmart, the complainant, refused to file a report.
There were also 20 instances of a crime report being filed with the police. A crime report
typically outlines the crime as it occurred but does not result in an arrest. Finally, for 17 calls,
police officers rendered services but did not arrest any individuals.
Because some cases resulted in the arrest of more than one person, the 136 cases for
which there are arrest reports provided information on a total of 177 individuals. For these 177
individuals, 132 (75%) of the cases were sealed leaving 45 (25%) cases which were not sealed.
Typically cases are sealed when resulting in an adjournment in contemplation of dismissal
(ACD), or if they are dismissed outright, or if they result in a conviction for a charge of
disorderly conduct.
Our review of cases showed that for the fraction of cases not-sealed, the most serious
sanction was a jail sentence ranging from several days to 12 months. Nine individuals were also
sentenced to a range of 16 to 360 hours of community service.

9
Case Characteristics
We also examined the characteristics of all of those who were arrested (sealed and not
sealed cases). The results are summarized below.
The table indicates that whites and blacks were arrested in nearly equal numbers.
Approximately one quarter of those arrested were described by officers as Hispanic. Although
the age range of those arrested stretched from 12 to 61, 43% of those arrested were between 16
and 21. Seventy-five percent of those arrested were female. The female arrestees were slightly
younger (median= 23) than the males (median= 25.5). Sixty nine percent of the females were 30
or under compared with 52% of the males.
Characteristics of Sample of
those Arrested for Larceny
N= 177 Percent
Race and Ethnicity of ArresteeWhite 27%
White Hispanic 20%
Black 47%
Black Hispanic 4%
Not Recorded 2%
AgeAverage 28.16 yrs
Median 23 yrs
GenderMale 23%
Female 75%
Not Recorded 2%
Local Criminal RecordYes 61%
No 39%

10
Of the 136 arrest reports in our sample, 109 provided some information about how the
larceny was committed. The most common method was to hide merchandise in a purse (48%)
followed by concealing it on one’s person (42%), inside coat or jacket pockets or down a pair of
pants, and finally, in 10% of cases a Walmart shopping bag was used.
Existing research suggests that meat, alcohol, baby formula, razors, jewelry, makeup, and
electronics are among the most commonly shoplifted goods in America. Our analysis of
Walmart’s stolen goods represented in the sample is limited to the lists of the stolen items
recorded by the responding police officers. In 25% of the arrest reports the list was not specific
but noted only ‘various merchandise.’ The chart below shows the types of items noted in the
larceny arrest reports.
The data indicate that clothing is the most commonly stolen item from this particular store
(30%). The second most commonly stolen item was makeup with 13% of the cases containing a
theft of cosmetics. Electronics represented 7% of the thefts, and jewelry represented 2% of the
total thefts.
We also examined the value of items as listed in the larceny reports. The sample of 136
reports of arrests for larceny was associated with property valued at $13,609.54. Based on that
the best estimate of the value of property associated with all the Walmart larceny arrests would

11
be approximately $45,500. From these data it is not possible to estimate the dollar value of
property loss from larcenies that did not result in arrest.
The per-larceny report cost of pilfered property in our sample ranged from $1.97 worth
of gum to $619.60 for Blu-Ray movies. Eleven percent of cases involved property worth less
than $20, while 41% involved values of less than $50, and 71% of cases totaled less than $100.
The value of the property did not differ by gender.
Finally, we also reviewed the home addresses of those arrested and the location of the
Walmart. The map below has three circles each representing another one mile radius around the
Walmart. As the map indicates, those arrested tended to live close to the store and in high
poverty neighborhoods.

12
Criminal Histories of Those Arrested
We also examined the criminal records of those arrested for larceny at Walmart in 2010.
Approximately 80% of those arrested had a record of previous arrests with the Rochester Police
Department; nearly 20% did not. Just over 50% of individuals had three or fewer previous
arrests. Twenty percent had 10 or more and 5%, or 9 individuals, had between 30 and 59 prior
arrests. The median number of prior arrests was 3.0 (mean=7.78, s.d.=9.8). As you would
expect, age and the number of prior arrests were positively related (r=.37).

13
The most common charge among the prior arrests was also larceny which was reported
for 147 people. In 80% of those cases, however there were three or fewer prior larceny arrests.
Forty-eight of the 177 (27%) people had prior arrests for violent offenses. In half of those cases
there was one prior arrest for violence. One person had five and another had six prior arrests for
violent crimes. For all those with prior arrests for violence, the most common charges were
assault, harassment, menacing and then robbery.
When we considered those with no prior arrests, the only difference between them and
the total group was that they were somewhat more likely to be female (87% v 75%). Those with
30 or more prior arrests were much more likely to be male (7/9). Eight of the nine in this group
were 39 years old or older. Half had 24 or more prior larceny arrests and 4 of 9 had prior arrests
for violent offenses.
Decisions about How Cases are Resolved
We examined how key decisions were made regarding the larceny cases, including the
issuance of appearance tickets, the sealing of cases, and sentences to jail. Once the decision to
arrest has been made, the critical decision made by police on the scene involves the choice of
taking someone into custody or giving them an appearance ticket, which informs them when they
must appear in court for the first time on this case. For the larceny arrests at Walmart, police
issued appearance tickets in almost precisely 50% of the cases while taking the other 50% into
custody. They took 66% of males into custody compared with 47% of females. The value of
property involved had little effect on the appearance ticket decision.
14
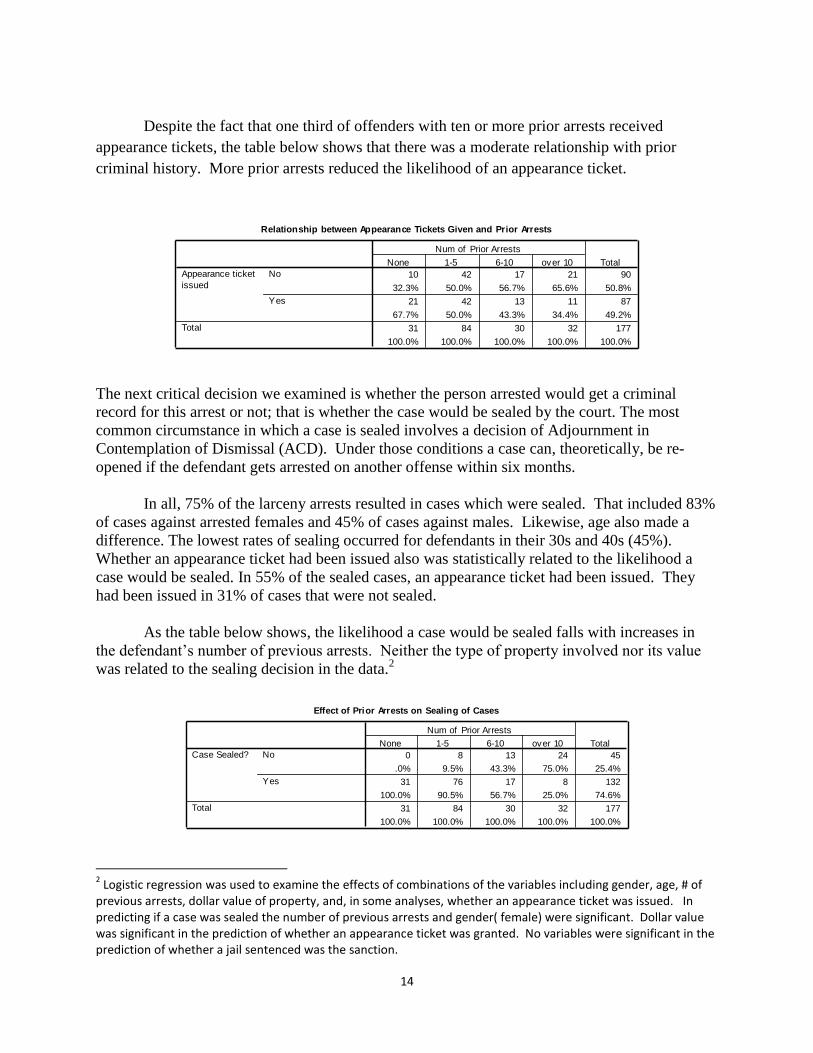
Despite the fact that one third of offenders with ten or more prior arrests received
appearance tickets, the table below shows that there was a moderate relationship with prior
criminal history. More prior arrests reduced the likelihood of an appearance ticket.
The next critical decision we examined is whether the person arrested would get a criminal
record for this arrest or not; that is whether the case would be sealed by the court. The most
common circumstance in which a case is sealed involves a decision of Adjournment in
Contemplation of Dismissal (ACD). Under those conditions a case can, theoretically, be re-
opened if the defendant gets arrested on another offense within six months.
In all, 75% of the larceny arrests resulted in cases which were sealed. That included 83%
of cases against arrested females and 45% of cases against males. Likewise, age also made a
difference. The lowest rates of sealing occurred for defendants in their 30s and 40s (45%).
Whether an appearance ticket had been issued also was statistically related to the likelihood a
case would be sealed. In 55% of the sealed cases, an appearance ticket had been issued. They
had been issued in 31% of cases that were not sealed.
As the table below shows, the likelihood a case would be sealed falls with increases in
the defendant’s number of previous arrests. Neither the type of property involved nor its value
was related to the sealing decision in the data.2
2 Logistic regression was used to examine the effects of combinations of the variables including gender, age, # of
previous arrests, dollar value of property, and, in some analyses, whether an appearance ticket was issued. In predicting if a case was sealed the number of previous arrests and gender( female) were significant. Dollar value was significant in the prediction of whether an appearance ticket was granted. No variables were significant in the prediction of whether a jail sentenced was the sanction.
Relationship between Appearance Tickets Given and Prior Arrests
10 42 17 21 90
32.3% 50.0% 56.7% 65.6% 50.8%
21 42 13 11 87
67.7% 50.0% 43.3% 34.4% 49.2%
31 84 30 32 177
100.0% 100.0% 100.0% 100.0% 100.0%
No
Yes
Appearance ticket
issued
Total
None 1-5 6-10 over 10
Num of Prior Arrests
Total
Effect of Prior Arrests on Sealing of Cases
0 8 13 24 45
.0% 9.5% 43.3% 75.0% 25.4%
31 76 17 8 132
100.0% 90.5% 56.7% 25.0% 74.6%
31 84 30 32 177
100.0% 100.0% 100.0% 100.0% 100.0%
No
Yes
Case Sealed?
Total
None 1-5 6-10 over 10
Num of Prior Arrests
Total

15
Finally we will discuss the 16 cases resulting in sentences to jail. This accounts for 9%
of all the cases and 35% of the non-sealed cases. Three of these cases resulted in the maximum
of 1 year in jail and one was for 6 months. At the other end of the continuum there was one
sentence of one day in jail and two other sentences of less than two weeks. Five sentences were
for three weeks to a month and three were for between two and approximately three months.
Eight of the 16 who received jail sentences were male, six were African American and five were
Hispanic. Ten were in their 20’s or 30’s. There was nothing about the nature or value of the
property involved which explained the sentences. The longest jail sentences involved property
valued from $35-$245. Although in one case, four cases of Red Bull and 7 cases of infant
formula was not only an interesting combination but may also suggest a motive of theft for
resale. The only information available which distinguished those receiving jail sentences from
the other cases was the length of their criminal records and their histories of arrests for offenses
other than larceny. Those sentenced to jail had, on average, twice as many prior arrests (14) than
the others (7). Those ratios were similar for prior arrests for larceny and prior arrests for other
offenses.
Summary
The data on calls for police service in Rochester shows that the Walmart location
provides the highest volume of calls, although this is a small proportion of all calls for service in
the City. Approximately half of the Walmart calls involve reports of larceny. Significant levels
of law enforcement resources are used in response to these calls.
About half of the larceny calls result in an arrest and about half of the arrests result in
appearance tickets being issued at the scene. Based on this data, the typical person arrested for
larceny at Walmart is a young woman in her late teens or early 20s who lives within a mile or
two from the store. She is equally likely to be White or Black. She is arrested for shoplifting
clothing, make-up or toiletries which are valued at around $60. She has between zero and three
previous arrests. She has a 50% chance of being given an appearance ticket and an 80% chance
of having her case sealed in court.
Ten percent of those arrested for larceny, or 18 individuals have prior records of more
than 20 arrests. Five of them received appearance tickets but the case was sealed in only one
case. They did not distinguish themselves by other criteria including the nature and value of the
property involved or the nature of their previous arrests. Even for this group which has the
longest criminal histories, only four received sentences to jail.
Conclusion and Implications
Several significant issues are raised as a result of this analysis:

16
1. It is worth noting again that the Walmart cases discussed here are included in this
reported because the store was the location for the greatest number of calls for police
services in Rochester in 2010. The calls for service are, however, a small fraction of all
calls for service (.25%) involving the police department. The larceny related calls are a
modest fraction of all larceny reported in the City (6%). Nonetheless, it is estimated that
these cases comprise 44% of all officially recorded cases of shoplifting in the City. That
volume suggests that there can be real value in close examination of the cases and their
processing.
2. It also seems important to begin by recognizing the apparent rationality and
reasonableness of the outcomes of the complicated processes which operate here- from
dispatch to police intervention and through prosecution and the courts. This is
particularly true when the focus is on individual cases. Many cases involve the
shoplifting of property of limited value by people with limited criminal histories. The
results are that many cases result in appearance tickets and nearly all cases are sealed.
3. There are, however, a variety of criteria which might be employed when considering the
contributions of the criminal justice process as it pertains to these larceny cases. The
record of previous larceny cases among those arrested suggests limited effectiveness at
changing behavior. The process also does not seem to make a significant contribution to
the identification of serious offenders or to intervention to reduce further crime. The vast
majority of cases are sealed and, even for the others, few significant penalties are handed
down.
4. In light of the volume of larceny cases reported, an effort should be made to evaluate the
impact of addressing these cases through the existing formal criminal justice process.
That should consider how well this process serves goals of criminal justice, including
crime prevention and reduction. It should also include an assessment of how well this
process serves the goals and interests of retailers involved. And, it should examine the
impact of those processes on those arrested and on the neighborhood and larger
community.
5. There is little evidence from this report of effects commonly hoped for in public safety
interventions which address crime. There are no obvious deterrent, incapacitative or
therapeutic effects. This should raise the question of whether the use of public safety
resources, or at least the use of those resources exclusively, to address these larcenies is
sound public policy. One could, however, carry this question still further to consider
whether even the traditional goals of criminal justice should be germane with regard to
the majority of low level activity reflected in many of these cases.

17
6. In this analysis the decision to issue an appearance ticket or not could not be predicted
well from information about age, gender, previous record or the value of property in the
larceny, or by the combination of these variables. It may be that situational factors
influence these decisions. However, since the appearance ticket decision had little
influence on the decision to seal a case or to sentence a defendant to jail, and since the
vast majority of cases are sealed, policy regarding appearance tickets and the potential
increase in their use could be explored.
7. This analysis also suggests that there may be value in examining existing programs
intended to reduce retail theft. Important resources for addressing shoplifting can be
found at the Center for Problem Oriented Policing at
http://www.popcenter.org/search/?cx=016817335679885975849%3Agiidughzfro&q=shoplifting
including one experimental design investigation of three approaches to reducing shoplifting, see
http://www.popcenter.org/library/crimeprevention/volume_01/05farrington.pdf One
program has been described a promising in a review by the Office of Justice Programs.
The program based in Great Britain involved the redesign of retail space and addition of
surveillance programs. See http://www.crimesolutions.gov/ProgramDetails.aspx?ID=59
8. The contributions of community crime prevention programs should also be examined.
Problem solving courts- Community Court in particular has shown positive results. See
http://www.courtinnovation.org/topic/community-court Restorative justice models have
also shown promise. One promising program identified by the U.S. Office of Justice
Programs should be considered as a potentially useful response to this problem. The
program known as Communities that Care seeks to redirect community resources to
address problematic behavior such as shoplifting. See
http://www.crimesolutions.gov/ProgramDetails.aspx?ID=94
9. As with any analysis of calls for service, this examination may be of value in evaluations
of resource deployment and particularly the availability of personnel during late
afternoon and early evening periods when calls for service are at their highest.
10. The impact of property crime and larceny, in particular, on overall crime rates for the
community should also be part of the conversation relevant to this report. Community
crime levels are reported through the FBI’s Uniform Crime Reports. Under this system,
the total index crime and the crime rate are constructed by adding together the total
number of crimes in nine offense categories. A single shoplifting is, therefore, counted
the same as any more serious crime such as a homicide or robbery. Larceny, because of
its low seriousness and high volume, makes the greatest numerical contribution to these
measures. This influences Rochester and Monroe County crime statistics. In Monroe
County in 2010 larceny comprised 65% of all crimes reported. It was, however,
somewhat lower in other counties. For example, it was 60% of total crime in both Erie

18
and Onondaga counties. These differences may reflect real differences in behavior but
may also reflect differences in how cases are handled. The issue is relevant to all
reported larcenies and many low serious offenses of other kinds. In this particular case,
the larcenies reported from the 1490 Hudson Avenue Walmart in 2010 accounted for
approximately 2% of the County’s total crime index and 3.3% of the City’s. Local
reliance on formal processing may contribute to official crime levels and, at the same
time, it may have little or no effect in terms of crime reduction.