Retail / Office Space For Lease - Ponderosa Shopping...
11
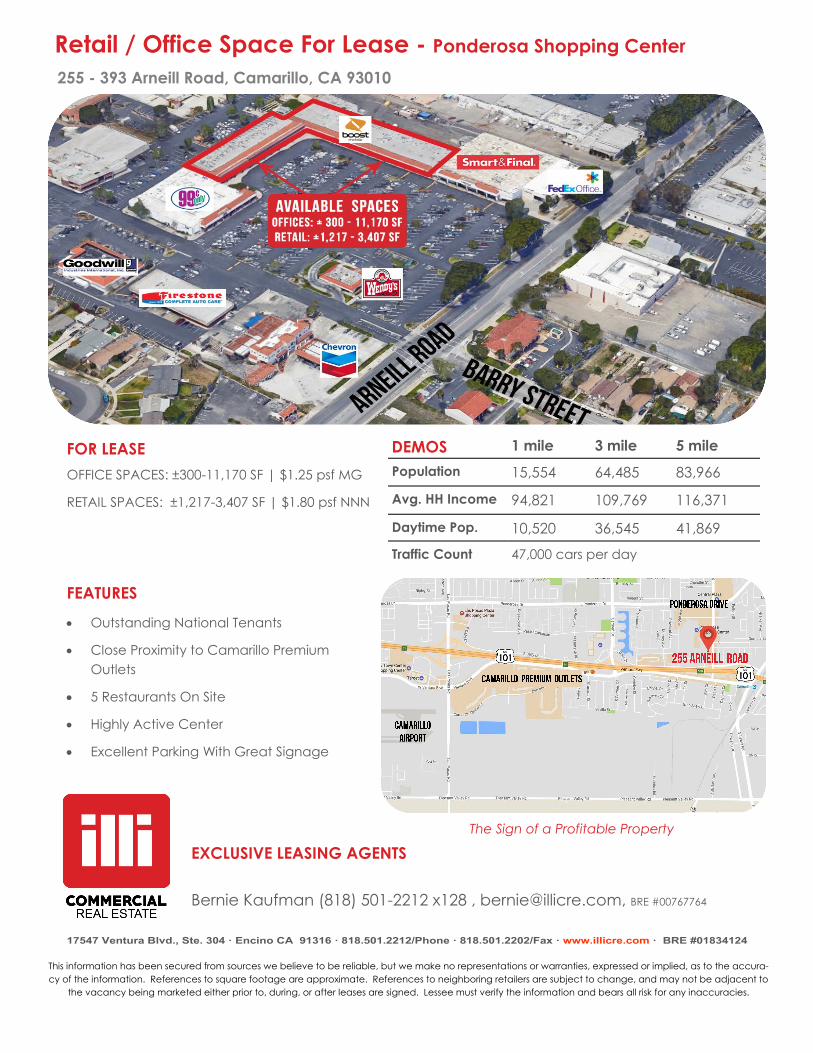
1 mile 3 mile 5 mile Population 15,554 64,485 83,966 Avg. HH Income 94,821 109,769 116,371 Daytime Pop. 10,520 36,545 41,869 Traffic Count 47,000 cars per day FEATURES Outstanding National Tenants Close Proximity to Camarillo Premium Outlets 5 Restaurants On Site Highly Active Center Excellent Parking With Great Signage FOR LEASE OFFICE SPACES: ±300-11,170 SF | $1.25 psf MG RETAIL SPACES: ±1,217-3,407 SF | $1.80 psf NNN EXCLUSIVE LEASING AGENTS Bernie Kaufman (818) 501-2212 x128 , [email protected], BRE #00767764 This information has been secured from sources we believe to be reliable, but we make no representations or warranties, expressed or implied, as to the accura- cy of the information. References to square footage are approximate. References to neighboring retailers are subject to change, and may not be adjacent to the vacancy being marketed either prior to, during, or after leases are signed. Lessee must verify the information and bears all risk for any inaccuracies. Retail / Office Space For Lease - Ponderosa Shopping Center 255 - 393 Arneill Road, Camarillo, CA 93010 The Sign of a Profitable Property DEMOS
Transcript of Retail / Office Space For Lease - Ponderosa Shopping...
1 mile 3 mile 5 mile
Population 15,554 64,485 83,966
Avg. HH Income 94,821 109,769 116,371
Daytime Pop. 10,520 36,545 41,869
Traffic Count 47,000 cars per day
FEATURES
Outstanding National Tenants
Close Proximity to Camarillo Premium
Outlets
5 Restaurants On Site
Highly Active Center
Excellent Parking With Great Signage
FOR LEASE
OFFICE SPACES: ±300-11,170 SF | $1.25 psf MG
RETAIL SPACES: ±1,217-3,407 SF | $1.80 psf NNN
EXCLUSIVE LEASING AGENTS
Bernie Kaufman (818) 501-2212 x128 , [email protected], BRE #00767764
This information has been secured from sources we believe to be reliable, but we make no representations or warranties, expressed or implied, as to the accura-
cy of the information. References to square footage are approximate. References to neighboring retailers are subject to change, and may not be adjacent to
the vacancy being marketed either prior to, during, or after leases are signed. Lessee must verify the information and bears all risk for any inaccuracies.
Retail / Office Space For Lease - Ponderosa Shopping Center
255 - 393 Arneill Road, Camarillo, CA 93010
The Sign of a Profitable Property
DEMOS

NOT TO SCALE
ALL MEASUREMENTS ARE APPROXIMATE
341A
341
345
353B
353
361A
361
365
369
373
377
381
385
TENANTS
101 - Good Morning Cafe
103 - VACANT ± 2,190 SF
105 - VACANT ± 1,217 SF
106 - Paris Nails & Spa
108 - Aza Fit Club
109 - Consumers Mortgage
Realty
111 - Cozy Massage
255 - Chevron/Food Mart/
Car Wash
261 - Firestone Complete
Auto Care
267 - Goodwill
301 - 99 Cents Store
307 - Wendy’s
341A - Moose Family Center
341 - Love Pho N’Mor
345 - Taqueria El Tapatio
353B - VACANT ± 2,417 SF
353 - Boost Mobile
361A - Lucky Pawnshop
361 - Cig Store # 8
365 - Bianco Rosso Pizzeria
369 - The Clubhouse
373 - Metro PCS
377 - Check’N Go
381 - Camarillo Jewelers
385 - Doris Panaderia Bakery
389 - Smart & Final
393 - FedEx
267 255
307
389
393
261
301
255
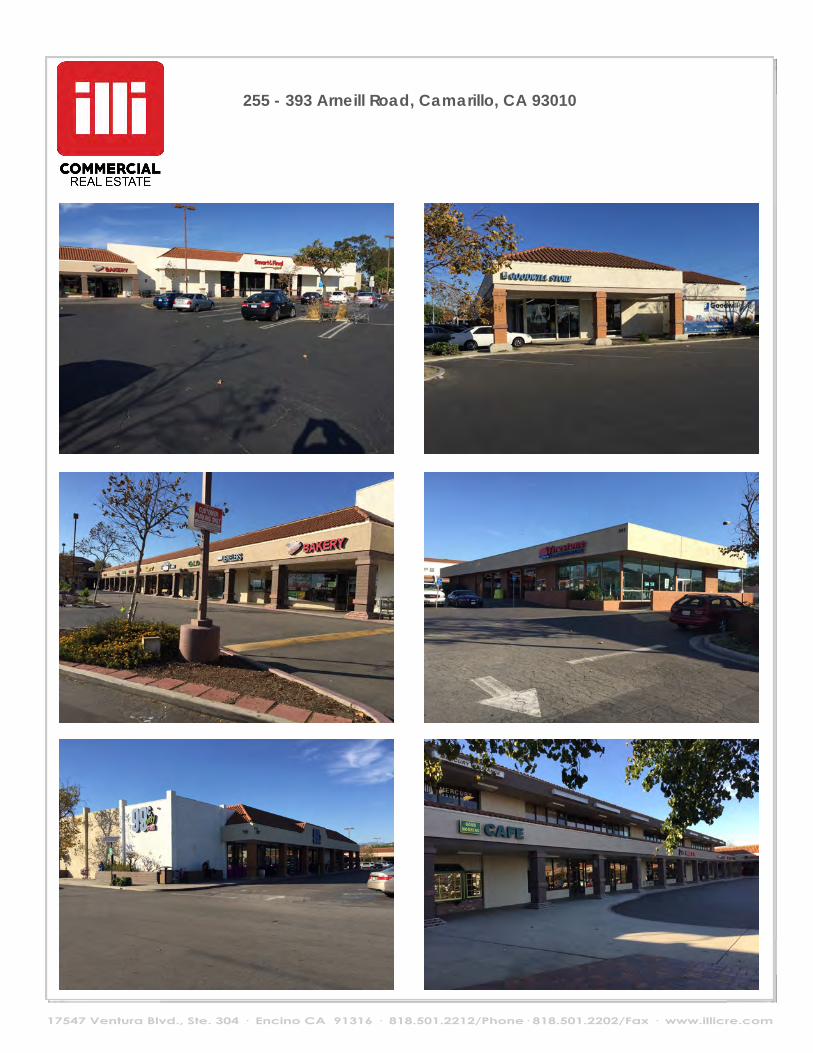
255 - 393 Arneill Road, Camarillo, CA 93010
Arn
eill
Ro
ad
111
109
108
106
105
103
101
EXHIBIT A
255 - 393 Arneill Road, Camarillo, CA 93010

Traffic Count Map - Close Up255 Arneill Rd, Camarillo, California, 93010 2 Prepared by Esri255 Arneill Rd, Camarillo, California, 93010 Latitude: 34.21904Rings: 1, 3, 5 mile radii Longitude: -119.03903
Source: ©2016 Kalibrate Technologies
December 05, 2016
©2016 Esri Page 1 of 1

Traffic Count Map255 Arneill Rd, Camarillo, California, 93010 2 Prepared by Esri255 Arneill Rd, Camarillo, California, 93010 Latitude: 34.21904Rings: 1, 3, 5 mile radii Longitude: -119.03903
Source: ©2016 Kalibrate Technologies
December 05, 2016
©2016 Esri Page 1 of 1

Traffic Count Profile255 Arneill Rd, Camarillo, California, 93010 2 Prepared by Esri255 Arneill Rd, Camarillo, California, 93010 Latitude: 34.21904Rings: 1, 3, 5 mile radii Longitude: -119.03903
Distance: Street: Closest Cross-street: Year of Count: Count:
0.06 Barry St N Glenn Dr (0.02 miles NE) 2009 3,000
0.08 Arneill Rd A (0.02 miles S) 2009 23,000
0.10 E Daily Dr Arneill Rd (0.03 miles E) 2009 10,000
0.10 E Daily Dr N Glenn Dr (0.03 miles E) 2009 14,000
0.14 Arneill Rd F (0.01 miles SE) 2009 19,000
0.16 E Daily Dr Raemere St (0.07 miles E) 2008 11,000
0.17 Fulton St E Daily Dr (0.01 miles N) 2009 16,000
0.18 Ventura Blvd Elm Dr (0.03 miles E) 2009 10,000
0.19 Ventura Fwy Arneill Rd (0.15 miles E) 2012 139,000
0.21 Ventura Blvd S Glenn Dr (0.02 miles W) 2009 16,000
0.23 Mobil Ave Barry St (0.02 miles S) 2009 7,000
0.25 Pickwick Dr Mobil Ave (0.10 miles W) 2009 9,000
0.26 Arneill Rd Pickwick Dr (0.03 miles S) 2009 22,000
0.26 Pickwick Dr Hartnell St (0.04 miles NE) 2009 8,000
0.27 Ventura Blvd Nellora (0.02 miles E) 2009 15,000
0.30 E Daily Dr N Lewis Rd (0.04 miles E) 2009 12,000
0.30 E Daily Dr Murray Ave (0.04 miles W) 2009 13,000
0.32 S Lewis Rd Ventura Fwy (0.03 miles N) 2012 18,200
0.33 N Lewis Rd Ventura Fwy (0.03 miles SW) 2012 18,200
0.33 Hartnell St Staunton St (0.02 miles E) 2009 2,000
0.34 Mobil Ave Pickwick Dr (0.04 miles S) 2005 7,000
0.34 E Ponderosa Dr Arneill Rd (0.10 miles E) 2009 14,000
0.37 N Lewis Rd E Daily Dr (0.08 miles SW) 2012 18,900
0.38 S Lewis Rd Dawson Dr (0.12 miles S) 2012 10,400
0.38 (0.00 miles ) 2009 17,000
0.39 E Ponderosa Dr Mobil Ave (0.01 miles E) 2005 21,000
0.41 N Dawson Dr Mission Oaks Blvd (0.02 miles NE) 2003 12,000
0.41 Dawson Dr Petit St (0.03 miles SW) 2009 13,000
0.42 Arneill Rd S (0.01 miles NW) 2009 18,000
0.46 Dawson Dr Calleguas (0.04 miles W) 2009 7,000
Data Note:The Traffic Profile displays up to 30 of the closest available traffic counts within the largest radius around your site. The years of the counts in the database range from 2016 to 1963. Over 25% of the counts were taken between 2010 and 2016 and over 77% of the counts were taken between 2000 and 2016. Traffic counts are identified by the street on which they were recorded, along with the distance and direction to the closest cross-street. Distances displayed as 0.00 miles (due to rounding), are closest to the site. A traffic count is defined as the two-way Average Daily Traffic (ADT) that passes that location.Source: ©2016 Kalibrate Technologies
December 05, 2016
©2016 Esri Page 1 of 1

Site Map on Satellite Imagery - 1.6 Miles Wide255 Arneill Rd, Camarillo, California, 93010 2 Prepared by Esri255 Arneill Rd, Camarillo, California, 93010 Latitude: 34.21904Rings: 1, 3, 5 mile radii Longitude: -119.03903
Source: ArcGIS Online World Imagery Basemap
December 05, 2016
©2016 Esri Page 1 of 1
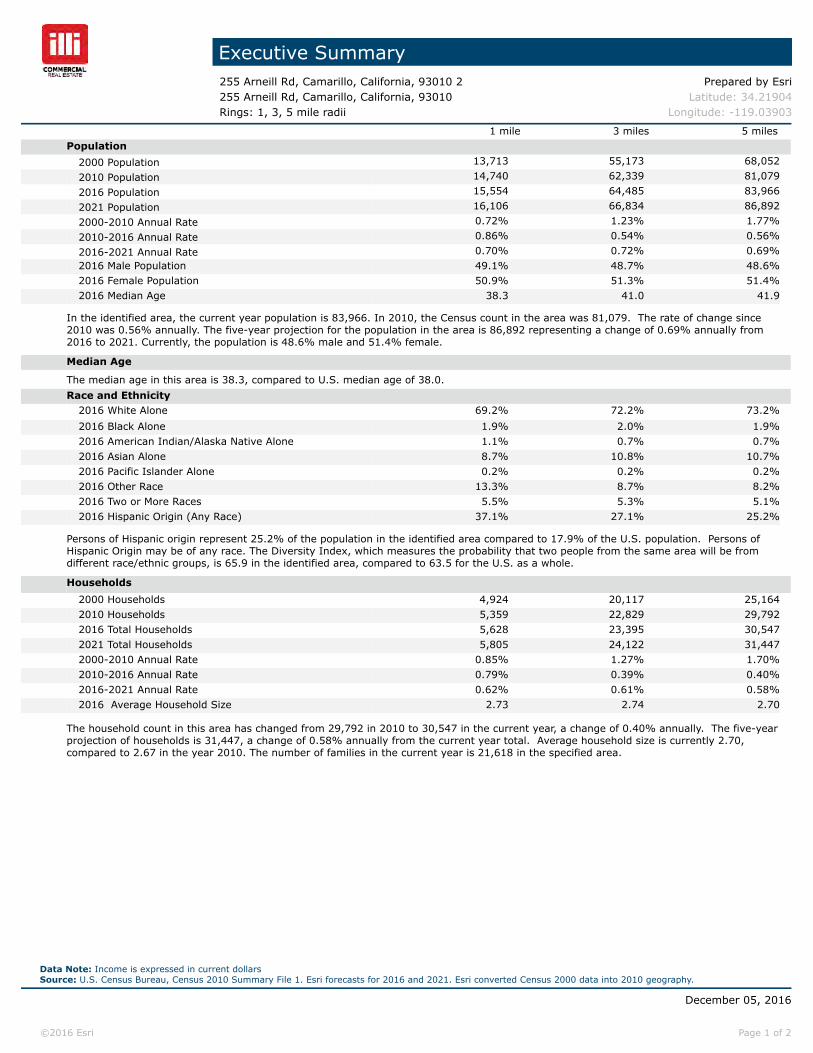
Executive Summary255 Arneill Rd, Camarillo, California, 93010 2 Prepared by Esri255 Arneill Rd, Camarillo, California, 93010 Latitude: 34.21904Rings: 1, 3, 5 mile radii Longitude: -119.03903
1 mile 3 miles 5 milesPopulation
2000 Population 13,713 55,173 68,0522010 Population 14,740 62,339 81,0792016 Population 15,554 64,485 83,9662021 Population 16,106 66,834 86,8922000-2010 Annual Rate 0.72% 1.23% 1.77%2010-2016 Annual Rate 0.86% 0.54% 0.56%2016-2021 Annual Rate 0.70% 0.72% 0.69%2016 Male Population 49.1% 48.7% 48.6%2016 Female Population 50.9% 51.3% 51.4%2016 Median Age 38.3 41.0 41.9
In the identified area, the current year population is 83,966. In 2010, the Census count in the area was 81,079. The rate of change since 2010 was 0.56% annually. The five-year projection for the population in the area is 86,892 representing a change of 0.69% annually from 2016 to 2021. Currently, the population is 48.6% male and 51.4% female.
Median Age
The median age in this area is 38.3, compared to U.S. median age of 38.0.Race and Ethnicity
2016 White Alone 69.2% 72.2% 73.2%2016 Black Alone 1.9% 2.0% 1.9%2016 American Indian/Alaska Native Alone 1.1% 0.7% 0.7%2016 Asian Alone 8.7% 10.8% 10.7%2016 Pacific Islander Alone 0.2% 0.2% 0.2%2016 Other Race 13.3% 8.7% 8.2%2016 Two or More Races 5.5% 5.3% 5.1%2016 Hispanic Origin (Any Race) 37.1% 27.1% 25.2%
Persons of Hispanic origin represent 25.2% of the population in the identified area compared to 17.9% of the U.S. population. Persons of Hispanic Origin may be of any race. The Diversity Index, which measures the probability that two people from the same area will be from different race/ethnic groups, is 65.9 in the identified area, compared to 63.5 for the U.S. as a whole.
Households2000 Households 4,924 20,117 25,1642010 Households 5,359 22,829 29,7922016 Total Households 5,628 23,395 30,5472021 Total Households 5,805 24,122 31,4472000-2010 Annual Rate 0.85% 1.27% 1.70%2010-2016 Annual Rate 0.79% 0.39% 0.40%2016-2021 Annual Rate 0.62% 0.61% 0.58%2016 Average Household Size 2.73 2.74 2.70
The household count in this area has changed from 29,792 in 2010 to 30,547 in the current year, a change of 0.40% annually. The five-year projection of households is 31,447, a change of 0.58% annually from the current year total. Average household size is currently 2.70, compared to 2.67 in the year 2010. The number of families in the current year is 21,618 in the specified area.
Data Note: Income is expressed in current dollarsSource: U.S. Census Bureau, Census 2010 Summary File 1. Esri forecasts for 2016 and 2021. Esri converted Census 2000 data into 2010 geography.
December 05, 2016
©2016 Esri Page 1 of 2
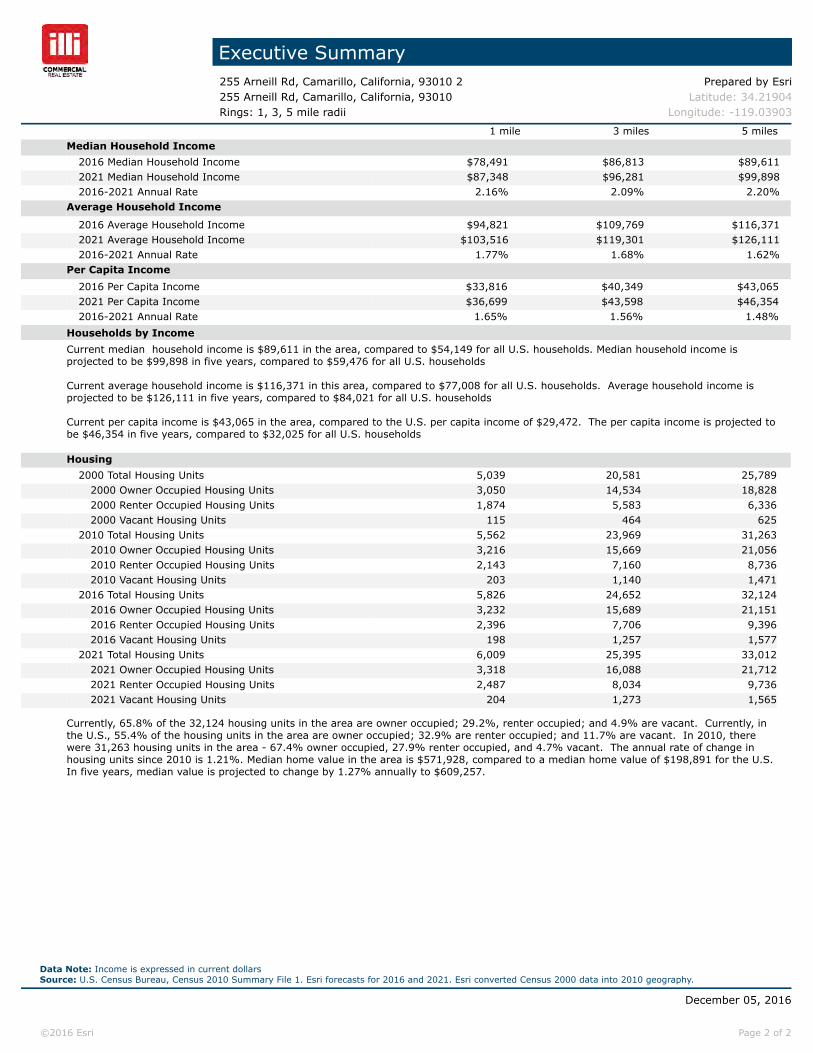
Executive Summary255 Arneill Rd, Camarillo, California, 93010 2 Prepared by Esri255 Arneill Rd, Camarillo, California, 93010 Latitude: 34.21904Rings: 1, 3, 5 mile radii Longitude: -119.03903
1 mile 3 miles 5 milesMedian Household Income
2016 Median Household Income $78,491 $86,813 $89,6112021 Median Household Income $87,348 $96,281 $99,8982016-2021 Annual Rate 2.16% 2.09% 2.20%
Average Household Income
2016 Average Household Income $94,821 $109,769 $116,3712021 Average Household Income $103,516 $119,301 $126,1112016-2021 Annual Rate 1.77% 1.68% 1.62%
Per Capita Income2016 Per Capita Income $33,816 $40,349 $43,0652021 Per Capita Income $36,699 $43,598 $46,3542016-2021 Annual Rate 1.65% 1.56% 1.48%
Households by IncomeCurrent median household income is $89,611 in the area, compared to $54,149 for all U.S. households. Median household income is projected to be $99,898 in five years, compared to $59,476 for all U.S. households
Current average household income is $116,371 in this area, compared to $77,008 for all U.S. households. Average household income is projected to be $126,111 in five years, compared to $84,021 for all U.S. households
Current per capita income is $43,065 in the area, compared to the U.S. per capita income of $29,472. The per capita income is projected to be $46,354 in five years, compared to $32,025 for all U.S. households Housing
2000 Total Housing Units 5,039 20,581 25,7892000 Owner Occupied Housing Units 3,050 14,534 18,8282000 Renter Occupied Housing Units 1,874 5,583 6,3362000 Vacant Housing Units 115 464 625
2010 Total Housing Units 5,562 23,969 31,2632010 Owner Occupied Housing Units 3,216 15,669 21,0562010 Renter Occupied Housing Units 2,143 7,160 8,7362010 Vacant Housing Units 203 1,140 1,471
2016 Total Housing Units 5,826 24,652 32,1242016 Owner Occupied Housing Units 3,232 15,689 21,1512016 Renter Occupied Housing Units 2,396 7,706 9,3962016 Vacant Housing Units 198 1,257 1,577
2021 Total Housing Units 6,009 25,395 33,0122021 Owner Occupied Housing Units 3,318 16,088 21,7122021 Renter Occupied Housing Units 2,487 8,034 9,7362021 Vacant Housing Units 204 1,273 1,565
Currently, 65.8% of the 32,124 housing units in the area are owner occupied; 29.2%, renter occupied; and 4.9% are vacant. Currently, in the U.S., 55.4% of the housing units in the area are owner occupied; 32.9% are renter occupied; and 11.7% are vacant. In 2010, there were 31,263 housing units in the area - 67.4% owner occupied, 27.9% renter occupied, and 4.7% vacant. The annual rate of change in housing units since 2010 is 1.21%. Median home value in the area is $571,928, compared to a median home value of $198,891 for the U.S. In five years, median value is projected to change by 1.27% annually to $609,257.
Data Note: Income is expressed in current dollarsSource: U.S. Census Bureau, Census 2010 Summary File 1. Esri forecasts for 2016 and 2021. Esri converted Census 2000 data into 2010 geography.
December 05, 2016
©2016 Esri Page 2 of 2

Business Summary255 Arneill Rd, Camarillo, California, 93010 2 Prepared by Esri255 Arneill Rd, Camarillo, California, 93010 Latitude: 34.21904Rings: 1, 3, 5 mile radii Longitude: -119.03903
Data for all businesses in area 1 mile 3 miles 5 milesTotal Businesses: 1,143 3,434 3,925Total Employees: 10,520 36,545 41,869Total Residential Population: 15,554 64,485 83,966Employee/Residential Population Ratio: 0.68:1 0.57:1 0.5:1
Businesses Employees Businesses Employees Businesses Employeesby SIC Codes Number Percent Number Percent Number Percent Number Percent Number Percent Number PercentAgriculture & Mining 24 2.1% 144 1.4% 76 2.2% 485 1.3% 102 2.6% 774 1.8%Construction 76 6.6% 433 4.1% 285 8.3% 1,512 4.1% 336 8.6% 1,828 4.4%Manufacturing 41 3.6% 726 6.9% 191 5.6% 5,275 14.4% 216 5.5% 6,003 14.3%Transportation 30 2.6% 465 4.4% 78 2.3% 957 2.6% 89 2.3% 1,102 2.6%Communication 9 0.8% 118 1.1% 28 0.8% 512 1.4% 32 0.8% 571 1.4%Utility 2 0.2% 25 0.2% 9 0.3% 75 0.2% 11 0.3% 93 0.2%Wholesale Trade 33 2.9% 380 3.6% 125 3.6% 1,767 4.8% 146 3.7% 2,124 5.1%
Retail Trade Summary 295 25.8% 3,675 34.9% 767 22.3% 10,170 27.8% 884 22.5% 11,468 27.4%Home Improvement 32 2.8% 428 4.1% 97 2.8% 2,320 6.3% 114 2.9% 2,506 6.0%General Merchandise Stores 7 0.6% 245 2.3% 16 0.5% 522 1.4% 18 0.5% 591 1.4%Food Stores 24 2.1% 277 2.6% 56 1.6% 862 2.4% 66 1.7% 948 2.3%Auto Dealers, Gas Stations, Auto Aftermarket 18 1.6% 163 1.5% 53 1.5% 437 1.2% 60 1.5% 502 1.2%Apparel & Accessory Stores 35 3.1% 368 3.5% 89 2.6% 956 2.6% 105 2.7% 1,144 2.7%Furniture & Home Furnishings 21 1.8% 393 3.7% 75 2.2% 860 2.4% 86 2.2% 957 2.3%Eating & Drinking Places 74 6.5% 1,077 10.2% 169 4.9% 2,435 6.7% 190 4.8% 2,691 6.4%Miscellaneous Retail 84 7.3% 723 6.9% 211 6.1% 1,777 4.9% 244 6.2% 2,128 5.1%
Finance, Insurance, Real Estate Summary 137 12.0% 760 7.2% 383 11.2% 2,002 5.5% 426 10.9% 2,151 5.1%Banks, Savings & Lending Institutions 38 3.3% 157 1.5% 96 2.8% 337 0.9% 108 2.8% 352 0.8%Securities Brokers 13 1.1% 51 0.5% 48 1.4% 211 0.6% 51 1.3% 224 0.5%Insurance Carriers & Agents 32 2.8% 152 1.4% 96 2.8% 492 1.3% 106 2.7% 518 1.2%Real Estate, Holding, Other Investment Offices 54 4.7% 400 3.8% 142 4.1% 962 2.6% 161 4.1% 1,057 2.5%
Services Summary 440 38.5% 3,375 32.1% 1,310 38.1% 12,273 33.6% 1,468 37.4% 14,057 33.6%Hotels & Lodging 5 0.4% 78 0.7% 13 0.4% 182 0.5% 16 0.4% 222 0.5%Automotive Services 37 3.2% 193 1.8% 90 2.6% 475 1.3% 100 2.5% 537 1.3%Motion Pictures & Amusements 20 1.7% 281 2.7% 80 2.3% 1,455 4.0% 92 2.3% 1,686 4.0%Health Services 62 5.4% 662 6.3% 220 6.4% 2,099 5.7% 240 6.1% 2,285 5.5%Legal Services 26 2.3% 93 0.9% 56 1.6% 220 0.6% 61 1.6% 242 0.6%Education Institutions & Libraries 18 1.6% 360 3.4% 58 1.7% 2,064 5.6% 67 1.7% 2,449 5.8%Other Services 272 23.8% 1,708 16.2% 793 23.1% 5,777 15.8% 893 22.8% 6,636 15.8%
Government 14 1.2% 366 3.5% 44 1.3% 1,274 3.5% 49 1.2% 1,439 3.4%
Unclassified Establishments 44 3.8% 53 0.5% 139 4.0% 243 0.7% 166 4.2% 258 0.6%
Totals 1,143 100.0% 10,520 100.0% 3,434 100.0% 36,545 100.0% 3,925 100.0% 41,869 100.0%
Source: Copyright 2016 Infogroup, Inc. All rights reserved. Esri Total Residential Population forecasts for 2016.Date Note: Data on the Business Summary report is calculated using Esri’s Data allocation method which uses census block groups to allocate business summary data to custom areas.
December 05, 2016
©2016 Esri Page 1 of 3

Business Summary255 Arneill Rd, Camarillo, California, 93010 2 Prepared by Esri255 Arneill Rd, Camarillo, California, 93010 Latitude: 34.21904Rings: 1, 3, 5 mile radii Longitude: -119.03903
Agriculture, Forestry, Fishing & Hunting 7 0.6% 51 0.5% 20 0.6% 218 0.6% 35 0.9% 451 1.1%Mining 0 0.0% 4 0.0% 1 0.0% 10 0.0% 2 0.1% 15 0.0%Utilities 1 0.1% 11 0.1% 7 0.2% 54 0.1% 9 0.2% 72 0.2%Construction 77 6.7% 434 4.1% 298 8.7% 1,560 4.3% 351 8.9% 1,890 4.5%Manufacturing 46 4.0% 626 6.0% 196 5.7% 5,042 13.8% 221 5.6% 5,720 13.7%Wholesale Trade 31 2.7% 376 3.6% 119 3.5% 1,752 4.8% 140 3.6% 2,108 5.0%Retail Trade 212 18.5% 2,554 24.3% 583 17.0% 7,638 20.9% 678 17.3% 8,671 20.7%
Motor Vehicle & Parts Dealers 11 1.0% 105 1.0% 37 1.1% 335 0.9% 41 1.0% 391 0.9%Furniture & Home Furnishings Stores 7 0.6% 37 0.4% 22 0.6% 136 0.4% 26 0.7% 162 0.4%Electronics & Appliance Stores 15 1.3% 363 3.5% 54 1.6% 782 2.1% 60 1.5% 847 2.0%Bldg Material & Garden Equipment & Supplies Dealers 31 2.7% 425 4.0% 96 2.8% 2,316 6.3% 113 2.9% 2,502 6.0%Food & Beverage Stores 17 1.5% 237 2.3% 44 1.3% 767 2.1% 54 1.4% 852 2.0%Health & Personal Care Stores 16 1.4% 83 0.8% 43 1.3% 225 0.6% 48 1.2% 276 0.7%Gasoline Stations 7 0.6% 58 0.6% 16 0.5% 103 0.3% 19 0.5% 111 0.3%Clothing & Clothing Accessories Stores 43 3.8% 411 3.9% 104 3.0% 1,051 2.9% 123 3.1% 1,259 3.0%Sport Goods, Hobby, Book, & Music Stores 15 1.3% 113 1.1% 43 1.3% 296 0.8% 49 1.2% 346 0.8%General Merchandise Stores 7 0.6% 245 2.3% 16 0.5% 522 1.4% 18 0.5% 591 1.4%Miscellaneous Store Retailers 39 3.4% 472 4.5% 96 2.8% 1,076 2.9% 112 2.9% 1,300 3.1%Nonstore Retailers 4 0.3% 6 0.1% 13 0.4% 31 0.1% 13 0.3% 33 0.1%
Transportation & Warehousing 26 2.3% 450 4.3% 63 1.8% 898 2.5% 72 1.8% 1,036 2.5%Information 22 1.9% 384 3.7% 73 2.1% 1,585 4.3% 83 2.1% 1,742 4.2%Finance & Insurance 84 7.3% 363 3.5% 242 7.0% 1,042 2.9% 265 6.8% 1,097 2.6%
Central Bank/Credit Intermediation & Related Activities 37 3.2% 152 1.4% 92 2.7% 315 0.9% 104 2.6% 330 0.8%Securities, Commodity Contracts & Other Financial Investments & Other Related Activities
15 1.3% 58 0.6% 53 1.5% 236 0.6% 56 1.4% 249 0.6%Insurance Carriers & Related Activities; Funds, Trusts & Other Financial Vehicles
32 2.8% 152 1.4% 96 2.8% 492 1.3% 106 2.7% 518 1.2%Real Estate, Rental & Leasing 65 5.7% 450 4.3% 169 4.9% 1,082 3.0% 191 4.9% 1,194 2.9%Professional, Scientific & Tech Services 121 10.6% 577 5.5% 373 10.9% 2,606 7.1% 422 10.8% 2,994 7.2%
Legal Services 29 2.5% 112 1.1% 65 1.9% 269 0.7% 71 1.8% 292 0.7%Management of Companies & Enterprises 0 0.0% 0 0.0% 3 0.1% 9 0.0% 3 0.1% 9 0.0%Administrative & Support & Waste Management & Remediation Services
53 4.6% 398 3.8% 173 5.0% 1,104 3.0% 191 4.9% 1,296 3.1%Educational Services 25 2.2% 456 4.3% 75 2.2% 2,202 6.0% 86 2.2% 2,599 6.2%Health Care & Social Assistance 78 6.8% 913 8.7% 267 7.8% 2,931 8.0% 292 7.4% 3,221 7.7%Arts, Entertainment & Recreation 15 1.3% 168 1.6% 51 1.5% 754 2.1% 62 1.6% 954 2.3%Accommodation & Food Services 82 7.2% 1,177 11.2% 189 5.5% 2,661 7.3% 213 5.4% 2,962 7.1%
Accommodation 5 0.4% 78 0.7% 13 0.4% 182 0.5% 16 0.4% 222 0.5%Food Services & Drinking Places 77 6.7% 1,099 10.4% 176 5.1% 2,478 6.8% 197 5.0% 2,739 6.5%
Other Services (except Public Administration) 142 12.4% 705 6.7% 350 10.2% 1,871 5.1% 394 10.0% 2,131 5.1%Automotive Repair & Maintenance 27 2.4% 148 1.4% 72 2.1% 387 1.1% 80 2.0% 440 1.1%
Public Administration 14 1.2% 373 3.5% 45 1.3% 1,290 3.5% 50 1.3% 1,459 3.5%
Unclassified Establishments 43 3.8% 49 0.5% 138 4.0% 236 0.6% 164 4.2% 250 0.6%
Total 1,143 100.0% 10,520 100.0% 3,434 100.0% 36,545 100.0% 3,925 100.0% 41,869 100.0%
Source: Copyright 2016 Infogroup, Inc. All rights reserved. Esri Total Residential Population forecasts for 2016.Date Note: Data on the Business Summary report is calculated using Esri’s Data allocation method which uses census block groups to allocate business summary data to custom areas.
December 05, 2016
©2016 Esri Page 3 of 3