Retail Lighting and Consumer Product Perception: A · PDF fileRetail Lighting and Consumer...
228
Retail Lighting and Consumer Product Perception: A Cross-Cultural Study by Dalal Anwar Alsharhan A Thesis Presented in Partial Fulfillment of the Requirements for the Degree Master of Science in Design Approved November 2013 by the Graduate Supervisory Committee: Michael Kroelinger, Chair John Eaton William Heywood ARIZONA STATE UNIVERSITY December 2013
Transcript of Retail Lighting and Consumer Product Perception: A · PDF fileRetail Lighting and Consumer...

Retail Lighting and Consumer Product Perception:
A Cross-Cultural Study
by
Dalal Anwar Alsharhan
A Thesis Presented in Partial Fulfillment of the Requirements for the Degree
Master of Science in Design
Approved November 2013 by the Graduate Supervisory Committee:
Michael Kroelinger, Chair
John Eaton William Heywood
ARIZONA STATE UNIVERSITY
December 2013

i
ABSTRACT
The study of lighting design has important implications for consumer behavior and is an
important aspect of consideration for the retail industry. In today’s global economy consumers
can come from a number of cultural backgrounds. It is important to understand various cultures’
perceptions of lighting design in order for retailers to better understand how to use lighting as a
benefit to provide consumers with a desirable shopping experience. This thesis provides insight
into the effects of ambient lighting on product perception among Americans and Middle
Easterners. Both cultural groups’ possess significant purchasing power in the worldwide market
place. This research will allow marketers, designers and consumers a better understanding of
how culture may play a role in consumer perceptions and behavior
Results of this study are based on data gathered from 164 surveys from individuals of
American and Middle Eastern heritage. Follow up interviews were also conducted to examine the
nuances of product perception and potential differences across cultures. This study, using
qualitative and quantitative methods, was executed using a Sequential Explanatory Strategy.
Survey data were analyzed to uncover significant correlations and relationships using measures
of descriptive analysis, analysis of variance (ANOVA), and regression analysis. Interviews were
analyzed using theme-based coding and reported in narrative form.
The results suggest that lighting does in fact have an impact on product perception,
however despite minor differences, this perception does not vary much between individuals from
American and Middle Eastern cultures. It was found that lighting could affect price and quality
perception with reference to store-image and store atmospherics. Additionally, lighting has a
higher impact on subjective impressions of product (such as Freshness, Pleasantness, and
Attractiveness), more than Price and Quality perceptions. This study suggests that particular
lighting characteristics could be responsible for differences in product perception between these
two cultures. This is important to note for lighting designers and marketers to create retail
atmospheres that are preferable to both cultures.
ii
Dedication
This work is dedicated to continued discoveries in the field of lighting design between the Middle
East and the U.S., and to my family. Thank you for your unconditional support.

iii
ACKNOWLEDGEMENTS
In the name of God, most Gracious, most Compassionate. Numerous individuals are to
acknowledge for their contributions during the research and writing of this work. Firstly, I want to
acknowledge my mother, father, sisters, and brother for their undying support and love
throughout my educational experience. Their presence kept me going throughout this journey,
even with 12,700 kilometers between us. A special thanks goes to my mentor, Michael
Kroelinger, for your wisdom, support, and encouragement, and to my thesis committee members
John Eaton and William Heywood. I want to especially acknowledge my ASU “sisters”, Maryam,
Katie, Eiman, Abeer, and Amzan for your unconditional friendship and for continuously inspiring
me as we learned from and assisted one another through this journey. Lastly, a special thanks to
my special one who supported me unconditionally through the thesis process and beyond.

iv
TABLE OF CONTENT
Page
LIST OF TABLES ………………………………………….………………………………..……………xii
LIST OF FIGURES ………………………………………………………………………...……….……xvi
CHAPTER
1 INTRODUCTION………………………………………………………………………………1
Overview…………………………………………………………………………………1
The Purpose of the Study………………………………………………………………3
Objectives……………………………………………………………..…………………3
Research Questions……………………………………………………………….……4
Significance………………………………………………………………………………4
Summary…………………………………………………………………………………5
2 REVIEW OF LITERATURE………………………………………..…………………………6
Overview ………………………………………………………………………...………6
Impulse Buying……………………………………………………………..……………7
Significance of Impulse Buying………………………………………………7
Defining Impulse Buying………………………………………………………8
Retail Atmospheric…………………………………………...………………11
Summary………………………………………………………………………15
Research on Lighting…………………………………………………….……………16
Lighting Characteristics……………………………………...………………16
Brightness…………………………………………...………………16
Correlated Color Temperature……………….……………………17
Spatial Light Distribution……………………………...……………19
Retail Lighting Practices……………………………………..………………21
Lighting Studies of Retail Environments………..…………………………23
Studies on Product Perception……………………………………23

v
CHAPTER Page
Studies on Product Perception in Actual Retail
Environments…………………………………...…………23
Studies on Product Perception in Simulated
Environments……………………………………...………25
Studies on Spatial Perception.…………………………….………26
Studies on Spatial Perception in Actual Retail
Environments………………………………...……………26
Studies on Spatial Perception in Simulated
Environments ……………………………………………..29
Summary………………………………………………………………………31
Culture………………………………………………..…………………………………32
Definition and Introduction of Culture………………………………………32
Research on Culture and Consumerism………………………..…………32
Cultural Differences between United States and Middle East……..……33
Culture and Perception………………………………………………………35
Cross-Cultural Research on Lighting………………………………………35
Summary………………………………………………………………………37
Discussion of Theoretical Framework of The Study…………………….…………37
Research Approaches in Lighting……………………………..……………38
M-R Model (Mehrebian-Russel) …………………….……………38
Vogel’s (2008) Model………………………………………………39
Flynn’s (1977) Model……………………………….………………40
Framework Developed and Influence of Quartier et. al (2009) …………40
Conclusions………………………………………………………...…………43
Chapter Summary…………………………………………………………..…………44
3 METHODOLOGY AND PROCEDURE……………………………………….……………45
Overview …………………………………………………………………...…………..45

vi
CHAPTER Page
Research Design………………………………………………………………………45
Phase I: Quantitaive Data………………………………………….…………………47
Study Setting……………………………………………….…………………47
Approach………………………………………………………………………48
The Sample…………………………………………………...………………48
Data collection…………………………………………………..……………51
Independent Vraiable ………………………………………..…….52
Dependent Variable ………………………………………….…….52
The Questionaire …………………………………………….…….53
Method of Analysis…………………...………………………………………53
Phase II: Qualitative Data……………………….……………………………………53
Study Setting…………………………….……………………………………54
The Sample………………………………...…………………………………54
Data Collection………………………….……………………………………54
Method of Analysis……………………...……………………………………55
Vertification……………………………………………………………………55
Advantages and Limitations of Sequential Explanatory Approach………….……55
Ethical Considerations……………………………………………………...…………56
Assumptions …………………………………………..……………….………………56
Chapter Summary…………………………………………………….……………… 57
4 ANALYSIS OF DATA ………………………………………………………..………………58
Overview ………………………………………………………………………….……58
Analysis of Phase I: Quantitaive Data……………………………….………………58
Characteristics of Sample Populations ……………………………………58
USA Sample …………………………………………..……………58
Middle Eastern Sample ……………………………………………59
Sample Comparison and Bias ……………………………..………………60

vii
CHAPTER Page
Analytical Tests Conducted …………………………………...……………61
Question 1. Do changes in ambient lighting affect product
perception? …………………………………………………………………. 62
One-Way ANOVA Analysis …………………….…………………62
Price Perception ……………………….…………………65
Quality Perception ……………………..…………………66
Freshness Perception ……………………………………67
Pleasantness Perception ………………..………………68
Attractiveness Perception ……………………….………69
Question 2 - Do these lighting changes affecting product perception
differ across different cultures? ……………………………………………69
Two-Way ANOVA Analysis ………………………….……………70
Price Perception ………………………………….………70
Quality Perception ………………………………..………73
Freshness Perception ……………………………………76
Pleasantness Perception ……………..…………………79
Attractiveness Perception …………………….…………82
Chi-Square Test ……………………………………………………86
Price Perception ……………………………….…………86
Quality Perception ……………………………..…………89
Freshness Perception ……………………………………92
Pleasantness Perception ……………………..…………94
Attractiveness Perception …………….…………..……..97
Question 3 - What lighting characteristics are responsible/causing
These changes in product perception across different cultures? .……100
Data Analysis: Bipolar Rating Scales ……………………..……100

viii
CHAPTER Page
Scoring of Data………………………………………..…100
Plotting The Mean Rating ………………...……………101
Lighting Type - Cool LED ……….……………102
Lighting Type - Warm LED ……………...……103
Lighting Type – Halogen …….………………104
Lighting Type- Florescent ….…………………105
One-Way ANOVA …………………………...……………………105
Quality Perception ………………………………………106
Do Perceptions of Quality Differ
by Brightness? …………………………………106
Does Perception of Quality Differ
According to Clarity? …………………….……107
Does Perception of Quality Differ
According to Radiance? ………………………107
Does Perception of Quality differ
According to Colorfulness? ……………..……107
Does Perception of Quality differ
by Complexity?...............................................108
Pleasantness Perception…………………….…………108
Does Perception of Pleasantness
Differ Accordingto Brightness? ………………108
Does Perception of Pleasantness
Differ According to Complexity? …………..…109
Regression Analysis ………………………..……………………109
Model I: Lighting Characteristics and Product
Perception …………………....………………………….110
Demographics …………………………………110

ix
CHAPTER Page
Brightness ………………...……………………111
Glare ……………………………………………111
Clarity ………………………..…………………112
Color Temperature ……………………………112
Radiance …………………………….…………113
Colorfulness ……………………………………114
Distinction ………………………………………114
Focusness ………………………..……………115
Complexity ………………………………..……115
Model II: Lighting Characteristics and Product
Perception over Cultural Groups ………………...……116
Brightness ……………………...………………116
Glare ……………………………………………117
Clarity …………………………………..………118
Color Temperature ……………………………119
Radiance …………………….…………………120
Colorfulness ……………………………………121
Distinction ………………………………………122
Focusness …………………..…………………123
Complexity ……………………………..………124
Analysis of Phase II: Qualitative Data……………………………………...………125
Overview …………………………………………….………………………125
Self-Control in Grocery Store Environment ……………..………………126
Mood and Lighting …………………………………………………………127
Lighting And Impulse Buying ……………………………………..………128
Lighting As an Ambiance Factor …………………………………………128
Lighting Characteristics ……………………………………………………129
x
CHAPTER Page
Brightness …………………………………………………………129
American Impressions of Brightness …………………129
Middle Eastern Perceptions of Brightness ……...……129
Overall Impressions on Brightness ……………………130
Correlated Color Temperature ……………………….…………130
American Impressions of CCT ……………...…………130
Middle Eastern Impressions of CCT …………….……131
Spatial Distribution ………………………….……………………131
American Impressions of Spatial Distribution ……..…131
Middle Eastern Impressions of Spatial Distribution …132
Influence Of The Three Lighting Characteristics …...…………132
Section Summary …………………………..………………………………133
5 DISCUSSION ……………………………………………………………………..…………135
Overview …………………………………………………………………………..… 135
Perception of Price ……………………………………………..………..………… 135
Brightness ………………………………………………………..…………137
Color Temperature and Spatial Distribution …………………...………..139
Conclusion on Price …………………………………..……………………139
Perception of Quality ………………………………...………………..…………… 139
Conclusion on Quality…………………………………………………..… 142
Subjective Impressions (Freshness, Pleasantness, and Attractiveness) …..... 143
Perception of Freshness …………………………………..………………..………143
Conclusion on Freshness………………………………………………… 145
Perception of Pleasatness ………………………………………………....……… 146
Perception of Attractiveness ………………………………..………..…………… 148
Conclusion …………………………………………………………………..……… 149

xi
CHAPTER Page
6 CONCLUSION……………....………………………………………………………………152
Overview………………………………………………………………………………152
Key Findings………………………………….………………………………………152
Limitations and Suggestions For Future Research…………....…………………155
Implications of Research ……………………………………………….…………. 157
REFERENCES…………………………..………………………………………………………………159
APPENDIX
A INSTITUTIONAL REVIEW BOARD RESEARCH OF HUMAN SUBJECTS
APPROVAL ………………………………………………………………………………… 171
B SURVEY OF USA CULTURE ………………………..…………………………………...173
C SURVEY OF MIDDLE EAST CULTURE ……………………...…………………………180
D INTERVIEW PROTOCOL …………………………………………………………………187
E SAMPLE TRANSCRIBED INTERVIEW………………………………….……………….191

xii
LIST OF TABLES
Table Page
1. Methodology, Strategy/Approach, and Phases………...…………………………………………46
2. Sample Population Overview…..……………………….….……………………………….………49
3. Lamp Specifications...………………………………………….……………………….…...………51
4. Independent and Dependent Variables…………………...…………………….…………………52
5. Characteristics of Sample Populations…………………………………….………………………59
6. N, Mean, and Standard Deviation for Participants Product Perception (Price, Quality,
Freshness, Pleasantness, and Attractiveness) under Different Lighting (Cool LED, Warm
LED, Halogen, and Fluorescent).…………………………………………….…………………….63
7. Summary of One-Way ANOVA Results for The Effects of Ambient Lighting on Product
Perception………………………………………………………………….…………………………64
8. Price Perception - Descriptive Statistics of Dependent Variable…………………..……………70
9. Summary of Two-Way ANOVA results for the affect of Ambient Lighting on Price
Perception among cultures.………………………………………………….……………………...72
10. Quality Perception - Descriptive Statistics of Dependent Variable.……………………………73
11. Summary of Two-Way ANOVA Results for The Affect of Ambient Lighting on Quality
Perception Over Culture……………..…………………………………..….………………………75
12. Freshness Perception - Descriptive Statistics of Dependent Variable………………..….……76
13. Summary of Two-Way ANOVA Results For The Affect of Ambient Lighting on Freshness
Perception over Culture.………………………………………………………….…………………78
14. Pleasantness Perception - Descriptive Analysis of Dependent Variable.………..……...……79
15. Summary of Two-Way ANOVA results for the affect of Ambient Lighting on Pleasantness
Perception among cultures.………………………………………………….………………...……81
16. Attractiveness Perception - Descriptive Analysis of Dependent Variable.……………….……82
17. Summary of Two-Way ANOVA results for the affect of Ambient Lighting on Attractiveness
Perception among cultures.…………………………………………………………………………84

xiii
Table Page
18. Results of Chi-Square Test on Price Perception Between American and Middle Eastern
Participants…………………………………….………………………………………..……………86
19. Summary of Answers in Price Perception Difference of American and Middle Eastern
Cultures……………………………………………………………………………..…………………87
20. Weighted Frequency for Lighting Preference on Price Perception by American and Middle
Eastern Participants……………………………………………………………………....…………88
21. Results of Chi-Square Test on Quality Perception Between American and Middle Eastern
Participants……………………………………………………………………………………………89
22. Summary of Answers in Quality Perception Difference of American and Middle Eastern
Cultures………………………………………………………………………………………..………90
23. Weighted Frequency for Lighting Preference on Quality Perception by American and Middle
Eastern Participants……………………………………………………...………………….………91
24. Results of Chi-Square Test on Freshness Perception Between American and Middle Eastern
Participants……………………………………………………………………………………………92
25. Summary of Answers in Freshness Perception Difference of American and Middle Eastern
Cultures……………………………………………………………………..…………………...……92
26. Weighted Frequency for Lighting Preference on Freshness Perception by American and
Middle Eastern Participants……………………………………………………...……….…………93
27. Results of Chi-Square Test on Pleasantness Perception Between American and Middle
Eastern Participants……………………………………………………………………….…………95
28. Summary of Answers in Price Perception Difference of American and Middle Eastern
Cultures……………………………………………………………………….……………….………95
29. Weighted Frequency for Lighting Preference on Pleasantness Perception by American
and Middle Eastern Participants……………………………………………………...…….………96
30. Results of Chi-Square Test on Attractiveness Perception Between American and Middle
Eastern Participants…………………………………………………………………………….……98

xiv
Table Page
31. Summary of Answers in Attractiveness Perception Difference of American and Middle
Eastern Cultures…………………………………………………………….………………..………98
32. Weighted Frequency for Lighting Preference on Attractiveness Perception by American
and Middle Eastern Participants……………………………………………………………....……99
33. Summary Results of One-Way ANOVA Analysis effect of Brightness on Quality
perception.……………………………………………………………………………….…….……107
34. Summary Results of One-Way ANOVA Analysis effect of Clarity on Quality
perception………………………………………………………………………………..….………107
35. Summary Results of One-Way ANOVA Analysis effect of Radiance on Quality
perception…………………………………………………………………………………...………107
36. Summary Results of One-Way ANOVA Analysis effect of Colorfulness on Quality
perception………………………………………………………………………..…….……………108
37. Summary Results of One-Way ANOVA Analysis effect of Complexity on Quality
perception………………………………………………………………………..……….…………108
38. Summary Results of One-Way ANOVA Analysis effect of Brightness on Pleasantness
perception………………………………………………………………………………….………..109
39. Summary Results of One-Way ANOVA Analysis effect of Complexity on Pleasantness
perception…………………………………………………………..………………….……………109
40. Ordinal Logistic Regression Model of Demographics and Product Perception…..…………110
41. Ordinal Logistic Regression Model of Brightness and Product Perception………….………111
42. Ordinal Logistic Regression Model of Glare and Product Perception…………..……………112
43. Ordinal Logistic Regression Model of Clarity and Product Perception………………………112
44. Ordinal Logistic Regression Model of Color Temperature and Product Perception………..113
45. Ordinal Logistic Regression Model of Radiance and Product Perception…………………...113
46. Ordinal Logistic Regression Model of Colorfulness and Product Perception………….……114
47. Ordinal Logistic Regression Model of Distinction and Product Perception………………….115
48. Ordinal Logistic Regression Model of Focusness and Product Perception…………………115

xv
Table Page
49. Ordinal Logistic Regression Model of Complexity and Product Perception…………………116
50. Ordinal Logistic Regression Model of Brightness and Product Perception Between
American Culture and Middle Eastern Culture………………………………….……………….117
51. Ordinal Logistic Regression Model of Glare and Product Perception Between American
Culture and Middle Eastern Culture……………………………………………………..………..118
52. Ordinal Logistic Regression Model of Clarity and Product Perception Between American
Culture and Middle Eastern Culture……………………………………………………..………..119
53. Ordinal Logistic Regression Model of Color Temperature and Product Perception Between
American Culture and Middle Eastern Culture…………………………………………….…….120
54. Ordinal Logistic Regression Model of Radiance and Product Perception Between
American Culture and Middle Eastern Culture……………………………………......….……..121
55. Ordinal Logistic Regression Model of Colorfulness and Product Perception Between
American Culture and Middle Eastern Culture………………………………………….……….122
56. Ordinal Logistic Regression Model of Distinction and Product Perception Between American
Culture and Middle Eastern Culture…………………………………………………………..…..123
57. Ordinal Logistic Regression Model of Focusness and Product Perception Between American
Culture and Middle Eastern Culture…………………………………………………………..…..124
58. Ordinal Logistic Regression Model of Complexity and Product Perception Between American
Culture and Middle Eastern Culture………………………………………………………..……..125
xvi
LIST OF FIGURES
Figure Page
59. Model for Measuring Effects of Ambient Light on Consumer Perception of Product..…..…...43
60. Research Design: Sequential Explanatory Strategy…………………………………….……….47
61. Products Photographed Under the Four Lighting Types…………………………….…………..50
62. Descriptive Analysis of the Sample……………………………………………………….………..64
63. Price Perception - Comparison of Standard Deviation Between Lighting Types………….….65
64. Quality Perceptions - Comparison of Standard Deviation Between Lighting Types……….…66
65. Freshness Perception - Comparison of Standard Deviation…………………….………………67
66. Pleasantness Perception - Comparison of Standard Deviation…………………….…………..68
67. Attractiveness Perception - Comparison of Standard Deviation………………………….…….69
68. American Price Perception - Comparison of Standard Deviation…………………….………...71
69. Middle East Price Perception - Comparison of Standard Deviation…………………………....71
70. Estimated Marginal Means of Price Perception over Culture…………………………….……..72
71. American Quality Perception - Comparison of Standard Deviation…………………….………74
72. Middle East Quality Perception- Comparison of Standard Deviation…………………….…….74
73. Estimated marginal means of quality………………………………………….…………………...75
74. American Freshness Perception - Comparison of Standard Deviation………………….……..77
75. Middle East Freshness Perception - Comparison of Standard Deviation……………….……..77
76. Estimated Marginal Means of Freshness……………………………………….…………………78
77. American Pleasantness Perception - Comparison of Standard Deviation…………….………80
78. Middle Eastern Pleasantness Perception - Comparison of Standard Deviation………….…..80
79. Estimated Marginal Means of Pleasantness……………………………………….……………..81
80. American Attractiveness Perception- Comparison of Standard Deviation……………….……83
81. Middle East Attractiveness Perception - Comparison of Standard Deviation…………….…...83
82. Estimated Marginal Means of Attractiveness…………………………………………….……….84
83. Descriptive Analysis of the American Sample……………………………………………………85
84. Descriptive Analysis of the Middle Eastern Sample………………………………….…………..85

xvii
Figure Page
85. Summary of Chi-Square Results…………………………………………….……………………..86
86. Bar Chart of Answers in Price Perception Difference between American and Middle Eastern
Cultures…………………………………………….………………………………………………….88
87. Lighting Preferences on Price Perception by American Participants………………….……….88
88. Lighting Preferences on Price Perception by Middle Eastern Participants……………….……89
89. Bar Chart of Answers in Quality Perception Difference between American and Middle Eastern
Cultures………………………………….…………………………………………………………….90
90. Lighting Preferences on Quality Perception by Middle Eastern Participants………….………91
91. Lighting Preferences on Quality Perception by American Participants………….……………..91
92. Bar Chart of Answers in Freshness Perception Difference between American and Middle
Eastern Cultures…………………………………………............................................................93
93. Lighting Preferences on Freshness Perception by Middle Eastern Participants………….…..94
94. Lighting Preferences on Freshness Perception by American Participants………………….…94
95. Bar Chart of Answers in Pleasantness Perception Difference between American and Middle
Eastern Cultures…………………………………………………………….……..…………………96
96. Lighting Preferences on Pleasantness Perception by Middle Eastern Participants…….…….97
97. Lighting Preferences on Pleasantness Perception by American Participants…………….…..97
98. Bar Chart of Answers in Attractiveness Perception Difference between American and Middle
Eastern Cultures……………………………………………………….……………………………..98
99. Lighting Preferences on Price Attractiveness by Middle Eastern Participants………….…….99
100. Lighting Preferences on Attractiveness Perception by American
Participants......................100
101. Data Sheet of Semantic Differential
Scale………………………………………….……………101
102. Mean Rating Scores of Semantic Differential Scale by American
Participants………….…..101

xviii
103. Mean Rating Scores of Semantic Differential Scale by Middle Eastern
Participants……….102
104. Mean Rating Scores of Semantic Differential Scale of Cool LED by American and Middle
Eastern Participants………………………………………………………….…………………….103

xix
Figure Page
105. Mean Rating Scores of Semantic Differential Scale of Warm LED by American and
Middle Eastern
Participants…………………………………………………………………….………….104
106. Mean Rating Scores of Semantic Differential Scale of Halogen by American and Middle
Eastern Participants……………………………………………………………….……………….104
107. Mean Rating Scores of Semantic Differential Scale of Florescent by American and Middle
Eastern Participants……………………………………………………………….……………….105
108. Summary Results of One-Way ANOVA Analysis effect of lighting characteristics on
product
perception…………………………………………………………….……………………………..106

1
CHAPTER I
INTRODUCTION
Overview
The world is becoming increasingly interconnected in terms of global exchanges of
national and cultural resources. The primary direction of globalization tends to move from more
developed countries to less developed countries. Some claim globalization is predominantly
driven by the outward flow of culture and economic activity from the United States and can be
better understood as Americanization or Westernization. However, globalization is a reality of
today’s interconnected economic structure. It does not necessarily have to be a unidirectional
relationship, and in fact globalization can benefit all parties involved if there is an emphasis on
cultural understanding. From a business standpoint, understanding another culture’s perceptions
can be a valuable strategy to expanding one’s market. Design industries in particular can benefit
from an increased emphasis on cultural awareness and sensitivity.
Consumerism plays a major role in globalization and cultural exchange. Consumerism
can be defined as,” a cultural paradigm where the possession and use of an increasing number
and variety of goods and services is the principal cultural aspiration and the surest perceived
route to personal happiness, social status, and national success. (Ekins, 1991). How consumers
spend their money has become an increasingly important area of study. In many cultures,
shopping has become a large part of people’s daily lives and construction of personal and social
identity. Miller (1998:68) defines shopping as “primarily an act of spending, preferably large
amounts of money, almost without a care for consequences.” How and why do people make the
purchases that they do? Research on shopper behavior shows that an increasing number of
consumer purchases are being made without advance planning (Stern, 1962; Kollat and Willet,
1967), and on an impulse (Bellenger et al., 1978; Weinberg and Gottwald, 1982; Cobb and
Hoyer, 1986; Han et al., 1991; Rook and Fisher, 1995).
The location at which consumers make their purchases is an important focal point.
Particular places are created to encourage and provide individuals with opportunities to spend
money. These are called “consumerist spaces” (Sklair, 2010). Consumer behavior can in fact be

2
categorized by space (Hyllegard et al. 2006). A store environment can influence consumers in
numerous ways: 1) It may be central to communicating a store’s brand/image and its purpose to
customers (Bitner, 1992), 2) it can elicit emotional reactions with its customers (Donovan &
Rossiter, 1982), 3) it can have an impact on the customers’ ultimate satisfaction regarding service
(Bitner, 1990), and 4) it can even affect the money and time spend in the store (Donovan,
Rossiter, Marcoolyn, & Nesdale, 1994).
There is a large body of academic literature suggesting that providing a desirable
environmental setting can encourage purchasing and enhance the shopping experience. These
studies examine aspects that are known as atmospherics. Kotler (1973) was the first to use the
term ‘atmospherics,’ as the “conscious planning of atmospheres to contribute to the buyers’
purchasing propensity.” Providing a particular atmosphere can be achieved by means of an
extensive set of atmospheric variables. Turley & Miliman (2000) conducted a literature review and
counted 43 environmental cues inside a store that have the potential to affect consumer
evaluations and behaviors. Studies suggest that a positive perception of a store environment
results in the consumer remaining in a store for a greater length of time (Milliman, 1982; Turley &
Chebat, 2002), an increased desire to touch or examine merchandise (Hebert, 1997), and a
greater intention to purchase goods (Fiore et al., 2000, cited in Hyllegard, Ogle, Dunbar, 2006).
Major retailers such as Nike Town, Prada, and REI, have been known to use retail lighting as an
element of atmospheric design to create, “ hands-on, often theatrical-like experiences that
engage consumers and alter their perception of shopping” (Gilmore & Pine, 1999; Giovannini,
2002, p. 224; Green, 1997, cited in Hyllegard, Ogle, Dunbar, 2006).
Lighting is an important environmental cue that has the potential to greatly affect
perceived atmosphere. In the past, research on the effect of lighting has mainly focused on
functional aspects, like visibility and visual comfort (e.g. glare and flicker). During the 1960’s and
1970’s lighting designers and researchers primarily examined the effect that lighting has on
people’s feelings when they are in an environment (for a review: Murdoch & Caughey, 2004).
However, the psychological effects of lighting on experience and feelings were not extensively
studied until the 1990’s. More current studies have looked at the effects of lighting on

3
environmental impressions (e.g. spaciousness), on emotions, mood and cognition (Flynn, 1992;
Fleischer, Krueger, & Schierz, 2001; Knez, 1995). However, there is a surprising lack of empirical
research addressing the effects of lighting on product perception within an atmosphere in retail
settings and whether this perception differs across different cultures. These issues will be
investigated in this thesis.
The Purpose of the Study
The main purpose of this study is to examine through cross-cultural comparison, the
effect of ambient light on consumer perception of products. Using a controlled experiment
methodology, this study identifies the effect of different lighting types on product perceptions of
price, quality, freshness, pleasantness, and attractiveness through the use of two sample
populations: American consumers and Middle Eastern consumers.
Using both quantitative and qualitative approaches, participants’ responses were
compared regarding lighting and perception to determine if there is a relationship between lighting
and participants’ cultural background, and what lighting characteristics may be involved in this
relationship. A sequential explanatory strategy was applied in two phases. Phase One was a
sequential study that looked at underlying statistically significant patterns between lighting types,
product perception, and cultural background. Following this macro-level analysis,
qualitative/follow-up interviews (Phase Two) were employed to better understand the cultural
nuances of lighting preference.
Objectives
The specific objectives of the study are:
1. To determine if changes in lighting affect consumer perception in terms of Price, Quality,
Freshness, Pleasantness, and Attractiveness.
2. To identify and explore lighting preference patterns of American consumers compared to
Middle Eastern consumers in terms of three lighting characteristics: Lighting Intensity,
Correlated Color Temperature, and Spatial Distribution.
3. To identify and compare product perceptions of American consumers versus Middle
Eastern consumers under different lighting conditions.
4
4. To explain the relationship between Product Perception, Lighting Characteristics, and
Cultural Background.
5. To explain/or explore perception and lighting characteristics in terms of intensity (low vs.
high), correlated color temperature (cool vs. warm) and spatial distribution of light
(directional light vs. diffused light).
Research Questions
Based on an in depth review of literature, the primary research question and two follow
up questions are posed to guide the analysis of data:
Q1; Do changes in ambient lighting affect product perception (measured in terms of Price,
Quality, Freshness, Pleasantness, and Attractiveness)?
Q2; if so, then do these lighting changes affecting product perception differ across different
cultures?
Q3: What lighting characteristics are responsible/causing these changes in product perception
across different cultures?
Significance
Retail design is a relatively new scientific approach that is gaining interest among
academics. Since atmosphere has been shown to influence consumer behavior from a marketing
perspective, this study looks at atmosphere from the designer point of view. The first part of this
study assesses one aspect of atmosphere; lighting and its influence on consumer perception of
product. The second component of this study looks at this phenomenon across cultures. This
cross-cultural comparison will fill a gap in the current academic literature. The third aspect of this
study will explore the lighting characteristics that may explain lighting preference patterns among
the two cultures and hypothesize links to the overall ‘shopping experience’ and phenomenon of
impulse buying behavior.
As we currently exist in a rapidly growing global marketplace, it is of the utmost
importance to understand the culture of other peoples. There can be differences in terms of the
ways in which one culture perceives something compared to how another culture might perceive
something. These differences in perception could affect aspects of consumerism such as ‘the

5
shopping experience’ or ‘impulse buying’ The findings of this study contributes to the goal of
interior design that promotes sustainable quality of life through creating environments that support
user’s physiological, psychological, and cultural needs. This particular study is concerned with
cultural perceptions and needs. The findings from this study provide insight into understanding
lighting perception in retail environments, information that can be utilized by other disciplines too.
By understanding the interaction of occupants, objects, and lighting, it also contributes to other
related interior environments such as workspaces, museums, educational facilities, healthcare
facilities, and many more.
A number of studies have been conducted to understand the influence of lighting on
human perception of space (Schielke 2010; Custers et.al., 2010; Loe et al., 1994); however, very
few studies exist that seek to understand how lighting impacts perception of objects within that
space. Thus, this research creates a new role for the expanding topic of retail design, and retail
lighting in particular.
Summary
This chapter (Chapter I) has presented an introduction to this research on cross-cultural
perceptions and lighting preferences. Chapter 2 provides an in depth review of literature on
aspects relevant to this study such as impulse buying, research on lighting, lighting in retail
environments, culture, and concludes with a description of how the framework for this study was
developed. Chapter 3 outlines the methodology and procedures undertaken, and details both the
quantitative and qualitative phases of this study. Chapter 4 presents analyses of the findings from
both quantitative and qualitative phases followed by a discussion of how the results were
integrated. Chapter 5 concludes this study by examining key findings, limitations and the
implications of this research.

6
CHAPTER II
REVIEW OF LITERATURE
Overview
In the field of interior design, retail design is developing as an important subject of
academic study. Retail design is multidisciplinary as it crosses the boundaries of scholarly theory
and practice in the fields of marketing research, consumer behavior, and interior design. Retail
design refers to, “designing spaces for selling products and/or services and/or a brand to
consumers. It is trans-disciplinary in its intention to create a sensory interpretation of brand
values, through physical or virtual stores” (Quartier, 2011). The goal of retail design is to
conceptualize space to anticipate and reflect consumers’ specific needs and wants. Design is a
means by which emotion and desire can be elicited in consumers, thus influencing their
purchasing behavior. Furthermore, design is an approach that can be used to set one store apart
from all the others. As Fitch (1990) remarked, “only one store can be the cheapest, the others
have to use design”.
Considering the intense competition in today’s global marketplace retail venues must
employ every advantage to gain customers. Cultural contexts are significant to examine. For
example, a particular retail design may yield positive results in one store in America, but
disappointing results in the same store with the same design in Saudi Arabia. This study in retail
design is two-fold in that it examines the effects of lighting on product perception as well as
provides a cross-cultural comparison between American and Middle Eastern consumer
preferences.
This chapter offers a summary of key research studies that have informed the theoretical
and methodological framework of this study. The literature review includes sections that address
impulse buying behavior and behavioral science in retail environments, lighting concepts and
lighting studies of retail environments, and cultural dimensions in behavioral science and
perception. It concludes with a discussion of theories of store atmospherics that were integrated
into the specific framework developed for this study on lighting preference and product
perceptions of consumers across different cultures.

7
Impulse Buying
Significance of Impulse Buying. Impulse buying is a crucial aspect of consumer
behavior and a critical concept in retail sector. The significance of impulse buying was primarily
observed by early impulse buying researchers, who reported a significant amount of impulse
purchases in retail store in the 1950’s. Impulse buying has been distinguished by contemporary
marketing and retail researchers as a very powerful and real force in the consumer buying
behavior process (Bayley and Nancarrow, 1998; Hausman, 2000; Crawford and Melewar, 2003).
It has become a widely recognized phenomenon in most countries, and it has been suggested
that most purchases of new products are a result of impulse purchasing rather than previous
planning (Kacen and Lee, 2002), (Abraham, 1997; Smith, 1996; sfiligoj, 1996; Liuo et al, 2009) .
Impulse buying may be an important consequence of consumers perceived
environmental cognitions or experienced internal stats or traits, which can arouse positive
reactions from shoppers that result in profit gains (Newman and Patel, 2004). In 1997, close to 40
percent of consumers classified themselves as impulse buyers, and impulse buying was
attributed to up to 80 percent of all purchases in certain product category (Abraham, 1997). By
2001, Nichols and others reported that over 50 percent of mall purchases were impulse
purchases. There are other studies, which specify that an estimated $4.2 billion annual store
volume was produced by impulse sales of items such as candy and magazines (Mogelonsky,
1998; Liao et al., 2009).
Impulse buying represents a significant potential contribution to stores’ sales volume;
retailers have invested considerable efforts to trigger such phenomenon through their store
displays, product packages, and in store promotional devices (Dholakia, 2000). The financial
significance of impulse buying cannot be minimized. Zhang (2007) argued that if people shopped
only based on their needs, the economy would collapse. Recent research characterized in-store
or point-of-purchase buying decisions as a common place, and studied expected consumer
behavior and included recommendations about designing store environments that promote
impulse buying (Wood, 2008). Therefore, companies today have invested substantial capital in
research to comprehend and maximize this buying behavior in many retail environments (Miller,
8
2002), such as drugstores, supermarkets, department stores, variety and spatiality stores (Kollat
and Willet, 1969).
Defining Impulse Buying. For over six decades, consumer researchers have struggled
to form a comprehensive definition of impulse buying (Youn and Faber, 2000). Initial efforts to
study impulse buying behavior before 1987 were focused on definitional matters and made efforts
to categorize impulse into one of several sub-categories, rather than to recognize the reasons
behind impulse buying behavior. It started with the DuPont Consumer Buying Habits Studies
(1948-1965), and as well studies were sponsored by the Point-of-Purchase Advertising Institute
(e.g., Patterson 1963), which was the driving force behind impulse buying research throughout
this period. The Dupont studies formed the prototype for the majority of early research and
defined impulse buying as an “unplanned” purchase. Unplanned buying was referred to as all
purchases made unexpectedly and without prior planning (Clover, 1950; West, 1951; Piron,
1993), and included impulse buying (Hansman, 2000), which was operationalized to be the
difference between a consumer’s total purchases at the completion of a shopping trip, and those
that were listed as intended purchases prior to entering the store (Weinberg and Goltwald, 1982).
Later studies expressed that describing an impulse buy as “unplanned” where the
decision is made only within the boundaries of the store is vague and incomplete (Kollat and
Willett, 1969). This approach has also been criticized as being limited to “definitional myopia”
(Piron, 1993) as it doesn’t clarify the “impulse” engaged in the buying decisions (Rook, 1987), and
the concept is much more complex than just unanticipated purchases (Young and Faber, 2002).
Wolman (1973; see Rook, 1987) stated that, an “impulse” is not consciously planned, but takes
place instantly upon “confrontation with certain stimulus”.
Research done by Rook (1987) proposes that not all unplanned purchases are
impulsively decided. For example; a purchase can involve a high degree of planning and yet be
extremely impulsive; and some unplanned purchases may be fairly rational. The academic
debate over unplanned opposed to impulse came to an end with Iyer’s (1989) work, which
proposes that all impulse buying is at the very least unplanned, however, all unplanned
purchases are not decidedly impulsive (Gardner and Rook, 1988).
9
Before 1982, definitions of impulse buying focused on the product rather than consumer
as the driver of impulse purchases (Hausman, 2000). As a result, the developing classification
framework has produced literature that neglected the behavioral motivations that cause impulse
buying behavior for a large variety of product and instead centers on small number of
comparatively cheap products. Later studies have recognized this disparity and analyzed impulse
purchases across a broad range of product offerings in a variety of price ranges (Cobb and
Hoyer, 1986; Rook, 1987; Rook and Fisher, 1995). In this direction, fundamental works by Rook
(1987) and Stephen & Loewenstein (1991) argued that it is people and not the product that
encounter the urge to consumer on impulse.
After 1982, the research work changed its focus to human motivation. Scholars began to
investigate the behavioral dimensions of impulse buying. It appears that impulse buying involves
a hedonic or affective component (Cobb and Hoyer, 1986; Piron, 1991; Rook, 1987; Rook and
Fisher, 1995; Weinberg and Gottwald, 1982). For instance, Rook (1987) reports accounts by
consumers who felt the product ``calling'' them, almost demanding they purchase it. There is an
indulgent aspect to impulse buying that gives the buyer a hedonic experience.
The emphasis on the behavioral elements of impulse buying led researchers to examine
the definition of impulse. Rook (1987; 191) comprehensively defines impulse buying as the
purchasing behavior that occurs “when a consumer experiences a sudden, often powerful and
persistent urge to buy something immediately”. The impulse to buy is a sudden, compelling,
hedonically complex purchase behavior in which the speed of the impulse purchase decision
avoids any thoughtful, deliberate consideration of alternatives or future implications (Kollat and
Willet, 1967; Cobb & Hoyer, 1986; Rook, 1987; Piron, 1991; Beatty & Ferrel, 1998; Bayley &
Nancarrow, 1998; Kacen & Lee; 2002; Vohs & Faber, 2003; Parboteeah, 2005). Impulse buying
is relatively extraordinary and exciting; while thoughtful buying is more regular and reasonable
(Weinberg and Gottwald, 1982). Impulse buying is mindless or not reflective because the buy is
made without engaging in a significant deal of evaluation (Rook, 1987). A buying impulse tends to
disturb the consumer’s behavior flow, while a thoughtful purchase is more likely to be part of
one’s regular routine. Kroeber-Riel (1980) explained that impulse buying is reactive behavior, and
10
often involves a sudden response to stimulus (Rook, 1987). Impulse buying is more emotional
than rational, and it is more likely to be perceived as “bad” than “good” (Levy, 1976; Solnick et al.,
1980; Rook and Fisher, 1995). The consumer is more likely to feel out of control when buying
impulsively than when making thoughtful purchases. According to a number of studies (Rook &
Fisher, 1995; Beatty & Ferrell, 1998; Verplanken & Herabadi, 2001; Virvilaite et al., 2009) the
main consumer characteristics of impulsive purchasing behavior are: tendency to impulse buying,
spontaneity in buying, satisfaction felt after unplanned purchase, and lack of planned shopping
list.
According to Jones et al (2003), consumer impulse buying is an important concept along
with product involvement as they are involved with a specific product. While, Han et al. (1991),
classified impulse buying within four types: (1) Planned impulse buying; (2) Reminded impulse
buying; (3) Fashion-oriented impulse buying; and (4) Pure impulse buying.
Cobb and Hoyer (1986) proposed a classification system, which shows that an impulse
purchase can take place when there was neither desire to buy a certain brand nor even from the
general product category prior to entering the store. Kollat and Willet (1967) suggested a typology
of pre-purchase planning which is based on level of planning or intent before entering a store:
a. Product and brand decided;
b. Product category decided;
c. Product class decided;
d. A general need recognized;
e. General need not recognized.
Consumers at level (e), when it concludes in a purchase, can be considered as a pure
impulse purchase. Although a need is not recognized until inside the store, the act may still be
rational. For example when the shopper is presented with a resolution to an unexpected need,
this disrupts the shopper’s baseline emotional state, allowing them to feel unanticipated
gratification if they purchase the product. The decision is still logical but not planned. Whereas,
consumers at level (d), recognize a general need, however, the specific brand or product
category has yet to be identified.

11
The majority of current literature on impulse buying seems to agree that the factors of
impulse buying can be divided into three different groups: personal factors, product related
factors, and situational factors (Masouleh, Pazhang, & Moradi, 2012). However, for the purpose
of this study, only situational factors will be discussed.
Situational factors are devoted to all factors that can influence impulse buying behavior
aside from a person or a product. These factors include; sales staff, self-service, local market
condition, time available, design of store, culture, and presence of others (Masouleh, Pazhang, &
Moradi, 2012). According to Masouleh et al (2012), experts believed that the situational factors
category is the most significant factor, which must be considered by decision makers. Hausman
(2000) proposed that in order to promote impulse buying, retailers should create an environment
that can ease consumer “negative perceptions” of impulse. As well, creating complex store
environment through different techniques can distort the ability of the consumer to process
information accurately. Such techniques include stocking extra merchandise, designing
stimulating atmospherics, and increasing information can be valuable in encouraging impulse
buying (Hausman, 2000).
Since the behavior of impulse buying is usually driven by stimuli (Rook and Fisher, 1995;
Dawson and Kim, 2009), the store stimuli function as a type of information aid for those who go to
the store undecided of what they need or buy. Once they get into the store, they are reminded or
get an idea of what they may need after looking around the store. In other words, consumer’s
impulse buying behavior is a reaction made by being confronted with stimuli that arouse a desire
that ultimately drives a consumer to make an unplanned purchase decision upon entering the
store (Kim, 2003). The more store stimuli present, the more likely the possibility of a desire or
need arising and finally leading to impulse purchase (Han et al., 1991).
Once customers enter a retail environment there are stimuli that affect and arouse a
consumer’s buying impulse. Researchers soon realized that atmosphere of the retail
environment, for example lighting and music can influence consumer’s purchases.
Retail Atmospherics. Many researchers emphasize the need to gain further
understanding of the influence of retail store environments or atmosphere on consumer behavior.
12
Darden, Erdem, and Darden (1983) suggested that consumer mannerisms toward the store
environment are sometimes more influential in determining store choice than are consumer
mannerisms toward the merchandise. For example, music can influence amount of time and
money spent in a store (Donovan et al.1994, Milliman, 1982, 1986), and lighting can influence the
handling and purchase of items to be viewed in a more positive manner (Areni and Kim, 1994).
Spies et al. (1997) stressed out the importance of a good store layout. Baker et al. (2002)
reiterate the importance of atmosphere demonstrating that store patronage can be influenced by
many aspects of store environment. All of these findings strongly suggest that environmental
features affect evaluations of a store and its products, as well as in store behaviors. Based upon
this premise, marketing researchers have come to the understanding that if consumers are
influenced by physical stimuli experienced at the point of purchase, then the practice of creating
influential atmospheres should be a significant marketing approach for most trade environments.
Bitner (1990), takes this notion a step further arguing that a store’s atmosphere can make the
difference between a business’ success or failure.
It has been well documented in other fields such as environment psychology, that the
environment is capable of influencing a wide range of behaviors (Hoffman and Turley, 2002).
More recently this idea has been incorporated into studies of retail and consumer environments
with the acknowledgement that environment affects both consumer and employee (Bitner, 1992;
Sharma and Stafford, 2000). Shelf space studies, atmospherics, servicescapes, and in particular
environmental psychology are fields that are currently contributing to a growing body of literature
concerned with investigating and analyzing the important role environment has on purchasing.
In an effort to define environmental psychology, Mehrabian and Russell (1974) described
it as “the direct impact of physical stimuli on human emotions and the effect of physical stimuli on
a variety of behaviors, such as work performance or social interaction.” These researchers
suggest that the physical environment creates an emotional response, which serves to evoke
either approach or avoidance behavior in individuals. Mehrabian and Russell (1974) also
emphasized the need for describing or defining the physical environment by identifying those
elements or dimensions that construct the physical environment.

13
Building on premises of environmental psychology, Kotler further developed the notion of
environmental impact by concentrating specifically on consumer behavior and the effects that the
physical environment has on it. Kotler (1973) was the first to use the term “atmospherics,” to
describe the effort to design buying environments to produce specific emotional effects in the
buyer that enhance purchase probability. He elaborated by stating that the atmosphere of a store
environment is experienced through the senses and as a result can affect consumer behavior. In
addition, he suggests that atmosphere as a marketing tool can be produced by maneuvering the
visual, aural, olfactory, and tactile dimensions of the surrounding space. He specifies that the
main visual dimensions of an atmosphere – color, brightness, size, shapes – can help draw
attention, convey messages, and create feelings that may elevate purchase probability. Kotler
further identified “atmospherics” as a highly significant differentiation tool and argued that spatial
aesthetics should be used more thoughtfully to make a distinctive retail environment.
Kotler (1973) further claims that the physical environmental will have a greater influence on
consumer behavior and purchase decisions under certain settings. These settings are
characterized by:
• An environment in which a product/service is purchased or consumed and the seller has
control of the design options;
• The number of competitive outlets has increased;
• Product and/or price differences are small; and
• The product/service entries are aimed at distinct social classes or life style buyer groups.
Kotler has emphasized the effects of atmospherics on emotions. His approach links the study
of atmospherics directly to the experiential perspective on consumer behavior (Mowen and Minor,
1998 and Kotler, 1973). However, since Donovan and Rossiter’s (1982) work on introducing the
Mehrabian-Russel (M-R) model to the study of store atmosphere in relation to consumer
behavior, researchers have largely explored how obvious and evident atmospheric variables such
as music (Milliman, 1982; Morin et al., 2007; Yalch and Spangenberg, 2000), color (Bellizzi and
Hite, 1992), odor/scent (Hirsch, 1995; Michon et al., 2005; Spangenberg et al., 1996), lighting
(Areni and Kim, 1994) and crowding (Machleit et al., 2000) can influence consumer behavior in

14
retail store environments. A small number of studies have also started to look at the interaction
between these variables, such as Baker et al. (2002) who explored the interaction between store
design, employees and music on perceptions of a retail store.
The ability to drive in-store behavior through the creation of an atmosphere is acknowledged
by many retail executives and retail organizations. In order to make it easier to examine the
effects caused by all these different environmental cues, several scholars suggested more
specific categories within atmospherics (Bitner, 1992; Berman & Evans, 2012; Turley & Milliman,
2000; Baker et al., 2002).
In a recent study, Turley & Milliman’s (2000) literature review indicated 57 different
environmental characteristics that can affect consumer’s emotions and behavior. They
recognized five broad categories of atmospheric cues, including: external cues (e.g. architectural
style and surrounding stores); general interior cues (e.g. flooring, lighting, color schemes, music,
aisle width and ceiling composition); layout and design cues (e.g. space design and allocation,
grouping, traffic flow, racks and cases); point of purchase and decoration displays (e.g. signs,
cards, wall decorations, price displays); and human variables (e.g. employee characteristics,
uniforms, crowding and privacy).
In 2002, Baker et al. conducted research on how environmental cues of the store affect
customers’ store choice decision criteria. They suggested a model that grouped the
environmental cues into three categories: design, ambient, and social factors. Except for the
external factors, these categories consist of the same type of environmental cues as the
categories identified by Turley & Milliman (2000).
It can be observed that within the literature on atmospherics, there seems to be a tendency
to attempt to specifically categorize individual cues in order to employ them and understand their
effects (Chebat and Dube ́, 2000), and to this end, much of the existing research literature has
been carried out using experimental designs. Findings from these experiments suggest that the
affect the retail environment has on consumer behavior is both strong and robust which, suggests
consumer environments can be manipulated to increase the likelihood of evoking a specific
shopping behavior.
15
Summary. This review of literature on impulse buying suggests that impulse buying
constitutes a large part of consumer shopping behavior. While previous definitions alluded only to
the ‘unplanned’ dimension of impulse buying, more recent research has centered on the
hedonistic or emotion driven aspects. Situational factors in retail settings as have been shown to
influence impulse buying behavior as the behavior is prompted by environmental stimuli. These
factors can include the design of the store, the sales staff, the presence of other customers, the
mood and lighting. Kotler’s (1974) work on atmospherics reveals just how much of a profound
effect environmental stimuli can have on consumers.
Surprisingly there have been few studies dedicated to attempting to explain, predict, and
control the behavior of consumer. Much of the research in the fields of retail environments and
atmospherics has looked at the effect of individual stimuli on the perceived atmosphere. Yet,
there seems to be a need for a more micro level research that would explain how consumers
actually perceive products or objects within a particular atmosphere, and evaluate this process.
Although the research to date has isolated the effects of particular environmental stimuli or
variables, there less understanding of which elements of particular stimuli drive consumer
behavior. Many atmospheric features, either individually or integrated, has an influence on
consumer behavior and these facets should be closely examined. It is important to examine
specific environmental stimulus such as lighting, to determine how this particular facet can
influence and change the perception of products within retail environment. This study looks at
lighting as an atmospheric element due to its efficiency in controlling and manipulating.
However, it is important to note that categorizing lighting within the definition of ‘atmospheric
aspects’ still remains vague in research up to now (e.g., Baker, 1986). However, Bitner (1992)
defined lighting as an interior aspect, while Turley and Milliman (2000) included lighting in their
review of atmospheric research in retail environments. Both opinions are appreciated, however,
for this study lighting is defined as an ‘atmospheric tool’ that might have an influence on
consumers perception of products. The following section will explore the academic literature on
lighting.

16
Research On Lighting
Although many studies have been conducted related to retail environments and impulse
buying behavior, there have been very few published regarding lighting specifically from a
designer perspective. This section discusses a number of studies related to lighting as applied in
retail environments from a non-designer perspective, as they provide valuable starting points for
investigation. It begins with an overview of lighting terminology and concepts. Following this, key
points of current retail practices are discussed. Finally, there is an overview of studies conducted
about lighting in retail environment.
Lighting Characteristics. Lamp technology and lighting design continues to evolve.
Since the introduction of electric lighting, many different light sources were introduced and
continued to improve. This section provides an overview of the perception of lighting
terminologies and characteristics: intensity, correlated color temperature, and spatial distribution.
Most general lighting systems and studies can be described in terms of these characteristics.
Brightness. As discussed earlier in this section, the words brightness and luminance are
closely related and sometimes interchangeable. However, brightness is a perceptual impression
of the product of luminance. The brightness of an object refers to the perception of a human
observer, while the object’s luminance refers to the objective measurement of a photometer.
IESNA defines brightness as “the perceptional response to luminance and is associated
with the luminous power of a surface or object, and varies from bright to dim”. It is important to
note that in certain conditions, a significant discrepancy exists between what we see (i.e.
brightness) and what a photometer reads (i.e. luminance). For example, a car headlight turned on
during the daytime does not appear very bright. However, at night, the same car headlight will
appear dramatically brighter. When the car headlight is measured by photometer either during the
day or at night, the measured luminance of headlight remains constant. This principle is
illustrated in Cayless and Marsden’s (1983) study, which found that the apparent brightness of a
surface depends on both its luminance and the luminance of the immediate surroundings that
constitutes our visual environment.

17
The perception of brightness is a function of so many different factors such as object
luminance, size, gradient, surrounding luminance, adaptation of the eye, and spectral
composition (DiLaura et. al., 2011). The perception of brightness has been studied by different
scholars dating back to the 1960s. Stevens (1961, as cited in Boyce 2010 and Cayless and
Marsden, 1983) using a self-luminous target, was the first to demonstrate that a measurably
consistent relationship exists between luminance and brightness.
There are several studies that suggest that varying the emitting surface of a luminaire
affects perceived brightness. Using reference-matching methods, Ishida and Ogiuchi (2002)
conducted an experiment to examine the effect of strength of light source and the amount of light
in a space on perceived brightness. They created several light settings in a light box without
objects. The participants were asked to evaluate the intensity without being able to see the light
source. The results showed that there is a significant correlation between the brightness of a
space and the perceived amount of light in that space. However, there was no correlation
between perceived brightness and the perceived strength of a light source.
Researchers also note that the sensation of brightness increases when the luminance of
the visible portion of the luminaire gets higher (Bernecker and Mier 1985 and Akashi et al. 1995).
Loe et al. (1994) conducted a study where subjects were presented with 18 different lighting
settings in a room that was furnished like a small conference room. Subjects were asked to fill a
questionnaire using semantic differential scale to evaluate the perception of room illuminance
from a fixed position at the side of the room. Findings suggest a high correlation between visual
lightness/brightness and average luminance over a 40-degree vertical visual angle centered at
normal eye height. These researchers propose that an observation area might exist that closely
related to the sensation of brightness, but exact specifications require further research.
Correlated Color Temperature. Artificial light sources are generally composed of a
variety of wavelengths and intensities of light. Manufacturers can manipulate the color of an
artificial light source by controlling the different wavelength components of the light. Yet, lighting
designers often describe white light in terms of “warm” and “cool”. These commonly used terms
are actually measureable numbers, expressed as correlated color temperature (CCT). CCT is
18
defined as “the absolute temperature a blackbody has when it has approximately the same color
appearance at the source and is measured in Kelvin (k)” (DiLaura et. al., 2011).
CCTs relate the perceptible warm colors with low temperatures, and perceptible cool
colors with high temperatures. Warm white light is generally set below 3000K, while cool white
light is set above 5000K. For instance, a candle flame has a color temperature of about 1700K.
As well, a typical incandescent lamp has a color temperature of about 2700 K, while the white
halogen lamps on average have a color temperature of about 3000K. Neutral light is measured
between 3000K and 5000K. However, Lechner (2009) found that despite the term ‘neutral’ for this
range, most people prefer light sources ranging from 3000K (warm white) to 4100K (cool white).
This study also found that warmer colors are preferred when illumination levels are low, while,
cooler colors are preferred at high light levels and in hot climates (Lechner, 2009). At the
higher/cooler end of the spectrum, cold white light (CCT 5000K) is only generally used for
spaces/tasks where very accurate color decisions must be made, such as in design studios
(Lechner, 2009).
In general, the focus of the perception of light color research is on white light. However,
recently scholars started to shift their focus on topics related to color preference and color
association of light. Such scholarly effort, can give us insight in choosing proper colors for colored
light sources to better the perceived atmosphere.
Studies have shown that perception of color tone, either warm or cool, changes with
CCT. Davis and Githner (1990) examined the effects of CCT and illuminance level on lighting
perception using “bipolar scale” with warm and cool listed at the ends of the scale. They asked 40
participants to assess two light sources with different color temperatures at three different
illuminance levels. One lamp with high CCT (5000K) was perceived as cool and the other lamp
with low CCT (2750K) was perceived as warm. Color temperature changes were identified by the
participants as being distinct from the illuminance level changes. Hu et al. (2006) also came to
similar conclusions. In this study the researchers used three linear brightness models, two color
appearance models, and two psychological experiments to examine the perception of brightness
as a function of CCT.

19
However, McCloughan et al. (1999) and Knez and Enmarker (1998) found no effect of
CCT on a warmth scale. In both experiments, CCT was ranged with two Color Temperatures,
3000K and 4000K. These results can be explained as Davis et al. (1990) used CT levels that
were more extreme compared to the levels used by McCloughan et al. (1999) and Knez and
Enmarker (1998). Had these latter researchers used more extreme levels, they perhaps could
have seen significant differences.
Other studies were conducted to look at any feasible relationship between age and
gender on perceived CCT. Knez and Enmarker (1998) varied the CCT (3000K vs. 4000K) and
asked participants to evaluate the perceived CT. They discovered that gender had a significant
effect as females were less sensitive to high CCT when compared to males. Specifically, female
participants found the 4000K mode notably warmer than the 3000K mode, whereas male
participants found the 4000K mode more cool as to the 3000K mode. However, the author did not
offer an explanation for this result. In a more recent study, Knez and Kers (2000) concluded that
younger participants assessed the room light as cooler as than older participants. The difference
in perceived color temperature between the younger and older people can be interpreted by the
fact that the capabilities of the human eye deteriorates during the aging process and a loss of
sensitivity for light intensities results.
In 2008, Van Erp conducted a pilot study where color temperature differentiation was
examined with five participants. A forced choice design approach was used between a fixed
reference with CCT of 3469K. The reference and the test stimuli were exposed at the same time
for evaluation. A total of eleven test stimuli ranging from 3013K to 3986K having a step size
ranging between 81K and 123K were selected. Participants were asked to judge wither the
reference light was more bluish than the actual stimuli with an answer choice of yes or no. They
found that 75K is the smallest difference in CCT that people could notice/perceive. However, Van
Erp’s (2008) findings are arguable as the number of participants was very small.
Spatial Light Distribution. Spatial light distribution refers to the way light is distributed
from a light source. It can affect the distribution of light in a space, which can be described as
uniform or non-uniform. Spatial distribution is composed of two aspects: (1) the distribution or

20
pattern of the light, and (2) the location of the light source. The degree of uniformity can be
controlled by limiting the spatial distribution of light, thus influencing the way space is perceived.
A uniform light effect in a space is achieved when the whole space is illuminated evenly.
Conversely, when the light in a space is distributed unevenly this creates patterns and zones
within a space; thus achieving a non-uniform light effect. Therefore, the desired effect (either
uniform or non-uniform) can be controlled by the number of luminaires, their location, and their
direction for emitting the light. Direction of light is very important as it can produce a number of
different effects. The direction is ascertained by the angle from which light is emitted by the
luminaire; this can be directional or diffuse. Directional light produces well-defined edges, while
diffuse light produces shadows with softer edges. Directional lighting can be used to highlight
something and add emphasis. Diffuse lighting is perceived as less bright compared to directional
lighting with the same illuminance (Boyce 2003).
Spatial distribution of light has been mainly investigated in regard to brightness. DPhil
(1995) conducted a study that examined the effects of illuminance level and luminance
distribution on perceived brightness. Participants were asked to assess the brightness between
an office with a uniform and an office with a non-uniform luminance distribution across the walls.
This was done by adjusting the illuminance of the working surface. Four rooms were used for this
experiment, two with a uniform distribution of luminance and two with a non-uniform luminance
distribution. While the distribution of luminance differed in all rooms, the average luminance
across the participant’s field of vision was the same. Participants inspected the light settings from
a fixed location. The results showed that offices with uniform luminance distribution required five
to ten percent more working plane illuminance to correlate the brightness of the offices with non-
uniform luminance distribution. Meaning that a room with a non-uniform distribution looks brighter
than a room with a uniform distribution even when the average luminance across the participant’s
field of vision is the same.
However, Kato and Sekiguchi (2005) found the opposite result. They used three levels of
total luminance with a variation of one to four vertical, diffused wall plane light sources. However,
they kept the total luminance across the room constant. Contrary to DPhil (1995), Kato and
21
Sekiguchi (2005) asked participants to rate the brightness impression of the room, with the ability
to move freely within the room. They found that in order to increase brightness impression, the
number of plane light sources should be increased rather than the mean luminance per plane.
This entails that a more uniformed luminance distribution appears brighter.
Retail Lighting Practices. The Illuminating Engineering Society of North America
(IESNA) considered the importance of successful retail lighting as being an important part of the
branding and marketing criteria. Accordingly, lighting influences and creates excitement in the
store (Wharton School of Business, 2010, Cited at DiLaura, Houser, Mistric, Steffy, 2011: P.
34.1). This amplifies other retail lighting aspects. IESNA stated that the role of lighting is to render
the goods in an attractive manner to allow the consumer to examine the goods in order to make
the final purchasing decision.
In order to incorporate retail lighting design with the marketing strategy, IESNA
recommended that the lighting design process should start at the early stages of the project. In
this way, the retail lighting designer can create proper contrast between goods, displays, and
backgrounds, utilize accessible lighting energy, and determine accent luminaries positions with
ideal aiming angles (DiLaura, Houser, Mistric, Steffy, 2011: P. 34.37).
IESNA encouraged the element of attraction and atmosphere by suggesting many
criteria. One criterion is accenting, which can affect brightness perception (as discussed above),
provide visual relief, and help in way finding through the store. In an interview with Alfred Borden,
from The Lighting Practice, in Lighting Design and Application Magazine, mentioned “Retail which
depends on too much on ambient lighting rather than accent lighting and uses more energy with
less effect than lighting which primarily accent the merchandise”.
IESNA also recommends that lighting for the general retail area should be dramatic and
target the merchandise display. However, perimeter areas should be treated carefully so that it
still attracts attention to the store and supports the dramatic atmosphere.
Feature display is another essential aspect of retail design, implemented to create an
attractive atmosphere. Feature displays can be used as a focal point to direct the consumer
throughout the store. Therefore, IESNA recommends the total display should be lighted to a base
22
level of illuminance. Subsequently, 25% of the feature display should be highlighted up to five
times the base illuminance. For additional highlighting and visual array, known as the Dazzle
Effect, another 10% of the display can be highlighted to ten times of general horizontal
illuminance component at the base illuminance. The Dazzle Effect is best used on displays of low
reflectance. These suggestions can create dramatic contrast across the display, introduce visual
interest, and avoids washout and sameness of feature displays. However, feature displays must
be limited in number as to not create too much sameness in displays across the store.
In 1996, Hegde conducted a study where she compared the IESNA standards with
current retail lighting practices. She measured fitting rooms in three stores in the same urban
area that share similar light sources and design. These measurements were compared against
IESNA recommendations of illumination levels (75 fc for general merchandising areas, and 100 fc
for fitting rooms), color temperature, and color rendering index of light sources. The findings
showed that both the illumination levels and the color rendering index of the three stores were
deficient and below IESNA recommendations. Yet, color temperature for both the fitting rooms
and the merchandising areas of the three stores was acceptable. The fact that the fitting rooms
were underlit revealed that retailers do not appreciate the value of lighting in fitting rooms where
product examination and main buying decisions were made. This also prompted IESNA to supply
valuable guidelines to lighting practitioners. Yet there were some issues with Hegde’s (1996)
study as they neglected to take into account a measure of consumer’s perception of lighting
levels against the recommended one by IESNA.
A pivotal study on the role of lightning design in retail published in 2006 brought up
numerous important findings. Quartier (2006) conducted in-depth interviews with twelve industry
experts to receive input across different disciplines. These experts included: four lighting
developers from four different lighting manufacturers, three independent retail designers, two
independent lighting designers, two people working and designing for a large retailer, and one
theatre lighting designer. The first important finding suggested that all of these experts agreed
that lighting can create specific atmospheres that can be used as “mood inducer.” The second
important finding related more specifically to the need for research in food retailing.

23
Supermarkets were identified as the most interesting locale (by all but one of the experts) due to
the diversity of products offered. One of the experts suggested that supermarkets in fact use the
best available technologies in terms of lighting.
It became apparent to Quartier (2006) that lighting can add significant value to the retail
environment, however there does not appear to be scientifically proven data to support this fact.
The need for more specific design recommendation was also stressed as one of the retail
designers mentioned that he would like to see, “scientific data that certain lamps, which were
credited with higher sales numbers by lighting manufacturers, in fact really did have this effect.”
The designers seemed to question the integrity of research carried out by manufacturers. Also
the study revealed that research in retail lighting is not necessarily comprehensible, as the
language used is difficult to understand by retail designers. In conclusion, Quartier’s (2006) was
especially significant as it emphasized the need for unbiased research data on lighting in “food
retailing”, and that this data should be communicated in a way that is obtainable to designers.
Lighting Studies of Retail Environments. In the previous section a basic
understanding of lighting and the effects of lighting characteristics on perception, mood, and
performance of people was discussed. However, many studies draw attention to the need to gain
further understanding of the influence of retail lighting on consumer preference and behavior.
Experimental research in this field dates back to the 1960s and has advanced since then. These
developments shaped two main avenues of research in retail lighting: one path focused on
product lighting and the other path focused on atmosphere lighting. In this section we will discuss
the valuable studies that were conducted in both fields.
Studies on Product Perception. Studies on lighting and product perception have been
conducted in both actual retail store environments and also in simulated or lab environments.
Both methods suggest similar results indicating that lighting can indeed influence consumer
behavior.
Studies on Product Perception in Actual Retail Environments. Starting with lighting
products, but with a larger impact on atmosphere, Areni and Kim (1994) examined the effect of
lighting on consumer behavior in an actual wine store. Their field study in a wine store

24
investigated the impact of in-store lighting on consumer behavior by manipulating two light
settings, soft and bright. Yet, the difference between the two settings was never specifically
measured. They only mentioned that for the ‘dim setting’ 22 of 50Watt lamps lighting products
were used and for the ‘bright setting’ seven of those 22 lamps were replaced by 75Watt lamps.
Their conclusions showed that under ‘bright lighting’ conditions, bottles were more often
examined and touched than under ‘dim lighting’ conditions. In addition, in the cellar area of the
store, couples spent more than other groups of potential customers. There were no significant
differences in the effects of lighting on couples’ spending in the cellar, the number of items sold
and the total sales in a wine store. The researchers also found that experienced customers
preferred a highly illuminated cellar that allowed for better visual acuity and facilitated the
assessment of goods. In contrast, non-experienced consumers preferred softer illumination to
boost their shopping experience. However, their findings did not support Markin, Lilis, and
Narayan ‘s (1976) results that soft store lighting did not have a significant relationship with the
amount of time spent in a store.
Freyssinier (2006) conducted studies on the perception of store windows when the
lighting was altered with an emphasis on finding a sustainable alternative for illuminating the
display windows in stores using blue LED background lighting. Therefore the goals of this study
were two fold: 1) to evaluate shoppers’ lighting preferences and 2) to measure energy savings
and sales for four lighting settings in three retail stores of an apparel chain. Questionnaires from
shoppers were collected and sales from each store were observed over an eight-week cycle. 700
shoppers were asked to evaluate attractiveness, eye-catching ability, comfort, and visibility of the
4 light settings. It was found that a 50% power reduction in accent lighting did not result in a
decrease in the aesthetic value of the display if used with the blue colored background.
Additionally, shopper’s subjective impressions were enhanced when the power of accent lighting
was decreased by 30%. Furthermore, the sales of the merchandise on display were not affected
by the 50 percent reduction in lighting.
Hebret (1997) studied the effect of lighting in a retail display area on the approach-
avoidance behavior of consumers. While this study did take place in an actual store, behavior

25
was videotaped and reviewed for analysis. The field settings included a hardware store and a
western apparel/feed store in non-urban areas. The study examined the influence of lighting on
three aspects of approach-avoidance consumer behavior: 1) a desire to approach the test display
or to avoid the test display, 2) a desire or willingness to explore the test display or to avoid the
test display. 3) The degree of approach or avoidance of the task of picking up the merchandise at
the test display. The researcher observed consumer behavior via closed circuit video camera.
Hebret (1997) found that manipulating the level of illuminance and the color temperature
correlated with consumer approach/avoidance behavior.
Following that study, Summer and Herbet (2001) conducted field research in retail stores:
a hardware store where tools were lit, and a fashion store were belts were lit. They analyzed
approach-avoidance behavior and incorporated video observational techniques. They studied the
effects of lighting on consumer behavior looking at the following behaviors: time spent at the
display, number of items touched, and number of items picked up. The lighting was determined
by following the IES (Illuminating Engineering Society) guidelines for retailers. There were
variations per store (number of lights and distance to the display). The setting take turn daily,
between on and off lighting treatment. Results show that light levels can factor in to consumer
approach behavior. Additional accent lighting treatments were shown to have a positive effect on
consumer behavior. The following interactions between lighting and display were found to be
statistically significant: 1) They found that more products (belts) were handled (touched and
picked up) with the added accent lighting; 2) consumers spent considerably more time at the
display of tools when the light was on rather than off. Even though results showed a significant
relationship between lighting and consumer behavior, this study was limited by the nature of
products, stores and price tag location which may have affected the results in terms of time spent
and touch. Another limitation was that passersby and children were included in the analysis.
Studies on Product Perception in Simulated Environments. Barbut (2001, 2002, 2003,
2004) conducted a series of lab experiments examining the effect of lighting on fresh food. He
used three different commercial light sources: incandescent, fluorescent, and metal halide to test
consumer preferences. Findings suggested that preference of food products can be affected by
26
manipulating the light spectrum of the light source. From this study it can be generalized that the
displayed merchandise should be illuminated with a lamp that emits lighting in the color of that
merchandise. For example Barbut noted that red pepper was preferred under incandescent light
source as a result of the availability of red spectrum in incandescent light as opposed to other
light sources used. Relative luminance data, collected with a fiber optic probe connected to a
photo array was used to show the red color availability in light sources, in order to explain the
consumer preferences. Conversely, he found that food with white/cream color did not show any
significance under the three different lighting sources (neutral effect).
Quartier (2009) conducted a smaller-scale study to investigate the influence of lighting on
product choice. In this study, a total of 60 subjects (30 male, 30 female) of various ages ranging
from 18 to 55 volunteered to participate. The subjects answered a computerized test involving
photographs of six different illuminated products. In particular, eight different light sources were
used; halogen (50 Watt), TL (TL830 and TL840, both 36 Watt); high-pressure discharge metal
halide lamps (CRI 830, and CRI 942, both 50 Watt), high- pressure discharge sodium lamp (CRI
825, 50 Watt). The subjects were then asked to rank the photos in order of their personal
preference using a criterion of four parameters: freshness, attractiveness, appetite and price
perception. The analysis of this experiment is yet to be finalized.
Studies on Spatial Perception. Like the previous section discussing studies on lighting
and product perception, studies on lighting and spatial perception have also been conducted in
both actual retail store environments and also in simulated or lab environments. As stated earlier,
both methods provide similar conclusions suggesting that lighting can influence consumers’
spatial perception and buying behavior. (The benefits and drawbacks of actual versus simulated
environments are discussed in further detail in a later section of this chapter outlining the
framework used.)
Studies on Spatial Perception in Actual Retail Environments. An important study that
examined lighting in an actual retail environment was conducted by Cuttle and Brandston (1995).
They compared the upgraded lighting with the former lighting at two furniture stores and their
impact on purchasing behavior. The former lighting (filament spotlights) provided low illuminance

27
with low efficiency in both stores. The updated lighting elevated the illuminance level and the
system efficiency was maximized by more than 200 percent, but power densities were slightly
affected. The intention was to apply ambient lighting through the indirect use of fluorescent
lamps. Halogen lamps were then used to create accent lighting. Six aspects of lighting
performance were empirically measured illumination, power density, lighting costs, sales,
customer perceptions, and sales staff perceptions. These measurements were analyzed by
observing energy used and the number of sales made. A short survey measuring the level of
satisfaction with the updated lighting was given to both customers and employees in the two
stores. For each of the two furniture stores, the sales performance of the preceding year was
compared to the sales performance the following year where the updated lighting had been
employed. One furniture store showed an increase of 35 percent in sales, while no significant
increase in the sales was found for the other store. However, these results need to be
approached with caution: low-volume, high price nature of the merchandise; influence of season
and trends during the period; and different furniture displays. Besides, both customers and sales
staff reacted positively to the updated lighting in both stores compared to the former lighting
condition. The sales staff believed that the updated lighting improved the performance of their
jobs. Although this study suffers greatly from methodological weaknesses, it helped to bridge the
gap in literature between retail lighting and consumer behavior.
A similar field-based study on illumination was conducted by Boyce, Lloyd, Eklund, and
Brandston (1996). Like the aforementioned study, the empirical results of the study are
overshadowed by the extraneous variables the researchers encountered. The researchers
investigated the impact of the new lighting on consumer attitudes, sales, and electrical power
consumption at a grocery store setting. Consumer attitudes were evaluated before and after the
lighting renovations were made. The effect of lighting on space perception was examined along
with the effect of the new upgraded lighting on sales figures. The consumers were asked to
complete two surveys one before and one after the lighting modifications. The results of the
surveys showed that the new lighting was more pleasing and comfortable than the old lighting
condition. After the lighting modifications there was reportedly a substantial increase in sales.
28
However, in addition to lighting modifications the bakery area was completely remodeled
which included the introduction of additional daylight through skylights. This confounding variable
may have inadvertently impacted consumers’ lighting perceptions. The modification of the store
was not only limited to lighting, but the whole store was renovated. This put the results into
question, as lighting was not being the only variable that was changed.
Vaccaro et. al. (2008) conducted a research study that was designed to investigate the
relationship of consumer perceptions of music retail consistency and lighting with store image and
product involvement. The study was based on two hypotheses. Firstly, brighter lighting is
essential in retail environment, because it enhances consumer product interactions and secondly,
higher music retail consistency would lead to enhanced consumer responses towards the
retailing environment. Questionnaires were used to collect data from undergraduate and graduate
students in the United States. The study found that the brighter the lighting, the more positive
consumer perceptions about the store were elicited. Moreover, greater consumer-product
involvement was recorded in brighter lighting than in less illuminated stores. However, there was
no positive correlation between music retail consistency and the image of the store. Thus creating
a positive retail atmosphere through lighting is an effective approach of encouraging return
customers.
Custers et.al. (2010) conducted a field study involving 57 clothing stores in an attempt to
measure how lighting contributes to atmosphere perception in real-world environments. They
assessed these stores in terms of lighting aspects such as brightness, contrast, glare and
sparkle, and context (such as the interior of the shop). Hierarchical regression analyses were
used to find correlations between lighting aspects and the four dimensions of perceived
atmosphere; coziness, tenseness, liveliness, and detachment. Results show that these lighting
aspects and perceived atmosphere can be correlated. Because of the diversity that exists in real-
world environments, the study was not able to find an exact link between each lighting aspect and
the type of influence it made on perceived atmosphere. Yet this study suggests that lighting may
play an important role in the retail environment.
29
Studies on Spatial Perception in Simulated Retail Environments. With regard to spatial
perception and retail lighting in simulated retail environments, Baker, Levy and Grewal (1992)
conducted a study to explore lighting with other variables. They utilized an experimental approach
in examining retail store environmental decisions using two aspects: 1) Ambient cues,
operationalized through lighting and music, and 2) social cues, operationalized through
friendliness of employees. They measured the effects of these aspects on participants’ pleasure,
arousal, and willingness to purchase in retail card and gift stores by the use of the M-R model
(discussed below). Lighting and music together were changed as the ambient cues; the
illumination levels were altered by manipulating the brightness controls on the television monitor.
It is not mentioned neither by measurements nor proper description, how bright or soft the lighting
was and if those settings were relevant stimuli. So, no precise statements about lighting could be
made. Findings suggest that both social cues and ambient cues interact to influence consumer’s
pleasure, arousal and willingness to purchase goods.
Quartier et al (2009) conducted an experimental research study that sought to examine
the influence of various retail atmospherics on the behavior and the mood of the shopper.
Quartier approached the experiment from a design background rather than a marketing
background. Lighting was the main focus as an atmospheric factor. A sample of shoppers was
subjected under holistic atmospheric components and their mood was observed and recorded in
a “Retail Design Research Lab”. The people under observation were 78 women and 42 men of
different ages and backgrounds. The lighting used was CDM and SDW spotlighting which has
similar illuminance levels but with different color rendering and color temperature. Fluorescent
lamps were used on the shelving area. The study found no significant difference in the choice
behavior between men and women. The route that the respondent took was found to be the key
determinant of choice behavior. However, the extra-lit shelves did not have any influence on the
choice behavior of the respondent. Moreover, there were notable results on color preference for
green vegetables: 60% of shoppers preferred the cool white light (CDM 930 lamp) over warm
reddish white light (SDW 930 lamp).

30
Quartier also mentions a study that investigated the extent to which lighting influences
the atmospheric appearance of a retail environment. A group of 90 people took part in the
experiment where they performed a shopping task in a simulated supermarket. Three specific
lighting settings were used and they included: high end, midlevel and hard discounter. These
settings were each subjected to three variables: illuminance levels, color temperature, and
equilibrium of general lighting and accent lighting measures. A fifty-dollar credit to fulfill the buying
scenario was given to subjects where they were asked to buy breakfast for two people. Subjects
were also free to buy any other products to stimulate impulse buying. The subjects were required
to answer one questionnaire before the “shopping task” and two questionnaires after the
“shopping task. The first questionnaire asked about mood, personal, socio-demographic factors,
and daily shopping behavior. The second questionnaire asked about atmosphere using 38
atmospheric terms in a 7-point scale. The third questionnaire asked about emotions and
perception, supermarket image, and impulse buying behavior. The study found that in the high-
end setting, respondents perceived it as being cozier, livelier, less tense and less detached than
other two settings. Moreover, the respondents’ mood did not affect their perceptions of the
“store.” This shows that lighting could be systematically used to change the atmospheric
appearance of a given retail environment.
Studies have also been conducted on impact of lighting on store appearance and space
perception in terms of branding (Schielke, 2010). Schielke used computer visualizations of retail
outlets with different lighting variations that are evaluated in terms of light, spatial setting and
brand impression by regional and international groups using the Semantic Differential Technique.
Eight different light settings were designed (each with or without visual luminaires) for evaluation.
Results showed that simple lighting modifications could convey different brand identities for the
same store. However, the researcher did not disclose a justification for the light settings used.
Although this study is valuable in building a bridge between lighting design and marketing through
enhancing brand communication, Schielke’s methodological approach is somewhat unclear,
posing difficulty for future replication.
31
Summary. Based upon the literature reviewed in this section on lighting studies in retail
environments it can be recognized that lighting can play an important role in retail spaces and
product presentation. These studies have provided informative data for the most part, however
there are some shortcomings within this research field that should be addressed. Studies on
product perceptions in actual environments suggest that lighting changes product perception in
positive ways that can prompt consumers’ approach-avoidance behavior. Lighting can potentially
increase time consumers spend in front of displays, touching products, and increase the number
of their purchases. Studies in actual retail environments demonstrate actual consumer behavior,
however; studies in simulated environments can allow for better control variables, particularly with
regard to specific lighting measures. Studies on lighting and spatial perception in actual
environments versus simulated environments present similar benefits and drawbacks. Studies in
actual environments theorize that changes in lighting can lead to product involvement, positive
feedback for store environments and even an increase in sales of products, yet there is an issue
with cofounding variables. A simulated environment may not reflect actual behavior but specific
levels of lighting can be measured and referred to.
While lighting has been determined to have an effect on the perceived atmosphere, there
is little known about the effect of lighting on the perceived product within that atmosphere. It
should be a focus of study since ultimately it is the products that are sold, not the atmosphere.
Similarly, while there are a variety of models available that examine spatial perception there does
not appear to be a model specific to analysis of product perception. Lighting characteristics have
been examined in the aforementioned studies; however, there is little discussion of precisely
which lighting effects evoke which responses. Knowledge of this information would be beneficial
in establishing guidelines for lighting and retail designers to create influential retail spaces, and
also aid in the management of effective budgetary spending. Finally, there was little to no
published qualitative research regarding in depth interviews concerning consumer perceptions of
retail lighting.

32
Culture
Definition and Introduction of Culture. Culture is a complex term that is expressed and
viewed in different ways depending on various aspects such as environment or situation (De
Mooji, 1998). Most anthropologists and social scientists regard culture as the aspects of humanity
that are learned, shared and passed on through social interaction rather than the aspects of
humanity that are biological or genetic. (Boas, 1940; Mead, 1937; Tylor, 1871). Culture appears
as the ways in which people live and interact with each other, it provides the foundation for social
organization, norms, values and traditions. These components together give different groups their
social identity, a means of defining themselves in relation to others. Therefore cultures around the
world can be quite different and hold different perspectives.
Specifically, in relation to international marketing and business, it cannot be assumed that
all consumers across the globe act in a similar manner. In the current globalized world, business
ownership and production have taken root in foreign countries and the Internet makes purchasing
from global vendors an everyday occurrence. Existing in such a global economy it is somewhat
surprising that there has not been more research undertaken on cross-cultural differences in
buying practices.
While other studies have explored this concept, they focus on differences between East
Asian and Western consumers, and there is little to no research on lighting preference differences
between Middle Eastern consumers and Western consumers. This study investigates the concept
of cross-cultural differences in relation to lighting preferences and their impacts on Middle Eastern
and Western consumer buying practices.
Research on Culture and Consumerism. Understanding how cultures differ is the first
step to understanding how culture impacts preferences and buying practices. Most of the
research on impulse buying examines American consumers, but other studies have looked at
consumers in Great Britain (Bayley & Nancarrow, 1998; Dittmar, Beattie, & Friese, 1995;
McConatha, Lightner, & Deaner, 1994), and South Africa (Abratt & Goodey, 1990). The studies
found that American consumers tend to be more impulsive than British and South African
33
consumers. Yet most of these studies do not look at what aspects of culture account for these
differences.
Hofstede (1991) identifies five dimensions of national culture: Power Distance (PDI),
Individualism versus Collectivism (IDV), Masculinity versus Femininity (MAS), Uncertainty
Avoidance (UAI), and Long-Term Orientation (LTO). Hofstede’s model has been used to examine
cross-cultural differences in actual consumption behavior and product use and is also useful in
predicting consumer behavior or effectiveness of marketing strategies for various cultures (De
Mooij and Hofstede, 2010). De Mooij and Hofstede, (2010) further note that of the five dimensions
of culture, the individualism/collectivism dimension perhaps best reflects cultural differences in
behavior research studies, especially in the studies conducted between Western and Asian
cultures. Western (American) culture is generally seen as individualistic, meaning the emphasis is
on the betterment of the individual, while Asian, Latin American and Middle Eastern cultures are
generally seen as collectivistic where the emphasis is on the betterment of the group.
Additionally, Maheswaran & Shavitt (2000) suggest that cultural factors can significantly
influence consumers’ impulsive buying behavior. In particular, they also propose that theories of
individualism and collectivism hold important insights about consumer behavior that may help us
to understand the impulsive buying phenomenon. Singelis et.al. (1995) suggest that impulsive
buying behavior can be linked to individualistic cultural aspects such as self-identity, normative
influences, the suppression of emotion, and instant gratification. Given that impulsiveness is
related to sensation-seeking and emotional arousal, where people may ignore the negative
consequences of their impulsive purchase (Rook, 1987; Weinberg & Gottwald, 1982), it is
possible that people in collectivist cultures may learn to control their impulsive tendencies better
than people from individualist cultures. Ho (1994) suggests that children in collectivist cultures are
socialized to control their impulses at a young age. Individuals belonging to collectivist cultures
may be taught that their actions should benefit not only themselves but also benefit those in their
immediate and or larger social group.
Cultural Differences between United States and Middle East. Western or American
culture can been seen as quite different than Middle Eastern culture. Much of this has to do with
34
the demographic make up based on historical circumstance for these regions. The United States
(U.S.) is a more heterogeneous society because, aside from Native Americans, it is a country
based on immigration in which most of the population’s heritage originates outside of the United
States. It is much more diverse ethnically, religiously and culturally than the Middle East. (Though
it must be acknowledged that the Middle East is composed of people of different religions,
cultures and ethnicities and should not be seen as completely homogenous.) The Middle East, in
comparison, has a much longer settlement history, more rigid boundaries and much less diversity
in terms of religious practice and belief systems. These aspects noting less ethnic diversity in the
Middle East have been recognized by researchers looking into global economic and political
differences as examined through ethnic fractionalization (Fearon 2003). As the Middle East is
much more homogenous in terms of religious beliefs, namely Islam, it could be reasoned that
more of the general population would believe in basic Islamic tenets more closely correlated to
altruism and collective wellbeing. Furthermore, in Schwartz’s (2007) study on the importance of
national morals and values in multicultural workplaces, he identifies Middle Eastern culture as
being much higher on a scale of communal embeddedness. As De Mooij and Hofstede, (2010)
stated, the individualism/collectivism dimension of culture perhaps has the most impact in
behavior research studies.
Studies done in the field of business and marketing have also shown differences between
Middle Eastern business practices and Western business practices. A study done on perceptions
of leadership demonstrated the features that most strongly stood out as characteristics of a
charismatic leader between Iran and Canada (Javaidan et. al 2004). Qualities valued in Iranian
leaders were self-sacrifice and eloquence, while in Canada the most valued qualities were
tenacity and vision. Researchers speculate that these differences in preference of managerial
style are due to Iran being more of a collective culture and Canada being more individualistic.
Seeing as how researchers have recognized how cultural differences in terms of collectivity
versus individualism can impact workplace and consumer behavior, further research specifically
on Middle Eastern culture would be very beneficial.

35
Culture and Perception. Some social scientists argue that culture is closely linked with
perception. De Mooij (1998) describes perception as “the process by which each individual
selects, organizes, and evaluates stimuli from the external environment to provide meaningful
experiences for him-or-herself.” These perceptual patterns are learned and culturally determined
because they capture people’s interests and values, and by understanding culture it filters and
leads people to distort, block, and even create ideas that they choose to see and hear or
understand (Adler, 1991; De Mooij, 1998). Often times what is viewed by one person is viewed
entirely differently by another person. Culture can often be the factor that accounts for these
differences.
Differences in perception have been recognized as important aspects to acknowledge in
research in the field of design and atmospherics. In Kotler’s 1974 article on atmosphere as a
marketing tool, he made a distinction between the “intended atmosphere” and the “perceived
atmosphere”. Intended atmosphere is described as “the set of sensory qualities that the designer
of the artificial environment sought to imbue in the space”. Perceived atmosphere included the
general public’s reactions to colors, sounds, noises, and temperatures, which are partially
learned. He suggested that this may also vary from person to person. Kotler (1974) used the
following examples to illustrate how perception varies across cultures. The color most often
associated with funerals in the West is black, while white is the color most often associated with
funerals in the East. Quietness in Italian culture may be noisy in Scandinavian culture. A pleasant
fragrance in Asia might be an unpleasant smell to an American. These examples reinforce the
notion that culture often dictates not only what is preferred but also how things are perceived.
These very important dimensions of culture should be investigated to ascertain how they might
affect buying behaviors in a global marketplace.
Cross-cultural Research on Lighting. A study conducted by Kuller et.al., (2006) shows
that lighting preferences, whether indoor lighting color or not, seems to have systematic impact
on the mood of people. These researchers sent a survey questionnaire to 988 workers in four
different countries, Argentina, Saudi Arabia, Sweden, and the United Kingdom (UK), which was
sent out five different times during the year. Based on the results of the survey, light and color of
36
the work environment appeared to have an influence on all workers. Mood was in its lowest when
workers subjectively judged it to be “too dark” and subsequently improved when the light reached
the “just right” status. Interestingly, mood also declined when light was subjectively judged to be
“too bright”. Workers north of the equator also reported significant seasonal variation in
psychological mood. This research is important as it suggests that perceptions of lighting can
certainly have some effect on the mood and psychological well-being of individuals.
Lighting effects would also seem to have significant impact on consumers’ emotions and
behavioral intentions in a retail environment. Park and Farr’s (2007) cross-cultural study
conducted between Caucasian-Americans and South Koreans revealed that lighting color
preference has impact on emotional states, perceptions, and behavioral intentions of people in
retail environments. Consumers in this experiment were found to have different reactions to
certain lighting effects. Park and Farr (2007) found that Americans find lighting more arousing
than Koreans, and the two cultures differ with regard to their color preference. Americans prefer
light with a higher color-rendering index (95 CR) and view this as more pleasurable; while
Koreans perceive light with a lower color rendering index (75 CR) as more pleasurable.
In a similar cross-cultural study done by Park, Pea and Meenely (2010), cultural
preferences in hotel guestroom lighting design were examined. Preferences are evaluated based
on three variables: preference, arousal, and pleasure. These were measured against three
independent variables:, two culture groups × two light colors × two light intensities. Findings
suggest that North American subjects preferred the hotel guestroom with low intensity and warm
color lighting, while the Korean subjects preferred high intensity and warm color lighting the most.
Dim lighting was viewed as more arousing than bright lighting by the North Americans, while
bright lighting was viewed by the Koreans as more arousing than dim lighting. This study provides
further evidence that preferences in lighting are not universal and that consumer mood and
behavior can be influenced if careful attention is paid to cross-cultural differences.
As previously mentioned there appears to be an absence of cross-cultural research on
lighting and design preferences comparing the Middle East and American culture. Middle Eastern
consumers should not be assumed to have the same lighting preferences or perceptions as Asian
37
consumers so specific research on the preferences of Middle Eastern consumers would be
especially pertinent given the general differences between Middle Eastern and American culture.
Summary. The research mentioned in this section has illustrated different cultures may
not only have different preferences but also different perceptions. Perception refers not only to a
particular view but the cultural implications that come along with the internalized judgment.
Certain smells, noises, and lighting can evoke particular moods and feelings in individuals of
different cultures. These cross-cultural differences can have a dramatic impact on buying
behaviors. Given the interconnected nature of the current global economic structure, cultural
differences in lighting perception and preferences could have a strong impact on consumer
buying behavior and warrants further, in-depth academic study. There are two main gaps in
current research on cross-cultural studies and lighting: 1) research focuses mainly on perception
of space, not product, and 2) research has been conducted comparing primarily East Asian
cultures and Western cultures, which little to no research has examined Middle Eastern culture.
This cross-cultural research on lighting perception and product, comparing Middle-Eastern and
American culture will be an important addition to this academic void.
Discussion of Theoretical Framework of The Study
A number of studies regarding atmospherics were pivotal in guiding the framework
chosen for this study. Researchers have found that consumer behavior is influenced by the
atmospherics of the shopping environment (Bitner, 1992; Donovan and Rossiter, 1982; Grossbart
et. al., 1990, Kotler 1973). Store atmospherics pertain to the special sensory qualities of retail
spaces, which can evoke a consumer’s emotional and/or cognitive states that influence
consumer-shopping behavior. Furthermore, researchers found that consumer perception of the
atmospheric stimuli in a store environment is highly related to consumer behavior (Grossbart et.
al. 1990; Spanenberg, Crowley, & Henderson, 1996; Yalch & Spanenberg, 2000). In determining
the particular framework for this study, three main approaches taken by key researchers were
examined exploring atmospherics. These approaches include: 1) the M-R Model 2) Vogel’s
(2008) Model and 3) Flynn’s (1977) model. Upon evaluating these studies while there were
strengths, no one model fit with the research questions regarding lighting and product perception

38
this particular study was examining. Therefore, while this research is informed by the groundwork
of these three approaches, a new model was developed based primarily upon Quartier’s 2009
concept. The strengths and weakness of these three influential models are discussed, as well as
the significant modification to Quartier’s (2009) model in creating the framework for this study.
Research Approaches in Lighting. M-R Model (Mehrebian-Russel). In 1974,
environmental psychologists Mehrebian and Russel designed an M-R model, for analyzing the
interaction between human behavior and the physical environment. The M-R model suggests
individuals react to environments with two general, and opposite, forms of behavior; approach
and avoidance (i.e., either approaching the situation or avoiding the environment altogether).
Researchers often use this model to explore consumers’ emotional and behavioral responses in a
physical environment (e.g., Jang and Namkung, 2009; Hebret, 1997; Baker, Levy, Grewal, 1992)
or virtual environment (e.g., Adelaar et. al., 2003). Mehrebian and Russel’s M-R model was
based on the stimulus-organism-response (S-O-R) paradigm, which correlated features of the
environment (S) to approach-avoidance behavior (R) within the environment, mediated by a
person’s emotional states (O) evoked by the environment. A number of researchers have used
this model in studies on retailing and the service industry (e.g., Caro and Garcia, 2007; Kaltcheva
and Wietz, 2006; Zhou and Wong, 2003).
In 1982, Donovan and Rossiter introduced the M-R model to the field of atmospherics to
study consumer behavior. They hypothesized that the emotional states of pleasure created by
retail atmosphere can affect approach or avoidance shopping behaviors within the store
environment. Meaning, the particular mood created in the store can influence consumers’
interactions with products. Building on this study, Donovan et. al. (1994) used a somewhat
modified M-R environmental psychology model. Quality and price (cognitive variables) were
demonstrated to be independent of these emotional variables. However, human nature is quite
complex. These researchers acknowledge that impulse buying or overspending may also result
from a desire to alleviate negative emotions not simply a result of experiencing positive emotions.
In other words, people may can have negatively-originated or positively-originated motives for
overspending. Donovan et al. (1994) concluded that further classification of the relationship

39
between emotional states and motivations for shopping were needed. Following Donovan and
Rossiter’s (1974) introduction of the M-R model, many studies of retail environments have
employed this framework with regard to atmospheric stimuli, emotional state, and consumer
behaviors (Areni and Kim 1994; Baker et al., 1992; Bitner, 1992; Dawson, Bloch, & Ridgway,
1990; Donovan, Rossiter, Marcoolyn, & Nesdale, 1994; Grossbart, et al., 1990; Hebret, 1997;
Sherman, et al., 1997).
Vogel’s (2008) Model. Researchers found that emotional states can be difficult to
disentangle from perceived atmosphere. The effect of environmental variables on perceived
atmosphere is expected to be independent from people’s emotions, yet many researchers were
not distinguishing between these variables. Vogels (2008) recognized this and provides this
example: people can feel very stressed in a relaxed environment if they think about all of their
problems. However, they will have a hard time feeling relaxed on a stressful environment. She
noted that atmosphere can be expected to be the more stable concept or variable to use for
measuring people’s experiences rather than measures of emotion. Therefore, Vogels’ (2008)
model can be regarded as further refining the concepts explored by the M-R model as it
evaluates atmospherics in terms of perceived atmosphere rather than emotion.
Vogels (2008) developed an atmospheric metric questionnaire to evaluate the perceived
atmosphere in a lit environment. She created list of atmosphere terms used by subjects when
they were asked to imagine different locations and the atmosphere of that environment. Using
factor analysis, she constructed an atmosphere questionnaire composed of atmosphere terms
forming 38 semantic differential scales. Vogel concluded that the atmosphere could be described
in four dimensions: coziness, liveliness, tenseness, and detachment. These dimensions are
comparable to the pleasure and arousal dimensions found by Mehrabian and Russell (1974).
Furthermore these four dimensions echo those used by Flynn and Spencer (1977) who specify
their dimensions as relaxing, tense, and spacious in relation to spatial light distribution. While
Vogel (2008) was successful in achieving a more accurate measure of perceived atmosphere, for
the purposes of my particular study, the methodology used by Flynn (1977) best captured both

40
perceived atmosphere and the effects of lighting. It is for these reasons the framework for my
study is most closely modeled after his work.
Flynn’s (1977) Model. James Flynn is an influential lighting researcher and retail
consultant. A major contribution of his work is applying Gibson’s (1974) perceptual theory to the
field of lighting and concluding that lighting actually impacts the ways in which the brain perceives
the outside environment. He introduced the element of subjectivity rather than simply the
assumption of perception as objective process. Flynn’s (1977) research along with Flynn and
Spencer (1977) research was considered by many in this research field (e.g. Veitch, 2001;
Ginthner, 2008; Loe et al., 1994) to be pivotal in that his work specifically examined subjectivity
and various lighting conditions.
Flynn (1977) conducted an experiment regarding participants subjective impression of six
light configurations. Based on responses five independent dimensions were identified using factor
analysis. They include: perceptual clarity (e.g. clear – hazy), evaluative (e.g. pleasant –
unpleasant), spaciousness (e.g. large – small), spatial complexity (e.g. simple – complex), and
formality (e.g. rounded – angular). He concluded that only three dimensions (perceptual clarity,
evaluative impressions, and spaciousness) showed significant differentiation between lighting
conditions. Flynn (1988) later revised his theories suggesting that for North American society
there are six categories of human impression that can be influenced or modified by lighting
design: perceptual clarity, spaciousness, relaxation and tension, public versus private space,
pleasantness, spatial complexity. Flynn (1988) further suggests that lighting systems can be
subjectively categorized by three main modes of lighting: 1) bright – dim, 2) overhead –
peripheral, and 3) uniform – non-uniform. Overall considering Flynn’s research contributions,
Flynn’s and Spencer’s (1977) user impression test of semantic differential scale was especially
useful with regard to subjective perception.
Framework Developed and Influence of Quartier et. al (2009). Out of the three models
discussed above, each research study has implications for the influence of atmospherics on
consumers, yet each model separately does not provide a comprehensive framework for
replication, this particularly true when considering cultural background as a factor. Therefore,
41
based upon the groundwork of the theories proposed by researchers such as Mehrebian and
Russel (1974), Vogels (2008) and Flynn (1977) the following model was proposed for this study
of the effects of ambient light on consumer perception of products (see figure). The focus of this
study was on testing consumer perception of products through lighting. This model identifies
variables (price, quality, freshness, pleasantness, attractiveness) that are important in evaluating
products in a retail environment and assesses them under different lighting conditions. This study
further adds the component of cross-cultural research, as responses of Middle Eastern
consumers are compared to the responses of American consumers to highlight differences in
preference and perception. Based upon the principles of this study, the framework used was
primarily informed by the research of Quartier et. al. (2009) and Flynn (1977).
This study refines and extends a pilot study that was conducted by Quartier et. al (2009).
In their study, they emphasized the need for more research on the effects of lighting conditions on
food retailing. Quartier conducted interviews with lighting experts who agreed that supermarkets
among other retail environments were identified as the most interesting due to the diversity of
their product offerings, and variety of lighting technology used. In addition, while establishing their
own brand identity, supermarkets are not specifically focused on one brand and brand image as
they encourage brand competition amongst a variety of brands. In their pilot study, Quartier used
images to evaluate product perception using four variables (freshness, attractiveness, appetite,
price perception). A computerized random generator was used to show two images at the same
time for evaluation. The participants were asked to choose which product they preferred based on
the variables mentioned under different lighting conditions. If they could not see any difference, or
both types of light are equally preferred, the respondent could opt to select the option “no
preference”.
Research done in the field of atmospherics and lighting design is conducted using three
different visual approaches. These approaches include:2-dimensional images or verbal
description, 3-dimensional environment such as labs and simulated stores, or 4-dimensional
experiments in real stores with complete experience. However, each approach has its own
methodological challenges.

42
Many researchers have investigated the effectiveness of using images for evaluation in
research. Mahdawi and Eissa (2002) reported significant correlations between image-based and
space-based evaluation using a semantic differential scale. In addition, Rohmann and Bishop
(2002) suggest that image simulation in research on human behavior is a valid and acceptable
methodology. More specifically to the field of lighting, the evaluation of images has value as both
a research tool and a method of representing lighting design solutions to clients and occupants
(Newsham et. al. 2005). Furthermore, image analysis is often used by marketers to examine an
effective communication strategy, which is usually measured using semantic differential methods
(Osgood, 1957)
Although research in actual retail environments provide a more realistic experience the
variables can be much more difficult to control. Because of this, only a very limited set of stimuli
can be manipulated at any one time and there may be a question of cofounding variables. This
makes it difficult to generalize the results of the study. Experimental research conducted in a
stimulated store or lab offers is generally easier to control and manipulate specific variables.
However, there is a lack of realism these artificial environments are used, potentially effecting
subjects’ behavior and therefore may not accurately predict behavior in a real world setting.
This research uses 2-dimensional images primarily because this method permits better
control of the stimuli. While, it does not allow the participants to experience a typical interaction in
an actual retail environment, numerous researchers as mentioned above note the inherent value
of this method. Two-dimensional images offer some insight into how people might respond to one
or more controlled stimuli, thus limiting the possibilities of confounding variables. Kotler (1973)
states that an image “is the set of beliefs, ideas, and impressions a person holds regarding an
object,” therefore valid inferences can be made when participants view two-dimensional images.
Although modeled after Quartier’s (2009) study, this study made several adjustments.
Firstly, in order to measure product perception among the variables instead of using a
computerized test, a 7-point likert scale was developed using similar variables to Quartier et. al
(2009). Quartier’s (2009) variables of price, freshness, and attractiveness were used with the
additional variables of pleasantness and quality. Furthermore, to analyze lighting perceptions and

43
lighting preference this study adapted variables used in Flynn’s and Spencer’s (1977) user
impression test of semantic differential scale (Dim-Bright, Glare- Non Glare, Hazy-Clear, Cool-
Warm, Dull-Radiant, Colorless-Colorful, Vague-Distinct, Unfocused-Focused, Complex-Simple).
This was necessary as this research pertains to product perception and not space perception.
Finally, an important methodological modification was regarding the addition of a second phase of
qualitative research, employed to provide further insight to the results obtained from the first
phase of quantitative research. There does not appear to be others studies in this field that
employ this two-part quantitative/qualitative framework. However, this method adds an element of
internal validity as this provided an opportunity to test the effectiveness of evaluating lighting
using interviews.
Figure 1. Model for Measuring Effects of Ambient Light on Consumer Perception of Product
Conclusions. While the background for this study was informed by the M-R Model
(1974) as employed by Donovan and Rossiter (1974), Vogel’s (2008) Model and Flynn’s (1977)
CULTURE!• USA!• Middle!East!
LIGHTING+• Intensity!• Correlated!Color!Temperature!• Spa9al!Distribu9on!
PRODUCT!PERCEPTION!• Pleasantness!• Freshness!• A?rac9veness!• Quality!• Price!
QUAN%&%qual%

44
Model, the primary framework for this study is based off Quartier et al. (2009). While Quartier et.
al (2009) did examine the effects of lighting on product perception he used computerized testing
for image evaluation. This study developed a 7-point Likert scale for evaluation. Other
modifications include: additional variables (pleasantness and quality) and follow up interviews to
add a qualitative component. This latter component of this study reflects the complexity of cross-
cultural comparison when subjected to analysis and also enhances the methodological rigor of
this study.
Chapter Summary
This chapter examined important research studies that have provided the foundation for
the theoretical and methodological framework of this study. Research on impulse buying has
come to the forefront of research on behavior in retail environments. Studies indicate that impulse
buying can be affected by atmospheric elements and in particular lighting. Studies suggest that
lighting can impact both product perception and spatial perception leading to increased
interaction with products, a more positive assessment of the retail environment and even
increased sales. However studies in actual retail environments often suffer from a lack of control
over confounding variables, which leads to issues regarding accuracy of findings. In contrast,
studies on lighting done in simulated environments can narrow in on more specific lighting
variables that influence perception, yet due to the artificial environment may possibly present
issues of generalizability in the real world. A consideration of these factors played a part in
determining the framework for this particular study. This section also included an assessment of
cross-cultural research on perception and lighting, which prompted a research design for this
study that includes qualitative measures to get at the nuances of culturally perceived differences.
45
CHAPTER III
METHODOLOGY
Overview
An extensive review of literature suggests that research comparing cross-cultural
perceptions and preferences of lighting in retail stores has not been explored in previous
research. This study attempts to fill this gap in academic research as its objectives include
examining the impact of different ambient lighting on the perceptual impressions of products and
comparing this between American culture and Middle Eastern culture. Specific research
questions ask:
Q1; Do changes in ambient lighting affect product perception (measured in terms of
Price, Quality, Freshness, Pleasantness, and Attractiveness)?
Q2; If so, then do these lighting changes affecting product perception differ across
different cultures?
Q3: What lighting characteristics are responsible/causing these changes in product
perception across different cultures?
This chapter describes the methodology used to examine these research objectives.
Included is a description of the research design, study setting, study sample, data collection
methods, procedures, and methods of analysis.
Research Design
This study used what is known as a mixed method design, which refers to the analyzing
and mixing of both quantitative and qualitative data during the research process within a single
study to better examine the research question (Creswell, 2002). The reasons for using this
strategy is that either quantitative or qualitative methods alone are not sufficient to thoroughly
explain the trends and details of the research question, in this case consumer perception of
products in a retail environment. When used in together quantitative and qualitative methods are
complementary and can lead to a more comprehensive analysis (Green, Caracelli, & Graham,
1989; Tashakkori & Teddie, 1998).

46
Table 1 Methodology, Strategy/Approach, and Phases
Methodology Quantitative and Qualitative Approaches
Strategy/Approach Sequential Explanatory Strategy
PHASE I Quantitative: Questionnaire
Sample 2 Samples: Middle East & USA, Each sample 4 groups Number of Sample
20 for each group, 80 for each sample. Visual Data
4 Artificial Lighting Types with 5 different products on each one Lighting Types Variation of LED (Cool and Warm), halogen, & Fluorescent lamps. Products used Apple, Cabbage, Ketchup, Soft Drinks, and cocktail Drinks.
Independent Variables
CULTURES: a. USA b. Middle-East
Dependent Variables PRODUCT PERCEPTION OF:
a. Price. b. Quality c. Freshness. d. Pleasantness e. Attractiveness
LIGHTING CHARACTERISTICS
a. Brightness b. Correlated Color Temperature c. Spatial Distribution
Moderators Age, Gender, Educational level.
Analysis o Descriptive information on age, gender, ethnicity, nationality, and
educational level is included. o Descriptive statistics such as means, modes, range, and standard
deviations for the dependent variable scores will be recorded. o Analysis of variance (One Way and Two Way ANOVA). o Chi Square Test o Ordinal Regression Test.
PHASE II Qualitative: Individual Interviews Sample Sequential Sampling
Number of Sample 10 Interviews with individuals from each culture sample population (US and Middle East)
Analysis Coding and thematic analysis
This study used a sequential explanatory strategy, consisting of two distinct phases (as
cited in Creswell, 2002, 2008; Creswell et al., 2003). In the first phase, the quantitative numeric
data was collected using a self-administered survey. The data was then subjected to a descriptive
and inferential analysis. The goal of the quantitative phase was to uncover any statistical
relationship between consumer cultural background and product perception through varying
lighting types, and to allow for purposeful selection of participants who would take part in the

47
individual interviews for the second phase. The second phase, (follow-up interviews) aided in
clarifying statistical relationships by having participants discuss aspects of lighting characteristics
like brightness, correlated color temperature, and spatial distribution. The rationale for this
approach is that quantitative data and results provide a general picture of the research problem,
(i. e. Do changes in ambient lighting affect product perception and do these changes differ across
different cultures), while the qualitative data and its analysis serve to refine and explain statistical
results by exploring participants’ views in more depth.
Figure 2. Research Design: Sequential Explanatory Strategy
The visual model of the procedures for the sequential explanatory design of this study is
represented in the figure (2) above. The priority in this design is given to the quantitative method,
because the quantitative research represents the major aspect of data collection and analysis in
the study, focusing on the exploration of any relationship between consumer cultural background,
product perception and lighting variations. The qualitative component acted as a follow up,
therefore appearing second in the sequence and is used to explain any relationships found in the
first phase by looking into lighting characteristics and shopping behavior. This study integrated
the quantitative and qualitative methods at the beginning of the qualitative phase while selecting
the participants for the follow-up interviews and developing the interview questions based on the
results of the statistical tests. The results of the two phases are discussed in findings section of
this study.
Phase I: Quantitative Data
Study Setting. The cultures selected for this study were American and Middle Eastern
cultures. However, there is a notable amount of diversity within both of these two populations. For
• Questionnaire • 2 Cultures • 4 groups in each Culture based on
Lighting Type
QUAN Data Collection
• Descriptive and Inferential Analysis
• Using SPSS • One Way ANOVA • Two Way ANOVA • Chi Square Test • Ordinal Regression
QUAN Data Analysis • Interviews
• 2 Cultures • 10 Interviews from each culture
qual Data Collection
• preliminary exploration of the data
• coding the data • developing themes • analyzing relationships between
themes in Narrative form
Qual Data Analysis • from QUAN and qual Data
Analysis
Interpretation of Results
Research Design: Sequential Explanatory Strategy

48
that reason, it is necessary to delimit the setting from which each population sample for the study
will be drawn. The study took place at Arizona State University, Tempe, Arizona. This location
was selected, as it provided a general student population from which to select both American and
Middle Eastern participants to represent potential consumers from those respective cultures.
Choosing these two population samples provided a sample of participants within a limited
geographic area in that way facilitating the process of data collection, while at the same time
meeting the requirements of grouping differences as noted in the literature review. Participants in
the Middle East sample were limited to individuals originating from the Arabic gulf region: Kuwait,
Saudi Arabia, Qatar, Bahrain, and the United Arab Emirates. The American participants were
represented by individuals born and raised in the contiguous United States. Further details on the
parameters of research participants are discussed in the section below entitled Articulation of
Population and Sampling Procedure.
Approach. A quantitative approach was taken to consolidate existing information and
relevant data regarding the relationships between consumer culture, product perception and
lighting variation. This study utilized quantitative methods of information verification regarding all
variables, thereby providing the opportunity for comparable future research in this field and
related fields. Questionnaires were used to collect data regarding visual perceptions and this data
was statistically analyzed for significant relationships.
The Sample. The two populations selected for the study were drawn from Middle Eastern
participants and American participants. As previously stated, the Middle Eastern population was
limited to the Arabian Gulf Area because of their relative similarity in culture and geography. This
group was limited to participants from Kuwait, Saudi Arabia, Qatar, Bahrain, and The United Arab
Emirates. The American population included participants from the contiguous United States;
therefore, Hawaii and Alaska were not included. This follows the methodology of previous cross-
cultural research in the field of impulse buying and retail atmospherics based on region samples
such as Kacen and Anne Lee’s 2002 study comparing Eastern consumers (Asians) and Western
consumers (Americans).

49
Table 2 Sample Population Overview
Define Population
Middle Eastern & American Consumers represented by students at ASU
Sample Frame
18 and above in age but mainly targeting 18-50, Males & Females
Sample size
80 from each population, divided into four groups, 20 participants in each group
Sampling Snowball sampling
Snowball sampling was used to identify both representative consumer populations: the
American participants and the Middle Eastern participants. Participants were recruited primarily
from the student body and staff of the university. To address the potential bias of acculturation, a
criterion for Middle Eastern participants was established to limit their presence in the U.S. to less
than four years. All Middle Eastern participants were born and raised in their home country, lived
in the U.S. for less than four years, and did not live outside their home country for more than six
months before coming to the U.S. The participants for the American sample were born and raised
in the U.S. and had not lived outside the U.S. for longer than six months before participating in
the study.
A sample size of 160 participants (80 participants from each culture) was selected in
order to assure a quality sample from which significant statistical calculations can be made, and
therefore results can be generalized to a larger population. This number was selected in a
response to a survey of literature suggesting that the sample be based on a reasonable
calculated margin of error listed as 1/√N (DePaulo 2000; Lenth 2001; Patel, Doku and Tennakoon
2003). Having a sample size of 160 participants would limit an estimate of margin of error to
approximately seven percent. This is a very stringent margin or error, well above the commonly
accepted realm for research studies of this nature (See DePaulo 2000).
Limitations were also set to avoid introducing additional variables of age and lighting
knowledge. The age of all participants was limited to a range of 18 to 50 years. This age range
was selected because of its relevance to impulse buying behavior. A review of literature on the
topic suggests that the role of atmospherics tend to be greater in a similar age range (Wood,
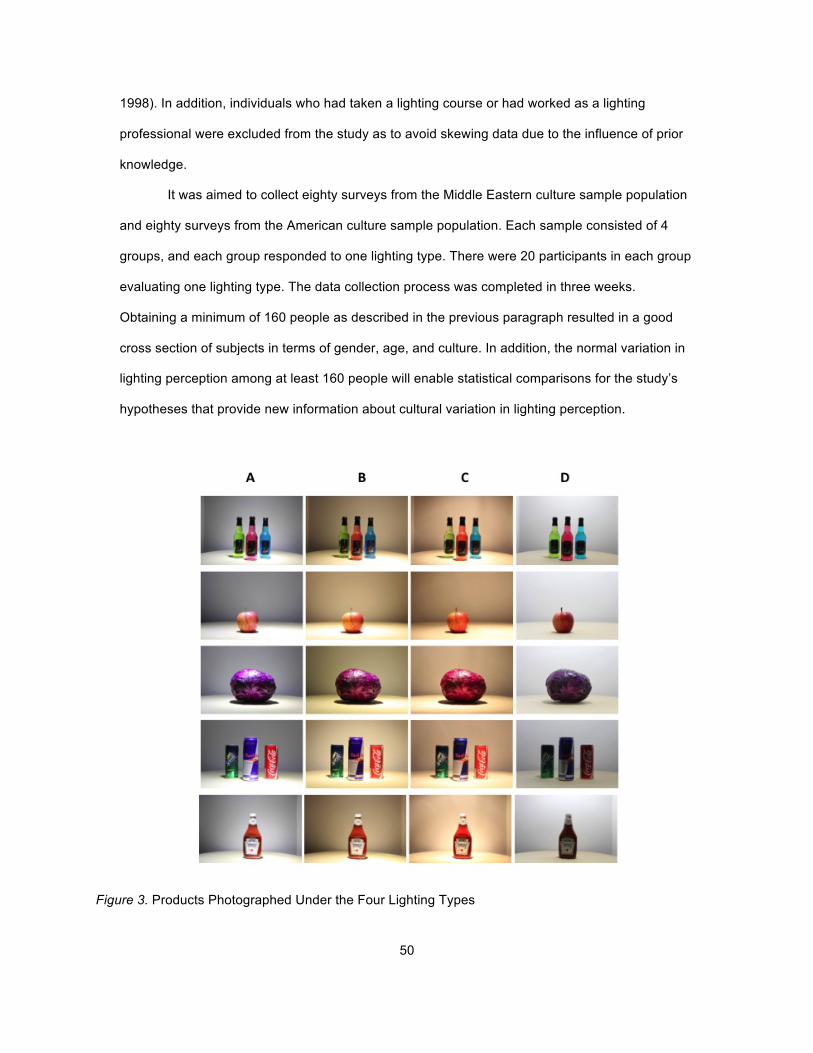
50
1998). In addition, individuals who had taken a lighting course or had worked as a lighting
professional were excluded from the study as to avoid skewing data due to the influence of prior
knowledge.
It was aimed to collect eighty surveys from the Middle Eastern culture sample population
and eighty surveys from the American culture sample population. Each sample consisted of 4
groups, and each group responded to one lighting type. There were 20 participants in each group
evaluating one lighting type. The data collection process was completed in three weeks.
Obtaining a minimum of 160 people as described in the previous paragraph resulted in a good
cross section of subjects in terms of gender, age, and culture. In addition, the normal variation in
lighting perception among at least 160 people will enable statistical comparisons for the study’s
hypotheses that provide new information about cultural variation in lighting perception.
Figure 3. Products Photographed Under the Four Lighting Types

51
Data Collection. Five products were placed and photographed under four different
lighting types to measure the influence of a consumer’s cultural background on lighting
preference and product perception. Each product tested one variable. The products were: an
apple, a cabbage, soft drinks, cocktail drinks, and ketchup. The lighting types that were used
were: variation of LED (warm LED and cool LED), halogen lamp, and fluorescent lamp. Table (3)
below shows the specifications of lamps used. The photographs were taken with the help of an
expert in photography.
This was a controlled experiment with participants from two different cultures for
comparison. The process for each participant in each population sample remained the same. The
participant filled out a questionnaire based on visual stimuli on a computer screen showing
images of the variation of lighting types and products. There were two versions of the
questionnaire, one specific to each culture (as reflected in demographic and acculturation
questions). Each survey questionnaire was composed of twenty-eight numbered items/questions
that were administered to each sample populations.
Table 3 Lamp Specifications
Product Company Lamp Wattage Color Designation FC at
Surface LED High Power Lamp China 7 w White 113 FC
LED High Power Lamp China 7 w Warm White 100 FC
Halogen Philips 50 w --- 141 FC 6400 Daylight WANSA 24 w Daylight 51 FC
In accordance with the ethics and requirements for human participants, informed consent
was obtained. The survey questionnaire was administered in a controlled setting located at the
Design School at Arizona State University. Each participant was assigned an individual 45-
minutes appointment to fill the questionnaire based on the images on the screen. Participants
were informed that the results of their survey forms would be kept confidential. After the survey
procedures were completed the collected data was entered to the computer using SPSS software

52
for statistical analysis. Findings will be discussed in a later section. The questionnaire was
employed to measure independent variables and dependent variables. These are outlined below
in Table (4).
Table 4 Independent and Dependent Variables
Variable Type Measure Culture Independent Product Perception Price Dependent 5 variation of prices Quality Dependent 7-point Likert-type scale Freshness Dependent 7-point Likert-type scale Pleasantness Dependent 7-point Likert-type scale Attractiveness Dependent 7-point Likert-type scale Lighting Characteristics Brightness Dependent Semantic Differential Scale: (Dim-Bright,
Glare-Non Glare, Hazy-Clear) Correlated Color Temperature
Dependent Semantic Differential Scale (Cool-Warm, Dull-Radiant, Colorless-Colorful)
Spatial Distribution Dependent Semantic Differential Scale (Vague-Distinct, Unfocused-Focused, Complex-Simple)
Independent Variables. The independent variable was consumer culture. As discussed
earlier, two samples were taken to represent two different consumer cultures. Middle Eastern
culture was chosen as one sample as represented by Middle Eastern students studying at ASU.
The other sample was American culture represented by American students studying at ASU.
Dependent Variables. The dependent variables were product perception under different
lighting conditions. The dependent variable of product perception in this study was measured by
two main factors: Product impression/perception, and Lighting Characteristics. Product
Perception was measured in terms of Quality, Freshness, Pleasantness, and Attractiveness.
These variables were measured on a 7-point Likert-type scale in the questionnaire. Only the
variable of Price was assessed differently, five options were provided instead of a 7-point Likert
scale. Lighting characteristics were measured based on Brightness, Correlated Color
Temperature, and Spatial Distribution. These variables were measured using a Semantic
Differential Scale for measuring lighting impression developed by John E. Flynn, et al. (1979). For
53
the tests to have statistical power, each variable was represented by at least three items on the
scale in the survey instrument.
The Questionnaire. For the Middle Eastern participants, all questionnaires were in
English and the main terms were provided in Arabic in order to avoid bias related to language
issues. As noted earlier, one criterion for the Middle Eastern sample selection is that participants
lived in the U.S. under four years, a standard chosen in order to reduce their acculturation. In
keeping with the practice of controlling for functional equivalence in cross- cultural research, the
translation and back-translation methods (Ember & Ember, 2001) were used.
Methods of Analysis. After data from the questionnaire was collected, it was analyzed
and documented in spreadsheets. SPSS, Statistical Package for Social Sciences was used for
statistical analyses due to its efficiency in the process of analyzing data in various ways.
In order to provide a snap shot of the sample from which data was collected, descriptive
information on moderating variables such as age, gender, ethnicity, nationality, and educational
level were included. Also descriptive statistics such as means, modes, range, and standard
deviations for the dependent variable scores were recorded. Frequency tables were used to
organize this information. To determine the relationship between the dependent variables, one-
way and two way (ANOVA) tests were used in addition to Chi-squared tests and Ordinal
Regression tests. These measures were used to examine and determine if there are any
significant differences among the scores and moderator variables. The results from the analyzed
data were used to suggest guidelines for retail lighting design as discussed in detail in the
Analysis and Discussion in Chapter IV.
Phase II: Qualitative Data
The second, qualitative phase of the study focused on explaining the results of the
statistical tests, obtained in the first, quantitative phase. The follow-up interview approach was
used for collecting and analyzing qualitative data. This section of the study addressed topics that
arose out of from statistical analyses of quantitative data. These interviews involved discussions
of lighting characteristics such as: lighting brightness, correlated color temperature and spatial

54
distribution. Interviews also included discussions of shopping behavior and the effects of lighting
on mood and impulse buying.
Study Setting. This phase of the study was conducted on the campus of Arizona State
University, Tempe, in Design School. Further details on the parameters of Phase II are discussed
in the section below.
The Sample. Due to the sequential nature of the research design of this study,
participants from Phase I were recruited to participate in Phase II. In the introductory/consent
letter, participants were given the choice to leave their contact information if they had a desire to
participate in Phase II. Those who left their contact information were requested to participate in
the follow up interviews of Phase II.
Data Collection. Using a follow-up interview framework in this section, this study was
able to explore statistical relationships found in Phase I in more detail. Twenty follow-up
interviews were conducted with 10 interviews conducted for each culture sample population.
Each follow-up interview lasted between 30-45 minutes. Participants were able to give direct
feedback regarding particular lighting characteristics and shopping behavior. The follow-up
interview protocol included twenty-four open-ended questions. The content of the protocol
questions were grounded in the results of the statistical tests of the relationships between
consumer cultural background, product perception, and lighting variations, and will elaborate on
them. Of particular importance were issues of buying behavior and impulse purchases, mood
and the overall shopping experience. Questions focused on aspects of lighting characteristics
such as brightness (low vs. high), correlated color temperature (cool vs. warm), and spatial
distribution of light (uniformed light vs. non-uniformed light).
It is important to note that the protocol for interviews were first tested in pilot interviews
consisting from 3 student colleagues, however this data was excluded from the full study results.
A debriefing with participants was conducted in this pilot study to obtain information regarding the
clarity of the interview questions and their relevance to the study aim. This information was then
used to modify interview questions for the official study.

55
Method of Analysis. For the purpose of the analysis, the follow-up interviews were audio
recorded and then transcribed. Notes of the important points mentioned during the interviews
were taken. The text and image data obtained through the follow-up interviews were assessed
and analyzed for key impressions then recorded in narrative form.
The steps used in qualitative analysis included: (1) preliminary exploration of the data by
reading through the transcripts and writing notes; (2) coding the data by segmenting and labeling
the text; (3) using codes to develop themes by grouping similar codes together; (4) analyzing
relationships between themes (as outlined in Creswell, 2002).
Verification. In qualitative research assessing validity differs from measures of validity in
quantitative research, which are of a statistical nature. In qualitative methods, the researcher
develops a relationship of trust with participants therefore the responses given by participants are
expected to be based on believability, coherence, insight, and trust (Eisner, 1998; Lincoln &
Guba, 1985). In qualitative research, the researcher establishes a relationship of trust with
participants using honesty and offering transparency when outlining their position, assumptions,
methods and the limitations of their study (Creswell, 2003).
In ensuring internal validity, the following strategies were employed:
1. Triangulation of data – Data was collected through multiple sources of information (i.e.
audio recording, transcript, notes)
2. External audit – asking a person outside the research project to conduct a thorough
review of the study and report back.
3. Clarification of researcher bias – This aspect was addressed in the assumptions section
in this chapter and further delineated in the limitations of this study.
Advantages and Limitations of Sequential Explanatory Approach
A number of researchers have discussed both the strength and weaknesses of a
Sequential Explanatory Approach. The following list of advantages and disadvantages have been
compiled according to the works of various leading researchers in this field (See Creswell, 2002;
Creswell, Goodchild, & Turner, 1996; Green & Cracelli, 1997; Morse, 1991; Moghaddam, Walker,
& Harre, 2003).
56
Advantages of this design include:
1. It is an easy to implement approach for a single researcher, as it is sequentially proceeds
from one stage to another.
2. Sequential explanatory design is useful for exploring quantitative results in more detail.
3. This design is especially useful when unexpected results from a quantitative study.
The limitations of this design include:
1. It requires a good amount of time to complete.
2. It requires feasibility of resources to collect and analyze both types of data.
3. Quantitative results of the first phase may show no significant results.
Ethical Considerations
Ethical issues were addressed at each phase in the study. In fulfillment with the
regulations of the Institutional Review Board (IRB), the permission for conducting the research
was obtained. The application for research permission contained the description of the project
and its significance, methods and procedures, participants, and research status. Participants
were informed that their collaboration in this study was completely voluntary and they were free to
discontinue at any time. The anonymity of participants was protected by numerically coding each
returned questionnaire. Responses were kept confidential. Follow-up interviews participants were
assigned fictitious names for use in reporting the results. All study data, including the survey
papers, interview recordings, and transcripts, were kept in locked file cabinets and will be
destroyed after a reasonable period of time. Participants were told summary data will be
distributed to the professional community, but in no way will it be possible to trace responses to
individuals. Every consideration was taken to protect the identities of participants and follow the
strictest ethical guidelines.
Assumptions
While exploring consumer product perception and lighting preference, several relevant
assumptions were made:
1. Respondents understood and answered the self-administered questionnaire truthfully and
accurately.
57
2. The instrument used for collecting data, a self-administered questionnaire; accurately
measured the perceptions of the respondents regarding lighting preference and product
perception.
3. The photographs taken were assumed to be representative of the actual lighting condition.
4. The chosen participants were assumed to have been representative of the specific targeted
sample population – American and Middle Eastern consumers.
5. Participants in the interview phases were assumed to have given honest feedback in a
safe, neutral environment.
Chapter Summary
This research used both quantitative and qualitative approaches to investigate the effect
of ambient light on consumer perception of products, and whether or not there may be differences
in perception between American consumers and Middle Eastern consumers. Sample populations
were represented by Middle Eastern and American students at Arizona State University. All
ethnical standards were met with careful concern given to the anonymity of participants. This
research has discussed in detail the sequential explanatory strategy that was employed and how
using such a strategy provides benefits in terms of both breadth and depth of data collection and
analysis. Findings based upon these methods used will be discussed in detail in Chapter 4.
58
CHAPTER IV
ANALYSIS OF DATA
Overview
Chapter IV presents the results of both the quantitative and qualitative analyses. The
data was collected and analyzed in response to the research questions that provide the basis for
this thesis. Two fundamental goals drove the collection of the data and the subsequent data
analysis. These goals were to determine if there is an affect of ambient lighting variation on
product perception measured in through the variables of price, quality, freshness, pleasantness,
and attractiveness, and if this does differ across cultures, which lighting characteristics are
responsible for this effect. The findings presented in this chapter demonstrate the potential for
merging theory and practice in terms of what can be measured and assessed in an academic
environment and then applied to the field of lighting and design. Each phase is analyzed and
discussed separately, followed by a discussion of the integration of findings from both phases.
The chapter concludes with a summary highlighting key results. .
Analysis of Phase I: Quantitaive Data
Characteristics of Sample Populations. In this section, characteristics and background
information for participants in both cultural population samples is discussed and compared.
USA Sample. The American participants were limited to the contiguous United States;
therefore, Hawaii and Alaska were not included. They were recruited primarily from ASU student
body. The criteria for the American participants were that they must be born and raised in the
U.S. and had not lived outside the U.S. for longer than six months before participating in the
study. In addition, they could not have taken any lighting courses or worked professionally in
Lighting Design Industry.
A total of 86 subjects participated in the study. Three of the 85 participants were
eliminated from the study prior to analysis. One female subject is Hawaiian and lived most of her
life in Hawaii. The other had lived outside the U.S. for more than six months before participating
in the study. The other participant had taken a theatre lighting course. Therefore, 83 American
participants met the requirements for participating in the study.

59
Table 5 Characteristics of Sample Populations
USA (N = 83) Middle East (N = 81) Total (N= 164)
Characteristics N % N % N %
Gender Female 40 48.2 26 32.1 66 40.2 Male 43 51.8 55 67.9 98 59.8
Age 18 – 24 63 75.9 61 75.3 124 75.6 25 – 29 11 13.3 14 17.3 25 15.2 30 -34 5 6 5 6.2 10 6.1 35 – 39 2 2.4 1 1.2 3 1.8 40 and over 2 2.4 0 0 2 1.2
Educational Level Graduate 21 25.3 14 17.3 35 21.3 Undergraduate 62 74.7 67 82.7 129 78.7
Ethnicity White American 58 69.9 - - - - Black American 2 2.4 - - - - Asian American 2 2.4 - - - - Two or more races 9 10.8 - - - -
Native American and Alaskan Native 3 3.6 - - - -
Other/Not Specified 9 10.8 - - - -
Country Kuwait - - 42 51.9 - - Saudi Arabia - - 33 40.7 - - Qatar - - 2 2.5 - - United Arab Emirates - - 4 4.9 - - Bahrain - - 0 0 - -
Middle Eastern Sample. The Middle Eastern participants were recruited primarily from
the ASU student body. To limit the effects of acculturation in this study on cross-cultural
comparisons, the researcher aimed to recruit relatively new residents of the United States. Thus,
the residency criterion for the study was limited to less than four years in order to reach a sample
size of 80 participants.
As mentioned in the previous chapter, the criteria for the Middle Eastern sample selection
were: (1) born and raised in their home country; (2) had been in the U.S. for less than four years;
(3) had not lived outside their home country for more than six months before coming to the U.S.;
(4) from one of the following countries: Kuwait, Saudi Arabia, Bahrain, Qatar, and United Arab
60
Emirates (5) had not studied any lighting courses or worked as a professional exercising lighting
knowledge.
84 subjects were initially recruited for this study. However. Two participants were deemed
to not fit the outlined criteria. One participant was Middle Eastern but not from the countries
mentioned. Although he is considered Middle Eastern, he was excluded from the study in order to
maintain uniformity within the criteria of the study. The other two participants lived in the U.S. for
more than four years, and therefore were also excluded. A total of 81 Middle Eastern participants
met the requirements of participation were selected for this study.
Sample Comparison and Bias. The participants in this study consisted of 164 adults. All
subjects were divided into two populations; 83 American participants and 81 Middle Eastern
participants. Table (5) shows the frequency distribution of the general characteristics of the
participants in each of the population tested.
The sample provided a good balance between both culture populations. Subjects’ ages
for both American and Middle Eastern were limited to the range of 18 to 39, with only 2 American
subjects above 40 years. The modal age of the American subjects was 18-24 (75.9%) years old.
The modal age of the Middle Eastern subjects was also 18-14 (75.3%) years old. There is no
significant difference between the two cultures in terms of age, as the variances of the two groups
are equal (F = 2.764, p = 0.098) and the difference in means is not significant (t = 0.719, p =
0.473).
There is also no significant difference between the two cultures in terms of educational
level, as the variances of the two groups are not equal (F=6.406, p = 0.012) but the difference in
means is not significant (t=1.253, p = 0.212). There appears to be no bias in how lighting type
groups were assigned to subjects. The distribution of lighting types given to subjects did not differ
by age (p = 0.247), gender (p = 0.567), culture (p = 0.989), or education (p = 0.183).
The 83 subjects in the American population included 40 female participants (48.2%) and
43 male participants (51.8%). While the 81 subjects in the Middle Eastern population included 26
female participants (32.1%) and 55 male participants (67.9%). In terms of gender, the Middle

61
Eastern population had more male participants than the American population (p = 0.040). This
dues to the fact that more Middle Eastern males studying abroad than females.
Analytical Tests Conducted. The remainder of this section discusses the tests and
findings based on the research questions outlined in Chapter I. Descriptive statistics of the means
and standard deviations are presented for answering the following research questions. Q1; Do
changes in ambient lighting affect product perception (measured in terms of Price, Quality,
Freshness, Pleasantness, and Attractiveness)? Q2; If so, then do these lighting changes affecting
product perception differ across different cultures? Q3: What lighting characteristics are
responsible/causing these changes in product perception across different cultures?
The numerical data for question 1 examining the effects of ambient lighting was analyzed
using one-way ANOVA. (The analysis was not performed with regard to culture.) The numerical
data for question 2 examining how lighting affects product perception across cultures were
analyzed using analysis of variance (two-way ANOVA) and Chi-square test. The reason for that
is, participants in each sample population (American and Middle Eastern) evaluated lighting
twice: the first evaluation assessed products without the participants being directly aware of the
lighting (ANOVA test used) and the second evaluation had the participants evaluate four different
lighting types (Chi-square test used). Chi-square analysis was performed on the categorical data
based on the comparative evaluations of the four lighting types on perceptions of price, quality,
freshness, pleasantness, and attractiveness. Frequency data was provided regarding lighting
preferences based on each variable (price, quality, freshness, pleasantness, and attractiveness)
and lighting type (Cool LED, Warm LED, Halogen, and Fluorescent) for each culture population.
With respect to question 3, examining which lighting characteristics may be responsible for
differences in product perception, a means rating, analysis of variance (one-way ANOVA), and
ordinal regression tests were performed in order to establish which lighting characteristic
measures were significant.
The standard alpha level of 0.05 was used to determine statistical significance. This
provides a high degree of confidence for this study in that 95% of the variation seen in the data
62
can be explained by the specific variables tested and only 5% of the variation in participants’
responses cannot be explained by the variables tested.
Question 1. Do changes in ambient lighting affect product perception? Measured in
terms of: (a) Price, (b) Quality, (c) Freshness, (d) Pleasantness, (e) Attractiveness. Subjects
viewed products under the four different lighting types (Cool LED, Warm LED, Halogen, and
Fluorescent) and estimated price according to the five options they were given. In addition,
responses using the bipolar adjectives on a seven-point likert-type scale were used to assess the
subjects’ perceptions of Quality, Freshness, Pleasantness, and Attractiveness under the four
different lighting types (Cool LED, Warm LED, Halogen, and Fluorescent). Table (6) displays the
N (number of participants), mean, and standard deviation scores for main effects of lighting type
on product perception.
One-Way ANOVA. The analysis of variance (one-way ANOVA) test was performed to
detect any significant effect of ambient lighting (Cool LED, Warm LED, Halogen, and Fluorescent)
and product perception (in terms of Price, Quality, Freshness, Pleasantness, and Attractiveness)
for inferential analysis. The results are summarized in Table (6). Results in Table (7) suggest that
there does not appear to be a significant correlation between the four lighting types and five
dependent variables of perception. Each Independent variable is discussed below:
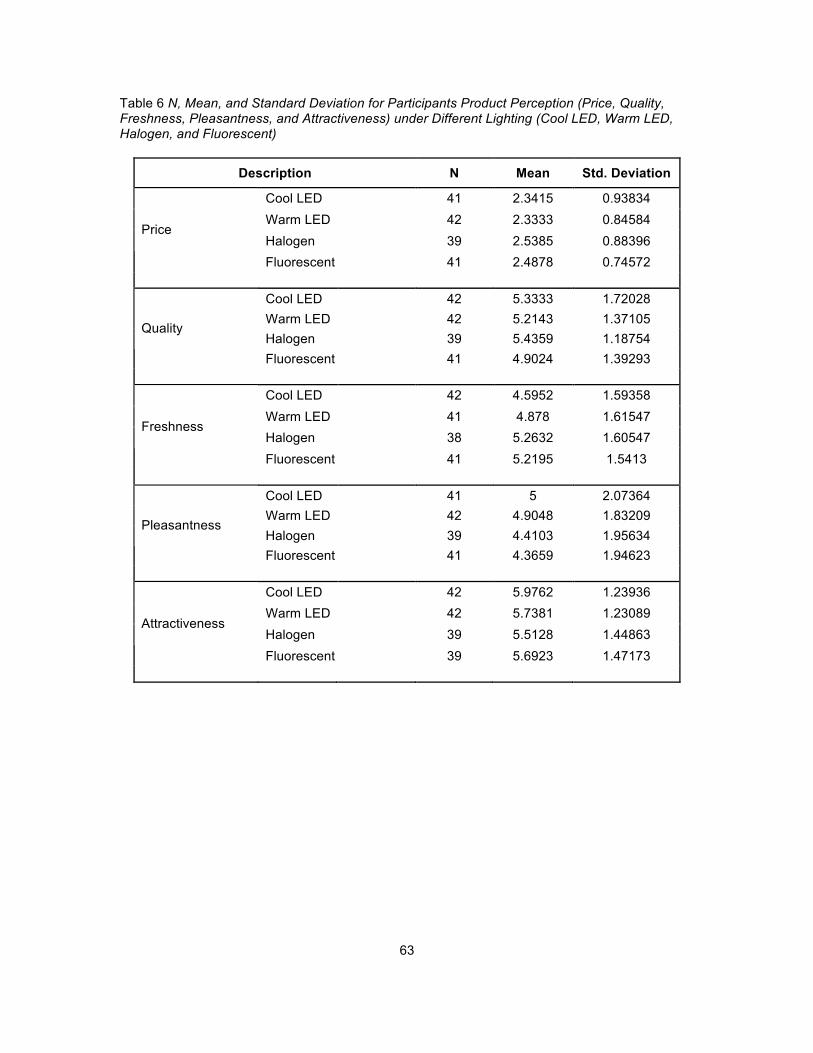
63
Table 6 N, Mean, and Standard Deviation for Participants Product Perception (Price, Quality, Freshness, Pleasantness, and Attractiveness) under Different Lighting (Cool LED, Warm LED, Halogen, and Fluorescent)
Description N Mean Std. Deviation
Cool LED 41 2.3415 0.93834 Warm LED 42 2.3333 0.84584 Halogen 39 2.5385 0.88396
Price
Fluorescent 41 2.4878 0.74572
Cool LED 42 5.3333 1.72028 Warm LED 42 5.2143 1.37105 Halogen 39 5.4359 1.18754
Quality
Fluorescent 41 4.9024 1.39293
Cool LED 42 4.5952 1.59358 Warm LED 41 4.878 1.61547 Halogen 38 5.2632 1.60547
Freshness
Fluorescent 41 5.2195 1.5413
Cool LED 41 5 2.07364 Warm LED 42 4.9048 1.83209 Halogen 39 4.4103 1.95634
Pleasantness
Fluorescent 41 4.3659 1.94623
Cool LED 42 5.9762 1.23936 Warm LED 42 5.7381 1.23089 Halogen 39 5.5128 1.44863
Attractiveness
Fluorescent 39 5.6923 1.47173
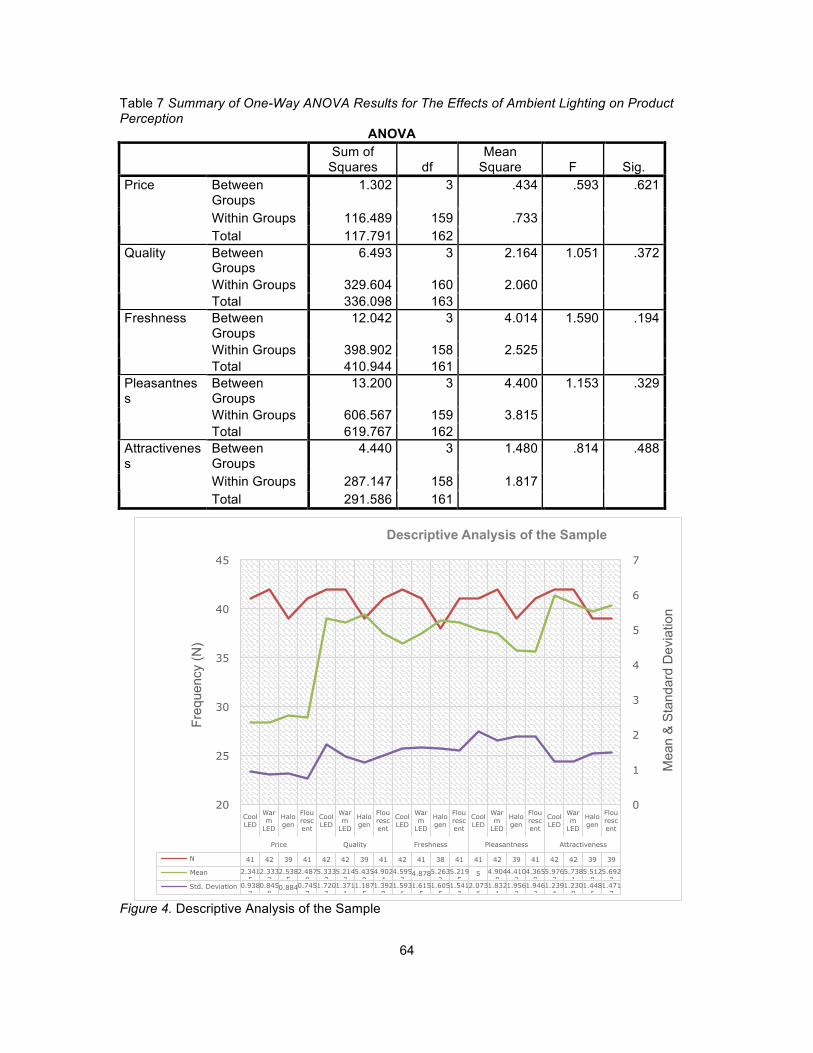
64
Table 7 Summary of One-Way ANOVA Results for The Effects of Ambient Lighting on Product Perception
ANOVA
Sum of Squares df
Mean Square F Sig.
Between Groups
1.302 3 .434 .593 .621
Within Groups 116.489 159 .733
Price
Total 117.791 162 Between Groups
6.493 3 2.164 1.051 .372
Within Groups 329.604 160 2.060
Quality
Total 336.098 163 Between Groups
12.042 3 4.014 1.590 .194
Within Groups 398.902 158 2.525
Freshness
Total 410.944 161 Between Groups
13.200 3 4.400 1.153 .329
Within Groups 606.567 159 3.815
Pleasantness
Total 619.767 162 Between Groups
4.440 3 1.480 .814 .488
Within Groups 287.147 158 1.817
Attractiveness
Total 291.586 161
Figure 4. Descriptive Analysis of the Sample
Cool LED
Warm
LED
Halogen
Flourescent
Cool LED
Warm
LED
Halogen
Flourescent
Cool LED
Warm
LED
Halogen
Flourescent
Cool LED
Warm
LED
Halogen
Flourescent
Cool LED
Warm
LED
Halogen
Flourescent
Price Quality Freshness Pleasantness Attractiveness
N 41 42 39 41 42 42 39 41 42 41 38 41 41 42 39 41 42 42 39 39
Mean 2.3415
2.3333
2.5385
2.4878
5.3333
5.2143
5.4359
4.9024
4.5952
4.878 5.2632
5.2195
5 4.9048
4.4103
4.3659
5.9762
5.7381
5.5128
5.6923
Std. Deviation 0.9383
0.8458
0.884 0.7457
1.7203
1.3711
1.1875
1.3929
1.5936
1.6155
1.6055
1.5413
2.0736
1.8321
1.9563
1.9462
1.2394
1.2309
1.4486
1.4717
0
1
2
3
4
5
6
7
20
25
30
35
40
45
Mea
n &
Sta
ndar
d D
evia
tion
Freq
uenc
y (N
)
Descriptive Analysis of the Sample
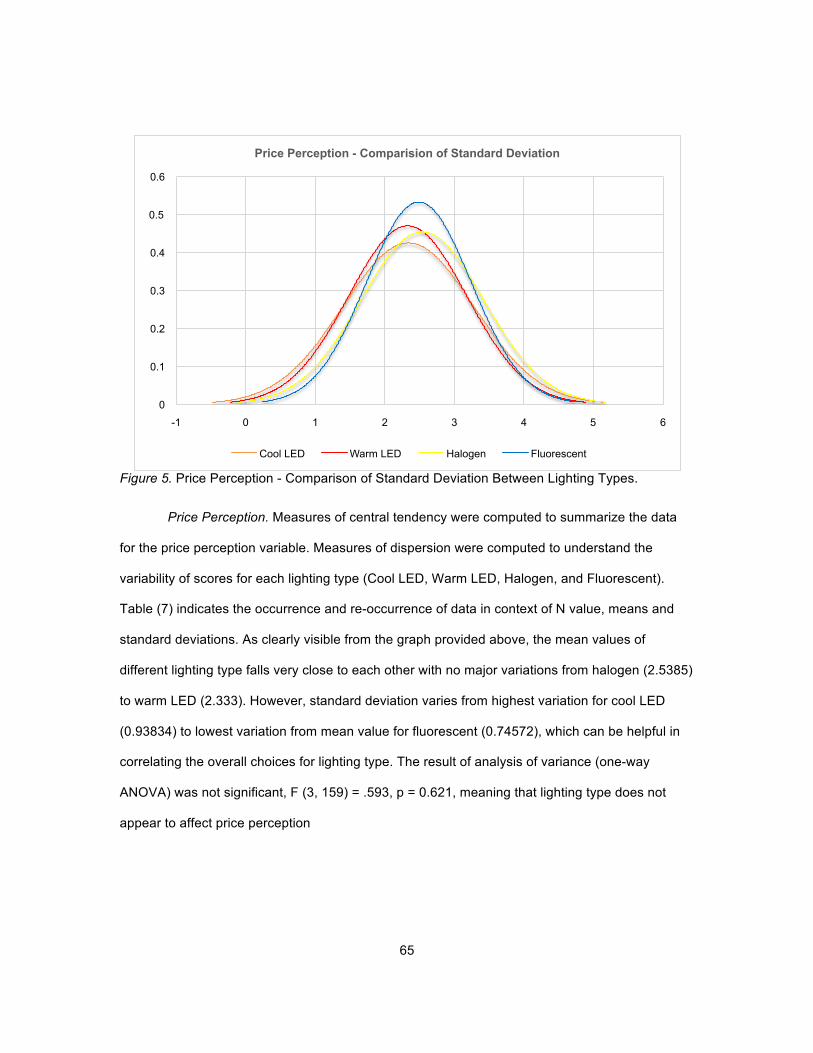
65
Figure 5. Price Perception - Comparison of Standard Deviation Between Lighting Types.
Price Perception. Measures of central tendency were computed to summarize the data
for the price perception variable. Measures of dispersion were computed to understand the
variability of scores for each lighting type (Cool LED, Warm LED, Halogen, and Fluorescent).
Table (7) indicates the occurrence and re-occurrence of data in context of N value, means and
standard deviations. As clearly visible from the graph provided above, the mean values of
different lighting type falls very close to each other with no major variations from halogen (2.5385)
to warm LED (2.333). However, standard deviation varies from highest variation for cool LED
(0.93834) to lowest variation from mean value for fluorescent (0.74572), which can be helpful in
correlating the overall choices for lighting type. The result of analysis of variance (one-way
ANOVA) was not significant, F (3, 159) = .593, p = 0.621, meaning that lighting type does not
appear to affect price perception
0
0.1
0.2
0.3
0.4
0.5
0.6
-1 0 1 2 3 4 5 6
Price Perception - Comparision of Standard Deviation
Cool LED Warm LED Halogen Fluorescent

66
Figure 6. Quality Perceptions - Comparison of Standard Deviation Between Lighting Types.
Quality Perception. Measures of central tendency were computed to summarize the data
for the quality perception variable. Measures of dispersion were computed to understand the
variability of scores for each lighting type (Cool LED, Warm LED, Halogen, and Fluorescent).
Table (7) indicates the occurrence and re-occurrence of data in context of N value, means and
standard deviations. As visible in the graph provided above, mean value varies from Halogen
(5.4359) as highest with standard deviation as minimum (1.18754) for and fluorescent (4.9024)
mean value is lowest. Cool LED has highest standard deviation values (1.72028) which is helpful
to generate the comparison of all different lighting suitable for quality as a product measure. The
result of analysis of variance (one-way ANOVA) was not significant, F (3, 160) = 1.051, p = 0.372,
meaning that lighting type does not appear to affect quality perception.
0
0.05
0.1
0.15
0.2
0.25
0.3
0.35
0.4
0 2 4 6 8 10 12
Quality Perception - Comparision of Standard Deviation
Cool LED Warm LED Halogen Fluorescent

67
Figure 7. Freshness Perception - Comparison of Standard Deviation.
Freshness Perception. Measures of central tendency were computed to summarize the
data for the freshness perception variable. Measures of dispersion were computed to understand
the variability of scores for each lighting type (Cool LED, Warm LED, Halogen, and Fluorescent).
Table (7) indicates the occurrence and re-occurrence of data in context of N value, means and
standard deviations. As visible from graph provided above, for freshness, cool LED has minimum
mean value (4.5952) and moderate standard deviation value (1.59358) for overall value choosing
it as best lighting type for the freshness as product measure. Warm LED has got highest standard
deviation value (1.61547), which makes it the least preferable lighting type in the given case. The
result of analysis of variance (one-way ANOVA) was not significant, F (3, 158) = 1.590, p = 0.194,
meaning that lighting type does not appear to affect freshness perception.
0
0.05
0.1
0.15
0.2
0.25
0.3
-2 0 2 4 6 8 10 12
Freshness Perception - Comparision of Standard Deviation
Cool LED Warm LED Halogen Fluorescent
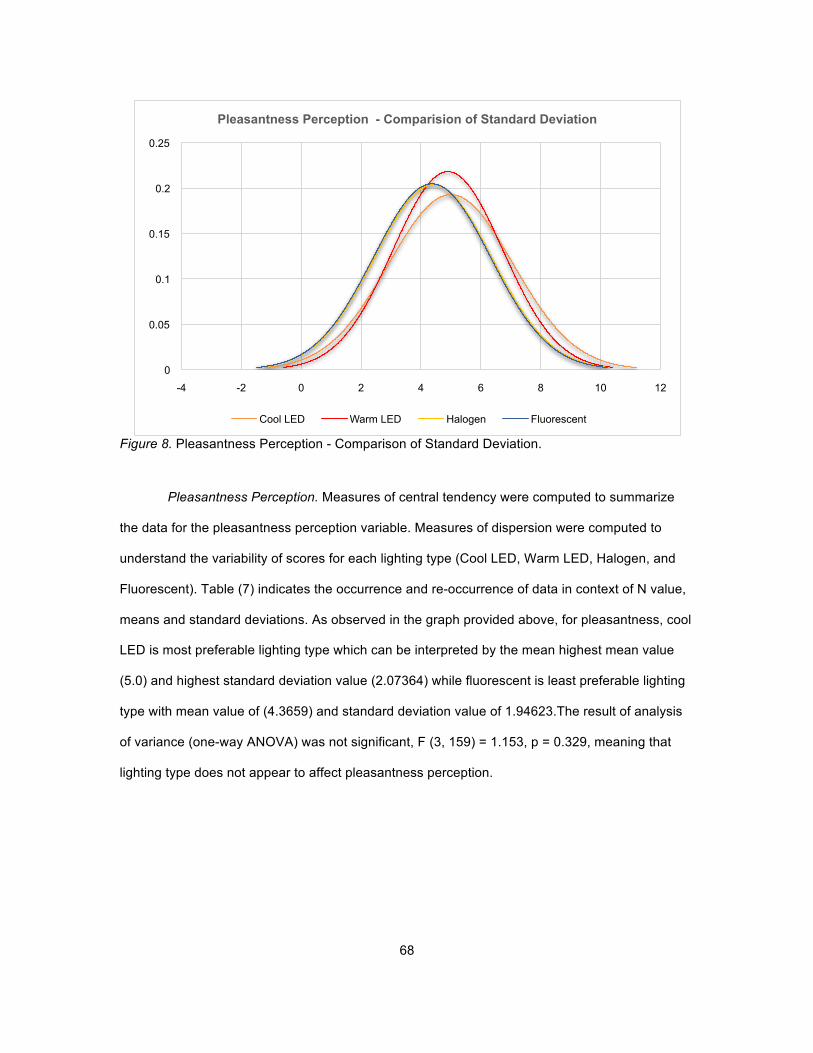
68
Figure 8. Pleasantness Perception - Comparison of Standard Deviation.
Pleasantness Perception. Measures of central tendency were computed to summarize
the data for the pleasantness perception variable. Measures of dispersion were computed to
understand the variability of scores for each lighting type (Cool LED, Warm LED, Halogen, and
Fluorescent). Table (7) indicates the occurrence and re-occurrence of data in context of N value,
means and standard deviations. As observed in the graph provided above, for pleasantness, cool
LED is most preferable lighting type which can be interpreted by the mean highest mean value
(5.0) and highest standard deviation value (2.07364) while fluorescent is least preferable lighting
type with mean value of (4.3659) and standard deviation value of 1.94623.The result of analysis
of variance (one-way ANOVA) was not significant, F (3, 159) = 1.153, p = 0.329, meaning that
lighting type does not appear to affect pleasantness perception.
0
0.05
0.1
0.15
0.2
0.25
-4 -2 0 2 4 6 8 10 12
Pleasantness Perception - Comparision of Standard Deviation
Cool LED Warm LED Halogen Fluorescent
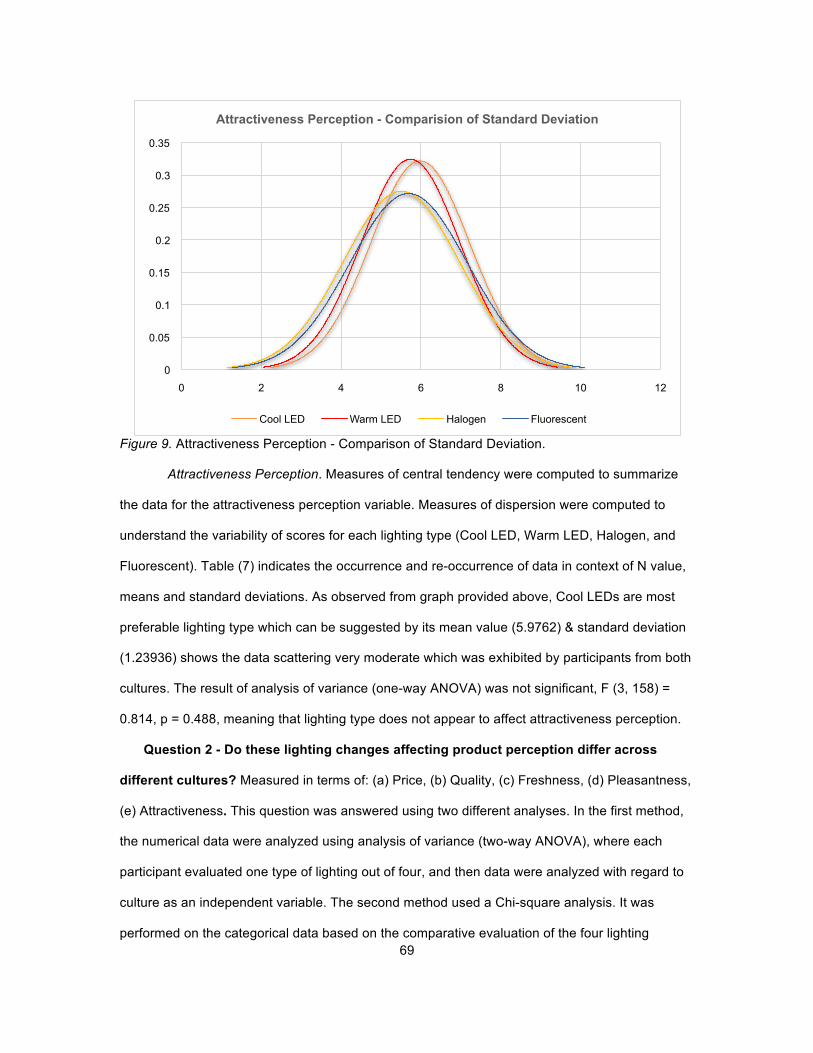
69
Figure 9. Attractiveness Perception - Comparison of Standard Deviation.
Attractiveness Perception. Measures of central tendency were computed to summarize
the data for the attractiveness perception variable. Measures of dispersion were computed to
understand the variability of scores for each lighting type (Cool LED, Warm LED, Halogen, and
Fluorescent). Table (7) indicates the occurrence and re-occurrence of data in context of N value,
means and standard deviations. As observed from graph provided above, Cool LEDs are most
preferable lighting type which can be suggested by its mean value (5.9762) & standard deviation
(1.23936) shows the data scattering very moderate which was exhibited by participants from both
cultures. The result of analysis of variance (one-way ANOVA) was not significant, F (3, 158) =
0.814, p = 0.488, meaning that lighting type does not appear to affect attractiveness perception.
Question 2 - Do these lighting changes affecting product perception differ across
different cultures? Measured in terms of: (a) Price, (b) Quality, (c) Freshness, (d) Pleasantness,
(e) Attractiveness. This question was answered using two different analyses. In the first method,
the numerical data were analyzed using analysis of variance (two-way ANOVA), where each
participant evaluated one type of lighting out of four, and then data were analyzed with regard to
culture as an independent variable. The second method used a Chi-square analysis. It was
performed on the categorical data based on the comparative evaluation of the four lighting
0
0.05
0.1
0.15
0.2
0.25
0.3
0.35
0 2 4 6 8 10 12
Attractiveness Perception - Comparision of Standard Deviation
Cool LED Warm LED Halogen Fluorescent
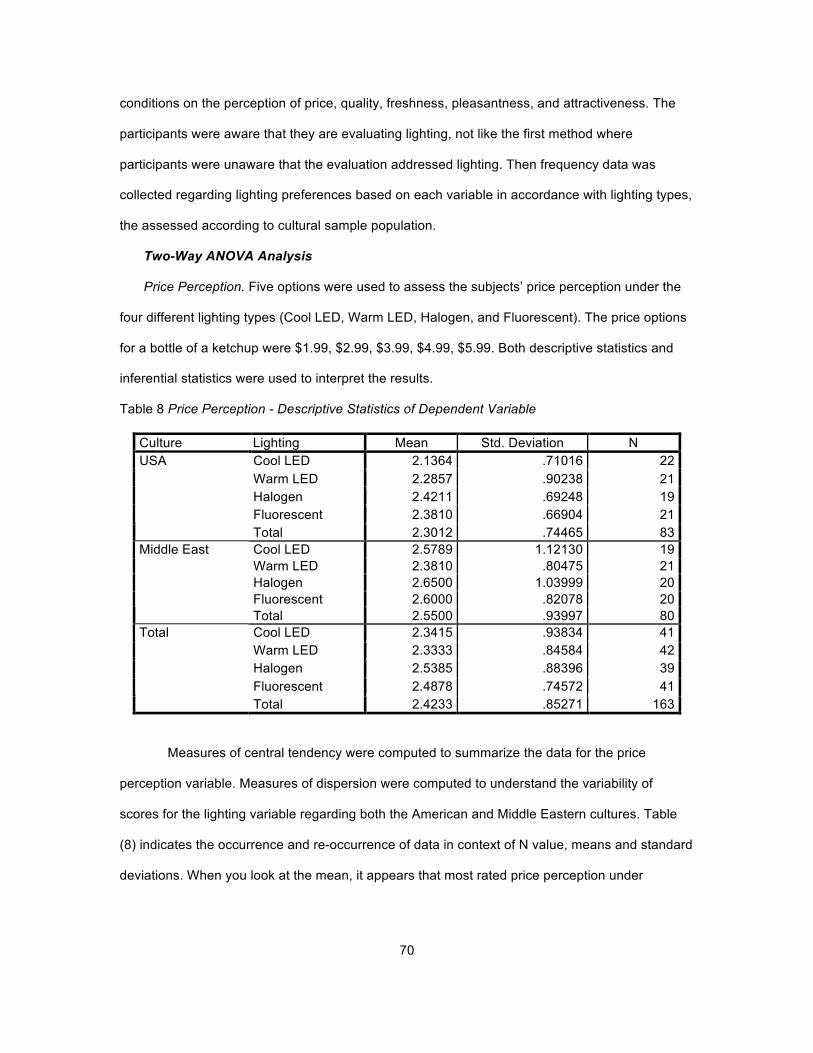
70
conditions on the perception of price, quality, freshness, pleasantness, and attractiveness. The
participants were aware that they are evaluating lighting, not like the first method where
participants were unaware that the evaluation addressed lighting. Then frequency data was
collected regarding lighting preferences based on each variable in accordance with lighting types,
the assessed according to cultural sample population.
Two-Way ANOVA Analysis
Price Perception. Five options were used to assess the subjects’ price perception under the
four different lighting types (Cool LED, Warm LED, Halogen, and Fluorescent). The price options
for a bottle of a ketchup were $1.99, $2.99, $3.99, $4.99, $5.99. Both descriptive statistics and
inferential statistics were used to interpret the results.
Table 8 Price Perception - Descriptive Statistics of Dependent Variable
Culture Lighting Mean Std. Deviation N Cool LED 2.1364 .71016 22 Warm LED 2.2857 .90238 21 Halogen 2.4211 .69248 19 Fluorescent 2.3810 .66904 21
USA
Total 2.3012 .74465 83 Cool LED 2.5789 1.12130 19 Warm LED 2.3810 .80475 21 Halogen 2.6500 1.03999 20 Fluorescent 2.6000 .82078 20
Middle East
Total 2.5500 .93997 80 Cool LED 2.3415 .93834 41 Warm LED 2.3333 .84584 42 Halogen 2.5385 .88396 39 Fluorescent 2.4878 .74572 41
Total
Total 2.4233 .85271 163
Measures of central tendency were computed to summarize the data for the price
perception variable. Measures of dispersion were computed to understand the variability of
scores for the lighting variable regarding both the American and Middle Eastern cultures. Table
(8) indicates the occurrence and re-occurrence of data in context of N value, means and standard
deviations. When you look at the mean, it appears that most rated price perception under

71
different lighting very closely between the two cultural groups. However, based on the large
standard deviation, it looks like the distribution of responses varied quite a bit (See Figure 10 and
Figure 11).
Figure 10. American Price Perception - Comparison of Standard Deviation.
Figure 11. Middle East Price Perception - Comparison of Standard Deviation.
0
0.1
0.2
0.3
0.4
0.5
0.6
-2 -1 0 1 2 3 4 5 6 7
Middle East Price Perception - Comparision of Standard Deviation
Cool LED Warm LED Halogen Fluorescent
0
0.1
0.2
0.3
0.4
0.5
0.6
0.7
-1 0 1 2 3 4 5 6
American Price Perception - Comparision of Standard Deviation
Cool LED Warm LED Halogen Fluorescent

72
Lighting variations may contribute to product price perception, but that affect may differ
across cultural groups. A two-way analysis of variance tested price perception of product under
four lighting conditions (Cool LED, Warm LED, Halogen, Fluorescent) among American
participants and Middle Eastern participants. Lighting variation showed no significant effect on
price perception (F (3) = 0.396, P = 0.655). Participants of different cultural groups also show no
significant effect of culture on price perception (F (1) = 3.375, P = .068). The interaction of lighting
variation and cultural group was also not significant (F (3) = .293, P = .830). The results of the
analysis of variance (two-way ANOVA) are summarized in Table (9).
Table 9 Summary of Two-Way ANOVA results for the affect of Ambient Lighting on Price Perception among cultures.
Tests of Between-Subjects Effects Dependent Variable: Price
Source Type III Sum of
Squares df Mean Square F Sig. Corrected Model 4.397a 7 .628 .859 .541 Intercept 959.613 1 959.613 1311.704 .000 Culture 2.469 1 2.469 3.375 .068 Lighting 1.189 3 .396 .542 .655 Culture * Lighting .643 3 .214 .293 .830 Error 113.395 155 .732 Total 1075.000 163 Corrected Total 117.791 162 a. R Squared = .037 (Adjusted R Squared = -.006)
Figure 12. Estimated Marginal Means of Price Perception over Culture.
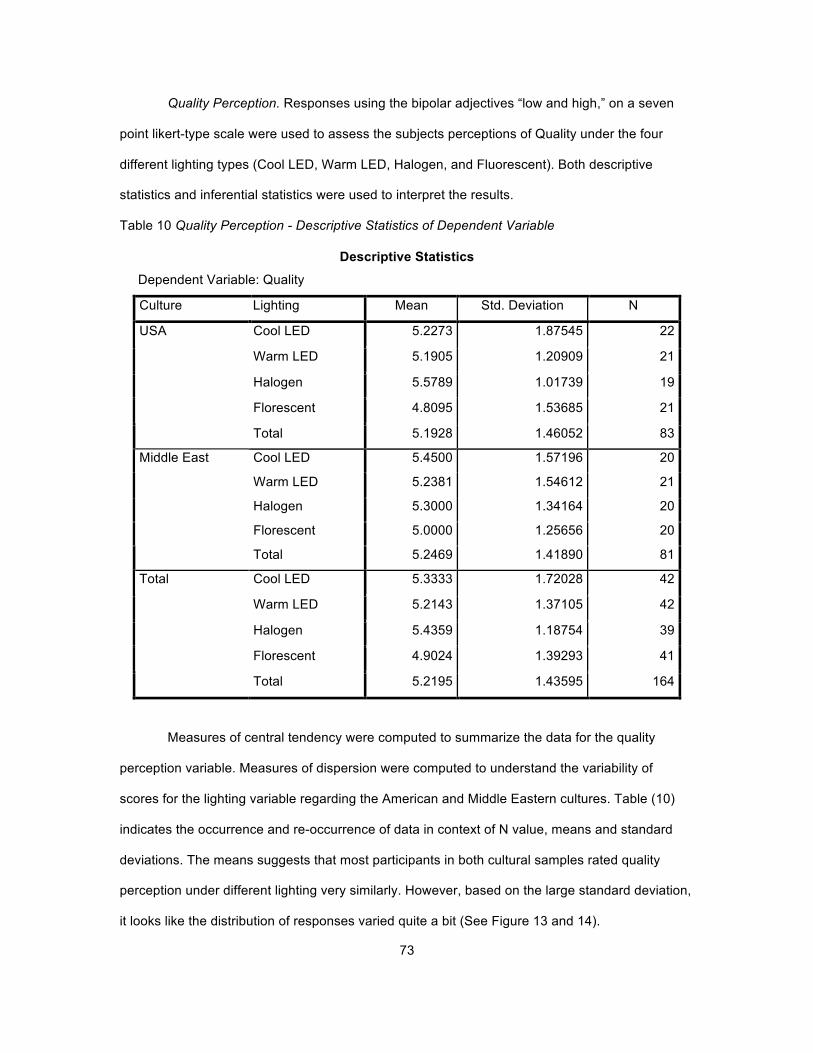
73
Quality Perception. Responses using the bipolar adjectives “low and high,” on a seven
point likert-type scale were used to assess the subjects perceptions of Quality under the four
different lighting types (Cool LED, Warm LED, Halogen, and Fluorescent). Both descriptive
statistics and inferential statistics were used to interpret the results.
Table 10 Quality Perception - Descriptive Statistics of Dependent Variable
Descriptive Statistics
Dependent Variable: Quality
Culture Lighting Mean Std. Deviation N
Cool LED 5.2273 1.87545 22
Warm LED 5.1905 1.20909 21
Halogen 5.5789 1.01739 19
Florescent 4.8095 1.53685 21
USA
Total 5.1928 1.46052 83
Cool LED 5.4500 1.57196 20
Warm LED 5.2381 1.54612 21
Halogen 5.3000 1.34164 20
Florescent 5.0000 1.25656 20
Middle East
Total 5.2469 1.41890 81
Cool LED 5.3333 1.72028 42
Warm LED 5.2143 1.37105 42
Halogen 5.4359 1.18754 39
Florescent 4.9024 1.39293 41
Total
Total 5.2195 1.43595 164
Measures of central tendency were computed to summarize the data for the quality
perception variable. Measures of dispersion were computed to understand the variability of
scores for the lighting variable regarding the American and Middle Eastern cultures. Table (10)
indicates the occurrence and re-occurrence of data in context of N value, means and standard
deviations. The means suggests that most participants in both cultural samples rated quality
perception under different lighting very similarly. However, based on the large standard deviation,
it looks like the distribution of responses varied quite a bit (See Figure 13 and 14).

74
Figure 13. American Quality Perception - Comparison of Standard Deviation.
Figure 14. Middle East Quality Perception- Comparison of Standard Deviation.
Lighting variations may contribute to product quality perception, but that effect may differ
across cultural groups. A two-way analysis of variance tested quality perception of product under
four lighting conditions (Cool LED, Warm LED, Halogen, Fluorescent) among American
0
0.05
0.1
0.15
0.2
0.25
0.3
0.35
0.4
0.45
-2 0 2 4 6 8 10 12
American Quality Perception - Comparision of Standard Deviation
Cool LED Warm LED Halogen Fluorescent
0
0.05
0.1
0.15
0.2
0.25
0.3
0.35
0 2 4 6 8 10 12
Middle East Quality Perception - Comparision of Standard Deviation
Cool LED Warm LED Halogen Fluorescent
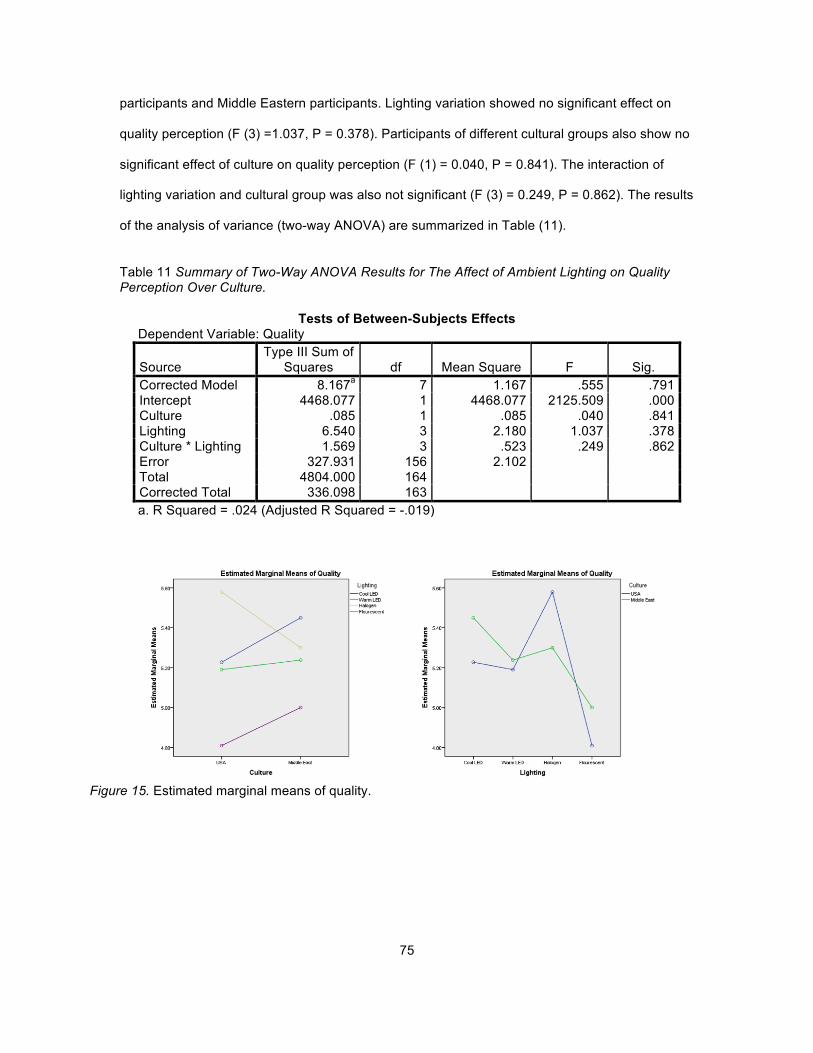
75
participants and Middle Eastern participants. Lighting variation showed no significant effect on
quality perception (F (3) =1.037, P = 0.378). Participants of different cultural groups also show no
significant effect of culture on quality perception (F (1) = 0.040, P = 0.841). The interaction of
lighting variation and cultural group was also not significant (F (3) = 0.249, P = 0.862). The results
of the analysis of variance (two-way ANOVA) are summarized in Table (11).
Table 11 Summary of Two-Way ANOVA Results for The Affect of Ambient Lighting on Quality Perception Over Culture.
Tests of Between-Subjects Effects Dependent Variable: Quality
Source Type III Sum of
Squares df Mean Square F Sig. Corrected Model 8.167a 7 1.167 .555 .791 Intercept 4468.077 1 4468.077 2125.509 .000 Culture .085 1 .085 .040 .841 Lighting 6.540 3 2.180 1.037 .378 Culture * Lighting 1.569 3 .523 .249 .862 Error 327.931 156 2.102 Total 4804.000 164 Corrected Total 336.098 163 a. R Squared = .024 (Adjusted R Squared = -.019)
Figure 15. Estimated marginal means of quality.
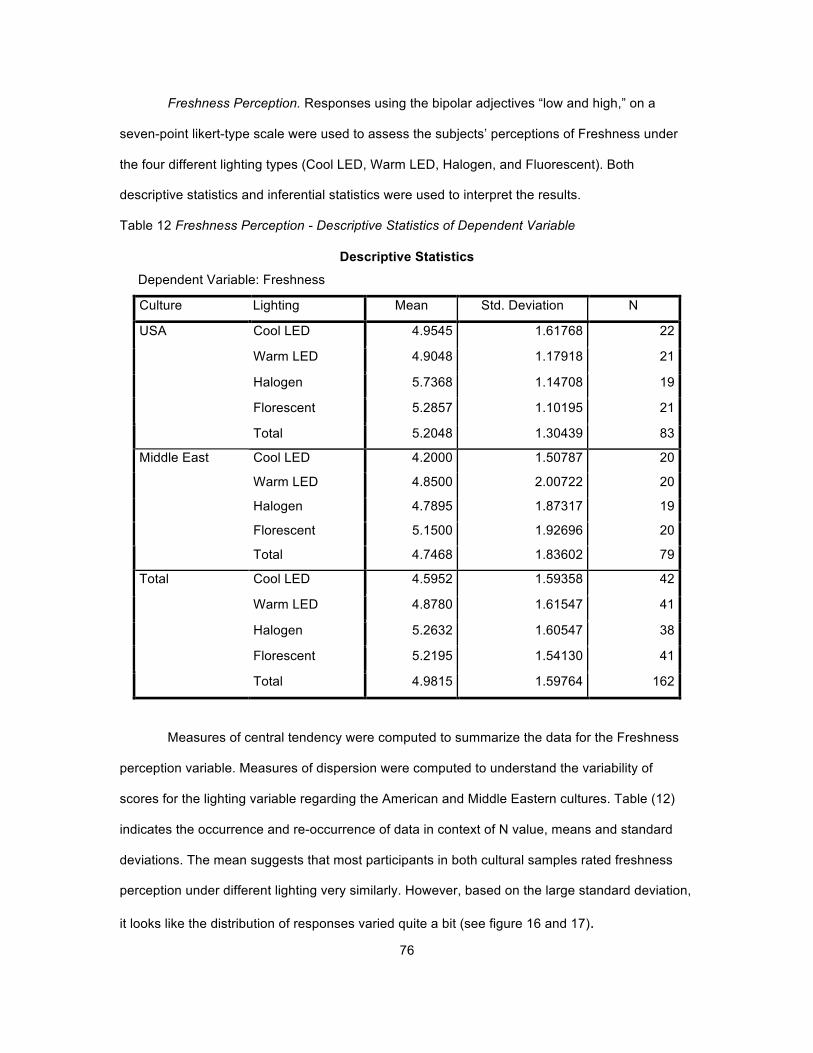
76
Freshness Perception. Responses using the bipolar adjectives “low and high,” on a
seven-point likert-type scale were used to assess the subjects’ perceptions of Freshness under
the four different lighting types (Cool LED, Warm LED, Halogen, and Fluorescent). Both
descriptive statistics and inferential statistics were used to interpret the results.
Table 12 Freshness Perception - Descriptive Statistics of Dependent Variable
Descriptive Statistics
Dependent Variable: Freshness
Culture Lighting Mean Std. Deviation N
Cool LED 4.9545 1.61768 22
Warm LED 4.9048 1.17918 21
Halogen 5.7368 1.14708 19
Florescent 5.2857 1.10195 21
USA
Total 5.2048 1.30439 83
Cool LED 4.2000 1.50787 20
Warm LED 4.8500 2.00722 20
Halogen 4.7895 1.87317 19
Florescent 5.1500 1.92696 20
Middle East
Total 4.7468 1.83602 79
Cool LED 4.5952 1.59358 42
Warm LED 4.8780 1.61547 41
Halogen 5.2632 1.60547 38
Florescent 5.2195 1.54130 41
Total
Total 4.9815 1.59764 162
Measures of central tendency were computed to summarize the data for the Freshness
perception variable. Measures of dispersion were computed to understand the variability of
scores for the lighting variable regarding the American and Middle Eastern cultures. Table (12)
indicates the occurrence and re-occurrence of data in context of N value, means and standard
deviations. The mean suggests that most participants in both cultural samples rated freshness
perception under different lighting very similarly. However, based on the large standard deviation,
it looks like the distribution of responses varied quite a bit (see figure 16 and 17).

77
Figure 16. American Freshness Perception - Comparison of Standard Deviation.
Figure 17. Middle East Freshness Perception - Comparison of Standard Deviation.
Lighting variations may contribute to product freshness perception, but that affect may
differ across cultural groups. A two-way analysis of variance tested freshness perception of
0
0.05
0.1
0.15
0.2
0.25
0.3
0.35
0.4
0 2 4 6 8 10 12
American Freshness Perception - Comparision of Standard Deviation
Cool LED Warm LED Halogen Fluorescent
0
0.05
0.1
0.15
0.2
0.25
0.3
-2 0 2 4 6 8 10 12
Middle East Freshness Perception - Comparision of Standard Deviation
Cool LED Warm LED Halogen Fluorescent

78
product under four lighting conditions (Cool LED, Warm LED, Halogen, Fluorescent) among
American participants and Middle Eastern participant. Lighting variation showed no significant
effect on freshness perception (F (3) = 1.682, P = 0.173). Participant of different cultural groups
also show no significant effect of culture on freshness perception (F (1) = 3.625, P = 0.059). The
interaction of lighting variation and cultural group was also not significant (F (3) = 0.791, P =
0.500). It can be concluded that the differences between condition Means are likely due to
chance and not likely due to the lighting and culture manipulation. The results of the analysis of
variance (two-way ANOVA) are summarized in Table (13).
Table 13 Summary of Two-Way ANOVA Results For The Affect of Ambient Lighting on Freshness Perception over Culture.
Tests of Between-Subjects Effects Dependent Variable: Freshness
Source Type III Sum of
Squares df Mean Square F Sig. Corrected Model 26.753a 7 3.822 1.532 .160 Intercept 4014.902 1 4014.902 1609.339 .000 Culture 9.044 1 9.044 3.625 .059 Lighting 12.591 3 4.197 1.682 .173 Culture * Lighting 5.923 3 1.974 .791 .500 Error 384.192 154 2.495 Total 4431.000 162 Corrected Total 410.944 161 a. R Squared = .065 (Adjusted R Squared = .023)
Figure 18. Estimated Marginal Means of Freshness.
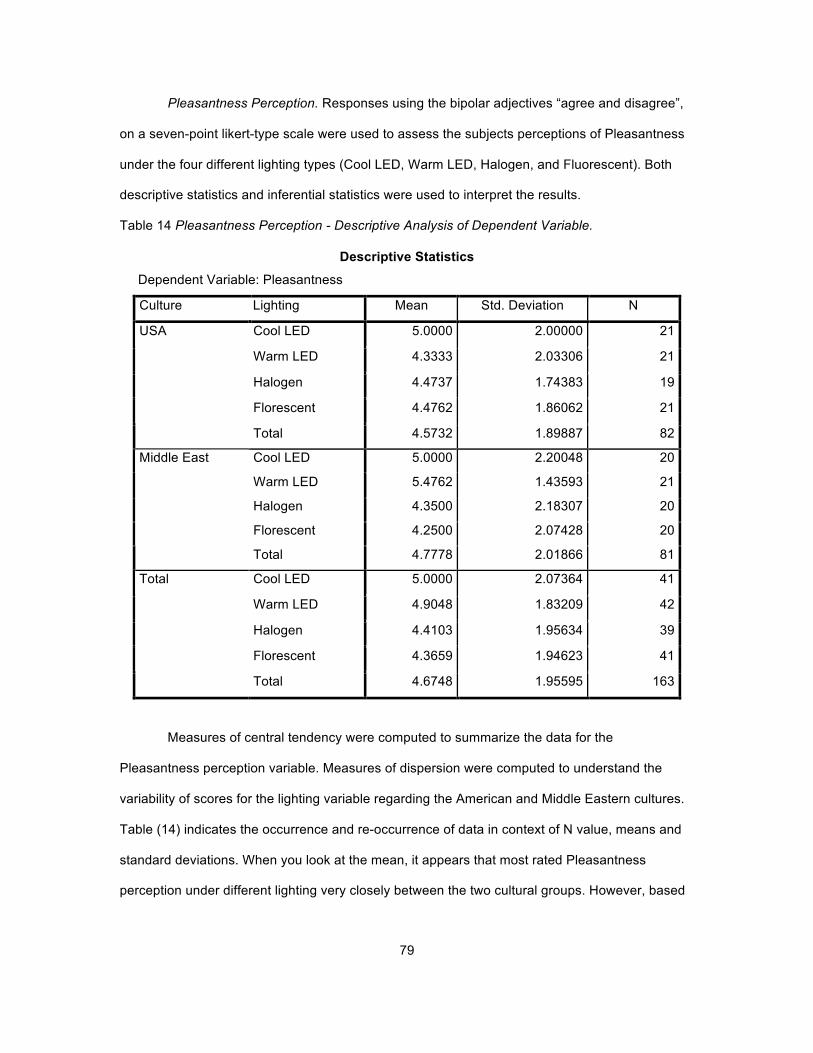
79
Pleasantness Perception. Responses using the bipolar adjectives “agree and disagree”,
on a seven-point likert-type scale were used to assess the subjects perceptions of Pleasantness
under the four different lighting types (Cool LED, Warm LED, Halogen, and Fluorescent). Both
descriptive statistics and inferential statistics were used to interpret the results.
Table 14 Pleasantness Perception - Descriptive Analysis of Dependent Variable.
Descriptive Statistics
Dependent Variable: Pleasantness
Culture Lighting Mean Std. Deviation N
Cool LED 5.0000 2.00000 21
Warm LED 4.3333 2.03306 21
Halogen 4.4737 1.74383 19
Florescent 4.4762 1.86062 21
USA
Total 4.5732 1.89887 82
Cool LED 5.0000 2.20048 20
Warm LED 5.4762 1.43593 21
Halogen 4.3500 2.18307 20
Florescent 4.2500 2.07428 20
Middle East
Total 4.7778 2.01866 81
Cool LED 5.0000 2.07364 41
Warm LED 4.9048 1.83209 42
Halogen 4.4103 1.95634 39
Florescent 4.3659 1.94623 41
Total
Total 4.6748 1.95595 163
Measures of central tendency were computed to summarize the data for the
Pleasantness perception variable. Measures of dispersion were computed to understand the
variability of scores for the lighting variable regarding the American and Middle Eastern cultures.
Table (14) indicates the occurrence and re-occurrence of data in context of N value, means and
standard deviations. When you look at the mean, it appears that most rated Pleasantness
perception under different lighting very closely between the two cultural groups. However, based

80
on the large standard deviation, it looks like the distribution of responses varied quite a bit (See
Figure 19 and Figure 20).
Figure 19. American Pleasantness Perception - Comparison of Standard Deviation.
Figure 20. Middle Eastern Pleasantness Perception - Comparison of Standard Deviation.
0
0.05
0.1
0.15
0.2
0.25
-4 -2 0 2 4 6 8 10 12
American Pleasantness Perception - Comparision of Standard Deviation
Cool LED Warm LED Halogen Fluorescent
0
0.05
0.1
0.15
0.2
0.25
0.3
-4 -2 0 2 4 6 8 10 12 14
Middle Eastern Pleasantness Perception - Comparision of Standard Deviation
Cool LED Warm LED Halogen Fluorescent

81
Lighting variations may contribute to product pleasantness perception, but that affect may
differ across cultural groups. A two-way analysis of variance tested pleasantness perception of
product under four lighting conditions (Cool LED, Warm LED, Halogen, Fluorescent) among
American participants and Middle Eastern participant. Lighting variation showed no significant
effect on pleasantness perception (F (3) = 1.154, P = 0.329). Participant of different cultural
groups also show no significant effect of culture on pleasantness perception (F (1) = 0.419, P =
0.519). The interaction of lighting variation and cultural group was also not significant (F (3) =
1.101, P = 0.350). It can be concluded that the differences between condition Means are likely
due to chance. The results of the analysis of variance (two-way ANOVA) are summarized in
Table (15).
Table 15 Summary of Two-Way ANOVA results for the affect of Ambient Lighting on Pleasantness Perception among cultures.
Tests of Between-Subjects Effects Dependent Variable: Pleasantness
Source Type III Sum of Squares df Mean Square F Sig.
Corrected Model 27.587a 7 3.941 1.032 .411 Intercept 3550.489 1 3550.489 929.322 .000 Culture 1.600 1 1.600 .419 .519 Lighting 13.231 3 4.410 1.154 .329 Culture * Lighting 12.623 3 4.208 1.101 .350 Error 592.180 155 3.821 Total 4182.000 163 Corrected Total 619.767 162 a. R Squared = .045 (Adjusted R Squared = .001)
Figure 21. Estimated Marginal Means of Pleasantness.

82
Attractiveness Perception. Responses using the bipolar adjectives “agree and disagree”,
on a seven-point likert-type scale were used to assess the subjects perceptions of attractiveness
under the four different lighting types (Cool LED, Warm LED, Halogen, and Fluorescent). Both
descriptive statistics and inferential statistics were used to interpret the results.
Table 16 Attractiveness Perception - Descriptive Analysis of Dependent Variable.
Descriptive Statistics
Dependent Variable: Attractiveness
Culture Lighting Mean Std. Deviation N
Cool LED 5.7273 1.48586 22
Warm LED 5.4286 1.07571 21
Halogen 5.4211 1.30451 19
Florescent 5.3810 1.56449 21
USA
Total 5.4940 1.35587 83
Cool LED 6.2500 .85070 20
Warm LED 6.0476 1.32198 21
Halogen 5.6000 1.60263 20
Florescent 6.0556 1.30484 18
Middle East
Total 5.9873 1.29589 79
Cool LED 5.9762 1.23936 42
Warm LED 5.7381 1.23089 42
Halogen 5.5128 1.44863 39
Florescent 5.6923 1.47173 39
Total
Total 5.7346 1.34577 162
Measures of central tendency were computed to summarize the data for the
attractiveness perception variable. Measures of dispersion were computed to understand the
variability of scores for the lighting variable regarding the American and Middle Eastern cultures.
Table (16) indicates the occurrence and re-occurrence of data in context of N value, means and
standard deviations. Based on the mean, it appears that most participants both cultural samples
rated attractiveness perception under different lighting very similarly. However, based on the

83
large standard deviation, it looks like the distribution of responses varied quite a bit (See Figure
22 and Figure 23).
Figure 22. American Attractiveness Perception- Comparison of Standard Deviation.
Figure 23. Middle East Attractiveness Perception - Comparison of Standard Deviation.
0
0.05
0.1
0.15
0.2
0.25
0.3
0.35
0.4
0.45
0.5
0 2 4 6 8 10 12
Middle East Attractiveness Perception - Comparison of Standard Deviation
Cool LED Warm LED Halogen Fluorescent
0
0.05
0.1
0.15
0.2
0.25
0.3
0.35
0.4
0 2 4 6 8 10 12
American Attractiveness Perception - Comparison of Standard Deviation
Cool LED Warm LED Halogen Fluorescent

84
Lighting variations may contribute to product attractiveness perception, but that effect
may differ across cultural groups. A two-way analysis of variance tested attractiveness perception
of product under four lighting conditions (Cool LED, Warm LED, Halogen, Fluorescent) among
American participants and Middle Eastern participants. Lighting variation showed no significant
effect on attractiveness perception (F (3) = 0.868, P = 0.459). Participants of different cultural
samples also showed no significant effect of culture on attractiveness perception (F (1) = 5.612, P
= 0.019). The interaction of lighting variation and cultural group was also not significant (F (3) =
0.271, P = 0.846). The results of the analysis of variance (two-way ANOVA) are summarized in
Table (17).
Table 17 Summary of Two-Way ANOVA results for the affect of Ambient Lighting on Attractiveness Perception among cultures.
Tests of Between-Subjects Effects Dependent Variable: Attractiveness
Source Type III Sum of
Squares df Mean Square F Sig. Corrected Model 16.049a 7 2.293 1.281 .263 Intercept 5316.087 1 5316.087 2971.204 .000 Culture 10.041 1 10.041 5.612 .019 Lighting 4.659 3 1.553 .868 .459 Culture * Lighting 1.454 3 .485 .271 .846 Error 275.537 154 1.789 Total 5619.000 162 Corrected Total 291.586 161 a. R Squared = .055 (Adjusted R Squared = .012)
Figure 24. Estimated Marginal Means of Attractiveness.
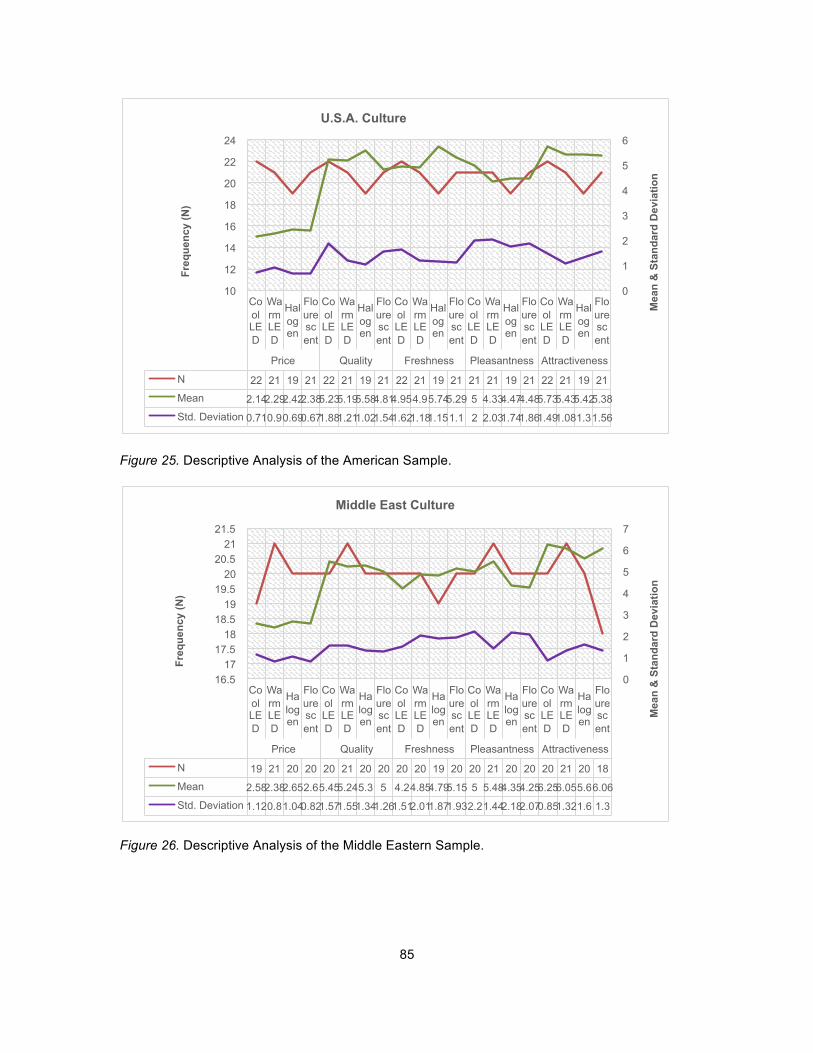
85
Figure 25. Descriptive Analysis of the American Sample.
Figure 26. Descriptive Analysis of the Middle Eastern Sample.
Cool LED
Warm LED
Halogen
Flourescent
Cool LED
Warm LED
Halogen
Flourescent
Cool LED
Warm LED
Halogen
Flourescent
Cool LED
Warm LED
Halogen
Flourescent
Cool LED
Warm LED
Halogen
Flourescent
Price Quality Freshness Pleasantness Attractiveness
N 19 21 20 20 20 21 20 20 20 20 19 20 20 21 20 20 20 21 20 18 Mean 2.58 2.38 2.65 2.6 5.45 5.24 5.3 5 4.2 4.85 4.79 5.15 5 5.48 4.35 4.25 6.25 6.05 5.6 6.06 Std. Deviation 1.12 0.8 1.04 0.82 1.57 1.55 1.34 1.26 1.51 2.01 1.87 1.93 2.2 1.44 2.18 2.07 0.85 1.32 1.6 1.3
0
1
2
3
4
5
6
7
16.5 17
17.5 18
18.5 19
19.5 20
20.5 21
21.5
Mea
n &
Sta
ndar
d D
evia
tion
Freq
uenc
y (N
)
Middle East Culture
Cool LED
Warm LED
Halogen
Flourescent
Cool LED
Warm LED
Halogen
Flourescent
Cool LED
Warm LED
Halogen
Flourescent
Cool LED
Warm LED
Halogen
Flourescent
Cool LED
Warm LED
Halogen
Flourescent
Price Quality Freshness Pleasantness Attractiveness
N 22 21 19 21 22 21 19 21 22 21 19 21 21 21 19 21 22 21 19 21 Mean 2.14 2.29 2.42 2.38 5.23 5.19 5.58 4.81 4.95 4.9 5.74 5.29 5 4.33 4.47 4.48 5.73 5.43 5.42 5.38 Std. Deviation 0.71 0.9 0.69 0.67 1.88 1.21 1.02 1.54 1.62 1.18 1.15 1.1 2 2.03 1.74 1.86 1.49 1.08 1.3 1.56
0
1
2
3
4
5
6
10
12
14
16
18
20
22
24
Mea
n &
Sta
ndar
d D
evia
tion
Freq
uenc
y (N
)
U.S.A. Culture
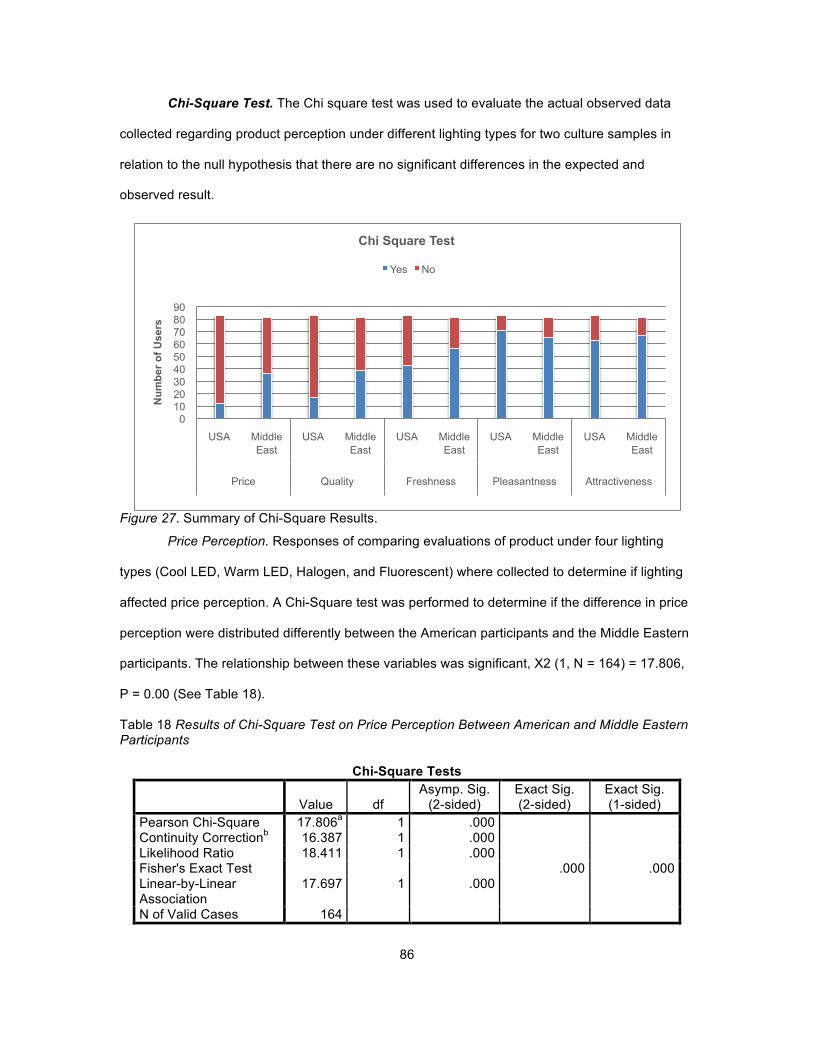
86
Chi-Square Test. The Chi square test was used to evaluate the actual observed data
collected regarding product perception under different lighting types for two culture samples in
relation to the null hypothesis that there are no significant differences in the expected and
observed result.
Figure 27. Summary of Chi-Square Results.
Price Perception. Responses of comparing evaluations of product under four lighting
types (Cool LED, Warm LED, Halogen, and Fluorescent) where collected to determine if lighting
affected price perception. A Chi-Square test was performed to determine if the difference in price
perception were distributed differently between the American participants and the Middle Eastern
participants. The relationship between these variables was significant, X2 (1, N = 164) = 17.806,
P = 0.00 (See Table 18).
Table 18 Results of Chi-Square Test on Price Perception Between American and Middle Eastern Participants
Chi-Square Tests
Value df Asymp. Sig.
(2-sided) Exact Sig. (2-sided)
Exact Sig. (1-sided)
Pearson Chi-Square 17.806a 1 .000 Continuity Correctionb 16.387 1 .000 Likelihood Ratio 18.411 1 .000 Fisher's Exact Test .000 .000 Linear-by-Linear Association
17.697 1 .000
N of Valid Cases 164
0 10 20 30 40 50 60 70 80 90
USA Middle East
USA Middle East
USA Middle East
USA Middle East
USA Middle East
Price Quality Freshness Pleasantness Attractiveness
Num
ber o
f Use
rs
Chi Square Test
Yes No
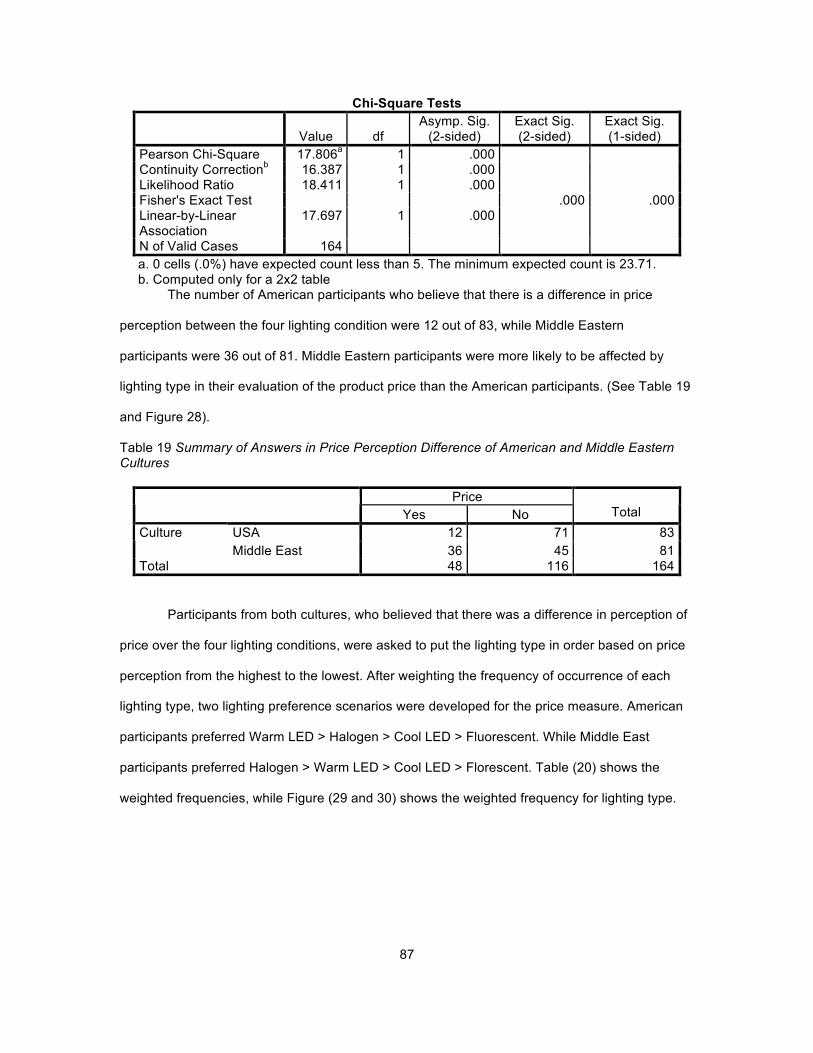
87
Chi-Square Tests
Value df Asymp. Sig.
(2-sided) Exact Sig. (2-sided)
Exact Sig. (1-sided)
Pearson Chi-Square 17.806a 1 .000 Continuity Correctionb 16.387 1 .000 Likelihood Ratio 18.411 1 .000 Fisher's Exact Test .000 .000 Linear-by-Linear Association
17.697 1 .000
N of Valid Cases 164 a. 0 cells (.0%) have expected count less than 5. The minimum expected count is 23.71. b. Computed only for a 2x2 table
The number of American participants who believe that there is a difference in price
perception between the four lighting condition were 12 out of 83, while Middle Eastern
participants were 36 out of 81. Middle Eastern participants were more likely to be affected by
lighting type in their evaluation of the product price than the American participants. (See Table 19
and Figure 28).
Table 19 Summary of Answers in Price Perception Difference of American and Middle Eastern Cultures
Price Yes No Total
USA 12 71 83 Culture Middle East 36 45 81
Total 48 116 164
Participants from both cultures, who believed that there was a difference in perception of
price over the four lighting conditions, were asked to put the lighting type in order based on price
perception from the highest to the lowest. After weighting the frequency of occurrence of each
lighting type, two lighting preference scenarios were developed for the price measure. American
participants preferred Warm LED > Halogen > Cool LED > Fluorescent. While Middle East
participants preferred Halogen > Warm LED > Cool LED > Florescent. Table (20) shows the
weighted frequencies, while Figure (29 and 30) shows the weighted frequency for lighting type.

88
Figure 28. Bar Chart of Answers in Price Perception Difference between American and Middle Eastern Cultures.
Table 20 Weighted Frequency for Lighting Preference on Price Perception by American and Middle Eastern Participants
Price USA Middle East Cool LED 26 98
Warm LED 38 101 Halogen 33 106
Fluorescent 23 55
Figure 29. Lighting Preferences on Price Perception by American Participants.
0
20
40
60
80
100
120
140
USA Middle East Total
Yes
No
Cool LED
Warm LED
Halogen
Fluorescent
0 5 10 15 20 25 30 35 40
USA
USA

89
Figure 30. Lighting Preferences on Price Perception by Middle Eastern Participants.
Quality Perception. Responses comparing quality perception of the products differs
among the four lighting types (Cool LED, Warm LED, Halogen, and Fluorescent) were collected.
A Chi Square test was performed to determine if the difference in quality perception was
distributed differently between the American participants and the Middle Eastern participants. The
relationship between these variables was significant, X2 (1, N = 164) = 13.954, P = 0.00 (See
Table 21).
Table 21 Results of Chi-Square Test on Quality Perception Between American and Middle Eastern Participants
Chi-Square Tests
Value df Asymp. Sig.
(2-sided) Exact Sig. (2-sided)
Exact Sig. (1-sided)
Pearson Chi-Square 13.954a 1 .000 Continuity Correctionb 12.751 1 .000 Likelihood Ratio 14.234 1 .000 Fisher's Exact Test .000 .000 Linear-by-Linear Association
13.869 1 .000
N of Valid Cases 164 a. 0 cells (.0%) have expected count less than 5. The minimum expected count is 27.66. b. Computed only for a 2x2 table
The number of American participants who believed that there was a difference in quality
perception between the four lighting condition were 17 out of 83, while Middle Eastern
Cool LED
Warm LED
Halogen
Fluorescent
0 20 40 60 80 100 120
Middle East
Middle East

90
participants were 39 out of 81. Middle Eastern participants were more likely to be affected by
lighting type in their evaluation of the product quality than American participants.
Table 22 Summary of Answers in Quality Perception Difference of American and Middle Eastern Cultures
Quality Yes No Total
USA 17 66 83 Culture Middle East 39 42 81
Total 56 108 164
Figure 31. Bar Chart of Answers in Quality Perception Difference between American and Middle Eastern Cultures.
Participants from both cultures, who believed that there was a difference in perception of
quality over the four lighting conditions, were asked to arrange the lighting type in order based on
quality perception from the highest to the lowest. After weighting the frequency of occurrence for
each lighting type, two lighting preference scenarios were developed for quality measure.
American participants preferred Cool LED > Warm LED > Halogen > Fluorescent. While Middle
Eastern participants preferred: Warm LED > Cool LED > Halogen > Florescent. Table (23) shows
the weighted frequencies, while Figure (32) and (34) shows the weighted frequency percentage
for each lighting type.
0
20
40
60
80
100
120
USA Middle East Total
Yes
No

91
Table 23 Weighted Frequency for Lighting Preference on Quality Perception by American and Middle Eastern Participants
Quality USA Middle East Cool LED 54 109
Warm LED 50 123 Halogen 43 102
Fluorescent 23 56
Figure 32. Lighting Preferences on Quality Perception by Middle Eastern Participants.
Figure 33. Lighting Preferences on Quality Perception by American Participants.
Cool LED
Warm LED
Halogen
Fluorescent
0 20 40 60 80 100 120 140
Middle East
Middle East
Cool LED
Warm LED
Halogen
Fluorescent
0 10 20 30 40 50 60
USA
USA

92
Freshness Perception. Responses evaluating perceptions of freshness of products under
the four lighting types (Cool LED, Warm LED, Halogen, and Fluorescent) were collected. A Chi
Square test was performed to determine if differences in freshness perception were distributed
differently across the American participants and the Middle Eastern participants. The relationship
between these variables was significant, X2 (1, N = 164) = 5.145, P = 0.023 (See Table 24).
Table 24 Results of Chi-Square Test on Freshness Perception Between American and Middle Eastern Participants
Chi-Square Tests
Value df Asymp. Sig.
(2-sided) Exact Sig. (2-sided)
Exact Sig. (1-sided)
Pearson Chi-Square 5.145a 1 .023 Continuity Correctionb 4.446 1 .035 Likelihood Ratio 5.181 1 .023 Fisher's Exact Test .026 .017 Linear-by-Linear Association
5.114 1 .024
N of Valid Cases 164 a. 0 cells (.0%) have expected count less than 5. The minimum expected count is 32.10. b. Computed only for a 2x2 table
The number of American participants who believed that there was a difference in
freshness perception between the four lighting conditions were 43 out of 83, while Middle Eastern
participants were 56 out of 81. Middle Eastern participants were more likely to be affected by
lighting type in their evaluation of the product freshness than the American participants.
Table 25 Summary of Answers in Freshness Perception Difference of American and Middle Eastern Cultures
Freshness Yes No Total
USA 43 40 83 Culture Middle East 56 25 81
Total 99 65 164

93
Figure 34. Bar Chart of Answers in Freshness Perception Difference between American and Middle Eastern Cultures.
Participants from both cultures, who believed that there was a difference in perception of
freshness over the four lighting conditions, were asked to arrange the lighting type in order based
on freshness perception from the most fresh to the least fresh. After weighting the frequency of
occurrence for each lighting type, two lighting preference scenarios were developed for freshness
measure. American participants preferred Halogen > Cool LED > Fluorescent > Warm LED.
While Middle Eastern participants preferred: Cool LED > Halogen > Florescent > Warm LED.
Table (26) shows the weighted frequencies, while Figure (35) and (36) shows the weighted
frequency percentage for each lighting type.
Table 26 Weighted Frequency for Lighting Preference on Freshness Perception by American and Middle Eastern Participants
Freshness USA Middle East Cool LED 117 152
Warm LED 96 131 Halogen 124 141
Fluorescent 103 136
0
20
40
60
80
100
120
USA Middle East Total
Yes
No

94
Figure 35. Lighting Preferences on Freshness Perception by Middle Eastern Participants.
Figure 36. Lighting Preferences on Freshness Perception by American Participants.
Pleasantness Perception. Responses determining if perceptions of pleasantness of
products differs among the four lighting types (Cool LED, Warm LED, Halogen, and Fluorescent)
were collected. A Chi-Square test was performed to determine if the difference in pleasantness
perception were distributed differently across the American participants and the Middle Eastern
Cool LED
Warm LED
Halogen
Fluorescent
120 125 130 135 140 145 150 155
Middle East
Middle East
Cool LED
Warm LED
Halogen
Fluorescent
0 20 40 60 80 100 120 140
USA
USA

95
participants. The relationship between these variables was not significant, X2 (1, N = 164) =
0.812, P = 0.368 (See Table 27).
Table 27 Results of Chi-Square Test on Pleasantness Perception Between American and Middle Eastern Participants
Chi-Square Tests
Value df Asymp. Sig.
(2-sided) Exact Sig. (2-sided)
Exact Sig. (1-sided)
Pearson Chi-Square .812a 1 .368 Continuity Correctionb .481 1 .488 Likelihood Ratio .814 1 .367 Fisher's Exact Test .411 .244 Linear-by-Linear Association
.807 1 .369
N of Valid Cases 164 a. 0 cells (.0%) have expected count less than 5. The minimum expected count is 13.83. b. Computed only for a 2x2 table
The number of American participants who believed that there was a difference in
pleasantness perception between the four lighting condition were 71 out of 83, while Middle
Eastern participants were 65 out of 81. Participants from both cultures were likely to be affected
by lighting type in their evaluation of the product pleasantness.
Table 28 Summary of Answers in Price Perception Difference of American and Middle Eastern Cultures
Pleasantness Yes No Total
USA 71 12 83 Culture Middle East 65 16 81
Total 136 28 164
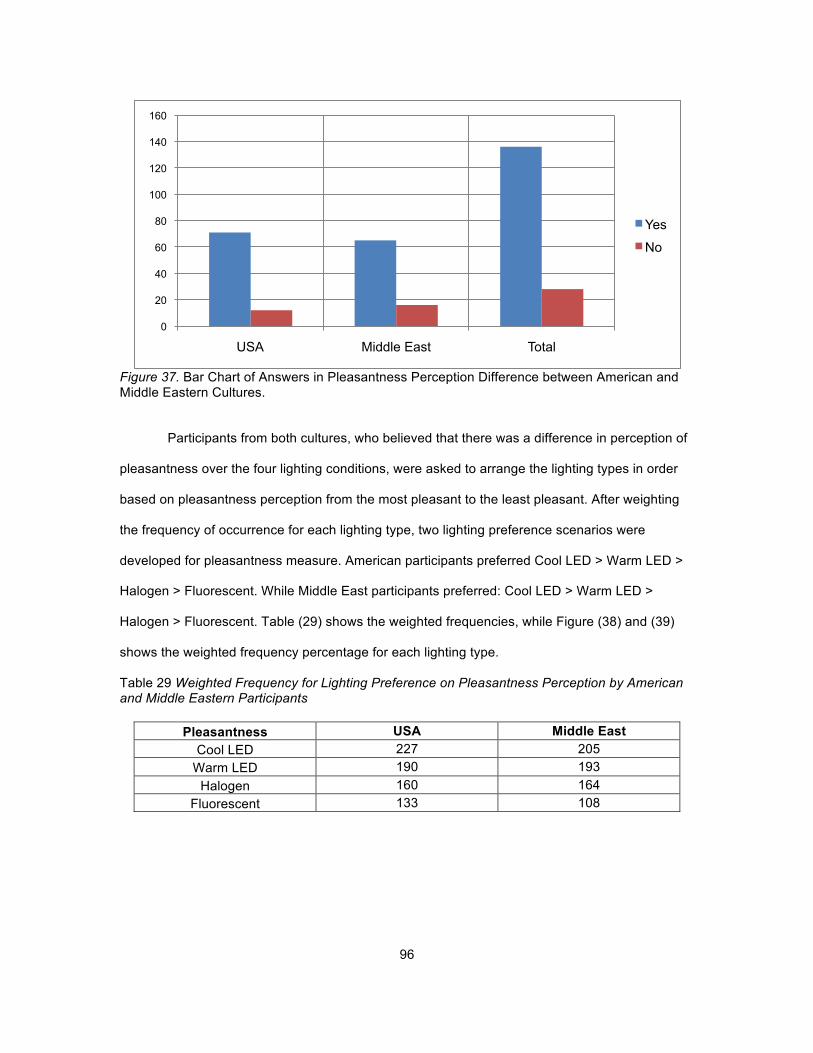
96
Figure 37. Bar Chart of Answers in Pleasantness Perception Difference between American and Middle Eastern Cultures.
Participants from both cultures, who believed that there was a difference in perception of
pleasantness over the four lighting conditions, were asked to arrange the lighting types in order
based on pleasantness perception from the most pleasant to the least pleasant. After weighting
the frequency of occurrence for each lighting type, two lighting preference scenarios were
developed for pleasantness measure. American participants preferred Cool LED > Warm LED >
Halogen > Fluorescent. While Middle East participants preferred: Cool LED > Warm LED >
Halogen > Fluorescent. Table (29) shows the weighted frequencies, while Figure (38) and (39)
shows the weighted frequency percentage for each lighting type.
Table 29 Weighted Frequency for Lighting Preference on Pleasantness Perception by American and Middle Eastern Participants
Pleasantness USA Middle East Cool LED 227 205
Warm LED 190 193 Halogen 160 164
Fluorescent 133 108
0
20
40
60
80
100
120
140
160
USA Middle East Total
Yes
No
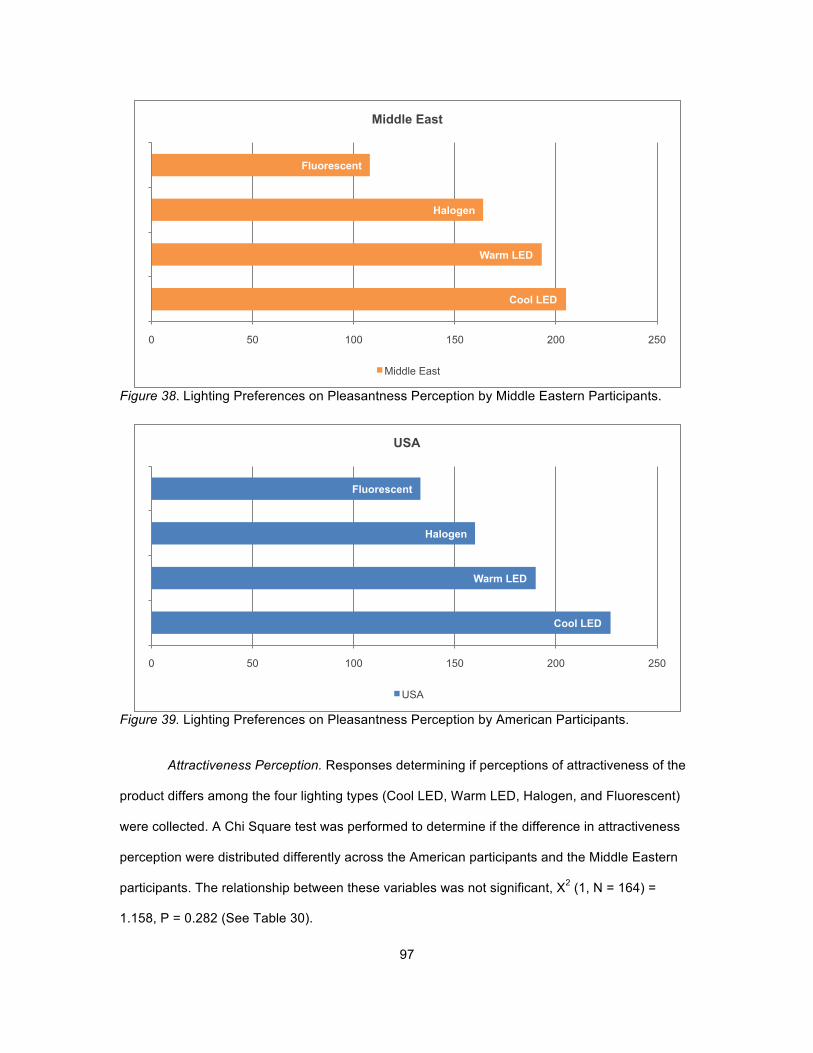
97
Figure 38. Lighting Preferences on Pleasantness Perception by Middle Eastern Participants.
Figure 39. Lighting Preferences on Pleasantness Perception by American Participants.
Attractiveness Perception. Responses determining if perceptions of attractiveness of the
product differs among the four lighting types (Cool LED, Warm LED, Halogen, and Fluorescent)
were collected. A Chi Square test was performed to determine if the difference in attractiveness
perception were distributed differently across the American participants and the Middle Eastern
participants. The relationship between these variables was not significant, X2 (1, N = 164) =
1.158, P = 0.282 (See Table 30).
Cool LED
Warm LED
Halogen
Fluorescent
0 50 100 150 200 250
Middle East
Middle East
Cool LED
Warm LED
Halogen
Fluorescent
0 50 100 150 200 250
USA
USA
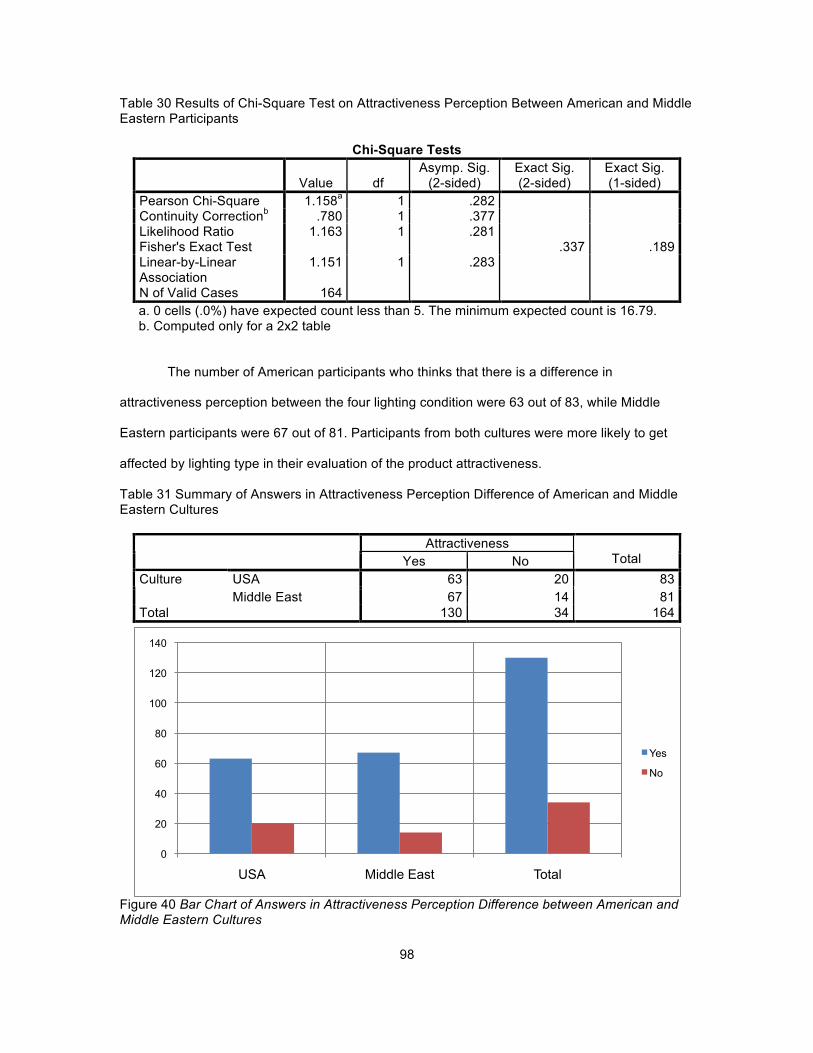
98
Table 30 Results of Chi-Square Test on Attractiveness Perception Between American and Middle Eastern Participants
Chi-Square Tests
Value df Asymp. Sig.
(2-sided) Exact Sig. (2-sided)
Exact Sig. (1-sided)
Pearson Chi-Square 1.158a 1 .282 Continuity Correctionb .780 1 .377 Likelihood Ratio 1.163 1 .281 Fisher's Exact Test .337 .189 Linear-by-Linear Association
1.151 1 .283
N of Valid Cases 164 a. 0 cells (.0%) have expected count less than 5. The minimum expected count is 16.79. b. Computed only for a 2x2 table
The number of American participants who thinks that there is a difference in
attractiveness perception between the four lighting condition were 63 out of 83, while Middle
Eastern participants were 67 out of 81. Participants from both cultures were more likely to get
affected by lighting type in their evaluation of the product attractiveness.
Table 31 Summary of Answers in Attractiveness Perception Difference of American and Middle Eastern Cultures
Attractiveness Yes No Total
USA 63 20 83 Culture Middle East 67 14 81
Total 130 34 164
Figure 40 Bar Chart of Answers in Attractiveness Perception Difference between American and Middle Eastern Cultures
0
20
40
60
80
100
120
140
USA Middle East Total
Yes
No
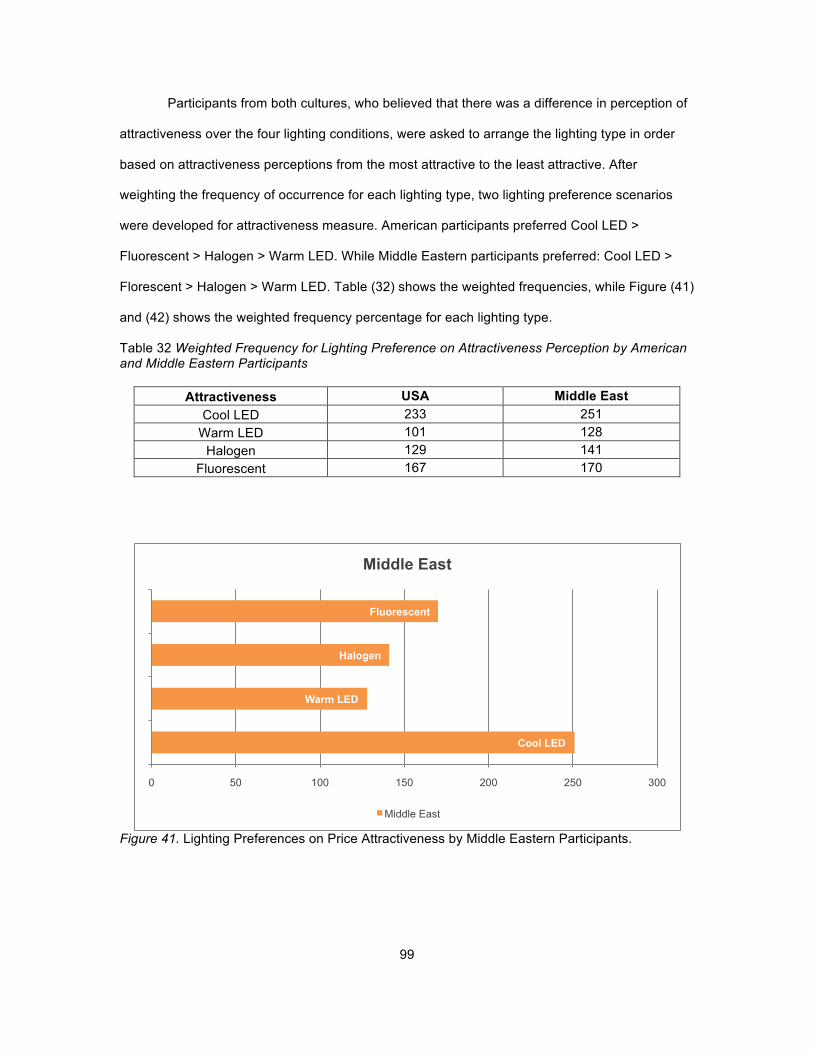
99
Participants from both cultures, who believed that there was a difference in perception of
attractiveness over the four lighting conditions, were asked to arrange the lighting type in order
based on attractiveness perceptions from the most attractive to the least attractive. After
weighting the frequency of occurrence for each lighting type, two lighting preference scenarios
were developed for attractiveness measure. American participants preferred Cool LED >
Fluorescent > Halogen > Warm LED. While Middle Eastern participants preferred: Cool LED >
Florescent > Halogen > Warm LED. Table (32) shows the weighted frequencies, while Figure (41)
and (42) shows the weighted frequency percentage for each lighting type.
Table 32 Weighted Frequency for Lighting Preference on Attractiveness Perception by American and Middle Eastern Participants
Attractiveness USA Middle East Cool LED 233 251
Warm LED 101 128 Halogen 129 141
Fluorescent 167 170
Figure 41. Lighting Preferences on Price Attractiveness by Middle Eastern Participants.
Cool LED
Warm LED
Halogen
Fluorescent
0 50 100 150 200 250 300
Middle East
Middle East

100
Figure 42. Lighting Preferences on Attractiveness Perception by American Participants.
Question 3 - What lighting characteristics are responsible/causing these changes
in product perception across different cultures? This question was assessed using three
methods. The first method used was mean rating, or plotting the means for each of the
characteristics and comparing it with respect to American sample population data and Middle
Eastern sample population data. The second test run was the one-way ANOVA assessing
variance with relation to product perception. The third test used was a regression analysis. Two
tests were performed: 1) estimating the relationship between lighting characteristics and product
perception variables and 2) estimating the relationship between lighting characteristics, product
perceptions and culture (Middle Eastern and American).
Data Analysis: Bipolar Rating Scales. Scoring of Data. Seven steps of each bipolar
(semantic differential) rating scale were assigned a numerical value (1-7), beginning with a “1” for
the leftmost column. The numerical value of the column selected by the subject constitutes the
data used for the analysis. Figure (43) shows a typical data sheet for recording and collecting
comparative scaling data.
Cool LED
Warm LED
Halogen
Fluorescent
0 50 100 150 200 250
USA
USA
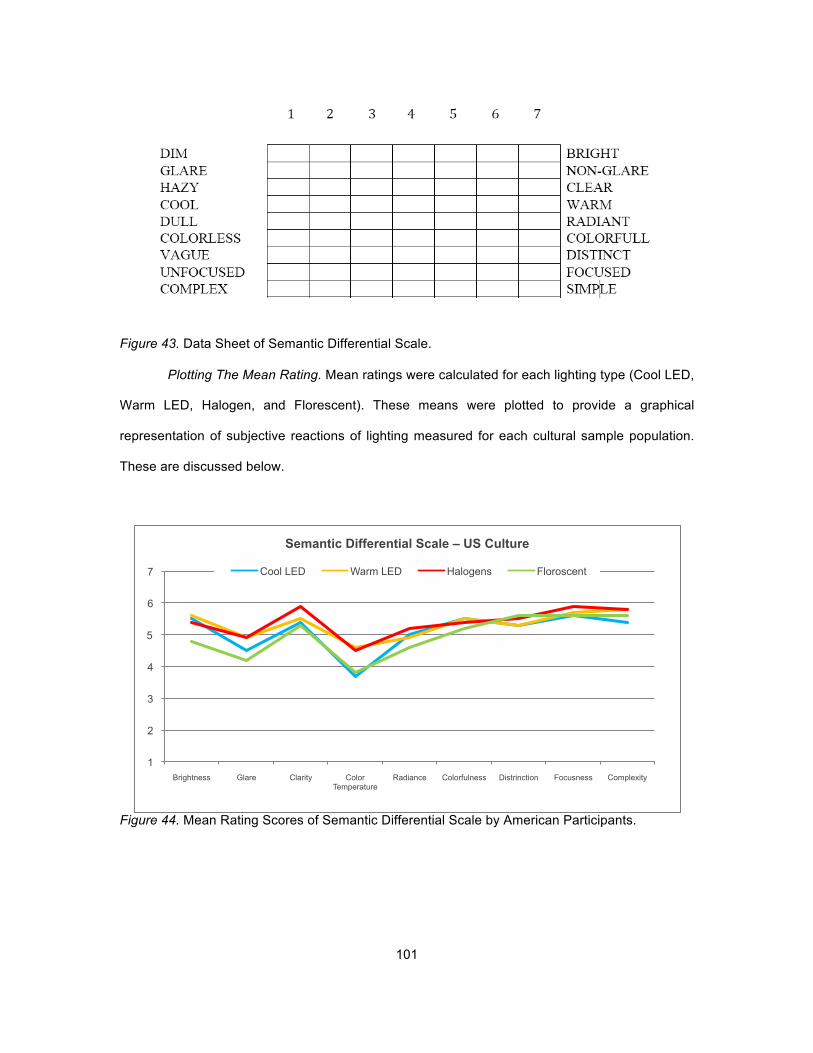
101
Figure 43. Data Sheet of Semantic Differential Scale.
Plotting The Mean Rating. Mean ratings were calculated for each lighting type (Cool LED,
Warm LED, Halogen, and Florescent). These means were plotted to provide a graphical
representation of subjective reactions of lighting measured for each cultural sample population.
These are discussed below.
Figure 44. Mean Rating Scores of Semantic Differential Scale by American Participants.
1
2
3
4
5
6
7
Brightness Glare Clarity Color Temperature
Radiance Colorfulness Distrinction Focusness Complexity
Semantic Differential Scale – US Culture
Cool LED Warm LED Halogens Floroscent
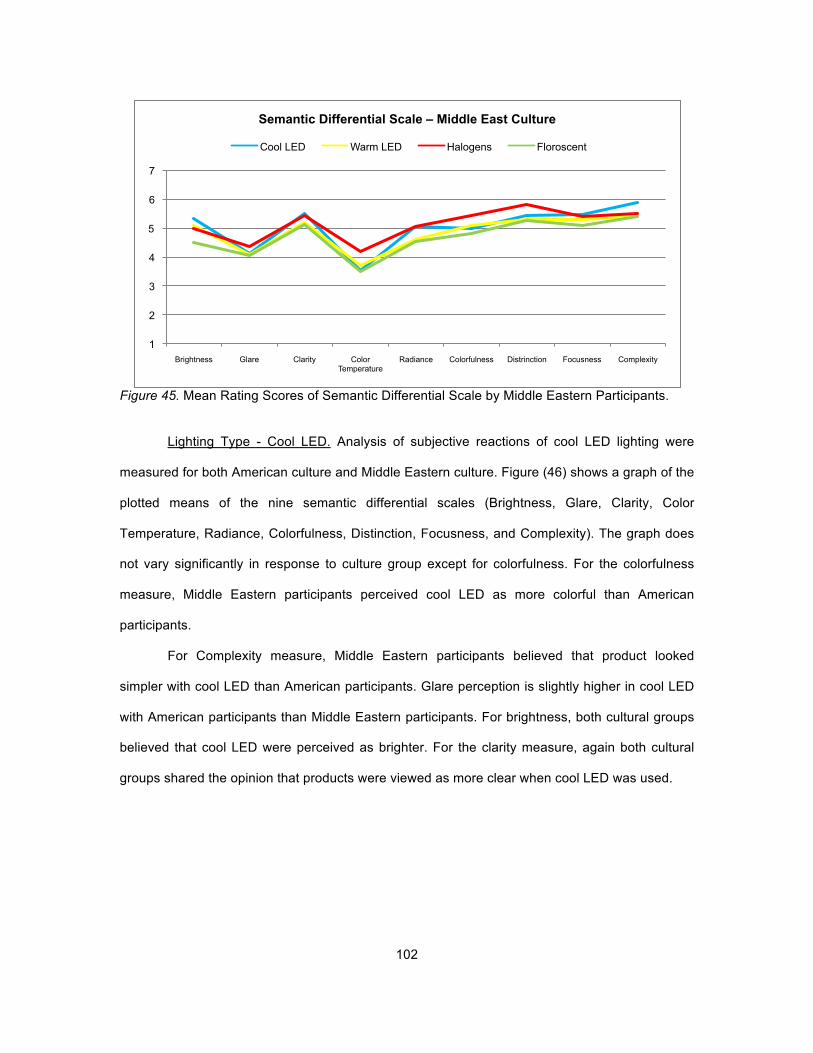
102
Figure 45. Mean Rating Scores of Semantic Differential Scale by Middle Eastern Participants.
Lighting Type - Cool LED. Analysis of subjective reactions of cool LED lighting were
measured for both American culture and Middle Eastern culture. Figure (46) shows a graph of the
plotted means of the nine semantic differential scales (Brightness, Glare, Clarity, Color
Temperature, Radiance, Colorfulness, Distinction, Focusness, and Complexity). The graph does
not vary significantly in response to culture group except for colorfulness. For the colorfulness
measure, Middle Eastern participants perceived cool LED as more colorful than American
participants.
For Complexity measure, Middle Eastern participants believed that product looked
simpler with cool LED than American participants. Glare perception is slightly higher in cool LED
with American participants than Middle Eastern participants. For brightness, both cultural groups
believed that cool LED were perceived as brighter. For the clarity measure, again both cultural
groups shared the opinion that products were viewed as more clear when cool LED was used.
1
2
3
4
5
6
7
Brightness Glare Clarity Color Temperature
Radiance Colorfulness Distrinction Focusness Complexity
Semantic Differential Scale – Middle East Culture
Cool LED Warm LED Halogens Floroscent

103
Figure 46. Mean Rating Scores of Semantic Differential Scale of Cool LED by American and Middle Eastern Participants
Lighting Type - Warm LED. Analysis of subjective reactions of warm LED lighting was
measured for both American culture and Middle Eastern culture. Figure (47) shows a graph of the
plotted means of the nine semantic differential scales (Brightness, Glare, Clarity, Color
Temperature, Radiance, Colorfulness, Distinction, Focusness, and Complexity). The graph
significantly varies with respect to both culture groups except for the distinction measure where it
is identical in both cultures. For brightness, glare, clarity, color temperature, radiance,
colorfulness, focusness, and complexity measures are all parallel with higher means for American
participants than Middle Eastern participants.
1
2
3
4
5
6
7
Brightness Glare Clarity Color Temperature
Radiance Colorfulness Distrinction Focusness Complexity
Semantic Differential Scale – Cool LED
USA Middle East
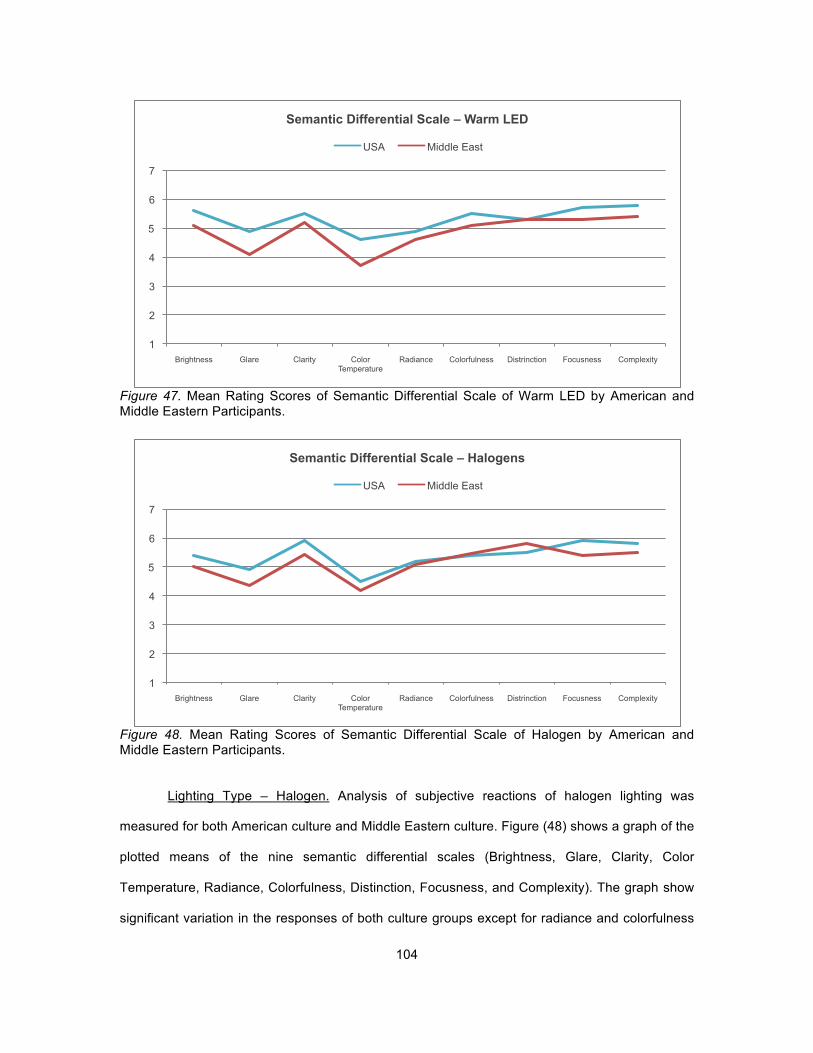
104
Figure 47. Mean Rating Scores of Semantic Differential Scale of Warm LED by American and Middle Eastern Participants.
Figure 48. Mean Rating Scores of Semantic Differential Scale of Halogen by American and Middle Eastern Participants.
Lighting Type – Halogen. Analysis of subjective reactions of halogen lighting was
measured for both American culture and Middle Eastern culture. Figure (48) shows a graph of the
plotted means of the nine semantic differential scales (Brightness, Glare, Clarity, Color
Temperature, Radiance, Colorfulness, Distinction, Focusness, and Complexity). The graph show
significant variation in the responses of both culture groups except for radiance and colorfulness
1
2
3
4
5
6
7
Brightness Glare Clarity Color Temperature
Radiance Colorfulness Distrinction Focusness Complexity
Semantic Differential Scale – Warm LED
USA Middle East
1
2
3
4
5
6
7
Brightness Glare Clarity Color Temperature
Radiance Colorfulness Distrinction Focusness Complexity
Semantic Differential Scale – Halogens
USA Middle East
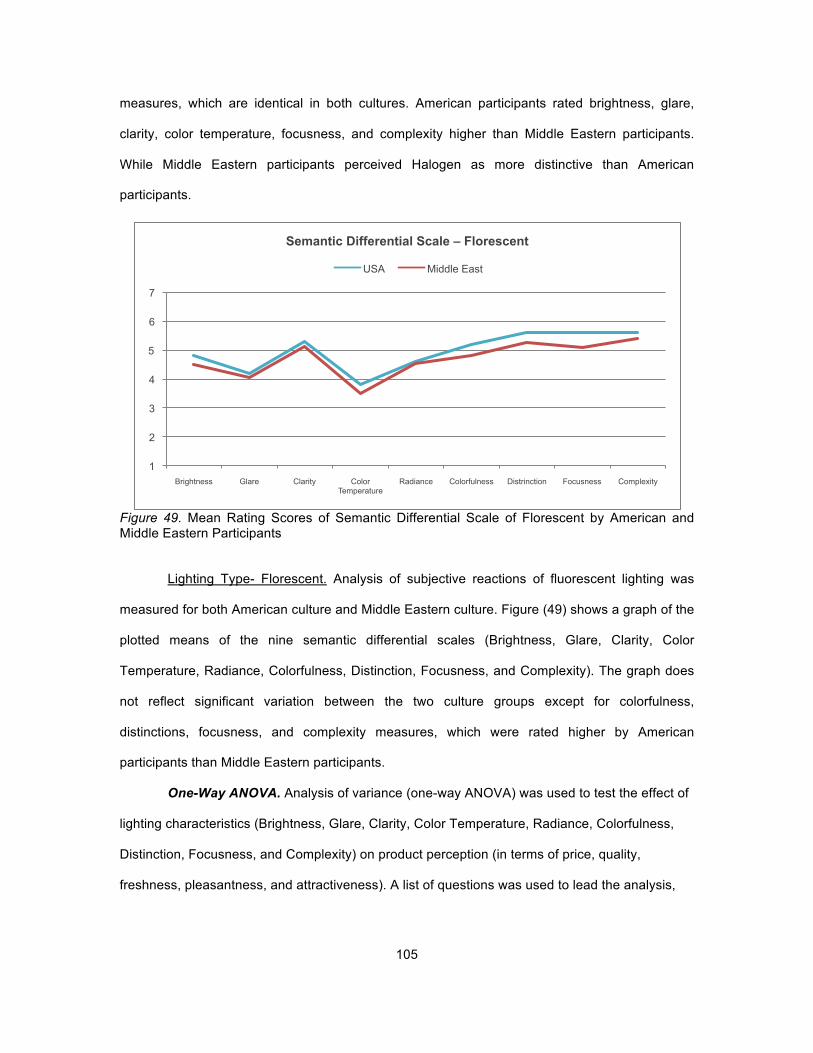
105
measures, which are identical in both cultures. American participants rated brightness, glare,
clarity, color temperature, focusness, and complexity higher than Middle Eastern participants.
While Middle Eastern participants perceived Halogen as more distinctive than American
participants.
Figure 49. Mean Rating Scores of Semantic Differential Scale of Florescent by American and Middle Eastern Participants
Lighting Type- Florescent. Analysis of subjective reactions of fluorescent lighting was
measured for both American culture and Middle Eastern culture. Figure (49) shows a graph of the
plotted means of the nine semantic differential scales (Brightness, Glare, Clarity, Color
Temperature, Radiance, Colorfulness, Distinction, Focusness, and Complexity). The graph does
not reflect significant variation between the two culture groups except for colorfulness,
distinctions, focusness, and complexity measures, which were rated higher by American
participants than Middle Eastern participants.
One-Way ANOVA. Analysis of variance (one-way ANOVA) was used to test the effect of
lighting characteristics (Brightness, Glare, Clarity, Color Temperature, Radiance, Colorfulness,
Distinction, Focusness, and Complexity) on product perception (in terms of price, quality,
freshness, pleasantness, and attractiveness). A list of questions was used to lead the analysis,
1
2
3
4
5
6
7
Brightness Glare Clarity Color Temperature
Radiance Colorfulness Distrinction Focusness Complexity
Semantic Differential Scale – Florescent
USA Middle East
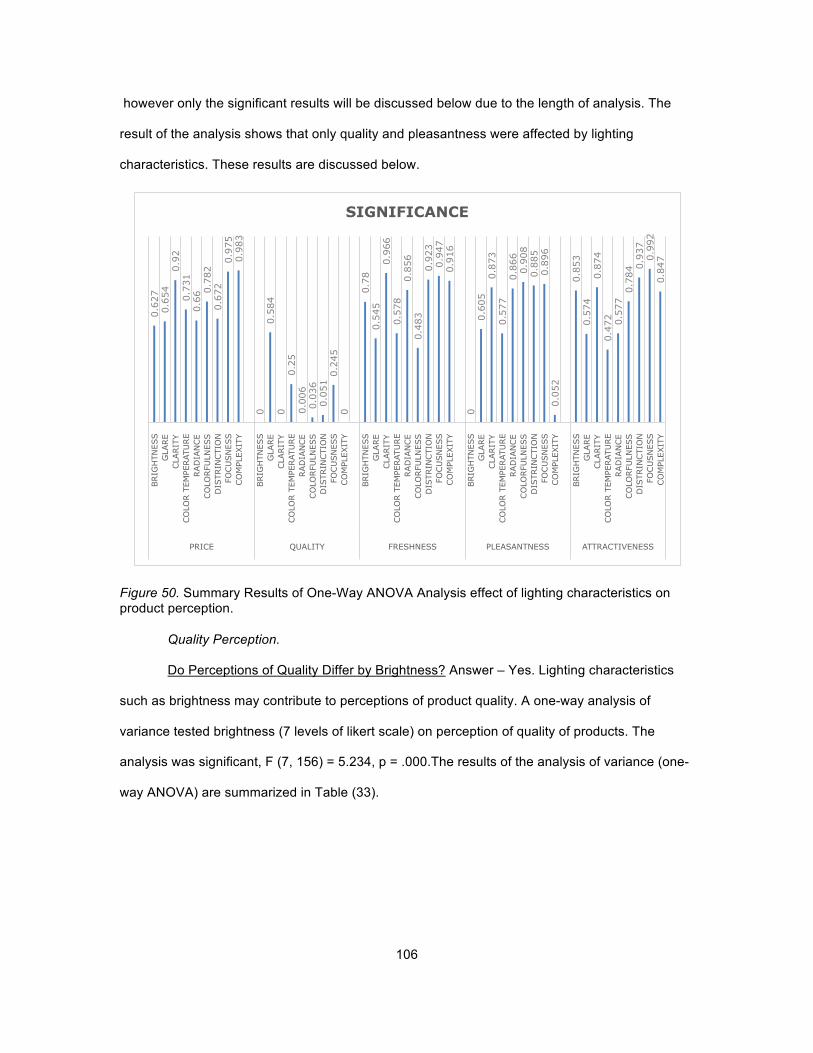
106
however only the significant results will be discussed below due to the length of analysis. The
result of the analysis shows that only quality and pleasantness were affected by lighting
characteristics. These results are discussed below.
Figure 50. Summary Results of One-Way ANOVA Analysis effect of lighting characteristics on product perception.
Quality Perception.
Do Perceptions of Quality Differ by Brightness? Answer – Yes. Lighting characteristics
such as brightness may contribute to perceptions of product quality. A one-way analysis of
variance tested brightness (7 levels of likert scale) on perception of quality of products. The
analysis was significant, F (7, 156) = 5.234, p = .000.The results of the analysis of variance (one-
way ANOVA) are summarized in Table (33).
0.6
27
0.6
54
0.9
2
0.7
31
0.6
6 0.7
82
0.6
72
0.9
75
0.9
83
0
0.5
84
0
0.2
5
0.0
06
0.0
36
0.0
51 0
.245
0
0.7
8
0.5
45
0.9
66
0.5
78
0.8
56
0.4
83
0.9
23
0.9
47
0.9
16
0
0.6
05
0.8
73
0.5
77
0.8
66
0.9
08
0.8
85
0.8
96
0.0
52
0.8
53
0.5
74
0.8
74
0.4
72
0.5
77 0
.784 0.9
37
0.9
92
0.8
47
BRIG
HTN
ESS
GLA
RE
CLA
RIT
Y
CO
LOR T
EM
PERATU
RE
RAD
IAN
CE
CO
LORFU
LNESS
DIS
TRIN
CTIO
N
FOCU
SN
ESS
CO
MPL
EXIT
Y
BRIG
HTN
ESS
GLA
RE
CLA
RIT
Y
CO
LOR T
EM
PERATU
RE
RAD
IAN
CE
CO
LORFU
LNESS
DIS
TRIN
CTIO
N
FOCU
SN
ESS
CO
MPL
EXIT
Y
BRIG
HTN
ESS
GLA
RE
CLA
RIT
Y
CO
LOR T
EM
PERATU
RE
RAD
IAN
CE
CO
LORFU
LNESS
DIS
TRIN
CTIO
N
FOCU
SN
ESS
CO
MPL
EXIT
Y
BRIG
HTN
ESS
GLA
RE
CLA
RIT
Y
CO
LOR T
EM
PERATU
RE
RAD
IAN
CE
CO
LORFU
LNESS
DIS
TRIN
CTIO
N
FOCU
SN
ESS
CO
MPL
EXIT
Y
BRIG
HTN
ESS
GLA
RE
CLA
RIT
Y
CO
LOR T
EM
PERATU
RE
RAD
IAN
CE
CO
LORFU
LNESS
DIS
TRIN
CTIO
N
FOCU
SN
ESS
CO
MPL
EXIT
Y
PRICE QUALITY FRESHNESS PLEASANTNESS ATTRACTIVENESS
SIGNIFICANCE

107
Table 33 Summary Results of One-Way ANOVA Analysis effect of Brightness on Quality perception.
ANOVA Brightness vs
Quality Sum of
Squares Df Mean
Square F Sig Between Groups 63.923 7 9.123 5.234 .000 Within Groups 272.174 156 1.745 Total 3336.096 163
Does Perception of Quality Differ According to Clarity? Answer – Yes. Lighting
characteristics such as clarity may contribute to perceptions of product quality. A one-way
analysis of variance tested clarity (7 levels of likert scale) on perceptions of product quality. The
analysis was significant, F (7, 156) = 4.418, p = 0.000.The results of the analysis of variance
(one-way ANOVA) are summarized in Table (34).
Table 34 Summary Results of One-Way ANOVA Analysis effect of Clarity on Quality perception.
ANOVA
Clarity vs Quality Sum of
Squares df Mean
Square F Sig Between Groups 55.602 7 7.943 4.418 .000 Within Groups 280.495 156 1.798 Total 336.098 163
Does Perception of Quality Differ According to Radiance? Answer – Yes. Lighting
characteristics such as radiance may contribute to perceptions of product quality. A one-way
analysis of variance tested radiance (7 levels of likert scale) on perceptions of product quality.
The analysis was significant, F (7, 156) = 2.967, p = 0.006. The results of the analysis of variance
(one-way ANOVA) are summarized in Table (35).
Table 35 Summary Results of One-Way ANOVA Analysis effect of Radiance on Quality perception.
ANOVA Radiance vs
Quality Sum of
Squares df Mean
Square F Sig Between Groups 39.488 7 5.641 2.967 .006 Within Groups 296.610 156 1.901 Total 336.098 163
Does Perception of Quality differ According to Colorfulness? Answer – Yes. Lighting
characteristics such as colorfulness may contribute to perceptions of product quality. A one-way

108
analysis of variance tested colorfulness (7 levels of likert scale) on quality perception of product.
The analysis was significant, F (7, 156) = 2.215, p = 0.036.The results of the analysis of variance
(one-way ANOVA) are summarized in Table (36).
Table 36 Summary Results of One-Way ANOVA Analysis effect of Colorfulness on Quality perception.
ANOVA Colorfulness vs
Quality Sum of
Squares df Mean
Square F Sig Between Groups 30.388 7 4.341 2.215 .036 Within Groups 305.709 156 1.960 Total 336.098 163
Does Perception of Quality differ by Complexity? Answer – Yes. Lighting characteristics
such as complexity may contribute to perceptions of product quality. A one-way analysis of
variance tested colorfulness (7 levels of likert scale) on quality perception of products. The
analysis was significant, F (6, 157) = 4.614, p = 0.000. The results of the analysis of variance
(one-way ANOVA) are summarized in Table (37).
Table 37 Summary Results of One-Way ANOVA Analysis effect of Complexity on Quality perception.
ANOVA Complexity vs
Quality Sum of
Squares df Mean
Square F Sig Between Groups 50.377 6 8.396 4.614 .000 Within Groups 285.720 157 1.820 Total 336.098 163
Pleasantness Perception.
Does Perception of Pleasantness Differ According to Brightness? Answer – Yes. Lighting
characteristics such as brightness may contribute to perceptions of product pleasantness. A one-
way analysis of variance tested brightness (7 levels of likert scale) on pleasantness perceptions
of products. The analysis was significant, F (7, 156) = 47299.477, p = 0.000.The results of the
analysis of variance (one-way ANOVA) are summarized in Table (38).
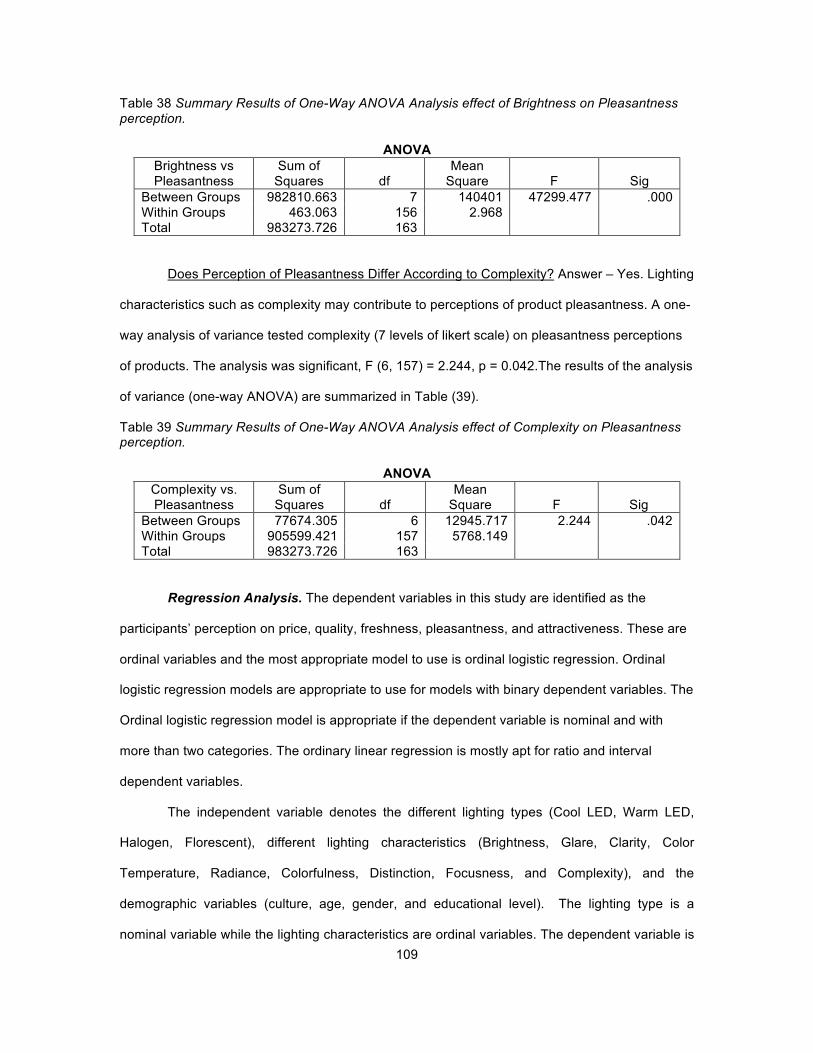
109
Table 38 Summary Results of One-Way ANOVA Analysis effect of Brightness on Pleasantness perception.
ANOVA Brightness vs Pleasantness
Sum of Squares df
Mean Square F Sig
Between Groups 982810.663 7 140401 47299.477 .000 Within Groups 463.063 156 2.968 Total 983273.726 163
Does Perception of Pleasantness Differ According to Complexity? Answer – Yes. Lighting
characteristics such as complexity may contribute to perceptions of product pleasantness. A one-
way analysis of variance tested complexity (7 levels of likert scale) on pleasantness perceptions
of products. The analysis was significant, F (6, 157) = 2.244, p = 0.042.The results of the analysis
of variance (one-way ANOVA) are summarized in Table (39).
Table 39 Summary Results of One-Way ANOVA Analysis effect of Complexity on Pleasantness perception.
ANOVA Complexity vs. Pleasantness
Sum of Squares df
Mean Square F Sig
Between Groups 77674.305 6 12945.717 2.244 .042 Within Groups 905599.421 157 5768.149 Total 983273.726 163
Regression Analysis. The dependent variables in this study are identified as the
participants’ perception on price, quality, freshness, pleasantness, and attractiveness. These are
ordinal variables and the most appropriate model to use is ordinal logistic regression. Ordinal
logistic regression models are appropriate to use for models with binary dependent variables. The
Ordinal logistic regression model is appropriate if the dependent variable is nominal and with
more than two categories. The ordinary linear regression is mostly apt for ratio and interval
dependent variables.
The independent variable denotes the different lighting types (Cool LED, Warm LED,
Halogen, Florescent), different lighting characteristics (Brightness, Glare, Clarity, Color
Temperature, Radiance, Colorfulness, Distinction, Focusness, and Complexity), and the
demographic variables (culture, age, gender, and educational level). The lighting type is a
nominal variable while the lighting characteristics are ordinal variables. The dependent variable is

110
an ordinal variable containing the participant’s scores on product perception. Model (1) was run
five times, one for each dependent variable – price, quality, freshness, pleasantness, and
attractiveness. The coefficients in (1) and (2) are interpreted as an odds ratio.
Table 40 Ordinal Logistic Regression Model of Demographics and Product Perception
Demographics Price Quality Fresh Pleasant Attract
USA Culture -0.682 -0.222 27.187*** -11.854 -5.868
Middle East Culture . . 0.161 -1.023** -1.372***
Cool LED -0.047 -0.045 . . .
Warm LED 0.208 0.007 -0.633 0.366 0.377
Halogen 0.58 0.153 -0.694 -0.221 -0.416
Fluorescent . . 0.378 -0.98* 0.093
Age = 18-24 -2.608 -1.663 . . .
Age = 25-29 -1.146 -1.541 -4.659 -1 -0.696
Age = 30-34 -1.715 -3.001 -4.29 -0.864 -1.084
Age = 35-39 -0.412 1.818 -4.393 -1.066 0.622
Age = 40 and over . . 0.488 12.205 0.735
Female 0.454 0.182 . . .
Male . . -0.063 -0.27 -1.478***
Undergraduate -0.573 0.792 . . .
Graduate . . 0.412 0.737 -0.567
* p < 0.10, ** p < 0.05, *** p < 0.01
Each column is one regression.
Model I: Lighting Characteristics and Product Perception.
Demographics. The ordinal logistic regression model in (1) was run on the full model
using all the independent variables lighting type (Cool LED, Warm LED, Halogen, and
Florescent), Culture (USA and Middle East), and demographics (age, gender, and educational
level). The regression yields estimates of the odds ratios (3) shown in Table (40). Table (40)
shows that controlling for the other variables, the odds ratios of the different lighting types do not
differ significantly from each other in explaining the set of dependent variables. Age, and
educational level also do not affect price, quality, freshness, pleasantness, and attractiveness,
holding other variables fixed. Males are more likely to perceive objects as unattractive with
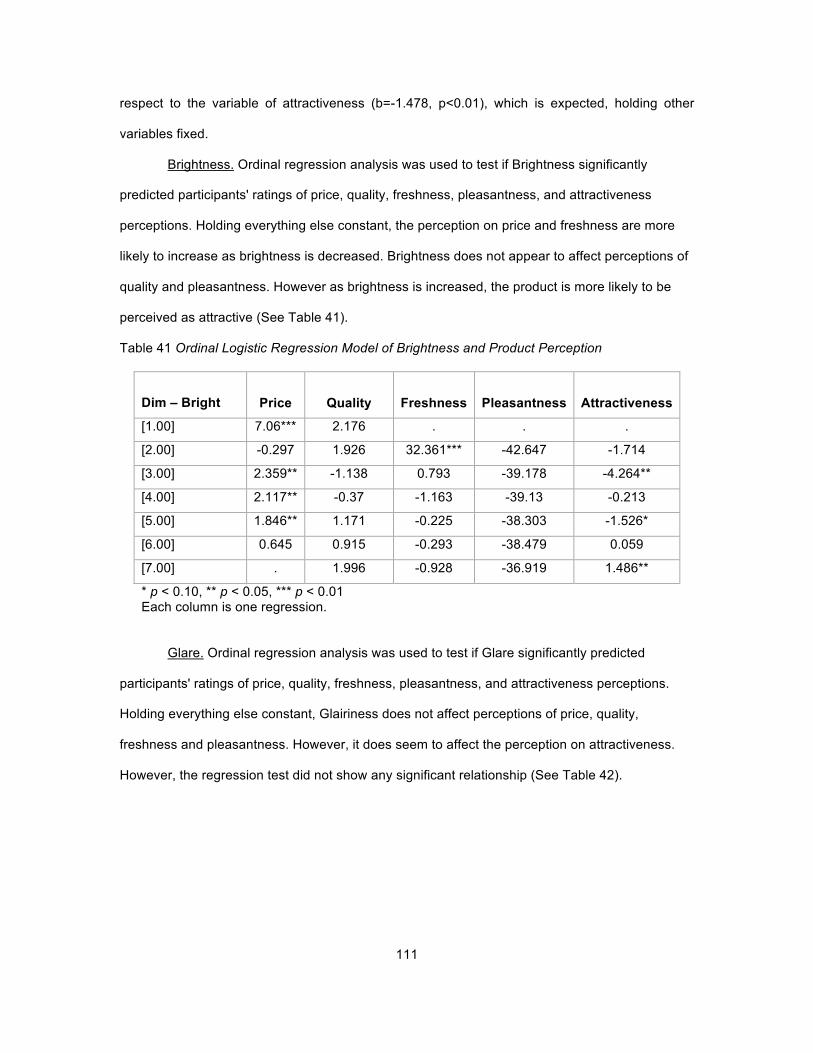
111
respect to the variable of attractiveness (b=-1.478, p<0.01), which is expected, holding other
variables fixed.
Brightness. Ordinal regression analysis was used to test if Brightness significantly
predicted participants' ratings of price, quality, freshness, pleasantness, and attractiveness
perceptions. Holding everything else constant, the perception on price and freshness are more
likely to increase as brightness is decreased. Brightness does not appear to affect perceptions of
quality and pleasantness. However as brightness is increased, the product is more likely to be
perceived as attractive (See Table 41).
Table 41 Ordinal Logistic Regression Model of Brightness and Product Perception
Dim – Bright Price Quality Freshness Pleasantness Attractiveness
[1.00] 7.06*** 2.176 . . .
[2.00] -0.297 1.926 32.361*** -42.647 -1.714
[3.00] 2.359** -1.138 0.793 -39.178 -4.264**
[4.00] 2.117** -0.37 -1.163 -39.13 -0.213
[5.00] 1.846** 1.171 -0.225 -38.303 -1.526*
[6.00] 0.645 0.915 -0.293 -38.479 0.059
[7.00] . 1.996 -0.928 -36.919 1.486**
* p < 0.10, ** p < 0.05, *** p < 0.01 Each column is one regression.
Glare. Ordinal regression analysis was used to test if Glare significantly predicted
participants' ratings of price, quality, freshness, pleasantness, and attractiveness perceptions.
Holding everything else constant, Glairiness does not affect perceptions of price, quality,
freshness and pleasantness. However, it does seem to affect the perception on attractiveness.
However, the regression test did not show any significant relationship (See Table 42).

112
Table 42 Ordinal Logistic Regression Model of Glare and Product Perception
Glare – Non-
Glare Price Quality Freshness Pleasantness Attractiveness
[1.00] -0.17 -3.025 -0.639 . -2.106*
[2.00] -1.288 -0.746 0.714 2.891 -2.453***
[3.00] -1.32 -2.416 0.477 0.577 -1.482*
[4.00] -0.177 -1.342 1.312* 1.474 -3.144***
[5.00] 0.019 -1.534 1.083 1.33 -0.117
[6.00] -2.375 -1.903 1.083 1.357 -1.93***
* p < 0.10, ** p < 0.05, *** p < 0.01 Each column is one regression.
Clarity. Ordinal regression analysis was used to test if Clarity significantly predicted
participants' ratings of price, quality, freshness, pleasantness, and attractiveness perceptions.
Holding everything else constant, Clarity affects perceptions of quality and freshness but not
perceptions on price, pleasantness, and attractiveness (See Table 43).
Table 43 Ordinal Logistic Regression Model of Clarity and Product Perception
Hazy - Clear Price Quality Freshness Pleasantness Attractiveness
[1.00] -0.511 . 36.773*** 0.973 0.783
[2.00] -0.643 15.228*** 28.721*** . -1.846
[3.00] 0.599 -3.093 30.217*** 6.054 -4.765
[4.00] 0.578 -2.086 29.393*** -1.481 -3.086
[5.00] 0.271 -2.548 30.532*** -1.691* -2.742
[6.00] -0.222 -1.116 31.431*** -1.096 -1.821
[7.00] 1.284 -1.112 30.606*** -0.493 -2.1
* p < 0.10, ** p < 0.05, *** p < 0.01 Each column is one regression.
Color Temperature. Ordinal regression analysis was used to test if Color Temperature
significantly predicted participants' ratings of price, quality, freshness, pleasantness, and
attractiveness perceptions. Holding everything else constant, Color Temperature primarily affects
perceptions of attractiveness, as the 7 values show significance of p < 0.05. However, the
direction and nature of the relationship could not be identified. Results also show that color

113
temperature has an affect on quality, pleasantness, but scores indicate that this may due to
chance. Results suggest that color temperature does not affect perceptions of price and
freshness (See Table 44).
Table 44 Ordinal Logistic Regression Model of Color Temperature and Product Perception
Cool - Warm Price Quality Freshness Pleasantness Attractiveness
[1.00] -2.623 . -0.213 . -5.868**
[2.00] -4.026 0.134 -0.935 -2.949** -7.015**
[3.00] -3.824 -0.81 -0.044 0.321 -8.209***
[4.00] -3.451 -0.684 0.489 -0.135 -8.847***
[5.00] -2.406 -0.846 -0.267 0.315 -7.899***
[6.00] -4.007 -2.03** 0.771 0.309 -6.51**
[7.00] -3.583 -1.403 . 0.655 -6.385**
* p < 0.10, ** p < 0.05, *** p < 0.01 Each column is one regression.
Radiance. Ordinal regression analysis was used to test if Radiance significantly predicted
participants' perception ratings of price, quality, freshness, pleasantness, and attractiveness.
Holding everything else constant, Radiance affects perceptions of price but the nature and
direction of the relationship cannot be predicted. Results also show that Radiance has an affect
on quality (p < 0.01), however this may due to chance. Results indicate that radiance does not
affect perceptions of freshness, pleasantness, and attractiveness. (See Table 45).
Table 45 Ordinal Logistic Regression Model of Radiance and Product Perception
Dull - Radiant Price Quality Freshness Pleasantness Attractiveness
[1.00] -1.562 -18.741*** -0.158 -3.522 -3.822
[2.00] -5.583** -1.234 0.615 -0.498 -3.752
[3.00] -3.564* -2.303 0.55 -0.124 -1.703
[4.00] -3.254 -2.992 0.079 -0.048 0.452
[5.00] -4.077* -2.21 0.967 -0.622 -0.245
[6.00] -1.782 -2.521 1.301 -0.058 -0.346
[7.00] -2.134 -1.452 . -1.006 -0.861
* p < 0.10, ** p < 0.05, *** p < 0.01 Each column is one regression.
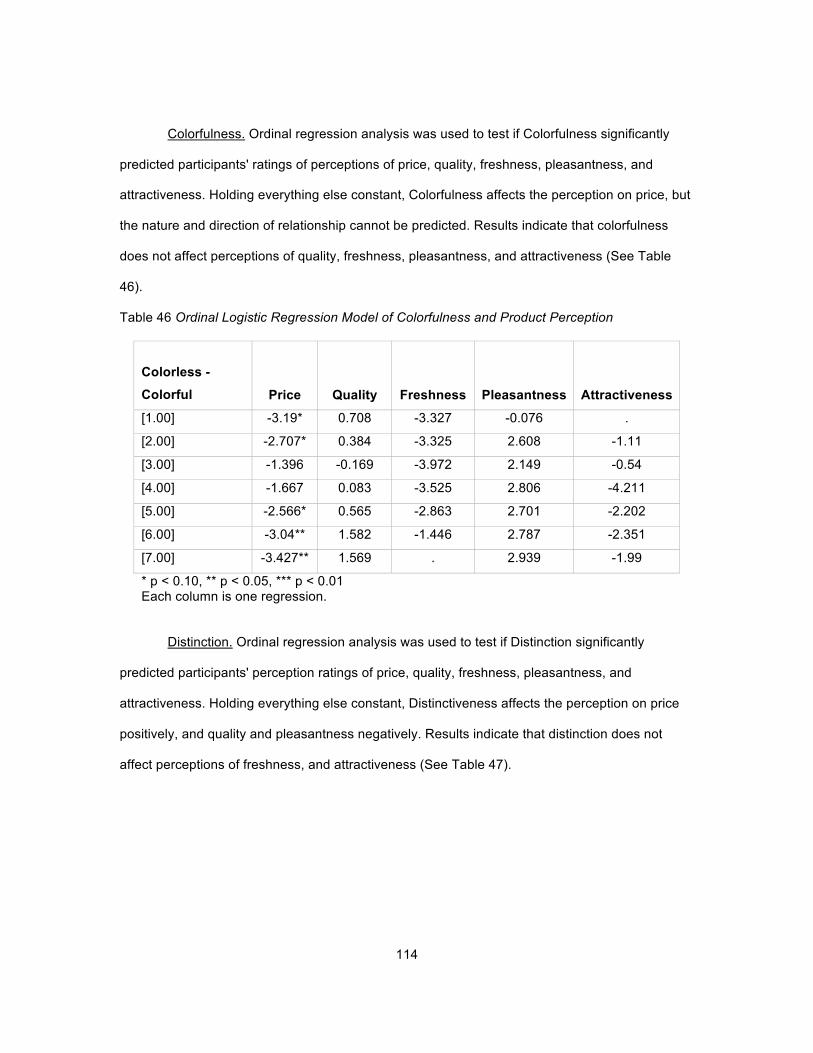
114
Colorfulness. Ordinal regression analysis was used to test if Colorfulness significantly
predicted participants' ratings of perceptions of price, quality, freshness, pleasantness, and
attractiveness. Holding everything else constant, Colorfulness affects the perception on price, but
the nature and direction of relationship cannot be predicted. Results indicate that colorfulness
does not affect perceptions of quality, freshness, pleasantness, and attractiveness (See Table
46).
Table 46 Ordinal Logistic Regression Model of Colorfulness and Product Perception
Colorless - Colorful Price Quality Freshness Pleasantness Attractiveness
[1.00] -3.19* 0.708 -3.327 -0.076 .
[2.00] -2.707* 0.384 -3.325 2.608 -1.11
[3.00] -1.396 -0.169 -3.972 2.149 -0.54
[4.00] -1.667 0.083 -3.525 2.806 -4.211
[5.00] -2.566* 0.565 -2.863 2.701 -2.202
[6.00] -3.04** 1.582 -1.446 2.787 -2.351
[7.00] -3.427** 1.569 . 2.939 -1.99
* p < 0.10, ** p < 0.05, *** p < 0.01 Each column is one regression.
Distinction. Ordinal regression analysis was used to test if Distinction significantly
predicted participants' perception ratings of price, quality, freshness, pleasantness, and
attractiveness. Holding everything else constant, Distinctiveness affects the perception on price
positively, and quality and pleasantness negatively. Results indicate that distinction does not
affect perceptions of freshness, and attractiveness (See Table 47).

115
Table 47 Ordinal Logistic Regression Model of Distinction and Product Perception
Vague -
Distinct Price Quality Freshness Pleasantness Attractiveness
[1.00] 0.082 -16.943*** -2.605 -6.976** .
[2.00] 2.365* -20.014*** -1.665 -3.112 2.131
[3.00] 2.692** -21.093*** -1.913 -4.366 0.305
[4.00] 0.684 -19.097*** -1.287 -2.488 1.681
[5.00] 1.053 -20.078*** -1.022 -3.246 -0.247
[6.00] 1.722** -19.993*** -2.966 -1.906 0.145
[7.00] . -19.995*** . -3.249 .
* p < 0.10, ** p < 0.05, *** p < 0.01 Each column is one regression.
Focusness. Ordinal regression analysis was used to test if Focusness significantly
predicted participants' perception ratings of price, quality, freshness, pleasantness, and
attractiveness. Holding everything else constant, Focusness affects the perception of quality
positively, but price and freshness negatively. Results indicate that Focusness of lighting does not
affect perceptions of pleasantness, and attractiveness (See Table 48).
Table 48 Ordinal Logistic Regression Model of Focusness and Product Perception
Unfocused -
Focused Price Quality Freshness Pleasantness Attractiveness
[1.00] -5.805* . -3.099** . 1.009
[2.00] -7.748** -14.796*** -2.677* 2.546* 3.488
[3.00] -4.498 -0.231 -1.438 -4.206 2.623
[4.00] -5.733** 1.904 -3.058*** -2.025* 3.215
[5.00] -4.526* 2.92*** -1.83*** -1.098 2.429
[6.00] -5.869** 1.27* -2.097*** -0.696 2.319
[7.00] -4.785* 1.665*** . -0.381 4.551*
* p < 0.10, ** p < 0.05, *** p < 0.01 Each column is one regression.
Complexity. Multiple regression analysis was used to test if Complexity significantly
predicted participants' perception ratings of price, quality, freshness, pleasantness, and
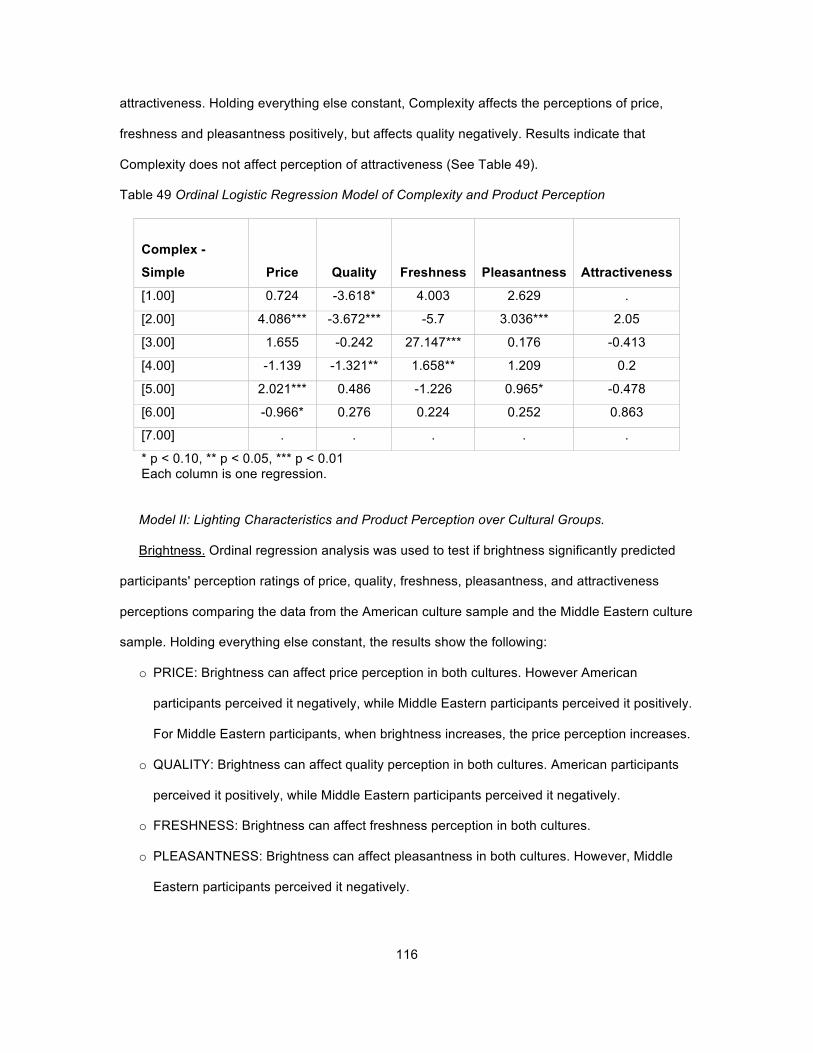
116
attractiveness. Holding everything else constant, Complexity affects the perceptions of price,
freshness and pleasantness positively, but affects quality negatively. Results indicate that
Complexity does not affect perception of attractiveness (See Table 49).
Table 49 Ordinal Logistic Regression Model of Complexity and Product Perception
Complex -
Simple Price Quality Freshness Pleasantness Attractiveness
[1.00] 0.724 -3.618* 4.003 2.629 .
[2.00] 4.086*** -3.672*** -5.7 3.036*** 2.05
[3.00] 1.655 -0.242 27.147*** 0.176 -0.413
[4.00] -1.139 -1.321** 1.658** 1.209 0.2
[5.00] 2.021*** 0.486 -1.226 0.965* -0.478
[6.00] -0.966* 0.276 0.224 0.252 0.863
[7.00] . . . . .
* p < 0.10, ** p < 0.05, *** p < 0.01 Each column is one regression.
Model II: Lighting Characteristics and Product Perception over Cultural Groups.
Brightness. Ordinal regression analysis was used to test if brightness significantly predicted
participants' perception ratings of price, quality, freshness, pleasantness, and attractiveness
perceptions comparing the data from the American culture sample and the Middle Eastern culture
sample. Holding everything else constant, the results show the following:
o PRICE: Brightness can affect price perception in both cultures. However American
participants perceived it negatively, while Middle Eastern participants perceived it positively.
For Middle Eastern participants, when brightness increases, the price perception increases.
o QUALITY: Brightness can affect quality perception in both cultures. American participants
perceived it positively, while Middle Eastern participants perceived it negatively.
o FRESHNESS: Brightness can affect freshness perception in both cultures.
o PLEASANTNESS: Brightness can affect pleasantness in both cultures. However, Middle
Eastern participants perceived it negatively.
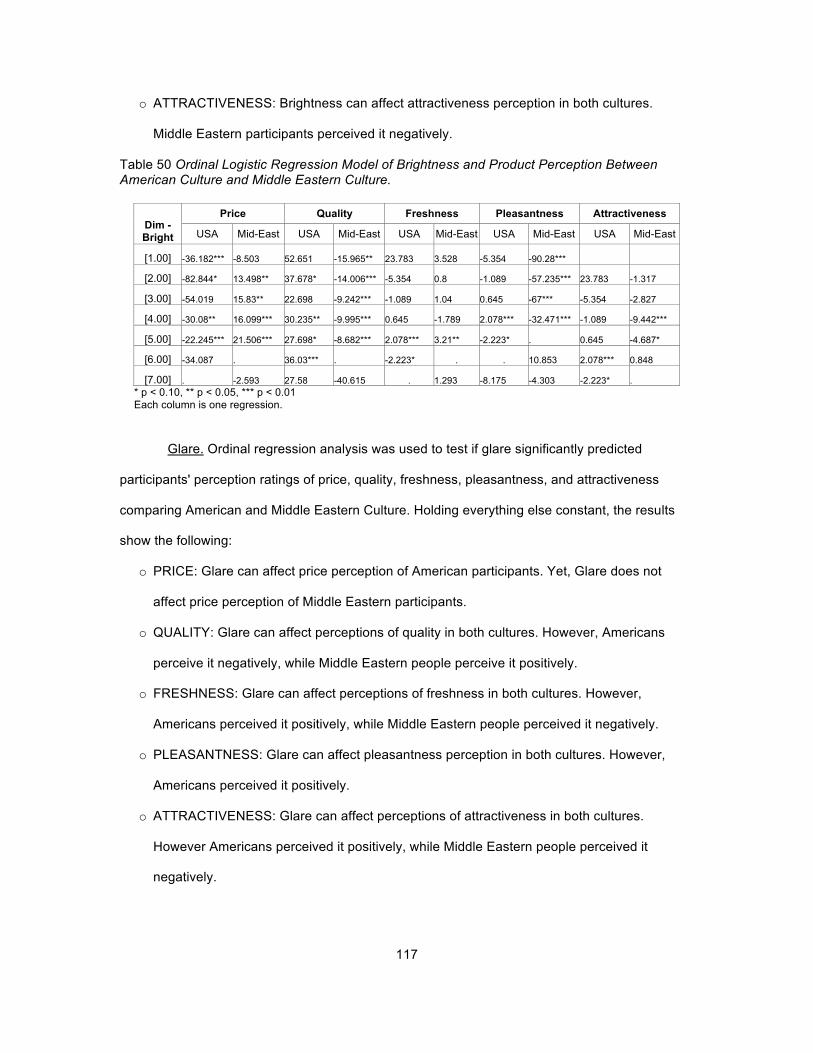
117
o ATTRACTIVENESS: Brightness can affect attractiveness perception in both cultures.
Middle Eastern participants perceived it negatively.
Table 50 Ordinal Logistic Regression Model of Brightness and Product Perception Between American Culture and Middle Eastern Culture.
Price Quality Freshness Pleasantness Attractiveness Dim - Bright USA Mid-East USA Mid-East USA Mid-East USA Mid-East USA Mid-East
[1.00] -36.182*** -8.503 52.651 -15.965** 23.783 3.528 -5.354 -90.28***
[2.00] -82.844* 13.498** 37.678* -14.006*** -5.354 0.8 -1.089 -57.235*** 23.783 -1.317
[3.00] -54.019 15.83** 22.698 -9.242*** -1.089 1.04 0.645 -67*** -5.354 -2.827
[4.00] -30.08** 16.099*** 30.235** -9.995*** 0.645 -1.789 2.078*** -32.471*** -1.089 -9.442***
[5.00] -22.245*** 21.506*** 27.698* -8.682*** 2.078*** 3.21** -2.223* . 0.645 -4.687*
[6.00] -34.087 . 36.03*** . -2.223* . . 10.853 2.078*** 0.848
[7.00] . -2.593 27.58 -40.615 . 1.293 -8.175 -4.303 -2.223* . * p < 0.10, ** p < 0.05, *** p < 0.01 Each column is one regression.
Glare. Ordinal regression analysis was used to test if glare significantly predicted
participants' perception ratings of price, quality, freshness, pleasantness, and attractiveness
comparing American and Middle Eastern Culture. Holding everything else constant, the results
show the following:
o PRICE: Glare can affect price perception of American participants. Yet, Glare does not
affect price perception of Middle Eastern participants.
o QUALITY: Glare can affect perceptions of quality in both cultures. However, Americans
perceive it negatively, while Middle Eastern people perceive it positively.
o FRESHNESS: Glare can affect perceptions of freshness in both cultures. However,
Americans perceived it positively, while Middle Eastern people perceived it negatively.
o PLEASANTNESS: Glare can affect pleasantness perception in both cultures. However,
Americans perceived it positively.
o ATTRACTIVENESS: Glare can affect perceptions of attractiveness in both cultures.
However Americans perceived it positively, while Middle Eastern people perceived it
negatively.

118
Table 51 Ordinal Logistic Regression Model of Glare and Product Perception Between American Culture and Middle Eastern Culture
Price Quality Freshness Pleasantness Attractiveness Glare – Non-Glare USA Mid-East USA Mid-East USA Mid-East USA Mid-East USA Mid-East
[1.00] 0.847 31.184 . -0.28 -8.175 -3.172* 3.926*** -21.015** . -5.175**
[2.00] 4.574 19.061 40.789 -3.873* 3.926*** 0.157 3.118*** 7.447 -8.175 -4.851*
[3.00] -12.815 17.637 20.596 -4.729** 3.118*** 0.118 6.319*** 12.606 3.926*** -3.327
[4.00] -3.1 11.695 7.543 -5.273*** 6.319*** -2.518 5.588*** 17.961* 3.118*** -7.684***
[5.00] 0.398*** 20.001 13.01 -0.865 5.588*** 0.308 4.663 . 6.319*** 3.529
[6.00] 7.361 12.851 11.989 . 4.663 . . 187.306*** 5.588*** -8.635***
[7.00] . . 4.607*** 11.839 . -10.133*** 38.179 -110.274*** 4.663 . * p < 0.10, ** p < 0.05, *** p < 0.01 Each column is one regression.
Clarity. Ordinal regression analysis was used to test if Clarity significantly predicted
participants' perception ratings of price, quality, freshness, pleasantness, and attractiveness
comparing data from American and Middle Eastern participants. Holding everything else
constant, the results show the following:
o PRICE: Clarity can affect price perception of American participants. However, Clarity does
not affect price perception of Middle Eastern participants.
o QUALITY: Clarity can affect quality perception in both cultures negatively.
o FRESHNESS: Clarity can affect freshness perception of American participants. However,
Clarity does not affect freshness perception of Middle Eastern participants.
o PLEASANTNESS: Clarity can affect pleasantness perception in both cultures. However,
Middle Eastern people perceived it negatively.
o ATTRACTIVENESS: Clarity can affect attractiveness perception of American participants.
However, Clarity does not affect attractiveness perception of Middle Eastern participants.
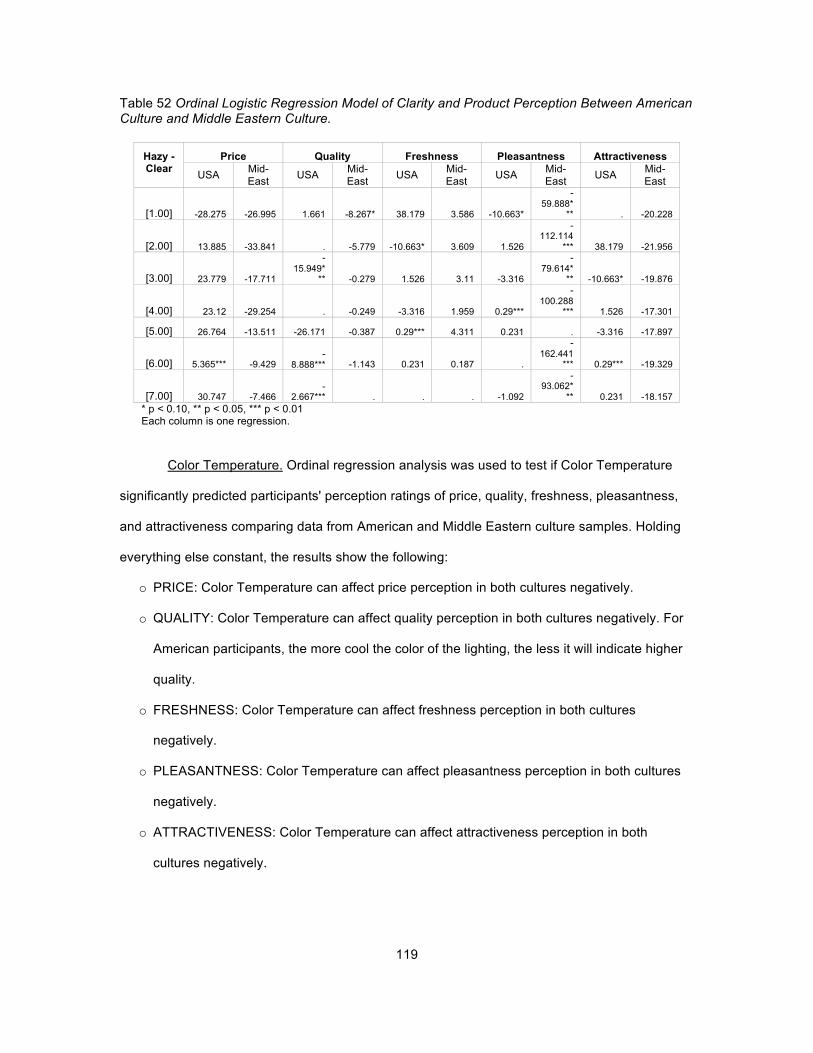
119
Table 52 Ordinal Logistic Regression Model of Clarity and Product Perception Between American Culture and Middle Eastern Culture.
Price Quality Freshness Pleasantness Attractiveness Hazy - Clear
USA Mid-East USA Mid-
East USA Mid-East USA Mid-
East USA Mid-East
[1.00] -28.275 -26.995 1.661 -8.267* 38.179 3.586 -10.663*
-59.888*
** . -20.228
[2.00] 13.885 -33.841 . -5.779 -10.663* 3.609 1.526
-112.114
*** 38.179 -21.956
[3.00] 23.779 -17.711
-15.949*
** -0.279 1.526 3.11 -3.316
-79.614*
** -10.663* -19.876
[4.00] 23.12 -29.254 . -0.249 -3.316 1.959 0.29***
-100.288
*** 1.526 -17.301
[5.00] 26.764 -13.511 -26.171 -0.387 0.29*** 4.311 0.231 . -3.316 -17.897
[6.00] 5.365*** -9.429 -
8.888*** -1.143 0.231 0.187 .
-162.441
*** 0.29*** -19.329
[7.00] 30.747 -7.466 -
2.667*** . . . -1.092
-93.062*
** 0.231 -18.157 * p < 0.10, ** p < 0.05, *** p < 0.01 Each column is one regression.
Color Temperature. Ordinal regression analysis was used to test if Color Temperature
significantly predicted participants' perception ratings of price, quality, freshness, pleasantness,
and attractiveness comparing data from American and Middle Eastern culture samples. Holding
everything else constant, the results show the following:
o PRICE: Color Temperature can affect price perception in both cultures negatively.
o QUALITY: Color Temperature can affect quality perception in both cultures negatively. For
American participants, the more cool the color of the lighting, the less it will indicate higher
quality.
o FRESHNESS: Color Temperature can affect freshness perception in both cultures
negatively.
o PLEASANTNESS: Color Temperature can affect pleasantness perception in both cultures
negatively.
o ATTRACTIVENESS: Color Temperature can affect attractiveness perception in both
cultures negatively.

120
Table 53 Ordinal Logistic Regression Model of Color Temperature and Product Perception Between American Culture and Middle Eastern Culture.
Price Quality Freshness Pleasantness Attractiveness Cool - Warm USA Mid-
East USA Mid-East USA Mid-
East USA Mid-East USA Mid-
East
[1.00] -135.31
-16.401** . 0.797 -1.092 -8.532** -2.143
-49.568*** . .
[2.00] -138.986
-22.312** . -6.471 -2.143
-9.161*** -0.354
-87.209*** -1.092 -7.362*
[3.00]
-113.283*
-19.926** -7.696*
-5.784*** -0.354 -4.016** 1.47
-56.631*** -2.143
-15.846***
[4.00] -100.935
-19.264*** -8.652** -3.572* 1.47
-5.367*** -1.45***
-48.976*** -0.354 -3.242
[5.00]
-135.527* -9.561**
-9.495*** -0.949 -1.45***
-5.861*** 2.047*** . 1.47
-17.861***
[6.00]
-111.037***
-33.366***
-12.993*** . 2.047*** -3.902** .
-297.783*** -1.45***
-14.711***
[7.00] -134.085 .
-21.636*** -51.457 . . .
-292.653*** 2.047*** -3.673
* p < 0.10, ** p < 0.05, *** p < 0.01 Each column is one regression.
Radiance. Ordinal regression analysis was used to test if Radiance significantly predicted
participants' perception ratings of price, quality, freshness, pleasantness, and attractiveness
comparing data from American and Middle Eastern sample populations. Holding everything else
constant, the results show the following:
o PRICE: Radiance can affect price perception negatively in American participants. However,
Radiance does not affect perceptions of Middle Eastern participants.
o QUALITY: Radiance can affect quality perception negatively in American participants.
However, Radiance did not affect Middle Eastern participants.
o FRESHNESS: Radiance can affect freshness perceptions in both cultures. However,
Americans perceived it positively while Middle Eastern people perceived it negatively.
o PLEASANTNESS: Radiance can affect pleasantness perceptions in both cultures.
However, Americans perceived it positively while Middle Eastern people perceived it
negatively.
o ATTRACTIVENESS: Radiance can affect attractiveness perceptions positively in American
participants. However, Radiance did not affect Middle Eastern participants.

121
Table 54 Ordinal Logistic Regression Model of Radiance and Product Perception Between American Culture and Middle Eastern Culture
Price Quality Freshness Pleasantness Attractiveness
USA Mid-East USA Mid-
East USA Mid-East USA Mid-
East USA Mid-East
[1.00] -37.125 -58.17 . -28.518 . -7.75 0.679**
-247.16*** . .
[2.00] -76.154 -46.701 -32.048 -27.768 0.679** -1.183 -0.323
-223.589*** 0.679** -4.926
[3.00] -68.881 -41.202 -5.396 -30.274 -0.323 -2.212 5.214
-167.771*** -0.323 -10.776
[4.00] -71.857 -40.247 6.071 -30.937 5.214 -3.848** 1.616
-128.453*** 5.214 5.029
[5.00] -87.662 -24.405 -5.024 -36.828 1.616 -1.813 3.575***
-181.899*** 1.616 -2.363
[6.00] -72.163*** -42.176 -0.856 . 3.575*** -0.278 3.867*** . 3.575*** -2.182
[7.00] -92.449 .
-2.782*** 20.31 3.867*** . .
152.036*** 3.867*** -2.371
* p < 0.10, ** p < 0.05, *** p < 0.01 Each column is one regression.
Colorfulness. Ordinal regression analysis was used to test if Colorfulness significantly
predicted participants' perception ratings of price, quality, freshness, pleasantness, and
attractiveness comparing data from American and Middle Eastern sample populations. Holding
everything else constant, the results show the following:
o PRICE: Colorfulness can affect price perception in both cultures. However, Americans
perceived it positively, while Middle Eastern people perceived it negatively.
o QUALITY: Colorfulness affected quality perception in American participants only. However,
Colorfulness did not affect quality perception in Middle Eastern participants.
o FRESHNESS: Colorfulness can affect freshness perception in both cultures negatively.
o PLEASANTNESS: Colorfulness can affect pleasantness perception in both cultures.
However, Americans perceived it negatively, while Middle Easterners perceived it positively.
o ATTRACTIVENESS: Colorfulness can affect attractiveness perception in both cultures
negatively.
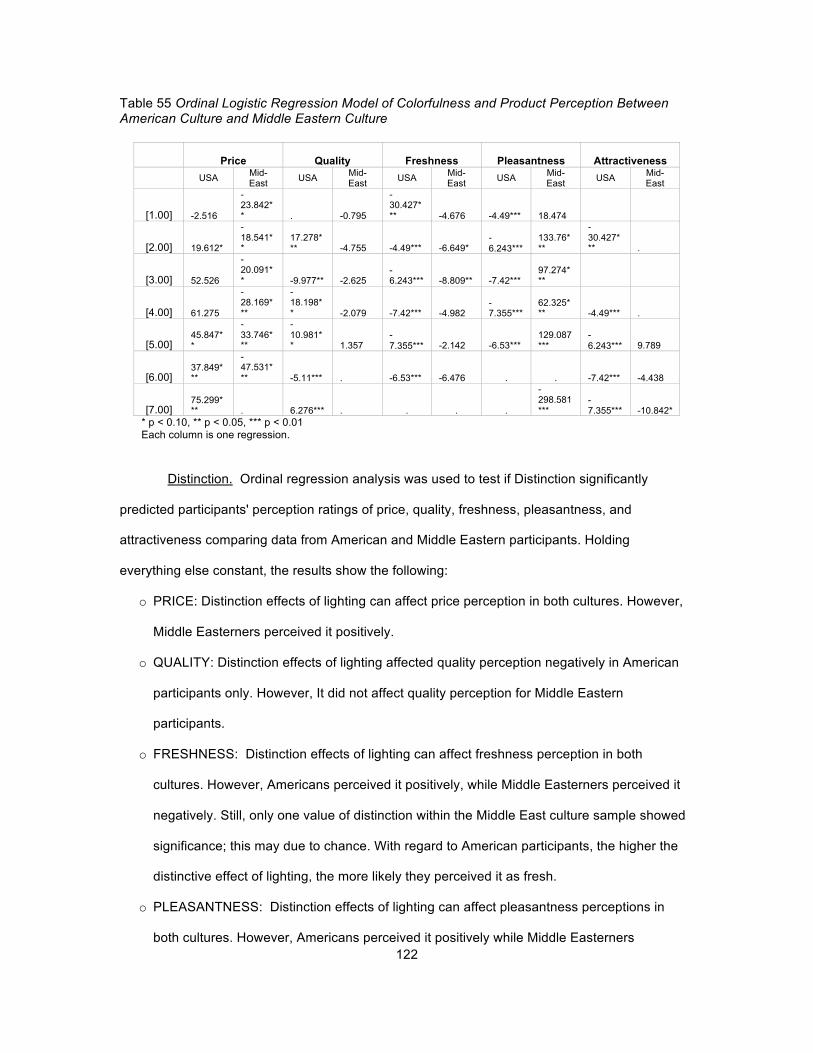
122
Table 55 Ordinal Logistic Regression Model of Colorfulness and Product Perception Between American Culture and Middle Eastern Culture
Price Quality Freshness Pleasantness Attractiveness
USA Mid-East USA Mid-
East USA Mid-East USA Mid-
East USA Mid-East
[1.00] -2.516
-23.842** . -0.795
-30.427*** -4.676 -4.49*** 18.474
[2.00] 19.612*
-18.541**
17.278*** -4.755 -4.49*** -6.649*
-6.243***
133.76***
-30.427*** .
[3.00] 52.526
-20.091** -9.977** -2.625
-6.243*** -8.809** -7.42***
97.274***
[4.00] 61.275
-28.169***
-18.198** -2.079 -7.42*** -4.982
-7.355***
62.325*** -4.49*** .
[5.00] 45.847**
-33.746***
-10.981** 1.357
-7.355*** -2.142 -6.53***
129.087***
-6.243*** 9.789
[6.00] 37.849***
-47.531*** -5.11*** . -6.53*** -6.476 . . -7.42*** -4.438
[7.00] 75.299*** . 6.276*** . . . .
-298.581***
-7.355*** -10.842*
* p < 0.10, ** p < 0.05, *** p < 0.01 Each column is one regression.
Distinction. Ordinal regression analysis was used to test if Distinction significantly
predicted participants' perception ratings of price, quality, freshness, pleasantness, and
attractiveness comparing data from American and Middle Eastern participants. Holding
everything else constant, the results show the following:
o PRICE: Distinction effects of lighting can affect price perception in both cultures. However,
Middle Easterners perceived it positively.
o QUALITY: Distinction effects of lighting affected quality perception negatively in American
participants only. However, It did not affect quality perception for Middle Eastern
participants.
o FRESHNESS: Distinction effects of lighting can affect freshness perception in both
cultures. However, Americans perceived it positively, while Middle Easterners perceived it
negatively. Still, only one value of distinction within the Middle East culture sample showed
significance; this may due to chance. With regard to American participants, the higher the
distinctive effect of lighting, the more likely they perceived it as fresh.
o PLEASANTNESS: Distinction effects of lighting can affect pleasantness perceptions in
both cultures. However, Americans perceived it positively while Middle Easterners

123
perceived it negatively. For American participants, the higher the distinctive effect of
lighting, the more likely they perceive it as pleasant.
o ATTRACTIVENESS: Distinction effects of lighting can affect attractiveness perception in
both cultures. However, Americans perceived it positively while Middle Easterners
perceived it negatively. For American participants, the higher the distinction effect of
lighting, the more likely the product will look attractive
Table 56 Ordinal Logistic Regression Model of Distinction and Product Perception Between American Culture and Middle Eastern Culture
Price Quality Freshness Pleasantness Attractiveness
USA Mid-East USA Mid-
East USA Mid-East USA Mid-
East USA Mid-East
[1.00] -75.541 45.966*** . 0.33 . -16.652* 2.48***
-96.382*** -6.53*** -6.537
[2.00] 16.047 10.777** . 2.99 2.48*** -2.492 6.615*** 59.608 . -6.161
[3.00] 19.552* 1.208 -8.454** -0.071 6.615*** -5.173 6.4*** -21.907 . .
[4.00] -5.138 4.314 11.274** 3.445 6.4*** -2.108 7.36***
-77.557*** 2.48*** .
[5.00]
-20.897*** .
-9.111*** -2.102 7.36*** -5.491 9.399***
-61.584*** 6.615***
-37.957***
[6.00] -1.835 -33.305 -6.916*** . 9.399*** -1.666 .
-112.998*** 6.4***
-17.934**
[7.00] . -6.603 . . . -5.025 . . 7.36*** 6.313 * p < 0.10, ** p < 0.05, *** p < 0.01 Each column is one regression.
Focusness. Ordinal regression analysis was used to test if Focusness significantly
predicted participants' perception ratings of price, quality, freshness, pleasantness, and
attractiveness comparing data from American and Middle Eastern participants. Holding
everything else constant, the results show the following:
o PRICE: The focus effect of lighting affected price perception of product in Americans
participants only. However, it did not affect Middle Eastern participants.
o QUALITY: The focus effect of lighting can affect quality perception of product in both
cultures. However, Americans perceived it negatively.
o FRESHNESS: The focus effect of lighting can affect freshness perception of product in both
cultures negatively.

124
o PLEASANTNESS: The focus effect of lighting can affect pleasantness perception of product
in both cultures negatively.
o ATTRACTIVENESS: The focus effect of lighting can affect attractiveness perception of
product in both cultures. However, Americans perceived this effect negatively, while Middle
Easterners perceived it positively.
Table 57 Ordinal Logistic Regression Model of Focusness and Product Perception Between American Culture and Middle Eastern Culture.
Price Quality Freshness Pleasantness Attractiveness
USA Mid-East USA Mid-
East USA Mid-East USA Mid-
East USA Mid-East
[1.00]
. .
-10.162**
148.019***
[2.00] 43.653 -15.28 . -4.221
9.399*** 10.082***
[3.00] 8.207*** -42.516* -1.088 3.461 -9.904*** -0.018
-6.935***
-28.299** . 3.499**
[4.00] -6.466* -27.924 15.75 8.997*** -6.935*** -6.391** -8.318
-23.981*** . .
[5.00] 23.416*** -36.552
-2.506*** -1.137 -8.318 -3.986** .
-38.382***
-10.162**
23.509***
[6.00] 21.096 -27.762 -1.173*** 0.841 . -1.849 -27.987
-14.099***
-9.904*** .
[7.00] . . . .
-
6.935*** 17.388 * p < 0.10, ** p < 0.05, *** p < 0.01 Each column is one regression.
Complexity. Ordinal regression analysis was used to test if Complexity significantly
predicted participants' perception ratings of price, quality, freshness, pleasantness, and
attractiveness comparing data from American and Middle Eastern participants. Holding
everything else constant, the results show the following:
o PRICE: Complexity effects of lighting can affect price perception in both cultures.
o QUALITY: Complexity effects of lighting can affect quality perception on both cultures.
o FRESHNESS: Complexity effects of lighting can affect freshness perception on Americans
participants only, who can perceive it negatively.
o PLEASANTNESS: Complexity effects of lighting can affect pleasantness perception in both
cultures.

125
o ATTRACTIVENESS: Complexity effects of lighting can affect attractiveness perception in
both cultures. However, Americans perceived this effect negatively while Middle Eastern
perceived it positively.
Table 58 Ordinal Logistic Regression Model of Complexity and Product Perception Between American Culture and Middle Eastern Culture.
Price Quality Freshness Pleasantness Attractiveness
USA Mid-East USA Mid-
East USA Mid-East USA Mid-
East USA Mid-East
[1.00] 27.073 21.421 .
-13.625***
[2.00] 92.828 34.563*** -33.941 -3.191 -27.987 -0.734 5.577 . -8.318
16.307**
[3.00] 32.447 41.867** 4.186*** 4.728*
. 14.924*
[4.00] 10.21 -7.202** -0.819** -0.06 5.577 . -1.571*** -22.445 -27.987
19.387**
[5.00] 7.012***
-17.272***
12.825*** 1.089
-1.571*** .
-0.679***
123.931*** 5.577 23.32**
[6.00]
-14.627***
-10.312** 5.089*** 0.286
-0.679*** 0.062 . 3.636
-1.571*** .
[7.00] . . . . . . 0*** 91.107***
-0.679*** .
* p < 0.10, ** p < 0.05, *** p < 0.01 Each column is one regression.
Phase II: Qualitative Interviews Analysis and Discussion
Overview. Phase II was developed to examine the insights of participants regarding their
perceptions of light and their product preferences in simulated retail environment. Participants
were divided into two groups based on cultural background, being American and Middle Eastern,
so that responses could be compared and analyzed for patterns related to cultural background.
Each group had ten participants. The Middle Eastern group consisted of six females and four
males, while the American group consisted of seven females and three males. Middle Eastern
participants were given the option to have the interview conducted in English, Arabic or in both
languages. The average length of an interview was thirty minutes. All interviews were recorded
using Audionote software and interviews were transcribed using a professional transcription
company. The interview protocol is provided in (Appendix D) and a sample of a transcribed
interview is provided in (Appendix X). Using this qualitative method, this study was able to also
126
touch on informative issues such as: impulse buying behavior and retail atmospherics, lighting as
an ambiance factor, lighting characteristics, and the experience of shopping environment.
This section addresses the research objective of understanding the effect of lighting on
product perception across cultures. Summaries of key interview topics are discussed with
reference to cultural preferences. These include: self-control, mood and lighting, lighting and
impulse buying, and lighting as an ambient factor. Following this is an analysis and discussion of
which lighting characteristics (brightness, CCT, and spatial distribution) influence variables such
as price, quality, freshness, pleasantness and attractiveness. The concluding discussion in this
chapter examines findings from these key interview topics and the effect of lighting characteristics
on dependent variables assessing cultural perceptions, and suggests research trajectories for the
future.
Self-Control in Grocery Store Environment. For the American participant group,
exercising self-control in a grocery store environment tended be characterized as either
restraining an urge to buy or as sticking to a list. A common technique used by participants to
inhibit impulse purchases was to refrain from shopping while hungry. The American participant
group viewed grocery shopping as therapeutic, and recognized the importance of frugality while
shopping. A key drive in controlling impulse buying was emphasizing the health aspects of food
purchase and consumption, generally creating a dichotomy between “the things you’re supposed
to eat,” “more fresh produce,” and the “healthier option,” versus “the things you shouldn’t eat” and
“too much of processed stuff.”
For the Middle Eastern participant group, exercising self-control in a grocery store
environment was thought of as buying what one needs as opposed to what one wants. This
group placed a strong emphasis on managing their attitudes and behavior appropriately,
identifying self-control with the ability to “control yourself from buying things,” “controlling what I
want to do,” and “controlling your actions, controlling your attitudes.” However, in contrast to the
American participant group, the Middle Eastern group did not apply any techniques or practices to
assist them in exercising self-control, indicating that they did not associate maintaining control
with the application of active strategies to direct their behavior.
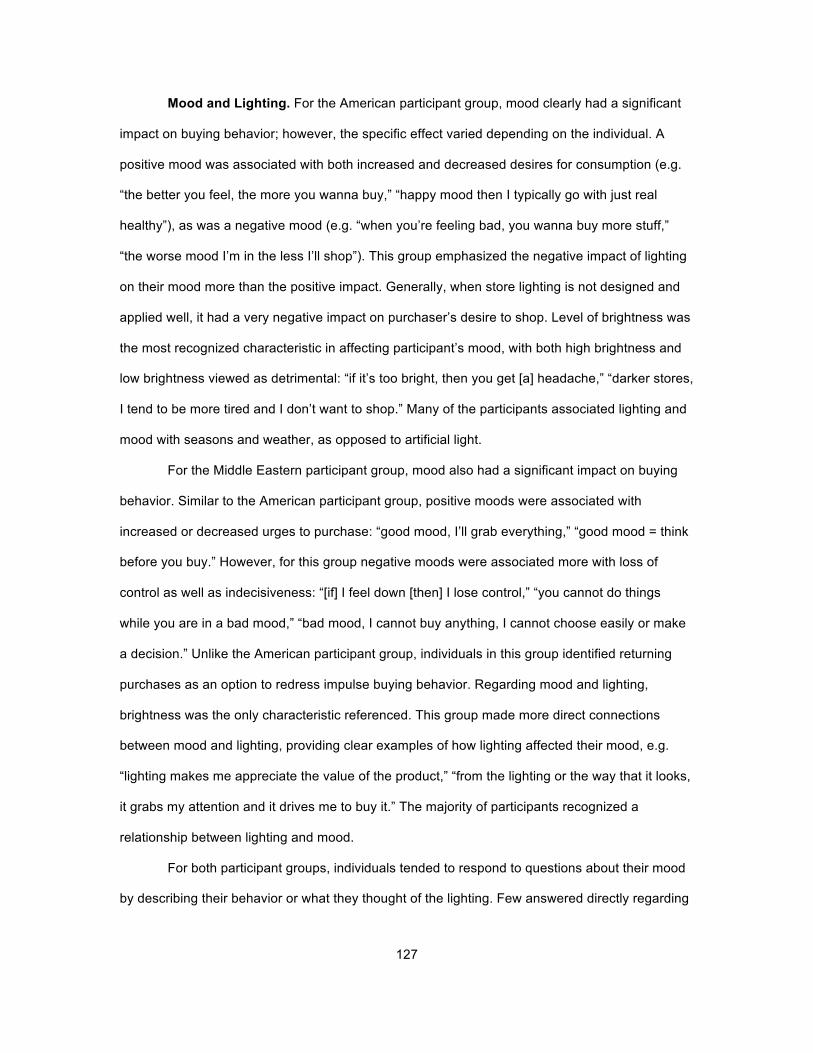
127
Mood and Lighting. For the American participant group, mood clearly had a significant
impact on buying behavior; however, the specific effect varied depending on the individual. A
positive mood was associated with both increased and decreased desires for consumption (e.g.
“the better you feel, the more you wanna buy,” “happy mood then I typically go with just real
healthy”), as was a negative mood (e.g. “when you’re feeling bad, you wanna buy more stuff,”
“the worse mood I’m in the less I’ll shop”). This group emphasized the negative impact of lighting
on their mood more than the positive impact. Generally, when store lighting is not designed and
applied well, it had a very negative impact on purchaser’s desire to shop. Level of brightness was
the most recognized characteristic in affecting participant’s mood, with both high brightness and
low brightness viewed as detrimental: “if it’s too bright, then you get [a] headache,” “darker stores,
I tend to be more tired and I don’t want to shop.” Many of the participants associated lighting and
mood with seasons and weather, as opposed to artificial light.
For the Middle Eastern participant group, mood also had a significant impact on buying
behavior. Similar to the American participant group, positive moods were associated with
increased or decreased urges to purchase: “good mood, I’ll grab everything,” “good mood = think
before you buy.” However, for this group negative moods were associated more with loss of
control as well as indecisiveness: “[if] I feel down [then] I lose control,” “you cannot do things
while you are in a bad mood,” “bad mood, I cannot buy anything, I cannot choose easily or make
a decision.” Unlike the American participant group, individuals in this group identified returning
purchases as an option to redress impulse buying behavior. Regarding mood and lighting,
brightness was the only characteristic referenced. This group made more direct connections
between mood and lighting, providing clear examples of how lighting affected their mood, e.g.
“lighting makes me appreciate the value of the product,” “from the lighting or the way that it looks,
it grabs my attention and it drives me to buy it.” The majority of participants recognized a
relationship between lighting and mood.
For both participant groups, individuals tended to respond to questions about their mood
by describing their behavior or what they thought of the lighting. Few answered directly regarding
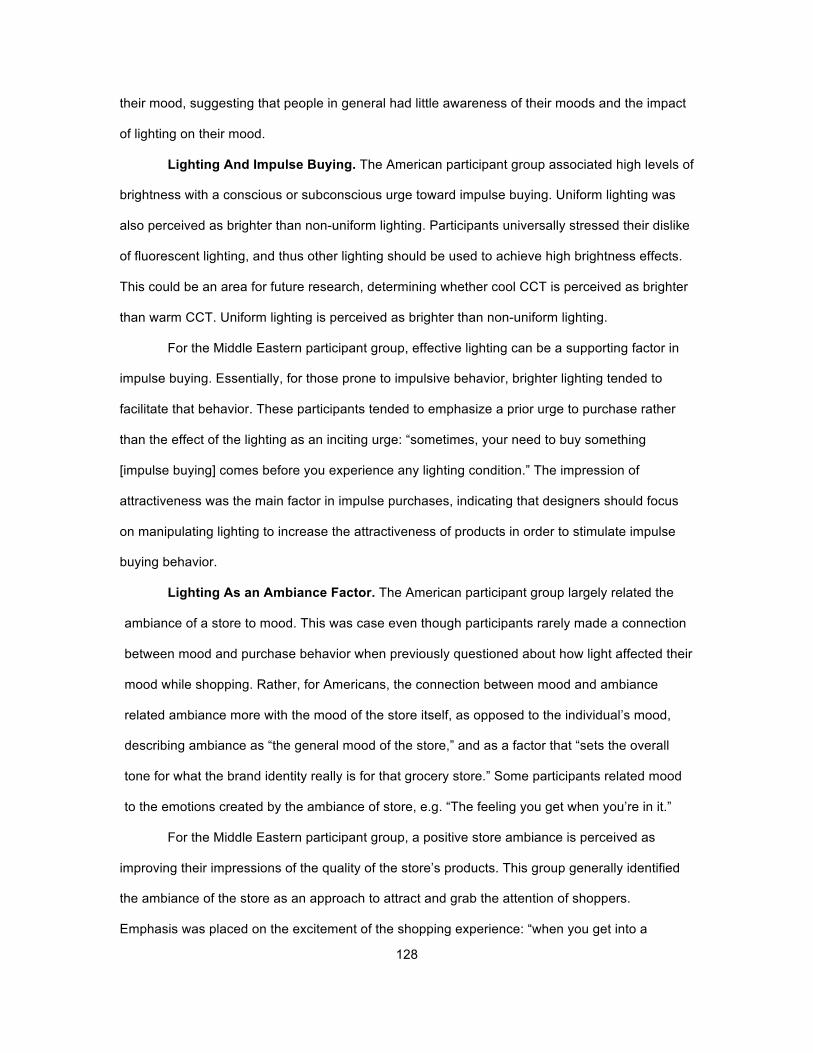
128
their mood, suggesting that people in general had little awareness of their moods and the impact
of lighting on their mood.
Lighting And Impulse Buying. The American participant group associated high levels of
brightness with a conscious or subconscious urge toward impulse buying. Uniform lighting was
also perceived as brighter than non-uniform lighting. Participants universally stressed their dislike
of fluorescent lighting, and thus other lighting should be used to achieve high brightness effects.
This could be an area for future research, determining whether cool CCT is perceived as brighter
than warm CCT. Uniform lighting is perceived as brighter than non-uniform lighting.
For the Middle Eastern participant group, effective lighting can be a supporting factor in
impulse buying. Essentially, for those prone to impulsive behavior, brighter lighting tended to
facilitate that behavior. These participants tended to emphasize a prior urge to purchase rather
than the effect of the lighting as an inciting urge: “sometimes, your need to buy something
[impulse buying] comes before you experience any lighting condition.” The impression of
attractiveness was the main factor in impulse purchases, indicating that designers should focus
on manipulating lighting to increase the attractiveness of products in order to stimulate impulse
buying behavior.
Lighting As an Ambiance Factor. The American participant group largely related the
ambiance of a store to mood. This was case even though participants rarely made a connection
between mood and purchase behavior when previously questioned about how light affected their
mood while shopping. Rather, for Americans, the connection between mood and ambiance
related ambiance more with the mood of the store itself, as opposed to the individual’s mood,
describing ambiance as “the general mood of the store,” and as a factor that “sets the overall
tone for what the brand identity really is for that grocery store.” Some participants related mood
to the emotions created by the ambiance of store, e.g. “The feeling you get when you’re in it.”
For the Middle Eastern participant group, a positive store ambiance is perceived as
improving their impressions of the quality of the store’s products. This group generally identified
the ambiance of the store as an approach to attract and grab the attention of shoppers.
Emphasis was placed on the excitement of the shopping experience: “when you get into a
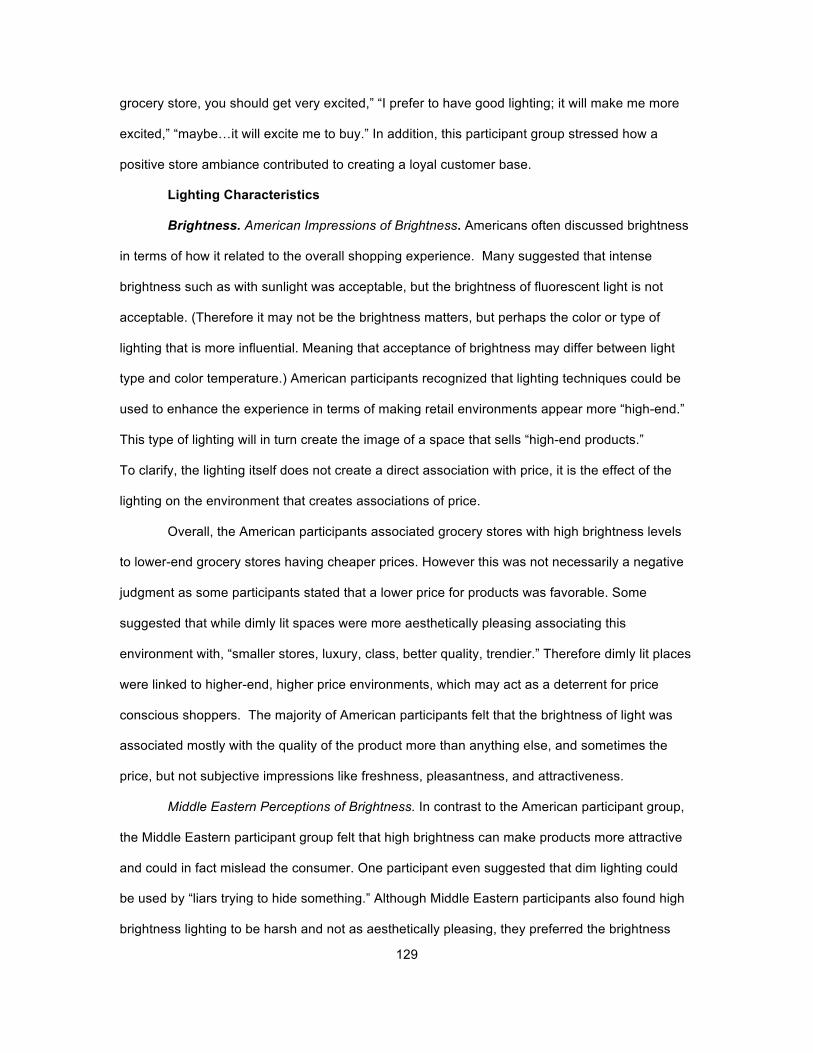
129
grocery store, you should get very excited,” “I prefer to have good lighting; it will make me more
excited,” “maybe…it will excite me to buy.” In addition, this participant group stressed how a
positive store ambiance contributed to creating a loyal customer base.
Lighting Characteristics
Brightness. American Impressions of Brightness. Americans often discussed brightness
in terms of how it related to the overall shopping experience. Many suggested that intense
brightness such as with sunlight was acceptable, but the brightness of fluorescent light is not
acceptable. (Therefore it may not be the brightness matters, but perhaps the color or type of
lighting that is more influential. Meaning that acceptance of brightness may differ between light
type and color temperature.) American participants recognized that lighting techniques could be
used to enhance the experience in terms of making retail environments appear more “high-end.”
This type of lighting will in turn create the image of a space that sells “high-end products.”
To clarify, the lighting itself does not create a direct association with price, it is the effect of the
lighting on the environment that creates associations of price.
Overall, the American participants associated grocery stores with high brightness levels
to lower-end grocery stores having cheaper prices. However this was not necessarily a negative
judgment as some participants stated that a lower price for products was favorable. Some
suggested that while dimly lit spaces were more aesthetically pleasing associating this
environment with, “smaller stores, luxury, class, better quality, trendier.” Therefore dimly lit places
were linked to higher-end, higher price environments, which may act as a deterrent for price
conscious shoppers. The majority of American participants felt that the brightness of light was
associated mostly with the quality of the product more than anything else, and sometimes the
price, but not subjective impressions like freshness, pleasantness, and attractiveness.
Middle Eastern Perceptions of Brightness. In contrast to the American participant group,
the Middle Eastern participant group felt that high brightness can make products more attractive
and could in fact mislead the consumer. One participant even suggested that dim lighting could
be used by “liars trying to hide something.” Although Middle Eastern participants also found high
brightness lighting to be harsh and not as aesthetically pleasing, they preferred the brightness
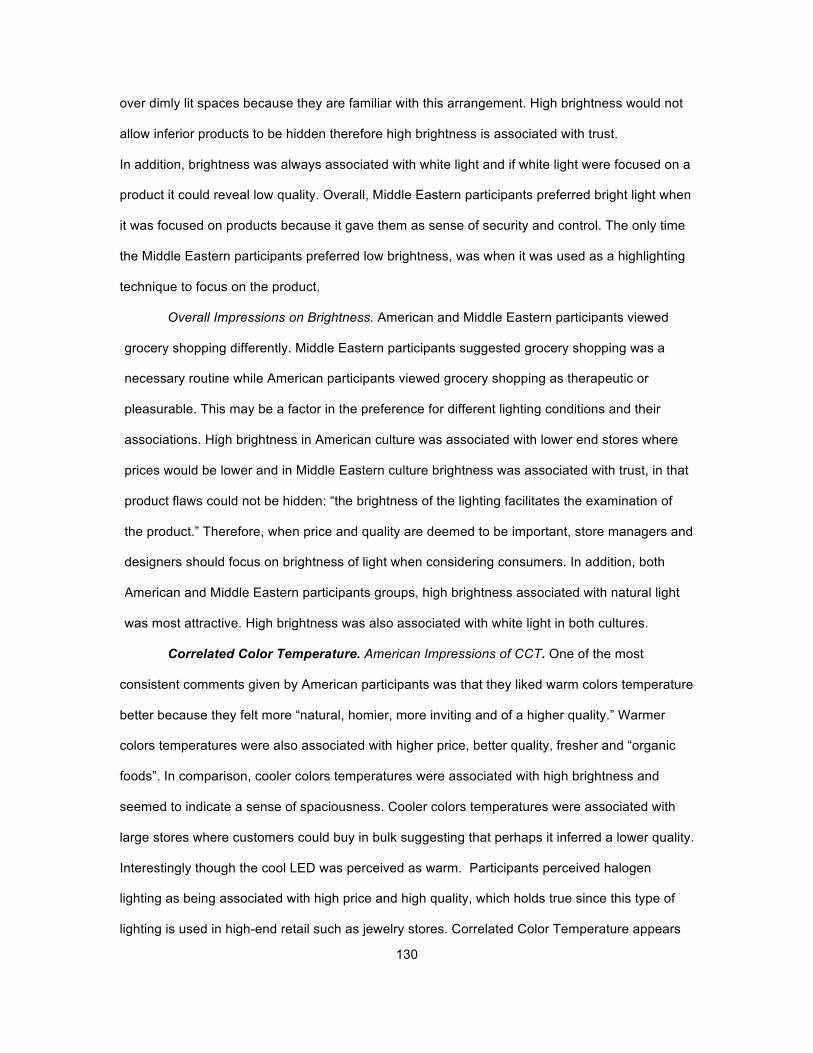
130
over dimly lit spaces because they are familiar with this arrangement. High brightness would not
allow inferior products to be hidden therefore high brightness is associated with trust.
In addition, brightness was always associated with white light and if white light were focused on a
product it could reveal low quality. Overall, Middle Eastern participants preferred bright light when
it was focused on products because it gave them as sense of security and control. The only time
the Middle Eastern participants preferred low brightness, was when it was used as a highlighting
technique to focus on the product.
Overall Impressions on Brightness. American and Middle Eastern participants viewed
grocery shopping differently. Middle Eastern participants suggested grocery shopping was a
necessary routine while American participants viewed grocery shopping as therapeutic or
pleasurable. This may be a factor in the preference for different lighting conditions and their
associations. High brightness in American culture was associated with lower end stores where
prices would be lower and in Middle Eastern culture brightness was associated with trust, in that
product flaws could not be hidden: “the brightness of the lighting facilitates the examination of
the product.” Therefore, when price and quality are deemed to be important, store managers and
designers should focus on brightness of light when considering consumers. In addition, both
American and Middle Eastern participants groups, high brightness associated with natural light
was most attractive. High brightness was also associated with white light in both cultures.
Correlated Color Temperature. American Impressions of CCT. One of the most
consistent comments given by American participants was that they liked warm colors temperature
better because they felt more “natural, homier, more inviting and of a higher quality.” Warmer
colors temperatures were also associated with higher price, better quality, fresher and “organic
foods”. In comparison, cooler colors temperatures were associated with high brightness and
seemed to indicate a sense of spaciousness. Cooler colors temperatures were associated with
large stores where customers could buy in bulk suggesting that perhaps it inferred a lower quality.
Interestingly though the cool LED was perceived as warm. Participants perceived halogen
lighting as being associated with high price and high quality, which holds true since this type of
lighting is used in high-end retail such as jewelry stores. Correlated Color Temperature appears
131
to function best with fresh food rather than packaged food due to the fact that brand identity is a
more significant factor in the selection of packaged food. This supports Barbout’s (2001, 2002,
2003, 2004) findings that the color of lighting should contain the same color spectrum of the
product. In terms of CCT, perceptions of freshness was most affected far more than the other
variables of price of quality. When questioned about CCT, participants repeatedly went back to
discussing issues of brightness therefore implying that brightness had a far greater impact on
their perceptions.
Middle Eastern Impressions of CCT. Middle Eastern participants had very similar
comments and perspectives as the American participants. Middle Eastern participants also
preferred the warm CCT for “fresh food like fruits and veggies” and cool CCT for packaged food.
Like the participants, Middle Eastern participants also associated cool CCT with brightness.
These participants also perceived cool LED as warm. This perhaps speaks to self-evaluations of
perceptions as although participants commented that they preferred warmer colors, statistically
they chose the cooler colors. Perceptions of CCT were most significant in terms of impressions of
freshness and quality. One participant even suggested: “that the lighting is controlling the actual
color of the objects.” CCT was shown to have a strong influence on perceptions of freshness.
Perceptions of price did not appear to be influenced by CCT, only in terms of price associated
with quality of fresh foods.
Spatial Distribution. American Impressions of Spatial Distribution. All participants
perceived the uniform lighting as bright. One participant noted uniform lighting is, “very standard,
it's bright, and I can see everything.” However uniform light was consistently associated with high
glare levels. When asked if they preferred uniform light or non-uniformed light, six American
participants preferred the non-uniform over the uniform lighting. Non-uniform lighting was
perceived as visually interesting and would stimulate the consumer to browse more. However
many expressed that non-uniform lighting can be deceptive, that they didn’t feel it was an entirely
honest representation of the product. While non-uniform lighting may be more attractive in some
respects participants felt that there was less of sense of control and for purchases such as
groceries consumers would want a high degree of clarity and control over purchases. Non-

132
uniform lighting, which is used more commonly in higher-end retail was associated with the
perception of higher priced goods. One particularly insightful participant stated: “non-uniform
lighting enhances the product's visual appeal, it appears more fresh. The use of the spotlights
focus more intensity on what they want to sell. It is a curated experience, isn’t random.” Therefore
adjusting lighting to match the consumer’s anticipation of price could be a variable considered by
store-owners and managers.
Middle Eastern Impressions of Spatial Distribution. In terms of uniformed lighting, the
Middle Eastern participants were evenly divided: five participants preferred uniform, and five
preferred non-uniformed. Those who preferred it described uniform lighting as, “clear even
vision, you can see everything, products are fresh, everything is fresh and new.” Those who
preferred non-uniform lighting stated it was, “more comfortable for the eyes and more luxurious.”
Middle Eastern participants preferred non-uniform lighting in clothing stories but not in grocery
stores. Since Middle Eastern participants associated shopping for clothing with luxury and
grocery with mundane activities this preference would make sense from a cultural perspective.
The Middle Eastern participants also more often associated uniformed lighting with visual clarity.
Middle Eastern participants also felt that spatial distribution of light could affect perceptions of
quality but not price. This is in opposition to what American participants stated in that they felt
that spatial distribution of light directly affected their impressions of price.
Influence Of The Three Lighting Characteristics. When asked about the importance of
lighting characteristics, American participants suggested that spatial distribution was most
influential, than color temperature, then brightness. However they stressed that a combination of
the three characteristics was essential to their assessments of products. The Middle Eastern
participants selected the same order of importance for lighting characteristics. One Middle
Eastern participant expressed, “I think the brighter the thing is, the more lighting, the more it
would grab my eye.” Spatial distribution was most influential for both groups, particularly in terms
of affecting price perception and the overall store image. Correlated Color Temperature had a
direct affect on subjective impressions of products, in particular fresh foods like product. A
number of studies have examined this characteristic. Brightness was not discussed in great detail

133
by either sample population; however, this is the characteristic that most studies of lighting in
retail environments focus on.
Section Summary. This chapter describes the qualitative data collected regarding the
effect of ambient lighting on product perception examining insights from American culture and
Middle Eastern culture. Of the three characteristics of lighting assessed (brightness, CCT and
spatial distribution), spatial distribution appeared most influential for both American and Middle
Eastern sample participants in terms of its affect of perceived quality and price. This was followed
by CCT, which had the strongest influence on perceptions of freshness by both sample
populations. Warm colors were viewed as most attractive by both sample populations. Brightness
was the characteristic most readily understood by participants, yet it was named as the least
important of the three lighting characteristics. However, participants were visibly unused to
describing aspects of lighting and frequently confused brightness with other concepts. Both
participant groups were not entirely aware of the effect that lighting could have on their mood and
behavior, although it did appear that the American participants could better articulate how
particular aspects of lighting could influence their behavior. Middle Eastern participants seems to
engage in more impulse buying and buying in bulk, therefore perhaps they may not be as aware
of the atmosphere factors in retail environments. Price was also less of a consideration for Middle
Eastern participants. Grocery shopping was viewed as a chore for Middle Eastern participants
while American participants expressed how grocery shopping could be seen as “therapeutic.”
One of the most significant findings of this interview data was that contrary to findings in
survey data, participants suggested that lighting could in fact directly affect their perceptions of
price. In the interviews, participants (both American and Middle Eastern) remarked that if it looks
fresher and high quality, they would be willing to pay more. Non-uniform, dimmer lighting is a
technique used by higher-end retails and suggests products of both higher cost and quality.
However, consumers are also wary of this type of light as it can hide flaws in products and be
deceptive. Consumers note that more uniform and higher brightness do instill impressions of
trust. Furthermore, based on interview data, distinctions should be made between lighting in
grocery store environments as opposed in lighting in other retail environments as participants
134
expressed opposite lighting preferences for these two settings. In addition, guidelines
distinguishing ambient lighting of the store versus lighting on a product should be created as
participants often differed in their preferences of these techniques regarding product versus
atmosphere. For future research, a study examining the effects of combinations of characteristics
(e.g. high brightness and cool) would be very beneficial.

135
CHAPTER IV
DISCUSSION
Overview
This chapter examines key results of data analyses from Phase I (quantitative data) and
Phase II (qualitative) and discusses their relevance in relation to the research objectives of this
study. Results demonstrate that changes in ambient light can affect product perceptions (in terms
of Price, Quality, Freshness, Pleasantness and Attractiveness). Some differences were noted
between the perceptions of American participants and the perceptions of Middle Eastern
participants. This study suggests that particular lighting characteristics could be responsible for
differences in product perception between these two cultures. These findings, based on both
quantitative and qualitative data, will be discussed in detail according to each variable
respectively (Price, Quality, Freshness, Pleasantness and Attractiveness) and are framed within
the context of the primary research questions listed below. An overall summary is then provided.
Q1; Do changes in ambient lighting affect product perception (measured in terms of
Price, Quality, Freshness, Pleasantness, and Attractiveness)?
Q2; If so, then do these lighting changes affecting product perception differ across
different cultures?
Q3: What lighting characteristics are responsible/causing these changes in product
perception across different cultures?
Perception of Price
In response to the first research question regarding whether changes in ambient light
affect product perception of price, ANOVA statistical results suggest that there were no significant
correlations. This means that changes in ambient lighting do not appear to affect product
perception. However, looking at descriptive analysis, in particular, standard deviation,
performance under four lighting types varies slightly.
In response to the second research question regarding whether changes to lighting
affects product perceptions of price across cultures, there were no significant differences between
the American culture sample population and the Middle Eastern culture sample population using

136
tests of inferential statistics (Two-Way ANOVA). However, Chi-square tests showed levels of
significance (X2 (1, N = 164) = 17.806, P = 0.00) between the two cultures and their perception of
price under the four lighting types. It should be mentioned though, when participants were asked
if they believed that there was a difference, Middle Eastern participants thought that there was a
difference in their perceptions of price with regard to the four lighting types’ effect on the same
products. American participants however, stated they did not believe that there was a difference.
Also descriptive analysis, in particular means and standard deviation, suggests a notable
variation in price perception under the four lighting types when comparing the two cultures.
Descriptive analysis showed that halogen lighting had the most significant influence on
price. Halogen lighting actually implied a higher price to participants in this study. This was also
supported by interview results that demonstrate that American participants perceived halogen
lighting as being associated with high price and high quality, which holds true since this type of
lighting is often used in high-end retail such as jewelry stores. Florescent lighting was chosen
second in terms of its influence of price perception for both cultures. However, florescent lighting
characteristics and specifications are actually the opposite of halogen lighting as florescent
lighting has the lowest illuminance levels and cool CCT, while halogen has the highest
illuminance level and was perceived as warm. This result in particular is unexplainable.
In response to the research question regarding which lighting characteristics affect
product perception across cultures, the characteristic of brightness presented an interesting case.
Results of analysis of variance suggested that that brightness did not affect price perception.
However, regression analysis depicted that an increase in brightness was associated with an
increase in perception of price. This is supported by the two facts. First, halogen lighting was
favored by both cultures in terms of indicating higher price. Second, halogen lighting also has the
highest illuminance levels (141 FC) compared to the other lighting types.
When price perception is lower generally it can mean that perceptions of fairness and
accessibility are higher as related in the qualitative interview data. Price was also less of a
consideration for Middle Eastern participants.
137
Interview data suggested that lighting itself does not create a direct association with price
rather it is the effect of lighting on the environment that creates an association of product price.
The lighting creates an atmospheric impression therefore the association of product price is
related to store image rather than the specific product itself. Lighting as an atmospheric tool can
be pivotal in creating a particular store image. This finding also explains why inferential tests
revealed no significant correlations in this study as product perception was measured separately
from the environment/atmosphere of the store.
Interviews also indicated that dimly lit spaces were more aesthetically pleasing and
associated with, “smaller stores, luxury, class, better quality, and trendier.” However, this may
act as a deterrent for more price conscious shoppers. Lower price/low-end was not necessarily a
negative judgment as some participants stated that a lower price for products was favorable.
High brightness in American culture was associated with lower end stores where prices would be
more affordable. This finding has been echoed in a number of studies (Schindler, 1989; Thaler,
1985; Monroe and Krishnan, 1985), which state that lower prices can create a positive effect
through increased notions of utility. This explains why many consumers patronize discounters
like Wal-mart for many goods, but do not consider it a desirable place to shop for their own
clothes. Research has supported the notion that informational cues affect consumers’ price
expectations. While the association between retail store environment and consumers’ price
perceptions has been discussed in marketing (Kotler, 1973), there have not been many
published studies to date that has examine this relationship empirically. Thaler (1985) conducted
an experiment suggesting that consumers perceive a relationship between retail environments
and selling prices. More specifically, Thaler’s results indicate that the environmental conditions of
the store affect consumers’ price estimates (using an indirect measure of price acceptability)
Brightness. Furthermore, interview data suggested that high brightness of space
indicated lower-end environments, which in turn indicated lower prices. These comments were
made with reference to grocery store settings. When brightness is studied or recommended as a
design solution, it should be indicated that high brightness on product compared to its
surrounding implies higher price. This is a highlighting technique used by high-end retail. In

138
contrast, high brightness in all over the space (lacking highlighting) will indicates low end and
lower price. This finding is consistent with categorization literature that proposes individuals,
during evaluation, compare a target stimulus (e.g. cues) with categorical knowledge that is stored
in memory (Alba and Hutchinson, 1987; Cohen and Basu, 1987). If these cues are congruent, a
more positive affect should result than if cues are incongruent (Cohen and Basu, 1987). Thus, the
store atmosphere evokes a category within which product/price combinations are evaluated. In a
store where the design and ambient cues are both “high-image”, consumers’ price acceptability
increases. Conversely, when one of these environmental dimensions was in the “low-image”
condition, the store atmosphere had no effect on price acceptability. Retailers who desire to
increase consumers’ acceptability of higher prices need to ensure that the ambient and design
cues in their stores are both “high-image” and congruent. Research on store image has
suggested that a number of environmental elements affect consumer perceptions of store image,
and that specific characteristics tend to be associated with “high-image” and “low-image” stores
(Hirschman et al., 1978; Zimmer and Golden, 1988). There is some support for the notion that the
physical environment affects store image (e.g., Lindquist, 1974; Zimmer and Golden, 1988). For
example, environmental elements such as soft/ dim lighting, classical music, open layout, nicely
dressed and cooperative salespeople are associated with high-image stores, whereas bright/
harsh lighting, Top-20 music, grid layout, sloppily dressed and uncooperative salespeople are
associated with low-image stores (e.g., Gardner and Siomkos, 1986; Golden and Zimmerman,
1980; Berman and Evans, 1989). Furthermore, research has found that store image influences
consumers’ perceptions of value and willingness to buy (e.g., Dodds et al., 1991).
A store described as having a combination of bright, fluorescent lights (soft, incandescent
lights) and popular (classical) background music causes consumer reactions consistent with a
discount (prestige) image (Baker et al., 1994). Thus, as a combination of classical music and soft
lights leads consumers to expect higher prices (Baker et al., 1994). Research suggests that bright
fluorescent (soft) lights and warm (cool) colors are more consistent with a discount (prestige)
store concept (Baker et al., 1992; Bellizi and Hite, 1992; Schlosser, 1998).

139
Color Temperature and Spatial Distribution. Interview data revealed that warmer color
temperatures were associated with higher price, better quality, fresher and “organic foods.”
American participants perceived non-uniform lighting, which is used more commonly in higher-
end retail, as associated with the perception of higher priced goods. Therefore adjusting lighting
to match the consumer’s anticipation of price could be a variable considered by store-owners and
managers. Middle Eastern participants also felt that spatial distribution of light could affect
perceptions of quality but not price. This is in opposition to what American participants stated in
that they felt that spatial distribution of light directly affected their impressions of price. For both
culture samples, spatial distribution was regarded as affecting price perception and the overall
store image. Non-uniform, dimmer lighting is a technique used by higher-end retails and suggests
products of both higher cost and quality.
Conclusions on Price. One of the most significant findings from interview data was that
contrary to findings from survey data, participants suggested that lighting could in fact directly
affect their perceptions of price. In the interviews, participants (both American and Middle
Eastern) remarked that if it looks fresher and high quality, they would be willing to pay more.
Middle Eastern participants perceptions of price did not appear to be influenced by CCT, only in
terms of price associated with freshness of food. Quartier (2011) found that price perception does
not seem to have a large impact because it only correlates with aesthetics impression of products
(such as freshness and attractiveness) which is in line with this research noting that price
perception of product itself does not appear to be affect by lighting.
Perception of Quality
In response to the first research question as to whether changes in ambient lighting
affects product perception measured in terms of quality, there did not appear to be any significant
relationships according to tests of inferential statistics (using one-way ANOVA). Descriptive
analysis, in particular, means and standard deviation, suggests that the performance for the four
lighting types varies only slightly. Halogen had the highest mean and lowest standard deviation,
meaning that it was the most preferred lighting in both cultures.

140
In response to research question 2, results from inferential statistics (using Two-Way
ANOVA) suggested that there was no significant relationship between product perceptions of
quality under different lighting conditions across the two culture samples. Descriptive statistics
showed some minor variations between how Americans’ perceptions of quality under the four
lighting types differ from Middle Eastern perceptions. Chi-square test of both culture sample
populations also showed there was some level of significance in terms of quality perception
between the two cultures. The participants who believed that there was a difference in quality
perception under the four lighting types were asked to put their preference of lighting in order.
When these preferences are weighted, the lighting preference showed that halogen and warm
LED were very close in terms of preference. This implies that warm LED can be a good
alternative to halogen in terms of energy efficiency without compromising the value of quality
perception. This finding from the Chi-square test corresponds with results from qualitative data.
During interviews, Middle Eastern participants stated that they perceived a difference in quality
perception between the four lighting conditions with the same products as higher, while American
participants they did not believe there was a difference.
As mentioned above, overall, halogen lighting was the most preferred lighting type.
Americans did rate halogen the highest in terms of quality perception while Middle Easterners
rated it as the second preferred after the cool LED. Again, the difference in means between the
cool LED and halogen were only slight. American lighting preference was driven by the
brightness of lighting. Halogen was the highest rated in terms of brightness (141 FC), then cool
LED (113 FC), then warm LED (100 FC), then florescent (51 FC). The means of cool LED and
warm LED are very close, while the difference in means between cool LED and halogen is high,
and also high for Florescent and warm LED. Cool LED was more acceptable to both cultures but
it was not the most preferred one (meaning that it was acceptable but not strongly influential on
quality perception). Florescent lighting was rated the lowest by the two cultural groups. Meaning
that florescent lighting did not indicate high quality. Results from the interview suggested that
intense brightness such as with sunlight was acceptable, but the brightness of fluorescent light is
not acceptable. This was associated with lower quality.

141
In response to the research question as to which lighting characteristic may be
influencing perception, using analysis of variance (one-way ANOVA), brightness was found to be
significant in affecting quality perception. Also regression analyses predicted that brightness
could affect quality perception in both cultural groups. However, overall Americans perceived
brightness more positively. Meaning that when brightness increased, quality perception also
increased. This was also confirmed by American participants, whose preferences were driven by
the brightness of lighting (discussed above). Also interview data reported that, “the majority of
American participants felt that the brightness of light was associated mostly with the quality of the
product more than anything else. However, regression analyses predicted that brightness affect
quality perception by middle eastern negatively. As brightness increases, the perception of quality
decreases. This was confirmed by Middle Eastern participants in the interviews that stated,
“brightness was always associated with white light and if white light were focused on a product it
could reveal low quality.”
Using analysis of variance (one-way ANOVA), clarity was found to be significant in
affecting quality perception. Also, regression analyses predicted that clarity can affect quality
perception for both cultures. Regression analyses predicted a negative impact, meaning that the
more clear it looks the lower quality of product it will indicate. Although, in this research visual
clarity is associated with intensity of light than color of light, in other literature, visual clarity is
associated with the warm color temperature of light, (Park, 2001). In the interview data,
participants also associated high quality perception with warmer colors.
Analysis of variance (one-way ANOVA) suggested that radiance was significant in
affecting quality perception. In particular, colorfulness was found to be significant in affecting
quality perception. Regression tests showed that radiance and colorfulness can affect quality
perception by American participants negatively. Analysis of variance (one-way ANOVA)
suggested that complexity was significant in affecting quality perception. Also, regression tests
predicted that complexity can affect quality perception negatively, meaning that the more complex
it appears (achieved by distribution of light), the higher quality it indicates. This was also

142
demonstrated in interview results in that Middle Eastern participants felt that spatial distribution of
light could affect perceptions of quality.
Participants universally expressed that brightness could have the most impact on quality
perception. They also almost unanimously expressed a dislike of fluorescent lighting. Middle
Eastern participants felt a positive store ambiance was perceived as improving impressions of the
quality of the store’s products. Middle Eastern participants also expressed that brightness was
associated with white light and if white light were focused on a product it could reveal low quality.
The majority of American participants felt that the brightness of light was associated with the
quality of the product. One of the most consistent comments given by American participants was
that they liked warm color temperature better because they felt more, “natural, homier, more
inviting and of a higher quality.” Warmer colors temperatures were also associated with higher
price, better quality, fresher and “organic foods.” American participants also perceived halogen
lighting as being associated with high price and high quality, which is relevant since this type of
lighting is used in high-end retail such as jewelry stores. Some American participants did suggest
that dimly lit spaces can be aesthetically pleasing, associating this environment with, “smaller
stores, luxury, class, better quality, trendier.”
Conclusions on Quality. Practical and theoretical interest in retail atmospherics is
predicated on a belief that the retail environment can be controlled by manipulating various cues,
and in turn, store patrons’ behavior can be affected (Kotler, 1974). There is widespread support
for the notion that the physical environment affects store image and consumers perceptions of the
store environment (e.g., Lindquist, 1974; Zimmer and Golden, 1988; Gardner and Siomkos, 1985;
Golden and Zimmerman, 1986; Berman and Evans, 1989). Furthermore, research has found that
store image and retail environment influences consumers’ perceptions of merchandise quality
(Darden and Schwinghammer 1985; Olshavsky 1985; Dodds et al., 1991). However, in most of
these studies, lighting was measured as part of the atmosphere and the impact of lighting on
quality perceptions were actually based on store image. This research study differs in that it
measured the direct effect of lighting on perceptions of quality holding other lighting atmospheric
factors constant. In doing so, data analyzed demonstrates that lighting can influence perceptions

143
of quality when lighting is applied directly to a product rather than lighting as a spatially based
atmospheric principle.
Subjective Impressions (Freshness, Pleasantness, and Attractiveness)
The remaining measures of perception in this study (freshness, pleasantness, and
attractiveness) were identified subjective impressions or semantic interpretation. This
interpretation is based on drawing attention. For example when a product display stands out
visually from competing product displays, (e.g. with the use of light), the probability of
consumers’ attention being drawn to that display is higher, thereby increasing interest and
possibly purchase intention (Summers and Hebret, 2001). Quartier (2011) also referred to it as
aesthetic impressions. This distinction is made as data from these three remaining measures
presented findings that were somewhat similar. This is in line with Quartier’s (2011) findings that
correlations between the three criteria (freshness, pleasantness and attractiveness) as
indicators of aesthetic impression are all found to be significant. It is clear that the aesthetic
impression indicators also correlate with willingness to buy as noted by Hutchings (1999, cited in
Barbut 2003), with the correlation between freshness and willingness to buy demonstrated to
have the strongest relationship.
Perception of Freshness
In response to the first research question regarding whether changes in ambient light
affects product perception of freshness, results from inferential statistics (using one-Way ANOVA)
suggested that there were no significant relationships. Descriptive analysis, in particular, means
and standard deviation, showed very minimal variation among the four lighting types. Halogen
lighting had the highest mean, then florescent, then warm LED, followed by cool LED. Florescent
lighting had the lowest standard deviation, then cool LED, then halogen, followed by warm LED.
It is somewhat puzzling that florescent had was most closely associated with freshness, as this is
cool color with the lowest brightness. The product viewed was apple, which has a red spectrum.
This actually contradicts Barbout (2001, 2002, 2003, 2004) findings that lighting is preferred when
it is of the same spectrum as the product. However it should be reiterated that in terms of
brightness there was only very slight variation perhaps due to chance.

144
In response to the second research question regarding whether changes to lighting
affects product perceptions of price across cultures, there were no significant differences
between the American culture sample population and the Middle Eastern culture sample
population using tests of inferential statistics (Two-Way ANOVA). When examining the
descriptive data (means and standard deviation) in each culture population sample, notable
variation can be seen. Evaluations of freshness under the four lighting types by American
participants varied quite a lot, while the rating did not vary much among Middle Eastern
participants. This factor may have come into play when assessing product perception and
lighting in the analysis of first question. Among Middle Eastern participants, the performance of
halogen, florescent and warm LED was very similar. Americans preferred halogen lighting for
freshness perception, while Middle Eastern preferred florescent. Thus the evaluation of
freshness was almost the opposite between the two cultures, as halogen lighting was rated most
preferred by Americans while it was the third favorite by Middle Eastern. Freshness perception
under halogen and cool LED is the opposite across the two cultures. Interestingly, both cultures
had very similar evaluations of warm LED and florescent lighting (meaning that warm LED has
almost the same mean across the two cultures).
Chi – square tests showed significance differences between American and Middle
Eastern population samples suggesting there is a difference of freshness perception among the
four lighting types. However, the number of Middle Eastern participants who felt that there was a
difference was higher than the number of American participants.
When lighting preference for people who believed that there is a difference in freshness
was weighted, it yielded contradicting results from observation of means and standard deviation,
especially in the Middle East culture. Middle Eastern preferred cool LED the for freshness
perception.
ANOVA analysis measuring lighting characteristics on perceptions of freshness did not
yield significant results. Regression analysis however, did present several interesting findings
with relation to brightness, correlated color temperature (CCT) and spatial distribution of light.

145
Regression analyses suggest that perception of freshness was more likely to increase as
brightness decreases.
Regression analyses demonstrate that Color Temperature can affect freshness
perception in both cultures inversely. Meaning that the cooler the color temperature, the more
fresh it appears. However this was a very weak correlation and seemed to contradict statements
made during interviews and findings from other studies (Barbut, 2001, 2002, 2003, 2004).
Regression analyses suggest that distinction effects of lighting can affect freshness
perception in both cultures. For American participants, the higher the distinctive effect of lighting,
the more likely they perceived it as fresh.
Interview data revealed that freshness was most often associated with color temperature
and least often with brightness. This finding was also demonstrated in other research findings
noting that when freshness is a variable, the color temperature or color of lighting is always
measured (Barbut, 2001, 2002, 2003, 2004). Creussen and Schoormans (2005) stated that
when products are similar in other dimensions, such as price, consumers would prefer the one
that appeals the most to them aesthetically. Moreover, their experiment showed that 65% of the
participants mentioned the product appearance as the motivation for their choice. With fresh
food products this typically refers to perceived taste and freshness (Hutchings, 1999, cited in
barbut, 2003). Hutchings associated high quality of fresh food products with acceptable color.
American participants noted color temperature as most influential on perceptions of freshness.
They stated that warmer color temperatures reflected higher price, better quality, fresher and
“organic foods”. Middle Eastern participants also preferred the warm CCT for “fresh food like
fruits and veggies” and cool CCT for packaged food. CCT was shown to have a strong influence
on perceptions of freshness for both culture groups.
Conclusions on Freshness. Correlated Color Temperature appears to function best
with fresh food rather than packaged food due to the fact that brand identity is a more significant
factor in the selection of packaged food. This supports Barbout’s (2001, 2002, 2003, 2004)
findings that the color of lighting should contain the same color spectrum of the product. However
it should be noted that this runs contrary to this study’s finding that Middle Eastern participants

146
preferred florescent light, which is considered cool color which does not complement the apple’s
color. Quarter (2011) found that SDW825 seems to be a lamp that is appreciated most for
products such as lettuce, juice, and bread. (This lamp has equal in CCT levels as halogen
lighting.) Quartier noted that lamps with the red filters were appreciated only for what they are
made for: to highlight meat. This suggests that warm color temperature is preferred for fresh food
that has red spectrum, like meat. This is in line with Barbut (2001, 2002, 2003, 2004) findings and
also the findings of this study. Overall, Correlated Color Temperature had a direct affect on
subjective impressions of products, in particular fresh food products.
Perception of Pleasantness
In response to the first research question regarding whether changes in ambient light
affect product perception of pleasantness, ANOVA statistical results suggest that there are no
significant correlations. When examining the graph of means and standard deviation, there was
no notable difference in evaluating pleasantness perception under the four lighting types. This
confirms again that there were no significant correlations. However, it should be stated that cool
LED was the most preferred lighting type for both culture population samples.
In response to the second research question regarding whether changes in lighting
affects product perceptions of pleasantness across cultures, there were no significant
differences between the American culture sample population and the Middle Eastern culture
sample population using tests of inferential statistics (Two-Way ANOVA). Based on descriptive
analysis of means and standard deviations, while the American participants did evaluated
pleasantness similarly under the four lighting types, the Middle Eastern participants evaluated
pleasantness under the four lighting varied to some extent. This suggests that the possibility of
lighting affecting perceptions of pleasantness was stronger for Middle Eastern participants..
Other notable cultural differences included: warm LED being the least favored by
Americans, while it was the most favored by Middle Easterners. Also both Americans and Middle
Easterners perceived pleasantness under florescent and halogen lighting the same. However, the
technical specifications of the two types of lighting were almost the opposite. This contradiction in
rating pleasantness under different lighting types is difficult to explain. However, this may be due

147
to the fact that purple cabbage may not be very popular among the age group used in the study in
both cultures. Although all possible efforts were made to translate “pleasantness” in Arabic for
Middle Eastern participants it could be that the term used in Arabic did not reflect the same
linguistic complexity of the word in English, despite the fact that the researcher speaks both
English and Arabic fluently.
While Chi-Square test showed no significant results, most participants in both cultures
believed that lighting could affect their perceptions of pleasantness under the four different
lighting types. For the participants who believed that there was a difference (in this case are the
majority), they were asked to rank their preference of pleasantness under the four lighting types.
Americans and Middle Easterners actually preferred the same lighting. Both cultures preferred
cool LED as the best lighting for pleasantness perception.
In response to the research question regarding which lighting characteristics affect
product perception across cultures, the characteristic of brightness was found to affect
perceptions of pleasantness in both cultures, confirmed by both one-way ANOVA and Regression
Test analyses. These two tests also found that the lighting effects of complexity and distinction
affected perceptions of pleasantness in both cultures. Specifically, for American participants, the
higher the distinctive effect of lighting, the more likely was perceived as pleasant, as confirmed in
tests of regression.
Although participants were asked in the interviews about their perceptions of
pleasantness, participants found nothing notable to say about this aspect. Interview data along
with statistical results from Phase I indicate that pleasantness is a weak and ambiguous measure
for product perception, and should be either avoided or explained more to clarify its meaning.
Other studies that measured impressions of pleasantness, relate it to spatial/atmosphere
perception, not product perception. For example, a study done by Grewal and Baker (1994)
suggests that a pleasant shopping experience can be created by environmental elements in the
retail store, such as color, layout, architecture, scents, and temperature. These aspects can act
as informational cues to consumers (Olson, 1977)
148
Perception of Attractiveness
In response to the first research question regarding whether changes in ambient light
affect product perception of attractiveness, ANOVA statistical results suggest that there were no
significant correlations that could be measured. However, examining the graph of means and
standard deviation, there were notable differences in evaluating perceptions of attractiveness
under the four lighting types. Cool LED was the most preferred lighting for both cultures. In
addition, cool LED and warm LED performed the same, likely explaining why during interviews,
participants perceived cool LED as warm.
In response to the second research question regarding whether changes to lighting
affects product perceptions of price across cultures, there were no significant differences between
the American culture sample population and the Middle Eastern culture sample population using
tests of inferential statistics (Two-Way ANOVA). However, looking at the graphs (Figure 22 and
23) in the analysis section, separating the evaluation of attractiveness perception under the four
lighting types according to each culture there were some notable differences. Middle easterners
found the cocktail drinks more attractive under the four lighting types than American participants.
When asked, participants from both cultures believed that there was a difference in perceptions of
attractiveness under the four different lighting types. People who believed that there was a
difference were asked to rank their preference of attractiveness under the four lighting types,
Americans and Middle Easterners both preferred cool LED, as the best lighting for their
perceptions of attractiveness.
Although none of the ANOVA tests performed on lighting characteristics showed any
significance for attractiveness perception, in response to the research question regarding which
lighting characteristics affect product perception across cultures, the characteristic of brightness
was noted to increase attractiveness. Also high distinctive impression of a product caused by
lighting could potentially increase attractiveness to the product.
Interview data suggested that the impression of attractiveness was the main factor in
impulse purchases, indicating that designers should focus on manipulating lighting to increase the
attractiveness of products in order to stimulate impulse buying behavior. Middle Eastern

149
participants generally identified the ambiance of the store as an approach to attract and grab the
attention of shoppers. They felt that high brightness can make products more attractive and
could in fact mislead the consumer. In addition, both American and Middle Eastern participants
groups noted that high brightness associated with natural light and warm colors were most
attractive. Non-uniform lighting was perceived as visually interesting and would stimulate some
consumers to browse more. However, some participants felt that non-uniform lighting elicited less
of a sense of control and for purchases such as groceries. Consumers would want a high degree
of clarity and control over purchases.
Cool LED was the preferred lighting by both cultures to stimulate attractiveness. This can
be explained by previous research by Barbut (2001, 2002, 2003, 2004) that the color of light
should contain the color spectrum of the product, however Barbut’s theory was applied to fresh
food rather than packaged food. Although the product was used for the attractiveness measure
(cocktail drinks) was variation of colors, they were complemented by cool LED and Florescent
lighting. This means measures of attractiveness perception may be influenced by the color
temperature of lighting. It can be generalized that to achieve attractiveness, a combination of
brightness and color temperature should be used to complement products. Lighting design could
play an important role in motivating consumers to purchase goods. Creussen and Schoormans
(2005) stated that when products are similar in other dimensions, such as price, consumers
would prefer the one that appeals the most to them aesthetically. Moreover, their research found
that 65% of their participants mentioned the product appearance as the motivation for their
choice.
Conclusion
When participants from both cultures were asked if there were differences in perception
under the four lighting types, Middle Eastern participants more often believed this statement to be
true. This suggests that Middle Easterners may be more affected by store atmospherics that
could lead to impulse buying. During interviews, they seemed to view impulse purchases
differently. Middle Easterners viewed self-control as buying on a need basis while Americans
viewed it as urge restriction. Middle Easterners suggested a need for control over the

150
environment while Americans seemed to be more aware of marketing techniques and the effect
of store atmosphere on their behavior. For this reason, Americans developed ways to deal with
such marketing strategies such as eating before grocery shopping. None of the Middle Eastern
participants expressed that they used any technique to deal with the impact of store atmospherics
on their behavior. An approach mentioned was to simply ignore stores that have high
atmospherics value. This applied to grocery stores where a grocery shopping was viewed as a
routine activity, whereas some American viewed grocery shopping as therapeutic.
Brightness was significantly associated with perceptions of quality. Americans perceived
it positively while Middle Eastern perceive it negatively. This fact confirmed by ANOVA, Standard
deviation graph, regression test, and interviews results. In general, American preferred warmer
color temperature, while Middle Easterners preferred cooler color temperature.
With regard to research questions one and two, ANOVA analysis showed no significant
relationships. However, other statistical tests or setting up the testing of variables differently may
yield alternate results. For example, the 7-point scales could have been categorized into a rating
system 1-3 having an extreme at each end of the scale, and a neutral midpoint. Instead of having
an “ordinal” rating, this would make it a “categorical” rating. This might yield different results.
Future research can be done with the same data but using different analytical tests.
It can also be generalized that affect of lighting on product perception on Middle Eastern
consumers may be stronger than on American consumers. Meaning that retail atmospherics can
affect Middle Eastern consumers more than American consumers. This was established during
interviews as Middle Easterners sought control over store environments while Americans were
more aware that atmospherics could affect them, and thus they developed techniques to deal with
it. The methodology of this study aided in establishing some of the most informative findings on
cultural differences, perception and shopping behavior as unexpected statistical results were
clarified through interviews.
In summary, this study demonstrates that changes in ambient lighting can affect product
perceptions. However, it can be generalized that consumer judgment on price and quality
perception in particular, is based on environmental cues and one of these cues is lighting. This
151
research also found that changes in lighting were found to affect perception in differ cultures. In
most cases, both cultures preferred the same type of lighting in relation to measures of perception,
which is beneficial for both marketers and designers to be aware of. However, the degree of
influence of lighting seems to differ between the two cultures studied. It can be generalized that
lighting may affect Middle Easterners more than Americans. This appears primarily due to
differences in cultural beliefs regarding shopping. In another words, a design technique that may be
used to increase sales may be successful and effective for Middle Eastern consumers but perhaps
not as effective for American consumers. Again, this may not entirely be due to lighting itself, since
Middle Eastern participants seemed to be care less about price and engaged more in impulse
buying. This finding warrants further research.
In response to the second part of research question 3, there were no clear trends from
which observations can be confidently generalized. Brightness and spatial distribution could
potentially be seen as influential characteristics, yet this may simply be a trend observed in this
particular data set only. This study, however, does provide a platform for further investigation of
specific lighting characteristics.

152
CHAPTER V
CONCLUSION
Overview
The central goal of this study was to comprehend the impact of ambient lighting on
product perception with relation to two different cultures, American and Middle Eastern.
Furthermore, lighting perception and preferences (in terms of lighting characteristics) were tested
as to their relevance on product perception. In this chapter, research questions are discussed
with regard to the theories developed in Chapter II and the results generated in Chapter IV. The
variables employed in this research were lighting types (Cool LED, Warm LED, halogen, and
Florescent) and cultural groups (American and Middle Eastern). Although numerous variables
have been appraised within the fields of lighting design and atmospheric research, cultural
background of consumers has not been thoroughly explored in these prior studies. Results of this
study reveal some interesting findings. The dependent variables including product perception
(measured in terms of price, quality, freshness, pleasatness, and attractiveness) and lighting
charasteristics seem to affect consumer product perception and this perception differs among
cultures. This chapter discusses key findings, the limitations of this study with suggestions for
future research, as well as the major implications of this research.
Key Findings
The data analyzed in Chapter IV and discussed in Chapter V revealed numerous results.
However, in this section only key findings are summarized. These main findings are discussed in
relation to the research questions established for this study.
The first question in this study examined the effect of different ambient lighting (Cool
LED, Warm LED, Halogen, and Flourescent) on product perception measured in terms of price,
quality, freshness, pleasantness, and attractiveness. The results of the inferential analysis using
analysis of variance (One-Way ANOVA) revealed no significant relationships between the four
different lighting types used (Cool LED, Warm LED, Halogen, and Florescent) and the five
measures of product perception (price, quality, freshness, pleasantness and attractiveness).
However, descriptive statistics such as observation of means and standard deviation revealed

153
notable differences. These differences are most recognizable in perceptions of quality and
perceptions of pleasantness. Price perception differed the least. This suggests that subjective
impressions of product (freshness, pleasantness, and attractiveness) appear more affected by
changes in lighting. This trend in data may be due to chance, limits of sample size (as will be
discussed below in limitation section), or a result of limitations of statistical tests used (also will be
discussed below in limitation section).
The second research question in this study explores whether lighting variation affects
product perception across different cultures (American and Middle Eastern). Two inferential
analysis methods were used due to the fact that this question was measured using two different
approaches. The first approach asked the participant to rate product perception under one
lighting type. For this approach, the analysis of variance (two-way ANOVA) between lighting type,
product perception, and culture revealed no significance. The second approach presented a
comparative evaluation of the four lighting types. The participants were asked if there was a
difference between the four lighting types in terms of product perception (price, quality, freshness,
pleasatness, and attractiveness). When the responses of the two culture samples were analyzed
and compared using a Chi-Square test, the results revealed levels of significance for perceptions
of price, quality and freshness. These results are a finding that can be explored more deeply in
future research.
The other component of the second question in this study examined which particular
lighting characteristics could cause variation in product perception between participants from
American and Middle Eastern cultures. This question was analyzed using three different
approaches. This first approach used mean plotting of the nine semantic differential items
comparing it to responses from American participants and Middle Eastern participants. This
revealed only slight differences in perceptions of the four different lighting types. The second
approach utlized was analysis of variance (One-Way ANOVA) in examining the correlation
between nine items of the semantic differntial scale and product perception. The results showed
levels of significance for perceptions of quality and pleasantness. Lighting characteristics such as
brightness, clarirty, radiance, colorfulness, and complexity were found to affect perception of

154
quality for the products viewed. While characteristics such as brightness and complexity can also
affect pleasantness perception of the product. The third approach utilized ordinal reqression to
explore the effect of lighting characteristics on product perception. The following relationships
were predicted:
o Males are more likely to perceive products as unattractive with respect to the variable of
attractiveness.
o Perceptions of price and freshness are more likely to increase as brightness is decreased.
o As brightness is increased, the product is more likely to be perceived as attractive.
o For American participants, the cooler the color temperature of lighting, the less quality the
product appears
o For American participants, the higher the distinctive impression caused by the lighting, the
more likely they perceive it as pleasant, attractive, and fresh.
In summary, when results from all analysis were combined and integrated, the following key
findins were discovered:
o Middle Eastern participants evaluated products higher than American participants,
suggesting that lighting potentially has a stronger affect on Middle Easterners than
Americans.
o Price perception is associated with store image and the atmosphere perception; therefore
the direct effect of lighting on price perception of products could not be accurately measured.
o Subjective impression of products (freshness, pleasantness, and attractiveness) can
indirectly affect price product perception.
o The most influential lighting characteristics on price perception were brightness and
distribution of lighting.
o The most influential lighting characteristic on quality perception was brightness.
o The most influential lighting characteristic affecting perceptions of freshness was color
temperature.
o The most influential lighting characteristics affecting perceptions of attractiveness and
pleasantness were brightness and color temperature.

155
o In general, subjective impressions (freshness, pleasantness and attractiveness) varied more,
suggesting that lighting may have a greater affect on subjective impressions than on price or
quality.
Limitations and Suggestions for Future Research
The explanatory approach to design research has some limitations, and despite the fact
that many attemps were made to minimize the impact of these limitations according to the
procedure suggested in Chapter III, it was not possible to entirely avoid these shortcomings. For
example, population samples representing American consumers and Middle Eastern consumers
were limited to students enrolled at Arizona State University. While convenience sampling was
the best method to obtain participants for this study, it should be acknowledged that the sample
population may not be an entirely accurate representation of the general population (Creswell,
2002). Although acculturation was taken into consideration for the Middle Eastern sample,
acculturation may be a variable that could impact lighting preference and product perception;
however, measures of levels of acculturation were beyond scope of this study.
When compared to other research done previously in this area of lighting perception, the
sample size used for this study can be deemed acceptable. However, increasing the sample size
could very well provide more reliable data. Future research can apply the same model but using a
larger sample size. This also will also provide the opportinity to use different statistical tests that
may yield more detailed results.
In addition, moderators of the sample population have not been explored statistically in any
great detail. Generally observations were made about gender but other factors such as age,
educational level, and ethnicity would prove valuable. Future research can include these
demographic moderators in exploring the affect of ambient lighting on consumer perception of
products.
Another potential limitation was that the number of the products was limited to five, and
each product represented only one dependent variable. The study is therefore limited because
the participant’s possible choice of product perception is based on one product only. In addition,
despite efforts to choose products that were neutral to both cultures, products may hold different
156
meanings among different cultures. Future study could use the five products to measure the
same aspect of perception. Such an approach would provide more in depth insight. In a simliar
light, this study was limited to only four different types of lighting, other types of lighting may have
yielded different results.
This study was limited to synthetic representation of products (i.e. images). Images on a
computer screen may be limiting as the participant is not engaged in a real retail environment.
Furthermore, research was limited because the independent and dependent variables were
measured as subject’s perception, and not actual behavior. Thus, the study does not address
actual participation in self-directed behavior nor does it explore personal choice. Instead it
describes the values that subjects attribute to these these products. However, the issue of
perception and not behavior was the pretext for this study. Future research could apply the same
model but in stimulated environment and explore the comparable results.
This study was limited to comparing two cultures, American and Middle Eastern. The Middle
Eastern participants were not representative of all Middle Eastern countries. It was limited to
individuals from Kuwait, Saudi Arabia, Bahrain, Qatar, and the United Arab Emirates. Future
research could compare lighting perception in different regions from the Middle East, and these
findings could also be compared to western cultures. The framework using a sequential
explanatory method exploring cross-cultural perception could be applied to any culture in any city
around the world.
This study was also limited to the retail setting of grocery stores. However, in this study,
participants expressed observations about lighting in other retail environments. Future research
could apply the same model but to different types of retail examining a variety of products and
then compare results.
Finally one last aspect to note under limitations was that participants were not tested for
color blindness. Previous research done by Park (2001) tested all participants for color blind prior
to their experiment and excluded the participants that tested positive for color blindness.
157
Implications of Research
This study provides insight into lighting as an atmospheric factor of impulse buying, and
give emphasis to the interaction between lighting and product perception among different
cultures. It has been recognized that unplanned and impulse purchases constitute a significant
number of consumer purchases, therefore those in the field of marketing and retail should be
aware of the many factors (such as lighting) that can influence consumers to engage in impulse
buying. As Lewis states, “What makes your store a profit powerhouse is the extent to which it
sells each customer something he or she did not intend to buy while making the planned
purchase” (1993:24)
Findings from this study reveals that consumers of different cultures could potentially
perceive products under various lighting types differently. Results provide insight about the
specific variables of lighting settings and how those variables were perceived and preferred by
different cultural groups. Though this study focused on American and Middle Eastern culture, this
study provides valuable insight into the role of lighting on product perception across cultures and
signifies opportunities of further research in this field of retail atmospherics.
Using a two phase methodology incorporating both quantitative and qualitative methods
proved quite successful. Conducting follow up interviews provided the opportunity to explore
elements of lighting design and allowed participants to explain their views. There is the possibility
that participants may not be able to accurately express their opinions and some participants did
sometimes confuse concepts such as brightness. However, data from interviews was valuable as
it was able to provide some explanation for statistical results. This methodology could be used in
other studies of lighting design.
In terms of lighting design in retail enviornments, professional designers involved in store
display and interior lighting can benefit from the insights this study provides. For example, lighting
characteristics should vary depending on the type of products displayed. This is supported by the
fact that spatial distribution was assessed as an effective criteria and non uniformed lighting was
viewed as more interesting. This variation cannot be achieved without using non-uniform lighting
strategies.

158
Design practitioners and design educators can constructively utilize the various lighting
techniques examined in this study regarding lighting intensity (brightness), color temperature,
spatial distribution of lighting and cultural background as factors for consideration. They are
excellent parameters for successfully executing the use of many varations based on the color
designations of merchandise, lighting perception and preference. Implications from this study can
be applied to store lighting techniques to attract consumers from different culture. Furthermore it
is important for designers and store managers to be aware of what image they want to convey to
customers about their products. This objective should drive design decisions and the design
process.
This study suggests that there are indeed differences between perceptions of lighting
among people of different cultures. It also provides insight into the effects of different lighting
characteristics and lighting as an atmospheric factor involved in impulse buying. These are all
relevant factors that should be considered by designers and those in the field of retail.

159
References
Abrahams, B. (1997). It’s all in the mind. Marketing, 27(1), 31-33. Adelaar, T., Chang, S., Lancendorfer, K. M., Lee, B., & Morimoto, M. (2003). Effects of media
formats on emotions and impulse buying intent. Journal of Information Technology, 18, 247-266. doi:10.1080/0268396032000150799
Alba, J. W., & Hutchinson, J. W. (1987). Dimensions of consumer expertise. Journal of Consumer
Research, 13(4), 411-454. Areni, C. S., & Kim, D. (1994). The influence of in-store lighting on consumers' examination of
merchandise in a wine store. International Journal of Research in Marketing, 11(2), 117-125.
Baker, J. (1986). The role of the environment in marketing services: The consumer perspective.
The services challenge: Integrating for competitive advantage, 79-84. Baker, J., Grewal, D., & Parasuraman, A. (1994). The influence of store environment on quality
inferences and store image. Journal of the Academy of Marketing Science, 22(4), 328-339. doi: 10.1177/0092070394224002
Baker, J., Levy, M., & Grewal, D. (1992). An experimental approach to making retail store
environmental decisions. Journal of Retailing, 68(4), 445-460. Baker, J., Parasuraman, A., Grewal, D., & Voss, G. B. (2002). The influence of multiple store
environment cues on perceived merchandise value and patronage intentions. The Journal of Marketing, 66(2), 120-141.
Barbut, S. (2001). Acceptance of fresh chicken meat presented under three light sources. Poultry
Science, 80(1), 101-104. Barbut, S. (2001). Effect of illumination source on the appearance of fresh meat cuts. Meat
Science, 59, 187-191. doi: 10.1016/S0309-1740(01)00069-9 Barbut, S. (2002). Cold meat cuts: Effect of retail light on preference. Journal of Food Science,
67, 2781-2784. doi: 10.1111/j.1365-2621.2002.tb08816.x Barbut, S. (2002). Effect of lighting on ground beef acceptability. Canadian Journal of Animal
Science, 82, 305-309. doi: 10.4141/A01-082 Barbut, S. (2003). Display light and acceptability of green, red and yellow peppers. Journal of
Food Processing and Preservation, 27, 243-252. doi: 10.1111/j.1745-4549.2003.tb00515.x
Barbut, S. (2004). Effect of retail lights on acceptability of salami. Meat Science, 66, 219-223. doi:
10.1016/S0309-1740(03)00094-9 Barbut, S. (2004). Effect of three commercial light sources on acceptability of salmon, snapper
and sea bass fillets. Aquaculture, 236, 321-329. doi: 10.1016/j.aquaculture.2004.02.018 Barr, V. (2012, February). Lighting retail: Ambient vs. accent vs. energy. Lighting Design &
Application, 42(2), 42-45.

160
Bayley, G., & Nancarrow, C. (1998). Impulse purchasing: A qualitative exploration of the phenomenon. Qualitative Market Research: An International Journal, 1, 99-114. doi: 10.1108/13522759810214271
Beatty, S. E., & Elizabeth Ferrell, M. (1998). Impulse buying: Modeling its precursors. Journal of
Retailing, 74, 169-191. doi: 10.1016/S0022-4359(99)80092-X Bellenger, D. N., Robertson, D. H., & Hirschman, E. C. (1978). Impulse buying varies by product.
Journal of Advertising Research, 18(6), 15-18. Bellizzi, J. A., & Hite, R. E. (1992). Environmental color, consumer feelings, and purchase
likelihood. Psychology & Marketing, 9, 347-363. doi: 10.1002/mar.4220090502 Berman, B., & Evans, J.R. (2012). Retail management: A strategic approach (12th ed),
Englewood Cliffs, NJ: Prentice Hall International. Bernecker, C., & Mier, J. M. (1985). The effect of source luminance on the perception of
environment brightness. Journal of the Illuminating Engineering Society, 15, 253-271. doi: 10.1080/00994480.1985.10748647
Bitner, M. J. (1990). Evaluating service encounters: The effects of physical surroundings and
employee responses. The Journal of Marketing, 54(2) 69-82. Bitner, M. J. (1992). Servicescapes: The impact of physical surroundings on customers and
employees. The Journal of Marketing, 56(2), 57-71. Boas, F. (1940). Race, language, and culture. IL: University of Chicago Press. Boyce, P. R (2012). Human factors in lighting. Boca Raton, FL: CRC Press. Boyce, P. R., Lloyd, C. J., Eklund, N. H., & Brandston, H. M. (1996, August). Quantifying the
effects of good lighting: The green hills farms project. In Proceedings of the IES Annual Conference.
Cayless, M. A., & Marsden, M. (1983), Lamps and lighting, Baltimore, MD: Edward Arnold. Chebat, J. C., & Dubé, L. (2000). Evolution and challenges facing retail atmospherics: The
apprentice sorcerer is dying. Journal of Business Research, 49(2), 89-90. Clover, V. T. (1950). Relative importance of impulse-buying in retail stores. The Journal of
Marketing, 15(1), 66-70. Cobb, C. J., & Hoyer, W. D. (1986). Planned versus impulse purchase behavior. Journal of
Retailing, 62(4), 384-409. Cohen, J. B., & Basu, K. (1987). Alternative models of categorization: Toward a contingent
processing framework. Journal of Consumer Research, 13(4), 455-472. Crawford, G., & Melewar, T. C. (2003). The importance of impulse purchasing behaviour in the
international airport environment. Journal of Consumer Behaviour, 3, 85-98. doi: 10.1002/cb.124
Creswell, J. W. (2002). Educational research: Planning, conducting, and evaluating quantitative
and qualitative approaches to research. Upper Saddle River, NJ: Merrill/Pearson Education.
161
Creswell, J. W., Goodchild, L. F., & Turner, P. P. (1996). Integrated qualitative and quantitative
research: Epistemology, history, and designs. New York, NY: Agathon Press. Creswell, J. W., Plano-Clark, V. L., Gutmann, M. L., & Hanson, W. E. (2003). Advanced mixed
methods research designs. In A. Tashakkori & C. Teddlie (Eds.), SAGE handbook of mixed methods in social and behavioral research (pp. 209-240). Thousand Oaks, CA: Sage.
Creusen, M. E., & Schoormans, J. P. (2005). The different roles of product appearance in
consumer choice*. Journal of Product Innovation Management, 22(1), 63-81. doi: 10.1111/j.0737-6782.2005.00103.x
Custers, P. J. M., de Kort, Y. A. W., IJsselsteijn, W. A., & de Kruiff, M. E. (2010). Lighting in retail
environments: Atmosphere perception in the real world. Lighting Research and Technology, 42, 331-343. doi: 10.1177/1477153510377836
Cuttle, C., & Brandston, H. (1995). Evaluation of retail lighting. Journal of the illuminating
Engineering Society, 24, 33-49. doi: 10.1080/00994480.1995.10748117 Darden, W. R., & Schwinghammer, J. K. (1985). The influence of social characteristics on
perceived quality in patronage choice behavior. Perceived Quality: How Consumers View Stores and Merchandise, 161-72.
Darden, W. R., Erdem, O., & Darden, D. K. (1983). A comparison and test of three causal models
of patronage intentions. Patronage behavior and retail management, 29-43. Davis, R. G., & Ginthner, D. N. (1990). Correlated color temperature, illuminance level, and the
Kruithof curve. Journal of the Illuminating Engineering Society, 19, 27-38. doi:10.1080/00994480.1990.10747937
Dawson, S., & Kim, M. (2009). External and internal trigger cues of impulse buying online. Direct
Marketing: An International Journal, 3(1), 20-34. doi: 10.1108/17505930910945714 Dawson, S., Bloch, P. H., & Ridgway, N. M. (1990). Shopping motives, emotional states, and
retail outcomes. Journal of Retailing, 66(4), 408. De Mooij, M. (2009). Global marketing and advertising: Understanding cultural paradoxes (3rd
ed.). London, UK: Sage. De Mooij, M., & Hofstede, G. (2010). The Hofstede model: Applications to global branding and
advertising strategy and research. International Journal of Advertising, 29, 85–110. doi: 10.2501/S026504870920104X Retrieved from http://www.mariekedemooij.com/articles/demooij_2010_int_journal_adv.pdf
De Mooij, Marieke. (2004). Advertising: Painting the tip of an iceberg. The Translator. 10, 179-
198. Retrieved from http://mariekedemooij.com/articles/demooij_2004_translator.pdf DePaulo, P. (2000). Sample size for qualitative research. Quirks Marketing Research Review.
Retrieved from http://www.quirks.com/articles/a2000/20001202.aspx Dholakia, U. M. (2000). Temptation and resistance: An integrated model of consumption impulse
formation and enactment. Psychology & Marketing, 17, 955-982. doi: 10.1002/1520-6793(200011)17:11<955::AID-MAR3>3.0.CO;2-J
162
DiLaura, D. L., Houser, K. W., Mistrick, R. G., Steffy, G. R. (Eds.). (2011). The lighting handbook:
Reference and application (10th ed.), New York, NY: The Illuminating Engineering Society of North America.
Dodds, W. B., Monroe, K. B., & Grewal, D. (1991). Effects of price, brand, and store information
on buyers' product evaluations. Journal of Marketing Research, 28(3), 307-319. Donovan, R. J., & Rossiter, J. R. (1982). Store atmosphere: An environmental psychology
approach. Journal of Retailing, 58(1), 34-57. Donovan, R. J., Rossiter, J. R., Marcoolyn, G., & Nesdale, A. (1994). Store atmosphere and
purchasing behavior. Journal of retailing, 70, 283-294. doi: 10.1016/0022-4359(94)90037-X
Eisner, E. W. (1998). The enlightened eye: Qualitative inquiry and the enhancement of
educational practice. Upper Saddle River, NJ: Merrill. Ekins, P. (1991). A sustainable consumer society: A contradiction in terms?. International
Environmental Affairs, 3(4), 243-258. Fearon, J. D. (2003). Ethnic and cultural diversity by country*. Journal of Economic Growth, 8,
195-222. doi: 10.1023/A:1024419522867 Fiore, A. M., Yah, X., & Yoh, E. (2000). Effects of a product display and environmental
fragrancing on approach responses and pleasurable experiences. Psychology & Marketing, 17, 27-54. doi: 10.1002/(SICI)1520-6793(200001)17:1<27::AID-MAR3>3.0.CO;2-C
Fitch, R., & Knobel, L. (Eds.). (1990). Fitch on retail design. Oxford, UK: Phaidon Press. Fleischer, S., Krueger, H., & Schierz, C. (2001, June). Effect of brightness distribution and light
colours on office staff. In The 9th European Lighting Conference Proceedings Lux Europa (pp. 77-80). Retrieved from http://www.brightfit.nl/media/docs/4_Licht_en_Mens/eth-25438-01.pdf
Flynn, J. E. (1977). A study of subjective responses to low energy and nonuniform lighting
systems. Lighting Design and Application, 7(2), 6-15. Flynn, J. E. (1977). The effect of light source color on user impression and satisfaction. Journal of
the Illuminating Engineering Society, 167-179. Flynn, J. E. (1988). Lighting-design decisions as interventions in human visual space.
Environmental aesthetics: Theory, research, and application, 156-172. Flynn, J. E., Hendrick, C., Spencer, T., & Martyniuk, O. (1979). A guide to methodology
procedures for measuring subjective impressions in lighting. Journal of the Illuminating Engineering Society, 8, 95-110. doi:10.1080/00994480.1979.10748577
Freyssinier, J. P., & Rea, M. (2010, August). A two-metric proposal to specify the color-rendering
properties of light sources for retail lighting. In Proceeding of the International Society for Optical Engineering, 7784-7829.
163
Freyssinier, J. P., Frering, D., Taylor, J., Narendran, N., & Rizzo, P. (2006, August). Reducing lighting energy use in retail display windows. Proceedings of International Society for Optical Engineering, 6337-6351.
Gardner, M. P., & Rook, D. W. (1988). Effects of impulse purchases on consumers’ affective
states. Advances in consumer research, 15(1), 127-130. Gardner, M. P., & George J. Siomkos, G. W. (1986). Toward a methodology for assessing effects
of in-store atmospherics. Advances in Consumer Research, 13, 27-31. Retrieved from http://www.aueb.gr/Users/siomkos/docs/articles/Siomkos_Gardner_1986.pdf
Gilmore, J. H., & Pine, B. J., II. (1999). The experience economy: Work is theater & every
business a stage. Boston, MA: Harvard Business School Press. Ginthner, D. (2002). Lighting: Its effect on people and spaces. Informe Design. Retrieved from
http://www.informedesign.org/_news/feb_v02-p.pdf Giovannini, J. (2002, April). Finally, Prada. Interior Design, pp. 222-224. Golden, L. G., & Zimmerman, D. A. (1980). Effective retailing. Rand McNally. Green, N. (1997, December). Environmental re-engineering. Brandweek, 38(45), 26-30. Greene, J., & Caracelli, V. (1997). Advances in mixed-method evaluation: The challenges and
benefits of integrating diverse paradigms. San Francisco, CA: Jossey-Bass. Grewal, D., & Baker, J. (1994). Do retail store environmental factors affect consumers' price
acceptability? An empirical examination. International Journal of Research in Marketing, 11(2), 107-115. doi: 10.1016/0167-8116(94)90022-1
Grossbart, S., Hampton, R., Rammohan, B., & Lapidus, R. S. (1990). Environmental dispositions
and customer response to store atmospherics. Journal of Business Research, 21, 225-241. doi: 10.1016/0148-2963(90)90030-H
Guba, E. G., & Lincoln, Y. S. (1985). Naturalistic inquiry. Beverly Hills, CA: Sage. Han, Y. K., Morgan, G. A., Kotsiopulos, A., & Kang-Park, J. (1991). Impulse buying behavior of
apparel purchasers. Clothing and Textiles Research Journal, 9, 15-21. doi: 10.1177/0887302X9100900303
Hausman, A. (2000). A multi-method investigation of consumer motivations in impulse buying
behavior. Journal of consumer marketing, 17, 403-426. doi: 10.1108/07363760010341045
Hebert, P. R. (1997). Approach-avoidance behavior of consumers as influenced by existing and
supplementary merchandise display lighting (unpublished doctoral dissertation). Louisiana State University, Baton Rouge.
Hegde, A. L. (1996). Retailers: do you understand the implications of lighting quality and quantity
for product sales?. Journal of Family and Consumer Sciences, 88, 9-12. Hirschman, E. C., Greenberg, B., & Robertson, D. H. (1978). The intermarket reliability of retail
image research: An empirical examination. Journal of Retailing, 54(1), 3-12.

164
Hoch, S. J., & Loewenstein, G. F. (1991). Time-inconsistent preferences and consumer self-control. Journal of Consumer Research, 492-507.
Hoffman, K. D., & Turley, L. W. (2002). Atmospherics, service encounters and consumer decision
making: An integrative perspective. Journal of Marketing Theory and Practice, 33-47. Hofstede, G., Hofstede, G. J., & Minkov, M. (1991). Cultures and organizations: Software of the
mind (Vol. 2). London, UK: McGraw-Hill. Hu, X., Houser, K. W., & Tiller, D. K. (2006). Higher color temperature lamps may not appear
brighter. Leukos, 3, 69-81. doi:10.1582/LEUKOS.2006.03.01.004 Hyllegard, K. H., Ogle, J. P., & Dunbar, B. H. (2006). The influence of consumer identity on
perceptions of store atmospherics and store patronage at a spectacular and sustainable retail site. Clothing and Textiles Research Journal, 24, 316-334. doi: 10.1177/0887302X06293021
Ishida, T., & Ogiuchi, Y. (2002). Psychological determinants of brightness of a space: Perceived
strength of light source and amount of light in the space. Journal of Light & Visual Environment, 26, 29. doi: 10.2150/jlve.26.2_29
Iyer, E. S. (1989). Unplanned purchasing: Knowledge of shopping environment and time
pressure. Journal of Retailing, 65, 40-57. Jang, S. S., & Namkung, Y. (2009). Perceived quality, emotions, and behavioral intentions:
Application of an extended Mehrabian–Russell model to restaurants. Journal of Business Research, 62, 451-460. doi: 10.1016/j.jbusres.2008.01.038
Javidan, M., & Carl, D. E. (2004). East meets West: A cross-cultural comparison of charismatic
leadership among Canadian and Iranian executives. Journal of Management Studies, 41, 665-691. doi: 10.1111/j.1467-6486.2004.00449.x
Jones, M. A., Reynolds, K. E., Weun, S., & Beatty, S. E. (2003). The product-specific nature of
impulse buying tendency. Journal of Business Research, 56, 505-511. doi: 10.1016/S0148-2963(01)00250-8
Kacen, J. J., & Lee, J. A. (2002). The influence of culture on consumer impulsive buying behavior.
Journal of consumer psychology, 12, 163-176. doi: 10.1207/S15327663JCP1202_08 Kaltcheva, V. D., & Weitz, B. A. (2006). When should a retailer create an exciting store
environment?. Journal of Marketing 70(1), 107-118. Kato, M., & Sekiguchi, K. (2005). “Impression of brightness of a space” judged by information
from the entire space. Journal of Light & Visual Environment, 29, 123-134. doi: 10.2150/jlve.29.123
Kim, J. (2003). College students' apparel impulse buying behaviors in relation to visual
merchandising (unpublished master’s thesis,). University of Georgia, Athens. Knez, I. (1995). Effects of indoor lighting on mood and cognition. Journal of Environmental
Psychology, 15, 39-51. doi: 10.1016/0272-4944(95)90013-6 Knez, I., & Enmarker, I. (1998). Effects of office lighting on mood and cognitive performance and
a gender effect in work-xrelated judgment. Environment and Behavior, 30(4), 553-567. doi: 10.1177/001391659803000408
165
Knez, I., & Kers, C. (2000). Effects of indoor lighting, gender, and age on mood and cognitive
performance. Environment and Behavior, 32, 817-831. doi: 10.1177/0013916500326005 Kollat, D. T., & Willett, R. P. (1967). Customer impulse purchasing behavior. Journal of Marketing
Research, 6, 21-31. Kollat, D. T., & Willett, R. P. (1969). Is impulse purchasing really a useful concept for marketing
decisions?. The Journal of Marketing,33, 79-83. Kotler, P. (1973). Atmospherics as a marketing tool. Journal of retailing, 49(4), 48-64. Kroeber-Riel, W. (1980). Marketing im nächsten jahrzehnt, teil 1. Marketing ZFP, 4(1), 5-11. Küller, R., Ballal, S., Laike, T., Mikellides, B., & Tonello, G. (2006). The impact of light and colour
on psychological mood: a cross-cultural study of indoor work environments. Ergonomics, 49(14), 1496-1507. doi:10.1080/00140130600858142
Lechner, N. (2009). Heating, cooling, lighting: Sustainable design methods for architects.
Hoboken, NJ: Wiley. Lenth, R. V. (2001). Some practical guidelines for effective sample size determination. The
American Statistician, 55, 187-193. doi: 10.1198/000313001317098149 Levy, M. F. (1976). Deferred gratification and social class. The Journal of Social Psychology,
100(1), 123-135. Levy, M., & Grewal, D. (1992). An experimental approach to making retail store environment
decisions. Journal of Retailing, 68(4), 445-460. Liao, S. L., Shen, Y. C., & Chu, C. H. (2009). The effects of sales promotion strategy, product
appeal and consumer traits on reminder impulse buying behaviour. International Journal of Consumer Studies, 33, 274-284. doi: 10.1111/j.1470-6431.2009.00770.x
Lindquist, J. (1974). Meaning of image: A survey of empirical and hypotetical evidence. Loe, L., Mansfield, K. P., & Rowlands, E. (1994). Appearance of lit environment and its relevance
in lighting design: Experimental study. Lighting Research and Technology, 26(3), 119-133. doi: 10.1177/096032719402600301
Machleit, K. A., Eroglu, S. A., & Mantel, S. P. (2000). Perceived retail crowding and shopping
satisfaction: What modifies this relationship?. Journal of Consumer Psychology, 9, 29-42. doi: 10.1207/s15327663jcp0901_3
Mahdavi, A., Eissa, H., Miller, T., Livingston, L. K., & Ashdown, I. (2002). Subjective evaluation of
architectural lighting via computationally rendered images. Journal of the Illuminating Engineering Society, 31(2), 11-20.
Maheswaran, D., & Shavitt, S. (2000). Issues and new directions in global consumer psychology.
Journal of Consumer Psychology, 9, 59-66. doi: 10.1207/S15327663JCP0902_1 Markin, R. J., Lillis, C. M., & Narayana, C. L. (1976). Social-psychological significance of store
space. Journal of Retailing, 52(1), 43-54.

166
Martínez-Caro, L., & Martínez García, J. A. (2007). Measuring perceived service quality in urgent transport service. Journal of Retailing and Consumer Services, 14, 60-72. doi: 10.1016/j.jretconser.2006.04.001
Masouleh, S., Pazhang, M., & Moradi, J. (2012). What is impulse buying? An analytical network
processing framework for prioritizing factors affecting impulse buying. Management Science Letters, 2, 1053-1064. doi: 10.5267/j.msl.2012.03.016
McCloughan, C. L. B., Aspinall, P. A., & Webb, R. S. (1999). The impact of lighting on mood.
Lighting Research and Technology, 31, 81-88. doi: 10.1177/096032719903100302 Mead, M. (1937). Cooperation and competition among primitive peoples. New York, NY:
McGraw-Hill. Mehrabian, A., & Russell, J. A. (1974). An approach to environmental psychology. Cambridge,
MA: The MIT Press. Miles, M. B., & Huberman, A. M. (1994). Qualitative data analysis: An expanded sourcebook.
Thousand Oaks: Sage. Miller, D. (1998). A theory of shopping. Ithaca, NY: Cornell University Press. Milliman, R. E. (1982). Using background music to affect the behavior of supermarket shoppers.
The Journal of Marketing, 46(3), 86-91. Milliman, R. E. (1986). The influence of background music on the behavior of restaurant patrons.
Journal of Consumer Research, 13(2), 286-289. Millner, I. (2002, September). Burying the myth of impulse buying. Brand Strategy, 38. Moeck, M. (2001). Analysis and synthesis of lighting atmospheres. Journal of the Illuminating
Engineering Society, 30, 141-153. doi: 10.1080/00994480.2001.10748342 Mogelonsky, M. (1998). Keep candy in the aisles. American Demographics, 20, 32. Moghaddam, F. M., Walker, B. R., & Harre, R. (2003). Cultural distance, levels of abstraction, and
the advantages of mixed methods. In A. Tashakkoori & C. Teddlie (Eds.), Handbook of mixed methods in social and behavioral research (pp. 111-134). Thousand Oaks, CA: Sage.
Monroe, K. B., & Krishnan, R. (1983). The effect of price on subjective product evaluations. In J.
Jacoby & J. Olsen (Eds.), Perceived quality: How consumers view stores and merchandise (pp. 209-232). Lexington, MA: Lexington Books.
Morin, S., Dubé, L., & Chebat, J. C. (2007). The role of pleasant music in servicescapes: A test of
the dual model of environmental perception. Journal of Retailing, 83, 115-130. doi: 10.1016/j.jretai.2006.10.006
Morse, J. M. (1991). Approaches to qualitative-quantitative methodological triangulation. Nursing
research, 40(2), 120-123. Mowen, J. C., & Minor, M. (1998). Consumer behavior. Upper Saddle River, NJ: Prentice Hall. Murdoch, J., & Caughey, C. (2004). Psychological effects of lighting: The work of Professor John
Flynn. Lighting Design and Application, 34(8), 69-73.
167
Newman, A. J., & Patel, D. (2004). The marketing directions of two fashion retailers. European
Journal of Marketing, 38, 770-789. doi: 10.1108/03090560410539249 Newsham, G. R., Richardson, C., Blanchet, C., & Veitch, J. A. (2005). Lighting quality research
using rendered images of offices. Lighting Research and Technology, 37, 93-112. doi: 10.1191/1365782805li132oa
Nicholls, J. A. F., Li, F., Roslow, S., Kranendonk, C. J., & Mandakovic, T. (2001). Inter-American
perspectives from mall shoppers: Chile-United States. Journal of Global Marketing, 15, 87-103. doi:10.1300/J042v15n01_06
Olshavsky, R. W. (1985). Perceived quality in consumer decision making: An integrated
theoretical perspective. In J. Jacoby & J. Olson (Eds.), Perceived quality, (pp. 3-29). Lexington, MA: Lexington Books.
Olson, J. C. (1977). Theories of information encoding and storage: Implications for consumer
research (No. 65). Pennsylvania State University, Department of Marketing. Osgood, C. E., Souci, G. J., Tannenbaum, P. H. (1957). The measurement of meaning. Urbana:
University of Illinois Press. Parboteeah, D. V. (2005). A model of online impulse buying (unpublished doctoral dissertation).
Washington State University, Pullman. Park, N. K. (2001). Indoor lighting perceptions and preferences: A cross-cultural comparison
(unpublished doctoral dissertation) Oklahoma State University, Stillwater. Park, N. K., & Farr, C. A. (2007). The effects of lighting on consumers' emotions and behavioral
intentions in a retail environment: A cross-cultural comparison. Journal of Interior Design, 33, 17-32. doi: 10.1111/j.1939-1668.2007.tb00419.x
Park, N. K., Pae, J. Y., & Meneely, J. (2010). Cultural preferences in hotel guestroom lighting
design. Journal of Interior Design, 36, 21-34. doi: 10.1111/j.1939-1668.2010.01046.x Patel, M. X., Doku, V., & Tennakoon, L. (2003). Challenges in recruitment of research
participants. Advances in Psychiatric Treatment, 9, 229-238. doi: 10.1192/apt.9.3.229 Patterson, L. W. (1963). In-store traffic flow. New York: Point-of-Purchasing Advertising Institute. Piron, F. (1991). Defining impulse purchasing. Advances in consumer research, 18, 509-514.
Retrieved from http://www.acrwebsite.org/search/view-conference-proceedings.aspx?Id=7206
Piron, F. (1993). A comparison of emotional reactions experienced by planned, unplanned and
impulse purchasers. Advances in Consumer Research, 20(1), 341-344. Quartier, K. (2011). Retail design: Lighting as a dsign tool for the retail environment (unpublished
master’s thesis). University of Hasslet, Belgium. Quartier, K., Van Cleempoel, K., & Nuyts, E. (2009, April 1-3). Retail design: Exploring lighting for
creating experiences that influence consumers’mood and behaviour in retail spaces. Paper presented at the 8th European Academy of Design International Conference. Aberdeen, Scotland.

168
Quartier, K., Vanrie, J., & Van Cleempoel, K. (n. d.). Atmospheric lighting in supermarkets. Retrieved from http://www.retailology.be/Retail-o-logy/publications/Artikelen/2010/9/10_Atmospheric_lighting_in_supermarkets_files/Quartier_etal.pdf
Rohrmann, B., & Bishop, I. (2002). Subjective responses to computer simulations of urban
environments. Journal of Environmental Psychology, 22, 319-331. doi: 10.1006/jevp.2001.0206
Rook, D. W. (1987). The buying impulse. Journal of Consumer Research, 189-199. Rook, D. W., & Fisher, R. J. (1995). Normative influences on impulsive buying behavior. Journal
of Consumer Research, 22(3), 305-313. Rook, D. W., & Gardner, M. P. (1993). In the mood: Impulse buying’s affective antecedents.
Research in Consumer Behavior, 6(7), 1-28. Sagiv, L., & Schwartz, S. H. (2007). Cultural values in organisations: insights for Europe.
European Journal of International Management, 1(3), 176-190. Schielke, T. (2010). Light and corporate identity: Using lighting for corporate communication.
Lighting Research and Technology, 42, 285-295. doi: 10.1177/1477153510369526 Schindler, R. M. (1989). The excitement of getting a bargain: Some hypotheses concerning the
origins and effects of smart-shopper feelings. NA Advances in Consumer Research, 16(1), 447-453. Retrieved from http://www.acrwebsite.org/search/view-conference-proceedings.aspx?Id=6945
Schlosser, A. E. (1998). Applying the functional theory of attitudes to understanding the influence
of store atmosphere on store inferences. Journal of Consumer Psychology, 7, 345-369. doi: 10.1207/s15327663jcp0704_03
Sfiligoj, E. (1996). Helping the little guy to merchandise. Periscope. Sharma, A., & Stafford, T. F. (2000). The effect of retail atmospherics on customers' perceptions
of salespeople and customer persuasion: An empirical investigation. Journal of Business Research, 49, 183-191. doi: 10.1016/S0148-2963(99)00004-1
Sherman, E., Mathur, A., & Smith, R. B. (1997). Store environment and consumer purchase
behavior: mediating role of consumer emotions. Psychology & Marketing, 14, 361-378. doi: 10.1002/(SICI)1520-6793(199707)14:4<361::AID-MAR4>3.0.CO;2-7
Singelis, T. M., Triandis, H. C., Bhawuk, D. P., & Gelfand, M. J. (1995). Horizontal and vertical
dimensions of individualism and collectivism: A theoretical and measurement refinement. Cross-cultural research, 29, 240-275. doi: 10.1177/106939719502900302
Sklair, L. (2010). Iconic architecture and the culture-ideology of consumerism. Theory, Culture &
Society, 27, 135-159. doi: 10.1177/0263276410374634 Smith, D. (1996). The joy of candy. National Petroleum News Supplement, 52. Solnick, J. V., Kannenberg, C. H., Eckerman, D. A., & Waller, M. B. (1980). An experimental
analysis of impulsivity and impulse control in humans. Learning and Motivation, 11, 61-77. doi: 10.1016/0023-9690(80)90021-1
169
Spangenberg, E. R., Crowley, A. E., & Henderson, P. W. (1996). Improving the store environment: Do olfactory cues affect evaluations and behaviors?. The Journal of Marketing, 60(2), 67-80.
Spies, K., Hesse, F., & Loesch, K. (1997). Store atmosphere, mood and purchasing behavior.
International Journal of Research in Marketing, 14, 1-17. doi: 10.1016/S0167-8116(96)00015-8
Stern, H. (1962). The significance of impulse buying today. The Journal of Marketing, 26(2), 59-
62. Summers, T. A., & Hebert, P. R. (2001). Shedding some light on store atmospherics: influence of
illumination on consumer behavior. Journal of Business Research, 54, 145-150. doi: 10.1016/S0148-2963(99)00082-X
Thaler, R. (1985). Mental accounting and consumer choice. Marketing Science, 4(3), 199-214. Tiller, D. T., & Veitch, J. A. (1995). Perceived room brightness: Pilot study on the effect of
luminance distribution. Lighting Research & Technology, 27, 93-101. Retrieved from http://archive.nrc-cnrc.gc.ca/obj/irc/doc/pubs/nrcc37885.pdf
Turley, L. W., & Chebat, J. C. (2002). Linking retail strategy, atmospheric design and shopping
behaviour. Journal of Marketing Management, 18, 125-144. doi:10.1362/0267257022775891
Turley, L. W., & Milliman, R. E. (2000). Atmospheric effects on shopping behavior: A review of the
experimental evidence. Journal of Business Research, 49, 193-211. doi: 10.1016/S0148-2963(99)00010-7
Tylor, E. B. (1871). Primitive culture: researches into the development of mythology, philosophy,
religion, art, and custom. London, UK: Murray. Vaccaro, V., Yucetepe, V., Torres-Baumgarten, G., & Myung-Soo, L. (2008). The relationship of
music-retail consistency and atmospheric lighting on consumer responses. Review of Business Research, 8(5), 214-221.
Van Erp, T. A. M. (2008). The effects of lighting characteristics on atmosphere perception
(unpublished master’s thesis). Eindhoven University of Technology, The Netherlands. Retrieved from http://alexandria. tue. nl/extra2/afstversl/tm/Erp, 202008
Veitch, J. A. (2001). Psychological processes influencing lighting quality. Journal of the
Illuminating Engineering Society, 30, 124-140. Retrieved from http://archive.nrc-cnrc.gc.ca/obj/irc/doc/pubs/nrcc42469/nrcc42469.pdf
Verde Group, Wharton School of Business, & Retail Council of Canada. (2009). Discovering
“WOW”: A study of great retail shopping experiences in North America. Retrieved from http://www.verdegroup.com/wp-content/uploads/2012/10/Discovering-WOW-June-2009.pdf
Verplanken, B., & Herabadi, A. (2001). Individual differences in impulse buying tendency: Feeling
and no thinking. European Journal of Personality, 15, S71-S83. doi: 10.1002/per.423 Virvilaite, R., Saladiene, V., & Bagdonaite, R. (2009). Peculiarities of impulsive purchasing in the
market of consumer goods. Inzinerine Ekonomika-Engineering Economics, 2, 101-108.

170
Retrieved from http://www.ktu.edu/lt/mokslas/zurnalai/inzeko/62/1392-2758-2009-2-62-101.pdf
Vogels, I. (2008). Atmosphere metrics. In J. Westerink, M. Ouwerkerk, T. J. M. Overbeek, W. F.
Pasveer (Eds.), Probing experience (25-41). Dordrecht, The Netherlands: Springer. Vohs, K., & Faber, R. (2003). Self-regulation and impulsive spending patterns. Advances in
Consumer Research, 30, 125-126. Weinberg, P., & Gottwald, W. (1982). Impulsive consumer buying as a result of emotions. Journal
of Business Research, 10, 43-57. doi: 10.1016/0148-2963(82)90016-9 West, C. J. (1951). Results of two years of study into impulse buying. The Journal of Marketing,
15(3), 362-363. Wood, M. (1998). Socio-economic status, delay of gratification, and impulse buying. Journal of
Economic Psychology, 19, 295-320. doi: 10.1016/S0167-4870(98)00009-9 Yalch, R. F., & Spangenberg, E. R. (2000). The effects of music in a retail setting on real and
perceived shopping times. Journal of business Research, 49, 139-147. doi: 10.1016/S0148-2963(99)00003-X
Youn, S., & Faber, R. J. (2000). Impulse buying: its relation to personality traits and cues.
Advances in Consumer Research, 27, 179-185. Zhang, X., Prybutok, V. R., & Strutton, D. (2007). Modeling influences on impulse purchasing
behaviors during online marketing transactions. The Journal of Marketing Theory and Practice, 15, 79-89. doi: 10.2753/MTP1069-6679150106
Zhou, L., & Wong, A. (2003). Consumer impulse buying and in-store stimuli in Chinese
supermarkets. Journal of International Consumer Marketing, 16, 37-53. doi:10.1300/J046v16n02_03
Zimmer, M. R., & Golden, L. L. (1988). Impressions of retail stores: A content analysis of
consumer images. Journal of Retailing,64, 265-293

171
APPENDIX A
INSTITUTIONAL REVIEW BOARD RESEARCH OF HUMAN SUBJECTS APPROVAL
172

173
APPENDIX B
SURVEY OF USA CULTURE
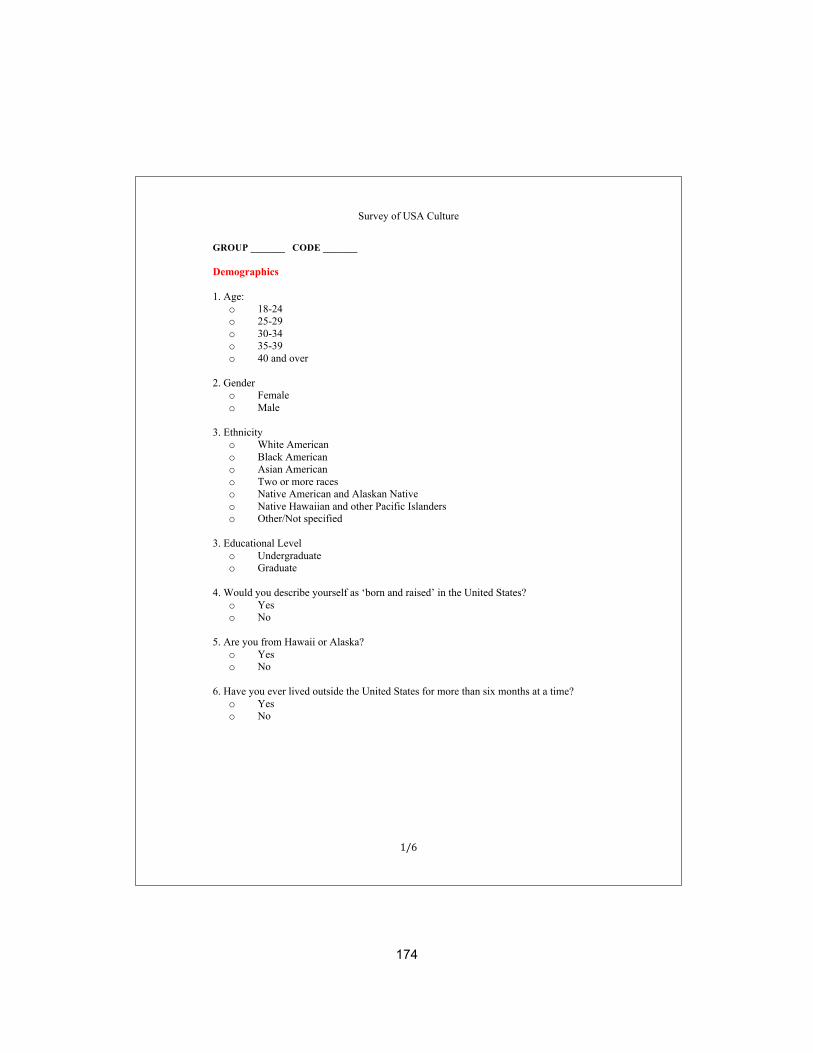
174
Survey of USA Culture !
1/6!
GROUP _______ CODE _______ Demographics 1. Age:
o 18-24 o 25-29 o 30-34 o 35-39 o 40 and over
2. Gender
o Female o Male
3. Ethnicity
o White American o Black American o Asian American o Two or more races o Native American and Alaskan Native o Native Hawaiian and other Pacific Islanders o Other/Not specified
3. Educational Level
o Undergraduate o Graduate
4. Would you describe yourself as ‘born and raised’ in the United States?
o Yes o No
5. Are you from Hawaii or Alaska?
o Yes o No
6. Have you ever lived outside the United States for more than six months at a time?
o Yes o No
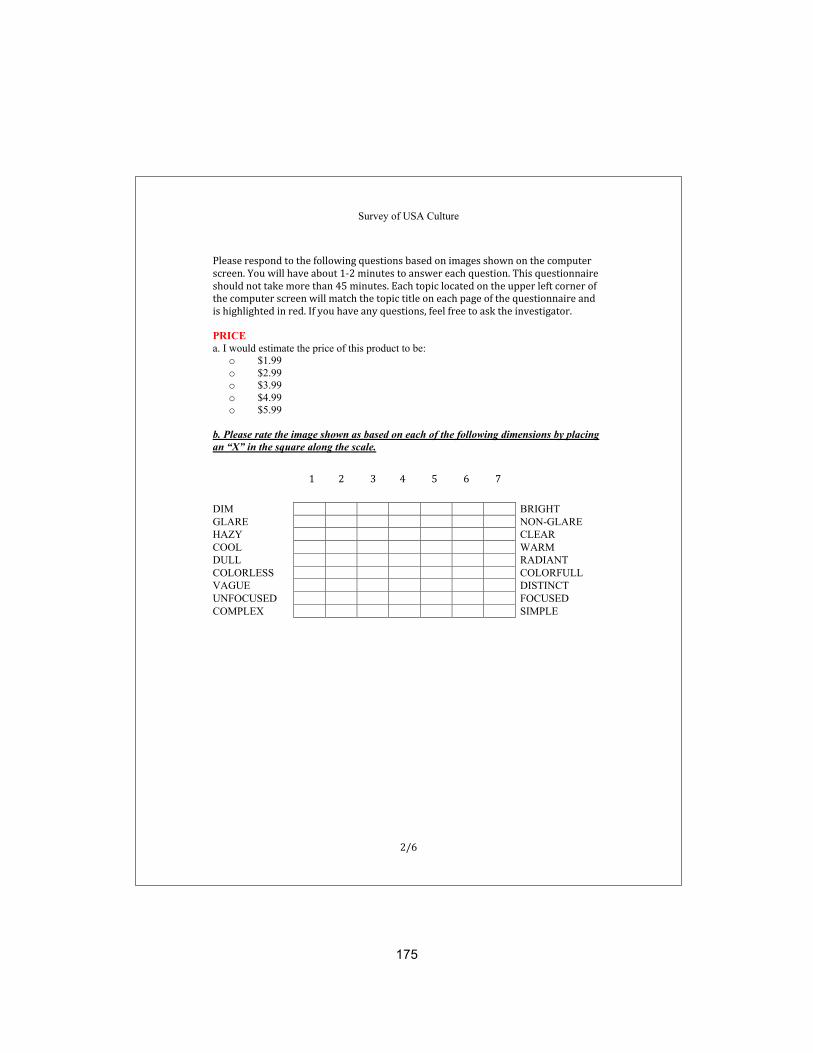
175
Survey of USA Culture !
2/6!
Please!respond!to!the!following!questions!based!on!images!shown!on!the!computer!screen.!You!will!have!about!1>2!minutes!to!answer!each!question.!This!questionnaire!should!not!take!more!than!45!minutes.!Each!topic!located!on!the!upper!left!corner!of!the!computer!screen!will!match!the!topic!title!on!each!page!of!the!questionnaire!and!is!highlighted!in!red.!If!you!have!any!questions,!feel!free!to!ask!the!investigator. PRICE a. I would estimate the price of this product to be:
o $1.99 o $2.99 o $3.99 o $4.99 o $5.99
b. Please rate the image shown as based on each of the following dimensions by placing an “X” in the square along the scale. DIM BRIGHT GLARE NON-GLARE HAZY CLEAR COOL WARM DULL RADIANT COLORLESS COLORFULL VAGUE DISTINCT UNFOCUSED FOCUSED COMPLEX SIMPLE
!!!!1!!!!!!!!!!2!!!!!!!!!!!3!!!!!!!!!!4!!!!!!!!!!!5!!!!!!!!!!!6!!!!!!!!!!!7!

176
Survey of USA Culture !
3/6!
QUALITY Please rate the product shown based on each of the following statement a. I would rate the quality of this product as: Low 1 2 3 4 5 6 7 High b. Please rate the image shown as based on each of the following dimensions by placing an “X” in the square along the scale. DIM BRIGHT GLARE NON-GLARE HAZY CLEAR COOL WARM DULL RADIANT COLORLESS COLORFULL VAGUE DISTINCT UNFOCUSED FOCUSED COMPLEX SIMPLE FRESHNESS Please rate the product shown based on each of the following statement a. I would rate the freshness of this apple as: Low 1 2 3 4 5 6 7 High b. Please rate the image shown as based on each of the following dimensions by placing an “X” in the square along the scale. DIM BRIGHT GLARE NON-GLARE HAZY CLEAR COOL WARM DULL RADIANT COLORLESS COLORFULL VAGUE DISTINCT UNFOCUSED FOCUSED COMPLEX SIMPLE
!!!!1!!!!!!!!!!2!!!!!!!!!!!3!!!!!!!!!!4!!!!!!!!!!!5!!!!!!!!!!!6!!!!!!!!!!!7!
!!!!1!!!!!!!!!!2!!!!!!!!!!!3!!!!!!!!!!4!!!!!!!!!!!5!!!!!!!!!!!6!!!!!!!!!!!7!

177
Survey of USA Culture !
4/6!
PLEASANTNESS Please rate the product shown based on each of the following statement a. This cabbage looks pleasant: Disagree 1 2 3 4 5 6 7 Agree b. Please rate the image shown as based on each of the following dimensions by placing an “X” in the square along the scale. DIM BRIGHT GLARE NON-GLARE HAZY CLEAR COOL WARM DULL RADIANT COLORLESS COLORFULL VAGUE DISTINCT UNFOCUSED FOCUSED COMPLEX SIMPLE ATTRACTIVENESS Please rate the product shown based on each of the following statement a. This drink looks attractive: Disagree 1 2 3 4 5 6 7 Agree b. Please rate the image shown as based on each of the following dimensions by placing an “X” in the square along the scale. DIM BRIGHT GLARE NON-GLARE HAZY CLEAR COOL WARM DULL RADIANT COLORLESS COLORFULL VAGUE DISTINCT UNFOCUSED FOCUSED COMPLEX SIMPLE
!!!!1!!!!!!!!!!2!!!!!!!!!!!3!!!!!!!!!!4!!!!!!!!!!!5!!!!!!!!!!!6!!!!!!!!!!!7!
!!!!1!!!!!!!!!!2!!!!!!!!!!!3!!!!!!!!!!4!!!!!!!!!!!5!!!!!!!!!!!6!!!!!!!!!!!7!
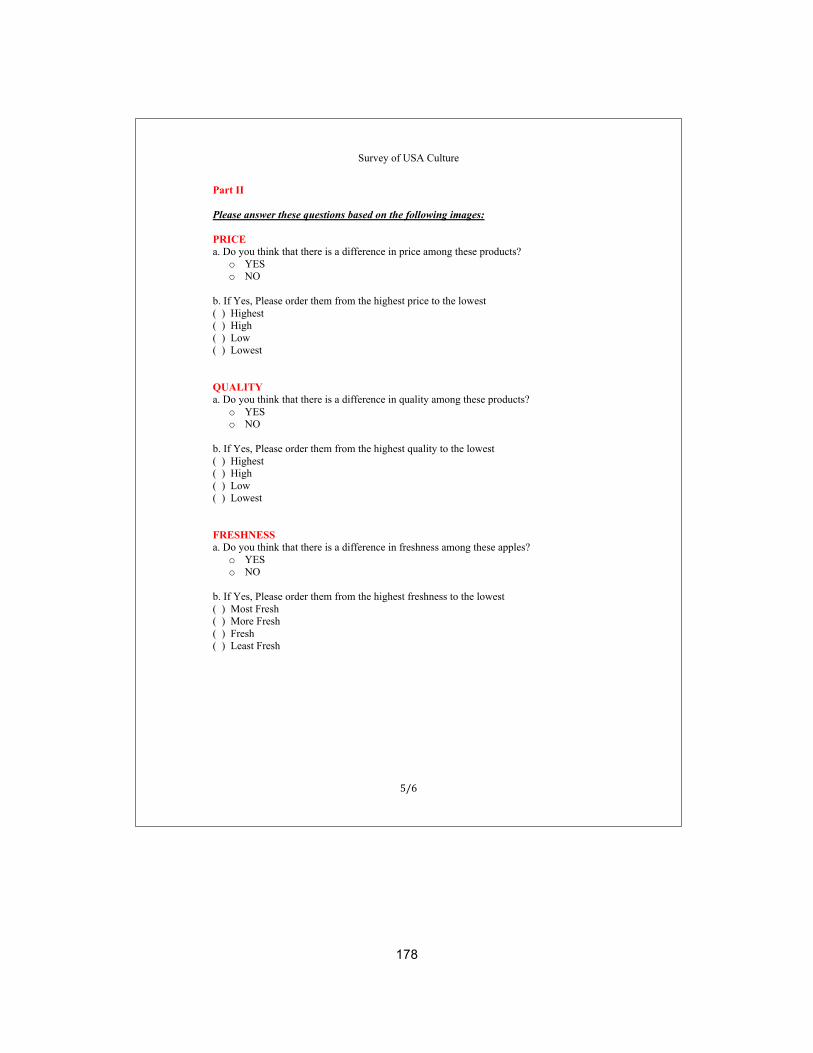
178
Survey of USA Culture !
5/6!
Part II Please answer these questions based on the following images: PRICE a. Do you think that there is a difference in price among these products?
o YES o NO
b. If Yes, Please order them from the highest price to the lowest ( ) Highest ( ) High ( ) Low ( ) Lowest QUALITY a. Do you think that there is a difference in quality among these products?
o YES o NO
b. If Yes, Please order them from the highest quality to the lowest ( ) Highest ( ) High ( ) Low ( ) Lowest FRESHNESS a. Do you think that there is a difference in freshness among these apples?
o YES o NO
b. If Yes, Please order them from the highest freshness to the lowest ( ) Most Fresh ( ) More Fresh ( ) Fresh ( ) Least Fresh

179
Survey of USA Culture !
6/6!
PLEASANTNESS a. Do you think that there is a difference in pleasantness among these cabbages?
o YES o NO
b. If Yes, Please order them from the most pleasant to the least pleasant ( ) Most Pleasant ( ) More Pleasant ( ) Pleasant ( ) Least Pleasant ATTRACTIVENESS a. Do you think that there is a difference in attractiveness among these sets of soft drinks?
o YES o NO
b. If Yes, Please order them from the most attractive set to the lowest attractive: ( ) Most Attractive ( ) More Attractive ( ) Attractive ( ) Least Attractive LIGHTING KNOWLEDGE Did you ever take any courses in Lighting Design or worked in Lighting Design Profession?
o Yes o No

180
APPENDIX C
SURVEY OF MIDDLE EAST CULTURE
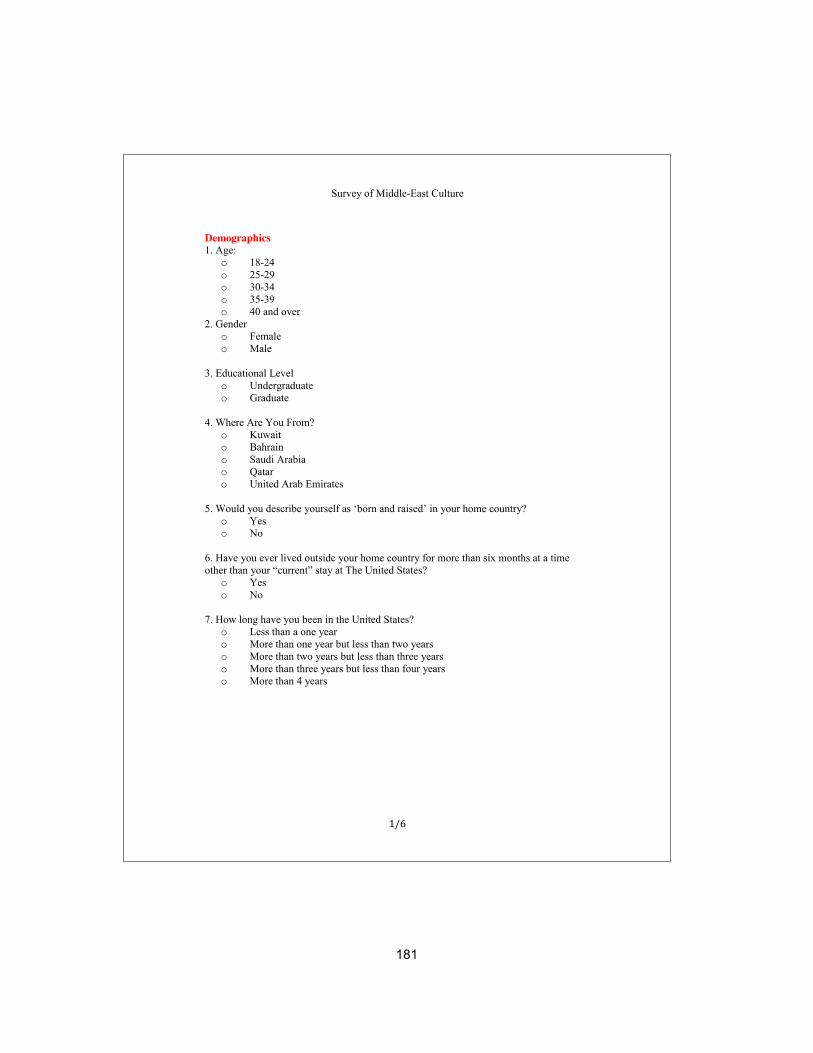
181
Survey of Middle-East Culture
1/6
Demographics 1. Age:
o 18-24 o 25-29 o 30-34 o 35-39 o 40 and over
2. Gender o Female o Male
3. Educational Level
o Undergraduate o Graduate
4. Where Are You From?
o Kuwait o Bahrain o Saudi Arabia o Qatar o United Arab Emirates
5. Would you describe yourself as ‘born and raised’ in your home country?
o Yes o No
6. Have you ever lived outside your home country for more than six months at a time other than your “current” stay at The United States?
o Yes o No
7. How long have you been in the United States?
o Less than a one year o More than one year but less than two years o More than two years but less than three years o More than three years but less than four years o More than 4 years

182
Survey of Middle-East Culture
2/6
Please respond to the following questions based on images shown on the computer screen. You will have about 1-2 minutes to answer each question. This questionnaire should not take more than 45 minutes. Each topic located on the upper left corner of the computer screen will match the topic title on each page of the questionnaire and is highlighted in red. If you have any questions, feel free to ask the investigator. PRICE )االثمنن( a. I would estimate the price of this product to be:
o $1.99 o $2.99 o $3.99 o $4.99 o $5.99
b. Please rate the image shown as based on each of the following dimensions by placing an “X” in the square along the scale.
)معتمم( DIM BRIGHT )ساططع( )متووهھھھج( GLARE NON-GLARE )غيیرر متووهھھھج ( )ضبابي( HAZY CLEAR ) صافي( )بارردد( COOL WARM )دداافئ( )باهھھھتت( DULL RADIANT )مشع(
)شاحبب( COLORLESS COLORFULL )اااللوواانن نيغ( )مبهھمم( VAGUE DISTINCT )باررزز(
)غيیرر مرركزز( UNFOCUSED FOCUSED )مرركزز( )قددعم( COMPLEX SIMPLE )بسيیطط(
1 2 3 4 5 6 7

183
Survey of Middle-East Culture
3/6
QUALITY ) االجووددةة( Please rate the product shown based on each of the following statement a. I would rate the quality of this product as: Low 1 2 3 4 5 6 7 High b. Please rate the image shown as based on each of the following dimensions by placing an “X” in the square along the scale.
)معتمم( DIM BRIGHT )ساططع( )متووهھھھج( GLARE NON-GLARE )غيیرر متووهھھھج ( )ضبابي( HAZY CLEAR ) صافي( )بارردد( COOL WARM )دداافئ( )باهھھھتت( DULL RADIANT )مشع(
)شاحبب( COLORLESS COLORFULL )اااللوواانن نيغ( )مبهھمم( VAGUE DISTINCT )باررزز(
)غيیرر مرركزز( UNFOCUSED FOCUSED )مرركزز( )قددعم( COMPLEX SIMPLE )بسيیطط(
FRESHNESS ) االططررااووةة( Please rate the product shown based on each of the following statement a. I would rate the freshness of this apple as: Low 1 2 3 4 5 6 7 High b. Please rate the image shown as based on each of the following dimensions by placing an “X” in the square along the scale.
)معتمم( DIM BRIGHT )ساططع( )متووهھھھج( GLARE NON-GLARE )غيیرر متووهھھھج ( )ضبابي( HAZY CLEAR ) صافي( )بارردد( COOL WARM )دداافئ( )باهھھھتت( DULL RADIANT )مشع(
)شاحبب( COLORLESS COLORFULL )اااللوواانن نيغ( )مبهھمم( VAGUE DISTINCT )باررزز(
)مرركزز غيیرر( UNFOCUSED FOCUSED )مرركزز( )قددعم( COMPLEX SIMPLE )بسيیطط(
1 2 3 4 5 6 7
1 2 3 4 5 6 7

184
Survey of Middle-East Culture
4/6
PLEASANTNESS ) االمتعة( Please rate the product shown based on each of the following statement a. This cabbage looks pleasant: Disagree 1 2 3 4 5 6 7 Agree b. Please rate the image shown as based on each of the following dimensions by placing an “X” in the square along the scale.
)معتمم( DIM BRIGHT )ساططع( )متووهھھھج( GLARE NON-GLARE )غيیرر متووهھھھج ( )ضبابي( HAZY CLEAR ) صافي( )بارردد( COOL WARM )دداافئ( )باهھھھتت( DULL RADIANT )مشع(
)شاحبب( COLORLESS COLORFULL )اااللوواانن نيغ( )مبهھمم( VAGUE DISTINCT )باررزز(
)غيیرر مرركزز( UNFOCUSED FOCUSED )مرركزز( )قددعم( COMPLEX SIMPLE )بسيیطط(
ATTRACTIVENESS ) لجاذذبيیةاا( Please rate the product shown based on each of the following statement a. This drink looks attractive: Disagree 1 2 3 4 5 6 7 Agree b. Please rate the image shown as based on each of the following dimensions by placing an “X” in the square along the scale.
)معتمم( DIM BRIGHT )ساططع( )متووهھھھج( GLARE NON-GLARE )غيیرر متووهھھھج ( )ضبابي( HAZY CLEAR ) صافي( )بارردد( COOL WARM )دداافئ( )باهھھھتت( DULL RADIANT )مشع(
)شاحبب( COLORLESS COLORFULL )اااللوواانن نيغ( )مبهھمم( VAGUE DISTINCT )باررزز(
)غيیرر مرركزز( UNFOCUSED FOCUSED )مرركزز( )قددعم( COMPLEX SIMPLE )بسيیطط(
1 2 3 4 5 6 7
1 2 3 4 5 6 7
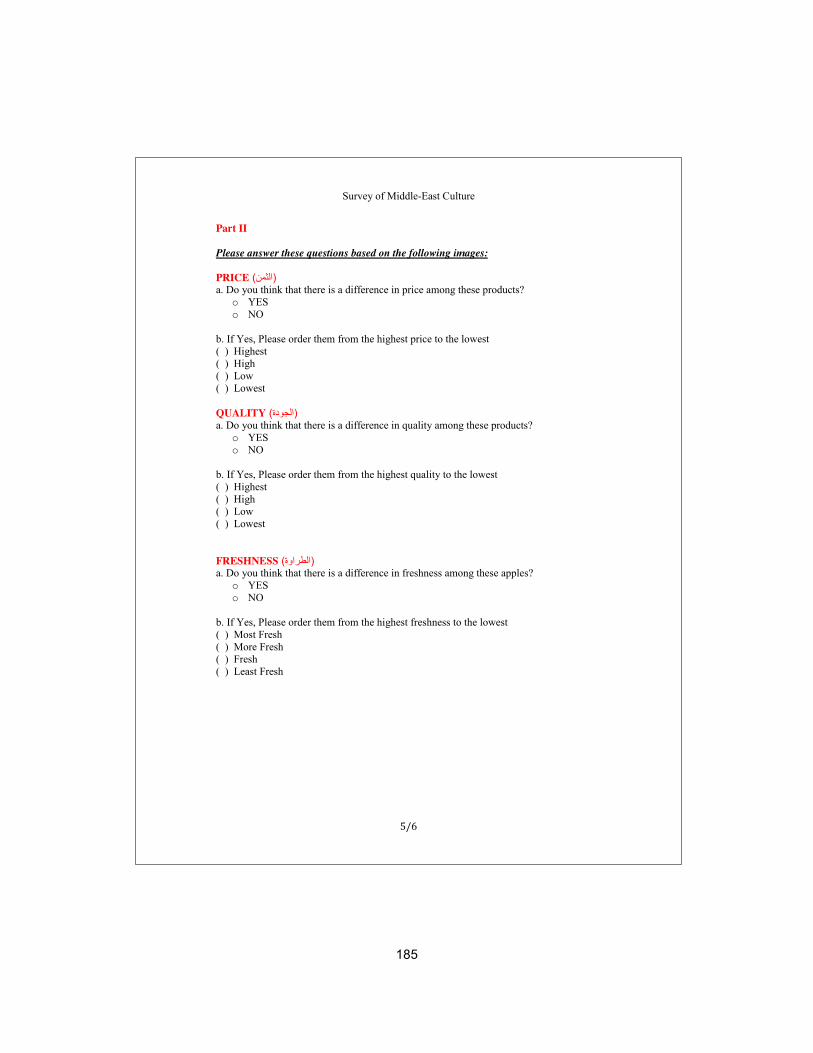
185
Survey of Middle-East Culture
5/6
Part II Please answer these questions based on the following images: PRICE ) االثمنن( a. Do you think that there is a difference in price among these products?
o YES o NO
b. If Yes, Please order them from the highest price to the lowest ( ) Highest ( ) High ( ) Low ( ) Lowest QUALITY ) االجووددةة( a. Do you think that there is a difference in quality among these products?
o YES o NO
b. If Yes, Please order them from the highest quality to the lowest ( ) Highest ( ) High ( ) Low ( ) Lowest FRESHNESS ) ااووةةاالططرر( a. Do you think that there is a difference in freshness among these apples?
o YES o NO
b. If Yes, Please order them from the highest freshness to the lowest ( ) Most Fresh ( ) More Fresh ( ) Fresh ( ) Least Fresh

186
Survey of Middle-East Culture
6/6
PLEASANTNESS ) االمتعة( a. Do you think that there is a difference in pleasantness among these cabbages?
o YES o NO
b. If Yes, Please order them from the most pleasant to the least pleasant ( ) Most Pleasant ( ) More Pleasant ( ) Pleasant ( ) Least Pleasant ATTRACTIVENESS ) االجاذذبيیة( a. Do you think that there is a difference in attractiveness among these sets of soft drinks?
o YES o NO
b. If Yes, Please order them from the most attractive set to the lowest attractive: ( ) Most Attractive ( ) More Attractive ( ) Attractive ( ) Least Attractive LIGHTING KNOWLEDGE Did you ever take any courses in Lighting Design or worked in Lighting Design Profession?
o Yes o No

187
APPENDIX D
INTERVIEW PROTOCOL

188
INTERVIEW PROTOCOL
INTRO
Hello, I am Dalal Alsharhan, A Co-Investigator of this study. I’m a Graduate student, in the Master
of Science in Design Program, with Interior Design concentration.
This interview is conducted to fulfill the research work for my Master’s Thesis. You were selected
because you agreed to participate in Phase I of this study, where you answered a survey that
asks you about your perception of product.
I will ask you certain questions about your Lighting preferences in a grocery shopping experience.
GUIDELINES
• No right or wrong answers, only differing points of view
• We're audio recording.
• Rules for cellular phone if applicable. For example: We ask that your turn off your phone.
If you cannot and if you must respond to a call please before you do so, ask the
interviewer to stop recording.
To Start With
Can you please introduce your name, Country, major and educational background?
QUESTIONS
From now whatever questions I would be asking it would be grocery shopping based. Please
answer them in relation to your grocery shopping behavior alone.
Impulse Buying Behavior
• To start with, what do you think is self-control?
o Definition: self-denial: the act of denying yourself; controlling your impulses
o Definition: Control of one's emotions, desires, or actions by one's own will.
(http://www.thefreedictionary.com/self-control).
• Do you think you can control yourself while shopping? And why do you think so?
• How does your mood affect your buying behavior?
• Do you think that Light can affect your mood while shopping?

189
• How do you think mood and light are related? What relationship do they share?
• Of what we have discussed, would lighting be a factor affecting your impulse buying
behavior?
o Impulse Buying defined as: the purchasing behavior that occurs when a
consumer experience a sudden, often powerful and persistent urge to buy
something immediately (Rook, 1987:191).
Light as an Ambiance Factor
• Can you explain what the “ambience of a store” means to you?
• How atmosphere factors inside the shop, like the smell inside a shop or the music that’s
played or the lighting is important to you and affecting your buying behavior?
Lighting Characteristics
a. Intensity/Brightness
• Do you think high brightness attracts your attention? Or can you explain how high
brightness attracts your attention?
• There has been conventional association of brightness of Light, like low brightness is for
luxury and high quality spaces; high-brightness/intensity lighting is for low-end retail
spaces. Do you agree with this kind of a conventional association? And Why?
• How do you think that “Intensity/Brightness” of the light has an effect on subjective
impressions of products like pleasantness, freshness, and attractiveness versus objective
impressions of the products like price and quality?
b. Correlated Color Temperature
• In this screen, you will see two images: one space is illuminated with cool color temperature,
and the other one is illuminated with warm color temperature, what do you prefer and why?
• In the survey you answered, you were exposed to five different products under four different
lighting as the following, which one do you prefer and why?
• How do you think that “Color Temperature” of the light has an effect on subjective impressions
of products like pleasantness, freshness, and attractiveness versus objective impressions of the
products like price and quality?
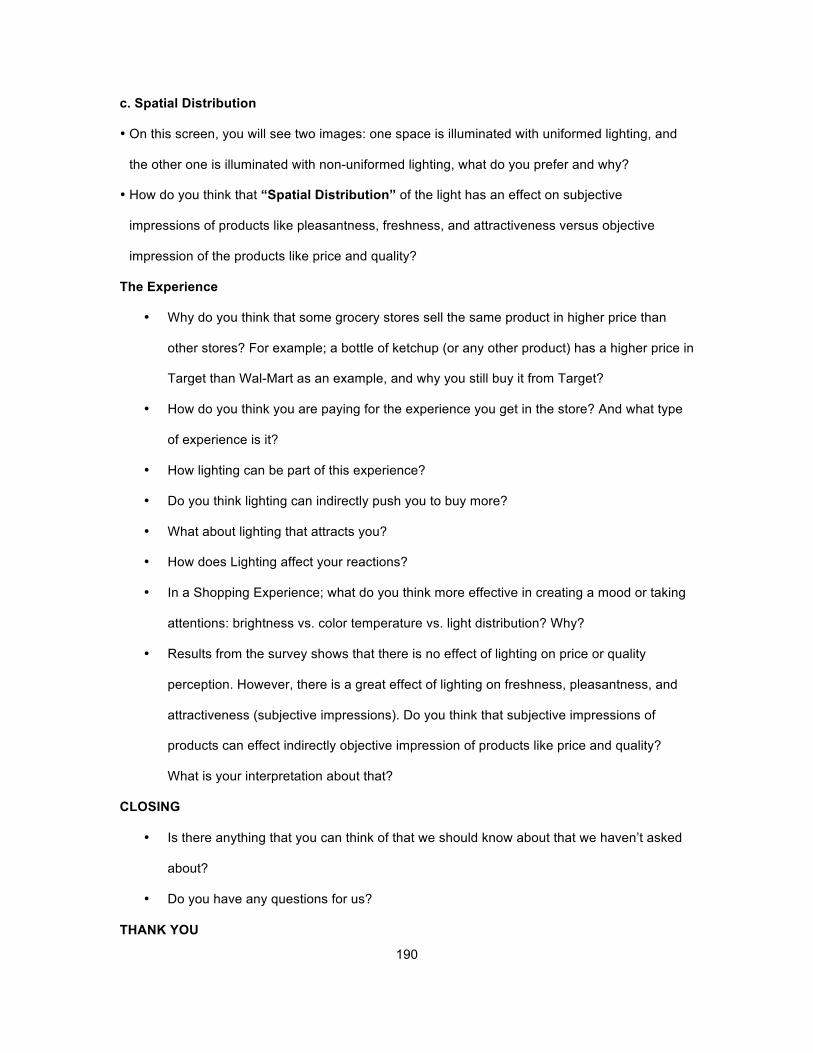
190
c. Spatial Distribution
• On this screen, you will see two images: one space is illuminated with uniformed lighting, and
the other one is illuminated with non-uniformed lighting, what do you prefer and why?
• How do you think that “Spatial Distribution” of the light has an effect on subjective
impressions of products like pleasantness, freshness, and attractiveness versus objective
impression of the products like price and quality?
The Experience
• Why do you think that some grocery stores sell the same product in higher price than
other stores? For example; a bottle of ketchup (or any other product) has a higher price in
Target than Wal-Mart as an example, and why you still buy it from Target?
• How do you think you are paying for the experience you get in the store? And what type
of experience is it?
• How lighting can be part of this experience?
• Do you think lighting can indirectly push you to buy more?
• What about lighting that attracts you?
• How does Lighting affect your reactions?
• In a Shopping Experience; what do you think more effective in creating a mood or taking
attentions: brightness vs. color temperature vs. light distribution? Why?
• Results from the survey shows that there is no effect of lighting on price or quality
perception. However, there is a great effect of lighting on freshness, pleasantness, and
attractiveness (subjective impressions). Do you think that subjective impressions of
products can effect indirectly objective impression of products like price and quality?
What is your interpretation about that?
CLOSING
• Is there anything that you can think of that we should know about that we haven’t asked
about?
• Do you have any questions for us?
THANK YOU

191
APPENDIX E
SAMPLE TRANSCRIBED INTERVIEW

192
Interviewer: So, hello. I’m [Inaudible], a core investigator of this study. I’m a
graduate student in the Master of Science and Design Program with Interior Design concentration. This interview is conducted to fulfill the research work for my thesis, for my master thesis. You were selected because you agreed to participate in Phase 1 of the study where you answered the survey that asked you about your perception of products. I will ask you certain questions about your lighting preferences in a grocery tracking experience. So the guidelines are there’s no right or wrong answers, only different point of views.
We are audio taping, audio recording. Rules for cellular phones, if applicable, for example, we ask you that you turn off your phone. If you cannot and if you must respond to a call, please before you do so, ask the interviewer to stop recording. And I’ll use images. I’ll show you images during the interview just when you want to describe or mention of the images, just say A or B. It will be indicated. Just use it instead of this and that and just pointing on it. And to start with, can you please introduce your name, country, major and educational background.
Interviewee: My name is XXXXX. I’m from the XXXX. I’m currently a XXXX
candidate in the XXXX XXXX and XXXX or XXXX at Arizona State University. My educational background include a XXXXXX in open media at the XXXXXX and I don’t know, As and Bs in high school.
Interviewer: Okay, great. So we will start with the questions. So, from now whatever
questions I would be asking, it would be grocery shopping based so please answer them in relation to your grocery shopping behavior alone. So, first we will talk about impulse buying, impulse buying behavior so to start with, what do you think is self-control? There is I’ll mention too definition of self-control that will help you to answer that but the first one is self-denial, the act of denying yourself, controlling your impulses. The second one is control of one’s emotions, desires or actions by one’s own self. What do you think is self-control?
Interviewee: In terms of grocery shopping? Interviewer: Right. Interviewee: So, to me that would be sticking to your shopping list and/or budget more
than anything. And depending on say food allergies or other medical issues, sticking to the things you’re supposed to eat, not the things you shouldn’t eat.
Interviewer: Do you think you can control yourself while shopping and why do you
think so? Interviewee: Generally, yeah, I don’t have a problem with that but it’s mostly because
I buy very little prepackaged food and generally make all my food from actual food ingredients instead of processed food.
Interviewer: Okay. How does your mood affect your buying behavior? Interviewee: It can affect it pretty heavily. For instance, I was shopping hungry and
tired a couple of nights ago and ended up buying two different things of

193
ice cream so even then there are sort of, I wouldn’t call them weaknesses because I enjoy indulging in good food sometimes, but that definitely late at night, hungry, tired will make that happen or in a hurry, just running through the store grabbing stuff versus actually spending the time to prepare your list.
Interviewer: Okay. Do you think that light can affect your mood while shopping? Interviewee: Yeah. Interviewer: Lighting of a store? Interviewee: Very much so. Interviewer: How? Interviewee: Well, for instance, in the meat aisle at a lot of grocery stores, they use
red lights and it makes the meat look redder and then when you pull it out to the regular light, you can see that it’s not nearly as “fresh looking.”
Interviewer: Okay. Interviewee: And also if you can’t read the labels or whatever in an aisle, maybe not a
supermarket, but in like a little bodega or a market, with bad lighting, not even being able to read what the packages are.
Interviewer: Okay. How do you think that mood and light are related? What
relationship do they share? Interviewee: Mood and light? Interviewer: Yeah. Interviewee: In the shopping experience – Interviewer: Um-hum. And you can go in general a little bit. Interviewee: Sometimes too much in the way of very bright fluorescent lights will
create a cold, kind of hostile feeling environment. More on the electrical end, fluorescent lights buzz and that can be anything from annoying to seizure inducing, depending on if you have that medical condition.
And then if you have, feel like displays of food in this case that are lit properly with like track lighting, like a three-point lighting scheme, showing my art backing, but if you light it properly, like you were taking a photograph of it, stuff looks great. So, if you go to some of those Safeways and Fry’s grocery stores here have track lighting over their produce and they do crossing light patterns on it and it all looks fantastic.
Interviewer: Then what we have this has to do would lighting be a factor affecting
your impulse buying behavior. Impulse buying is defined as the purchasing behavior that occurs when a consumer experience a sudden, often powerful and persistent urge to buy something immediately.

194
Interviewee: I would think yes because I’m thinking between different grocery stores that I shop at because I shop at a wide variety of them, when you’re standing – the classics are, you know, you’re at the end of each aisle where they’ll put sales and very much impulse purchases or higher-priced items at the ends or at the ends of the aisles and also when you’re standing in line, the racks of candy and other little knick-knacks.
Sometimes it’s dark enough in the store overall that you can’t actually see very much of the stuff in the lower racks and even the stuff at face level is harder to read and then in other places with better lighting layouts, those things are fully illuminated and do grab your attention.
Interviewer: Okay. Now, we will talk about light as an ambience factor. Interviewee: As a what factor? Interviewer: Ambience factor in a store so can you explain first what the ambience of
a store mean to you? Interviewee: Generally I would, because you were asking about mood earlier,
ambience and mood both, to morale. Interviewer: To what? Interviewee: To morale, especially of the people that work in that environment.
People are nicer in better lit environments because they can see better and can also just more comfortable to be in mentally. And if you’re under harsh blue light all day, kind of your standard fluorescents, it’s a lot different than if you’re under warm and candescent lights or nice halogens. Does that help?
Interviewer: Yeah. Interviewee: I think more, I’m trying to think, like I’m trying to compare like Trader
Joe’s to Safeway here. It’s a Lee Lee actually because that’s another place I shop a lot. Lee Lee has very bright, consistent light throughout the store. They don’t do anything special with the lighting, but you can at least read everything that’s in the store all the time. Trader Joe’s also just has kind of a basic grid of light. It’s not aimed or anything, but it’s got a different light tone to it. It’s a warmer light.
And then with the Fry’s I mentioned earlier that has a track light over the produce, at least in the produce section, it’s almost like you’re walking around spotlights because they don’t have as much of the overhead lighting so like just the track lighting provides the illumination and so there’s like darker – the floors are kind of darker and it helps. It helps the produce especially stand out.
Interviewer: Okay. Interviewee: Actually there you go. There’s a visual lesson right there. Interviewer: What? There is what?
195
Interviewee: There’s a possible visual lesson right there in terms of maybe not stuff on flat, straight up and down, vertical racks but things that are piled up like produce is, kind of chest or waist height, to be able to provide a background or backdrop that’s dark for them makes them stand out that much more when they’re lit. So, it’s just sort of like if you look at your computer screen when it’s off or a TV screen when it’s off, it’s not light on the background, it’s a black surface that light is emitted through and it’s because the black actually helps it stand out.
Interviewer: Right. And what about other factors like atmosphere factors like smell or
music that is played, not just lighting but you already talked about lighting but other atmosphere factors.
Interviewee: For me chemical. Chemical and spoiled smells spoil it for me. So, if you
walk through the meat department and you get that smell of like old animal or whatever or even in the veggie department like someone forgot an orange or something and it’s got that kind of reek to it, that always does it for me. I do not like that. The smell of cleaning chemicals, especially in the parts of a store where you need to be able to smell the food, again, I’m kind of a picky shopper about stuff like that so I will smell my melons and my pineapples and my apples, everything to make sure it’s good and ripe or know what the ripeness is.
And if there’s like whatever, like floor cleaning solution or something like that and it still smells like it, that wrecks the atmospherics. Let’s see, smell, you said yes for music, music, something ambient, something kind of really in the background usually down tempo or whatever, instrumental. One thing and you get this in the bigger grocery stores like the intercom cutting in every couple of minutes to ask people to go somewhere is really annoying. It’s distracting from the experience of shopping so like an example is at Trader Joe’s, instead of using, I mean those are smaller stores, it’s not like a mega grocery store at that point, but at Trader Joe’s when they need help upfront, all the cashier’s upfront ring like an old bell from like a boat and they’ll shout something like man overboard or something, going with their somewhat nautical kind of theme, but they all do it in unison but you know it’s coming and it’s actually part of the experience whereas you get the like the very electronic, you know, Cashier 5, come to this thing or whatever and it’s not nearly as pleasant. I’ve never seen this but it’d be amazing to have, and this would probably only work in New York or San Francisco, but like DJs spinning in an upscale grocery store would be really nice. Just get like a little like low drumming base; he’s got like a little DJ booth or something. That would be really neat.
Interviewer: Yeah, I would imagine that would be so interesting. Interviewee: I’d shop there. Interviewer: What about all like the music and smell, lighting, like what is the most
that affects you? Interviewee: Out of all of those?
196
Interviewer: Um-hum. Interviewee: Realistically you have to be able to see so lighting is probably the No. 1
thing, but I’m just thinking like back when I lived in Providence, we had like a bodega right across the street. I wouldn’t go there because of the smell. You walk into, especially smaller stores and stuff, and you can tell when it’s not being cared for, and that and they also left the milk at, I think it was 55 degrees in that place, but that’s a special case. I’d say lighting is the most important because if you can’t see, you can’t navigate and after that smell and after that probably the noise environment.
Interviewer: Okay. But what about if you get in a store that the lighting was not really
good in terms of for example if it’s too bright but everything is good to you in terms of the price, environment, whatever, like quality of the product, do you still shop there or not?
Interviewee: This is more than a grocery store but Target is like that. Target for
instance and they have a grocery section, but they use that very even, very, very bright grid. It tends to be, maybe just like maintenance is part of this, even though they use very bright fluorescents, there’s very, very rarely buzz and they don’t have that flicker. I’ve never been in a Target that had flickering fluorescent light for instance like if you go in, again this is a little broader, but if you go in Wal-Mart, every Wal-Mart in the country has bad, buzzing, flickering lights.
And there have been even a brand one that did and in some ways that’s a matter of, if you will, perceived cost-cutting and a hilariously aggressive cost-cutting environment versus one that values customer and employee experience and some of this so trying to think of some specific grocery stores. Lee Lee like that with a very, very bright grid but now that I’m thinking about it, some of theirs are incandescent as well. They use a mixed bulb environment so it’s actually multiple temperature, or sorry, light temperatures, light colors.
Interviewer: Now, we will talk more about lighting versus [inaudible] so I’ll show you
here so do you think that brightness attract your attention or can you explain how brightness attract your attention?
Interviewee: How brightness? When you say brightness, do you mean –? Interviewer: Intensity. Interviewee: Intensity of light or color of the object? Interviewer: No, intensity of light? Interviewee: Intensity of the light. Below a certain point, you can’t read it. Interviewer: Hmm? Interviewee: Below a certain point, you can’t read something. Above a certain point of
illumination, it is too harsh, [inaudible] so there’s a range of in between in there that goes from, I’d say it’s like dim to readable to standout like what we’d use a spotlight in theatre and video production and then after that

197
it’s too bright and be kind of like, it’s like if you’re on a car lot during the height of the day, you get the glint off of everything and it’s too much, especially – well, back to the produce versus stuff in the aisles, if you’re talking product that’s wrapped in say plastic or aluminum foil or something like that, it has different lighting characteristics than produce which has light-absorbing and reflective characteristics.
It’s based on sunlight whereas the plastic – well, if you hit plastic wrap
and stuff with the same brightness that you might illuminate produce with, it’s going to have that glint and it’s gonna be a little harder to read, to see it so you’d almost want like more muted kind of maybe – I don’t know if it’d be more muted or just maybe a slightly different temperature versus intensity at different color of the light.
Interviewer: Can you recall lighting in a grocery store or any other store that attracts
you? Interviewee: So, yeah, the kind of produce section that I was talking about. It was
well lit. That was really, I mean that’s why I keep going back to it because it really nicely designed. It’s just like you could just do anything set of track lights over anything you buy like that and it’s just three points crossing it and that always gets my attention. Also, like in open frozen, like those open freezer devices, it’s like a big long freezer that’s open on the top with frozen stuff in it, when those have light in them, that’s always better than having just light outside, like them just having light from above.
Sometimes usually they just have light in the back. Or and the same principle holds to this, anything in a glass case. If a glass case doesn’t have lights in it, why do you have a glass case? You need like [inaudible], kind of low temperature, like low physical temperature lights, like modern LEDs or something like that to really pull that off, but that always adds to the experience.
Interviewer: I show you now, here. So, there has been conventional association of
brightness of light, like low brightness for luxury and high quality places, high brightness or intense brightness for low-end retail spaces, do you agree with this kind of conventional association and why?
Interviewee: Absolutely. Well, Example A right here is exactly the kind of setup I was
talking about. It is what we would call in the design world curated experience. You go in, the floor’s dark, there’re pools of light around the merchandise; you have your crossing light patterns. Again, this is Example A. You have your crossing light patterns. You can really, really see what you’re looking at when you walk up to it. They’re neatly piled up but they have that, it’s a Japanese term, but its wabi-sabi, certain disorganizedness to them, aesthetic disorganization and it just looks nice.
And then Example B is that sort of washed out fluorescent grid environment. Example A, you can actually see. You have at least one type of direct droplight, droplights from the ceilings and then a separate grid of track lighting so you can do a lot with it. You have a base illumination but the base illumination is fairly dark. It’s just enough to

198
navigate down the aisles, even to the extent like this person in Example A is wearing black and there is no definition in the exposure. But having two different types of lighting gives you that sort of ability. It’s like you’d have flood in spots for video production versus the grid in the bottom which is just pure illumination, harsh light. It’s actually a white purple light and it’s not as appealing. It’s just floods everything with that light.
Interviewer: But the same products are sold here but do you think that in Example A it
looks more of a high-quality, high-end kind of experience? Interviewee: Like I said, it appears as a curated experience whereas the other one,
the more gridded, kind of high-brightness environment in Image B, it’s almost like something you could have robots going down the aisles, loading merchandise onto those racks whereas the lighting but also the presentation and a lot of it has to do with, it’s like structural, you know, it’s not just the lighting in that case because like if you use that kind of double-lighting scheme, track lighting and droplights like that, in the other environment, that’s just kind of the grid of aisle, it wouldn’t work because you can’t aim that light onto those products that way.
Could you rearrange all those products in a different way and then successfully light it like that, yes, but it would require a different set of base assumptions when you’re creating the store. So, are these two different versions of the same store?
Interviewer: No, different. Interviewee: Because this looks like a boutique grocery store/café like Green Grocery
and Café type place and the other one looks like a Wal-Mart, whatever they call it, [inaudible] or whatever.
Interviewer: I have like the other, well, the next question is – it’s a little bit complicated
so how do you think brightness or intensity of light has an effect on subjective impression of products like pleasantness, freshness and attractiveness versus objective impressions of products like price and the quality? So, you have two different impressions. So, how do you think brightness can affect them?
Interviewee: Can affect the perception of the quality of the product? Interviewer: Um-hum, versus like pleasantness or freshness of the products. Interviewee: So, well, I used the meat example earlier. That’s probably the best
example of it because they use, and you can look up next time you’re at the meat counter, if you look at the fluorescents that are right over the meat counter or right in the glassed-in meat counter, you’ll see they have a pink sleeve over it, that’s the most blatant example of manipulating light to make the product look more saleable. The irony being that fresh meat nor aged meat actually looks like that way.
And for produce, well like in these examples, I wish there was produce in Example B because it’d be interesting to see more directly sale of produce but in the context of big buck store that’s all “true flavored
199
products” so maybe that counts but in a more curated example in A, I think it looks like the centers of the track lights on the vegetables are probably about the same intensity of light, but it’s only directional. So, if you’re holding the fruit, well that looks like avocados, so if you’re holding the fruit, you go up to it and there’s an illuminated pile, you can even see that there’s illumination there and there is where the main are and there’s a pile of avocados in the dark spot where people are putting them down. They’re picking them up in the bright spot, examining it right there and then they’re putting it down in the dark spot creating pits in the bright area at least right in there and sort of it in that one but it’s kind of migrated. You need to have a certain brightness of light to be able to examine especially produce. If it’s too bright, I’m trying to think like I’ve never been in a grocery store where it was too bright to examine produce. I’ve been in stores like Example B where you just wanna put your sunglasses on because everything’s so bright, but maybe this is like a food snob thing but I wouldn’t buy vegetables in a place that was so bright like that unless it was an absolute emergency just because it would look like very mechanical and you don’t have any guarantees on what you’re actually buying at that point in terms of where it’s from or any of that. I’m trying to think, as far as non-produce, kinda packaged goods and stuff, I guess this goes with sort of light conservation in urban environments where we put different types of street lights in so that don’t shine on birds, for sky watching and for saving migratory birds, in the aisles you could use more advanced lighting like LED lighting again to actually illuminate if you were doing a gridded layout like that. Instead of having all the illumination coming from the top, if in the actual racks there was lighting, it would be more pleasant first off because it would then again take that appearance, curated experience and it would give you immediate, you know, you reach for that box of cereal, you already know it’s Cheerios. All you really wanna see on it is maybe the price or something or maybe the little price tags are on the racks so you already know like actually like their quality and then maybe there’s some illumination like 6 inches or a foot back in each rack that shines down so you can pull it down, look at the object and then put it in your cart. And that would be kind of a high-tech compromise and it would actually probably save significantly on power bills and maintenance because every time one of these lights burns out, you have to have a cherry picker to go in there boost up to it to replace it.
Interviewer: Do you wanna add something? Interviewee: No, I think that – also, one other thing to notice and this goes back to that
dark highlights colors, white washes colors out. This floor is like a stained concrete. It’s look like brown stained concrete or a miscellaneous stained concrete. The other one is a white-tiled floor so that even to make things look colorful in that environment, their using these incredibly bright yellows, oranges, reds, these purples, all the colors.
200
There’s blues and greens, all the colors they’re using are incredibly bright, not just vibrant, they’re like neon, to stand out against the white background whereas in Example A, even – oh no, okay, good, so you have sensor, all caps, or the word cook and be and the word sale in [inaudible] so they’re kind of equivalent like that but the word sale on those sticks out even though it’s kind of a medium brick red in Example A. Because the rest of the environment has a mix of lights and darks and ranges of tone, it doesn’t just have these sorts of neons and white. The Environment B had black columns and a dark grey floor, something like that, a more differentiated environment and could have less neon.
Interviewer: The lighting will be more acceptable maybe. Interviewee: Yeah, at that point, yeah, because with this, every white surface reflects
all that white purple light. Interviewer: Now we will talk about the correlated color temperature light so in this
screen you will see two images. One space is illuminated with bold color temperature and the other one is illuminated with warm color temperature. What do you prefer and why?
Joshua Interviewee: For grocery shopping and for food definitely warm color temperature. It
is much easier on the eyes overall. It’s closer to sunlight which is the root of why warm color temperature feels good in the eyes. It’s also, in the case that these are produce in this case, it’s what produce grows under, it’s a yellowish-white light so it looks – I guess I would say it looks both qualitatively and quantitatively better under that light because it’s the natural lighting conditions.
You might be able to argue that plastic, that plastic goes nicely with kind of high-intensity UV, intense whitish-purple light, cool temperature light because they’re both very unnatural but that doesn’t make the cool temperature, Example A, hospitable. It’s a very mechanical kind of robotic environment whereas the warm color temperatures in the two examples of B, it’s inviting essentially.
Interviewer: So, the same question that I asked about Brightness, I’ll ask it to you in
terms of color temperature so how do you think that color temperature of the light has an effect on subjective impressions of a product like pleasantness, freshness and attractiveness versus objective impression of product like price and the quality?
Interviewee: How does color temperature affect perception of the qualitative elements
of the food? Interviewer: Yeah, versus subjective impression like freshness, attractiveness. Do
you think it affects and how? Interviewee: Well, especially in the context of produce and meat. It has to affect our
perceptions of freshness and kind of appeal just by the fact that at the meat counter they already do that. So, it’s already known that it helps sales. If you’re specifically looking at cool temperature fluorescents versus warmer color halogens or incandescent, I would say anything that

201
can spoil probably looks better under warm light. And things that don’t spoil like packaged processed foods and stuff, it might not matter but in Example A, this is perfect from what I mentioned earlier about the bright light glinting off the plastic.
That’s hard to read. It’s hard to read Tostitos in Example A right there because there’re non-uniform – the packaging is non-uniform and then so it picks up multiple angles of the light but even in the square packages, Pop Tarts or whatever those are, as you walk by those, you will catch the overhead lights reflecting if they’ve got plastic or shiny packaging to them. I think in some ways the distinction is probably largely between whether it’s food that spoils and you need it to actually kind of judge its freshness versus those prepackages ones. And also with, I guess with packaged goods it’s more – as a retailer, your customers either already know exactly which one they wanna buy because they always get that kind of that thing or you’re trying to get people to buy something new and in that point, it’s either got an extra sign attached to it or it’s on the end of one of the aisles to call attention to it. And even in that case, if it’s on the end of an aisle, there’s a chance it’s got its own light at that point, depending on the grocery store. Whereas like with fresh goods, if you put, well, Example B has apples, grapes, pears, grapefruit, if you put that stuff under purplish, very cool fluorescent, with pears, instead of being that brownish green are gonna be gosh, they’re gonna have an orange cast to them and the apples are gonna have a yellowish-green cast to them and grapefruits are probably actually gonna take on purple highlights because they’re shiny. And then the grapes, I don’t know, they’re wrapped in plastic so they’re probably just kind of a bluish kinda cast to them but it will affect the color of it. An example of this outside of children, people generally won’t eat blue food and using this kind of light, using cool temperature light as in Example A always gives every bit of food you’re eating a bluish cast.
Interviewer: Right. Let me show you are. So in the survey you answered you were
exposed to five different products under more different lighting. Of the following, which one do you prefer and why?
Interviewee: For each of the five items? Interviewer: Overall and you can specify. Interviewee: Are these all the lights and these are all in the same direction? Interviewer: Um-hum. Interviewee: Okay. I think it’s mostly a tossup between warm LED and halogen in
general leaning towards warm LED, especially you can see the UV effect on both of these, on the very, very purple cabbage in very different ways too. I’d say in these particular examples, the halogen bulb looks better on the apple and actually the cool LED looks pretty good with it. The packaged goods, the cool LED I think is by far, as least in this very directional lighting scheme, is by the best. It’s the most readable. And

202
coming from a marketing background, you asked about education, but I have a marketing background professionally.
The packaged goods in the cool LED are actually the closest to the intended colors from a brand management standpoint that Coca Cola is that red color, that’s the right red for it, that bluish-purple, that royal blue on the Red Bull can, the intended color of the tomato sauces some place between the cool and the warm LED. Actually the halogen is pretty good on that as well, but the packaging, I’d say the packaging looks best on the cool LED for all of them and I’d just have to say the warm LED for the fruit and the vegetable.
Interviewer: Okay. And the other question is the same one. I think I asked you this
one. No, I will proceed to that one. So, now we will talk about special distribution. So, on this screen you will see two images. One space is illuminated with uniformed lighting and the other one is non-uniform lighting. So, which one do you prefer and why?
Interviewee: Generally, I guess I would say Example B which is non-uniform lighting
but that’s also, that goes back to that idea of a curated experience because the non-uniform lighting isn’t random. It’s tailored. They’ve actually shaped the light to the particular situation and that shows a level of care and sort of attention to detail that a gridded lighting scheme or completely uniform lighting simply can’t have. I would definitely prefer the more directional kind of non-uniform lighting in Example B. It’s not sterile. Example A in this one, it’s so harsh and just like kind of sterile I guess is the best word.
Interviewer: Okay. And do you think that special distribution of light can affect your
perception of price, quality, freshness, attractive, pleasantness? Interviewee: Quality, pleasantness, attractiveness, yes. Trying to think, will the
lighting in the situation affect price or your view of the price, I would have to say yes, absolutely because you can take the same, look at a pile of avocados in blue and you can take that same pile of avocados, put it in the sort of cooler or whatever in Example A and sell them for 69 cents a piece of you can sell them in Example B for three for three bucks because it will look better in that moment for sure.
You’re never gonna get somebody to pay $7.00 for fresh eggs, I mean fresh like off the farm, boutique eggs because I bought some at the Tempe Farmer’s Market recently. It was like $6.00. It was six or seven bucks for a dozen eggs but they were like fresh from and they’re fancy chicken, blue eggs and stuff like that. There you go. There are a few blue foods but that’s just the shell you know. You could I would say from B2C, Business to Consumer marketing standpoint, you probably couldn’t get people in Example A to do that. They would look at that and think it was a joke, but there’s expectations in that uniformed lighting environment and everything about that whereas as in the curated, non-uniform lighting environment, you do two or three lights down on those eggs and it says today’s special picked fresh by Farmer Joe in this exact location and gives his phone number on it or something and people will part way with the $7.00 for a dozen eggs.

203
Interviewer: Okay. So, you think lighting can be part of that? Interviewee: Especially from the idea of trying to kind of upsell materials, yes,
absolutely. Interviewer: You wanna add something? Interviewee: Well, part of that goes with I think with that idea of we expect big buck
stores with that sort of lighting environment, we expect big buck stores to be places that are cheaper, you know, they’re “bargain” even if you’re paying the same prices as someplace else. But in that context, you can’t sell kind of perhaps specialty items like that.
Everything is mass, you know, kind of maybe not least common denominator but definitely the average product. You’re never gonna sell – in that sort of environment, you’re never gonna sell really exotic and especially expensive foods. That said, my understanding is Wal-Mart’s the largest seller of organic vegetables in the world at this point strangely enough but that is still sort of a mass market approach to organics with all the cost cutting and everything that’s involved with that sort of thing. Yeah, I’m trying to think if there’s anything else with that but no.
Interviewer: Okay. Now, we will talk about more of the experience. So, why do you
think some grocery stores sell the same product at higher price than other stores? For example, a bottle of ketchup or another product has a higher price in Target for example than Wal-Mart. Why do you still buy it, well, not you, but why do people still buy it at Target than Wal-Mart?
Interviewee: A lot of items, especially in the retail chain, are going to bare the price
that people will buy it at. Either Target’s figured out that they can charge 15 cents more for that thing and so they do or they float the price kind of where they think it should be and hope that while you’re picking up underwear and an air filter and a new iron and kind of other things and you see that bottle of ketchup and remember that you need ketchup and just grab it. Some of that is actual location so if the grocery store you’re shopping at or the store you’re shopping it is the only one in the area, they can charge whatever they want.
I used to live in a food desert in Providence, Rhode Island. We had no grocery stores within, even a convenient drive; you’d have to go outside of, essentially outside of the city to get groceries or at least outside of the neighborhood. And so any of the convenience stores in that neighborhood charged whatever they could get away with for prices and it’s just that’s kind of, in some ways, that’s just like the free market at work, but there’s also distinctly known exploitation. If you’re the only person in a square mile that sells milk, you can get away with charging six bucks a gallon for it. That’s only, well, in the case of the neighborhood I used to live in, that’s only amplified with sort of well, EBT or other WIC, kind of government food credits, food stamps and stuff like that because then it’s all funny money at that point. But food deserts probably aren’t part of your study as much but that was definitely – you’d see like – if we’re talking lighting, all these places that were charging six bucks a gallon for spoiled milk, had terrible lighting. It’s just sort of like a couple of flickering, overhead
204
lights and nothing else or lights in the cases for the cold stuff and then a few lights above and that’s all.
Interviewer: How do you think you are paying for the experience you get in a store?
So, do you think you are, it’s part of or the prices are higher just because of the experience and what type of experience was it?
Interviewee: I don’t think the experience floats exactly with price so Trader Joe’s has
some of the cheapest food around but has a carefully curated experience and it’s quite pleasant. But that said, I think a lot of retailers play on that concept. So, Whole Foods being egregious example of it over curates everything and then charges you as much as they possible can for it. I guess I’d say there’s a balance in there.
It’s just weird like you can go to a Whole Foods in Omaha, Nebraska, and they charge New York prices for food but you go to a random market in New York City and it’s like at least [inaudible] that and at that point you’re literally just kind of getting an experience. You’re paying for the experience with that.
Interviewer: Do you think lighting can be part of the experience that you are paying
for? Interviewee: Yeah, lighting is absolutely part of the experience that you’re paying for,
shopping inside of. Well, yeah, I mean Whole Foods versus Trader Joe’s kind of is a good example of that because they use the track lighting, they use kind of the scheme that I’ve been describing and then you have photos of where they’ve got like the nice crossing track lights and all of that. And yeah, you’re definitely paying for that experience and the lighting helps kind of amplify that experience.
It gives it a theatrical element to it, an element of discovery as you move from kind of different levels of illumination and in pools of light and everything. There’s a more exploratory nature to it. I’m not sure how that would translate to price overall but definitely grocers and grocery corporations like that do use lighting to try and boost the experience for especially higher priced groceries.
Interviewer: Do you think lighting can directly push you to buy more? Interviewee: Yes, undoubtedly. I don’t even think it’s indirect. I think it’s quite direct.
Well, it’s kind of like the first example of the candy at the checkout, if you can’t see it or if it’s in disarray, but especially if you can’t see it, you’re not gonna buy it.
And like sometimes you’ll see in that kind of impulse buy, you’ll see like an angled shelf so that more of the merchandise gets illuminated and that definitely spurs you to kind of reach out and grab something even if you didn’t intend to grab that M&Ms. Oh, it’s right there and it’s well illuminated and it’s not dusty or anything like that so yeah.
Interviewer: And what about lighting that can attract you? Interviewee: Does the lighting direct your attention?

205
Interviewer: Um-hum. Interviewee: It literally sets the tone for what you’re looking at and what your
expectations of those items are. If done right, lighting can be very comforting and I think that’s some of that indirect lighting schemes are probably part of the attractiveness along with some sun-like color.
Sun-like color is comforting, just that it’s got that, the word would be like dappled kind of look like when you’re walking through the forest and the trees kind of block out some of the sunlight. There’re pools of light in there. Those sorts of indirect lighting schemes kind of mimic that and that’s a very powerful force. I mean it is a comforting feeling and it goes back to that sense of exploration and finding things, a sense of discovery.
Interviewer: Okay. How does the lighting affect your reactions? Interviewee: Reactions like purchasing reaction or reaction to a product? Interviewer: Both. Like for example, I can give you example if you would like. For
example, some people would walk in a store that is really high in brightness and then they will walk away and some people just affect their time, spending time there in the store or, you know.
Interviewee: So, in a really bright store like a Target or kind of a large chain grocery
store or whatever, I will often find myself in the brighter parts of the store because you often end up with that sort of mixed scheme and they’ve got a grid over most of the store and then they’ve got produce, bakery and meat have its own lighting. In the more kind of uniform lighting scheme areas, I’m just going up and down the aisles looking for the one or two things I need and it goes in the cart as fast as I can.
So, I would say that that probably, maybe the uniform scheme, uniform lighting scheme probably pushes people to shop faster which is actually brilliant because it means people make bigger mistakes in terms of shopping, not as much time to price compare and stuff like that. And then the more natural, non-uniform lighting leads to that sort of browsing instead and so if you’re goal is to move people through your store as quickly as possible where they grab the Cheerios and the stuff that they know and they’re just throwing it in their cart and leave, maybe that really bright lighting scheme makes sense. If you want people to explore and discover new food and discover kind of new elements to the environment that you’re in, you’ve got this store in this case, something with some variation will keep, at least myself, would keep me there more. I’m thinking some book stores that are like that. The Strand in New York City was like that like not necessarily super careful lighting grid but it’s not direct overhead. It’s kind of angled track light in most of the places and it encourages you to walk around and you’re like, oh, you see this book and you pull it off the shelf and you flip through it. It encourages that sort of mingling and browsing kind of environment or the café we’re in. It’s got rid of the lights, pools of light because they’re using candescent.
206
Interviewer: So, in the shopping experience, what do you think more affects,
[inaudible] or taking attention? Is it brightness versus color temperature versus light distribution? Why? What is more effective?
Interviewee: I think it’s a combination of those. That goes back to theatrical lighting
and everything. You sculpt just like you sculpt any other media and that’s as an artist or a designer, you’re not just going to use color or form or texture. You’re gonna use a combination of all of these design elements to make something happen, to create an effect.
And so of those, I mean brightness has to be within a certain range or you can’t see one way or another. Color temperature, I’m gonna lean towards warm colors generally unless you were selling something that’s white on white for some reason or some other setup like that. Let’s see, was it temperature, color, color temperature, brightness and directionality?
Interviewer: Distribution. Interviewee: Distribution? Well, I definitely prefer the more aimed light even if it’s
either simplistic, you know if it’s just track lights pointing kind of off in different directions, even that can be nicer than like a pure even temperature or even uniform lighting setup.
Interviewer: My last question is results from the survey shows that there is no
effective lighting on price or quality perception; however, there is a great effect of lighting on freshness, pleasantness and attractiveness which are subjective impressions. Do you think that subjective impressions of products can affect indirectly objective impression of product like price and quality and what is your interpretation about that?
Interviewee: Well, that goes back to what I was saying earlier about kind of being able
to upsell, like if you make something look nicer, you can charge more for it. There’s no way around that. That’s a counter to market demands and market pressures. If you put a little bowtie on it or light it nicely, it does change people’s perception. It doesn’t change the price of it but it does mean maybe that you can charge more for it.
I think that goes back again though too like probably fresh stuff versus packaged foods as well. You can probably amplify that effect with fresh goods in terms of kind of upselling but it’s interesting. So, the studies you’re talking about say that the lighting doesn’t affect the perception of freshness?
Interviewer: No, well, actually affected the subjective impression which is
pleasantness, freshness and attractiveness. This is what I did in my survey so this is the result of my survey.
Interviewee: Got you. Interviewer: But it has an effect on freshness but it doesn’t have an effect on price or
quality perception. There is no relation.

207
Interviewee: Interesting. That’s interesting. So, I wonder, see a lot of what we’re talking about and this is a really weird one because you’re never gonna find just the lighting being different in terms of the environment because we’re talking about this sort of curated experience versus kind of mechanical or rigid experience. I’m not sure how you’d mull those things out. So, is it a dark floor versus a light floor? Does that count as lighting?
The music in the environment, how many associates from that store in that area and what are they doing, those things also all affect the perception, the environmental perception, of the shopping experience so I think it’s interesting because I remember the survey, you know, where we were talking about kind of like does this look fresher, not as fresh, to me that would indicate that you can probably pull off a curated experience regardless of the lighting situation. But the more carefully lit that any environment is, the better retention you’re gonna have for customers, the pleasant it is to be in both for customers and employees. And depending on the business environment, let’s you upsell or otherwise add to the cache of that business.
Interviewer: All right, but remembering that what I did in my survey is just about
product and light, illuminating the experience, illuminate any other light variable, yeah, so maybe lighting can be effective but within that environment. And this is what all the study did. They measured lighting within a space but not lighting in a product directly.
Interviewee: Interesting, yeah. Interviewer: Of course there are some, but this is what I focused on and see how
effective lighting on product itself, but I couldn’t find correlation between price and the quality and lighting, but I found some correlation between lighting and freshness, particularly freshness and attractiveness to packaged food.
Interviewee: For packaged food in particular? Interviewer: Yeah, yeah. Interviewee: That’s interesting for food that typically is not fresh doesn’t even matter. Interviewer: Yeah, but I mean attractive not freshness. Interviewee: Oh, attractiveness, yeah, okay. Interviewer: So this is what I’m asking about now and seeing, try [inaudible]. Do you
have any like things you wanna add or do you have any questions? Interviewee: I would be interested from a research standpoint, and this is obviously
not for your MSD, but maybe a further study, put this in your future questions in your thesis, would be actual numerical frequencies of the light that are used and tested so like do a 6900 [Inaudible] lighting setup, do like very, very measured in these different lights, you know, have a

208
light meter but especially in the kind of the standard lighting colors and see what it looked like across those, across technologies.
Interviewer: Right. Interviewer: Thank you. [End of Audio] Duration: 72 minutes